NANOSTRUCTURED POLYPYRROLE IMPEDIMETRIC SENSORS FOR ANTHROPOGENIC ORGANIC POLLUTANTS By RICHARD ODUNAYO AKINYEYE BSc (Hons), MSc (Ibadan) and MBA (Akure) A Thesis Submitted in fulfilment of the requirement for the Degree of Doctor of Philosophy in Chemistry of The University of the Western Cape Supervisor Dr Priscilla Baker Co-Supervisor Prof. Emmanuel Iwuoha May 2007

Welcome message from author
This document is posted to help you gain knowledge. Please leave a comment to let me know what you think about it! Share it to your friends and learn new things together.
Transcript
NANOSTRUCTURED POLYPYRROLE IMPEDIMETRIC
SENSORS FOR ANTHROPOGENIC ORGANIC
POLLUTANTS
By
RICHARD ODUNAYO AKINYEYE BSc (Hons), MSc (Ibadan) and MBA (Akure)
A Thesis Submitted in fulfilment of the requirement for the Degree of
Doctor of Philosophy in Chemistry
of
The University of the Western Cape
Supervisor
Dr Priscilla Baker
Co-Supervisor
Prof. Emmanuel Iwuoha
May 2007
Nanostructured Polypyrrole Impedimetric Sensors for Anthropogenic Organic
Pollutants
Richard Akinyeye
KEYWORDS
Nanostructured conducting polypyrrole
Naphthalene sulfonic acid
1, 2- naphthaquinone-4-sulfonic acid
Tungsten oxide- polymer composites
Zirconium oxide- polymer composites
Anthropogenic organic compounds
Spectroelectrochemistry of polypyrrole
Impedance spectroscopy
Chemical sensors.
ii

ABSTRACT
Nanostructured Polypyrrole Impedimetric Sensors for Anthropogenic Organic
Pollutants
Richard Akinyeye
Polypyrrole composites of polyaromatic hydrocarbon sulphonic acids (β–naphthalene
sulphonic acid (NSA) and 1, 2-napthaquinone-4-sulphonic acid (NQS)), as well as those
of transition metal oxides (tungsten (VI) oxide (WO3) and zirconium (IV) oxide
(ZrO2)), were prepared and characterised for use as electrocatalytic sensors. The
polymerization of pyrrole in β–naphthalene sulphonic acid (NSA) gave rise to
nanotubules, nanomicelles or nanosheets polypyrrole (PPy) morphologies depending on
the amount of NSA in the polymer and the polymerisation temperature. Scanning
electron microscopy (SEM) measurements showed that the diameters of the
nanostructured polypyrrole-β-naphthalene sulphonic acid (PPyNSA) composites were
150-3000 nm for the tubules, 100-150 nm for the micelles and 20 nm for the sheets. A
red shift in the UV-Vis absorption spectra of PPy was observed for PPyNSA which is
indicative of the involvement of bulky β-naphthalene sulphonate ion in the
polymerization process. The UV-Vis also showed the existence of polaron and bi-
polaron in the polymer which may be responsible for the improved solubility of
PPyNSA compared to PPy. All the characteristic IR bands of polypyrrole were
observed in the FTIR spectra of PPyNSA, with slight variation in the absolute values.
However, the absence of N–H stretching at 3400 cm-1 and 1450 cm-1 usually associated
with neutral polypyrrole confirms that the polymer is not in the aromatic state but in the
excited polaron and bipolaron defect state. Electrochemical analysis of PPyNSA reveals
two redox couples: a/a′ - partly oxidized polypyrrole-naphthalene sulphonate radical
cation/neutral polypyrrole naphthalene sulphonate; b/b′ - fully oxidized naphthalene
sulphonate radical cation/partly reduced polypyrrole-naphthalene sulphonate radical
anion. The corresponding formal potentials measured at 5 mV/s, Eº'(5 mV/s), are 181 mV
and 291 mV, respectively. Analysis of the amperometric response of GCE/PPyNSA
film to phenol gave sensitivities of 3.1 mA/mole dm-3 with a linear correlation
coefficient of 0.982 for phenol concentrations of 19.8 µM to 139.5 µM. The apparent
Michaelis-Menten constant (Km′) was estimated as 160 µM.
iii
Novel polypyrrole thin film microelectrodes prepared from an aqueous solution of the
sodium salt of 1, 2-napthaquinone-4-sulphonic acid and pyrrole in hydrochloric acid as
the supporting electrolyte was characterized electrochemically for the first time and
found to exhibit good electronic and spectroscopic properties. The modified PPyNQS
consisted of nano micelles with diameters of 50–100 nm. It also exhibited more
pronounced voltammetric redox responses, improved solubility and stronger UV-Vis
absorptions at wavelengths for polarons (380 nm), bipolarons (750 nm) and overlapped
bi-polarons (820 nm) compared to conventional PPy. Voltammetric investigations
showed that the polymer exhibited quasi-reversible kinetics in a potential window of -
400 mV to +700 mV, with a formal potential of 322 mV vs. Ag/AgCl. The diffusion
coefficient was calculated to be 1.02 x 10⁻⁶ cm2/s for a thin film with a surface
concentration of 1.83 x 10⁻⁷ mol/cm2 and a standard rate constant of 2.20 x 10⁻³ cm/s at
5 mV/s. Substractively normalised in situ Fourier transform infrared spectroscopy
(SNIFTIR) confirmed the incorporation of the surfactant into the polypyrrole film, and
for the first time structural changes within the polymer were observed and used to
explain the electrochemistry of the polymer. Electrochemical impedance spectroscopy
(EIS) results validated the quasi-reversible kinetics observed in the voltammetric
experiment. The changes in electrical properties of the polymer during electrochemical
p-doping and n-doping were quantified by equivalent electrical circuit fitting.
Impedimetric nanosensor systems for the determination of two anthropogenic organic
pollutants, namely benzidine and naphthalene, were constructed with smart Pt/PPyNQS
nanomaterials.
Analysis of sensor systems containing tungsten oxide or zirconium oxide-modified
polypyrrole showed that nanohybrids of the polypyrrole were generated by the in-situ
polymerisation of pyrrole in acidic solutions. Results from morphological and
spectroscopic investigation confirmed the pattern of metal distribution within the
nanohybrid polymers matrix. However, this class of polymers were devoid of charge
carriers characteristics required for electrocatalytic sensor applications. The thesis
provided justification for the preparation of nanostructured conducting polypyrrole for
use as anodes for the determination of phenol, benzidine and naphthalene.
May 2007.
iv

Declaration
I declare that Nanostructured Polypyrrole Impedimetric Sensors for Anthropogenic
Organic Pollutants is my own work, that it has not been submitted before for any
degree or examination in any other university, and that all the sources I have used or
quoted have been indicated and acknowledged as complete references.
Richard Odunayo Akinyeye May 2007
Signed: ……………………………..
v

ACKNOWLEDGEMENTS
Every worthwhile destination requires a journey. Similarly, every journey must have a
destination. My arrival at this destination has been made possible only through the
assistance, guidance and prayers of so many people who are hereby gratefully
acknowledged. Firstly, I will like to give the Almighty God all the glory, honour and
adoration for seeing me through this great journey. As we often say in the laboratory,
that the “road to Nigeria from South Africa is far”. With His presence, it has really
been an interesting and fulfilling venture.
To my supervisors, Dr. Priscilla Baker and Professor Emmanuel Iwuoha, I say a big
thank you for your untiring efforts and interest in this work. You introduced me to the
world of Electrochemistry and ensured that I receive water, care and nourishment
from time to time. Your confidence in me was indeed a great inspiration. From time
to time, you are ever willing to attend to my “don’t knows”. The fruit of your support
is evident, and I am indeed very grateful.
To the Department of Chemistry, University of the Western Cape, Bellville, South
Africa, the Head of the department, Prof. Farouk Ameer and all the members of staff,
I say a big thank you for the good and cordial working relationship I enjoyed during
my studies.
To the National Research Foundation (NRF) of South Africa, thank you for awarding
me a PhD bursary. To the University of the Western Cape, thank you for providing
me with postgraduate conference grant to present my work at ICMAT 2007 in
Singapore.
This study would not have been completely satisfying without the cordial and good
working relationship I had with my colleagues in the Sensor Research Laboratory,
including Vernon, Michael, Immaculate, Sipho, Omotayo, Joseph, Everlyne,
Nicolette, Munkombwe, Fanelwa, Nurali, Lawrence, Jasmina, Leslie, and others.
Your contributions are highly appreciated. The leadership role and cooperation from
our post-doctoral fellows; Mantoa, Amir, Raju, Anna and Tesfaye; are gratefully
acknowledged.
vi

I wish to thank all the ministers and members of the Church of God where I derived
spiritual nourishment. The Redeem Christian Church of God, Victory Center, and
lately, Household of God Centre: you served as a river to keep me evergreen. Most
especially, Pastor and Pastor (Mrs) Sola Oduwole, I am indeed very proud of you.
My brothers and friends both here in South Africa and in Nigeria, I say thank you for
always being there for me from time to time. Tokunbo Akinyeye, Samuel Akinyeye,
Joseph Akinyeye, Martins Akinyeye, Mr & Mrs Toye Omiyale, Kole Amigun, Segun
Akinyemi, Segun Adelana, Lanre Fatoba, Lekan Babajide, Kayode Odunayo, Segun
Ogundele, etc. (you are too many to be all mentioned by name), your contributions
are not unnoticed. Thank you.
I am grateful to the management of the University of Ado-Ekiti, Nigeria for granting
me the permission to undertake this study.
Finally, to all my family members, I say thank you. I am particularly grateful to my
parents, “Mrs Beatrice Akinyeye and Mr Gabriel Rotibi Akinyeye” for my education
and upbringing. It is delightful to see you alive as I progress in life. Painfully, Daddy
passed away at the climax of this work, may his soul rest in peace. My dear wife “Mrs
Caroline Modupe Akinyeye” and my children “Damilola Akinyeye, Folakemi
Akinyeye, Emmanuel Akinyeye and Isaac Akinyeye”, I missed you greatly during the
period I was away studying for this degree. I know you missed me more. All my other
family members are equally gratefully acknowledged. Thanks for the love and care.
vii

DEDICATION
This project is dedicated to
The
Almighty God,
My darling wife
Mrs Modupe Caroline Akinyeye
and
My loving children
Damilola, Folakemi, Emmanuel and Isaac
For your prayers, love, understanding and endurance during my absence
from home during this period.
viii

LIST OF SOME PUBLICATIONS
1. Akinyeye, R.0, Sekota, M., Baker, P. & Iwuoha, E. (2006). Chemical
Synthesis And Morphology of β-Naphthalene Sulphonic Acid Doped
Polypyrrole Micro/Nanotubes, Fullerenes, Nanotubes & Carbon
Nanostructures, 14, 49-55.
2. Akinyeye, R.O., Michira, M., Sekota, M., Ahmed, A-Al, Baker, P. &.
Iwuoha, E. (2006): Electrochemical Interrogation and Sensor Applications of
Nanostructured Polypyrroles, Electroanalysis, 18(24), 2441 – 2450.
3. Akinyeye, R.O., Michira, M., Sekota, M., Ahmed, A-Al, Tito, D. Baker,
P.G.L., Brett, C.M.A., Kalaji, M. & Iwuoha, E. (2007). Electrochemical
Synthesis and Characterization of 1, 2-Napthaquinone-4-Sulphonic Acid
Doped Polypyrrole, Electroanalysis, 19(2-3), 303–309.
4. Michira, M., Klink, M., Akinyeye, R.O., Somerset, V., Sekota, M., Ahmed,
A-Al, Baker, P.G.L. & Iwuoha, E.I. (2007). Anthracene Sulphonic Acid-
Doped Polyanilines: Electrodynamics and Application as Amperometric
Peroxide Biosensor, Chapter 5 in Recent Advances in Analytical
Electrochemistry, 0 – 00, ISBN: 978-81-7895-274-1, edited by Kenneth I.
Ozoemena (in press).
5. Akinyeye, R.O., Michira, M., Botha, S., Baker, P. & Iwuoha, E. (2007).
Electrocatalytic Sensor Applications of Nanostructured Polypyrroles and
Polythiophenes, Chapter 4 in Recent Advances in Analytical Electrochemistry,
0 – 00, ISBN: 978-81-7895-274-1, edited by Kenneth I. Ozoemena (in press).
6. Akinyeye, R.O., Klink, M., Ahmed, A-Al, Ignaszak, A., Baker, P., & Iwuoha,
E. (2007). Impedimetric Applications of Nanostructured Conducting 1, 2-
Naphthaquinone-4-Sulphonated Polypyrroles for the Determination of
Benzidine and Naphthalene, ICMAT 2007 Conference Paper in
“Encyclopedia of Advanced Materials: Science and Engineering” (in review).
ix
TABLE OF CONTENTS
Title page i
Keywords ii
Abstract iii
Declaration v
Acknowledgements vi
Dedication viii
List of Publications ix
Table of contents x
List of Figures xvii
List of Tables xxv
Chapter One Introduction
1.1 Intrinsically conducting polymers and concept of doping 1
1.2 Some applications of intrinsically conducting polymers 8
1.2.1 Polypyrrole and its applications in sensors 10
1.3 Research Objectives 11
1.3.1 Preamble 11
1.3.2 Background information and Motivation 12
1.3.3 Objectives 14
1.3.4 Methodology 14
1.3.4.1 Preparation of ICP nanomaterials and sensors 14
1.3.4.2 Characterization and application of ICP nanomaterials
and sensors 15
1.4 Thesis layout 16
x
References 17
Chapter Two Literature review
2.0 Introduction to Nanostructured Conducting Polymers 26
2.1 Preparation methods for conducting polymers of PANi, PPy and PTh 28
2.2 Strategies for production of ‘nanostructurised conducting
polymers/Polymer composites’ 31
2.3 Polyaniline (PANi) blends/composites 34
2.4 Polypyrrole blends/composites 37
2.5 Polythiophene blends and composites 45
2.6 General properties and factors affecting processability of
nanostructured polyaniline, polypyrroles and polythiophenes. 46
2.6.1 Temperature and ageing process 47
2.6.2 Nature of solvent 47
2.6.3 pH and redox potential of the environment 48
2.6.4 Nature of dopants 48
2.6.5 Other factors 49
2.7 Characterization of nanostructured PANi, PPy’s and PTh’s 49
2.7.1 Morphology characterization 49
2.7.2 Electrochemical characterization 51
2.7.3 Spectroscopic characterization 52
2.8 Application of NCPs in sensors 53
2.9 Future challenges in the scope of conducting polymer applications 59
2.10 Chemical sensors for anthropogenic organic pollutants. 61
2.10.1 Surfactant modified polypyrrole chemical sensors 64
2.10.2 Transition metal oxide modified polypyrrole sensors 66
xi

2.10.3 Polycyclic aromatic hydrocarbons (PAHs) 67
References 72
Chapter Three Analytical Techniques and Experimental Procedures
3.1 Analytical techniques 91
3.1.1 Electrochemical techniques 91
3.1.1.1 Cyclic Voltammetry 91
3.1.1.2 Oyster-young square wave voltammetry (OSWV) 97
3.1.1.3 Differential pulse voltammetry 98
3.1.1.4 Electrochemical Impedance Spectroscopy 100
3.1.1.4.1 Electrical circuit elements 106
3.1.1.4.2 Impedance modeling using equivalent
electrical circuit 109
3.1.2 Spectroscopic techniques (UV-Vis, FTIR, SNIFTIRS) 113
3.1.2.1 Ultra Violet-Visible spectroscopy (UV-Vis) 113
3.1.2.2 Fourier Transform Infra Red (FTIR) 114
3.1.2.3 Subtractively Normalized Interfacial Fourier
Transform Infrared Spectroscopy (SNIFTIRS) 114
3.1.3 Morphological technique (SEM) 115
3.2 Chemical synthesis procedures and characterization of polypyrrole
nanomaterials. 115
3.2.1 Chemicals 116
3.2.2 Chemical synthesis of β-naphthalene sulphonic acid doped
polypyrrole (PPyNSA); polypyrrole from distilled water
(PPyDW); and polypyrrole from HCl (PPyHCl) 116
xii

3.2.3 Chemical synthesis of 1, 2-naphthaquinone-4-sulfonate doped
polypyrrole (PPyNQS) 119
3.2.4. Chemical synthesis of metal oxide doped polypyrrole (PPyMO)
using tungsten oxide (WO3) and Zirconium oxide (ZrO2) 120
3.3 Electrochemical synthesis and characterization procedures
3.3.1 Apparatus 121
3.3.2 Electrochemical synthesis procedures of modified polypyrrole 121
3.3.3 Electrolyte and potential window for polypyrrole synthesis 121
3.3.4 Polypyrrole electrosynthesis from aqueous solution of HCl
and product characterization. 123
3.3.5 Polypyrrole electrosynthesis from aqueous solution of
β-naphthalene sulphonic acid and product characterization. 124
3.3.6 Polypyrrole electrosynthesis from aqueous solution of 1, 2-
naphthaquinone-4-sulfonate and product characterization
(PPyNQS) 124
3.3.7 Polypyrrole electrosynthesis from aqueous solution of metal
oxide of tungsten oxide and zirconium oxide 125
3.3.8 Electrochemical characterization of chemically synthesised
polypyrrole 125
3.4 Sensor development 126
3.4.1 Chemicals 126
3.4.2 Phenol sensing with GCE/PPYNSA (Amperometry) 126
3.4.3 Benzidine sensing with Pt/PPyNQS (Impedimetry) 126
3.4.4 Naphthalene sensing with Pt/PPyNQS (Impedimetry)
References 128
xiii

Chapter Four Results and discussion 1
Morphology, Spectroscopy, Electrochemistry and Application of nanostructured
polypyrrole-β-naphthalene sulphonic acid (PPyNSA) composites
4.0 Introduction 132
4.1 Polymerization yield of PPyNSA 134
4.2 Morphology of PPyNSA 138
4.3 UV-Vis absorption and solubility of PPyNSA 142
4.4 FTIR spectral studies 144
4.5 Electrochemical studies on PPyHCl and PPyNSA 147
4.5.1 Chemically synthesised PPyNSA 147
4.5.1.1 Voltammetric studies of GCE/PPyNSA systems 147
4.5.1.2 Electrode kinetics of GCE/PPyNSA systems 152
4.5.1.3 Impedance studies PPyNSA systems 158
4.5.2 Electrosynthesised PPyHCl and PPyNSA 160
4.5.2.1 Voltammetric studies on electrosynthesised PPyHCl
and PPyNSA 160
4.5.2.2 Kinetic studies on electrosynthesised PPyHCl 169
4.6 Amperometric response of GCE/PPyNSA to phenol 170
Conclusions 172
References 173
Chapter five Results and discussion 2
Morphology, Spectroscopy, Electrochemistry and Applications of novel
polypyrroles-1, 2-napthaquinone-4-sulphonate (PPyNQS) composite
5.0 Introduction 179
xiv
5.1 Chemical synthesis and yield optimization 179
5.1.1 Yield and morphological properties of PPyNQS 181
5.1.2 Spectroscopic properties of PPyNQS 184
5.2 Electrochemical investigation 189
5.2.1 Chemically synthesized PPyNQS 189
5.2.2 Electrochemically synthesized PPyNQS 189
5.2.2.1 Voltammetric investigation 190
5.2.2.2 Kinetic analysis of the Pt/PPyNQS system 198
5.2.2.3 Impedance spectroscopic investigation of Pt/PPyNQS 201
5.3 Modeling of the electrochemical and impedimetric properties of PPyNQS 207
5.4 Test application of Pt/PPyNQS for benzidine and naphthalene 211
Conclusions 218
References 219
Chapter Six Results and discussion 3
Spectroscopic and morphological studies of polypyrrole composites with metal
oxides (PPyWO3 and PPyZrO2)
6.0 Introduction 224
6.1 Chemical synthesis of (PPyWO3 and PPyZrO2) 225
6.1.1 Yield pattern of metal oxide modified polypyrroles 225
6.1.2 Morphological and EDX examination 226
6.2 Spectroscopic properties of metal oxide modified polypyrroles 229
6.2.1 UV-Vis Spectroscopy 229
6.2.2 FTIR spectral studies 231
Conclusions 236
References 237
xv

Chapter Seven Conclusions and Recommendations
7.1 Conclusions 238
7.2 Main scientific contributions of the dissertation 239
7.3 Recommendations for future work 240
7.4 Output from the dissertation 241
7.4.1 Contributions at conferences 241
7.4.2 Manuscripts and publications from dissertation 244
xvi
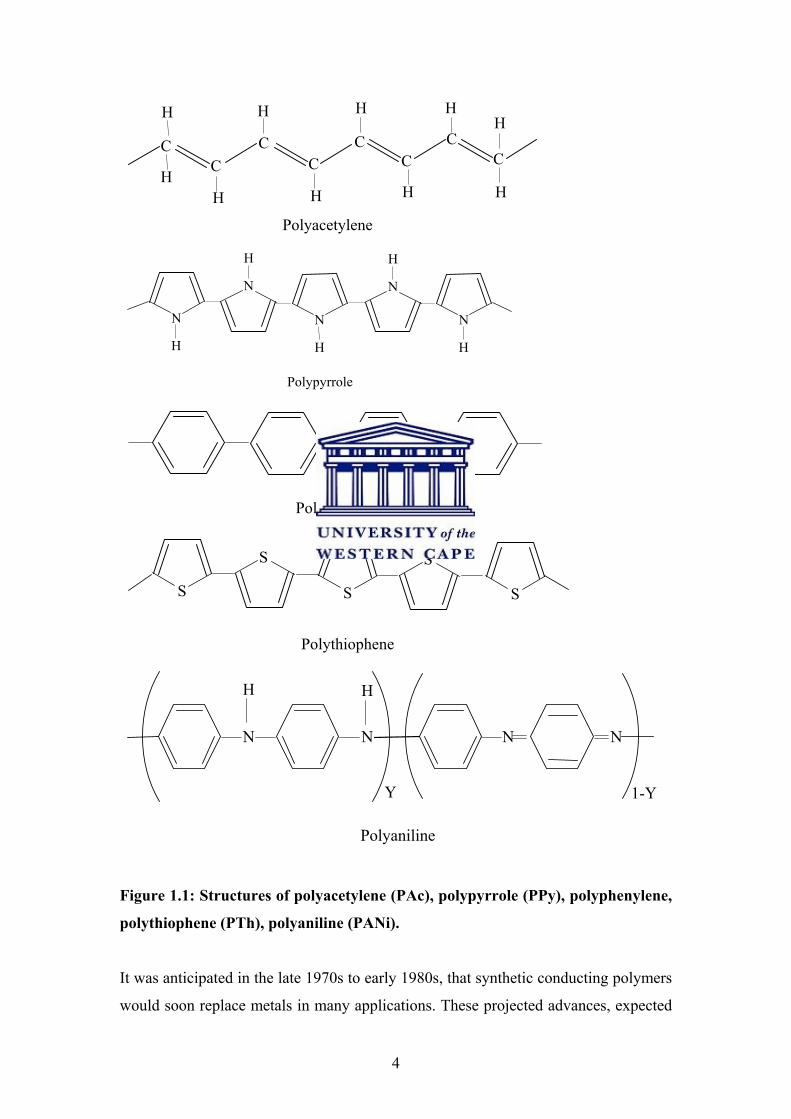
LIST OF FIGURES Figure 1.1: Structures of polyacetylene (PAc), polypyrrole (PPy),
polyphenylene, polythiophene (PTh), polyaniline (PANi). 4
Figure 1.2 Conductivity of some metals and doped conjugated polymers 5
Figure 1.3: Band structure in an electronically conducting polymer 7
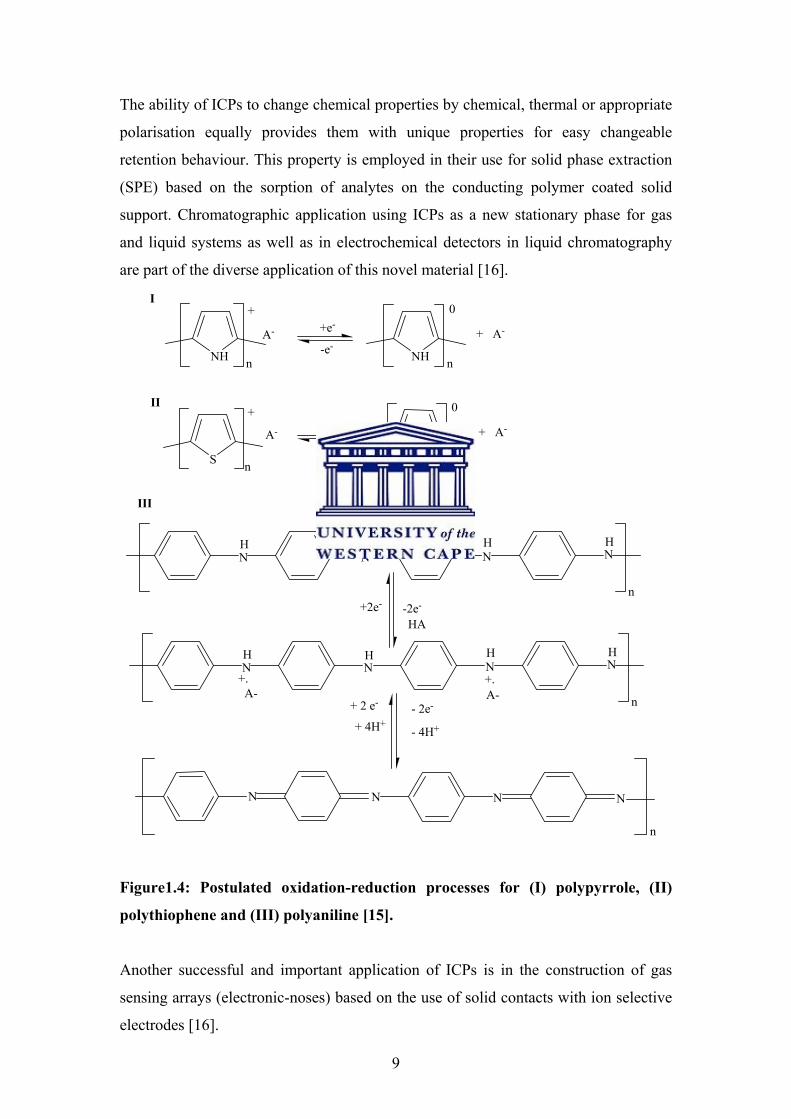
Figure1.4: Postulated oxidation-reduction processes for (I)
polypyrrole, (II) polythiophene and (III) polyaniline 9
Figure 2.1: SEM and TEM images of Polypyrrole nanowires under different synthesis
conditions 33
Figure 2.2: Schematic diagram of PANi in different oxidation states namely, LM
(insulator) as (A), EM-base (insulator) as (B) and PE (insulating) as (C) 35
Figure 2.3: Generalized scheme for the polymerization of polypyrrole 39
Figure 2.4: Scheme for the electropolymerisation of polypyrrole 40
Figure 2.5: Scheme for the structures of polypyrrole showing the
non-degenerate: aromatic (a) and quinoid (b) configurations;
and degenerate (oxidised forms): a polaron defect (c), and a
bipolaron defect (d) configurations 41
Figure 2.6: The polypyrrole oxidation and reduction scheme 44
Figure 2.7: SEM micrographs of as-synthesized PPy-chloride nanotubes
from ethanol with V2O5 as sacrificial template 51
Figure 2.8: Schematic representation of electrochemical oxidation
and reduction of a polypyrrole film 55
xvii

Figure 2.9: Scheme for the mediation process of an immobilized
polymeric film at an electrode surface for an electroactive analyte 56
Figure 2.10: Scheme for the working principle of an electrochemical sensor 61
Figure 2.11: Scheme for the metal oxide semiconductor sensor 66
Figure 2.12: Scheme of a conductometric based sensor using a conducting
polymer material 67
Figure 2.13: Structural representations of some PAHs included in the USEPA list 69 Figure 3.1: Typical electroanalytical instrument used for cyclic voltammetry 92
Figure 3.2: Typical cyclic voltammogram for the electrochemical oxidation
and reduction process 94
Figure 3.3: Typical OSWV for PPyNSA film containing the forward,
reverse and reverse currents 98
Figure 3.4: Typical potential-current curve for the anodic and cathodic differential
pulse voltammetric scan of polypyrrole in 0.1 M LiClO4 at a scan rate
of 5 mV/s and 25 mV amplitude. 99
Figure 3.5: Sinusoidal current response to potential perturbation as a
function of time 101
Figure 3.6: Typical Nyquist plot with impedance vector and a typical Nyquist plot
of Ferricyanide solution on platinum electrode 105
Figure 3.7: Typical Bode plot of Ferricyanide solution on platinum electrode
showing variation of impedance and phase angle with changes in
frequency 106
xviii
Figure 3.8: Equivalent circuit of a capacitor and a resistor in parallel 106
Figure 3.9: General representation of an electrochemical cell 110
Figure 3.10: Randles circuit for a simple electrochemical cell 112
Figure 4.1: Scheme for the ionic form of β–naphthalene sulphonic acid
doped polypyrrole 134
Figure 4.2: Scheme for the polymerization of polypyrrole via
pyrrole-complex intermediates using the radical cations and
the radical species that are free of naphthalene sulphonate specie 136
Figure 4.3: Typical SEM images of different polypyrrole synthesized with
o/m 0.2 at 25 oC (a) PPyNSA nano/microtubes and fibers from
d/m 1, (b) PPyNSA nano/microtubes from d/m 0.8, and(c)
PPyNSA microfibers from d/m 0.8 139
Figure 4.4: Typical SEM images of polypyrrole nano/micro sheets synthesized
with o/m 0.2 at 25 oC in the absence of NSA dopant (PPyDW) 139
Figure 4.5: Typical SEM images of different polypyrrole synthesized at 0 oC
(a) nano/microtubes and fibers from PPyNSA (d/m 0.8; o/m 0.2),
(b) nanomicelles from PPyNSA (d/m 0.8; o/m 1.0),
(c) nanosheets from PPyDW (o/m 0.2) 141
Figure 4.6: UV-Vis results for PPyNSA prepared under different synthesis
conditions: Fig. 4.6A: PPyNSA (d/m, o/m): (a) [0.5, 0.2] and
(b) [0.8, 0.2], Fig. 4.6B: PPyNSA [d/m 0.8] from o/m ratios:
(a) 0.2, (b) 0.5 and (c) 1.0 143
Figure 4.7: FTIR spectra of polypyrroles in KBr medium for: (a) PPyDW,
(b) PPyNSA (d/m 0.8; o/m 1.0) and (c) PPyNSA (d/m 0.8; o/m 0.2) 145
xix

Figure 4.8: (a) Multi–scan rate voltammograms in 0.1 M HCl for (a) PPyNSA
(d/m 0.8; o/m 0.2) at scan rates of 10, 20, 30 mVs-1; (b) PPyNSA
(d/m 0.8; o/m 1.0) at scan rates of 5, 10, 20 mVs-1 in 0.1M HCl 149
Figure 4.9: Typical anodic SWV of PPyNSA (d/m 0.8; o/m 1.0) at
frequencies of 2, 3, 4 and 5 Hz. showing (a) the forward and
reverse waves (b) the net square wave responses 151
Figure 4.10: Typical anodic DPV of PPyNSA (d/m 0.8; o/m 1.0) at scan
rates of 5 and 10 mV/s 152
Figure 4.11: Plot showing the variation of the modulus of both the anodic
and cathodic peak currents with square root of scan rates for
(a) GCE/PPyNSA (d/m 0.8; o/m 0.2) system and (b) GCE/PPyNSA
(d/m 0.8; o/m 1.0) in 0.1 M HCl 155
Figure 4.12: Plots of the real impedance (Z) and capacitance (C) data of
PPyNSA (d/m 0.8, o/m 1.0) system showing low frequency
behaviours between -600 mV to 700 mV 159
Figure 4.13: Plots of the real impedance (Z) data obtained at 0.1 Hz for
PPyNSA (d/m 0.8, o/m 1.0), PPyNSA (d/m 0.8, o/m 0.2) and
PPyDW at different potentials 160
Figure 4.14: (a) The polymerization voltammograms of Pt/PPyHCl (20 cycles)
from 0.1 M Pyrrole in 0.1 M HCl at 50 mV/s and (b) multi-scan
rate voltammograms for electropolymerized Pt/PPyNSA at
10 to 50 mV/s 162
Figure 4.15: (a) The polymerization voltammograms of GCE/PPyHCl (30 cycles)
from 0.1 M Pyrrole in 0.1 M HCl at 50 mV/s and (b) multi-scan rate
voltammograms for electropolymerized GCE/PPyNSA at
10 to 100 mV/s 164
Figure 4.16: Polymerization voltammograms of GCE/PPyNSA (15 cycles) from
xx
0.1 M Pyrrole and 0.05 M NSA in 0.1 M HCl at 50 mVs-1 and
(b) multi scan rate voltammogram for the electropolymerized
GCE/PPyNSA at 5 to 400 mV/s
166
Figure 4.17: (a) Polymerization voltammograms of GCE/PPyNSA (10 cycles)
from 0.1 M Pyrrole and 0.05 M NSA in 0.1 M HCl at 20 mVs-1
showing overoxidation current pattern, (b) multiscan
voltammograms of overoxidised GCE/PPyNSA in 0.1 M HCl 168
Figure 4.18: Plot showing the variation of the modulus of both the anodic
and cathodic peak currents with square root of scan rates for
Pt/PPyHCl system in 0.1 M HCl 170
Figure 4.19: Graph of the square wave voltammetric response of GCE/PPyNSA
to different concentrations of phenol in 0.05 M HCl 171
Figure 4.20: Calibration plots of GCE/PPyNSA sensor for phenol concentrations 172
Figure 5.1: Ionic form of polypyrrole 1, 2-naphthaquinone-4-sulphonate
(PPyNQS) smart nanomaterials 180
Figure 5.2: SEM micrographs of dry powder PPyNQS showing the typical
fibrous-micellic structures obtained from (a) PPyNQS
[d/m 0.05; o/m 0.2] and (b) PPyNQS [d/m 0.05; o/m 1.0] 183
Figure 5.3: SEM and EDX analysis for dry powder of PPyNQS (top)
compared with that from naphthalene sulphonic acid doped
polypyrrole (PPyNSA) (below) 184
Figure 5.4: FTIR spectra of polypyrroles in KBr medium for: (a) PPyDW,
(b) PPyNQS(d/m 0.05; o/m 0.2) and (c) PPyNQS (d/m 0.05; o/m 1.0) 185
Figure 5.5: Full SNIFTIRS spectra of PPyNQS at 100 mV potential intervals
from 0 to 600 mV, vs calomel electrode 187
xxi

Figure 5.6: Normalised SNIFTIRS spectra of PPyNQS showing the enlargement
of the finger print region
188
Figure 5.7: UV-Vis results for PPyNQS compared with that of PPyDW 189
Figure 5.8: Typical voltammogramms for (a) the polymerisation of Pt/PPYNQS
from 0.1 M Py + 0.01 M NQS in 0.05 M HCl. (25 cycles) at 50 mV/s
and (b) multi–scan rate voltammograms of the thin film in 0.05 M HCl
at scan rates of 5, 10, 15, 20, 25, 30, 40 and 50 mV/s 191
Figure 5.9: (a) Plot of variation of anodic and cathodic peak currents with square
root of the scan rates and (b) plot showing the variation of the modulus
of both the anodic and cathodic peak currents with square root of
scan rates of Pt/PPyNQS in 0.05 M HCl 194
Figure 5.10: (a) Plot showing the variation of cathodic peak potentials with scan
rates and (b) plot of peak separations versus scan rates of
Pt/PPyNQS in 0.05 M HCl at a 1.6 mm diameter Pt electrode
at a temperature of 25 °C based on the data from Fig. 5.8b 196
Figure 5.11: Differential pulse voltammograms for the anodic and cathodic
wave difference for Pt/PPyNQS film in 0.05 M HCl using a
scan rate of 5 mV/s and 50 mV pulse amplitude 197
Figure 5.12: Square wave voltammogram for the anodic and cathodic wave
difference for Pt/PPyNQS film in 0.05 M HCl using frequency of
15 Hz and 25 mV amplitude 198
Figure 5.13: Plot of the peak current dependence on scan rate for Pt/PPyNQS
prepared from 0.1 M Py + 0.01 M NQS in 0.05 M HCl and
characterized in 0.05 M HCl 200
Figure 5.14: Complex plane impedance plots of PPyNQS thin film electrode
xxii

at 50 mV vs. Ag/AgCl in 0.05 M HCl during (•)step-by-step
oxidation and (o) subsequent reduction 202
Figure 5.15: Plot of interfacial capacitance versus potential for the
oxidation and reduction of the PPyNQS thin film 205
Figure 5.16. Model illustrating the alignment of charges at different oxidation
states of polypyrrole: (a) neutral polymer and (b) oxidized polymer 206
Figure 5.17: Equivalent electrical circuit describing the electrical components
of Pt/PPyNQS in an electrolyte medium of 0.05 M HCl 208
Figure 5.18: Typical Nyquist plot (top), Bode plot (bottom) for
Pt/PPyNQS system 209
Figure 5.19: Plot of the interfacial impedance and capacitance at different
perturbation potentials of the Pt/PPyNQS electrode 210
Figure 5.20: Plot of changes in real impedance with increasing concentrations
of benzidine at the bulk polymers region () and at the interface () 211
Figure 5.21: Plot of changes in capacitance with increasing concentrations of
benzidine at the interface with insert showing the calibration curve
for the linear region 214
Figure 5.22: Plot of changes in capacitance with increasing concentrations of
benzidine at the bulk polymers region in () and the straight line
showing the regression line 215
Figure 5.23: Plot of changes in impedance with increasing concentrations of
benzidine at the bulk polymers region in () 216
Figure 5.24: Plot of changes in capacitance with increasing concentrations of
naphthalene at the interface with insert showing calibration curve
xxiii

for the linear region 217
Figure 6.1: SEM micrographs of dry powder of metal oxide modified
polypyrrole showing the typical fibrous nanostructures from
(a) PPyWO3 [d/m 0.8; o/m 0.2] and (b) PPyZrO2 [d/m 0.8; o/m 0.2] 228
Figure 6.2: UV-Vis results for metal oxide modified polypyrrole prepared
under different synthesis conditions: Fig. 6.2A: PPyWO3 from
o/m 0.2 and 1.0; and Fig. 6.2B: PPyZrO2 from o/m 0.2 and 1.0 231
Figure 6.3: FTIR spectra of metal oxide modified polypyrroles in KBr medium,
Fig. 6.3A: (a) PPyDW, (b) PPyWO3 (d/m 0.8; o/m 0.2) and
(c) PPyWO3 (d/m 0.8; o/m 1.0); and Fig. 6.3B: (a) PPyDW,
(b) PPyZrO2 (d/m 0.8; o/m 0.2) and (c) PPyZrO2 (d/m 0.8; o/m 1.0) 234
xxiv

LIST OF TABLES
Table 1.1: Names and repeat units of the most widely studied
conducting polymers 3
Table 2.1: Chemical structure of the 15 European Union (EU) priority PAHs 70
Table 3.1: Table of relative amounts of materials used for chemical
synthesis of PPyNSA, PPyDW and PPyHCl 118
Table 3.2: Table of relative amounts of materials used for chemical synthesis
of PPyNQS 120
Table 3.3: Table of relative amounts of materials used for chemical
synthesis of PPyWO3 121
Table 3.4: Table of relative amounts of materials used for chemical synthesis
of PPyZrO2 121
Table 4.1: Yield/Temperature profile for doped and undoped PPy 134
Table 4.2: Yield of various polypyrroles prepared under different synthesis
conditions 137
Table 4.3: Major shifts of bands (cm-1) in FTIR spectra of PPyDW,
PPyNSA (d/m 0.8, o/m 0.2) and PPyNSA (d/m 0.8, o/m 1.0)
from undoped polypyrrole major bands (Geetha & Trivedi) 146
Table 4.4: Summary of estimates of kinetic parameters for PPyNSA
[d/m 0.8, o/m 1.0] on GCE based on n = 1, and scan rate measurements
from 10 – 100 mV/s 157
xxv

Table 5.1: Yield profile for chemically synthesised PPyNQS at different
dopant and oxidant concentration ratios 181
Table 5.2: Major shifts of bands (cm-1) in FTIR spectra of PPyDW,
PPyNQS (d/m 0.05, o/m 0.2) and PPyNQS (d/m 0.05, o/m 1.0)
from undoped polypyrrole major bands (Geetha & Trivedi) 186
Table 5.3: Analysis of the oxidative impedance data at the conductive
polymer electrode 203
Table 5.4: Analysis of reductive impedance data at the conductive
polymer electrode 203
Table 6.1: Yield of metal-oxide modified polypyrroles prepared under
different synthesis conditions 226
Table 6.2: Comparative trend of elemental composition (C, S, O, W, Zr, others)
in different modified polypyrroles prepared at from d/m ratio of 0.8
and o/m ratio 0.2 by EDX spectroscopic analysis 229
Table 6.3: Major shifts of bands (cm-1) in FTIR spectra of PPyDW, PPyWO3
(d/m 0.8, o/m 0.2) and PPyWO3 (d/m 0.8, o/m 1.0) from undoped
polypyrrole major bands (Geetha & Trivedi) 235
Table 6.4: Major shifts of bands (cm-1) in FTIR spectra of PPyDW, PPyZrO2
(d/m 0.8, o/m 0.2) and PPyZrO2 (d/m 0.8, o/m 1.0) from
undoped polypyrrole major bands (Geetha & Trivedi) 236
xxvi
Chapter One
Introduction
This chapter gives a brief introduction to intrinsically conducting polymers, the
concept of doping and conductivity especially in polypyrroles. The project proposal,
objectives and methodology that was adopted is presented.
1.1 Intrinsically conducting polymers and concept of doping
The current day science aims at using nanostructured-conducting polymers to boost
the development of exciting opportunities in modern day science and technology.
Towards achieving this objective, novel materials and technologies, new ideas,
applications and techniques will always be a challenging route to explore new
possibilities. The current interest in the world of conducting polymer science evolved
from the discovery that the erstwhile inactive, non-conductor polymers mostly used as
electrical insulators could still be obtained in a conducting state through the presence
of certain additives in the polymer that enhances the conductivity [1-15]. This
commonly is referred to as “doping the polymer” and it provides increase in
conductivity of several orders of magnitude from the semiconductor regime. This
doping terminology in conductive polymers is slightly different from its conventional
use in semi-conductor physics, since considerably higher concentration (of up to 33%)
are employed in the former [7].
This new class of polymer known as intrinsically conductive polymers (ICPs) or
electronic (electroactive) polymers (EP) combines the mechanical and chemical
properties of insulator polymers with the electrical and optical properties of inorganic
semiconductors and metals [2]. This class of material is completely different from
“conducting polymers” which are merely a bulk material generated from the physical
mixture of a nonconductive polymer with a conducting material such as a metal or
carbon powder that has been uniformly dispersed. Intrinsically conducting polymers
offer a unique combination of ion exchange characteristics and optical properties that
1
make them distinctive. They are readily oxidized and reduced at relatively low
potentials, and the redox process is reversible and accompanied by large changes in
the composition, conductivity and colour of the material. In 1969, the use of
electronic polymers was proposed as light emitting material, however, its first use as
light emitting diode was launched in 1991 [3]. This involved the combination of
carbon and metal filled polymers as mouldable semiconductors, as photoreceptors in
electro photographic copying machines and some other applications.
Great publicity into the potentials in organic polymers actually came up in 1977,
when the conductive properties of the alternating-bond in the conjugated polymer of
trans-polyacetylene were discovered. Hideki Shirakawa et al. in 1971 had reported the
enhanced conductivity of polyacetylene observed in his laboratory following an
accidental addition of excess Ziegler-Natta catalyst as dopant to the pristine semi
conducting polyacetylene [4]. The development generated a lot of curiosity amongst
scientist like Heeger and MacDiarmid who found that the conductivity of
polyacetylene could be enhanced by exposure to oxidizing agents such as iodine
vapor, AsF5, NOPF6 (p-doping) or reducing agents such as sodium naphtide from 10-9
S cm-1 to 105 S cm-1, an increase of well over ten million times [4]. In particular,
exposure of iodine vapor to polyacetylene generated increased conductivity of about
ten million times (from 10-3 S m-1 to 3000 S m-1) [2]. It was found that the polymer
could be doped either chemically or electrochemically to the metallic state and
thereby transformed into a good electrical conductor almost comparable to that of one
single copper crystal. The recognition of these efforts by the world scientific
community was the Nobel Prize in Chemistry awarded to Professors Heeger A, J.,
MacDiarmid A.G. and Shirakawa H., in 2000 for their research in that field.
Thereafter, many new conducting polymers and their derivatives were discovered and
applied for different electronic applications in different fields. These include organic
polymers such as polyaniline (PANi), polypyrrole (PPy) polythiophene (PTh), poly-
(para-phenylene), poly-(phenylenevinyl-ene), polyfuran and other poly-
(heteroaromatic vinylenes) [5]. Table 1.1 shows the idealized structure of the mostly
studied conducting polymers. The structural feature common to conducting polymers
is their alternating single and double bond lattice structure that allows for the transfer
of charge carriers upon excitation of electron.
2
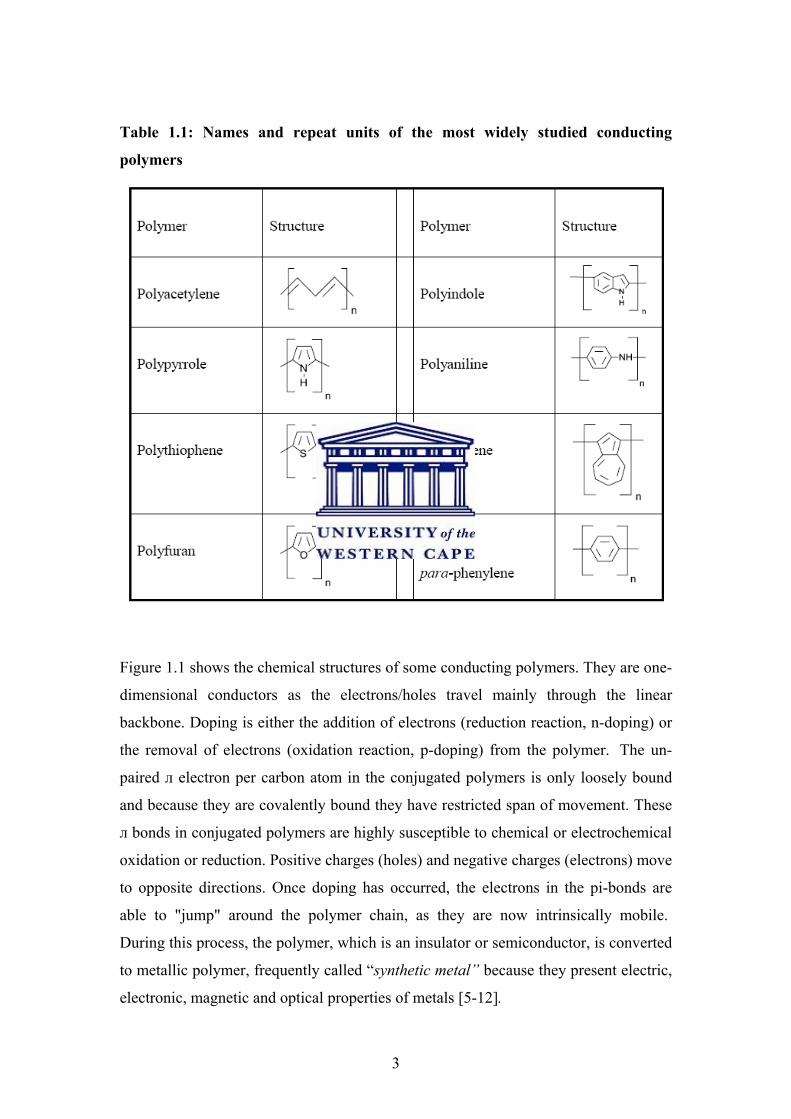
Table 1.1: Names and repeat units of the most widely studied conducting
polymers
Figure 1.1 shows the chemical structures of some conducting polymers. They are one-
dimensional conductors as the electrons/holes travel mainly through the linear
backbone. Doping is either the addition of electrons (reduction reaction, n-doping) or
the removal of electrons (oxidation reaction, p-doping) from the polymer. The un-
paired л electron per carbon atom in the conjugated polymers is only loosely bound
and because they are covalently bound they have restricted span of movement. These
л bonds in conjugated polymers are highly susceptible to chemical or electrochemical
oxidation or reduction. Positive charges (holes) and negative charges (electrons) move
to opposite directions. Once doping has occurred, the electrons in the pi-bonds are
able to "jump" around the polymer chain, as they are now intrinsically mobile.
During this process, the polymer, which is an insulator or semiconductor, is converted
to metallic polymer, frequently called “synthetic metal” because they present electric,
electronic, magnetic and optical properties of metals [5-12].
3
CC
CC
CC
CC
HH
HH
HH H
HH H
Polyacetylene
N
H
N
H
N
H
N
H
N
H
Polypyrrole
Polyphenylene
S
S S
SS
Polythiophene
N N
HH
Y
N N
1-Y
Polyaniline
Figure 1.1: Structures of polyacetylene (PAc), polypyrrole (PPy), polyphenylene,
polythiophene (PTh), polyaniline (PANi).
It was anticipated in the late 1970s to early 1980s, that synthetic conducting polymers
would soon replace metals in many applications. These projected advances, expected
4
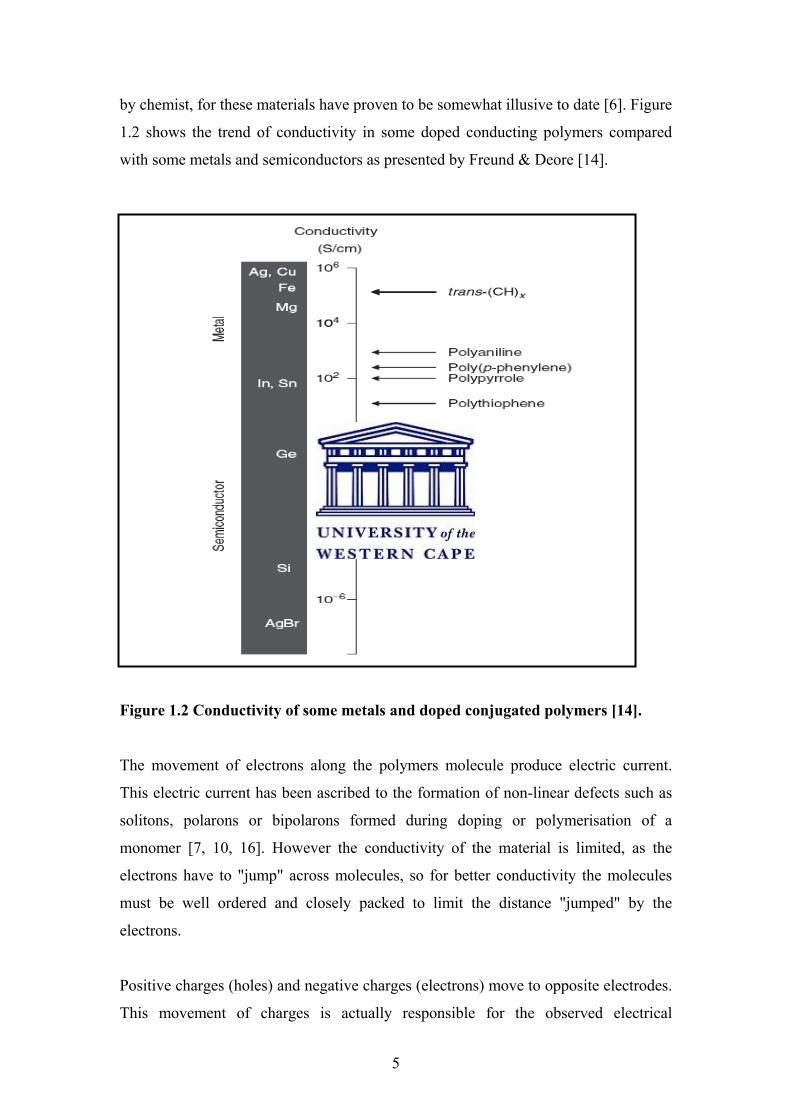
by chemist, for these materials have proven to be somewhat illusive to date [6]. Figure
1.2 shows the trend of conductivity in some doped conducting polymers compared
with some metals and semiconductors as presented by Freund & Deore [14].
Figure 1.2 Conductivity of some metals and doped conjugated polymers [14].
The movement of electrons along the polymers molecule produce electric current.
This electric current has been ascribed to the formation of non-linear defects such as
solitons, polarons or bipolarons formed during doping or polymerisation of a
monomer [7, 10, 16]. However the conductivity of the material is limited, as the
electrons have to "jump" across molecules, so for better conductivity the molecules
must be well ordered and closely packed to limit the distance "jumped" by the
electrons.
Positive charges (holes) and negative charges (electrons) move to opposite electrodes.
This movement of charges is actually responsible for the observed electrical
5

conductivity [8]. This is why small particulate and nanostructured conducting
polymer materials with large surface area are desirable for good conductivity.
Doping could be achieved via chemical and electrochemical routes. Introduction of
mobile carriers into the double bonds of the polymer backbone is the source of the
polymers conductivity, and that is why the enumerated properties above are only
intrinsic to the doped state [11, 12]. According to Wikipedia® 2007, the doping
process in ICPs is similar to that of inorganic semiconductors such as silicon which
could be doped with the addition of electron rich atoms such as phosphorous or
electron poor atom such as boron to create an n-type or p-type semiconductor
respectively [8]. This doping action could produce significant effects on the
conductivity of the material, even in concentrations of one part per million. While the
n-type doping is common in inorganic semiconductors, it is very rare in organic
semiconductors. Most of the optical characteristics inherent to inorganic
semiconductors, such as photoemission, photodetection and photocurrent have also
been observed in ICPs [13]. Chemical procedure for n-doping is rarely employed
because of the oxidizing nature of the atmosphere which is rich in molecular oxygen
that has propensity of de-doping (oxidizing to the neutral state) an n-doped polymer
once it is in contact with the atmosphere. The electrochemical route to n-doping is
equally not very common in research because it is not easy to exclude oxygen
completely from a solvent in a sealed cell even when burbled with argon during
synthesis. Thus n-doped conducting polymer is usually not of much commercial value
and thus hardly used [8].
The relatively low ionization energy and high electron affinity of the conjugated
bonds readily generate changes in the electronic structure of the polymer chain. This
change in electronic structure is accompanied with a change in the conductivity of the
polymer. Thus the relative concentration of the charge carriers, solitons i.e. radicals
with unpaired electrons, polarons i.e. couples formed from neutral or charged solitons,
or bipolarons determines the polymers conductivity. The gap between the polymers
valence band and the conduction band determines the relative ease with which
electrons will jump across the gap. In a doped polymer, charge is removed from the
highest occupied molecular orbital (HOMO) while charge is injected to the lowest
unoccupied molecular orbital (LUMO) and this takes place in the mid-gap states [14].
6

These bands stem from the splitting of interacting molecular orbitals of the constituent
monomer units in a manner reminiscent of the band structure of solid-state
semiconductors (Figure 1.3). The smaller the band gap, the higher the doping level in
the polymer.
C O N D U C T IO N B A N D
V A L E N C E B A N D
E n e rg y
b a n d g a p
… … ..L U M O
… … .H O M O
C O N D U C T IO N B A N D
V A L E N C E B A N D
E n e rg y
b a n d g a p
… … ..L U M O
… … .H O M O
Figure 1.3: Band structure in an electronically conducting polymer
The mechanism of charge propagation in conducting polymer using polypyrrole as
example is discussed further in section 2.2. Other factors that influence the
conductivity are impurities, folds in the chain structure, chain ends, and differences
between amorphous and crystalline regions [12].
Conductivity is not only a result of charge transfer along the chain, but is also due to
electron hopping between chains and between different conjugated segments of the
same polymer chain. In addition to these effects that act at a molecular level, electron
transfer between grain boundaries and variations in morphology also dominates bulk
conductivity values. Thus, the conjugated polymers bulk conductivity may be
described by Equation 1.1 [7].
∑=E
evZnσ iii Equation 1.1
where σ = conductivity (S/cm),
ni = number of charges carried by each type i,
Zi = carrier type,
e = electronic charge (1.60 x 10⁻¹⁹ C),
vi = drift velocity of electron (cm/s), and,
E = electric field (V/cm)
7

Eq. 1.1 takes into account different types of charge carrier, which contribute to the
overall observed electrical conductivity in the bulk polymer.
1.2 Some applications of intrinsically conducting polymers
The ICPs have been a big challenge to classical materials in many applications. There
is however the need to temper the enthusiasm generated by the discovery of ICPs as
potential competitor for classical metals and semiconductors, but rather seen as mere
opportunities for new applications [1]. Polymer films of ICPs such as PPy, PTh and
PANi on electrode surfaces can be switched between the oxidized conducting state
and the reduced insulating state by the ingress and egress (i.e. doping and de-doping)
of counter anions [15]. This change is always accompanied with a proportionate
signal (e.g. current, impedance, capacitance, etc) corresponding to the concentration
of the counter ion in solution and the change in conductivity of the polymer.
The oxidation-reduction processes for PANi, PPy and PTh on an electrode surface are
depicted in Fig. 1.4. This reversible charging and discharging property of ICPs is a
useful property employed in the production of various electronic devices,
optoelectronic and biotechnological applications such as rechargeable batteries,
molecular electronics, solar cells, electronic displays, electrodes, diodes, redox
supercapacitors and superconductors, Electromagnetic material interference (EMI)
shielding materials, ion exchange membranes in fuel cells, field effect transistors,
printed circuit boards, electrochemical ionic sensors, use as ion gate membrane for
drug release systems and biosensors, etc [11]. A lot of monographs and reviews have
been documented for different scope of applications [7, 11, 13, 15, 16]. Some of these
application ranges are already commercialised while some are still being developed.
The colour changes during switching of ICPs (conducting states) enable their use in
the manufacture of multichromic displays and electrochromic windows [11]. The
hole-injection properties of the polymers under an applied potential or current enable
their use as flexible light emitting diodes (LED) and light emitting cell (LEC) [11].
8
The ability of ICPs to change chemical properties by chemical, thermal or appropriate
polarisation equally provides them with unique properties for easy changeable
retention behaviour. This property is employed in their use for solid phase extraction
(SPE) based on the sorption of analytes on the conducting polymer coated solid
support. Chromatographic application using ICPs as a new stationary phase for gas
and liquid systems as well as in electrochemical detectors in liquid chromatography
are part of the diverse application of this novel material [16].
NH n
+
A-
NH n
0
+ A-+e-
-e-
I
II
S
+
n
A- +e-
-e-S n
0
+ A-
III
NH
NH
NH
NH
n
NH
NH
NH
NH
+. +.
n
N N N N
A- A-
- 2e-
+ 4H+- 4H+
+ 2 e-
+2e- -2e-
HA
n
Figure1.4: Postulated oxidation-reduction processes for (I) polypyrrole, (II)
polythiophene and (III) polyaniline [15].
Another successful and important application of ICPs is in the construction of gas
sensing arrays (electronic-noses) based on the use of solid contacts with ion selective
electrodes [16].
9

Recently, use of nanostructured conducting polymers as electrode materials has
received remarkable interest owing to improved electrocatalysis [17]. The production
of the electrode materials must therefore take the advantage of using methods that
generates nanostructured materials with good, cost effective and competitive
electroanalytical applications. Section 2.1 presents the strategies for production of
nanostructures such as template free, template assisted and molecular template
assisted methods. These nanostructures are miniatures such as nanowires [18],
nanofibres [19], nanotubes, nanoballs, and nanodots and in particular nanoparticles
[17, 20, 21]. The advantages offered by nanoparticle-modified electrode when
compared to a microelectrode are high effective surface area, mass transport,
catalysis, and control over local environment [22].
1.2.1 Polypyrrole and its applications in sensors
Amongst the ICPs, PPy has excellent environmental stability, easy synthesis, good
conductivity and other intrinsic properties that are of promising applications in
various fields of science and technology [23–30]. However, its application is grossly
limited because it is insoluble and infusible. Various efforts have been made to
address this gross shortcoming that impairs the PPy’s processability so that the
inherent electronic potentials offered by the polymer could be maximally harnessed
[30 -32]. The use of conducting PPy as sensors is derived from the polymers ability to
manifest different conductivities when exposed to different types and concentration of
analytes. It is also well known that the mechanical, physical and chemical properties
of PPy strongly depend on the nature of the dopant anion [33]. The interaction of
gaseous components with deposited PPy films produces changes in colour, mass,
work function or electrical conductivity. The resistance decreases with the gas of
larger electron affinity [17, 34]. The factors responsible for the observed changes in
resistance are ionic interactions, type of functional groups, presence of lone pairs and
electron bridging species [17].
Over the last three decades, it has been known that chemiresistors with ICP layer on
an electrode do respond to a variety of gases and some organic vapours [16]. The
interaction of electrophilic gases attracts electrons from the polymer phase, thus
causing an increase in conductivity whereas nucleophilic gases increase the resistance
10

of the polymer. The use of a conducting polymer modified electrode can be used for
the detection of not only gaseous analytes but also for solution species. The
interaction or adsorption of organic or inorganic molecular species at the
polymer/solution interface may also affect the electronic charge transfer process in
relation to the concentration of the gaseous or liquid analytes. Detection of ammonia
in aqueous solution was reported for polypyrrole [35], and it is noteworthy that the
PPy application was patented shortly thereafter [36]. A comprehensive review of
different chemical sensors for electronic nose systems was reported recently by James
et al. (2005) involving the use of intrinsic (doped) conducting polymers, extrinsic
(composite) conducting polymers based on different transduction technologies [37].
Today, there are a lot of anthropogenic pollutants in our gaseous and aqueous
environment and there is the challenge of controlling the concentration of these
analytes using improved electrochemical techniques. This challenge calls for new
electrochemical sensors that could be used to provide continuous information about
the environment. The synthesis, characterisation and application of nanostructured
PPy modified with different dopants for the determination of some anthropogenic
organic pollutants found in wastewaters shall be investigated in this study. Details of
the possible interfacial interaction between the various analytes and the transducer
(PPy) will be undertaken based on the understanding that the molecules of analytes
are first adsorbed on the surface of the sensor and finally absorbed into the matrix of
the polymer [38, 39]. The research proposal which was the basis of this study is
summarised and presented underneath.
1.3 Research Objectives
1.3.1 Preamble
Specialty polymers, such as native and derivatised polypyrrole (PPy), polythiophene
(PTh) and polyaniline (PANi) are the most popular intrinsically conducting polymers
(ICP) [40, 41]. The research and industrial interest in these ‘organic electronics’ is
due to a good combination of properties, reasonable stability, low cost, ease of
synthesis, and the possibility of tailoring the structures on the molecular scale. There
are numerous attempts to apply high conductivity, electrochromic, catalytic, sensor,
11

redox and other properties of these polymers to different practical needs [41–53].
Their direct application has been however greatly limited because they suffer
processability limitation because of their intractable nature. Of recent, the application
of ICPs has been widened through formation of composites or blends with common
polymers [41, 43-47, 54–56] and other particulate dispersants like SiO2 and SnO2 to
form nanocomposites with better processability [52].
1.3.2 Background information and Motivation
The discovery of carbon nanotubes (CNTs) in 1991 by Sumio Iijima and the inherent
high conductivity, high chemical stability, extremely high mechanical strength and
modulus, led to a new branch of science called nanotechnology [57, 58]. Due to the
ability of CNTs to promote electron transfer, they are used as electrode materials to
prepare sensors and in the study of direct electrochemistry of biological molecules
[59-63]. The same principle is applicable to the ICPs, otherwise called synthetic
metals.
Present day material science deals with microstructures of characteristic morphology
and dimensions between 1 and 100 nm. Current chip technology is also reported to
produce structures with a characteristic dimension of about 100 nm [57]. In building
up such nanostructures, scientist aims at structuring molecules through ingenious
synthesis procedures to build functional superstructures via supramolecular self-
organization. Reduction in particle size of the polymeric materials to the nanometer
level imparts unique properties that make them suitable for chemical and physical
sensing, and the control of the structure of sensing surfaces on the nanometer scale
can be utilized to enhance sensor performance.
Inorganic, organic as well as biological materials can be integrated to functionalized
systems to build up novel nanostructures for application in catalysis, electro-optics,
high performance ceramics as well as chemo and gene therapy. All these will result in
improvements in the areas of electronics, telecommunication and health care. For
example mixing oxide nanoparticles into poly (2-methoxy-5- (2-ethyl hexyloxy)-1,4-
phenylenevinylene) (MEH-PPV) gave rise to enhancement of the current density and
radiance in polymer light emitting diodes (PLEA), and the composites of conjugated
12
polymers and nanoparticles that exhibited useful composition for application in
photonics [55, 56]. Also, in situ polymerization reactions in medium containing
surfactants such as poly- (styrene sulphonic acid) (PSSA), poly-vinyl alcohol (PVA)
or transition metal systems (e.g. vanadium pentoxide) do generate stable
nanocomposites with properties useful for amperometric and impedimetric sensor
devices [55, 56].
Delvaux et al. [56] reported the template synthesis of PANI micro and nanotubes
based on oxidative polymerization of aniline within the pores of particle track-etched
membranes while Wei et al. [58] suggested the possibility of preparation of PANI
nanotube through a self assembly method. This opens the possibility of extending the
technique of nanotube materials to other polymers. These conducting polymers can be
reversibly changed between insulating and conducting states through chemical or
electrochemical doping reactions [41, 48].
The present study proposes to develop novel nano-structured or nanometer scale
sensor devices for environmental analysis of anthropogenic priority organic pollutants
contained in industrial wastewater systems. Among the compounds of interest are
benzenoids such as benzene, toluene, ethylbenzene and xylene isomers (BTEX) that
are also volatile organic pollutants (VOC’s), chlorinated compounds (e.g.
trichloroethylene, [TCE]), polycyclic aromatic hydrocarbons (PAHs); e.g.
naphthalene, fluroanthene, pyrene) and polychlorinated biphenyls (PCBs) and other
priority organic pollutants (POP’s) such as benzidine, phenol and its derivatives.
These culprit organic compounds are known to have varying degrees of toxic,
mutagenic or carcinogenic activities. Chromatographic (TLC, GC, HPLC),
spectroscopic (UV-Vis, IR, MS) or coupled techniques (GC-MS) are presently
heavily relied upon for environmental analysis. The disadvantages are high cost, not
being user friendly and failure to indicate whether the compounds are accessible for
assimilation by living organisms.
The rationale for this proposed study is the need for relatively low cost, miniaturised
and easy-to-use hand-held nanosensor systems for on site application, which to a great
extent maintains sample integrity. Environmental impedimetric and chemosensor
devices containing ICP nanotube films will be developed and applied for real-time
13
determination and speciation of PAHs and VOCs associated with industrial
wastewater effluents.
1.3.3 Objectives
The main aim of this study is to develop a novel strategy for harnessing the properties
of electroconductive polymers in sensor technology by using polymeric
nanostructured blends in the preparation of high performance sensor devices. The
objectives include:
i. To electrochemically and chemically prepare intrinsically conducting polymers
(ICPs) of pyrrole doped with different polyaromatic hydrocarbon sulphonic acid
(PAHSA) and transition metal oxides of WO3 and ZrO2.
ii. To characterize the intrinsically conducting polymers by instrumental,
electrochemical and impedimetric techniques.
iii. To develop high performance nano-sensor devices using the polymers for
determination of some priority organic pollutants (POPs) present in waste waters.
iv. To model the reactivity of the intrinsically conducting polymers sensor systems.
1.3.4 Methodology
1.3.4.1 Preparation of ICP nanomaterials and sensors
In this study processable electrically conducting PPy nanotubes was prepared by in
situ oxidative polymerization of the monomer in acid solutions using PAHSA of
naphthalene sulphonic acid (NSA) and the sodium salt of 1, 2-naphthaquinone-4-
sulphonic acid (NQS) as stabilizing surfactants. Electrosynthetic or chemically
synthesized nanostructural formats of polymer composites doped with transition metal
oxides (WO3 and ZrO2) were equally explored. The resulting nanotubes will
subsequently be blended with polyurethane acting as a compliant, insulating host for
sensor application. The oxidative polymerization will be performed either electro
synthetically to produce self-assembled polymer layers on platinum, gold or glassy
carbon electrode; or chemically to produce polymer pastes using ammonium
peroxydisulphate as oxidant.
14
1.3.4.2 Characterization and application of ICP nanomaterials and sensors
Electrochemical characterization was performed in aqueous medium with the help of
electrochemical workstations. The electrochemical and spectroscopic techniques used
includes:
i. Cyclic voltammetry (CV).
ii. Osteryoung square wave voltammetry (OSW).
iii. Differential pulse voltammetry (DPV).
iv. UV/Vis spectroelectrochemistry.
v. Impedance spectroscopy.
Morphological and structural characterizations were performed on the prepared
nanomaterials with scanning electron microscopy (SEM).
The application of ICP nanotubes sensors/electrodes was undertaken using glassy
carbon, platinum or gold disc electrodes. The sensors was tested for their suitability as
impedimetric and amperometric electrode materials for some anthropogenic pollutants
in wastewater; namely phenol, naphthalene and benzidine. Electrochemical data
generated for the various electrode materials were explored for the analysis of the
pollutants in wastewaters using their reactivity in aqueous systems by EIS and
voltammetry.
Modeling of the reactivities of ICP modified electrodes and sensors involved the
monochromatic stimulation procedure [64-70] for the measurement of ICPs electrode
impedance. The reactivity of electrochemical sensors involve slow preceding
reactions, slow electrode kinetics and diffusion, all of which contribute to the
impedance of electron flow and hence to lower currents. Impedance data was
generated for studying the electrochemical phenomenon at the electrode’s interface by
perturbations with different potentials over a broad frequency range (usually 100 kHz
to 100 mHz) to determine the electrical characteristics such as resistors, capacitors
and inductors of the system. The study did not only involve the Nyquist plots but also
bode plots so that information on change of impedance with frequency could be
obtained for the circuit elements. The electrochemical modeling of the surface
properties of various ICP-modified electrodes involved search for an appropriate
15

equivalent circuit model in order to isolate the different contribution to the overall
response during an electrochemical perturbation [64-70]. Impedance circuits tested
includes:
(a) Series and parallel combination of single equivalent elements.
(b) Series and parallel combination of multiple equivalent elements.
The preparation of various impedance circuits and models for the various nanosensor
systems depends on the appropriate model that fit the physical electrochemistry and
equivalent circuit elements such as:
(c) Models based on purely capacitive system as Nyquist and Bode plots.
(d) Models based on randles cell for the Nyquist plots.
(e) Models based on Warburg impedance.
(f) Models based on mixed kinetic and charge transfer control circuits as
Nyquist and Bode plots.
(g) Models for a failed coating.
Reliable and scalable synthetic methods for nanostructured conducting polypyrrole
with interesting technological and scientific properties for both research and
environmental applications are to be optimised.
1.4 Thesis layout
The thesis is structured into seven chapters. Chapter one introduces the subject of
conducting polymers and how the intrinsic conductivity is generated. The research
proposal, objectives, methodology and techniques used are briefly highlighted.
Chapter two gives a general literature review on the intrinsically conducting polymers
and techniques for the production of nanostructurised conducting polymers. General
properties of polyaniline, polypyrrole and polythiophene are discussed alongside the
factors that influence their stabilities. A review of the characterisation techniques,
electrocatalytic applications and challenges for the future with respect to these
polymers are discussed. Introduction of dopant materials and the anthropogenic
organic pollutants used as analytes is presented.
16

Chapter three gives a brief synopsis on the different analytical techniques and general
experimental procedure for the chemical and electrochemical preparation; and
characterization of the electroactive materials. This gives the necessary methodology
and the applied electrochemical principles for the sensor development.
Chapter four discusses the experimental results obtained from the chemical and
electrochemical preparation and characterization of naphthalene sulphonic acid
doped-polypyrrole (PPyNSA) alongside hydrochloric acid doped polypyrrole
(PPyHCl). The application of the naphthalene sulphonic acid doped-polypyrrole
(PPyNSA) as amperometric sensor for phenol is presented.
Chapter five presents the experimental results obtained from the chemical and
electrochemical preparation; characterization and application of naphthalene 1, 2-
naphthaquinone-4-sulphonic acid doped-polypyrrole (PPyNQS) as impedimetric
sensor for benzidine and naphthalene.
Chapter six presents the experimental results of the preparation and characterization
of metal oxide doped-polypyrrole (PPyWO3 and PPyZrO2) as potential sensor
material.
Chapter seven gives the summary of the main scientific contributions of the
dissertation, conclusions drawn from them and recommendations for future research
References
1. Street, G.B., & Clark, T.C. (1981). “Conducting polymers: A review of Recent
Work”, IBM J. Res Develop., 25(1), 51–57.
2. MacDiarmid, A.G. (2001). "Synthetic metals: A novel role for organic polymers
(Nobel Lecture)", Angew. Chem. Int. Ed., 40, 2581-2590.
3. Handbook of conducting polymers, (1998). (Eds: Skothiem, T.A., Elsenbaumer,
R.L., & Reynolds, J.F.), 2nd ed., Mercel Dekker, New York.
17
4. Shirakawa, H., Louis, E.J., MacDiarmid, A.G., Chiang, C.K., & Heeger, A.J.
(1977). ‘Synthesis of electrically conducting organic polymers: halogen derivatives of
Polyacetylene, (CH),’ J. Chem. Soc., Chem. Commun., 578-580, In Colin Pratt (1996)
Conducting Polymers, http://www.ntlworld.com/colin.pratt/cpoly.pdf of 22nd
February 1996.
5. Thieblemont, J.C., Planche, M.F., Petrescu, C., Bouvier, J.M. & Bidan, G. (1993).
Stability of chemically synthesized polypyrrole films, Synthetic Metals, 59, 81-96.
6. Billingham, N.C. & Calvert, P.D. (1989). ‘Electrically conducting polymers – a
polymer science viewpoint,’ Advances in Polymer Science, 90, 1.
7. Smith, J.R. (1995). Electrosynthesis of Novel Polyheterocycles, Doctoral Thesis,
University of Portsmouth, UK.
8. http://en.wikipedia.org/wiki/Conductive_polymer , accessed on 28 February 2007
9. MacDiarmid, A.G., Epstein & A.J., In MacDiarmid, A.G. (2001). “Synthetic
Metals”: A Novel Role for Organic Polymers (Nobel Lecture), Angew. Chem. Int. Ed.,
40, 2581–2590.
10. Vernitskaya, T.V. & Efimov, O.N. (1997). Polypyrrole: a conducting polymer; its
synthesis, properties and applications, Russian Chemical Reviews, 66 (5), 443-457.
11. Malhotra, B.D., Chaubey, A., & Singh, S.P. (2006). Prospects of conducting
polymers in biosensors, Analytica Chimica Acta., Doi:10.1016/j.aca.2006.04.055
12. Bloor, D. (1989). Electrical Conductivity, In Comprehensive Polymer Science,
Pergammon Press, New York, p687.
13. Paoli, M.D. & Gazotti, W.A. (2002). Electrochemistry, Polymers, and Opto-
Electronic Devices: A Combination with a Future, J. of the Brazilian Chemical
Society, 13(4), published on the web, http://www.icml9.org/ of 10th July, 2002.
18

14. Freund, M.S. & Deore, B.A. (2007). Self-Doped Conducting Polymers,
http://media.wiley.com/product_data/excerpt/92/04700296/0470029692.pdf assessed
on 1st March, 2007, 2007 John Wiley & Sons, Ltd.
15. Leech, D. (1996). In Electroactive Polymer Electrochemistry, Part 2: Methods and
Applications, edited by Michael EG Lyons, Platinum Press, New York, 1996, pp285.
16. Trojanowics, M. (2003). Application of Conducting Polymers in Chemical
Analysis, Michrochimica Acta, 143, 75–91.
17. Welch, C. M. & Compton, R.G. (2006). The use of nanoparticles in
electroanalysis: A review, Anal Bioanal Chem, 384, 601–619.
18. Hongliang, Y., Lan, Z., Jiaoyan, S., Zhaojia, C., Gaoquan, S. & Binglin, Z.
(2006). Synthesis, property and field emission behaviour of amorphous polypyrrole
nanowires, Nanotechnology, 17, 3446-3450.
19. Zhang, X., & Manohar, S. (2005). Narrow Pore-Diameter Polypyrrole Nanotubes,
J. Am. Chem. Soc., 127, 14156-14157.
20. Banks, C.E., Davies, T.J., Wildgoose, G.G. & Compton, R.G. (2005).
Electrocatalysis at graphite and carbon nanotube modified electrodes: edge-plane sites
and tube ends are the reactive sites, Chem Commun, 7, 829-841.
21. Dai, X., Nekrassova, O., Hyde, M.E. & Compton, R.G. (2004). “Anodic Stripping
Voltammetry of Arsenic (III) Using Gold Nanoparticle-Modified Electrodes”, Anal
Chem., 76, 5924-5929.
22. Kattz, E., Willner, I. & Wang, J. (2004). Electroanalytical and bioelectroanalytical
systems based on metal semiconductor nanoparticles, Electroanalysis, 16, 19–44.
23. Asavapiriyanont, S., Chandler, G.K. & Gunawardena, G.A. (1984).
Electrodeposition of polypyrrole films from aqueous solutions, J. Electroanal. Chem.
177, 229–244.
19

24. Duchet, J., Legras, R. & Demoustier-Champagne, S. (1998). Chemical synthesis
of polypyrrole: structure–properties relationship, Synthetic Metals, 98, 113–122.
25. Kassim, A., Basar, Z. B., & Mahmud, H.N.M.E., (2002). Effects of preparation
temperature on the conductivity of polypyrrole conducting polymer, Proc. Indian
Acad. Sci (Chem. Sci.), 114(2), 155–162.
26. Turcu, R., Grecu, R., Brie, M., Peter, I., Bot, A. & Graupner, W. (2001).
Spectroscopic investigation of the electron delocalisation and molecular
conformational changes in polypyrrole induced by different doping ions, Studia
universitatis babes-bolyai, Physica, special issue, 216–222.
27. Lu, Y., Pich, A. & Adler, H. (2003). Synthesis and characterization of nanometer-
sized polypyrrole composites, Synthesis Metals, 135–136, 37–38.
28. Masunda, H., & Asano, D. K. (2003). Preparation and properties of polypyrrole,
Synthetic Metals, 135–136, 43–44.
29. Yang, Y., Liu, J. & Wan, M. (2002). Self-assembled conducting polypyrrole
micro/nanotubes, Nanotechnology, 13, 771–773.
30. Lee, J.Y., Kim, D.Y. & Kim, C.Y. (1995). Synthesis of soluble polypyrrole of the
doped state in organic solvents, Synthetic metals, 74, 103–106.
31. Yakovlena, A. A. (2000). Electrochemistry of polypyrrole films in aqueous
solutions: The character of the bond between the anion and the polymer matrix,
Russian Journal of Electrochemistry, 36(12) 1275 – 1282.
32. Dongtao, G.E., Wang, J., Wang, S., Jianbiao, M.A. & Binglin H.E. (2003).
Electrochemical synthesis of polypyrrole nanowires, J. of Materials Science Letters,
22, 839-840.
20
33. Potje-Kamloth, K. (2002). Chemical gas sensors based on organic semiconductor
polypyrrole, Critical reviews in Analytical Chemistry, 32(2), 121-140.
34. Ameer, Q. & Aduloju, S.B. (2005). Polypyrrole-based electronic noses for
environmental and industrial analysis, Sensors and Actuators B, 106, 541–552.
35. Trojanowicz, M., Lewenstam, A., Krawczyński, vel K. T., Lähdesmäki, I. &
Szczepek W. (1996). "Flow injection amperometric detection of ammonia using
polypyrrole-modified electrode and its application in urea and creatinine biosensors"
Electroanalysis, 8, 233-243.
36. Lewenstam, A.., Matuszewski W. & Trojanowicz M., (1996). "Procedure and
apparatus for the determination of concentration of ammonia, and a procedure for the
manufacturing of a detector", United States Patent No. 5, 498, 323.
37. James, D., Scott, S.M., Ali_, Z. & O’Hare, W.T. (2005). Chemical sensor for
electronic nose systems, Microchimica Acta, 149, 1-17.
38. de Melo, C.P., Neto, B. B., Lira, L. R. B. & de Souza, J.E.G. (2005). Colloids
and Surfaces A, 257–258, 99–103.
39. Grate, J. W. & Abraham, M. H. (1991). Solubility interactions and the design of
chemically selective sorbent coatings for chemical sensors and arrays, Sensors and
Actuators B: Chemical, 3(2), 85-111.
40. Aduloju, S.B. & Wallace, G.G. (1996). Conducting polymers and the
bioanalytical sciences, Analyst, 121, 699-703.
41. Pud, A., Ogurtsov, N., Korzhenko, A. & Shapoval, G. (2003). Some aspects of
preparation methods and properties of polyaniline blends and composites with organic
polymers, Prog. Poly. Sc., 28, 1701-1753.
42. Long, Y., Chen, Z., Wang, N., Li, J. & Wan, M. (2004). Electronic transport in
PANI-CSA/PANI-DBSA polyblends. Condensed Matter B, 344, 82-87.
21

43. Amado, F. D. R., Gondran, E., Ferreira, J.Z., Rodrigues, M.A.Z. & Ferreira, C.A.
(2004). Synthesis and characterisation of high impact polystyrene/polyaniline
composite membranes for electrodialysis, J. Membrane Science, 234, 139-145.
44. Iwuoha, E.I., & Smyth, M.R. (1996). “Application of polymers in
Electroanalytical Chemistry”. In Electroactive Polymers Electrochemistry, Part II:
Methods and Applications, edited by M.E.G. Lyons, Plenum Press, New York, pp.
297-328.
45. Jain, S., Chakane, S., Samui, A.B., Krishnamurthy, V.N. & Bhoraskar S.V.
(2003). Humidity sensing with weak acid-doped polyaniline and its composites.
Sensors Actuators B: Chemical, 96, 124-129.
46. M. Chipara, D. Hui, P. V. Notingher, M. D. Chipara, K. T. Lau, J. Sankar, D.
Panaitescu. (2003). On polyethylene–polyaniline composites. Composites B:
Engineering, 34, 637-645.
47. Talapin, D.V., Poznyak, S.K., Gaponik, N.P., Rogach, A.L. & Eychmüller, A.
(2002). Synthesis of surface-modified colloidal semiconductor nanocrystals and study
of photoinduced charge separation and transport in nanocrystal-polymer composites.
Physica E: Low-dimensional Systems and Nanostructures, 14, 237-241.
48. Su, S.-J. & Kuramoto N. (2000). Synthesis of processable polyaniline complexed
with anionic surfactant and its conducting blends in aqueous and organic system.
Synthetic Metals, 108, 121-126.
49. Iwuoha, de Villaverde, D.S., Garcia, N.P., Smyth, M.R. & Pingarron, J.M. (1997).
Reactivities of organic phase biosensors. 2. The amperometric behaviour of
horseradish peroxidase immobilised on a platinum electrode modified with an
electrosynthetic polyaniline film. Biosen. Bioelectron., 12, 747-761.
22

50. Geng, Y.H., Sun, S.C., Li, J., Jing, X.B., Wang, X.H. & Wang F.S. (1999). Water
soluble polyaniline and its blend films prepared by aqueous solution casting. Polymer,
40, 5723-5727.
51. Avlyanov, J.K. (1999). Stable polyaniline and polypyrrole nanolayers on carbon
surface. Synthetic Metals, 102, 1272-1273.
52. Ballav, N., & Biswas, M. (2003). Preparation and evaluation of nanocomposites
of polythiophene with Al2O3, Polymer International, 52, 179-184.
53. A. Galatanu, M. I. Chipara, M. D. Chipara and M. Toacsen, J. Planèes, Y.
Cheguettine, Y. Samson (1997). Structural properties of conducting and
semiconducting polymers. Physica B: Condensed Matter, 234-236, 242-244.
54. B.D. Yang, K.H. Yoon, K.W. Chung (2004). Dispersion effect of nanoparticles on
the conjugated polymer–inorganic nanocomposites. Materials Chemistry Physics 83,
334–339.
55. Ray, S.S. & Biswas, M. (2000). Water-dispersible conducting nanocomposites of
polyaniline and poly (N-vinylcarbazole) with nanodimensional zirconium dioxide,
Synthetic Metals 108, 231–236.
56. Delvaux, M., Duchet, J., Stavaux, P-Y., Legras, R., & Demoustier-Champagne, S.
(2000). Chemical and electrochemical synthesis of polyaniline micro and nano-
tubules. Synthetic Metals, 113, 275–280.
57. Wang, S.J., Cheng, C.H., Chang, S.H., Wong, C.H., Uang, K.M. & Chen T.M.
(2005). On the thermal annealing conditions for self synthesis of tungsten carbide
nanowires, Nanotechnology, 16 (2), 273–277.
58. Wei, Z., Zhang, Z. & Wan, M. (2002). Formation mechanism of self-assembled
polyaniline micro/nanotubes, Langmuir, 18, 917-921.
23

59. Iwuoha, E.I., Leister, I., Miland, E., Smyth, M.R. & Ó’Fágáin, C. (1997).
Reactivities of organic phase biosensors. 1. Enhancement of the sensitivity and
stability of amperometric peroxidase biosensors using chemically modified enzymes,
Anal. Chem., 69, 1674-1681.
60. Iwuoha, E.I. & Smyth, M.R. (2003). Reactivities of organic phase biosensors: 6.
Square-wave and differential pulse studies of genetically engineered cytochrome
P450cam (CYP101) bioelectrodes in selected solvents. Biosensors Bioelectronics, 18,
237-244.
61. Brahim, S., Wilson, A.M., Narinesingh, D., Iwuoha, I. & Guiseppi-Elie, A.
(2003). Chemical and biological sensors based on electrochemical detection using
conducting electroactive polymers, Microchimica Acta 143, 123–137.
62. Iwuoha, E.I., Wilson, A., Howel, M., Mathebe, N.G.R., Montane-Jaime, K.,
Narinesingh, D. & Guiseppi-Elie, A. (2004). Cytochrome P4502D6 (CYP2D6)
bioelectrode for fluoxetine, Analytical Letters, 37, 943-956.
63. Chandrakanthi, L.R.N. & Careem, M.A. (2002). Preparation and characterization
of Cadmium sulphide and copper (I) sulphide and nanoparticle polyaniline composite
films. Thin Solid Films, 417, 51–56.
64. Baronas, R., Kulys, J. & Ivanauskas, F. (2004). Modelling amperometric enzyme
electrode with substrate cyclic conversion. Biosensors and Bioelectronics, 19, 915–
922.
65. Galceran, J., Taylor, S.L. & Bartlett, P.N. (2001). Modelling the steady-state
current at the inlaid disc microelectrode for homogeneous mediated enzyme catalysed
reactions. J. Electroanalytical Chemistry, 506, 65–81.
66. Mahon, P.J. & Oldham, K.B., (2001). Incorporating electrode kinetics into the
convolutive modeling of reactions at planar, cylindrical and spherical electrodes.
Electrochimica Acta, 46, 953–965.
24
67. Mahon, P.J. & Oldham, K.B., (1999). Convolutive modelling of electrochemical
processes based on the relationship between the current and the surface concentration.
J. Electroanalytical Chemistry, 464, 1–13.
68. Valøen, L.O. & Tunold, R. (2002). The electrochemical impedance of metal
hydride electrodes. J. Alloys Compds, 330–332, 810–815.
69. Savitri, D. & Mitra, C.K. (1999). Modeling the surface phenomena in carbon paste
electrodes by low frequency impedance and double-layer capacitance measurements.
Bioelectr.Bioenerg, 48, 163–169.
70. Park, S. & Yoo, J. (2003). Electrochemical impedance spectroscopy for better
electrochemical measurements. Analytical Chemistry, November 1, 455A– 261A.
25
Chapter Two
Literature Review
In this chapter, different routes for the preparation of the intrinsically and
nanostructured conducting polymers (NCP) of PANi, PPy and PTh are discussed. The
preparation and blending methods, properties, factors affecting stability and
characterization techniques of the NCPs together with their hybrids/composites are
reviewed. Moreso, a broad review of their applications as electro catalytic sensors is
presented. A review on the doping materials used in preparing modified polypyrrole
chemical sensors is presented vis-à-vis the anthropogenic organic pollutants
investigated in this study.
2. Introduction to Nanostructured Conducting Polymers
An emerging sub discipline of chemical and material science is nanomaterials. It deals
with development of methods for synthesizing nanoscopic particles of a desired
material and the scientific investigations of the nanomaterial obtained. Sumio Iijima
introduced the terms nanotubes and nanowires to the world of science from his
discovery of carbon nanotubes in 1991 [1]. During the past decade, there has been a
great technological focus on the production of nanostructurised materials [1-10]. The
growth of nanostructures is increasing daily because nanomaterials are not only good
conductors of electricity but potential chemically inert matrix for various electron
field emission characteristics [5].
A lot of research findings have been reported on nanoparticles, nanotubes, nanorods,
nanobelts, nanofilms, nanowires, nanocables and nanocomposites, which are all
nanomaterials [1-5, 7, 10]. Infact the number of nanoparticle-based papers published
per year since 1994 to date has been on the increase [10]. It is therefore not surprising
that a lot of resources are being committed to nanotechnology sector by various
organizations and governments in the USA, Japan and many European countries to
fund research that will help industry harness the commercial opportunities offered by
26
this novel technology [10]. According to a report from Lux Research entitled
"Ranking the Nations: Nanotech's Shifting Global Leaders", the U.S., Japan, South
Korea, and Germany dominate today, but Taiwan and China will challenge them for
leadership in the next seven years [11]. The advantages derived from the use of
nanoparticles or NCPs over micro/macroparticles as an electrode material includes
high effective surface area, better mass transport, better catalysis and control over
local microenvironment. A nanoparticle with sizes of about 100 nm has been reported
to produce seventy times magnitude of current when applied in electroanalyses
compared to that from a micro electrode [10].
The evolution into the world of nanomaterials came up after the scientific discovery
of conducting polymers in 1970’s. The intrinsic conductivity in organic polymers,
based on the utilization of the л-electrons, or electron donors or acceptors for charge
propagation in the polymer matrix is significantly improved when nanostructurised
materials are used [7]. Many polymers have been used as matrix materials in carbon
nanotubes (CNTs) /polymer composites for various target applications. Carbon
nanotubes (CNTs) are molecular scale wires with high electrical conductivity,
extremely high mechanical strength, and can be divided into two categories: single-
walled carbon nanotubes (SWNTs) and multi-walled carbon nanotubes (MWNTs)
[12]. They resemble rolled up graphite and it was found to act as conductors or
semiconductors with very high tensile strength. The existence of nanotubes within
nanotubes led to the distinction between multi-walled nanotubes (MWNTs) and
single-walled nanotubes (SWNTs), which have been reported for potential use in
photovoltaic devices [13]. Apart from its remarkable tensile strength, nanotubes
exhibit varying electrical properties (depending on the way the nanostructures spirals
around the tube, and other factors, such as doping), and can be superconducting,
insulating, semi conducting or conducting (metallic). Usually, the MWNTs have
larger diameters and better electrical properties than the SWNTs [14].
Http://www.nanotech.now/nanotube reported that ''one dimensional fiber (nanotube)
exhibit electrical conductivity as high as copper, thermal conductivity as high as
diamond and strength of 100 times greater than steel''.
Present day material science and chip technology deals with microstructures of
characteristic morphology with dimensions of 1 and 100 nm [13]. In building up these
27

nanostructures, scientist aims at structuring molecules through specialized synthesis to
build functional superstructures by self-organization [13]. Inorganic, organic as well
as biological materials can be integrated to functionalized systems to build up
nanostructures of novel application in catalysis, electro-optics, high performance
ceramics as well as chemo and gene therapy. The size dependent changes in the
physical and chemical properties of the nanomaterial composite obtained makes them
different from those of the bulk material. The larger surface to volume ratio provides
substantial changes in the chemical, electrical and optical properties. These
developments have produced significant improvements in the areas of electronics,
telecommunication and health care. Recently, the electrochemistry related aspect of
nanostructurised conducting polymers have attracted a great deal of interest because
of their potential application as electric energy storage system, chemical-to-electric or
vice versa energy conversions, sensors and biosensors, and materials for corrosion
protection [8, 10].
2. 1 Preparation methods for conducting polymers of PANi, PPy and PTh
Of the intrinsically conducting polymers, polyaniline, polypyrrole and polythiophene
have been greatly exploited for practical applications in many areas of human needs.
Other electronic polymers are poly-acetylene, poly-(para-phenylene), poly-
(phenylenevinyl-ene), polyfuran, polyindole, polycarbazole and other poly-
(heteroaromatic vinylenes). The structural feature common to conducting polymers is
their alternating single and double bond lattice structure which allows for the transfer
of charge carriers upon excitation by the use of appropriate dopants. Doping materials
can include iodine, bromine, lithium, sodium, mineral acids and surfactants. The
conjugated system of PANi, PPy and PTh is earlier described in Fig. 1.1.
Many publications have appeared on the preparation and blending techniques for
these polymers and their substituted derivatives [15, 16, 17]. Improved solvent
solubility and thermal stability for the polymers were obtained when blended with
conventional polymers such as polyvinyl acetate (PVAc), polystyrene (PS) and
polyvinyl acetate (PVA). However, the conductivity of the blends formed was lower
than the conventional host polymers [18]. Over the years, conducting polymers are
prepared by a variety of techniques including cationic, anionic, radical chain growth,
28
co-ordination step growth polymerization or electrochemical polymerization [17–34].
The electrochemical polymerization of conducting polymers is generally achieved by
galvanostatic, potentiostatic or potential scanning voltammetry. The conductivity and
yield of the polymeric product are enhanced by doping, use of oxidizing or reducing
agent or a protonic acid to give a highly delocalized polycation or polyanion [18].
The preparation techniques aim at getting a product with excellent conductivity and
good environmental stability. The applications of these polymers have suffered
greatly because of their intractable nature and insolubility in common solvents. This
limitation in post-synthesis processability is due to the chain stiffness and inter-chain
interactions that render these materials insoluble in common solvents. The resulting
polymers are usually cross-linked, highly branched, or electrostatically cross-linked
due to polaron/bipolaron charge interactions. This chemical or ionic cross-linking is
the cause of the polymer’s intractability [35]. To curtail this intractable problem
which hinders processability, researchers have fashioned out some preparation
procedures for synthesis of conjugated polymers that are soluble in either or both
aqueous and organic solvents for a target use. Some of the approaches that have been
employed include:
Reduction of polymer to the non-conducting state so as to remove inter-chain
charge interactions. For example, PANi when in the deprotonated form,
emeraldine base (EB), it is readily soluble in some solvents such as N-
methylpyrrolidinone, dimethyl formamide and dimethyl sulfoxide [36].
Use of alkyl substituted monomer for the polymerisation of PANi, PPy and
PTh produces polymers which are rendered soluble in common organic
solvents (chloroform, toluene, etc.) through reduced interchain interactions
and favourable substituent–solvent interactions. Examples include the
synthesis of soluble and conducting poly (3-alkylthiophene) [37, 38] and the
introduction of N-substituent [39, 40] or alkoxy substituent [41, 42] on
Polyaniline. This approach however poses some steric hindrance on the
polymer with a resulting effect of lower conductivity.
Use of large protonic acid with counter ion that is soluble in organic solvents
such as camphor sulphonic or dodecyl benzene sulphonic acid during
synthesis of these polymers [43, 44]. The most successful approach for
increasing the solubility of conductive polymers in aqueous solution is ‘self-
29
doping’. This involves use of ionizable functional groups that form negatively
charged sites in solution which are invariably attached to the polymer chain to
make the polymer conducting. This approach avoids the use of many organic
solvents which have many environmental restrictions. This approach have
been found to produce conducting polymers which are environmental friendly,
good water solubility and good electroactivity and conductivity over a wider
pH range (in the case of polyaniline), and also good thermal stability.
According to http://www.wikipatents.com/5002700.html review, different
permanently doped PANi have been invented and patented using electrically
polymerized polyaniline in covalent combination with an organic dopant
having at least one sulphonic acid functional group (United States Patent
50002700) [45].
Other approaches of producing soluble polymers includes in-situ polymerisation with
a monomer/oxidant mixture involving a chemical oxidizing agent with a formal
potential which is slightly lower than the oxidation potential of the monomer. This
results in a metastable reaction mixture that polymerizes upon solvent evaporation
[46, 47]. Use of template guided enzymatic approach in strong acid polyelectrolyte
e.g. polystyrene sulfonate also provides a lower local pH environment for the
formation of soluble conducting polyaniline [48], polypyrrole [49] and polythiophene
[50]. Using horseradish peroxidase (HRP), Nabib and Entezami (2004) prepared
polypyrrole in the presence of sulphonated polystyrene, as a polyanionic template
[49]. The HRP is an effective catalyst for the oxidative polymerization of pyrrole in
the presence of hydrogen peroxide at room temperature. The reaction is sensitive to
solution pH and it is performed in pH 2 aqueous solutions. Polymerization of pyrrole
by this biological route produced a conducting water-soluble polypyrrole for the first
time. Alternatively, a colloidal dispersion of the polyelectrolyte, polymeric stabilisers
and anionic surfactants could be used [51, 52]. Simmons et al. reported for the first
time the synthesis of colloidal polypyrrole particles using reactive polymeric
stabilizers of poly (2-(dimethylamino)ethyl methacrylate-stat-3-vinylthiophenes) in
1995 [53]. Since then different efforts have been made in the utilisation of other
organic based stabilisers.
30

2.2 Strategies for production of ‘nanostructurised conducting
polymers/Polymer composites’
The drive for modern technologies and new materials in the past decade aroused
movement from the erstwhile conducting polymers to generation of nanostructurised
materials with enhanced conductivity for many areas of technology. It is therefore
important that special materials and technologies should be employed that will generate
the requisite metallization in the new material or target application. The attainment of
this objective demands that both bifunctional additives and reaction conditions that will
enhance the efficiency of oxidative polymerization should be employed. The cationic
radicals and other reactive species, after oxidation forms oligomers, which agglomerate
depending on the synthesis conditions to form nano, micro or macrostructures [8].
According to the 2005 Winner of the IUPAC Prize for young Chemists, Jiaxing Huang,
the nanofibres that form the basic unit for polyaniline is naturally formed at the early
stage of the polymerization reaction and are much smaller in diameter than most
templated or electrospun fibres [54]. The nanofibrilar morphology does not require any
template or surfactant, and appears to be intrinsic to polyaniline synthesized in water.
Two approaches; namely interfacial polymerization and rapidly-mixed reactions were
developed to prepare pure nanofibers. The trick was to suppress the secondary growth
that leads to agglomerated particles. Different dopant acid was used to tune the
diameters of the nanofibers between about 30 and 120 nm while changing the organic
solvent in interfacial polymerization reactions has little effect on the product [54].
There are three broad strategies for obtaining nanostructured-conducting polymers:
Template-free approach: The growth of nanostructured conducting
polymers could be ordered through template-less synthesis by choosing
optimum conditions of electrosynthesis at simple chemically inert
electrodes or chemically via optimized and well specified synthesis
conditions. It is well known that the nature of the anion present in the
electropolymerization solution determines the morphology and properties
of the generated conducting polymers. In their conducting form, these
polymers are usually proton and anion doped, whereas reversible
31

expulsion and bonding of anions occurs during reduction and oxidation
processes. It has been shown recently that the presence of suitable dopant
anions leads to the formation of well defined nanostructures of conducting
polymers. Tubules of polypyrrole with diameter range 0.8 – 2.0 µm and
length of 5 – 30 µm were synthesized by the electrochemical template-free
technique in the presence of β-naphthalene sulphonic acid (dopant) and
stainless steel electrode [55]. Shortly after this, polypyrrole nanotubules
with diameter ranging from 50 nm to 2 µm were synthesized
electrochemically in the presence of β-naphthalene sulphonic acid or p-
toluene sulphonic acid as dopant [19]. The micelles of dopant or dopant-
monomer clusters act like a template to orchestrate tubular growth of the
polypyrrole. Using this approach but varying the chemical synthesis
conditions, various nanostructures of modified polypyrrole doped with β-
naphthalene sulphonic acid with particle diameters of 20 – 3000 nm were
reported recently [56, 57].
Template assisted: This approach involves use of an electrically insulating
template possessing nanosized pores. Two common architectures are
employed, one is the track-etched polymer membranes and the other is the
alumina template which is used to house the nanosized structures of
conducting polymers [8, 22]. Track-etched template was used by Pra et al.
to prepare electrochemically assembled copper nanowires and polypyrrole
nanotubules [58]. Demoustier and Stavaux used nanoporous polycarbonate
track-etched membrane to prepare polypyrrole doped with poly (sodium 4-
styrenesulfonate) with thickness that is dependent on the pore sizes and
type of electrolyte used [8]. Duvail et al. reported the electrochemical
polymerization of poly (3, 4-ethylenedioxythiophene) within the pores of a
track-etched porous membranes [23]. Polymers generated using this
technique is associated with increased electric conductivity because the
polymerization is confined to the pore spaces and electrostatic interactions
between the ionic species allow alignment on the walls of the pores [8].
Alumina template is very popular in the synthesis of conducting polymers
and copolymers. Polypyrrole nanowires was electro synthesised by direct
oxidation of pyrrole in a medium of 75% isopropyl alcohol + 20% boron
trifluoride diethyl etherate + 5% poly (ethylene glycol) (by volume) using
32

porous alumina membranes as the templates. The as-prepared nanowires is
composed of smooth surface, uniform diameter, and highly ordered tip
array. The SEM and TEM images of the nanowires are shown in Fig. 2.1.
The conductivity of polypyrrole wires is better than that from flat films
and a single polypyrrole nanowire was measured to be 23.4 S cm−1 at room
temperature [59]. The field emission properties of the polypyrrole
nanowire arrays prove positive for its use as emission device nanotips.
Figure 2.1: SEM (a–c) images and TEM image (d) of PPy nanowires [59].
Molecular template assisted electrosynthesis. This approach is similar to
the template-free method described earlier. The major difference is that the
electrode is physically modified with specialized kind of adsorbate that
directs electropolymerisation to proceed in template-like manner.
Nanosized fibres of polypyrrole films have been grown galvanostatically
33
in acetonitrile solution at a gold electrode modified with thiolated β-
cyclodextrin self-assembled monolayer [60].
Other approaches that have been used to make nanostructured conducting polymer
composites are the chemical or electrochemical reaction of nanosized metal ions from
their salt solution at the polymer/solution interface [8]. The high metal surface area of
the generated polymer composite confers a higher degree of electrocatalysis on the
metal-conducting polymer nanocomposite. Different polyaniline fibre with gold
nanoparticles, have been demonstrated for use as memory devices for data storage
(e.g. flash memory) [54]. High catalytic nano-sized gold-polypyrrole complex was
electrochemically prepared from gold complexes of Au(ClO4)4- with less than 100 nm
particle sizes have been reported [21]. Use of nano-sized inorganic materials such
V2O5, TiO2, Fe2O3 have also been reported to produce metal-oxide based polymer
composites [8]. Clay-based nanocomposites have also been explored under this
category. Some organic materials such as Nafion membranes, DNA and porphyrin
derivatives have been used to produce nanocomposites of polypyrrole and
polythiophenes for different applications [8].
2.3 Polyaniline (PANi) blends/composites
The polyaniline’s is a very important class of ICP with varieties based on the type of
substituent on the aniline monomer. The synthesis of the conducting polymer “aniline
black” was first published in the 19th century as a product of the anodic oxidation of
aniline, but its electronic properties was not established for many years [61]. PANi is
novel due to its relative facile processability, electrical conductivity and
environmental stability [62, 17]. In acid solution, it is protonated to form an organic
metal, which is easily deprotonated in alkaline medium to form a semiconductor. It
generates a conductivity of about 105S/cm comparable to copper. These inherent
advantages make PANi to qualify as a synthetic metal. PANi exists in three well-
defined oxidation states: the electrically insulating leucomeraldine (LM), electrically
conducting emeraldine (EM) and the electrically insulating pernigraniline (PE) as
shown in Fig. 2.2.
34

Figure 2.2: Schematic diagram of PANi in different oxidation states namely, LM
(insulator) as (A), EM-base (insulator) as (B) and PE (insulating) as (C).
The LM and PE states are the fully reduced (i.e. all the nitrogen atoms are amine) and
the fully oxidized (all the nitrogen atoms are imines) forms respectively. In the EM
state, the ratio of amine to imine is 0.5. This explains the adopted general formula:
[(-B-NH-B-NH) y (-B-N=Q=N-) 1-y] x showing PANi as a continuum of oxidation states. ‘B’ and ‘Q’ denote benzene rings
in the benzoid and quinoid forms respectively. Letter 'y' is a measure of amine to
imine forms; when y = 1, it implies PANi in the Leucomeraldine form, y = 0.5 implies
PANi in the Emeraldine form and y = 0 implies PANi in the Pernigraniline form. The
imine’s sites of the half oxidized EM base form are easily protonated in strong acid
solutions to produce the conductive EM salt form of PANi [62].
Strafstrom et al. was reported to have proposed the polaronic lattice structure for the
EM salt showing the positive charges without any change in the number of pi-
electrons. The combination of charged sites and electro neutral radicals (i.e. solitons)
form polarons; at higher doping levels, two polarons could combine to form
bipolarons [63]. In the review work of Gospodinova and Terlemezyan, the mechanism
of the oxidative polymerization of PANi was reported and discussed [63]. The
35

chemistry of the dopant used and the polymerization mechanism determines the
properties, morphology, and molecular weight distribution of the PANi product.
In the last two decades, a lot of effort has been made on the search for improved and
processable PANi having good mechanical and solubility properties. This involves
preparation of conducting PANi blends and composites, which possess the
mechanical properties of an insulating host matrix and also the electrical properties of
the PANi Guest within the matrix. Polymeric composites of conducting polymers
offers the combination of the good processability of a polymer like poly-
(phenylenesulfide-phenylenediamine) PPDA with the conductivity and ease of
synthesis of another polymer like PANi [62].
Two general methods are being adopted, one was to introduce flexible substituent to
the benzene rings or nitrogen atoms of PANi [64]; the other is doping PANi with
functionalised organic acid such as camphor sulphonic acid (CSA), naphthalene
sulphonic acid (NSA) and dodecyl benzene sulphonic acid (DBSA) [24, 25, 26, 27].
These processes produce a soluble and more conductive product that could be blended
with PANi or used to form PANi composite with materials such as poly vinyl alcohol
(PVA) or polyurethane [28]. In the solid phase, the protonation of the imine sites of
PANi or its blend/composites is limited by the diffusion of the dopant (acid) [17].
This also depends on the dopant anion size and the polymer matrix morphology. The
more the degree of dispersion of dopants, the more the redistribution of polarons
along PANi macromolecular chains and the more conductive the PANi blend or
composite. Over the years, the following broad synthetic methods have been
employed in preparing PANi blends or composites:
Polymerization of aniline in dispersion systems involving the use of
dopants, surfactants and suitable oxidant [17, 25, 26, 27].
Chemical or electrolytic in situ polymerization of aniline in the presence of
a polymer matrix or by incorporation of polymer/metal nanocomposites
like H2PtCl6 at a liquid liquid interface [6, 7, 17, 34]. This method could׀
involve use of reverse micelles, during which polymerisable surfactants
were used or incorporation of metal nanoparticles that could enhance the
conductivity of polymers. The principle is based on the reduction of metal
ions (clusters) that are dispersed in polymer matrices, or the
36
polymerization of the monomer dispersed with the metal nanoparticles
followed by electrodeposition of the strongly embedded metal / polymer
composites by either pulse or potential cycle program [34].
Use of electrolytic method to polymerize aniline in suitable electrolyte at
an electrode (anode) [17, 61, 62, 65, 66]. The conductive form of
polyaniline was synthesized by the anodic and chemical oxidation of
aniline in malonic acid medium [66]. The conductivity of polyaniline
doped with malonic acid changed from 1.62×10⁻⁶ to 2.5×10⁻⁵Scm–1
depending on the way it was synthesized. The polymer growth rate was
observed to be very slow in malonic acid compared with H2SO4.
According to Li et al. [62], electropolymerised PANi has many advantages
over the chemically polymerized PANi. These includes better adhesion
and good mechanical strength; ease of control of film thickness based on
the applied potential and number of cycles to give a more stable electronic
property for a longer duration. Also the product is purer as there are no
residual oxidants or reduced specie adhering to the polymer matrix thus
providing a more ordered nanostructure.
Grafting of the polymer on a PANi surface or copolymerized with another
polymer surface [17, 67, 68]. This offers production of polymeric systems
that are copolymers, composites, bilayers or blends with improved
properties of the corresponding homopolymer. Free standing-grafted
polymer films of PPy and PANi prepared electrolytically showed varying
amounts of polyaniline and polypyrrole depending on the electrolysis time.
The Raman spectra of the films taken from the electrode side were similar
to those of pure polyaniline, whereas the spectra of the solution side were
identical to those of pure polypyrrole [67].
2.4 Polypyrrole blends/composites
Polypyrrole (PPy), known as “polypyrrole black” since early 20th century, is one of
the most studied COPs. PPy is an extensively studied CP with its monomer pyrrole
being easily oxidisable, water soluble, commercially available and the PPy and its
derivatives possess good environmental stability, good redox properties, high
37

electrical conductivity and simplicity of synthetic procedures. The main hindrance of
its processability is in its insolubility in any organic solvents. PPy is usually a black
powder and could be prepared by chemical or electrochemical synthesis. Various
approaches have been used for the chemical synthesis of polypyrrole nanofibres and
nanaotubes such as soft (organic) and hard (inorganic) template approach and of
recent nanofibre seeding, in which narrow pore nanotubes with an average inner
diameter of 6 nm and an outer diameter of 60 – 80 nm respectively are formed [69,
70]. The new approach involved the use of reactive seed templates that chemically
react with the monomer prior to the addition of oxidant. This pre-polymerization
reaction on the surface of fibrilar seed templates helps direct the evolution of bulk
fibrilar morphology when oxidant is subsequently added.
The mechanism of polymerization for both chemical and electrochemical methods
follows an initial generation of radical cation while subsequent steps depend on the
type of polymerization being adopted. In the chemical case, the radical cation attacks
another monomer to form a dimer radical cation, while in the electrochemical synthesis
a neutral dimer is formed by the dication of the large concentration of radical cations in
the vicinity of the electrodes. The general scheme for the formation of the dimers and
subsequent chain growth for both methods is shown in Fig. 2.3. The number of
electrons involved in the polymerization process for each monomer is approximately
2.25, one for each of the two α positions to form the polymer and another one for every
four monomer units to form the doped polymer. Similarly, one anion per four monomer
units is incorporated during doping to maintain charge neutrality [71]. The chemical
synthesis is used when large quantities of material are required but electrochemical
synthesis is preferred for research purposes due to the simplicity of the technique,
control over material thickness, geometry and location, the facility for doping during
synthesis, the wide choice of available dopant ions and the generation of good quality.
The electro-deposition of polypyrrole on the positively polarized working electrode
proceeds via a condensation reaction between the pyrrole-monomer units, and the
concomitant balance of charge (electroneutrality) along the polypyrrole backbone by
the anions present in solution [32].
38

Figure 2.3: Generalized scheme for the polymerization of polypyrrole from
monomer (a) and dimer (b) [71].
Figure 2.4 shows the scheme for the electropolymerisation of polypyrrole which is
typical for other aromatic five-membered heterocycles with NH, S and O as the
heteroatom. Monomer units are adsorbed onto the surface of the working electrode
resulting in one-electron oxidation to form a pyrrole radical cation. These radical
cations then couple with themselves, or with other cations or with neutral monomers
from solution. In each case, this leads to the formation of a dimer dication, which
undergoes a double deprotonation to give a neutral molecule. These more stable dimer
radicals have a lower oxidation potential compared with the monomer units and chain
growth then occurs by preferential coupling between the dimers and monomers [32,
71]. Anions called ‘dopants’ are incorporated into the film to maintain electrical
neutrality as polymerisation progresses.
39

Figure 2.4: Scheme for the electropolymerisation of polypyrrole [32].
In the undoped state (pristine), neutral PPy is generally non-conducting having the
aromatic and quinoid structures of which the latter possesses a higher energy
configuration. In the presence of a Lewis acid, the doped form (oxidized) is formed
which manifest as either a polaron and/or bipolaron depending on the doping level as
follows:
PPy + X-(s) → PPy+X- + e- polaron
PPy+ + 2X(s) → PPy2+(X-)2 + e- bipolaron
40

where X- are anions, (the subscript (s) indicates that they are in solution phase), and PPy
represents a segment of the polypyrrole chain.
The various structures of PPy are shown in Fig. 2.5. The chemical oxidations of
pyrrole monomer using aqueous or anhydrous iron III chloride (FeCl3), other salts of
iron (III) and copper (II) and other Lewis acids and halogens have been reviewed
[71]. The yield from the reactions is dependent on the choice of solvents and oxidants,
initial monomer/oxidant ratio, duration and temperature of the reaction.
Figure 2.5: Scheme for the structures of polypyrrole showing the non-
degenerate: aromatic (a) and quinoid (b) configurations; and degenerate
(oxidised forms): a polaron defect (c), and a bipolaron defect (d) configurations.
A yield of almost 100% is obtained with Fe (III)/monomer ratio of 2.4 [71]. The use
of different concentrations of dopant materials has also been employed to modulate
the yield and morphology of polypyrrole in aqueous medium [56]. Details of the
various micro/nanotubes reported in [56] using different dopant/monomer (d/m) ratios
and temperature settings are discussed further in Chapter four.
FeCl3 have been used to chemically synthesis PPy in various solvents (water,
alcohols, benzene, tetrahydrofuran, chloroform, acetone, acetonitrile and dimethyl-
41
formamide) [72]. The highest conductivity was obtained from PPy prepared in
methanol solution [71]. Rapi et al. [72] reported improved chemical yield using
shorter times of polymerization and lower temperatures (0 – 5 ºC). Improved film or
coatings of PPy was prepared through the use of gaseous pyrrole on FeCl3. Persulfates
(Na2S2O8,), (NH4)2S2O8) and H2O2 have also been applied as oxidant in the synthesis
of PPy [71 - 73]. The use of peroxide as oxidant can be via a hydrogen peroxide based
chemical or biological material. Recently, self-assembled conducting PPy
micro/nanotubes and films using β-naphthalene sulphonic acid were chemically and
electrochemically prepared [19, 55]. Micellic clusters of the dopant of NSA and its
complex with the pyrrole served as template for this tubular growth.
Composites of PPy with different organic and inorganic compounds having improved
mechanical performance have also been reported. Omastova et al. prepared net-work
like PPy composites with poly (methyl methacrylate (PMMA/PPy) [74] while Cairns
et al. studied the structure of PPy composite with polystyrene and reported that
pyrrole was present as discrete 20 – 30 nm nanoparticles adsorbed into the PST matrix
[75]. Lu et al. [76] chemically synthesized and characterized nanometer sized PPy
composites using styrene and butyl acrylate. Also, polypyrrole/poly (methyl
methacrylate) coaxial nanocable was prepared through the sequential polymerization
of methyl methacrylate and pyrrole monomers inside the channels of mesoporous
silica template, followed by the removal of the silica template [77]. Similarly,
thermoplastic polyurethane (TPU- PPy) composites on electrode [78] and PPy- poly
(vinyl alcohol or chloride) blends [79] have been reported.
Although PPy can be chemically synthesized especially for large-scale preparation,
electropolymerisation is easily achieved and is the most common preparative method
because of the ease of oxidizing the polypyrrole compared to the pyrrole monomer.
Electropolymerisation could be achieved with different electrodes such as platinum,
carbon and metal oxides. The earliest electropolymerised film was prepared on
platinum electrode by the oxidation of the monomer in sulphuric acid solutions. The
polymer obtained was found to be brittle, conductivity of 8 Scm-1 and one positive
charge per three pyrrole monomer units. Subsequently, improved electrochemically
synthesized PPy have been prepared by variations in conditions of preparation
42

(solvent, temperature, anions, current/potential) used and on the composition of the
solution used during electrochemical investigations [80-87].
Tamm et al. [80, 81] and Yuan et al. [86] had respectively reported an elaborate in-
situ electrochemical study on the redox properties of polypyrrole in aqueous solutions
using different anions and polymerization conditions to show the concepts of
electroneutrality coupling and electron hopping which are useful for the
fuctionalization of the polymer and its electron transportation ability. They found out
that the polymer differs with respect to the extent of oxidation, doping anions, and
also reduction, doping cations. Even though polymerization efficiency improves as
the positive potential limit becomes more positive, however, polypyrrole films
becomes over-oxidized at potentials in excess of 700 mV versus Ag/AgCl [86]. The
overoxidation, which is entirely irreversible, results in the dedoping of conducting
polypyrrole and the formation of carboxyl group. Overoxidation of PPy, leads to loss
of conductivity and de-doping.
Study on the potentials at which the overoxidation of polypyrrole occurs have shown
a strong dependence on the pH values of the aqueous solutions [87]. At higher pH
values, the occurrence of the overoxidation was easier, thus occurring at lower
overoxidation potential. This is coincident with the electrolysis reaction of water to
give out oxygen. It was supposed that the oxygen produced in the electrolysis of water
results in the overoxidation of the conducting polypyrrole films.
The polypyrrole redox scheme (Figure 2.6) is accompanied with three processes,
namely, mass and resistance changes as well as electron transitions unlike other
systems in electrochemistry in which only electrons are involved during the reduction
and oxidation processes [88, 89]. Using cyclic voltammetry, oxidation of pyrrole
yields a positive charged polymer film on an electrode surface, which is balanced by
anions incorporated during synthesis. During the following reduction scan,
electroneutrality can be maintained either by expulsion of these anions or by
incorporation of cations. When a sufficient negative potential is applied to the
polymer, the anions are expelled (undoping), thus reducing it to the neutral state.
43

NH n
+
A-
NH n
0
+ A-+e-
-e-
Figure 2.6: The polypyrrole oxidation and reduction scheme
Conversely, when a positive potential is applied to oxidize the neutral film (doping),
the anions are taken up. Therefore, the reduction/oxidation of PPy films involves the
transport of ions in and out of the polymer in order to compensate the cationic nature
of oxidized polymer. The dopant anions (small size) in the PPy film can be exchanged
relatively easily with electrolyte anions in aqueous solutions during potential
sweeping. The anion exchange processes offer an alternative chemical route for the
preparation of some conductive and anion specific PPy complexes. However, the
anion exchange processes do not result in any significant alteration of the basic
structure of the polymer.
In the investigation of the effect of solution temperature on electroactivity of
polypyrrole using cyclic voltammetry technique by Khalkhali & Wallace, thermal
treatment at elevated temperatures in solutions was found to affect the electroactivity
of PPy, and the changes are mostly irreversible [89]. The temperature, time of
exposure, the switching potential and the nature of electrolyte in which the polymer is
switched all have important effects in determining thermal stability of the polymers in
solutions. The nature of the effect was greatly dependent on the nature of the counter-
ion incorporated during synthesis. Large surfactants and immobilized polymeric
dopants such as polyelectrolytes counterions were not released during reduction
process and become trapped within the polymer matrix due to their large size and
entanglement with the PPy chain; this consequently increased their solution stability
at elevated temperatures. Smaller inorganic ions dopants such as chlorides gave a less
stable polymer. The loss of electroactivity of PPy films when exposed to elevated
solution temperatures in aqueous media was attributed to the loss of conjugation in
polymer due to the nucleophilic attack by water or dissolved oxygen, which occurs
more rapidly at higher temperatures [89].
44
2.5 Polythiophene blends and composites
The property of PTh shows much resemblance to those of PPy. The monomer,
thiophene is quite cheaper than pyrrole and its redox potential is quite higher. It shows
remarkable stability in both air and water. PTh usually appears as a stable infusible
black powder, which is insoluble in common solvents. The chemistry of PTh is based
on its conjugated π electrons. Its conductivities in the neutral (undoped) form could be
as low as 10-11 Scm-1 while in the oxidized (p-doped form) it could be as high as 102
Scm-1, although on exposure to air this value decreases [90]. The
electropolymerisation of most conductive polythiophenes is done in non-aqueous
solvents [30]. Unsubstituted thiophene is insoluble in water and can thus not be
polymerized in aqueous medium. This is due to the electro-oxidation potential of
thiophene, which is higher than the decomposition potential of water coupled with the
fact that the reaction between thiophene cation with water prevents cationic
polymerization and this becomes a competing reaction [30]. The electrosynthesis of
PTh could be done galvanostatically, potentiostatically or by sweeping potential
voltammetry [29, 30, 33]. P-doped PTh has a characteristic blue colour, highly air
sensitive and its conductivity decreases on exposure to the atmosphere. N-doping is
less studied but cathodically doped PTh have been reported with lower conductivity
as compared to the p-doped polythiophene [91]. The processes of p- and n- doping in
PTh compounds and their effect on conductivity have been described by the
‘generalized transmission line circuit’ model using electrochemical impedance
spectroscopy [91, 92].
The mechanism of polymerization of PTh and many substituted PTh’s is similar to
those of PPy discussed earlier occurring via a radical – monomer coupling or radical –
radical coupling intermediate to form the polymer [90]. In the process, radical cations
(polarons), or dications (bipolarons) are formed. Substituted thiophene polymerizes at
1.7 V vs. SCE. This value is lower than the oxidation potential of the corresponding
polymer and thus over-oxidation readily sets in which causes degradation of the
polymeric film. The problem of over-oxidation is usually minimized in different ways
[30]. This could be done by the addition of bithiophene to the thiophene solutions or
converting the thiophene to its oligomers before electrolysis. The resulting extension
of the conjugation length and lowering of the oxidation potential produces a polymer
45

with high conductivity and good electrochemical and thermal stability. Cho et al. have
reported that substitution of the hydrogen on the monomer with electron donating
groups do significantly reduce the potential at which oxidation occurs [33]. The
longer the length of this substituent, the lower is the oxidation potential of the
monomer. Various substituents such as long alky chain, sulfonate groups, carboxylic
acids, amino acids and urethanes have been used to improve the polymers solubility
[29]. The sulfonate substituent group (-SO3H) acts as a counter ion and produces self
doped conducting polymer.
Ballav and Biswas reported a simple procedure for the preparation of PTh in high
yield using FeCl3 as the oxidant and using the same method they were able to prepare
PTh-Al2O3 nanocomposites [93]. Cyclic voltammetric experiments have shown that
the electrode reactions taking place depends on the conditions used, the type and
length of electron donating substituent and type of solvent used [90, 94]. Slowly
polymerized PTh has more conductive states and relatively higher molecular weight
than those from faster chemical reactions [95]. The positive mechanical properties
exhibited by PTh over PPy coupled with its larger positive working window makes
copolymers of PPy and PTh as potential better positive electrodes in lithium batteries.
Yigit et al. [96] electrochemically prepared composites of PTh with natural and
synthetic rubber as the insulating polymer host. Various regio-regular PTh’s with
pendant carboxylic acid functionality have been prepared as water soluble conducting
polymer which produced distinct color changes when applied on divalent cations and
some acting as solid state chemo sensors for acid vapors [97]. It appears that PTh
films give more electro catalytic response even though the preparation procedure
appears more cumbersome and must be done in totally anhydrous solvent to get good
reproducibility. However, a wider application of PANi and PPy is practiced.
2.6 General properties and factors affecting processability of nanostructured
polyaniline, polypyrroles and polythiophenes.
The properties and stability of nanomaterials determines the final application to which
the conducting polymer is put. Some of the intrinsic properties that characterize NCPs
46

do originate from the preparation procedure. Understanding of the chemistry,
electrochemistry, structure, electrical and optical phenomena, processing and
applications of NCPs has been employed in improving the processability limitations
of PANi, PPy and PTh. The effect of temperature and ageing process, nature of
solvent, pH and redox potential of the polymerization liquor, and the nature of
dopants on their preparation and stability are discussed below.
2.6.1 Temperature and ageing process
Zhang et al. [27] reported the temperature dependence of conductivity for PANi
doped with various types of NSA showing decrease in conductivity with decrease in
temperature, thus exhibiting semiconductor behavior. Kassim et al. [98] studied the
effect of preparation temperature on conductivity of PPy films prepared by
electrochemical synthesis in aqueous medium using camphor sulphonates as the
dopant and temperature range of 1 – 60ºC. It was discovered that the film’s
conductivity decreases with increase in temperature, the optimum conductivity was
obtained between 10 - 30ºC. They established that PPy formed at low temperature is
stronger and more conductive than those formed at higher temperatures. SEM analysis
for the PPy films prepared at lower temperature attested to its smoother, more
coherent, and stronger mechanical strength when compared with that prepared at
higher temperatures. The X- ray analysis also showed that the PPy film obtained by
low temperature preparation is more compact with higher conductivity. Many
researchers have established that the polymerization of thiophene and its derivatives is
temperature dependent. The highest quality material was obtainable at 5ºC, with rate
increasing up to 16ºC after which there is decrease [90].
2.6.2 Nature of solvent
Many researchers have shown that the electrochemical behavior of a polymer is
determined by the nature of the electrolyte used for polymerization [99-103].
Monomers with lower oxidation potentials (aniline and pyrrole) can be polymerized
in aqueous electrolytes. For monomers with higher oxidation potentials such as
thiophene, aprotic solvents like acetonitrile, propylene carbonate, dichloromethane
etc. must be used. This is why the aqueous synthesis of polythiophene is highly
47
problematic. The use of acidic solvents for polymerization of PTh have been reported
to substantially lower the oxidation potential of the monomer from about 1.6 V to 0.9
V vs. SCE [99]. The solvent composition used in the preparation of a conducting
polymer alongside the film thickness and morphology have been reported to
determine the biosensing efficiency [100].
2.6.3 pH and redox potential of the environment
The electronic conductivity of conducting polymers changes over several orders of
magnitude in response to changes in pH and redox potential of their environment
[104]. Unlike aniline and pyrrole, which could be electropolymerised at low potential,
thiophene requires much higher oxidation potential [90, 94]. The effect of pH,
oxidation potential and nature of electrolyte on conductivity of PPy films synthesized
therein have been extensively studied and reviewed [104]. In alkaline media, thin
insulating films are formed [105], while optimum conductivity was obtained around
the synthesis potential of 0.6V (vs. saturated calomel electrode) in aqueous solutions
[106]. The absence of a protonic dopant ion during electropolymerisation reaction of
conducting polymers do limit the rate determining step of proton abstraction from the
monomer molecule (H-M-H), and thus terminating the polymerization at the dimer or
trimer stage. A reasonable level of doping is thus critical for the formation of higher
oligomers. Lower oligomers are soluble in nucleophilic environment just as the
monomer, but with increasing polymerization an insoluble film is formed at the
electrode. This trend increases from aniline to pyrrole and to thiophene [107, 108].
2.6.4 Nature of dopants
The solubility and conductivity of the polymer could be tuned by the nature and
concentration of the dopant. Use of specialized dopants during polymerization plays a
major role in tuning electronic properties in conducting polymers. It helps to create a
more stable polymer whose work function (work of extraction of an electron from an
uncharged metal) and resistivity can be electrochemically adjusted [15, 107]. While a
particular dopant may produce nanostructurised polymer from a particular monomer,
it may form completely different morphology when another monomer is used.
Nanofibres of PANi which could readily be produced using the surfactant-mediated
48
synthesis with naphthalene sulphonic acid become greatly problematic with PPy.
Rather than nanofibres, different fibrilar and tubular morphology with diameters of 50
– 2000 nm range are formed [19, 55]. However, with different naphthalene sulphonic
acid derivatives and depending on the dopant structure and concentration, nanotubes
of PPy with average diameter of 130 to 250nm could be produced [27, 73]. Similarly,
the polymeric yield of conducting polymers is greatly influenced by the relative
concentration of the dopant used [15, 56, 57, 95].
2.6.5 Other factors
Amongst other factors that could affect the stability of conducting polymers is the
nature of the working electrode. This determines its relative catalytic property and
lifespan before fouling sets in. Del-Valle et al. have reported on the comparative
performance of modified electrodes using PANi, PPy, and PTh in dispersion system
of Pt or Pt – Pb respectively to monitor the catalytic oxidation of formic acid [109].
The modified system of PTh had the longest electro catalytic activity while systems
with PANi and PPy were fouled within a shorter time. This informed their
recommendation of the use of PTh as a better electro catalyst in fuel cells and sensors.
2.7 Characterization of nanostructured PANi, PPy’s and PTh’s
The use of physical and chemical methods for the characterization of NCPs is critical
for the confirmation of the electronic species involved vis-à-vis the understanding of
the electrochemical processes taking place and for fashioning procedures for
development of appropriate application for the polymer. The major characterization
techniques often employed are morphology, electrochemical and spectroscopic
examination of the nanotube or polymer film produced depending on the potential
application that is of interest.
2.7.1 Morphology characterization
Scanning electron microscopy (SEM), transmission electron microscopy (TEM),
atomic force microscopy (AFM) and X-ray diffraction measurement (XRD) have
been severally used to characterize polymers of intrinsically conducting polymers and
49

their composites [25, 26, 27, 73, 51, 93, 98] The polymer could have different
morphology ranging from grain-like, sponge-like, fibrous, porous-structured to
tubular (hollow or closed) morphology. SEM and TEM studies of PTP-Al2O3
composite particles showed globular morphology with uniform particle size for
polymers prepared in CHCl3 while those prepared in the absence of any solvent
showed relatively irregular particle formation. The morphology studies of screen-
printed carbon electrode (SPCE) modified with PANi showed sponge-like high
surface area suitable for enzyme immobilization, which changed to a speckled, grainy
image after immobilization. Changing the chemical structure of the dopant and
synthesis conditions leads to formation of different morphologies for PANi/NSA
nanotubes [25, 27]. This varies from hollow to solid micro/nanotubes and fibres
depending on the type of NSA used and oxidant concentrations [56, 57].
Also, Zhang and Manohar reported the synthesis of narrow pore-diameter PPy
nanotubes by the chemical oxidation of pyrrole with FeCl3 as oxidant, and V2O5 as the
sacrificial seed template to orchestrate fibrilar polymer growth [69]. This seed
template has the catalytic ability of oxidizing the monomer prior to the oxidation with
the oxidant. The same authors also reported fibrilar and tubular morphology when
large organic dopant anions such as naphthalene sulphonic acid are used to during the
synthesis. Very thin nanofibres were obtained when the reaction is carried out in
ethanol using FeCl3 as the oxidant and V2O5 as seed template [70]. The SEM of the
as-synthesized polymer nanotube showed that fiber diameter can be controlled by
stirring the seed template in ethanol for a limited time before initiation of the
oxidation of the monomer. Figure 2.7 (A) shows SEM for polypyrrole-Cl nanofibers
of 30 nm diameters obtained by stirring the seed template foe 30 min, (B) is the
nanofiber of 100 nm diameters obtained upon extended stirring in ethanol for 12 h.
There is the need to activate the seed template to ensure fibrillar polymer growth in
polypyrrole whereas some polyaniline nanofibres are readily produced in the
unseeded polyaniline system which was interpreted as a peculiar feature intrinsic to
polyaniline. The similarity or contrast in morphology could further be investigated
using the XRD measurements. PANi indicated four sharp characteristic peaks at 2θ =
4.6º, 9.2º, 13.8º and 23.0º for the crystalline tubes while amorphous PANi had only
two characteristic broad peaks at 2θ = 20º and 26º.
50

Figure 2.7: SEM micrographs of as-synthesized PPy-chloride nanotubes from
ethanol with V2O5 as sacrificial template, where A is morphology obtained after
30 min while B is the morphology after 12 hr of stirring [70].
While PPy/NSA tubes were amorphous, the polypyrrole doped with p- toluene
sulfonate acid (PPy/TsOH) was partially crystalline [19, 55]. XRD is also employed
to discriminate the compactness of a polymer film synthesized at different
temperatures. The peak values for polypyrrole doped with p- toluene sulfonate acid
(PPy/CSA) film were greater at lower temperatures than at higher temperatures [98].
2.7.2 Electrochemical characterization
Various voltammetric techniques are being used to study the redox activity and
electrochemistry of conducting polymers of PPy and PTh tubes and films. While
cyclic voltammetry (CV) is the most versatile for characterization of electrochemical
systems, other techniques such as Oster-Young square wave and differential pulse
voltammetric techniques (OSWV and DPV) have been severally used for both
qualitative and quantitative analyses [68, 91, 92].
51

Polypyrrole prepared from aqueous medium has poor/ill formed oxidation and
reduction peaks. However when it is modified with suitable dopants, the
electroactivity is enhanced. Similarly, electrochemical impedance spectroscopy (EIS)
offers a platform for a deeper intuitive study of interfacial properties of conducting
polymers at electrode surfaces. The changes in the electrochemical parameters during
the course of switching through the oxidation and reduction waves is dependent on
the properties of the polymer, the electrolyte and the external force applied through
the electrode surface.
2.7.3 Spectroscopic characterization
UV-Vis, FTIR and 1H NMR spectroscopic techniques are widely used for the
characterization of NCPs. The UV-Vis absorption spectra are often used to diagnose
the presence of charge carriers within the polymer structure or the existence of
various oxidation state(s) of the NCPs. While the emeraldine salt form of PANi is
characterized with two absorption bands at about 346 nm and 636 nm for the π- π*
excitation band and the polaron bands respectively, the higher doped PANi may have
multiple polarons and bipolarons depending on the synthesis condition, type of dopant
used and the level of doping [25, 26, 34]. The same trend applies to PPy and PTh in
the doped state, however the relative position and intensity of the polaron and bi-
polaron bands changes depending on the synthesis conditions [19, 55].
In the study of Massari et al., the unique light absorbing behavior of PANi at various
redox states under a modulated electrochemical oxidation was explored for illustrating
the interplay of the index of refraction and absorptivity of the material [110]. In
investigating the electrochemistry of polyaniline or polypyrrole synthesized via
surfactant dopant, FTIR spectroscopy is a viable tool to monitor the presence or
absence of surfactants as well as the level of over-oxidation attained at different
electronic states [15, 17]. In-situ study using substractively normalised in-situ Fourier
transform infra-red spectroscopy (SNIFTIR) on the structural changes during
oxidation and reduction of the polymer at different stepping potential will manifest
slight shifts in the vibrational peak positions depending on the extent of doping. The
reproducibility of the peak positions during repeated oxidation and reduction is an
attestation of a polymer’s high electroacitivity and suitability for use in batteries and
actuator applications. The sulphonated polypyrrole spectral region between 1000 and
52

1700 cm-1 contains information on the relative populations of charge defects as a
function of potential, and the results confirm that electronic charge transport at
moderate potentials is due to formation of radical cations, which oxidize further or
recombine to form dications at higher potentials. At more positive potentials the
polymer degrades with formation of carbonyl, hydroxyl groups and also CO2 [15, 17].
The electrochemical overoxidation of conducting polypyrrole nitrate film in aqueous
solutions was studied by a combination of cyclic voltammetry, in-situ spectro-
electrochemical measurement and FTIR spectroscopy [87]. The overoxidation, which
is entirely irreversible, results in the dedoping of conducting polypyrrole and the
formation of carboxyl group. The combination of spectroscopic techniques with
electrochemical and morphological methods is indeed a vital force for characterizing
and probing of structural and kinetic reactivities of nanostructured conducting
polymer systems and significant breakthrough is expected from this within the next
decade.
2.8 Application of NCPs in sensors
The application of NCPs is being greatly exploited in bioelectrochemistry,
bioelectronics and voltammetric chemical sensing. The applications of ‘NCP’ could
be generalized under two major groups; namely those derived from its conductivity
and those derived from its electro activity. There are many publications on the
prospect and usage of ‘NCPs’ based on its conductivity in electrostatic materials,
conducting adhesives, electromagnetic shielding devices, artificial nerves, antistatic
clothing, piezoceramics, diodes, transistors and aircraft structures [17, 61]. Salient
features of conducting polymers and their wide biosensor application in health care,
food industries, environmental monitoring was reviewed by Gerard at al. [111]. The
electroactivity properties equally find applications in molecular electronics,
interdigitated microelectrodes (IME), chemically sensitive field effect transistors
(chemFET), electrical displays, biosensor and chemical sensors, thermal sensors,
rechargeable batteries and solid electrolytes, ion exchange and drug release systems,
optical computers and electromechanical actuators or switches [17, 61, 62, 110, 111,
112].
53

Conducting polymers such as polypyrrole (PPy) is unique in its ability to be used in
tailoring specific bulk and surface properties of materials to provide novel solutions
for tissue engineered systems. This includes controlled cell assembly (micro and
nano-patterned surfaces), drug release (degradable polymers), tissue release (thermo-
responsive polymers) and integrated biosensing (electroactive polymers). In addition,
such materials provide a platform for the study of the fundamental science relating to
tissue-material surface interactions. It is in recognition of these special requirements
that researchers have engaged the use of polypyrrole in particular, for trial use in
biological applications [32]. The electric conductivity of NCPs is sensitive to changes
in chemical environment; this provides possibility of developing various sensors. For
example, spectroelectrochemical studies have shown that the change in absorptivity
with effective index of refraction of PANi could be employed to develop diffraction
based chemical sensor [110]. PPy has been used as sensor material for certain
components in gas mixtures, for both inorganic (NO2, CO2, CO, NH3, H2S) and
organic (acetone, methanol, ethanol) compounds [71, 111].
The widespread interest of electrochemists in these polymers has been spurred by
their applicability in the area of chemically modified electrodes. Coating the
electrodes with electroactive polymers helps in the development of new materials
with very active catalytic properties. In most electrocatalytic systems, the polymer
itself is inert and serves only as a support for the electrocatalytic metal sites. The
electrocatalyst site functions as a mediator, facilitating the transfer of electrons
between the electrode and the substrate.
Electrocatalysis in general is of great economic importance and the aim of these
modified electrodes is to drive electrochemical reactions selectively and/or at modest
potentials, and with better control than could be possible by the direct interaction
between the substrate and the electrode. Fig. 2.8 shows the scheme for a conducting
polypyrrole based sensor in an electrolyte medium of dilute hydrochloric acid
undergoing oxidation and reduction processes.
54

Figure 2.8: Schematic representation of electrochemical oxidation and reduction
of a polypyrrole film.
Catalysis of electrochemical reactions are determined by the availability of reactive
sites at the working electrodes coupled with other hydrodynamic conditions that
promotes attainment of balance between adsorption of reactants and desorption of
products from the electrodes. The electrostatic binding of electroactive ions into
ionomeric polymer films generates nanoscopic electrocatalytic layers. This has a
concomitant effect of shifting the electrode kinetics to a region of lower formal
potential at the operating potential window. Through such shifts in the formal
potential, problems of electroactive interferences are reduced. Many metals such as
tin, bismuth, tungsten, palladium, lead, antimony, selenium and carbonaceous inert
material have been used to modify electrodes for increased reactivity [108].
Optimum preparation conditions for modified electrodes of PANi, PPy and PTh on Pt
have been reported [109]. The immobilization of catalytically active compounds on
55
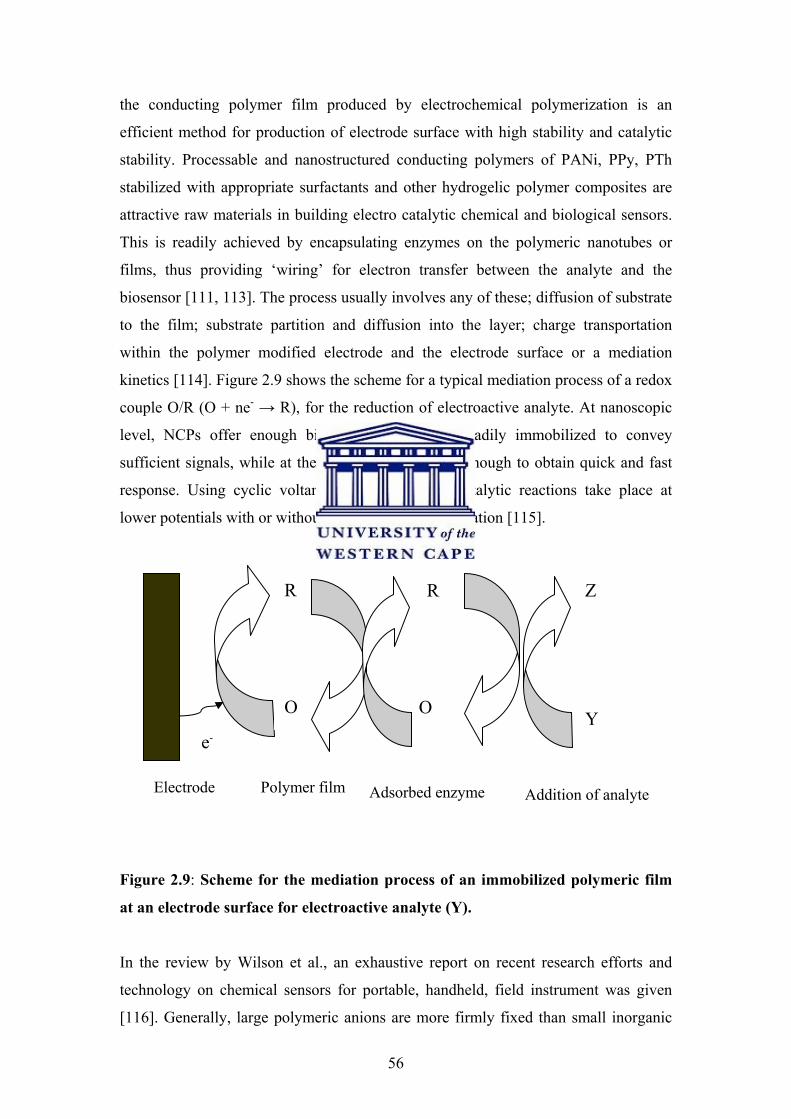
the conducting polymer film produced by electrochemical polymerization is an
efficient method for production of electrode surface with high stability and catalytic
stability. Processable and nanostructured conducting polymers of PANi, PPy, PTh
stabilized with appropriate surfactants and other hydrogelic polymer composites are
attractive raw materials in building electro catalytic chemical and biological sensors.
This is readily achieved by encapsulating enzymes on the polymeric nanotubes or
films, thus providing ‘wiring’ for electron transfer between the analyte and the
biosensor [111, 113]. The process usually involves any of these; diffusion of substrate
to the film; substrate partition and diffusion into the layer; charge transportation
within the polymer modified electrode and the electrode surface or a mediation
kinetics [114]. Figure 2.9 shows the scheme for a typical mediation process of a redox
couple O/R (O + ne- → R), for the reduction of electroactive analyte. At nanoscopic
level, NCPs offer enough binding sites that are readily immobilized to convey
sufficient signals, while at the same time being thin enough to obtain quick and fast
response. Using cyclic voltammetry such electro catalytic reactions take place at
lower potentials with or without peak currents amplification [115].
e-
Polymer film
R
O O
R Z
Y
Addition of analyte Adsorbed enzyme
Electrode
Figure 2.9: Scheme for the mediation process of an immobilized polymeric film
at an electrode surface for electroactive analyte (Y).
In the review by Wilson et al., an exhaustive report on recent research efforts and
technology on chemical sensors for portable, handheld, field instrument was given
[116]. Generally, large polymeric anions are more firmly fixed than small inorganic
56
anions on the film and consequently increase the rate of electro deposition at the
electrode. X-ray microanalysis has shown that porphyrin doped PPy films were firmly
fixed and were not expelled even during extensive potential cycling [117].
Electrodes formed from PTh polymeric matrix do show higher current densities and
are more stable towards successive potentiodynamic cycles in formic acid oxidation
than their PANi and PPy counterparts [108, 111]. This has been traced to the greater
affinity for electrons by the sulphur atoms of the thiophene rings [118]. The catalytic
effects of the conducting poly (3-methylthiophene)-film electrode on the redox
behaviour of catecol compounds have been reported. It was established that the redox
electron transfer step is taking place at the polymer/solution interface involving the
heteroatom of the thiophene ring at the interface [118].
Applications of NCPs as suitable matrix for the entrapment of biological components
such as enzymes for use as a medium for rapid electron transfer at electrode surfaces
have attracted much interest in electrocatalysis. The advantages derived through this
are enhanced speed, sensitivity and versatility of biosensors in diagnostics to measure
vital analytes. The review of Aduloju and Wallace gave a concise report of earlier
work on this [119].
Mathebe et al. [120] have been reported the fabrication and characterization of PANi-
based amperometric biosensor incorporating Horseradish peroxidase (HRP) for the
detection of hydrogen peroxide (H2O2) in aqueous medium. The catalytic cathodic
reduction of H2O2 was studied amperometrically and also by cyclic voltammetry, both
cases showed a positive correlation between the peak currents and increasing
concentration of H2O2. The sensitivity of the catalytic sensor was found to be
dependent on the concentration of the immobilized enzyme. A range of 0.6 and 0.7 g/l
was recommended as optimum enzyme concentration. Higher concentrations generate
a lower response due to a sterically hindered surface for electron transfer while at
lower concentration a lower sensor response is obtained. Similar improved electro
catalytic response was obtained when functionalized poly (pyrrole/cyclo dextrin)
electrode was used to investigate the detection of some neuro transmitters [121].
57
Catalytic accumulations of analytical signals (by over five orders of magnitude) based
on gold nanoparticle substrates have been used to generate high sensitivity and high
selectivity in nucleic acid determinations [122]. High sensitivity polythiophene based
transducer for the fluorimetric determination of nucleic acid hybridization based on
the electrostatic bonding between positively charged polythiophene and a single
stranded oligonucleotide probe have been reported [123]. The principle involved is
based on monitoring changes in electrical/optical properties of PTh when associated
with the single- or double- stranded nucleic acids.
Recently, Yokoyama et al. [124] reported a digital simulation of the cyclic
voltammetry of reversible electrochemical reactions coupled with enzyme-mediated
reactions. The model is applicable to any substrate and mediator system and the
voltammogram changes with changes in the concentration of the enzyme or the
mediator. As the substrate concentration is depleted in the vicinity of the electrode,
the catalytic current is reduced. Similarly, Temsamani et al. [125] reported the use of
conducting polymer film of polypyrrole doped with sulphonated-β- cyclodextrin
(PPy-SβCD) for the solid phase micro extraction of cationic analytes. In another
application, β-cyclodextrin doped polypyrrole was employed to fabricate an
electrochemical sensor for the selective, simultaneous and quantitative detection of
some polyhydroxyl phenyls and neurotransmitters derived from pyrogallol and
catechol [126].
Generally, the scope of application of nanostructured conducting polymers is grossly
dependent on the intrinsic conductivity, thermal stability and morphology of the
doped polymer. The conductivity of PPy films doped with dopant mixtures of
naphthalene sulphonic acid and HCl was reported to show more thermal stability than
those from single dopants. Similarly, NCPs physical structure is radically different
between different monomer starting groups with the same counter ion, or between the
same monomer groups and with the different counter ions. These physical changes are
useful in chemical sensing as small changes in the polymer synthesis conditions can
lead to differing sensor responses and selectivity [127, 128]. PPy doped polymer with
fibrilar morphology was found to show better conductivity than those with globular
morphology because the former offers a better interaction between polymer chains
[129, 130].
58
Recently, glassy carbon electrode immobilized with conducting nanostructured
polypyrrole doped with naphthalene sulphonic acid is reported to electrocatalyse the
oxidation of phenol at a potential of about 80 mV [56], as against about 850 mV vs.
Ag/AgCl for its normal oxidation on unmodified glassy carbon electrode. In another
report, when exfoliated graphite electrode was used for phenol oxidation, the
irreversible conversion to quinone compounds occurred at 420 mV [131].The
electrocatalysis of conducting polymers could be further enhanced when modified
with dispersed particles of platinum. A thin film of nanoparticles of
polyaniline/platinum composite electrode showed significant electrocatalysis for the
oxidation of hydrazine and the reduction of dichromate [132]. Similar electrocatalysis
is expected for metal nanoparticle/PPy and PTh polymer composites.
A comprehensive review on the applications of electropolymerized conducting
polymers in amperometric biosensors as well as current tendencies and the advances
made in the field was published recently [133]. Special attention was paid to novel
applications, which have opened up new possibilities and lines of research with regard
to NCPs. The review covered applications in areas of imprinted electrosynthesised
film, screen printing technology, immunoassay analysis, immobilization of enzymes
on conducting polymer surfaces, multi-enzyme systems, miniaturization of electrodes
for ‘in vivo applications, liquid chromatography electrochemical detection, organic
phase biosensors and other miscellaneous applications for food and environmental
applications. A lot of analytical and technological development is expected in these
areas in the next few years.
2.9 Future challenges in the scope of conducting polymer applications
The development of novel and improved sensor devices with good electro catalytic
properties is a major challenge for scientists in the next few decades. Improved
processability for existing nanomaterials in appropriate medium, the production of
new materials (synthetic metals) through doping of hitherto insulating polymers and
development of terrific methods that are highly selective must be harnessed. Sensor
materials with good electro catalytic property, reversible and reproducible
electrochemistry must be assembled in portable and cost effective fashion. This
59
should cover all forms of biosensors for health, immunosensors, DNA biosensors,
environmental monitoring biosensors and chemosensors for food and allied industries.
Reproducibility of nanoparticles with desirable morphology and properties for
electrocatalytic application should be of utmost concern to synthetic chemists. It was
reported recently that the process of stirring during the bulk synthesis of polyaniline
leads to the formation of highly dispersible nanofibres [134]. The authors reasoned
that homogenous nucleation of nanoparticles of PANi results in nanofibres while
heterogeneous nucleation leads to granular particulates. They submitted that avoiding
stirring during the oxidation of the monomers could enhance the processability
problem of PANi. In the same manner, the effect of agitation on nanoparticles of
polypyrrole and polythiophene should be more critically investigated.
There is the challenge of developing new electrode systems from the combination of
separate chemical sensors having different transducer technologies to produce new
hybrid electronic nose (E–noses) systems for various quality control applications. The
problem of electrode surface fouling at high temperature by sulphur compounds in
calorimetric sensors should be curtailed. Likewise the humidity levels should be
optimized in polymer-based biosensors for optimal analyte discrimination in sensor
assemblies. There is also the challenge of developing greater photovoltaic
applications for nanostructured conducting polymers. In the near future, more
photovoltaic coatings that gather and emit electricity should be developed to power
and/or protect our houses and vehicles. This will be environmentally friendly and
possibly cheaper than petroleum products. Conductive polymeric coatings that can
fight corrosion will be more stable when applied as car paints. There is equally the
need to rapidly revolutionalise the world with an accelerated commercialization of the
research findings of material science so that the potential benefits therein could be
tapped. In this respect, Analytical Chemist and Engineers have the challenge of
producing microsytems of nanostructured conducting polymers through
simplification, automation and miniaturization of electro analytical processes such
that the analytical problems of selectivity and sensitivity are solved and more so that
the final sensor material is cost effective [135].
60

2.10 Chemical sensors for anthropogenic organic pollutants.
A chemical sensor can be described as a device, which upon exposure to a gaseous or
liquid chemical compound or mixture of chemical compounds alters one or more of
its physical properties (e.g. mass, electrical conductivity, or capacitance) in a way that
can be measured and quantified directly or indirectly. Sensors can be classified
according to their operating principle, each class having a different sensitivity and
selectivity. The sensor signal may be due to a change in the resistance
(conductometry), a change in potential difference across the polymer interface
(potentiometry), or to generation of oxidation or reduction of the analyte
(voltammetric/amperometric).
The working principle of a typical electrochemical sensor is illustrated in Figure 2.10.
Different sensors could be used singly or in an array to generate patterned recognition
and identification of various analytes.
Pt/PPYNQSA
Analyte Polymer Transducer Amplifier Monitor Output layer
Figure 2.10: Scheme for the working principle of an electrochemical sensor e.g.
electronic nose, (EN).
0102030405060708090
1. Kw 2. Kw 3. Kw 4. Kw
61

The analyte molecules interact with the polymer interface in a lock and key
mechanism to generate an electrical signal through the chosen transducer. The
generated signal is amplified and monitored with an artificial intelligence such as
computer hardware/software to produce measurable analytical signal. Furthermore, it
is possible to change the properties of the sensor by changing parameters (e.g. sensing
material or temperature) during manufacturing or operation of the sensor in order to
improve selectivity and sensitivity. For example, by an inclusion of different metal
ions into the polymer, the sensor can be adjusted for various chemical species. It is
well known that electron conducting polymers can be used as chemical sensors by
measuring the conductivity changes as a function of secondary doping or undoping of
detected species [136]. In order to improve the characteristics of PPy based
composites as chemical sensors; the sensitivity could be tuned by modifying the
nature of the interacting polymer site with the analyte of interest.
Hwang et al. had proposed a microscopic gas-sensing model indicating that the
sensitivity of the ethanol-based PPy-PEO composite film sensor depends on the site
number of a monolayer, the thickness of the sensing film, the adsorption equilibrium
constant as well as the change of site resistance [137, 138]. It was also found out that
the ethanol sensing abilities of the PPy-PEO sensor are better at lower polymerisation
charge [139]. The design of gas sensors was based on determining the sorption
properties on the polymers surface. Chehimi et al. [140] had reported that conducting
polymer surface is amphoteric with polar molecules (Lewis acids and bases) being
adsorbed to a greater degree than non-polar molecules. The polymers surface
morphology thus plays important role in surface thermodynamics of the polymer.
Conducting polypyrrole based electronic sensor arrays have been developed for toxic
and non-toxic substances, such as ammonia, nitrogen, nitrogen oxides, carbon
monoxide, sulphur dioxide, hydrogen sulphide, methane, oxygen, hydrogen, alcohols,
phenols, benzene and water vapour in materials ranging from water and beverages to
waste waters and sewage effluents [139].
The conductivity of an intrinsically conducting polymer like pyrrole is simply
measured at a constant current or voltage over a resistor. Sorption of gases or liquid
(containing the analyte) into the polymer matrix and the interaction with the matrix
62
causes a change in the conductivity of the polymer. The sensor response is not
necessarily a linear relationship between the analyte concentration and conductivity.
Responses are typically measured as the relative differential resistance (R2-R1)/R1,
where R1 is the baseline resistance in clean air or electrolyte and R2 the resistance in
analyte atmosphere. In the study by Lin et al. [136], on the responses of PPyCl sensor
to BTEX compounds, ο-xylene caused increase in conductivity being an electron-
donating compound. The resistance change (∆R) increases linearly with ο-xylene
concentration from 20 to 60 ppm in N2. The sensitivity was 0.8 mΩ/ppm. The
sensitivities obtained for BTEX compounds were in the following order ο-xylene › m-
xylene being ≈ p-xylene › ethylbenzene › toluene › benzene. This shows decrease from
the polar to non-polar compounds.
Hydrogen bonding and dipole-dipole interactions are also reported to play important
roles in sensing process [141]. The infrared spectra of a PPy film after exposing to
acetone indicated the formation of hydrogen bonds (H-bonds) between C=O groups of
acetone molecules and N−H groups of pyrrole units [141]. Also, the conductivities of
conducting polymers are directly determined by the doping levels and the properties
of counter ions. For example, the conductivity of ClO4- doped PPy is higher than that
of p-toluenesulphonate (TsO-) doped PPy [141].
Change in the morphology of conducting polymer’s sensing layer can strongly
influence the performances of chemresistors and diodes. This is attributable to the
results of changing the ratio of surface area to volume (rA/V) [143]. A film with higher
rA/V makes analyte molecules diffuse and interact with the sensing layer more easily,
which lead to a higher sensitivity and shorter response time. The exposure of
conducting polymer samples to the vapour of volatile substances can have their
conductivity altered in a reproducible manner. The combined pattern of variation of
the individual conductivities of slightly different polymeric substances in an assembly
could be used to give a specific ‘signature’ of the volatile compound. This is the
operating principle of the conducting polymer based “electronic noses” currently in
developmental stages in different laboratories [20, 139, 144, 145]. A comprehensive
review of the achievements from the various research efforts from 1994 to 2005 on
PPy-based E-Noses for environmental and industrial analysis is contained in [139].
63

Nanofibers (wires, tubes etc) have huge rA/V values, so they are perfect candidates for
preparing polypyrrole sensors with high sensitivities and fast responses. In this study,
careful control of the polypyrrole morphology have been done using surfactant
dopants of naphthalene sulphonic acid and 1,2-naphthaquinone-4-sulphonic acid; and
transition metal oxides of tungsten oxide and zirconium oxide to tune the interaction
of polypyrrole to some anthropogenic organic pollutants.
2.10.1 Surfactant modified polypyrrole chemical sensors
Surfactants are water-soluble agents made up of hydrophilic heads and hydrophobic
tails. They are widely used in soaps, detergents, pharmaceuticals and biotechnology
and can also be used in the modification of conducting polymer. Improved
processability of polypyrrole is usually obtainable by modification of the polymer’s
structure through the use of substituted monomer, variation in the type of oxidant and
also that of the doping material. However, the mostly studied approach to structural
variation of a conducting polymer like PPy is to modulate the properties through the
incorporation of sulphonic acid group (surfactants) which helps to improve the
polymers solubility in water, and allows the possibility of self doping. Selection of a
particular surfactant for a particular application is dependent on the critical micelle
concentration (CMC), i.e. the concentration at which it starts to form micelles. CMC
decreases as the carbon chain length and molecular weight increases, and the addition
of surfactants into aqueous solutions increase the conductance of the solution [146].
Different approaches have been explored such as use of aliphatic or aromatic organic
acids. In the study by Yasuo Kudoh [147], highly conducting and environmentally
stable PPy was prepared by chemical polymerization using aqueous solution
containing Fe2(SO4) as oxidant and an anionic surfactant of either sodium
dodeclybenzenesulfonate (NaDBS), sodium alkylnaphthalenesulfonate (NaANS) or
sodium alkylsulfonate (NaAS) . In the study, aromatic sulfonate was found to have a
stronger tendency to increase the moisture and thermal stabilities of the polymer than
alkylsulfonate. The improved thermal and environmental properties of the aromatic
sulphonated polypyrroles were ascribed to the large-sized surfactant anions that were
effectively incorporated into PPy as dopant. Evidence of the incorporation of the
monovalent sulfonate anions as dopant into PPy was monitored by the increase in the
64
S/N ratio. The doping ratio of each dopant was calculated by the following
simultaneous equations:
x + y = S/N ratio
2x + y = total doping ratio (constant)
where x and y are the doping ratios of sulfate (oxidant) and sulfonate (dopant),
respectively. A yield in excess of 100 % was reported when excess DBS was
adsorbed on the PPy surface.
Furthermore, the addition of the surfactant into the pyrrole-monomer solution was
reported to have accelerated the polymerization reaction [147]. It was reported that
the yield of the modified PPy is proportional to the surfactant concentration until near
the maximal dopable concentration after which a lower constant conductivity value
was maintained. The lower conductivity at the higher surfactant concentration region
was ascribed to the presence of surfactant anion adsorbed on the PPy surface [147].
The effectiveness of the surfactant modified PPy was dependent on the electron
withdrawing nature of the -SO3H- dopant moiety, the choice of dopants and steric
effect from the dopant being used, the choice of oxidant and its relative ratio to the
monomer mass concentration.
In order to improve selectivity of polypyrrole-based sensors towards acetone and
toluene which are flammable components of lacquer over the non-flamable acetic acid
and water, Ruangchuay et al. used blends of α-naphthalene sulfonate (PPy/α-NS-)
with common insulating polymers to create differences in surface composition and
wetting ability [148]. The PPy/α-NS- was more sensitive to acetone and toluene but
less sensitive towards water, relative to pure PPy/α-NS-. The sensitivity towards acetic
acid was not significantly different from that of pure PPy/α-NS-. Similarly, Jun et al.
used different pre-treatment procedure to use dodecylbenzenesulphonic acid (DBSA)
doped polypyrrole to generate different response times of the polymer to different
alcohol gases and volatile organic compounds such as acetone and chloroform [149].
Using an array of different sensors based on polypyrrole, eight different sufonated
polypyrroles were identified by Barisci et al. to detect and quantify benzene, toluene,
ethylbenzene, xylene i.e. (BTEX) compounds [150]. The uses of PPy gas sensors ENs
65
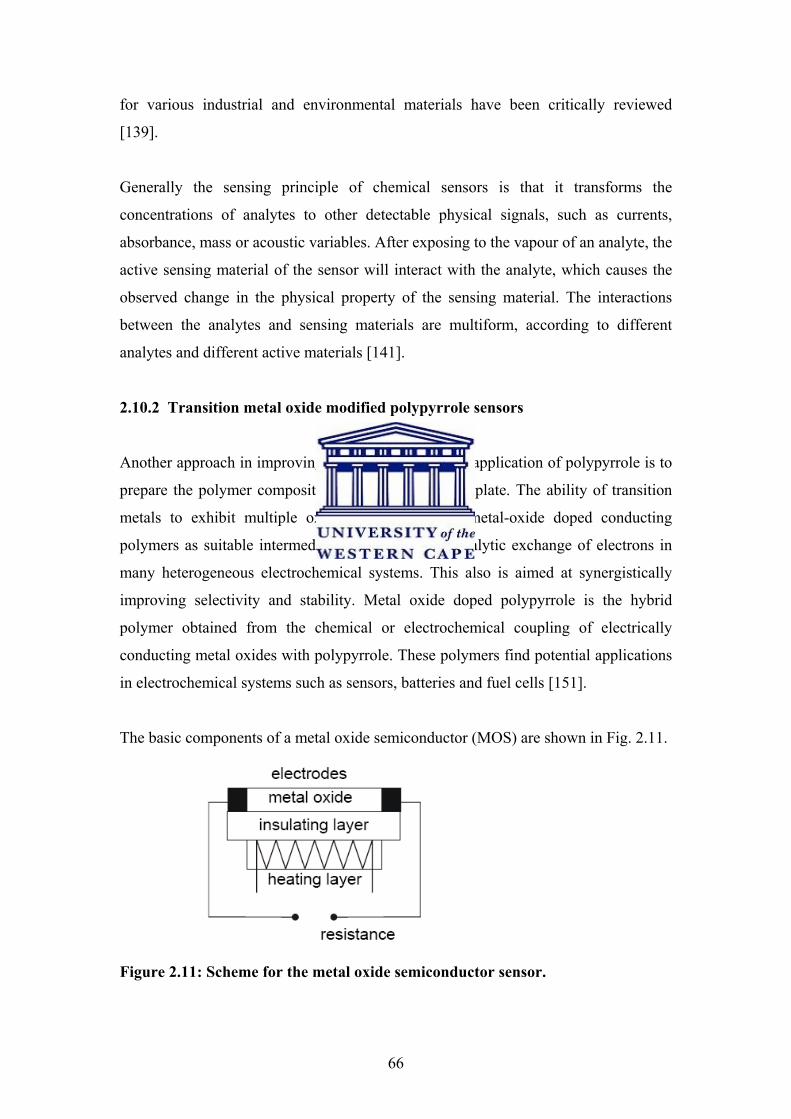
for various industrial and environmental materials have been critically reviewed
[139].
Generally the sensing principle of chemical sensors is that it transforms the
concentrations of analytes to other detectable physical signals, such as currents,
absorbance, mass or acoustic variables. After exposing to the vapour of an analyte, the
active sensing material of the sensor will interact with the analyte, which causes the
observed change in the physical property of the sensing material. The interactions
between the analytes and sensing materials are multiform, according to different
analytes and different active materials [141].
2.10.2 Transition metal oxide modified polypyrrole sensors
Another approach in improving the processability and application of polypyrrole is to
prepare the polymer composite using metal oxide template. The ability of transition
metals to exhibit multiple oxidation states makes metal-oxide doped conducting
polymers as suitable intermediate material for the catalytic exchange of electrons in
many heterogeneous electrochemical systems. This also is aimed at synergistically
improving selectivity and stability. Metal oxide doped polypyrrole is the hybrid
polymer obtained from the chemical or electrochemical coupling of electrically
conducting metal oxides with polypyrrole. These polymers find potential applications
in electrochemical systems such as sensors, batteries and fuel cells [151].
The basic components of a metal oxide semiconductor (MOS) are shown in Fig. 2.11.
Figure 2.11: Scheme for the metal oxide semiconductor sensor.
66
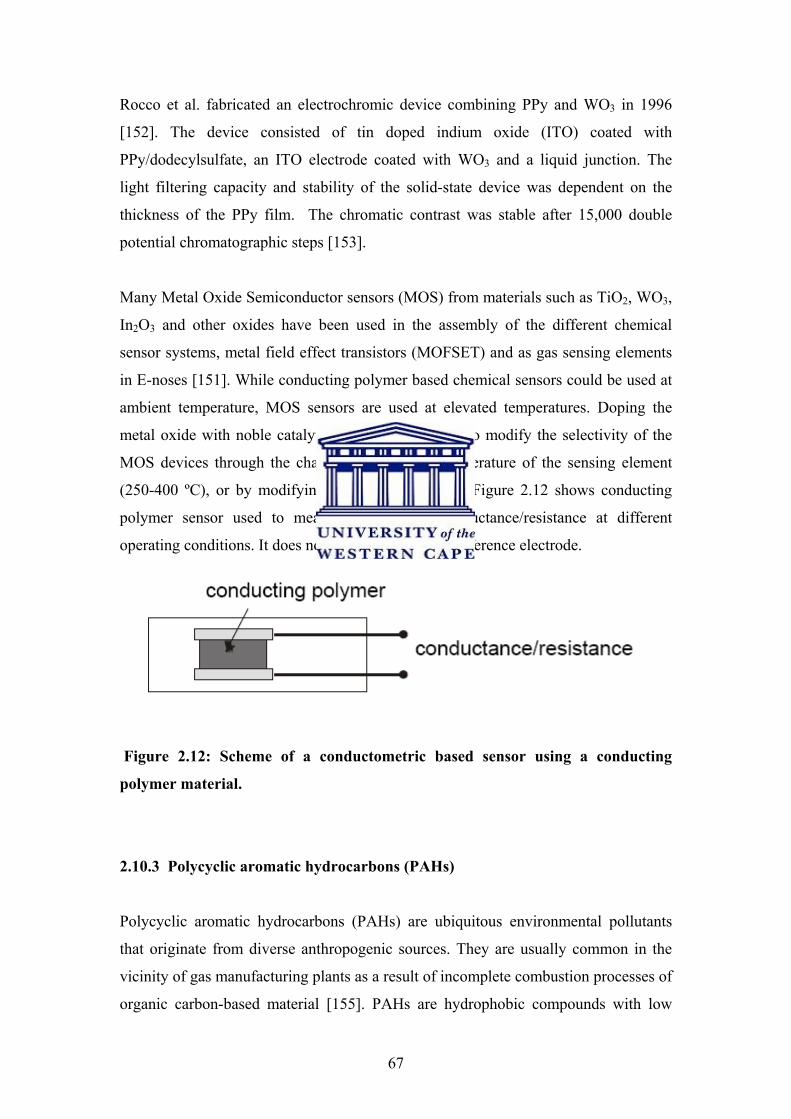
Rocco et al. fabricated an electrochromic device combining PPy and WO3 in 1996
[152]. The device consisted of tin doped indium oxide (ITO) coated with
PPy/dodecylsulfate, an ITO electrode coated with WO3 and a liquid junction. The
light filtering capacity and stability of the solid-state device was dependent on the
thickness of the PPy film. The chromatic contrast was stable after 15,000 double
potential chromatographic steps [153].
Many Metal Oxide Semiconductor sensors (MOS) from materials such as TiO2, WO3,
In2O3 and other oxides have been used in the assembly of the different chemical
sensor systems, metal field effect transistors (MOFSET) and as gas sensing elements
in E-noses [151]. While conducting polymer based chemical sensors could be used at
ambient temperature, MOS sensors are used at elevated temperatures. Doping the
metal oxide with noble catalytic metals can be used to modify the selectivity of the
MOS devices through the changing of working temperature of the sensing element
(250-400 ºC), or by modifying the grain size [153]. Figure 2.12 shows conducting
polymer sensor used to measure changes in conductance/resistance at different
operating conditions. It does not require the use of a reference electrode.
Figure 2.12: Scheme of a conductometric based sensor using a conducting
polymer material.
2.10.3 Polycyclic aromatic hydrocarbons (PAHs)
Polycyclic aromatic hydrocarbons (PAHs) are ubiquitous environmental pollutants
that originate from diverse anthropogenic sources. They are usually common in the
vicinity of gas manufacturing plants as a result of incomplete combustion processes of
organic carbon-based material [155]. PAHs are hydrophobic compounds with low
67

water solubility. They are of increasing interest because of their toxic, mutagenic and
carcinogenic properties [156].
PAHs do accumulate in the environment because they are thermodynamically stable
compounds, due to their large negative resonance energies; they have low aqueous
solubilities, and they adsorb to soil particles. Because of these reasons, PAHs do not
readily undergo natural environmental processes including biodegradation. Therefore,
PAHs persist for long periods under many natural conditions in the contaminated
environment [157]. The major natural source of PAHs in the environment is
combustion of biomass. Other significant sources are petroleum and fossil fuels, coal
and lignite, and coal tar residue from coal gasification processes. The major industrial
sites polluted with PAHs are coal gasification and wood-preserving plants. Some
PAHs such as naphthalene are also obtained from the concentration of the high
boiling residual oil (and asphalt) derived from crude petroleum refinery processing.
These PAHs are mostly used as intermediaries in pharmaceuticals, agricultural
products, photographic products, thermosetting plastics, lubricating materials, and
other chemical industries [158].
PAHs exist in various combinations that manifest various functions. They are made
up of two or more fused benzene rings and some "pentacyclic moieties" in linear,
angular, and/or cluster arrangements. The simplest example is naphthalene having two
benzene rings side by side while others could vary from 2, 3 and more fused aromatic
rings. The United States (US) Environmental Protecting Agency (EPA) proposed a
list of 16 PAHs in 1984 as carcinogenic or mutagenic compounds [159], which was
adopted by the US government in 1988. Some of these PAHs are shown in Figure
2.13. Further concern on PAHs necessitated the European Union to adopt a legislation
in 2005 [160] that provided a list of 15 PAHs (8 in common with US EPA and 7 new
compounds) which were of major concern for human health due to their toxic
properties (Table 2.1). The general characteristics of PAH includes high melting- and
boiling points (they are solid), low vapour pressure, and very low water solubility,
decreasing with increasing molecular weight. However, resistance to oxidation,
reduction, and vaporization increases with increasing molecular weight. Vapour
pressure tends to decrease with increasing molecular weight. PAHs are highly
lipophilic and readily soluble in organic solvents. The lower molecular weight PAHs
68

of 2 or 3 ring groups such as naphthalenes, fluorenes, phenanthrenes, and anthracenes
have toxicity that tends to decrease with increasing molecular weight [159].
Naphthalene Fluoranthene
Anthracene Pyrene
Phenanthrene
Figure 2.13: Structural representations of some PAHs included in the USEPA
list [158].
69
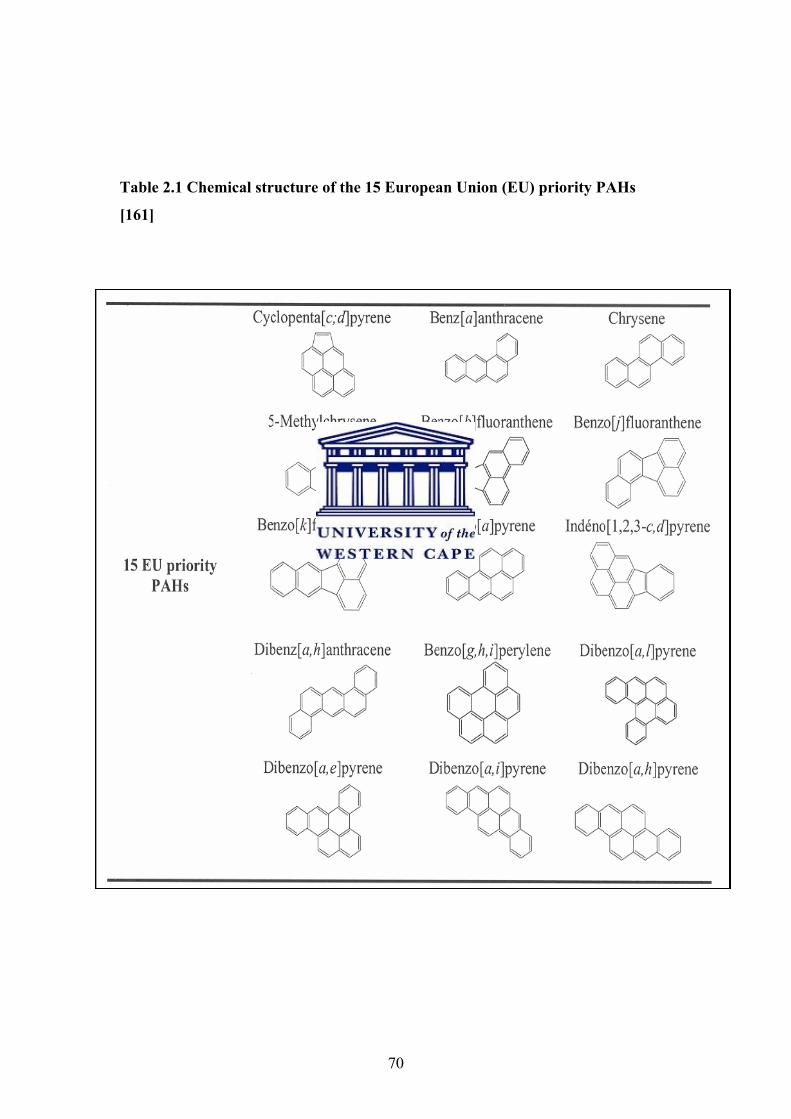
Table 2.1 Chemical structure of the 15 European Union (EU) priority PAHs
[161]
70
The main environmental impact of PAHs relates to their health effects, focusing on
their carcinogenic properties. The semi-volatile property of PAHs makes them highly
mobile throughout the environment via deposition and re-volatilisation between air,
soil and water bodies. Most of the PAHs released in the environment end up being
deposited in the oceans and/or subject to long range transport making them a
widespread environmental problem. Although PAHs may undergo chemical
oxidation, photolysis and volatilization, microbial degradation is the major process
affecting PAH persistence in nature [157].
It is therefore desirable in order to put in place adequate clean up programmes for the
prevention and remediation of PAHs pollution in the environment to avoid public
health hazards. Consequently, companies prone to generate these materials for
installation of abatement equipment at factory locations and also at old sites for the
purposes of monitoring control and remediation of PAHs are committing a lot of
investment. There are limits for work place exposure for chemicals that contain PAHs
such as coal tar and mineral oil. The Occupational Safety and Health Administration
(OSHA) has set a limit of 0.2 milligrams of PAHs per cubic meter of air (0.2 mg/m3).
The OSHA Permissible Exposure Limit (PEL) for mineral oil mist that contains PAHs
is 5 mg/m3 averaged over an 8-hour exposure period. Likewise, the National Institute
for Occupational Safety and Health (NIOSH) recommends that the average workplace
air levels for coal tar products should not exceed 0.1 mg/m3 for a 10-hour workday,
within a 40-hour workweek. There are other limits for workplace exposure for things
that contain PAHs, such as coal, coal tar, and mineral oil [158].
Therefore, there is an ever-increasing demand for the determination of trace amounts
of these substances at plant sites, water bodies and air. So far, mostly
chromatographic methods such as GC-MS or HPLC with fluorimetric detection are
used for these purposes [161]. However, these methods are characterized by high
investment and running costs. Modern electroanalytical methods are required for the
determination of these dangerous chemical carcinogens. The main advantage
derivable from this electroanalytical method is a much lower investment and running
costs. A study of voltammetric determination of trace amounts of carcinogenic 1-
nitropyrene and 1-aminopyrene using a glassy carbon paste electrode by Barek et al.
was described recently [162]. A fiber coating from polyaniline (PANI) was
71
electrochemically prepared and employed for solid phase microextraction (SPME) of
some polycyclic aromatic hydrocarbons (PAHs) from water samples. The study
revealed that this polymer is a suitable SPME fiber coating for extracting the selected
PAHs [156]. The development of more electrochemical devices for these
anthropogenic pollutants still remains a big challenge to scientists.
References
1. Iijima, S. (1991). Helical microtubules of graphitic carbon. Nature, 354, 56-58.
2. Long, Y., Chen, Z., Shen, J., Zhang, Z., Zhang, L., Huang, K., Wan, M., Jin, A.,
Gu, C. & Duvai, J.L. (2006). Magnetoresistance studies of polymer nanotube/wire
pellets and single polymer nanotubes/wires, Nanotechnology, 17, 5903–5911.
3. Pan, Z.W., Dai, Z.R. & Wang, Z.L. (2001). Nanobelts of semiconducting oxides,
Science, 291, 1947-1949.
4. Long, Y., Chen, Z., Zhang, X., Zhang, J., & Liu, Z. (2004). Electrical properties of
multi-walled carbon nanotube/polypyrrole nanocables:percolation-dominated
conductivity, J. Phys. D: Appl. Phys., 37, 1965–1969.
5. Wang, S.J., Cheng, C.H., Chang, S.H., Wong, C.H., Uang, K.M. & Chen, T.M.
(2005). On the self-synthesis of tungsten carbide nanowires from WCx films,
Nanotechnology, 16, 273-277.
6. Feng W., Bai X., Lian, Y., Liang, J., Wang, X. & Yoshino, K. (2003). Well-aligned
polyaniline/carbon-nanotube composite films grown by in-situ aniline polymerization,
Carbon, 41, 1551-1557.
7. Shi, J., Wang, Z. & Li, H. (2007). Electrochemical fabrication of polyaniline/multi-
walled carbon nanotube composite films for electrooxidation of methanol, J. Mater.
Sci., 42, 539–544.
72

8. Malinauskas, A., Malinauskeienė, J. & Ramanavičius, A. (2005). Conducting
polymer-based nanostructurised materials: electrochemical aspects, Nanotechnology,
16, R51-R62.
9. Ye, J-S., Cui, H.F., Wen, Y., Zhang, W.D., Xu, G.Q. & Sheu, F.S. (2006).
Electrodeposition of Platinum Nanoparticles on Multi Walled Carbon Nanotubes for
Electrocatalytic Oxidation of Methanol, Microchimica Acta, 152, 267-275.
10. Welch, C.M. & Compton, R.G. (2006). The use of nanoparticles in
electroanalysis: a review, Anal Bioanal Chem., 384, 601-619.
11. http://www.luxresearchinc.com accessed on 5th March 2007.
12. Wang, C., Li, C., Ting, L., Xu, X. & Wang C. (2006). Application of a Single-
Wall Carbon Nano-Tube Film Electrode to the Determination of Trace Amounts of
Folic Acid, Microchimica Acta, 152, 233-238.
13. Förstar, S., Konrad, M., (2003). From self-organizing polymers to nano- and
biomaterials, J. Mater. Chem., 13, 2671-2688.
14. Ye, J-S., Cui, H.F., Wen, Y., Zhang, W.D., Xu, G.Q. & Sheu, F-S. (2006).
Electrodeposition of Platinum Nanoparticles on Multi Walled Carbon Nanotubes for
Electrocatalytic Oxidation of Methanol, Microchimica Acta, 152, 267-275.
15. Stejskal, J., Omastova, M., Fedorova, S., Prokeš, J. & Trchová, M. (2003).
Polyaniline and polypyrrole prepared in the presence of surfactants: a comparative
conductivity study, Polymer, 44, 1353-1358.
16. Su, S.J., Kuramoto, N. (2000). Synthesis of processable polyaniline complexed
with anionic surfactant and its conducting blends in aqueous and organic system,
Synthetic Metals, 108, 121-126.
73
17. Pud, A., Ogurtsov, N., Korzhenko, A. & Shapoval, G. (2003). Some aspects of
preparation methods and properties of polyaniline blends and composites with organic
polymers, Prog. Poly. Sc., 28, 1701-1753.
18. Hossein S.H. & Entezami, A.A. (2005). Studies of Thermal and Electrical
Conductivity Behaviours of Polyaniline and Polypyrrole Blends with Polyvinyl
acetate, Polystyrene and Polyvinyl Chloride, Iranian Polymer Journal, 201-209.
19. Yang, Y.S., Liu, J. & Wan, M.X. (2002). Self-assembled conducting polypyrrole
micro/nanotubes, Nanotechnology, 13, 771-773.
20. James, D., Scott, S.M., Ali, Z. & O'Hare, W.T. (2005). Review Chemical Sensors
for Electronic Nose Systems, Microchim. Acta, 149, 1-17.
21. Liu, Y.C. (2002). New Pathway for the Autopolymerization of Pyrrole on the
Chlorine- and Gold-Containing Complexes with Nanostructures, Langmuir, 18, 9513-
9518.
22. Pra, L.D.D., Ferain, E., Legras, R., & Demoustier-Champagne, S. (2002). Nucl.
Instrum. Methods Phys. Res. B, 196, 81. In Malinauskas, A., Malinauskeienė, J. &
Ramanavičius, A. (2005). Conducting polymer-based nanostructurised materials:
electrochemical aspects, Nanotechnology, 16, R51-R62.
23. Duvail, J.L., Retho, P, Garreaau, S., Louarn, G., Gondon, C. & Demoustier-
Champagne, S. (2002). Transport and vibrational properties of poly(3,4-
ethylenedioxythiophene) nanofibers, Synthetic Metals, 131, 123-128.
24. MacDiarmid, A.G. (2001). "Synthetic metals”: A novel role for organic polymers
(Nobel Lecture), Angew. Chem. Int. Ed., 40, 2581-2590.
25. Zhang, L. & Wan, M. (2002). Synthesis and characterization of self-assembled
polyaniline nanotubes doped with D-10-camphorsulphonic acid, Nanotechnology, 13,
750-755.
74
26. Xia, Y., Wiesinger, J.M., MacDiarmid, A.G. (1995). Camphor sulphonic Acid
Fully Doped Polyaniline Emeraldine Salt: Conformations in Different Solvents
Studied by an Ultraviolet/Visible/Near-Infrared Spectroscopic Method, Chem. Mater.,
7, 443-445.
27. Zhang, Z., Wei, Z., Zhang, L. & Wan, M., (2005). Polyaniline nanotubes and their
dendrites doped with different naphthalene sulphonic acids, Acta Materialia, 53,
1373-1379.
28. Chwang, C., Liu, C., Huang, S., Chao, D. & Lee, S. (2004). Synthesis and
characterization of high dielectric constant polyaniline/polyurethane blends, Synthetic
Metals, 142, 275-281.
29. Mukoyama, I., Koichi, A. and Chen, J., (2002). Electrochemical Dissolution of
Polythiophene Films, J. Electroanal Chem., 531, 133-139.
30. Abaci, S., Yildiz, A., J. (2004). Electropolymerization of thiophene and 3-
methylthiophene on PbO2 electrodes, Electroanal Chem., 569, 161-168.
31. Gospodinova, N. & Terlemezyan, L., (1998). Conducting polymers prepared by
oxidative polymerization:Polyaniline, Prog. Polym. Sci., 23, 1443-1484.
32. Ateh, D.D., Navsaria, H.A. & Vadgama, P. (2006). Polypyrrole-based conducting
polymers and interactions with biological tissues, J. R. Soc. Interface, 3, 741–752
33. Cho, K.H., Park, S., Paik, W. & Lee, H. (2002). Electrochemistry and
electrochromism of the polythiophene derivative with viologen pendant, Synthetic
Metal, 132, 15-20.
34. Zheng, L. & Li, J. (2005). Platinum-polyaniline nanofilms synthesized at a
liquid|liquid interface with enhanced conductivity, J. of Electroanalytical Chem.,
577(1), 137-144.
75

35. Freund, M.S. & Deore, B.A. (2007). Self-Doped Conducting Polymers, John
Wiley & Sons Ltd, Canada, 1st edn, pp1-74, accessed on the internet on 1st of March,
2007.
36. Angelopoulos, M., Asturias, G.E., Ermer, S.P., Ray, A., Scherr, E.M.,
MacDiarmid, A.G., Akhtar, M., Kiss, Z. & Epstein, A.J. (1988). Polyaniline–
solutions, films and oxidation-state, Molecular Crystals and Liquid Crystals, 160,
151-163.
37. Jen, K.Y., Oboodi, R. & Elsenbaumer, R.L. (1985). Processible and
environmentally stable conducting polymers, Polymeric Materials Science and
Engineering, 53, 79-83.
38. Sato, M., Tanaka, S. & Kaeriyama, K. (1986). Soluble conducting polythiophenes,
Chemical Communications, 873-874.
39. Yano, J. (1991).The transformation of electroinactive polymers derived from
aniline derivatives into electroactive and functional polymers; 2. Making poly (N,N-
di- N-butylaniline) films have anion exchangeability and selective potential response
to dissolved iodide ions, Journal of the Electrochemical Society 138, 455-459.
40. Wei, Y., Hariharan, R. & Patel, S.A. (1990). Chemical and electrochemical
copolymerization of aniline with alkyl ring-substituted anilines, Macromolecules, 23,
758-764.
41. Daprano, G., Leclerc, M., Zotti, G. & Schiavon, G. (1995). Synthesis and
characterization of polyaniline derivatives – poly(2-alkoxyanilines) and poly(2,5-
dialkoxyanilines), Chemistry of Materials, 7, 33, In Freund, M.S. & Deore, B.A.
(2007). Self-Doped Conducting Polymers, John Wiley & Sons Ltd, Canada, 1st edn,
pp1-74, accessed on the internet on 1st of March, 2007.
42. Gazotti, W.A. & De-Paoli, M.A.(1996). High yield preparation of a soluble
polyaniline derivative, Synthetic Metals, 80, 263-269.
76
43. Cao, Y., Smith, P., Heeger, A.J. (1992). Counterion induced processibility of
conducting polyaniline and of conducting polyblends of polyaniline in bulk polymers,
Synthetic Metals, 48, 91-97.
44. Heeger, A.J. (1993). Polyaniline with surfactant counterions – conducting
polymer materials which are processible in the conducting form, Synthetic Metals
57, 3471-3482.
45. Otagawa, Takaaki (Fremont, C.A.), Madou, Marc, J. (Palo Alto, CA), (1991).
Permanently doped polyaniline and method thereof,
http://www.wikipatents.com/5002700.html accessed on 6th of March 2007.
46. Freund, M.S., Karp, C. & Lewis, N.S. (1995). Growth of thin processable films of
poly (pyrrole) using phosphomolybdate clusters, Inorganica Chimica Acta,
240, 447-451.
47. Lonergan, M.C. (1997). A tunable diode based on an inorganic semiconductor
vertical bar conjugated polymer interface, Science, 278, 2103-2106.
48. Liu, W., Kumar, J., Tripathy, S., Senecal, K.J., & Samuelson, L. (1999)
Enzymically synthesized conducting polyaniline, Journal of the American Chemical
Society, 121, 71-78.
49. Nabid, M.R. & Entezami, A.A., (2004). A novel method for synthesis of water-
soluble polypyrrole with horseradish peroxidase enzyme, Journal of Applied Polymer
Science, 94, 254-258.
50. Lee, B., Seshadri, V. & Sotzing, G.A. (2005). Poly(thieno 3,4-b thiophene)-
poly(styrene sulfonate): a low band gap, water dispersible conjugated polymer,
Langmuir, 21, 10797-10802.
51. Stejskal, J. (2001). Colloidal dispersions of conducting polymers, Journal of
Polymer Materials, 18, 225-231.
77
52. Wessling, B. (2005). Dispersion – the key tool for understanding, improving and
using conductive polymers and organic metals, Synthetic Metals, 152, 5-8.
53. Simmons, M.R., Chaloner, P.A. & Armes, S.P. (1995). Synthesis of Colloidal
Polypyrrole Particles Using Reactive Polymeric Stabilizers, Langmuir, 11, 4222-
4224.
54. Huang, J. (2005). Conducting Polymer Nanofibres: Synthesis, Properties and
Applications, 2005 Winner of the IUPAC Prize for Young Chemists lecture; full
article in Huang, J. & Kaner, R.B. (2006). The Intrinsic nanofibrilar morphology of
Polyaniline, Chem. Commun, 367-376.
55. Yang, Y.S. & Wan, M.X. (2001). Microtubules of polypyrrole synthesized by an
electrochemical template-free method, J. Mater. Chem., 11, 2022-2027.
56. Akinyeye, R.O., Sekota, M., Baker, P. & Iwuoha, E. (2006). Chemical Synthesis
and Morphology of β–Naphthalene Sulphonic Acid Doped-Polypyrrole
Micro/Nanotubes, Fullerenes, Nanotubes and Carbon Nanostructures, 14, 49-55.
57. Akinyeye, R.O., Michira, I., Sekota, M., Al-Ahmed A., Baker, P. & Iwuoha, I.,
(2006). Electrochemical Interrogation and Sensor Applications of Nanostructured
Polypyrroles, Electroanalysis, 18(24), 2441-2450.
58. Pra, L.D.D., Ferain, E., Legras, R. & Demoustier-Champagne, S. (2002). Nucl.
Instrum. Methods Phys. Res. B, 196, 81, In Malinauskas, A., Malinauskeienė, J. &
Ramanavičius, A. (2005). Conducting polymer-based nanostructurised materials:
electrochemical aspects, Nanotechnology, 16, R51-R62.
.
59. Hongliang, Y., Lan, Z., Jiaoyan, S., Zhaojia, C., Gaoquan, S. & Binglin, Z.
(2006). Synthesis, property and field-emission behaviour of amorphous polypyrrole
nanowires, Nanotechnology, 17, 3446-3450.
78
60. Lee, J.Y., Park, S.M. (2000). Electrochemistry of Conducting Polymers XXIV.
Polypyrrole Films Grown at Electrodes Modified with β-Cyclodextrin Molecular
Templates, J. Electrochem. Soc., 147, 4189-4195.
61. De-Paoli, M.A. & Gazotti, W.A. (2002). Electrochemistry, Polymers and Opto-
Electronic Devices: A Combination with a Future, Journal of Brazillian Chemical
Society, 13(4), 410-424.
62. Li, G., Josovies, M. & Janata, J. (2002). Electrochemical assembly of conducting
polymer films on an insulating surface, Electrochemical and Solid State Letters, 5(4),
D5 – D8.
63. Strafstrom, S., Bredas, J.L., Epstein, A.J., Woo, H.S. (1987). Polaron lattice in
highly conducting polyaniline: theoretical and optical studies, Phys. Rev. Lett. 59(13),
1464 – 1467. In Pud, A., Ogurtsov, N., Korzhenko, A. & Shapoval, G. (2003). Some
aspects of preparation methods and properties of polyaniline blends and composites
with organic polymers, Prog. Poly. Sc., 28, 1701-1753.
64. Geng, Y.H., Sun, Z.C., Li, J., Jing, X.B., Wang, X.H. & Wang, F.S. (1999). Water
soluble polyaniline and its blend films prepared by aqueous solution casting, Polymer,
40, 5723-5727,
65. Tang Z, Liu S, Wang Z, Dong S, Wang E (2000). Electrochemical synthesis of
polyaniline nanoparticles, Electrochemistry Communications, 2, 32-35.
66. Karakista, M., Sacak, M., Erdem, E. & Akbulut, U. (1997). Synthesis and
characterization of malonic acid-doped polyaniline, J. of Applied Electrochemistry,
27, 309-316.
67. Karakista, M. & Sacak, M. (2000). The preparation of polyaniline/polypyrrole
conductive polymer films on polycarbonate-coated Pt electrodes, J. of Polymer
Science: Part A: Polymer Chem. 38, 51-59.
79

68. Malmonge, L.F. & Mattoso, L.H.C. (1995). Electroactive blends of
poly(vinylidene fluoride) and polyaniline derivatives, Polymer, 36(2), 245-249.
69. Zhang, X. & Manohar, S. (2005). Narrow Pore-Diameter Polypyrrole Nanotubes,
Journal of American Chemical Society, 127, 14156-14157.
70. Zhang, X. & Manohar, S. (2004). Bulk Synthesis of Polypyrrole Nanofibers by a
Seeding Approach, Journal of the American Chemical Society, 126, 12714-12715.
71. Vernitskaya, T.V. & Efimov, O.N. (1997). Polypyrrole: a conducting polymer; its
synthesis, properties and applications, Russian Chemical Reviews, 66(5): 443-457.
72. Rapi, S., Bocchi, V., Gaardini, G.P. (1988). Conducting polypyrrole by chemical
synthesis in water, Synthetic Metals, 24, 217-221.
73. Mccarthy G. P., Armes S. P., Greaves, S. J. & Watts J. F. (1997). Synthesis and
characterization of carboxylic acid-functionalized polypyrrole-silica microparticles
using a 3-substituted pyrrole comonomer, Langmuir, 13(1), 3686-3692.
74. Omastova, M., Pavlinec, J., Pointech, J. (1988). Chemical preparation and
characterization of conductive poly(methyl methacrylate)/polypyrrole composites,
Polymer 39(25), 6559–6566.
75. Cairns, D.B., Armes, S.P., Bremer (1999) Synthesis and characterization of
submicrometer-sized polypyrrole-polystyrene composite particles, Langmur, 15,
8052-8058.
76. Lu, Y., Pich, A. & Adler, H. (2003). Synthesis and characterization of. nanometer-
sized polypyrrole composites, Synthetic Metals, 135–136, 37–38.
77. Jang, J., Lim, B., Lee, J. & Hyeon, T. (2001). Fabrication of a novel
polypyrrole/poly(methyl methacrylate) coaxial nanocable using mesoporous silica as
a nanoreactor, The Royal Society of Chemistry Chem. Commun., 83–84.
80

78. Watanabe, M., Shirai, H. & Hirai, T. (2002). Wrinkled Polypyrrole Electrode for
Electroactive Polymer Actuators, J. Appl. Phys., 92(8), 4631-4637.
79. Njuguna, J. & Pielichowski, K. (2004). Recent developments in polyurethane-
based conducting composites, J. of Material Sci., 39(13), 4081-4094.
80. Tamm, J., Alumaa, A., Hallik, A. & Sammelselg, V. (1997). Electrochemical
properties of cation sensitive polypyrrole films, J. of Electroanaly. Chem., 448, 25-31.
81. Tamm, J., Hallik, A., Alumaa, A. & Sammelselg, V. (1997). Electrochemical
properties of polypyrrole/sulphate films, Electrochim Acta., 42(19), 2929-2934.
82. Giacomini, M.T. & Schuster, R. (2005). Localized electrosynthesis of polypyrrole
by application of short voltage pulses, Phys. Chem. Chem. Phys., 7(3), 518-523.
83. Lee, J.Y., Kim, D.Y. & Kim, C.Y. (1995). Synthesis of soluble polypyrrole of the
doped state in organic solvents, Synthetic Metals, 74, 103–106.
84. Turcu, R., Grecu, R., Brie, M., Meter, I., Bot, A. & Graupner, W. (2001).
Spectroscopic investigation of the electron delocalisation and molecular
conformational changes in polypyrrole induced by different doping ions, Studia
universitatis babes-bolyai, Physica, special issue, 216 – 222.
85. Masuda, H. & Asano, D.K. (2003). Preparation and properties of polypyrrole,
Synthetic Metals, 135–136, 43-44.
86. Yuan, Y.J., Adeloju, S.B. & Wallace, G.G. (1999). In-situ electrochemical studies
on the redox properties of polypyrrole in aqueous solutions, European Polymer
Journal, 35, 1761-1772.
87. Li, Y.F. & Qian, Y.F. (2000). Electrochemical overoxidation of conducting
polypyrrole nitrate film in aqueous solutions, Electrochimica Acta, 45(11), 1727-
1731.
81

88. Ge, D., Wang, J., Wang, S., Ma, J. & He, B. (2003). Electrochemical synthesis of
polypyrrole nanowires, J. of Material Sci. Letters, 22:839-840.
89. Khalkhali, R.A. & Wallace, G.G. (2004). Effect of solution temperature on
electroactivity of polypyrrole using cyclic voltammetry technique, Iranian Polymer
Journal, 13 (6), 463-470.
90. Evans, G.P. (1990). The Electrochemistry of conducting polymers, pp51 – 59, In
Advances in Electrochemical Science and Engr., VCH, Weinheim.
91. Ding, H., Pan Z., Pigani, L., Seeber, R., Zanardi, C. (2001). p- and n-doping
Processes in Polythiophenes with Reduced Bandgap. An Electrochemical Impedance
Spectroscopy Study, Electrochim. Acta, 46, 2721-2732.
92. Betova, I., Bojinov, M., Laukinem. E. & Sundholm, G. (1999). Studies of the
redox behaviour of some polythiophene derivatives by impedance spectroscopy in
symmetrical and asymmetyrical configurations, J. of Electroanaly. Chem., 472, 20-32.
93. Ballav, N. & Bisvas, M. (2003). Preparation and Evaluation of a nanocomposite
of polythiophene with Al2O3, Polym. Int., 52, 179-184.
94. Auderbert, P., Catel, J.M., Duchenet, V., Guyard, L., Hapiok, P. & Coustumer,
G.L (1999). Redox chemistry of thiophene, pyrrole and thiophene-pyrrole-thiophene
oligomers, Synthetic Metals, 101, 642-645.
95. Ryv, K.S., Lee, Y., Han, K.S., & Kim, M.G. (2004). The electrochemical
performance of polythiophene synthesized by chemical method as the polymer.
Material Chemistry and Physics, 84, 380-384.
96. Yigit, S., Hacaloglu, J., Akbulut. U. & Toppare, L. (1995). Conducting polymer
composites of polythiophene with natural and synthetic rubbers, Synthetic Metals, 79,
11-16.
82

97. Ewbank, P.C., Loewe, R.S., Zhai, L., Reddinger, J., Sauve, G. & McCullough,
R.D. (2004). Regioregular poly(thiophene-3-alkanoic acid)s: water soluble conducting
polymers suitable for chromatic chemosensing in solution and solid state.
Tetrahedron, 60, 11269-11275.
98. Kassim, A., Basar, Z.B. & Mahmud, H.M.E. (2002). Effects of preparation
temperature on the conductivity of polypyrrole conducting polymer, Proc. Indian
Acad. Sci. (Chem. Sci.), 114, 155-162.
99. Xia, Y., Wiesinger, J.M. & MacDiarmid, A.G. (1995). Camphor Sulphonic Acid
Fully Doped Polyaniline Emeraldine Salt: Conformations in Different Solvents
Studied by an Ultravielet/Visible/Near-Infrared Spectroscopic Method, Chem. Mater
7, 443-445.
100. Bazzaoui, E.A., Aeiyach, S. & Lacaze, M.P.C. (1994). Low Potential
Electropolymerisation of Thiophene in Aqueous Perchloric-Acid, Journal of
Electroanalytical Chemistry, 364(1-2), 63-69.
101. Iwuoha, E.I., Smyth, M.R. & Lyons, M.E.G. (1995). Solvent effects on the
reactivities of an amperometric glucose sensor, Journal of Electroanalytical
Chemistry, 390 (1), 35-45.
102. Wang, Y. & Jing, X. (2005). Effect of solution concentration on the UV-vis
spectroscopy measured oxidation state of polyaniline base, Polymer testing, 24, 153-
156.
103. Zotti, G., Cattarin, S. & Commisso, N. (1998). Microdimensional Polyaniline:
Fabrication and Characterization of Dynamics of Charge Propagation at Microdisk
Electrodes, Journal of Electroanalytical Chemistry, 239(1–2), 387-396.
104. Paul, E.W., Ricco, A.J., Wrighton, M.S., J. Phys. Chem. (1985). Resistance of
Polyanillne Films as a Function of Electrochemical Potential and the Fabrication of
Poiyanlline-Based Microelectronic Devices, J. Phys. Chem., 89, 1441-1447.
83
105. Asavapiriyanont, S., Chandler, G.K., Gunawardena, G.A. & Pletcher, D. (1984).
J. Electroanal. Chem., 177, 229. In Vernitskaya, T.V. & Efimov, O.N. (1997).
Polypyrrole: a conducting polymer; its synthesis, properties and applications, Russian
Chemical Reviews, 66(5): 443-457.
106. Satoh, M., Kaneto, K. & Yoshino, K. (1984). Synthetic Metals, 14, 61. In
Vernitskaya, T.V. & Efimov, O.N. (1997). Polypyrrole: a conducting polymer; its
synthesis, properties and applications, Russian Chemical Reviews, 66(5): 443-457.
107. Li, G., Josowics, M. & Janata, J., (2001). Tuning of Electronic Properties. in
Conducting Polymers, Collect. Czech. Chem. Commun., 66, 1208-1218.
108. Koryta, J., Dvorak, J. & Kavan, L. (1993). In Principles of Electrochemistry, 2nd
ed., John Wiley & Sons Ltd., New York, USA, pp324–328 and 352–364.
109. Del-Valle, M.A.D., Diaz, F.R., Bodini, M.E., Pizarro, T., Cordova, R., Gomez,
H. & Schrebler, R. (1998). Polythiophene, polyaniline and polypyrrole electrodes
modified by electrodeposition of Pt and Pt + Pb for formic acid electrooxidation, J. of
App. Electrochemistry, 28, 943-946.
110. Massari, A.M., Stevenson, K.J. & Hupp, J.T. (2001). Development and
application of patterned conducting polymer thin films as chemoresponsive and
electrochemically responsive optical diffraction gratings, J. of Electroanalytical
Chem., 500(1-2), 185-191.
111. Gerard, M., Chaubey, A. & Malhotra, B.D. (2002). Application of conducting
polymers to biosensors, Biosensors & Bioelectronics, 17(5), 345-359.
112. Janata, J. & Josowicz, W. (2003). "Conducting polymers in electronic chemical
sensors", Nature Materials, 2(1), 19-24.
113. Brahim, S., Wilson, A.M., Narinsingh, D., Iwuoha, E., & Guiseppi-Elie A.,
(2003). Chemical and Biological Sensors Based on Electrochemical Detection Using
Conducting Electroactive Polymers, Microchim. Acta, 143, 123-137.
84
114. Dónal, L. (1996). In Electroactive Polymer Electrochemistry, Part 2: Methods
and Applications, edited by Michael EG Lyons, Platinum Press, New York, pp269–
296.
115. Lipkowski, J. & Ross, P.N. (1998). Electrocatalysis, Wiley–Vch, New York,
USA, pp139–141.
116. Wilson, D.M., Hoyt, S., Janata, J., Booksh, K. & Obando, L. (2001). Chemical
sensors for portable, handheld field instruments, IEEE Sensor Journal, 1(4), 256-274.
117. Johanson, U., Marandi, M. & Sammelselg, V. & Tamm, J. (2005).
Electrochemical properties of porphyrin-doped polypyrrole films, Journal of
Electroanalytical Chemistry, 575, 267-273.
118. Galal, A., Mark, H.B., Zimmer, H., Petticrew, K.L., Marawi, I. & Atta, N.F.
(1996). Electrochemistry and detection of some organic and biological molecules at
conducting polymer electrodes. Part 3. Evidence of the electrocatalytic effect of the
heteroatom of the poly(hetetroarylene) at the electrode/electrolyte interface, J. of
Electroanalytical Chemistry, 408, 47-52.
119. Aduloju, S.B. & Wallace, G.G. (1996). Conducting polymers and the
bioanalytical sciences, Analyst, 121, 699-703.
120. Mathebe, N.G.R., Morrin, A. & Iwuoha, E.I. (2004). Electrochemistry and
scanning electron microscopy of polyaniline/peroxidase-based biosensor, Talanta, 64,
115-120.
121. Izaoumen, N., Bouchta, D., Zejli, H., Kaotit, M.E., Stalcup, A.M. & Temsamani,
K.R. (2005). Electrosynthesis and analytical performances of functionalized poly
(pyrrole/β-cyclodextrin) films, Talanta, 66, 111-117.
122. Piuno, P.A.E., & Krull, U.J. (2005). Trends in the development of nucleic acid
biosensors for medical diagnostics, Anal Bioanal Chem, 381, 1004-1011.
85

123. Dore, K., Dubus, S., Ho, H., Levesque, I., Brunette, M., Corbeil, G., Boissinot,
M., Boivin, G., Boudteau, D. & Laclerc, M. (2004). Fluorescent Polymeric
Transducer for the Rapid, Simple, and Specific Detection of Nucleic Acids at the
Zeptomole Level, J. Am. Chem. Soc., 126, 4240-4244.
124. Yokoyama, K., Koide, S. & Kayanuma Y. (2002). Cyclic voltammetric
simulation of electrochemically mediated enzyme reaction and elucidation of
biosensor behaviors, Anal Bioanal Chem, 372, 248-253.
125. Temsamani, K.R., Ceylan, Ö., Yates, B., Oztemiz, S., Gbatu, T.P., Stalcup,
A.M., Mark, H.B. & Kutner, W. (2002). Electrochemically aided solid phase
microextraction: conducting polymer film material applicable for cationic analytes, J.
Solid State Electrochem., 6, 494-497.
126. Izaoumen, N., Bouchta, D., Zejli, H., Kaotit, M.E., Stalcup, A.M. & Temsamani,
K.R. (2005). Electrosynthesis and analytical performances of functionalized poly
(pyrrole/β-cyclodextrin) films, Talanta, 66, 111-117.
127. Gardner, J.W.& Bartlett, P.N. (1995). Application of conducting polymer
technology in microsystems, Sensors & Actuators A, 51, 57-66.
128. Cui, X., Hetke, J.F., Willer, J.A., Anderson, D.J. & Martin, D.C. (2001).
Electrochemical deposition and characterization of conducting polymer
polypyrrole/PSS on multichannel neural probes, Sensors & Actuator A, 93, 8-18.
129. Lee, H.J. & Park, S.M. (2005). Electrochemistry of conductive polymers 37.
Nanoscale monitoring of electrical properties during electrochemical growth of
polypyrrole and its aging, J. Phys. Chem. B, 109, 13247-13254.
130. Oh, K.W., Park, H.J. & Kim, S.H.(2005). Novel conducting polyaniline blends
with cyanoresin, J. Appl Polym Sci., 96, 1035-1042.
86

131. Skowroński, J.M. & Krawczyk, P.(2007). Improved electrooxidation of phenol at
exfoliated graphite electrodes, J. of Solid State Electrochemistry, 11(2), 223-230.
132. O’Mullane, A.P., Dale, S.E., Day, T.M., Wilson, N.R., Macpherson, J.V. &
Unwin, P.R. (2006). Formation of polyaniline/Pt nanoparticle composite films and
their electrocatalytic properties, J. Solid State Electrochemistry, (10), 792-807.
133. Juan-Carlos, V., Esperanza, G.R. & Juan-Ramo´n, C. (2003). Recent advances in
electropolymerized conducting polymers in amperometric biosensors, Microchim.
Acta, 143, 93-111.
134. Dan, L. & Richard, B.K. (2006). Shape and aggregation control of nanoparticles:
not shaken, not stirred, J. Am. Chem. Soc., 128(3), 968-975.
135. Rios, A., Escarpa, A., Gonzalez, M.C. & Crevillen, A.G. (2006). Challenges of
analytical microsystems, Trends in Analytical Chemistry, 25(5), 467-479.
136. Lin, C.W., Liu, Y.L. & Thangamuthu, R. (2003). Investigation of the
relationship between the surface thermodynamics of the chemically synthesised
polypyrrole films and their gas-sensing responses to BTEX compounds, Sensors and
Actuators B, 94, 36-45.
137. Hwang, J., Yang, J.Y. & Lin, C.W. (1999). “A microscopic gas-sensing model
for ethanol based on the conductive polymer composites from polypyrrole and poly
(ethylene oxide)”, J. Electrochem. Soc., 146, 1231-1236.
138. Hwang, B.J., Yang, J.Y. & Lin, C.W. (2001). Recognition of alcohol vapor
molecules by simultaneous measurements of resistance changes on polypyrrole-based
composite thin films and mass changes on a piezoelectric crystal, Sensors and
Actuators B, 75, 67-75.
139. Ameer, Q. & Aduloju, S.B. (2005). Polypyrrole-based electronic noses for
environmental and industrial analysis, Sensors and Actuators B, 106, 541-552.
87

140. Chehimi, M.M., Abel, M-L., Pigois-Landureau, E. & Delamar, M. (1993).
Characterization of conducting polymers by inverse gas chromatography Part II.
Effect of dopant on the dispersive and specific properties of polypyrrole, Synthetic
Metals, 60, 183-194.
141. Bai, H. & Shi, G. (2007). Gas sensors based on conducting polymers, Sensors, 7,
267-307.
142. Ruangchuay, L., Sirivat, A. & Schwank J. (2004). Electrical conductivity
response of polypyrrole to acetone vapor: effect of dopant anions and interaction
mechanisms. Synth. Met., 140, 15-21.
143. Milella, E., Musio, F. & Alba, M.B. (1998). Polypyrrole LB multilayer sensitive
films for odorants. Thin Solid Films, 285, 908-910.
144. de Souza, J.E.G., Neto, B.B., dos Santos, F.L., de Melo, C.P., Santos, M.S. &
Ludermir, T.B. (1999). Polypyrrole based aroma sensor, Synthetic Metals, 102(1-3)
1296-1299.
145. Guadarrama, A., Rodríguez-Méndez, M.L., de Saja, J.A & Olías, J.M. (2000).
Array of sensors based on conducting polymers for the quality control of the aroma of
the virgin olive oil, Sensors and Actuators B, 69, 276-282.
146. Gupta, M. Kam, M., Pacheco, N. & Weisman R. (2005). “Surfactants” Final
Report Week 3, www.seas.upenn.edu/courses/belab/LabProjects/2005/FRPTM4E5.doc
accessed on 23rd March 2007.
147. Kudoh, Y. (1996). Properties of polypyrrole prepared by chemical
polymerization using aqueous solution containing Fe2(SO4) and anionic surfactant,
Synthetic Metals, 79, 17-22.
88
148. Ruangchuay, L., Sirivat, A. & Schwank, J. (2004). Selective conductivity
response of polypyrrole-based sensor on flammable chemicals, Reactive and
Functional Polymers, 61, 11-22.
149. Jun, H.K., Hoh, Y.S., Lee, B.S., Lee, S.T., Lim, J.O., Lee, D.D. & Huh, J.S.
(2003). Electrical properties of polypyrrole gas sensors fabricated under different
conditions, Sensors and Actuators B, 96, 576-581.
150. Barisci, J.N., Wallace, G.G., Andrews, M.K., Partridge, A.A. & Harris, P.D.
(2002). Conducting polymer sensors for monitoring aromatic hydrocarbons using an
electronic nose, Sensors and Actuators B, 84, 252-257.
151. James, D., Scott, S.M., Ali-, S.Z. & O’Hare, W.T. (2005). Chemical Sensors for
Electronic Nose Systems, Microchimica Acta, 149, 1-17.
152. Rocco, A.M., De Paoli, M-A., Zanelli, A. & Mastragostino, M. (1996). An
electrochromic device combining polypyrrole and WO3 –I. Liquid electrolyte,
Electrochimica Acta, 41(18), 2805-2816.
153. De Paoli, M-A., Zanelli, A., Mastragostino, M. & Rocco, A.M. (1997). An
electrochromic device combining polypyrrole and WO3 –II. Solid state device with
polymeric electrolyte, J. Electroanalytical Chemistry, 435, 217-224.
154. Applied Sensor Sweden AB, Linköping, Sweden, http://www2.nose-
network.org/members/2_Chemical_sensors.doc, accessed on 24th March, 2007.
155. Thomas, A.O. & Lester, J.N. (1993). The microbial remediation of former
gasworks sites: a review, Environ. Technol. 14, 1–24.
156. Bagheri, H., Babanezhad, E., Es-haghi, A., (2007). An aniline-based fiber
coating for solid phase microextraction of polycyclic aromatic hydrocarbons from
water followed by gas chromatography-mass spectrometry, Journal of
Chromatography A, xxx, xxx–xxx (in press).
89

157. Potin, O., Veignie, E. & Rafin, C. (2004). Biodegradation of polycyclic aromatic
hydrocarbons (PAHs) by Cladosporium sphaerospermum isolated from an aged PAH
contaminated soil, FEMS Microbiology Ecology, 51, 71–78.
158. Agency for Toxic Substances and Disease Registry (ATSDR), (1995).
Toxicological profile for polycyclic aromatic hydrocarbons, Atlanta, GA: U.S.
Department of Health and Human Services, Public Health Service.
159. Wilson, S.C. & Jones, K.C. (1993). Bioremediation of soil contaminated with
polynuclear aromatic hydrocarbons (PAHs): a review. Environ. Pollut. 81, 229–249.
160. Commission Recommendation of 4 February, 2005 on the further investigation
into the levels of polycyclic aromatic hydrocarbons in certain foods. Off. J. Eur.
Union, L34, 43-45.
161. Veyrand, B., Brosseaud, A., Sarcher, L., Varlet, V., Monteau, F., Marchand, P.,
Andre, F. & Bizec, B.L. (2007). Innovative method for determination of 19 Polycyclic
Aromatic Hydrocarbons in food and oil samples using gas chromatography coupled to
tandem mass spectrometry based on an isotope dilution approach, Journal of
Chromatography A (2007), doi:10.1016/j.chroma.2007.03.043.
162. Barek, J., Muck, A., Wang, J. & Zima, J. (2004). Study of voltammetric
determination of carcinogenic 1-nitropyrene and 1-aminopyrene using a glassy carbon
paste electrode, Sensors 4, 47-57.
90

Chapter Three
Analytical Techniques and Experimental Procedures
This chapter gives a synopsis on the different analytical techniques employed,
detailed research methodology and general experimental procedures for the chemical
and electrochemical preparation, characterization and application of the modified
polypyrrole electroactive materials.
3.1 Analytical techniques
The analytical techniques used in this study are electrochemical techniques namely,
cyclic voltammetry (CV), Oyster-young square wave voltammetry (OSWV),
differential pulse voltammetry (DPV) and electrochemical impedance spectroscopy
(EIS); spectroscopic techniques namely Ultra Violet-Visible spectroscopy (UV-Vis),
Fourier transform infra red spectroscopy (FTIR), substractively normalised in-situ
Fourier transform infra red spectroscopy (SNIFTIRS); and morphological technique
which was mainly scanning electron microscopy (SEM).
3.1.1 Electrochemical techniques
Two broad electrochemical techniques were used in these studies namely:
voltammetric and impedimetric techniques. The merits derivable from the techniques
used are discussed below.
3.1.1.1 Cyclic Voltammetry
Cyclic voltammetry (CV) is the most widely used electrochemical technique for the
characterisation of redox systems. It provides information about the number of
oxidation states, as well as qualitative information about the stability of these
oxidation states and quantitative information about the rates, mechanisms and the
electron transfer kinetics [1]. Modern electroanalytical measurements are normally
91

performed with software driven potentiostats, two examples of which are shown in
Fig. 3.1.
(a) AUTOLAB Voltammetric instrument
(b) CV 50 Voltammetric instrument.
Figure 3.1: Typical electroanalytical instrument used for cyclic voltammetry [2].
92

In a CV experiment, as in other controlled potential experiments, a potential is applied
to the system, and the faradaic current response, resulting from a redox reaction is
measured. The potential is cycled between a pre-determined potential window from
an initial potential, Ei, to a final (switching) potential, Ef, at a constant scan rate (ca.
from 1 mV/s to a few thousand mV/s). By varying the potential limits, the reactivity
of the electrochemical system is probed over a large range of potentials in a single
sweep. Also by varying the sweep rate, the kinetics of the reactions and/ or mass
transfer processes is probed [3]. The potential scan may be terminated at the end of
the first cycle or continued for any number of cycles leading to a multisegment
voltammogram. The cycling could be done oxidatively (increasing potential) or
reductively (decreasing potential) [4]. The forward half of the CV is identical to a
linear-sweep voltammogram. When the potential is scanned in a positive direction,
the electroactive species at the surface of the electrode is oxidised and if it is scanned
in the negative direction, they are reduced. The oxidation generates a current response
as a result of the depletion of species at the electrode surface. The plot of the applied
potential vs. the resulting currents provides characteristic peak potentials for both
oxidation (Ep,a) and reduction (Ep,c), and their corresponding peak currents (Ip,a and
Ip,c) respectively. The peak width at half the peak current (Ep1/2) is also sometimes
measured. This characteristic feature of the voltammogram provides information
about the redox (formal) potential of a system denoted as E°′ [4].
The chemical processes involved in redox cycling are complicated, thus, the CV could
be reversible (limited by diffusion); irreversible (completely limited by kinetics) i.e.
the reverse reaction is so slow at electrode potentials larger than the redox potential;
or quasi-reversible (partially limited by kinetics) [3]. A redox couple in which both
species rapidly exchange electrons with the working electrode is termed an
electrochemically reversible couple. Figure 3.2 shows typical cyclic voltammogram
for the electrochemical oxidation and reduction process. The formal reduction
potential (E°′) for a reversible or quasi-reversible couple is at the mid-point of Ep,a and
Ep,c on the voltammogram and it is commonly determined from equation 3.1 [1, 4].
E°′ = (Ep,a + Ep,c) / 2 equation 3.1
93

Figure 3.2: Typical cyclic voltammogram for the electrochemical oxidation and
reduction process.
The number of electron transferred (n) can be determined from the separation between
Ep,a and Ep,c (∆Ep) using equation 3.2 [1, 4].
∆Ep = (Ep,a - Ep,c) = 0.059 / n equation 3.2
Thus, for a one electron process, a ∆Ep of 0.059 V will be expected.
The number of electrons transferred (n) can also be determined via Tafel plots. This
plot relates the generated current to the overpotential, η, in an exponential manner
similar to the Arrhenius and Eyring equations. At a fixed temperature, T, the Tafel
equation is:
I = a + b exp η equation 3.3 [1].
A plot of log10 I (as ‘y’) against overpotential, η, (as ‘x’), called Tafel plot is usually
linear over a narrow range of potentials and only valid for high overpotential. As a
general rule it is stated that the Tafel equation is valid for η > 118/n mV, where n is
the number of electrons exchanged [5].
94
For low overpotentials, the Buttler Volmer approach is applied whereby the net
current (Inet) from the oxidation and reduction is given by equation 3.4 [1, 4].
Inet = Io [exp (α n F η/RT) - exp (1-α n F η/RT)] equation 3.4
Where Io is the exchange current representing the rate constant of electron transfer at
zero overpotential, α is the transfer coefficient, F is the Faradays constant, R is the
molar gas constant and T is the operating temperature in Kelvin. The actual value of
this current (Inet) is affected by many additional factors, most importantly the
concentration of the redox species, the size, shape, and material of the electrode, the
solution resistance, the cell volume, and the number of electrons transferred.
Cyclic voltammetry can also provide information about the rate of electron transfer
between the electrode and the analyte, and the stability of the analyte in the
electrolyzed oxidation states (e.g., do they undergo any chemical reactions). For a thin
layer of adsorbed electro active material at the electrode surface undergoing Nerstian
reaction, the plot of peak current values versus scan rates for both cathodic and anodic
peaks respectively show linear dependence. This is in accordance with Brown-Anson
model, equation3.5, from which the surface concentration of the various redox states
could be estimated [4, 6, 7].
Ip = n2 F2Γ*Aν / 4RT equation 3.5
Ip = Peak current for either the oxidation or reduction peak being considered
n = Number of electrons transferred
F = Faraday constant (96584 C mol-1)
Γ* = Surface concentration of the electroactive film bound to the working
electrode
A = Surface area
ν = Scan rate (Vs-1)
R = Gas constant (8.314Jmol-1K-1)
95

T = Temperature of the system (K).
By varying the scan rates (Vs-1) of the process, the diffusion coefficient, De, (which
tells how rapidly the electroactive species is diffusing through the solution to and
from the surface of the working electrode) can be calculated using the Randles-Sevčik
equation [4, 7],
Ip = - 0.4463 n F (nF/RT) 1/2 Γ* De1/2 ν1/2 A equation 3.6
This reduces to equation 3.7 at 25 °C for A in cm2, De in cm2/s, Γ* in mol/L, and ν in
V/s, Ip in amperes
Ip = 2.686 x 10⁵ n3/2 A Γ*De1/2 ν1/2
equation 3.7
Accordingly, Ip increases with ν1/2 and is directly proportional to concentration. The
relationship to concentration is of particular interest in analytical applications and in
studies of electrode mechanisms. A plot of Ip versus ν1/2 should give a straight line
from which De can be evaluated. For a reversible system, the values of Ipa and Ipc
should be identical for a simple reversible (fast) couple. However, the ratio of the
peak currents can be significantly influenced by chemical reactions coupled to the
electrode process.
The standard rate constant (kº) for electron transfer within the polymer chain could be
estimated using Nicholson treatment for a quasi-reversible electrochemical system
The net shape of the voltammetric curves have been shown to depend on a kinetic
parameter φ which is given by the expression:
φ = [(DO/DR) α/2 kº / (π.n. De.F. ν/RT) 1/2] equation 3.8
where for simplicity the diffusion coefficient (De), for the oxidized (O) and reduced
(R) forms of the solution phase probe redox couple are equal, i.e. DO = DR = De; This
simplifies to:
96
kº = φ (α. n. F. ν. π. De / RT) ½ equation 3.9 [7].
For a typical reversible system, α = 0.5. As the systems turns from reversible to
irreversible, there is a transition in the magnitude of α and ΔEp. For 0.3 < α < 0.7, the
ΔEp values are nearly independent of α and depend only on φ. Thus estimates of kº
could be made using the tabulated values of φ for different values of scan rates [4].
A numerical analysis of the diffusion boundary value problem for cyclic voltammetry
has established a quantitative analysis of the relationship between the kinetic
parameter φ and the voltammetric peak separation ΔEp. This has been plotted as a
working curve and result summarised for reference purposes in different literatures [4,
7, 8]. While a ΔEp value of 61 mV gives a φ value of 20 at 25oC, the φ values at 63
mV and 212 mV are 7 and 0.10 respectively [4]
3.1.1.2 Oyster-young square wave voltammetry (OSWV)
The theory of SWV was invented by Ramaley and Krause in 1969 [9] but was only
extensively developed by Osteryoung and co-workers in 1986 [10]. The technique
involves the application of square wave modulation to a constant or nearly constant dc
potential, and the current generated is sampled at the end of successive half cycles of
the square wave. Three currents are generated, vis: forward current from the forward
pulse (if), the reverse current from the reverse pulse (ir) and that for the net current (Id)
vs. the potential on the corresponding staircase tread. The net current serves better
analytical usage than the forward and reverse currents because it increases the
discrimination against the charging current, since any residual charging current is
subtracted out. Figure 3.3 shows the OSWV containing the forward, reverse and
reverse currents. The net current is larger than that for the forward and reverse current
since it is the difference between them [11]. The peak height is directly proportional
to the concentration of the electroactive species and direct detection limits as low as 1
x 10–8 M is possible as against 5 x 10⁻⁸ M differential pulse voltammetry and 1 x 10⁻⁵
M in cyclic voltammetry [1].
SWV has many advantages over other differential techniques such as much faster
scan times, excellent sensitivity, the rejection of background current, high signal to
97
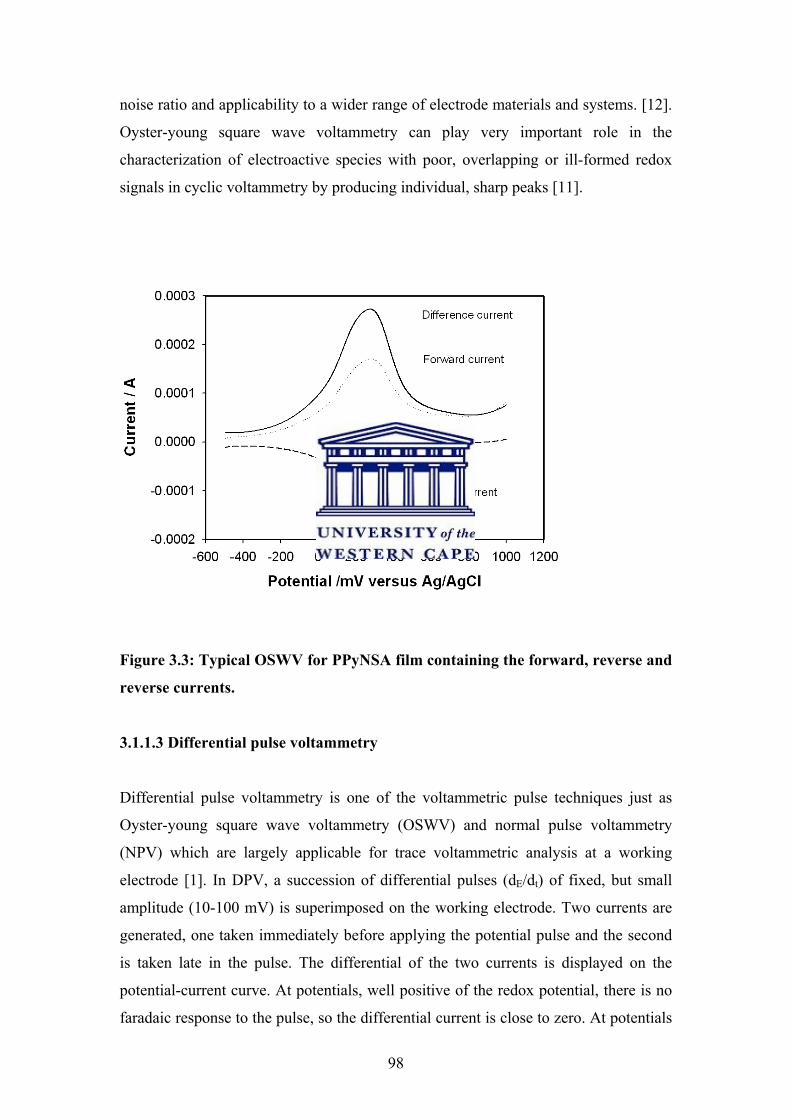
noise ratio and applicability to a wider range of electrode materials and systems. [12].
Oyster-young square wave voltammetry can play very important role in the
characterization of electroactive species with poor, overlapping or ill-formed redox
signals in cyclic voltammetry by producing individual, sharp peaks [11].
Figure 3.3: Typical OSWV for PPyNSA film containing the forward, reverse and
reverse currents.
3.1.1.3 Differential pulse voltammetry
Differential pulse voltammetry is one of the voltammetric pulse techniques just as
Oyster-young square wave voltammetry (OSWV) and normal pulse voltammetry
(NPV) which are largely applicable for trace voltammetric analysis at a working
electrode [1]. In DPV, a succession of differential pulses (dE/dt) of fixed, but small
amplitude (10-100 mV) is superimposed on the working electrode. Two currents are
generated, one taken immediately before applying the potential pulse and the second
is taken late in the pulse. The differential of the two currents is displayed on the
potential-current curve. At potentials, well positive of the redox potential, there is no
faradaic response to the pulse, so the differential current is close to zero. At potentials
98

around the redox potential, the differential current reaches a maximum and decreases
towards zero, as the current becomes diffusion-controlled. The current response is
therefore a symmetrical curve. Figure 3.4 shows a typical differential pulse
voltammogramm for a film of polypyrrole doped with 1, 2-naphthaquinone-4-
sulphonate (PPyNQS) on a platinum working electrode in an undegassed 0.1 M
LiClO4 at a scan rate of 5 mV/s and 25 mV amplitude. The peaks at the positive
potentials are characteristic for polypyrrole while the peaks at the negative potentials
are characteristic for dissolved oxygen in the electrolyte solution.
.
Figure 3.4: Typical potential-current curve for the anodic and cathodic
differential pulse voltammetric scan of polypyrrole in 0.1 M LiClO4 at a scan
rate of 5 mV/s and 25 mV amplitude.
Differntial pulse voltammetry is widely used for the identification of any electroactive
specie at the electrode surface, which will be largely used in characterising the
conducting polymers used in this work. Individual redox specie generates a
corresponding symmetrical peak. The potential of the peak can help identify the
cation in solution in a similar manner to normal polarography. The peak area is
proportional to concentration. The peak height could be used as approximation for the
99
estimation of an analyte’s concentration using the Osteryoung-Parry equation
(equation 3.10) [1].
ΔIp = (n2F2A/4RT). (D/πt) 1/2. Canalyte. ΔE equation 3.10
Where all terms have their usual meaning and t is the time between pulses. The
magnitude of ΔE and the rooted term in brackets, (D/πt) ½, implies that the separation
of potential and diffusion of analyte to the electrode plays important role in
determining the value of ΔIp which increases accuracy of the technique. DPV is very
versatile in its scope of application just as the OSWV. Its advantages over NPV are
twofold: (i) many analyte could be sampled with a single voltammogram since the
analytical peaks for each analyte are well resolved, and (ii) by working with a
differential current the sensitivity of the technique is improved. While the lower
detection limit for DPV is 10-8 to 5 x 10⁻⁸ M, that for NPV is only 10-7 to 10-8 M [1].
3.1.1.4 Electrochemical Impedance Spectroscopy
In cyclic voltammetry and other dynamic electroanalysis, an applied potential is either
constant (potentiostatic) or changing (potentiodynamic) when ramped at a constant
rate of V = dE/dt. However, in impedance, a small perturbing potential is applied
across a cell or sample that changes in a cyclic sinusoidal manner and generates a
current resulting from the overpotential (η) caused by the small displacement of the
potential from the equilibrium value. Over a time scale, the averaged over potential is
zero. Because the potential is only perturbing, it has the advantage of minimising the
concentration change after the experiment. The induced current alternates because the
voltage changes in a cyclic manner, and hence the term alternating current (AC). The
term impedance is therefore a measure of the ability of a circuit to resist the flow of
an alternating current (AC). It is synonymous to resistance (R) used in direct current
(DC), which is defined by Ohm’s law (equation 3.11) as the ratio between voltage (E)
and current (I) [1, 4].
R = E/I equation 3.11
100

During a controlled-potential electrochemical impedance spectroscopy (EIS)
experiment, the electrochemical cell is held at equilibrium at a fixed DC potential, and
a small amplitude (5–10 mV) AC wave form is superimposed on the DC potential to
generate a response from the equilibrium position. The response to the applied
perturbation, which is generally sinusoidal, can differ in phase and amplitude from the
applied signal. This response is measured in terms of the AC impedance or the
complex impedance, Z, of the system, which permits analysis of electrode process in
relation to diffusion, kinetics, double layer, coupled homogeneous reactions, etc [13].
The ratio of the applied voltage (E) over measured current (I) is the impedance of the
system (Z = E/I). Since an AC potential is applied to the cell, there will probably be a
phase shift by an angle (φ) between the applied AC potential waveform and the AC
current response. Therefore, the impedance can be represented using a vector diagram
(figure 3.5) displaying the in-phase and out-of-phase impedances, the total
impedance, and the phase angle (φ).
Figure 3.5: Sinusoidal current response to potential perturbation as a function of
time.
Depending on the AC perturbation, the potential and current functions at a particular
frequency could be represented by the equations 3.12 and 3.13:
101

E(t) = Eo sin (ωt) equation 3.12
and,
I(t) = Io sin (ωt + φ) equation 3.13.
Where E(t) is the potential at t, Eo is the amplitude of the signal, and ω is the radial
frequency (radians/second) defined as 2 π f with f being the frequency in hertz, I(t)
and Io represent the response current signal and amplitude respectively. Using ohms
law, an analogous expression for the impedance could be derived by substituting
equations 3.12 and 3.13 into equation 3.11 as shown below:
Z = Et/It = Eo sin (ωt)/ Io sin (ωt +φ) equation 3.14
Z = Zo * sin (ωt)/ sin (ωt +φ) equation 3.15
Since complex number terminology is involved when analyzing impedance spectra,
the in-phase and out-of-phase impedances are often referred to as real and imaginary
impedances. The complex impedance (Z) is made up of a resistive or real part Z′,
attributable to resistors (in phase with the applied voltage), and a reactive or
imaginary part Z′′, attributable to the contributions of capacitors (out of phase with
the applied voltage by π/2) and /or inductors (out of phase with the applied voltage by
-π/2). This is related to the resistance (R), reactance (X) and capacitance (C) by the
equation:
Z = R – j X equation 3.15
where X = 1/ωC and ω = 2 π f. R is the resistance measured in Ohms (Ω), X the
reactance, C the capacitance measured in Farads (F), ω the applied angular frequency
measured in rad/s and f is the frequency measured in Hertz (Hz) [4].
Notational representation of this in terms of Z′ and Z" is given by:
102
Z = Z′ - j Z′′ where j = √-1 equation 3.16
Because Z is defined by the complex term, j, which determines the contribution of Z′′
to Z, the term complex impedance is often used. For a pure resistor that is not having
any capacitance, its resistance when determined with a continuous current (DC) is R
because its impedance is frequency independent, Z = Z′ = R.
The experimental data collated from an impedance experiment is often presented as
Nyquist plot of Z′ (usually positive x-axis corresponds to the real impedance), versus
Z′′ (usually, the positive y-axis correspond to -Z"), over a wide frequency range
(normally 100 kHz to 0.1 Hz). Another way of presenting impedance data is a Bode
plot in which the logarithm of the absolute value of Z′ and the phase (φ) are plotted
against the logarithm of the frequency (f) [14]. This could be plotted together or
separately. Nyquist plots is more commonly displayed for historical reasons, the data
is however often poorly resolved (particularly at high frequencies), and the explicit
frequency dependence is not displayed. In contrast, the Bode plot directly displays the
frequency dependence; in addition, the data is well resolved at all frequencies, since a
logarithmic frequency scale is used.
When the frequency of the AC waveform is varied over a wide range of frequency (ca
about 10-4 and > 106 Hz), the impedance obtained for the system is a function of the
operating frequency. Spectrums of the resulting impedance at different frequencies do
reveal the different electrochemical kinetics involved in the system. While dipolar
properties are manifest at the high frequency regions, bulk and surface properties will
be evident at intermediate and low frequencies respectively [14]. The total impedance
of a system is determined by the impedances of the various components of the
electrochemical cell; for example, electron transfer kinetics, diffusion, passivating
layers, etc. The relative contribution of the various components typically varies with
frequency; for example, electron transfer kinetics may dominate at high frequencies,
whereas diffusion may dominate at lower frequencies.
Measuring impedance over a wide frequency range allows processes with different
time scales to be detected within the same experiment. The Nyquist plot obtained for
103
a particular system could therefore be used for both qualitative and quantitative
analysis. Some important electrochemical parameters about a NCP can be
simultaneously gotten from a single experiment at a known level of charge. This
includes charge transfer at the metal (electrode) /film interface, the rate of charge
transfer in the film, ohmic resistance, double layer capacitance and redox capacitance
of the film and even the potential dependence of the diffusion coefficient for ionic and
electronic charge carriers [4, 14]. To achieve this, the practical constraint is choosing
the appropriate equivalent circuit and an accurate fitting procedure to obtain the
different variables.
While qualitative information could be obtained by mere inspection of the EIS
spectrum, quantitative information requires proper use of appropriate software (Z-
View or Z-Plot) to model the electrical components of the system to equivalent
electrical circuits. One common method is based on the principle of equivalent circuit;
that is, the various cell components can be modeled using electronic components (e.g.,
a resistor for electron transfer kinetics and solution resistance, and a capacitor for the
interfacial (double layer) capacitance), and an electronic circuit can be built that gives
the same impedance spectrum as the electrochemical cell. This approach requires that
each equivalent circuit element corresponds to a component of the electrochemical
cell and a good match must exist between the experimental impedance spectrum and
the model impedance spectrum over the entire frequency range, otherwise the
equivalent circuit has no meaning.
Impedance data is commonly analysed by fitting it to an equivalent circuit model. The
frequently used circuit, called the Randles equivalent circuit is composed of different
elements such as resistors, capacitors, and inductors joined in series and/or in parallel.
Figure 3.6a shows the Nyquist plot for the real impedance (x-axis) and imaginary
impedance (y-axis) with low frequency data being on the right side of the plot and
higher frequencies are on the left. A typical Nyquist plot for the impeadnace data
obtained on platinum electrode in ferricyanide solution is shown in Fig 3.6b. The
semicircular shape is characteristic of a single "time constant". A representative plot
of frequency as x-axis versus logarithm of real impedance as y1-axis, and phase angle
as y2-axis called (Bode plot) is presented in Figure 3.7 for impedance spectra obtained
104
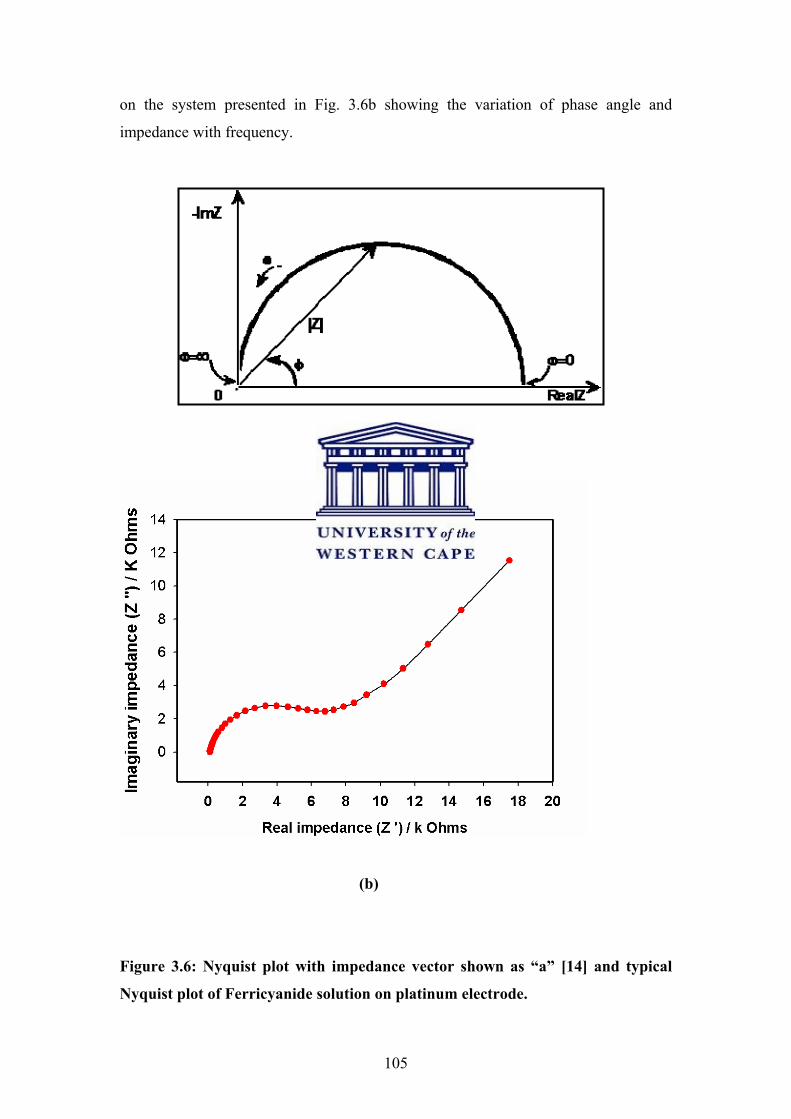
on the system presented in Fig. 3.6b showing the variation of phase angle and
impedance with frequency.
(a)
(b)
Figure 3.6: Nyquist plot with impedance vector shown as “a” [14] and typical
Nyquist plot of Ferricyanide solution on platinum electrode.
105

10m 1 100 10K
100
300
1K
3K
10K
30K
100K
-90
-75
-60
-45
-30
-15
0
frequency / Hz
|impedance| / Ω phase / o
Figure 3.7: Typical Bode plot of Ferricyanide solution on platinum electrode
showing variation of impedance and phase angle with changes in frequency.
Electrochemical Impedance plots often contain several time constants, but often only
a portion of one or more of their semicircles is seen. The shape varies depending on
the equivalent electrical circuits for the system. Fig. 3.8 is a typical equivalent circuit
of a capacitor and a resistor in parallel. This is discussed further underneath.
C1
R1
Figure 3.8: Equivalent circuit of a capacitor and a resistor in parallel (one time
constant).
3.1.1.4.1 Electrical circuit elements
Any electrochemical cell can be represented in terms of an equivalent electrical circuit
that comprises a combination of resistances and capacitances. There could also be
106

contribution of inductances at very high frequencies. Contributions to the resistance of
a cell are the solution resistance (Rs), the charge transfer resistance (Rct), Warburg
impedance (Zw) while contribution to the capacitance could be as a capacitor (C) and
constant phase element (CPE) [1, 14]. These elements are described briefly
underneath.
Solution resistance (Rs): The solution resistance is the resistance between the
working electrode and the reference electrode. This is indicated as a small offset on
the real impedance axis. It is measured at high frequency intercept near the origin of
the Nyquist plot. The resistance of an ionic solution depends on the ionic
concentration and type of ions the electrolyte is made up, temperature and the
geometry of the area in which current is carried. In a bounded area with area A and
length l carrying a uniform current the resistance is defined as:
equation 3.17
The conductivity of the solution, k, is more commonly used in solution resistance
calculations. Its relationship with solution resistance is:
equation 3.18
The units for k are siemens per meter (S/m). The siemens is the reciprocal of the ohm,
(1 S = 1/ohm).
Charge transfer resistance (Rct): This is the resistance associated with the charge
transfer mechanisms for electrode reactions. It is the resistance to electron transfer at
the electrode interface. It is deduced from the kinetically controlled electrochemical
reaction at low over-potentials. From the Buttler-Volmer equation (equation 3.4), the
net current (Inet) from the oxidation and reduction reactions is:
Inet = Io [exp (α n F η /RT) - exp (1-α n F η /RT)] equation 3.4 [1, 4].
When (n F η /RT) is well below unity, the Buttler-Volmer equation could be
linearised to obtain
107

I = Io n F η / RT equation 3.19 [4]
And also in terms of over-potential (η) and concentration terms for oxidised, reduced
and equilibrium states for a one electron redox process,
η = RT/F [CO (0, t)/CO* – CR
(0, t)/CR* + i /io] equation 3.20 [4].
Hence, when the over-potential, η, is very small and the electrochemical system is at
equilibrium, the expression for the charge transfer resistance for an n-electron process
changes into:
equation 3.21 [3, 4].
From this equation the exchange current density (Io) can be calculated when Rct is
known. The charge transfer resistance is estimated from the diameter of the
semicircular region on the real impedance axis of the Nyquist plot. When the
chemical system is kinetically sluggish, the Rct will be very large and may display a
limited frequency region where mass transfer is a significant factor. However, if the
system is so kinetically facile, and the mass transfer always plays a role, the
semicircular region is not well formed [4].
Warburg Impedance (ZW): This is the resistance associated with the diffusion of
ions across the electrode/electrolyte interface. This impedance is associated with the
difficulty of mass transport of electroactive species [13]. Layers of ions at the
electrode interface behave like an RC element (i.e. a resistor and a capacitor in
parallel) and this produces infinite sum of RC elements called the Warburg
impedance. It is characterised as a linear portion at an angle of 45° and slope of unity
on the Nyquist plot and a slope of -0.5 on the Bode plot [1].
Capacitor (C): The capacitance (C) is the ability of an electrochemical system to
store or retain charge. An electrical double layer exists on the interface between an
electrode and its surrounding electrolyte. This double layer is formed as ions from the
solution "stick on" the electrode surface. The potential at the terminals of this double
108
layer (capacitor) is proportional to its charge. The impedance of a capacitor is given
by the equation
Z (C) = Z′′ = 1/jωC equation 3.22
Constant phase element (CPE): A constant phase element is a non-intuitive circuit
element that was invented while looking at the response of real-world systems. Often,
a CPE is used in a model in place of a capacitor due to deviation of capacitance
parameters from expected values. In some systems the Nyquist plot was expected to
be a semicircle with the center on the x-axis. However, the observed plot may be an
arc of a circle with the center being some distance below the x-axis. These depressed
semicircles have been linked to a number of phenomena, depending on the nature of
the system being investigated. This behaviour was traced to the non-homogeneity of
the system or that there is some distribution (dispersion) of the value of some physical
property of the system. The impedance of a CPE is represented by equation
CPE = equation 3.23 [15]
= 1 / (C jω) α equation 3.24 [13]
This is similar to that of a capacitor except that the constant A = 1/C (the inverse of
the capacitance) and the exponent α = 1 for a true capacitor. For a constant phase
element, the exponent α is less than one. When α = 0.5, a 45° line is produced on the
complex plane graph and could be used for an infinite length of Warburg element.
During circuit fitting, the CPE is defined by two values, i.e., the capacitance, C, and
the CPE exponent, α, which has a value between 0.5 and 1 for a non-ideal capacitor.
If n equals 1, the equation is identical to that of a capacitor and smaller values can be
related to surface roughness and in-homogeneities, which lead to frequency
dispersion.
3.1.1.4.2 Impedance modeling using equivalent electrical circuit
Jiri Janata [16] has identified three major points to be considered in equivalent circuit
analysis for chemiresistors as follows:
109

(a) Description of individual physical processes by realistic electrochemical
circuit elements;
(b) Arrangement of this elements in a rationally constructed equivalent circuit;
(c) Optimisation of the values of the elements in the equivalent circuit such that
the overall transfer function (response) matches the response of the real cell.
The external current flowing in an electrochemical cell (voltaic cell) made up of two
metal electrodes A and B (figure 3.9) serving as contact to an electrolyte solution of
their salt is given by the equation
Icell (ω) = Ecell (ω)/Zcell (ω) equation 3.25 [16]
Figure 3.9: General representation of an electrochemical cell.
The overall cell impedance is sum of the impedances in the path of the cell current,
Zcell (ω) = ZA + ZB + ZElectrolyte equation 3.26 [16]
Considering the commonest combination of a capacitor and a resistor arranged in
parallel, the flow of current will be divided into two branches, namely: IR and IC in
line with Kirchoff’s law.
. ICell = IR + IC equation 3.27
110
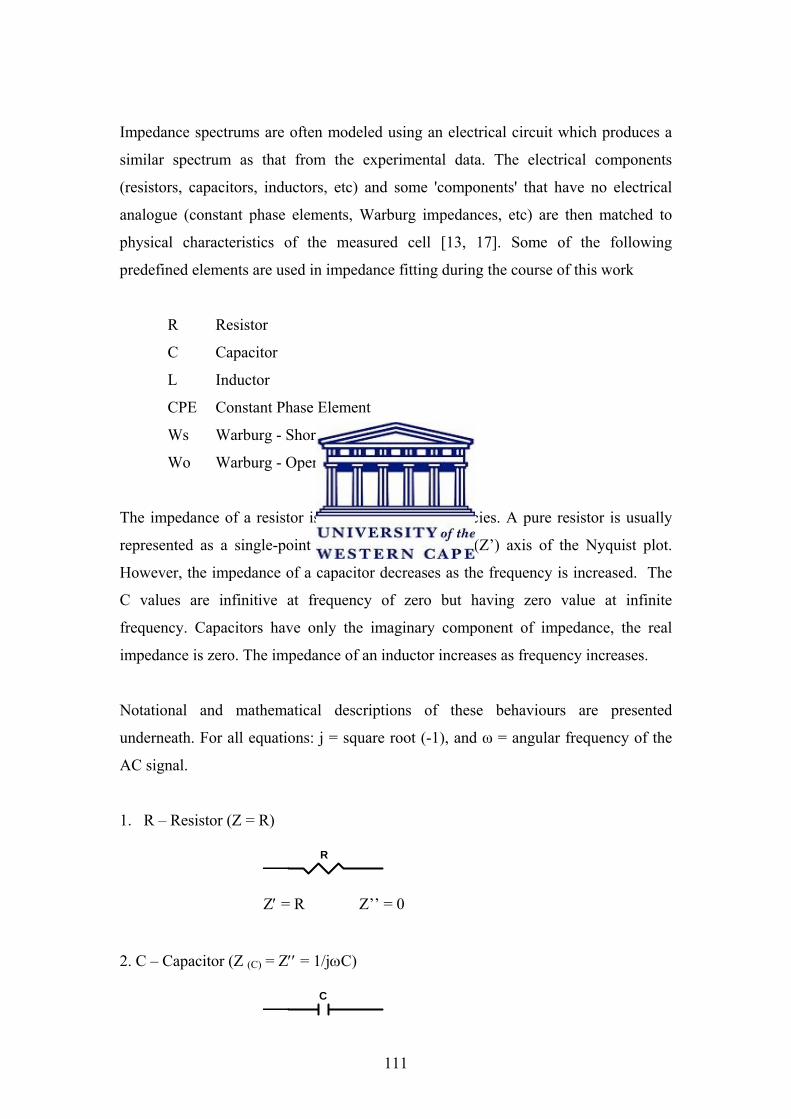
Impedance spectrums are often modeled using an electrical circuit which produces a
similar spectrum as that from the experimental data. The electrical components
(resistors, capacitors, inductors, etc) and some 'components' that have no electrical
analogue (constant phase elements, Warburg impedances, etc) are then matched to
physical characteristics of the measured cell [13, 17]. Some of the following
predefined elements are used in impedance fitting during the course of this work
R Resistor
C Capacitor
L Inductor
CPE Constant Phase Element
Ws Warburg - Short Circuit Terminus
Wo Warburg - Open Circuit Terminus
The impedance of a resistor is constant at all frequencies. A pure resistor is usually
represented as a single-point on the real impedance (Z’) axis of the Nyquist plot.
However, the impedance of a capacitor decreases as the frequency is increased. The
C values are infinitive at frequency of zero but having zero value at infinite
frequency. Capacitors have only the imaginary component of impedance, the real
impedance is zero. The impedance of an inductor increases as frequency increases.
Notational and mathematical descriptions of these behaviours are presented
underneath. For all equations: j = square root (-1), and ω = angular frequency of the
AC signal.
1. R – Resistor (Z = R)
R
Z′ = R Z’’ = 0
2. C – Capacitor (Z (C) = Z′′ = 1/jωC)
C
111
Z′ = 0 Z′′ = 1/jωC
3. L = Inductor (Z = jωL)
L
Z′ = 0, Z′′ = ωL
4. CPE = Constant Phase Element
CPE
Z = 1 / (C jω) α
For kinetically favoured reactions, Rct → 0 and Zw predominates and for difficult
reactions Rct → ∞ and Rct predominates. When other steps are involved in the
electrode process, homogeneous or heterogeneous, more complicated circuits are
involved. A simple circuit commonly used is the Randles circuit (Figure 3.10).
Rs Cd
Z
Figure 3.10: Randles circuit for a simple electrochemical cell. Rs is the solution
resistance, Z is the impedance of the electrode process and Cd is the double layer
capacity.
Various combinations of appropriate circuits in series or/and parallel will be explored
in modeling the reactivities at wide range of frequencies for the polypyrrole materials
and sensors using Z-View software.
The impedance and capacitance generated by the perturbation of a stationary working
electrode with small AC voltage (5 – 10 mV) amplitude provides bulk and interfacial
electrical information on the material connected to the transducer. When this
perturbation is done over a large range of frequencies (ca. 106 to 10-4 Hz), a spectrum
112
for the various electro-kinetics involved in the system will be reflected at different
frequency regions [4]. While dipolar properties of solid materials will be revealed at
high frequencies, bulk and surface properties becomes evident at medium and low
frequencies [14]. In the production of an impedance sensor for selective hydrocarbon
gas sensing, Hagen et al used a normalized impedance parameter Sn, to follow the
interfacial reaction at a novel zeolite based electrode [18]. The methodology involved
measuring deviations of the magnitude of Z at a time t (Zt) from a value without
hydrocarbon at time t = 0, (Z0) divided by the hydrocarbon concentration at time t = t,
(Zt). The sensor effect in this work is based on similar normalized real impedance
(Sn), and/or that of the normalized real capacitance (Kn) as shown in equation 3.28
and 3.29.
Sn = |Zt| - |Z(t = 0)| equation 3.28 [18]
|Z(t = 0)|
Kn = |Ct| - |C(t = 0)| equation 3.29 [18]
|C(t = 0)|
3.1.2 Spectroscopic techniques (UV-Vis, FTIR, SNIFTIRS)
Two broad spectroscopic techniques were employed in this study, namely: Ultra
Violet-Visible spectroscopy (UV-Vis) and Fourier transform infra red spectroscopy
FTIRS. In-situ FTIR studies were also carried out using substractively normalised in-
situ Fourier transform infra red spectroscopy (SNIFTIRS).
3.1.2.1 Ultra Violet-Visible spectroscopy (UV-Vis)
UV – Vis absorption spectra were recorded at room temperature on a GBC UV/ Vis
920 spectrophotometer (GBC Scientific Instruments, Australia) between 200 and 900
nm using a 1-cm path length quartz cuvette and 99.6% dimethyl sulfoxide (DMSO) or
dimethyl formamide (DMF) as reference solvent. UV-Vis measurements were made
with the filtrate obtained from dispersions of the polymer materials in appropriate
113
solvent. Spectra obtained in each case were processed and investigated for
characteristic absorptions that could be linked to the electrochemistry of the materials.
The band gap peculiarities of the materials were explored using the wavelengths of
maximum absorption.
3.1.2.2 Fourier Transform Infra Red (FTIR)
The Fourier Transform Infra Red (FTIR) spectra were recorded on a Perkins Elmer
FT-IR Spectrometer, Paragon 1000PC. In each case, less than 0.0010 g of each
polymer was ground in a medium of 0.4 g of dried KBr salt, and placed in the pallet to
obtain a fairly transparent pellet. The spectra were recorded in the wavenumber region
of 400 to 4000 cm-1. The characteristic set of absorption bands in the spectrum were
used to identify various functional groups predominating in the various polymeric
states.
3.1.2.3 Subtractively Normalized Interfacial Fourier Transform Infrared
Spectroscopy (SNIFTIRS) [19, 20, 21]
Subtractively normalized interfacial Fourier transform infrared spectroscopy
(SNIFTIRS) measurements were performed in the staircase mode using a fully
evacuated FTIR spectrometer (Bruker IFS113v) fitted with a mercury cadmium
telluride (MCT) photo detector and Ge/KBr beam splitter. Thin film of polypyrrole
was subjected to SNIFTIRS analysis using a three-electrode cell similar to the cyclic
voltammetry set-up. The reflectance data on the film at the working electrode was
collected at different applied potential using a manually controlled potentiostat. A
calomel reference electrode was used and a platinum ring electrode fitted on the
inside of the custom made FTIR electrochemical cell, served as counter electrode.
During the in situ measurements of FTIR spectra the surface of the working electrode
was positioned very close to the CaF2 window and parallel to it in order to limit the
influence of solvent on the spectra.
Spectra were obtained at potentials from 0 mV to 600 mV at 100 mV intervals.
Spectra were also recorded at selective potentials in the reverse direction as a check
on the reversibility of the modified polymer. Spectra were obtained by Fourier
transformation after averaging 200 interferograms acquired at each potential, using p-
114

polarised radiation. Infrared spectra have been normalized with respect to the
reference spectrum collected at 0 mV and are displayed as ΔR/R difference spectra
(the ratio of the signals obtained at potentials Ei and Eref and that obtained at the
reference potential Eref) in units of reflectance, since no logarithm was applied [20].
Subtractively normalized in-situ FTIR spectra obtained in this way therefore, contain
only information of the molecular changes occurring from modification of the
oxidation state of the polymer. Negative bands were interpreted as indicative of
absorption by species generated as the potential is changed to Ei, while upward peaks
were interpreted as the disappearance of initial species [21].
3.1.3 Morphological technique (SEM)
Scanning electron microscopy was used for morphological investigation in this study.
Polypyrrole samples were examined under a scanning electron microscope (Hitachi
X650 Micro-analyzer) with interchangeable accelerating voltages of 10kV to 30kV
for optimum sensitivity. In the SEM experiment, about 0.01g of the polypyrrole
sample was spiked onto a carbon coated sample holder charged with gold to improve
surface electrical conductivity. The charged sample is subsequently transferred into
the micro-analyzer where it is transversed by electron beam. The signals produced are
collected by an appropriate detector, amplified and displayed on the cathode ray tube
at different magnifications. The magnification of the image is the relationship
between the length of the scan line on the specimen and that on the cathode ray tube.
Energy Dispersive X-ray (EDX) spectra and the elemental analysis for carbon,
oxygen and sulphur were captured on the polymers micrograph by stigmation of the
relevant area on the micrograph where the nanoparticles were assayed.
3.2 Chemical synthesis procedures and characterization of polypyrrole
nanomaterials.
The general experimental procedure used for the chemical synthesis of polypyrrole
was as described in literature [22-26]. This involved usage of different dopants,
temperature, concentrations of dopant and oxidant in the mother liquor, etc.
Polypyrrole was prepared from distilled water, hydrochloric acid, β-naphthalene
sulphonic acid, sodium salt of 1, 2-napthaquinone-4-sulphonic acid, tungsten oxide
and zirconium oxide. The characterisation techniques are as described previously.
115
3.2.1 Chemicals
All chemicals used in this study were purchased from Sigma – Aldrich (Pty) Ltd.,
South Africa. The pyrrole (98%) was re-distilled at reduced pressure and saturated
with argon atmosphere and stored in 1 mL ampoules in the dark at 4 oC. β-
naphthalene sulphonic acid (70%), sodium salt of 1, 2-napthaquinone-4-sulphonic
acid (BDH laboratory reagent), ammonium peroxodisulfate (98%), acetone (99.8%),
hydrochloric acid (32%), and methanol (99.8%) were used without further treatment.
Deionised-distilled water used was prepared with Milli-Q water purification apparatus
(Millipore). Solvents used for spectroscopic studies are 99.6% dimethyl sulfoxide
(DMSO) or N, N-Dimethylformamide (DMF)-A.C.S spectrophotometric grade.
3.2.2 Chemical synthesis of β-naphthalene sulphonic acid doped polypyrrole
(PPyNSA); polypyrrole from distilled water (PPyDW); and polypyrrole from
HCl (PPyHCl)
A series of polypyrroles was synthesized by varying the reaction conditions reported
for the chemically synthesized polypyrrole doped with dodecyl-benzene sulphonic
acid (DBSA) [22, 23]. β-Naphthalene sulphonic acid was used as surfactant and
dopant [24, 25, 26]. In a typical procedure for the preparation of PPyNSA from a
dopant to monomer mole concentration ratio (d/m) of 0.8 and an oxidant (APS) to
monomer concentration ratio (o/m) of 0.2, 1.059 mL (0.015 mol) of pyrrole was
dissolved and stirred in 20 mL aqueous solutions of 3.5696 g (0.012 mol) of NSA at
60 oC while stirring for 15 min. The reaction solution was cooled and 10 mL aqueous
solution of oxidant (APS) containing 0.7607 g (0.0030 moles), was added and stirred
for 24 hr at 0 oC. The beakers were rinsed with distilled water to make up the total
volume of liquor to 50 mL. Similarly various polypyrroles were synthesized using
d/m mole concentration ratios of 0.5 and 1 and o/m mole concentration ratios of 0.5
and 1 at 0 oC and room temperature of 25 oC. Control experiments were performed in
NSA-free aqueous solutions (HCl or water) of the monomer to produce NSA-free
polypyrroles tagged PPyDW or PPyHCl. Polymerization process was terminated in
each case by the addition of excess methanol and the liquor allowed to age. The
resulting polypyrrole precipitate was vacuum filtered and washed sequentially with
excess distilled water, methanol and acetone until a colourless filtrate was obtained.
116
The precipitates obtained were dried in a vacuum oven at 25 oC for 12 hours. The
apparent yield (g/mL) was determined by calculating the weight (g) of dry powder to
initial volume (mL) of monomer.
The table showing relative amounts of materials used for the separate preparations is
presented underneath (Table 3.1). The results from these syntheses were used to
investigate the following:
Effect of pH on polypyrrole synthesis
Effect of temperature on polypyrrole synthesis
Effect of type, presence and concentration of dopant on polypyrrole synthesis
Effect of concentration of oxidant on polypyrrole synthesis
Morphological examination of polypyrrole from different synthetic conditions
Spectroscopic examination of polypyrrole from different synthetic conditions
Electrochemistry and application of chemically synthesised polypyrrole
117
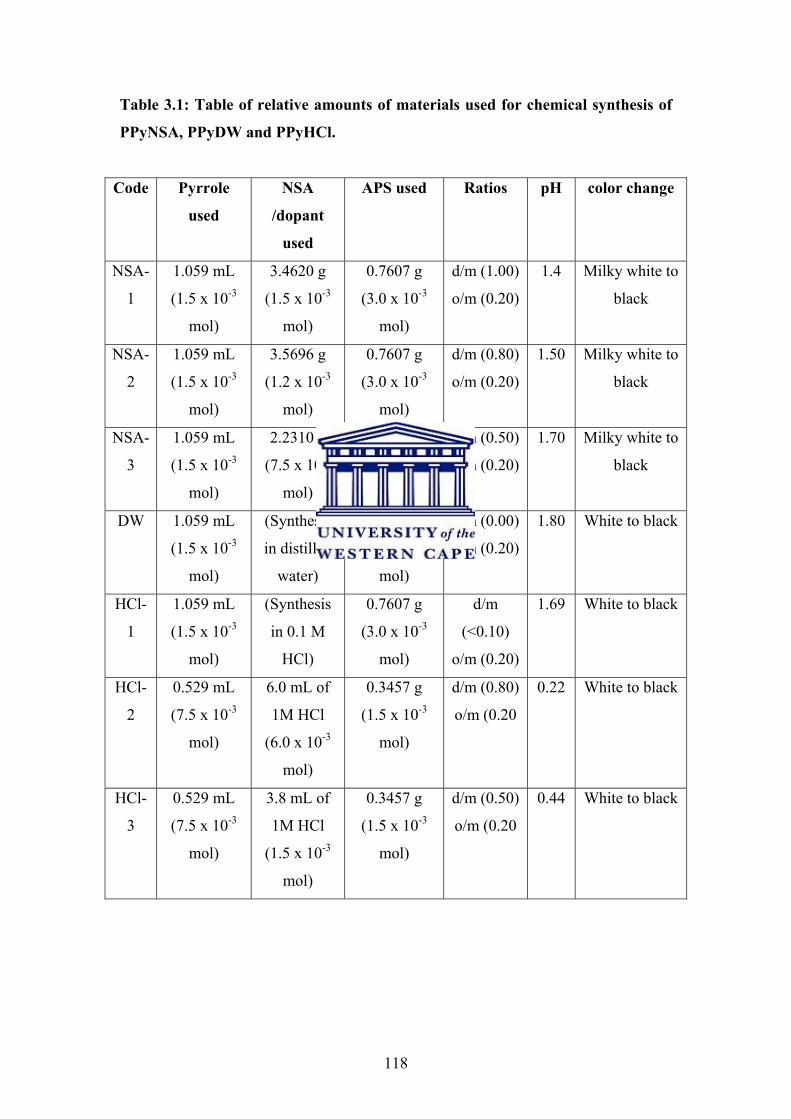
Table 3.1: Table of relative amounts of materials used for chemical synthesis of
PPyNSA, PPyDW and PPyHCl.
Code Pyrrole
used
NSA
/dopant
used
APS used Ratios pH color change
NSA-
1
1.059 mL
(1.5 x 10⁻³
mol)
3.4620 g
(1.5 x 10⁻³
mol)
0.7607 g
(3.0 x 10⁻³
mol)
d/m (1.00)
o/m (0.20)
1.4 Milky white to
black
NSA-
2
1.059 mL
(1.5 x 10⁻³
mol)
3.5696 g
(1.2 x 10⁻³
mol)
0.7607 g
(3.0 x 10⁻³
mol)
d/m (0.80)
o/m (0.20)
1.50 Milky white to
black
NSA-
3
1.059 mL
(1.5 x 10⁻³
mol)
2.2310 g
(7.5 x 10⁻³
mol)
0.7607 g
(3.0 x 10⁻³
mol)
d/m (0.50)
o/m (0.20)
1.70 Milky white to
black
DW 1.059 mL
(1.5 x 10⁻³
mol)
(Synthesis
in distilled
water)
0.7607 g
(3.0 x 10⁻³
mol)
d/m (0.00)
o/m (0.20)
1.80 White to black
HCl-
1
1.059 mL
(1.5 x 10⁻³
mol)
(Synthesis
in 0.1 M
HCl)
0.7607 g
(3.0 x 10⁻³
mol)
d/m
(<0.10)
o/m (0.20)
1.69 White to black
HCl-
2
0.529 mL
(7.5 x 10⁻³
mol)
6.0 mL of
1M HCl
(6.0 x 10⁻³
mol)
0.3457 g
(1.5 x 10⁻³
mol)
d/m (0.80)
o/m (0.20
0.22 White to black
HCl-
3
0.529 mL
(7.5 x 10⁻³
mol)
3.8 mL of
1M HCl
(1.5 x 10⁻³
mol)
0.3457 g
(1.5 x 10⁻³
mol)
d/m (0.50)
o/m (0.20
0.44 White to black
118

3.2.3 Chemical synthesis of 1, 2-naphthaquinone-4-sulfonate doped polypyrrole
(PPyNQS)
Using the same experimental procedure as in 3.2.2 above, 1,2-naphthaquinone-4-
sulfonate doped polypyrrole (PPyNQS) were prepared using the sodium salt of 1, 2-
napthaquinone-4-sulphonic acid as the surfactant dopant and pyrrole monomer in
aqueous solution of hydrochloric acid (acting as the supporting electrolyte). It has
been observed that when a chemical material which on its own could orchestrate the
oxidation of monomer is used as dopant in very small amounts, the subsequent
polymerisation would be on the nanofibre seeds of the dopant and not necessarily on
the surfactant acting as a polymerisation template [27]. Usage of NQS has intrinsic
property of being able to pre-oxidize pyrrole to form nanofibres which generate the
bulk polymer with further oxidation with the APS, or with the application of potential.
Following the over-oxidation observed in the use of a d/m ratio of 0.8, and o/m ratio
of 0.2, lower doping ratios were explored to arrive at an optimised d/m ratio of 0.05
and o/m ratios of 0.2 and 1. This study investigated preparations using d/m mole
concentration ratios of 0.8 and 0.05; and o/m mole concentration ratios of 1.0 and 0.2
at 0 oC based on the optimised conditions established from 3.2.2. Table 3.2 presents
the summary of relative amounts of materials used for the preparations.
In a typical preparation of PPyNQS using d/m mole concentration ratios of 0.8 and
o/m mole concentration ratios of 1.0 at 0 oC, 0.529 mL (0.0075 mol) of pyrrole was
dissolved and stirred in 20 mL aqueous solutions 1.540 g (0.0060 mol) of NQS at 60 oC while stirring for 15 min. The reaction solution was cooled and 10 mL aqueous
solution of oxidant (APS) containing 1.7287 g (0.075 mol), was added and stirred for
24 hr at 0 oC. Similarly, using d/m mole concentration ratios of 0.8 and o/m mole
concentration ratios of 0.2 at 0 oC, 0.529 mL (0.0075 mol) of pyrrole was dissolved
and stirred in 20 mL aqueous solutions 1.540 g (0.0060 mol) of NQS at 60 oC while
stirring for 15 min. After cooling, 10 mL aqueous solution of oxidant (APS)
containing 0.3457 g (0.0015 mol), was added and stirred for 24 hr at 0 oC. Synthesis
using d/m mole concentration ratios of 0.05 and o/m mole concentration ratios of 0.2
at 0 oC involved use of 0.529 mL (0.0075 mol) of pyrrole and 0.0982 g (3.776 x 10⁻⁴
mol) of NQS as described earlier. Control experiments were performed in NQS-free
aqueous solutions of the monomer to produce NQS-free polypyrroles tagged PPyDW.
119
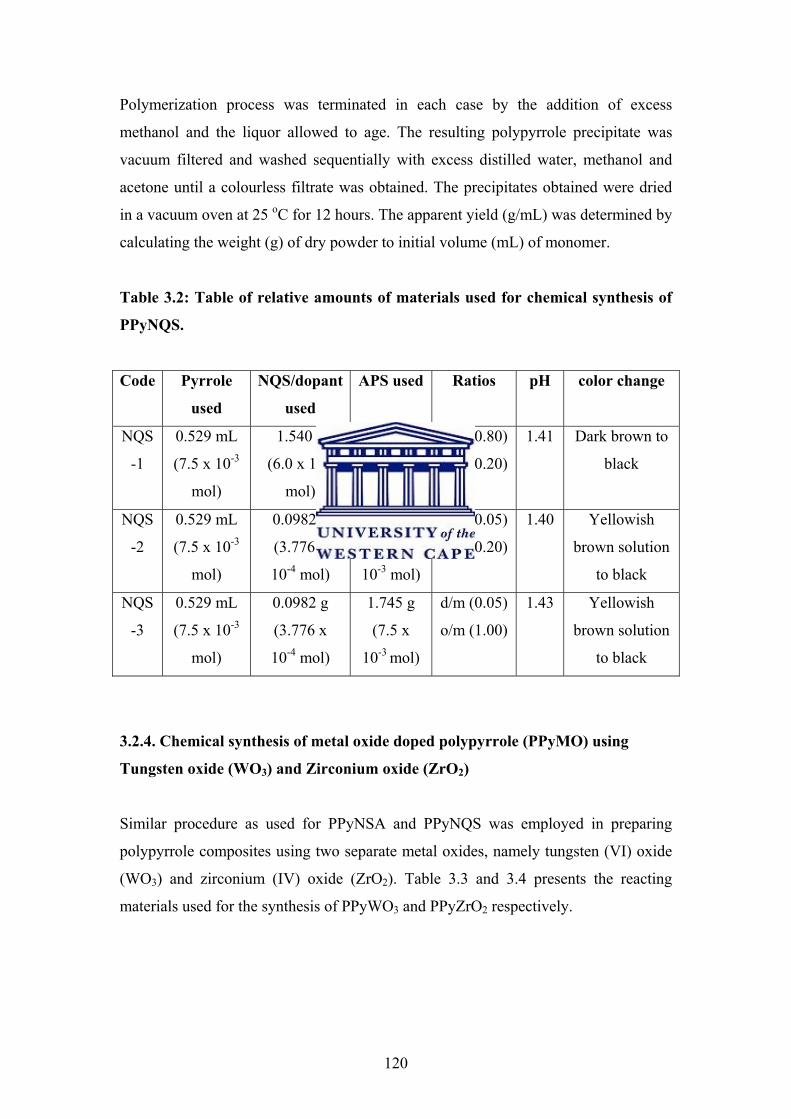
Polymerization process was terminated in each case by the addition of excess
methanol and the liquor allowed to age. The resulting polypyrrole precipitate was
vacuum filtered and washed sequentially with excess distilled water, methanol and
acetone until a colourless filtrate was obtained. The precipitates obtained were dried
in a vacuum oven at 25 oC for 12 hours. The apparent yield (g/mL) was determined by
calculating the weight (g) of dry powder to initial volume (mL) of monomer.
Table 3.2: Table of relative amounts of materials used for chemical synthesis of
PPyNQS.
Code Pyrrole
used
NQS/dopant
used
APS used Ratios pH color change
NQS
-1
0.529 mL
(7.5 x 10⁻³
mol)
1.540 g
(6.0 x 10⁻³
mol)
0.3457 g
(1.5 x 10⁻³
mol)
d/m (0.80)
o/m (0.20)
1.41 Dark brown to
black
NQS
-2
0.529 mL
(7.5 x 10⁻³
mol)
0.0982 g
(3.776 x
10-4 mol)
0.3484 g
(1.5 x
10-3 mol)
d/m (0.05)
o/m (0.20)
1.40 Yellowish
brown solution
to black
NQS
-3
0.529 mL
(7.5 x 10⁻³
mol)
0.0982 g
(3.776 x
10-4 mol)
1.745 g
(7.5 x
10-3 mol)
d/m (0.05)
o/m (1.00)
1.43 Yellowish
brown solution
to black
3.2.4. Chemical synthesis of metal oxide doped polypyrrole (PPyMO) using
Tungsten oxide (WO3) and Zirconium oxide (ZrO2)
Similar procedure as used for PPyNSA and PPyNQS was employed in preparing
polypyrrole composites using two separate metal oxides, namely tungsten (VI) oxide
(WO3) and zirconium (IV) oxide (ZrO2). Table 3.3 and 3.4 presents the reacting
materials used for the synthesis of PPyWO3 and PPyZrO2 respectively.
120
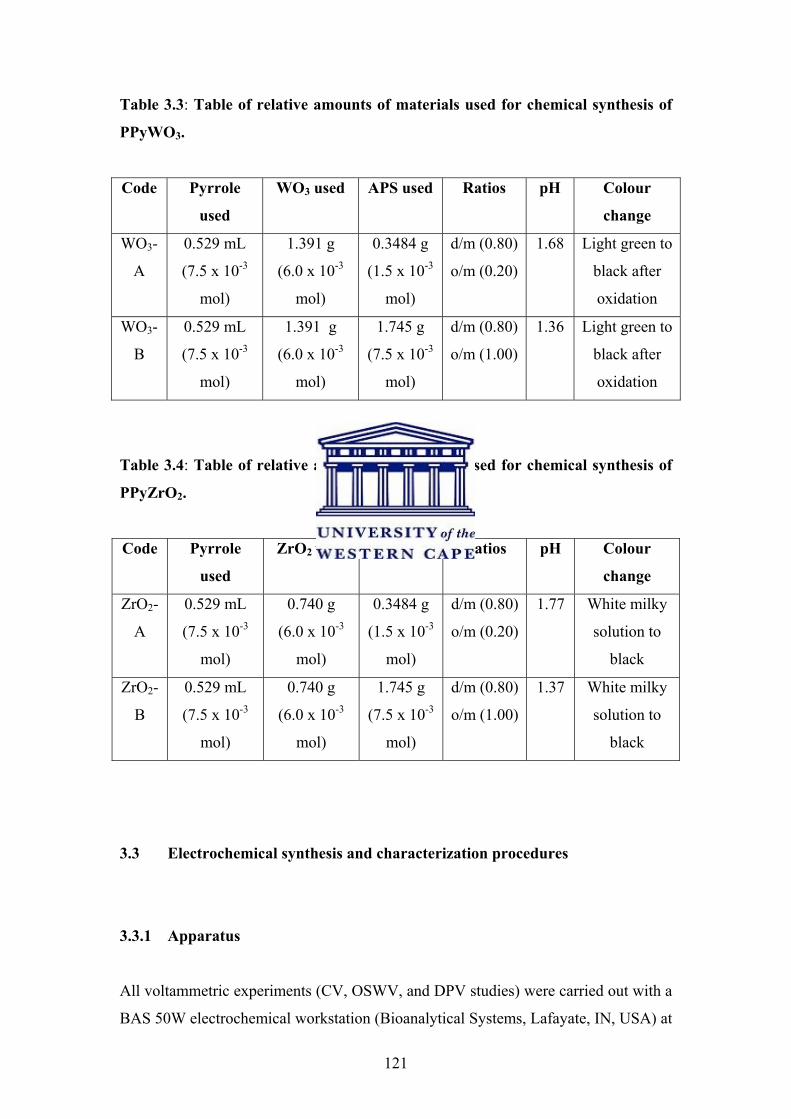
Table 3.3: Table of relative amounts of materials used for chemical synthesis of
PPyWO3.
Code Pyrrole
used
WO3 used APS used Ratios pH Colour
change
WO3-
A
0.529 mL
(7.5 x 10⁻³
mol)
1.391 g
(6.0 x 10⁻³
mol)
0.3484 g
(1.5 x 10⁻³
mol)
d/m (0.80)
o/m (0.20)
1.68 Light green to
black after
oxidation
WO3-
B
0.529 mL
(7.5 x 10⁻³
mol)
1.391 g
(6.0 x 10⁻³
mol)
1.745 g
(7.5 x 10⁻³
mol)
d/m (0.80)
o/m (1.00)
1.36 Light green to
black after
oxidation
Table 3.4: Table of relative amounts of materials used for chemical synthesis of
PPyZrO2.
Code Pyrrole
used
ZrO2 used APS used Ratios pH Colour
change
ZrO2-
A
0.529 mL
(7.5 x 10⁻³
mol)
0.740 g
(6.0 x 10⁻³
mol)
0.3484 g
(1.5 x 10⁻³
mol)
d/m (0.80)
o/m (0.20)
1.77 White milky
solution to
black
ZrO2-
B
0.529 mL
(7.5 x 10⁻³
mol)
0.740 g
(6.0 x 10⁻³
mol)
1.745 g
(7.5 x 10⁻³
mol)
d/m (0.80)
o/m (1.00)
1.37 White milky
solution to
black
3.3 Electrochemical synthesis and characterization procedures
3.3.1 Apparatus
All voltammetric experiments (CV, OSWV, and DPV studies) were carried out with a
BAS 50W electrochemical workstation (Bioanalytical Systems, Lafayate, IN, USA) at
121
room temperature. Electrochemical impedance spectroscopy (EIS) measurements
were performed with a PGZ402 Voltalab Analyzer (Radiometer Analytical S.A,
France). A conventional three-electrode cell was used. The electrodes were a 0.0201
cm2 platinum disc or 0.0707 cm2 glassy carbon disc as working electrode (WE), a
platinum wire auxiliary electrode (AE) and a Ag/AgCl (3 M NaCl type) reference
electrode (RE). The WE was cleaned by polishing on slurries of 1.0 μm, 0.3 μm and
0.05 μm alumina powders (Bueller, IL, USA) placed on individual alumina pads, and
rinsed with deionised water obtained by passing distilled water through a Milli-Q
water purification apparatus (Millipore). The surface of the disc WE was polished by
using circular motions on the pad containing 1.0 μm followed by 0.3 μm slurry and
then 0.05 μm slurry. Intermittently between usages, the electrodes were treated in hot
concentrated H2SO4 and 30% H2O2 and washed with distilled deionised water. The
counter electrode (AE) was cleaned between each experiment by heating in a Bunsen
flame, washed and rinsed with copious amount of deionised water. The reference
electrode was rinsed in deionised water between each experiment.
3.3.2 Electrochemical synthesis procedures of modified polypyrrole
While bulk quantities of intrinsically conducting polypyrrole are prepared from
chemical synthesis, thin films of the polymer is preferably electrosynthesised on
suitable working electrodes by careful control of the nature of electrolyte, dopants,
anodes and electrochemical window. Careful control of film thickness and extent of
oxidation is very crucial during processing to avoid over-oxidation of polypyrrole and
subsequent loss of electroactivity. Potentiodynamic and potentiostatic polymerisation
methods were used. However, the potentiodynamic approach was preferred as it gave
more uniform and reproducible results during the course of the research.
Potentiostatic approach was explored during the optimisation of processing conditions
for PPyNSA.
3.3.3 Electrolyte and potential window for polypyrrole synthesis
An initial screening for an appropriate choice of electrolyte for the electrosynthesis
and characterisation of polypyrrole involved use of different concentrations of
hydrochloric acid and sulphuric acid. Films of polypyrrole were prepared from 0.1 M
122
solutions of freshly distilled pyrrole in an ionic solution of 0.1 M HCl with or without
other dopants such as surfactants metal oxides. The choice of 0.1 M HCl was based
on the clear and unambiguous potential window between -400/700 mV which allowed
for characterisation of peaks resulting from polypyrrole within the same potential
window. Use of sulphuric acid (H2SO4) as electrolyte was marred with multiple peaks
resulting from the dual ionisation of the dibasic acid at low scan rates. The choice of a
an electrolyte concentration of 0.1 M HCl was based on the finding that higher
concentration of 0.5 M and 1M HCl causes undesirable and accelerated oxidation of
the pyrrole monomer before application of potential. Besides, ion transportation that
is required for effective polymerisation takes place better in more dilute solutions
according to Debye Huckel theory. It was the satisfactory performance of the 0.1M
HCl as electrolyte/supporting electrolyte that warranted its choice as the electrolyte
medium in this work. In some application stage use of 0.05 M HCl or 0.01 M HCl
was used as reaction medium for sensor reaction.
Potentiodynamic polymerisation of polypyrrole using a potential limit of 500 mV or
less does not generate any polymer. A minimum potential of 600 mV must be applied
to initiate the polymerisation process. Care was taken to avoid over-oxidation of the
polymer by growing the film at the lowest possible upper potential limit between 600
mV to a maximum of 800 mV. At about 850 mV, the irreversible oxidation of
polypyrrole set in. This was in agreement with literature [28]. Further care to avoid
over-oxidation of the polymer was to purge the electrolyte properly by de-gassing
with a gentle flow of argon gas for 15 min prior to usage and keeping the argon
atmosphere on the electrolyte during polymerisation and characterisation processes.
The films were grown potentiodynamically with a scan rate of 50 mV/s. In most cases
a lower and higher scan rates from this do not generate desirable quality of film. The
electrosynthesised films were dried in air for about 2 min prior to characterisation in
fresh hydrochloric acid solution.
3.3.4 Polypyrrole electrosynthesis from aqueous solution of HCl and product
characterization.
The polypyrrole films were prepared by potentiodynamic cycling from 0.1M pyrrole
in 0.1M HCl which had been properly ultrasonicated. Depending on the electrode
123

material, appropriate potential window were chosen for polymerization and
characterization. All the electrochemical characterization (CV, OSWV, DPV, EIS)
were done in an electrolyte solution of 0.1M HCl.
3.3.5 Polypyrrole electrosynthesis from aqueous solution of β-naphthalene
sulphonic acid and product characterization.
The polypyrrole films modified with β-naphthalene sulphonic acid were prepared by
potential cycling from a solution containing the 106-μL pyrrole-monomer (0.0015
mol) and 0.0893 g of β-naphthalene sulphonic acid -dopant (0.0003 mol) respectively
in 15 mL of 0.1 M HCl or 0.05 M HCl. This d/m concentration ratio of 0.2 gave a fair
trend of electropolymerisation of conductive polymer after several attempts to
electropolymerise using higher ratios as used for chemical synthesis failed. The
polymerization and characterization of PPyNSA were carried out separately on glassy
carbon electrode (GCE) and platinum (PtE) disc electrodes at a scan rate of 50 mV/s
using an optimised potential window of -600/+800 mV in 0.05 M HCl. While limited
interrogation could be achieved using voltammetric techniques, more intuitive
findings were obtained using EIS.
All the electrochemical characterizations (CV, OSWV, DPV, EIS) were done in an
electrolyte solution of 0.1M HCl.
3.3.6 Polypyrrole electrosynthesis from aqueous solution of 1, 2-
naphthaquinone-4-sulfonate and product characterization (PPyNQS)
A thin film of conducting polypyrrole was grown under potentiodynamic conditions
from a solution containing the 350-μL pyrrole monomer (0.0050 mol) and 0.130 g of
the sodium salt of 1, 2-napthaquinone–4-sulphonic acid-dopant (0.0005 mol)
respectively in 50 mL of 0.05 M HCl. This solution is made up of a dopant to
monomer concentration ratio of 0.1. Higher d/m ratios caused over-oxidation of
pyrrole. The solution from which the film was generated was then replaced with a
fresh electrolyte solution of 0.05 M HCl, in which all cyclic voltammetry experiments
were then performed. The potential window used for the polymerization and
characterization studies was -400 mV to 700 mV vs. Ag/AgCl. OSWV were
124

performed at 5 Hz at 25 mV square wave amplitude, and a potential step of 4 mV
from an initial potential, Ei, of -400 mV to a final potential, Ef, of 700 mV. DPV
experiments were performed at scan rates of 5, 10 and 20 mV at pulse amplitude of 25
mV. Similarly EIS interrogation of the electrochemical behaviour of the
electrosynthesised film was done at different stepping potentials.
3.3.7 Polypyrrole electrosynthesis from aqueous solution of metal oxide of
tungsten oxide and zirconium oxide
The exploration of the electrosynthesis of polypyrrole films modified with tungsten
oxide or zirconium oxide by potential cycling using platinum and glassy carbon
electrodes was inconclusive. A solution containing 0.529 mL (0.0075 mol) of pyrrole
and 1.391 g (0.0060 mol) of tungsten oxide in 50 mL of 0.1 M HCl was used for
PPyWO3. Similarly the preparation of the PPyZrO2 was explored using a solution
containing 0.529 mL (0.0075 mol) of pyrrole and 0.740 g (0.0060 mol) of zirconium
oxide in 50 mL of 0.1 M HCl. The optimisation of the polymerisation conditions for
the attainment of conductive polymer on the electrode surface was inconclusive.
3.3.8 Electrochemical characterization of chemically synthesised polypyrrole
Thin film of the chemically synthesized polypyrrole were generated from the aqueous
solution of the material via adsorbtion at the glassy carbon electrode (GCE) being
used as the working electrode. A 1- mL cell containing de-aerated saturated paste of
0.025 g of the black polypyrrole powder in 0.5 mL 0.1M HCl was cycled 20 times at
50mV/s from -500 to 1000 mV. The GCE modified with polypyrrole was
characterized by multiscan rate CV, OSWV, DPV and EIS in de-aerated 0.1M HCl.
OSWV was performed at 50 mV square wave amplitude, and 2 mV potential step
from an initial potential, Ei, of -400 mV to a final potential, Ef, of 900 mV. The
forward, reverse and net square wave responses were plotted for frequencies of 2, 3, 4
and 5 Hz. DPV experiments were performed at scan rates of 5 and 10 mVs-1 within
the same potential window. EIS measurements were performed using perturbation
voltage amplitude of 10 mV at different fixed potentials from -600 to 1000 mV in 100
mV or 200 mV intervals during sequential frequency scan from 105 to 10-1 Hz at room
temperature of 25 oC.
125
3.4 Sensor development
The test application using some of the prepared polymers as sensor materials for some
common pollutants in waste waters are presented underneath. The test applications
were based on amperometric and impedimetric transduction techniques.
3.4.1 Chemicals
The chemicals used as analytes in the test application of the sensor materials are
phenol (99%), benzidine (>98.0%) and naphthalene (99%) which were supplied by
Sigma – Aldrich (Pty) Ltd., South Africa.
3.4.2 Phenol sensing with GCE/PPYNSA (Amperometry)
Different concentrations of phenol were analysed in acidic solution containing phenol
using a thin film of β-naphthalene sulphonic acid doped polypyrrole (PPyNSA)
adsorbed on a glassy carbon electrode. The GCE/PPYNSA working electrode used for
phenol sensing was prepared as described in 3.3.8. The electrochemical cell was set
up by placing 1 mL 0.05 HCl (pH 1.2) in a 5 mL cell. The working, reference and
counter (Pt wire) electrode were placed in the solution and connected to the BAS 50
Potentiostat. The solution was degassed for 15 min with argon and an argon head-
space maintained at very low gas flow rate. Square wave voltammetry of the
GCE/PPYNSA working electrode was then measured at 5 Hz using 50 mV square
wave amplitude, and an initial potential, Ei, of -400 mV to a final potential, Ef, of 900
mV. Aliquots of 2.0 mM phenol (0.0471g in 250 mL) were then added to the cell
solution which was degassed (15 min) after each phenol addition, and SWV responses
recorded as described before. Amperometric curve for the GCE/PPYNSA sensor to
phenol addition was plotted from the square wave responses at 70 mV.
3.4. 3 Benzidine sensing with Pt/PPyNQS (Impedimetry)
Stock solution of 0.001 M of benzidine was prepared by dissolving 0.0184 g of
benzidine in 100 cm3 of distilled water (under continuous stirring for 3 hrs). From this
126

stock solution, aliquots (in μL) were drawn and added to the electrolyte in the cell and
used for sensor development. Proper interaction of the analyte with the polymer
surface was achieved by a gentle flow of argon being used for purging.
Impedance measurements
Different concentrations of benzidine in acidic aqueous solution were analysed using
a thin film of 1, 2-naphthaquinone-4-sulfonate doped polypyrrole (PPyNQS)
electrosynthesised on a platinum working electrode. The Pt/PPyNQS working
electrode used for benzidine sensing was prepared as described in 3.3.6. A PGZ402
Voltalab Analyzer (Radiometer Analytical S.A, France) was used for all the EIS
measurements using the same three-electrode cell arrangement and electrolyte as for
cyclic voltammetry. An AC amplitude of 5 mV was imposed on the potential applied
on the working electrode at a frequency range from 100 KHz down to 0.01 Hz at a
sampling rate of 10 points per frequency decade. A voltammetric cell containing 2
cm3 of 0.05 M HCl electrolyte was used for the application tests. EIS data was first
taken using 2 mL of 0.05 M HCl free of analyte and thereafter dosed with progressive
aliquots (in μL) of benzidine. All electrochemical measurements were taken under an
inert atmosphere of argon.
EIS data was modeled by fitting the impedance data using a simple RsR1C1-R2C2
circuit. These elements represents the solution resistance (Rs) between working and
reference electrode, a R1CPE1 parallel combination, where CPE is a constant phase
element, to model movement by electron hopping through the polymer film along the
polymer backbone, and a second R2C2 component in series representing the electrode
/solution interface. The CPE was modeled as a non-ideal capacitor. Thus two
simultaneous kinetics are involved, one involving the bulk polymer material which is
observable at high frequency and the other taking place within the electrolyte/polymer
interface at the low frequency end. The capacitance and impedance values at 10 KHz
for the bulk polymer data and the values obtained at 10 mHz as were used to represent
the electrolyte/polymer interface. The sensor effect was based on the normalized real
impedance (Sn), and/or that of the normalized real capacitance (Kn) using equations
3.28 and 3.29
127
3.4.4 Naphthalene sensing with Pt/PPyNQS (Impedimetry)
The naphthalene stock solution of 0.001 M was prepared by dissolving 0.0128 g in
about 5 cm3 of acetonitrile (to achieve solubility) and later made up to 100 cm3
solution in distilled water with continuous stirring for about 30 min. From this stock
solution, aliquots (in μL) were drawn and added to the cell and used for sensor
development. Proper interaction of the analyte with the polymer surface was achieved
by a gentle flow of argon being used for purging.
Impedance measurements
The procedure adopted for the impedimetric detection of naphthalene was as
described for benzidine in 3.4.2.
References
1. Monk, P.M.S. (2001). Fundamentals of Electroanalytical Chemistry, John Wiley &
Sons, New York, USA.
2.http://www.biol.paisley.ac.uk/marco/Enzyme_Electrode/Chapter1/Ferrocene_anima
ted_CV1.htm.
3. Girault, H.H. (2004). Analytical and Physical Electrochemistry, EPFL Press,
Marcel Dekker Inc., Italy.
4. Bard, A. J. & Faulkner, L. R. (2001). Electrochemical methods - Fundamentals and
Applications, John Wiley & Sons, Inc., 2nd edition, USA.
5. http://www.chm.bris.ac.uk/~cpdjr/teaching/level3/pwqh1.htm accessed on 22nd
March, 2007.
6. Brown, A. P. & Anson, F. C. (1977). Cyclic and differential pulse voltammetric
behaviour of reactants confined to the electrode surface, Anal. Chem., 49, 1589-1595.
128
7. Zanello, P. (2003). Inorganic Electrochemistry (Theory, Practice and Applications),
Royal Society of Chemistry, Cambridge, UK.
8. Nicholson, R. S. (1965). Theory and application of cyclic voltammetry for
measurement of electrode-reaction kinetics, Anal. Chem., 37, 1351–1355.
9. Ramaley, L. & Krause, M.S. –Jnr. (1969). Theory of square wave voltammetry,
Anal. Chem., 41, 1362-1365.
10. Osteryoung, J., O’Dea, J. J. (1986). Square-wave voltammetry. In:
Electroanalytical chemistry, Bard AJ (ed), 14, Marcel Dekker, New York, pp209-308
11. Williams-Dottin, A.R. (2001). Monosubstituted Squarate Ligands and their
transition metal and Lanthanide Complexes: Structural and Electrochemical Studies,
PhD Thesis in Chemistry, University of the West Indies, St. Augustine
12. Kounaves, S.P. (2007). Voltammetric Techniques: Chapter 37, Handbook of
Instrumental Techniques for Analytical Chemistry, pp709-725. In
http://www.prenhall.com/settle/chapters/ch37.pdf, accessed on 30th March, 2007].
13. Brett, C.M.A. & Brett, A.M.O. (2005). Electrochemistry Principles, Methods and
Applications, Oxford University Press, United States, New York.
14. Fernández-Sánchez, C., McNeil, C. J. & Rawson, K. (2005). Electrochemical
impedance spectroscopy studies of polymer degradation: application to biosensor
development. Trends in Analytical Chemistry, 24(1), 37–48.
15. http://www.gamry.com/App_Notes/EIS_Primer/EIS_Primer.htm accessed on 31st
march 2007.
16. Janata, J. (2002). Electrochemical sensors and their impedances: a tutorial,
Critical reviews in Analytical Chemistry, 32(2), 109-120.
129
17. Derek Johnson, Z-View version 2.2 software Help, Copyright © 1990-1999,
Scribner Associates, Inc.
18. Hagen, G., Dubbe, A., Rettig, F., Jerger, A., Birkhofer, T., Müller, R., Plog, C. &
Moos, R. (2006). Selective impedance based gas sensors for hydrocarbons using
ZSM-5 zeolite films with chromium (III) oxide interface, Sensors and Actuators B,
119, 441-448.
19. Viana, A.S., Abrantes, L.M., Jin, G., Floate, S., Nicholas, R.J. & Kalaji, M.
(2001). Electrochemical, spectroscopic and SPM evidence for the controlled
formation of self-assembled monolayers and organised multilayers of ferrocenyl alkyl
thiols on Au(111), Phys. Chem. Chem. Phys., 3, 3411-3419.
20. Martínez, Y., Hernandez, R., Kalaji, M. Márquez, O.P. & Márquez, J. (2004).
SNIFTERS study of the electrochemical oxidation of 1, 3-dimethoxybenzene on
platinum in acetonitrile/tetrabutilammonium electrolytes. J. Electroanal. Chemistry,
563, 145-152.
21. Xie, H., Yan, M. & Jiang, X. (1997). Transition of polypyrrole from electroactive
to electroinactive state investigated by use of in situ FTIR spectroscopy, Electrochim.
Acta, 42 (15), 2361.
22. Lee, J.Y., Kim, D.Y. & Kim, C.Y. (1995). Synthesis of soluble polypyrrole of the
doped state in organic solvents, Synthetic metals, 74, 103–106.
23. Turcu, R., Grecu, R., Brie, M., Peter, I., Bot, A. & Graupner, W. (2001).
Spectroscopic investigation of the electron delocalisation and molecular
conformational changes in polypyrrole induced by different doping ions, Studia
universitatis babes-bolyai, Physica, special issue, 216–222.
24. Yang, Y., Liu J. & Wan, M. (2002). Self-assembled conducting polypyrrole
micro/nanotubes, Nanotechnology, 13, 771-773.
130
25. Kassim, A., Basar, Z. B. & Mahmud H.N.M.E. (2002). Effects of preparation
temperature on the conductivity of polypyrrole conducting polymer, Proc. Indian
Acad. Sci (Chem. Sci.), 114(2), 155-162.
26. Wei, Z., Zhang, Z. & Wan, M. (2002). Formation mechanism of self –assembled
polyanaline micro/nanotubes, Langmuir, 18, 917–921.
27. Zhang X. and Manohar, S.K. (2004). Bulk synthesis of polypyrrole nanofibres by
a seeding approach, J. Am. Chem. Soc., 126, 12714-12715.
28. Yakovleva, A.A. (2000). Electrochemistry of polypyrrole films in aqueous
solutions: The character of the bond between the anion and the polymer matrix,
Russian Journal of Electrochemistry, 36(12), 1275-1282.
131

Chapter Four
Results and Discussion 1
Morphology, Spectroscopy, Electrochemistry and Application of
nanostructured polypyrrole-β-naphthalene sulphonic acid (PPyNSA)
composites
This chapter presents the results obtained on the chemical and electrochemical
preparation, characterization and application of polypyrrole modified with β-
naphthalene sulphonic acid (PPyNSA). The optimal synthesis conditions,
spectroscopy and electrochemistry of the NSA-doped polypyrrole nanotubes,
nanosheets and nanomicelles are discussed. The kinetics of the charge transfer
processes, the redox properties of the polymer and its suitability for as a chemical
sensor for phenol detection were also presented.
4.0 Introduction
The production of different kinds of conducting polymers in the form of nanotubes or
nanowires from metallic or organic constituents inside the void spaces of nanoporous
host material have received a lot of attention as a means of boosting electrical
properties of intrinsically conducting polymers [1-10]. Since the initial work by Wei
et al. [3] on the formation and self-assembly of Polyaniline (PANi) micro/nanotubes
by the use of surfactants as against the hitherto ‘template synthesis’ method, various
investigation have been made on the use of various surfactants for production of
nano-structured materials of polypyrrole and other conducting polymers [1-11]. Yang
(2002) [1] reported the production of self assembled micro and nanotubes of
conducting PPy using protonic organic acid dopants and proposed that dopant
micelles or pyrrole/dopant clusters act as template in the formation of the polymers
micro/nanotubes.
132
Kassim et al. [2] also reported that a higher conductivity was obtained from camphor
sulphonate doped PPY electrochemically synthesized at optimum temperature of 10 –
30 oC than those prepared at higher temperatures. The physical properties were
equally reported to be changing with the preparation temperature. Smooth and
coherent films were obtained at lower temperatures while rough and wrinkled surface
was found at higher temperatures when examined under a scanning electron
microscope (SEM).
Polypyrrole synthesis and electro-activity is affected by a number of experimental
conditions such as type of solvent, electrolyte concentration and type of electrode
material, current density, applied potential, polymerization time and temperature. The
optimization of these parameters to get nanostructured and reasonably stable PPy in
gaseous (air) and in aqueous media determines its potential application as electrode
materials for biosensors and chemical sensors amongst other applications [13-19].
The neutral form of polypyrrole is usually insulating but this can be switched
electrochemically into the conductive state by oxidative (p) or reductive (n) doping of
the monomer. The property of polypyrrole to switch reversibly from one oxidation
state to the other has led to a number of technological applications, including
secondary rechargeable batteries, fuel cells, chemical sensors, controlled drug
delivery, electrochromic and corrosion protection [11–19]. It also shows promise in
the remediation of electro-active pollutants and lot of environmental control
applications [20].
Despite the easy polymerization of pyrrole and the extensive π-conjugated polymer
chain of PPY, the application is often limited by its insolubility in aqueous and
organic solvents. Various efforts have been made to add or remove electrons from the
polymer’s backbone to generate a conductive state often described as doped PPy. The
use of bulky sulphonated organic acid dopants has been proposed as a means of
generating the ionic form (PPy+A-)x (Fig. 4.1) in which polypyrrole’s solubility is
enhanced [11], where A- is the bulky sulphonated organic acid anion and ‘x’ is the
number of pyrrole trimers constituting the polymer sheet. The dopant ion hosted by
the polymer improves the solubility of PPy in organic solvents. This is achieved by
the reduction of the inter- and intra-molecular interactions of the polymer chains by
the incorporation of the bulky polynuclear protonic organic acid surfactant [11].
133

Figure 4.1: Scheme for the ionic form of β–naphthalene sulphonic acid doped
polypyrrole.
The results obtained on the nanostructured polypyrrole-β-naphthalene sulphonic acid
(PPyNSA) composites prepared in this study is presented and discussed below.
4.1 Polymerization yield of PPyNSA
Preliminary investigation to ascertain the optimum conditions for the chemical
synthesis of PPyNSA was carried out at room temperature of 25 oC and at 0 – 5 oC.
The polymerisation yield obtained is as shown in Table 4.1 for polypyrrole doped
with NSA at dopant to monomer mole concentration ratios (d/m) of 1, 0.8, 0.5 and 0
in which no dopant is involved. In all cases an oxidant to monomer mole
concentration ratio (d/m) of 0.2 was used. There is a trend of higher yield from the
synthesis carried out at lower temperature with the doped system having more yield.
Table 4.1: Yield/Temperature profile for doped and undoped PPy [21]
Sample d/m mole
concentration ratio
used
Yield of
polypyrrole (g/ml)
at 25 oC
Yield of
polypyrrole (g/ml)
at 0 - 5 oC
PPyNSA 1 1.0 33 42
PPyNSA 2 0.8 35 44
PPyNSA 3 0.5 27 32
PPyDW 0 18 20
134
The optimum PPy yield of 44% was obtained for a d/m ratio of 0.8 while the lowest
yield of 18% was obtained for the undoped polymer prepared at room temperature.
This higher yield pattern observed for the doped system is due to the ability of NSA to
generate enough radicals through protonation of the pyrrole monomers that initiates
the cationic polymerisation of PPy. The NSA equally forms micelles in aqueous
solution using its hydrophilic sulphonic acid group to combine with the hydrophobic
pyrrole monomers acting as templates in the formation of micro/nanotubes [1]. The
result shows that the efficiency of the polymerization reaction is highest at the d/m
ratio of 0.8. Lee et al. [4] had reported optimum synthesis with an apparent PPy yield
of 42% for a d/m ratio of 0.5 using dodecyl benzene sulphonic acid (DBSA) as dopant
and a synthesis temperature of 00C for the same polymerization time of 24 hours.
These results are quite comparable. The lower yield value of 32% for PPyNSA-2
when a d/m ratio of 0.5 was used in comparison with the yield of 42% for PPyDBSA
from similar d/m ratio of 0.5 cited above might be due to the higher steric hindrance
associated with the bulkier binuclear naphthalene moiety compared to the
mononuclear DBSA group.
Optimisation of chemical synthesis conditions
In order to further investigate the effect of processing conditions on the preparation of
NSA-doped polypyrrole, a series of experiments were performed with 0.1M pyrrole
using different mole-concentration ratios of dopants (HCl or NSA) and oxidant
(APS). The effect of reaction medium (pH, heating, electrolyte concentration etc.) on
polymerization yield was investigated for polypyrroles prepared in oxidant alone
(PPyDW), HCl and oxidant (PPyHCl), and NSA and oxidant (PPyNSA) at different
synthesis conditions (Table 4.2). A higher yield of polypyrrole is obtainable at low
temperature synthesis of 0 – 5 oC in all cases. The yield was further increased with an
initial heating of the NSA – Pyrrole solutions at 50 – 60 oC for 15 minutes and
cooling before the addition of the oxidant than when there was no heating. This
preparation procedure enhanced the production of higher concentration of pyrrole
complexed with naphthalene sulphonate ion (Py+NSA-) that was subsequently
oxidized to form dimeric radical cations and radical species undergoing slow cross
linking as polymerization progressed in line with the mechanism in Fig. 4.2.
135
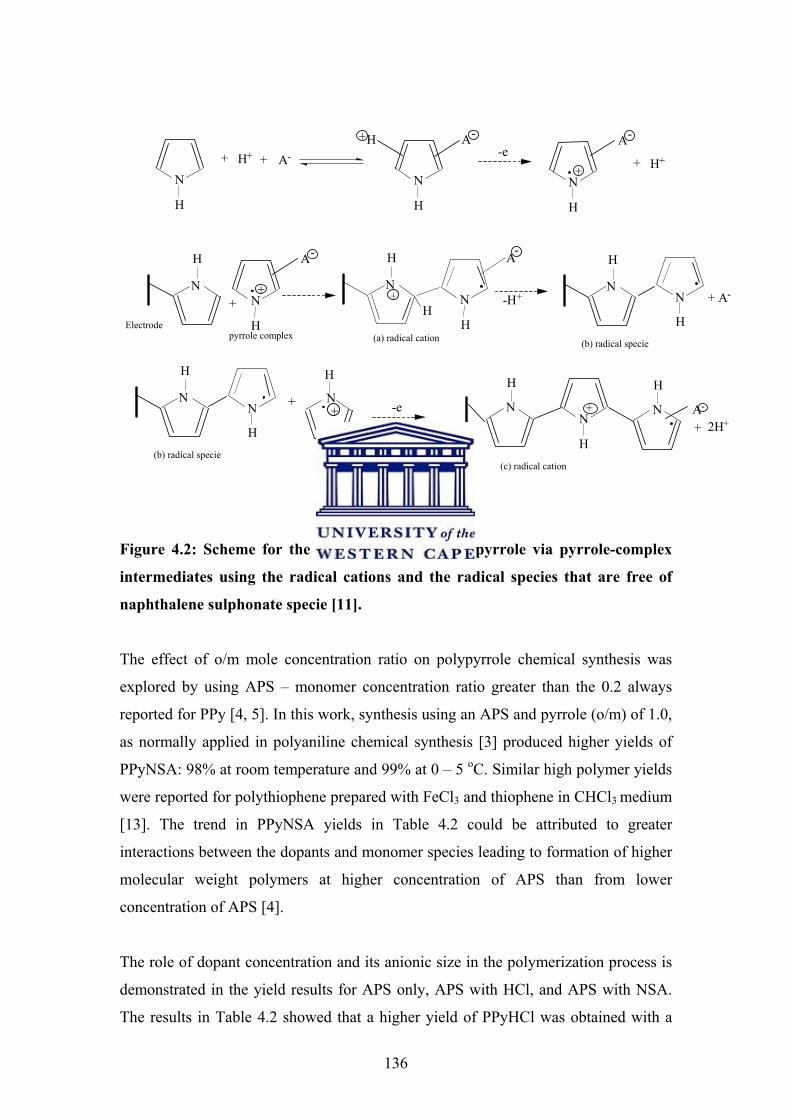
N
H
N
H
+ H+ + A-
N
H
A-+H
+
A-
+ H+-e
N
H
+ N
H
+
A-
N
H
N
H
+
A-
Electrodepyrrole complex (a) radical cation
-H+H
N
H
N
H(b) radical specie
+ -e N
H
N
H
N
H
+
(b) radical specie
H
NN
H
+ A-
N
H
+ + A-
(c) radical cation
2H+
Figure 4.2: Scheme for the polymerization of polypyrrole via pyrrole-complex
intermediates using the radical cations and the radical species that are free of
naphthalene sulphonate specie [11].
The effect of o/m mole concentration ratio on polypyrrole chemical synthesis was
explored by using APS – monomer concentration ratio greater than the 0.2 always
reported for PPy [4, 5]. In this work, synthesis using an APS and pyrrole (o/m) of 1.0,
as normally applied in polyaniline chemical synthesis [3] produced higher yields of
PPyNSA: 98% at room temperature and 99% at 0 – 5 oC. Similar high polymer yields
were reported for polythiophene prepared with FeCl3 and thiophene in CHCl3 medium
[13]. The trend in PPyNSA yields in Table 4.2 could be attributed to greater
interactions between the dopants and monomer species leading to formation of higher
molecular weight polymers at higher concentration of APS than from lower
concentration of APS [4].
The role of dopant concentration and its anionic size in the polymerization process is
demonstrated in the yield results for APS only, APS with HCl, and APS with NSA.
The results in Table 4.2 showed that a higher yield of PPyHCl was obtained with a
136
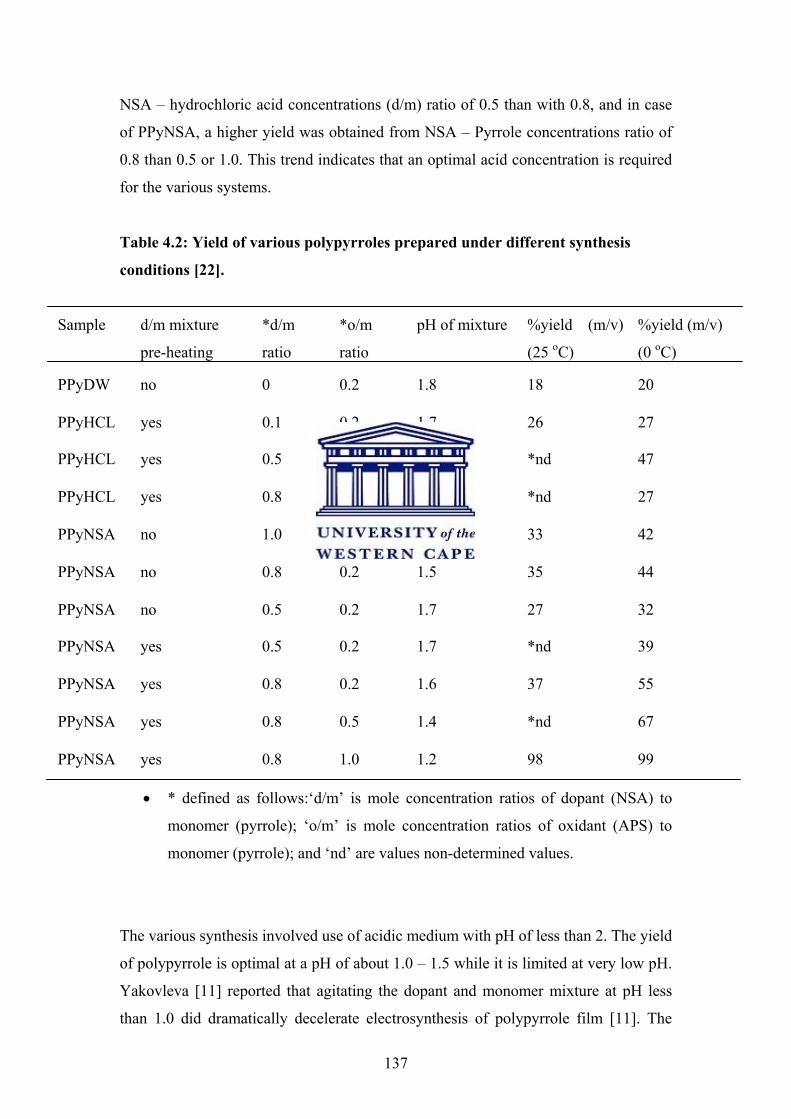
NSA – hydrochloric acid concentrations (d/m) ratio of 0.5 than with 0.8, and in case
of PPyNSA, a higher yield was obtained from NSA – Pyrrole concentrations ratio of
0.8 than 0.5 or 1.0. This trend indicates that an optimal acid concentration is required
for the various systems.
Table 4.2: Yield of various polypyrroles prepared under different synthesis
conditions [22].
Sample d/m mixture
pre-heating
*d/m
ratio
*o/m
ratio
pH of mixture %yield (m/v)
(25 oC)
%yield (m/v)
(0 oC)
PPyDW no 0 0.2 1.8 18 20
PPyHCL yes 0.1 0.2 1.7 26 27
PPyHCL yes 0.5 0.2 0.5 *nd 47
PPyHCL yes 0.8 0.2 0.2 *nd 27
PPyNSA no 1.0 0.2 1.4 33 42
PPyNSA no 0.8 0.2 1.5 35 44
PPyNSA no 0.5 0.2 1.7 27 32
PPyNSA yes 0.5 0.2 1.7 *nd 39
PPyNSA yes 0.8 0.2 1.6 37 55
PPyNSA yes 0.8 0.5 1.4 *nd 67
PPyNSA yes 0.8 1.0 1.2 98 99
• * defined as follows:‘d/m’ is mole concentration ratios of dopant (NSA) to
monomer (pyrrole); ‘o/m’ is mole concentration ratios of oxidant (APS) to
monomer (pyrrole); and ‘nd’ are values non-determined values.
The various synthesis involved use of acidic medium with pH of less than 2. The yield
of polypyrrole is optimal at a pH of about 1.0 – 1.5 while it is limited at very low pH.
Yakovleva [11] reported that agitating the dopant and monomer mixture at pH less
than 1.0 did dramatically decelerate electrosynthesis of polypyrrole film [11]. The
137
yield of the polypyrrole obtained from this study was found to increase with the size
of dopant ion used for doping. Earlier work on electrochemically-synthesized
polypyrrole had posited that the yield increases with the size of dopant ion used [11].
For example, the rate of electropolymerisation of polypyrrole in different electrolytes
follow the trend ClO4- > HSO4
- > Cl-. In this study, the yield follows the trend
PPyNSA >PPyHCl >PPyDW in favour of larger ionic dopants.
4.2 Morphology of PPyNSA
The physical appearance of PPyNSA obtained at 0 – 5 oC was smooth and shiny while
those prepared at higher temperature appear rough and loose. This is in line with the
findings of Kassim et al. that the rough physical appearance was due to greater rates
of polymerization at higher temperatures that leads to faster nucleation and
precipitation of nanoparticles [2]. However, even when higher yields are obtainable at
higher temperatures, there is higher overlapping of micelles, which leads to surface
roughness; unlike ordered and smother nodule morphology observed at lower
temperatures. From the scanning electron micrographs (Fig. 4.3) taken at
magnification of 500 for PPyNSA doped in the ratio 1, 0.8 and 0.5 respectively; the
trends posited above could be confirmed. The lumps (side-growth) at the sides of the
identified micro/nanotubes are products from overlapped micelles, which is more
probable at higher temperatures. The micrographs of similarly doped polyaniline
(PANi) with NSA at 0 oC have very few lumps but more of tubes and some few flakes
[3]. Wei et al. had posited an optimum d/m mole concentration ratio of 0.5 for
PANiNSA [3]. At this ratio, an excess concentration of aniline is available to form
NSA micelles with aniline to form nanotubes, whereas at higher ratios lesser moles of
aniline are available for polymerization and bigger tubes were obtained. However, at
lower d/m ratios, smaller diameter nanofibre/tubes were obtained. When the
surfactant, NSA, was not used the polypyrrole featured folded sheets of fibers with
tube-like morphology (Fig 4.4). The sheet-like fibers rolled up to form tubes with a
hollow inner cavity. In this synthesis, APS produced both the required acid medium
for the synthesis and peroxodisulfate counter ion, which served as dopant. The
micrographs observed from different sides of the PPyDW could be attributed to lack
of a rigid template for the formation of compact nanostructure. In alkaline media, thin
138

insulating films are formed from the electrochemically synthesized PPy [6]. The
PPyDW synthesized from the less acidic medium of oxidant and monomer will be
less conducting. The stability of the conducting cationic polypyrrole intermediate in
the polymerization process is favoured in acidic medium.
(a) (b) (c)
Figure 4.3: Typical SEM images of different polypyrrole synthesized with o/m
0.2 at 25 oC (a) PPyNSA nano/microtubes and fibers from d/m 1, (b) PPyNSA
nano/microtubes from d/m 0.8, and (c) PPyNSA microfibers from d/m 0.8 [21].
.
(a) (b) (c)
Figure 4.4: Typical SEM images of polypyrrole nano/micro sheets synthesized
with o/m 0.2 at 25 oC in the absence of NSA dopant (PPyDW) [21] taken from
different sides to show the sheet-like fibrous structures (a) hollow tubular tubes
(b) and the rod-like microstructures (c).
139
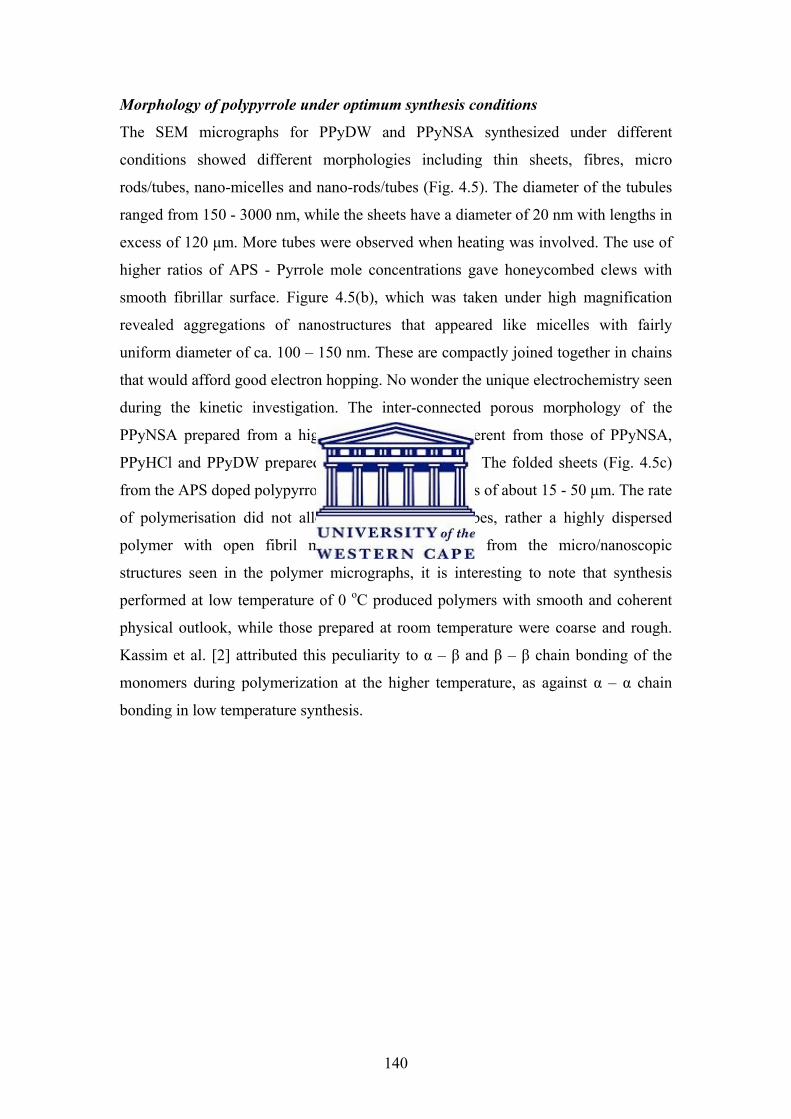
Morphology of polypyrrole under optimum synthesis conditions
The SEM micrographs for PPyDW and PPyNSA synthesized under different
conditions showed different morphologies including thin sheets, fibres, micro
rods/tubes, nano-micelles and nano-rods/tubes (Fig. 4.5). The diameter of the tubules
ranged from 150 - 3000 nm, while the sheets have a diameter of 20 nm with lengths in
excess of 120 μm. More tubes were observed when heating was involved. The use of
higher ratios of APS - Pyrrole mole concentrations gave honeycombed clews with
smooth fibrillar surface. Figure 4.5(b), which was taken under high magnification
revealed aggregations of nanostructures that appeared like micelles with fairly
uniform diameter of ca. 100 – 150 nm. These are compactly joined together in chains
that would afford good electron hopping. No wonder the unique electrochemistry seen
during the kinetic investigation. The inter-connected porous morphology of the
PPyNSA prepared from a higher ratio of o/m is different from those of PPyNSA,
PPyHCl and PPyDW prepared from lower o/m ratios. The folded sheets (Fig. 4.5c)
from the APS doped polypyrrole (PPyDW) have lengths of about 15 - 50 μm. The rate
of polymerisation did not allow the formation of tubes, rather a highly dispersed
polymer with open fibril morphology [18]. Apart from the micro/nanoscopic
structures seen in the polymer micrographs, it is interesting to note that synthesis
performed at low temperature of 0 oC produced polymers with smooth and coherent
physical outlook, while those prepared at room temperature were coarse and rough.
Kassim et al. [2] attributed this peculiarity to α – β and β – β chain bonding of the
monomers during polymerization at the higher temperature, as against α – α chain
bonding in low temperature synthesis.
140
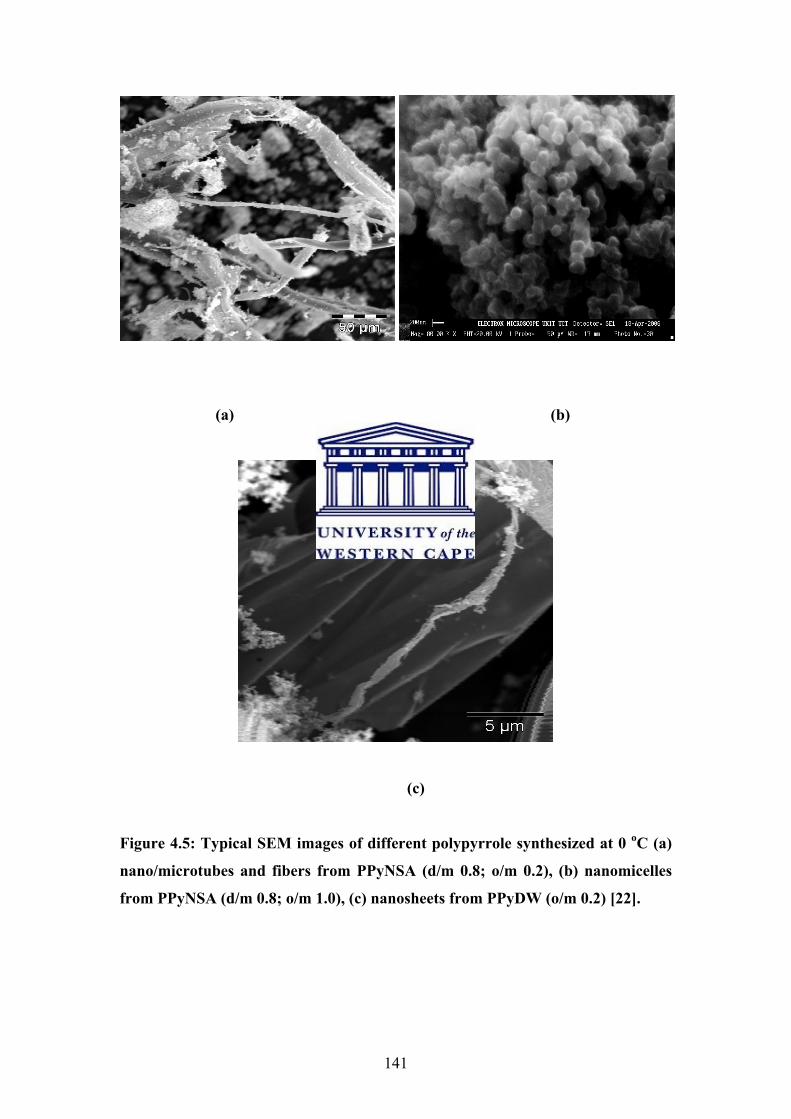
(a) (b)
(c)
Figure 4.5: Typical SEM images of different polypyrrole synthesized at 0 oC (a)
nano/microtubes and fibers from PPyNSA (d/m 0.8; o/m 0.2), (b) nanomicelles
from PPyNSA (d/m 0.8; o/m 1.0), (c) nanosheets from PPyDW (o/m 0.2) [22].
141

4.3 UV-Vis absorption and solubility of PPyNSA
The various PPyNSA’s were sparingly soluble in m- cresol, chloroform and dimethyl
sulfoxide (DMSO). The polymer was found to be more soluble in DMSO than in
other solvents. The PPyNSA prepared by pre-heating of the dopant /monomer mixture
had higher solubility and more intense coloration than those prepared without
preheating. Similarly, synthesis at 0 oC produced PPy with higher solubility and
spectroscopic absorption than PPy prepared at room temperature synthesis. PPyHCl
showed the least solubility in all solvents.
From the UV-Vis spectra (Fig. 4.6), the absorption maxima for the conjugated double
bonds (i.e. π to π* transition) for both PPyDW and PPyHCl were seen at 291 nm.
However, PPyNSA (d/m 0.5 and o/m 0.2) has an absorption maximum at 300 nm.
This red shift is an indication of involvement of the bulky dopant ion (NSA) in the
polymerization process [23]. From Fig. 4.6A, there are prominent polaron band at 437
nm; bipolaron band at 555 nm and over-lapped bipolaron band at 765 nm upwards for
the PPyNSA prepared from NSA - pyrrole concentration ratios of 0.5 and APS –
pyrrole concentration ratios of 0.2. The PPyNSA prepared from NSA - pyrrole
concentration ratio of 0.8 and APS - Pyrrole concentration ratio of 0.2, 0.5 and 1.0
gave only the polaron band at 409 nm (Fig. 4.6B). The concentration of polarons and
bipolaron ions along the polymer chain must have contributed to the improved
solubility of the polymer in DMSO. This is evident in the higher polaronic absorption
(437 – 765 nm) for PPyNSA prepared from NSA - pyrrole concentration ratios of 0.5
and APS - pyrrole concentration ratios of 0.2.
142
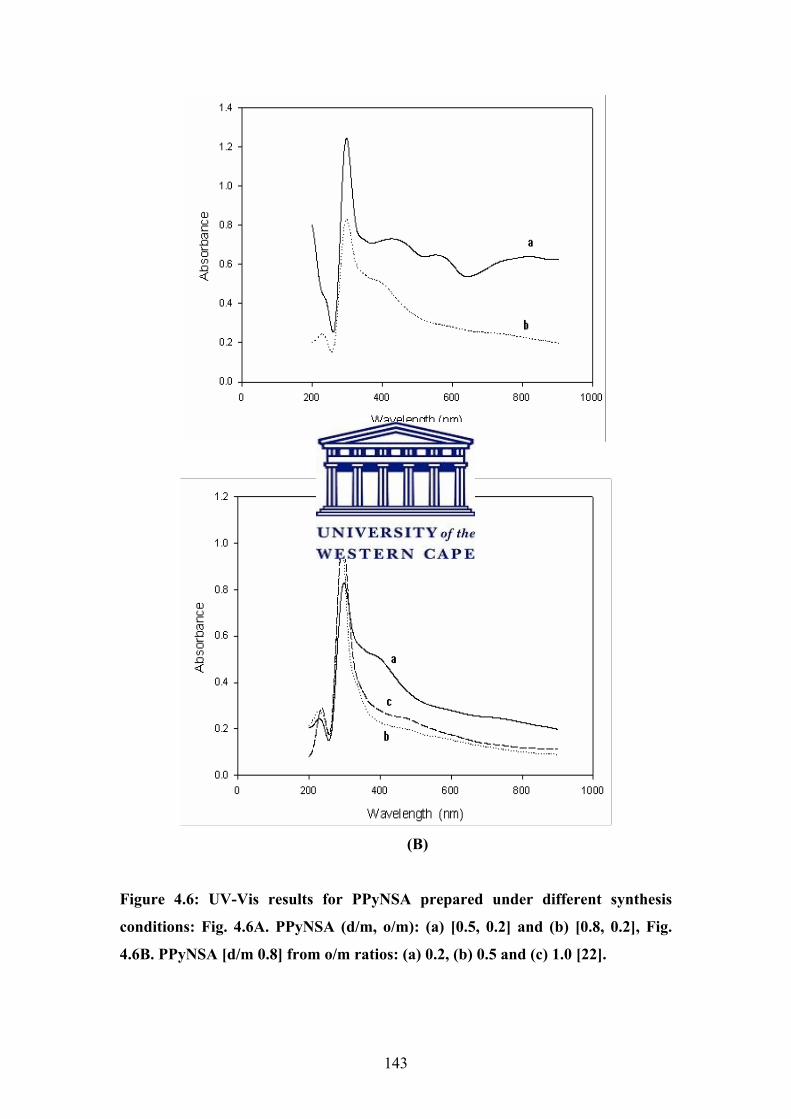
(A)
(B)
Figure 4.6: UV-Vis results for PPyNSA prepared under different synthesis
conditions: Fig. 4.6A. PPyNSA (d/m, o/m): (a) [0.5, 0.2] and (b) [0.8, 0.2], Fig.
4.6B. PPyNSA [d/m 0.8] from o/m ratios: (a) 0.2, (b) 0.5 and (c) 1.0 [22].
143
Previous work on DBSA-doped polypyrrole by Lee et al. showed bi-polaron
absorption at 480 nm and free carrier tailing in the near IR region from 750 – 1500
nm region [4]. Diffused reflectance UV-Vis-NIR spectra of doped polypyrrole by
Geetha and Trivedi [24] gave indications of cation radicals at wavelength band of 400
– 600 nm for doped polypyrrole and other bands at above 800 nm associated to
trapped excitons (bipolarons). Similarly, Shiigi et al. reported that the polaron and bi-
polaron absorption peaks at 420 nm and 860 nm respectively for overoxidised
polypyrrole colloids are greatly dependent on the concentration and type of oxidant
used [9]. It could therefore be postulated that the formation of the bipolaron band at
555 nm and over-lapped bipolaron bands at 765 nm upwards for PPyNSA system is
feasible at an optimum concentration of d/m 0.5 and o/m 0.2 using (NH4)2S2O8 as
oxidant.
It is note worthy to mention that the PPyNSA polymer with 99% yield from a d/m of
0.8 and o/m of 1.0 did not give sharp indication of trapped polaron and bipolaron (Fig.
4.6B) within the wavelength investigated. This might be due to the facile oxidation
process, which did not allow for ordered entrapment of the charge carriers. However,
the polaron peak was more prominent when an o/m concentration ratio of 1.0 was
used as against when 0.5 was used. The increasing order of oxidation power of some
common oxidants is K3Fe(CN)6 < FeCl3 < (NH4)2S2O8. The level of chemical
oxidation could therefore be used to modulate the applicability of PPyNSA. High
performance polymeric nanosensors should exhibit polaron and bipolaron bands as
obtained for the PPyNSA prepared from of NSA – pyrrole concentration ratios of 0.5
and APS – pyrrole concentration ratios of 0.2 in Fig. 4.6A. The combination of other
techniques is therefore necessary to further explore the properties of these polymers
[15].
4.4 FTIR spectral studies
Figure 4.7 shows the IR spectra of (a) PPyDW, (b) PPyNSA (d/m 0.8; o/m 0.2) and
(c) PPyNSA (d/m 0.8; o/m 1.0). Principal absorption bands observed are given in
Table 4.3 together with those reported for polypyrrole by Geetha and Trivedi [24]. All
the characteristic IR bands for polypyrrole were observed with slight variation in the
absolute values of the absorption bands. The usual N – H stretching at 3400 cm-1 in
144
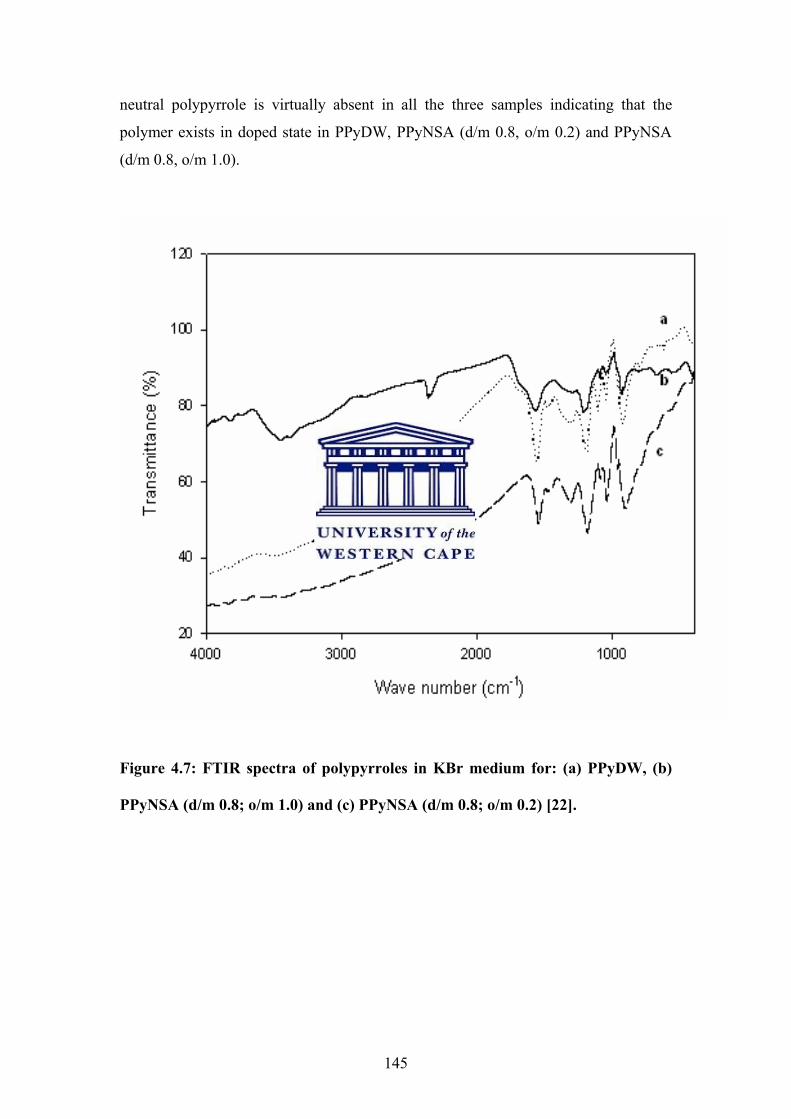
neutral polypyrrole is virtually absent in all the three samples indicating that the
polymer exists in doped state in PPyDW, PPyNSA (d/m 0.8, o/m 0.2) and PPyNSA
(d/m 0.8, o/m 1.0).
Figure 4.7: FTIR spectra of polypyrroles in KBr medium for: (a) PPyDW, (b)
PPyNSA (d/m 0.8; o/m 1.0) and (c) PPyNSA (d/m 0.8; o/m 0.2) [22].
145

Table 4.3: Major shifts of bands (cm-1) in FTIR spectra of PPyDW, PPyNSA
(d/m 0.8, o/m 0.2) and PPyNSA (d/m 0.8, o/m 1.0) from undoped polypyrrole
major bands (Geetha & Trivedi) [24].
Major bands (cm-1) PPYDW PPYNSA PPYNSA
(d/m 0.8, o/m 0.2) (d/m 0.8, o/m 1.0).
3421 (N-H str) absent absent absent
3100 (C-H str) absent absent 3195 (sharp)
1535 (C=C &
C-C str) 1554 1564 1550
1450 (N-H str) absent 1461 1400
1295 (C-H &
N-H def) 1308 1310 1299
1050 (C-H def) 1047 1048 1045
The N – H stretching band for neutral polypyrrole at 1450 cm-1 was totally absent in
PPyDW but shifted positively by 11 cm-1 in PPyNSA (d/m 0.8, o/m 0.2) and
negatively by 50 cm-1 in the most oxidized polypyrrole PPyNSA (d/m 0.8, o/m 1.0).
This is an indication that the polymer is not in the aromatic state but in the excited
polaron and bipolaron defect state. The strong electronic excitations occasioned by the
polypyrrole-oxidized states strongly distort the observed absorptions. The C=C and C-
C stretching band at 1535 cm-1 shifted positively by 15 – 24 cm-1 in the three scenario
investigated and is synonymous to the absorption band of 1545 cm-1 observed for
doped PPy [24]. Similarly, the C-H stretching band at 3100 cm-1 was absent in all the
three oxidized polypyrrole, though there was a new sharp and pronounced peak at
3190 cm-1 for PPyNSA (d/m 0.8, o/m 1.0). However, the C-H deformation at 1050
cm-1 was observed at 1047, 1048 and 1045 cm-1 for PPyDW, PPyNSA (d/m 0.8; o/m
0.2) and PPyNSA (d/m 0.8; o/m 1.0) respectively. The new sharp peak observed at
3204 cm-1 in the PPyNSA (d/m 0.8, o/m 1.0) spectrum might be due to hydrogen
146
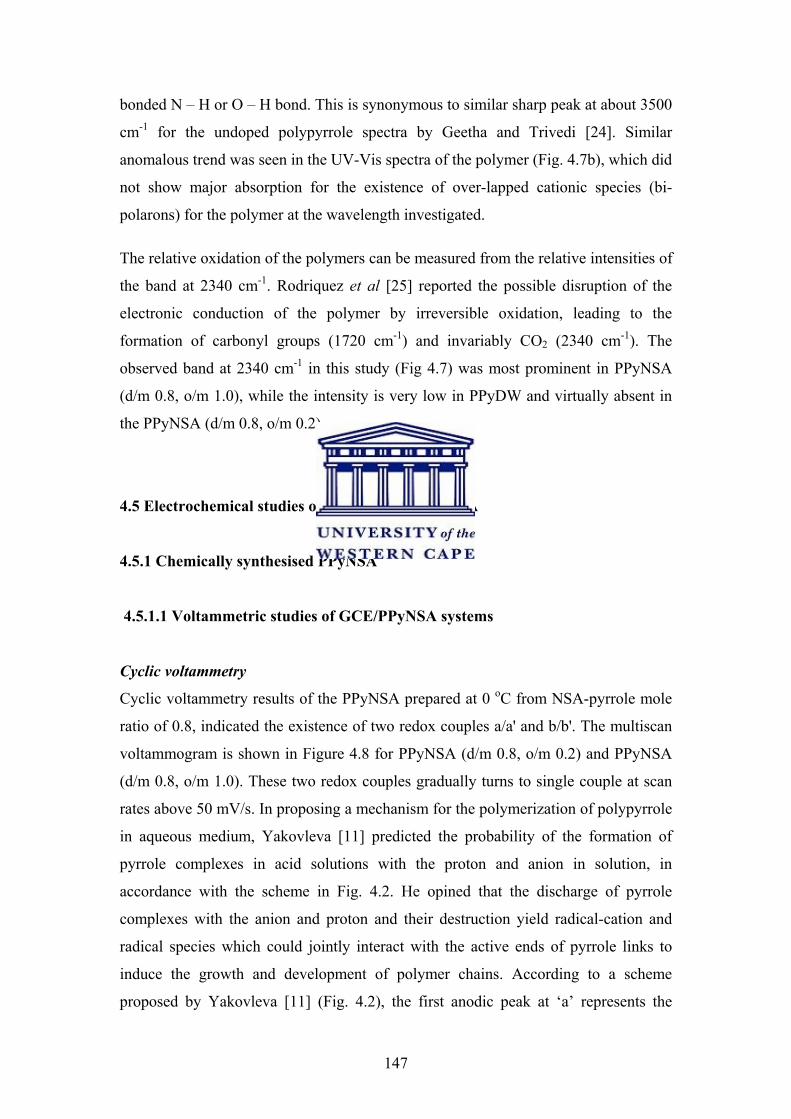
bonded N – H or O – H bond. This is synonymous to similar sharp peak at about 3500
cm-1 for the undoped polypyrrole spectra by Geetha and Trivedi [24]. Similar
anomalous trend was seen in the UV-Vis spectra of the polymer (Fig. 4.7b), which did
not show major absorption for the existence of over-lapped cationic species (bi-
polarons) for the polymer at the wavelength investigated.
The relative oxidation of the polymers can be measured from the relative intensities of
the band at 2340 cm-1. Rodriquez et al [25] reported the possible disruption of the
electronic conduction of the polymer by irreversible oxidation, leading to the
formation of carbonyl groups (1720 cm-1) and invariably CO2 (2340 cm-1). The
observed band at 2340 cm-1 in this study (Fig 4.7) was most prominent in PPyNSA
(d/m 0.8, o/m 1.0), while the intensity is very low in PPyDW and virtually absent in
the PPyNSA (d/m 0.8, o/m 0.2).
4.5 Electrochemical studies on PPyHCl and PPyNSA
4.5.1 Chemically synthesised PPyNSA
4.5.1.1 Voltammetric studies of GCE/PPyNSA systems
Cyclic voltammetry
Cyclic voltammetry results of the PPyNSA prepared at 0 oC from NSA-pyrrole mole
ratio of 0.8, indicated the existence of two redox couples a/a' and b/b'. The multiscan
voltammogram is shown in Figure 4.8 for PPyNSA (d/m 0.8, o/m 0.2) and PPyNSA
(d/m 0.8, o/m 1.0). These two redox couples gradually turns to single couple at scan
rates above 50 mV/s. In proposing a mechanism for the polymerization of polypyrrole
in aqueous medium, Yakovleva [11] predicted the probability of the formation of
pyrrole complexes in acid solutions with the proton and anion in solution, in
accordance with the scheme in Fig. 4.2. He opined that the discharge of pyrrole
complexes with the anion and proton and their destruction yield radical-cation and
radical species which could jointly interact with the active ends of pyrrole links to
induce the growth and development of polymer chains. According to a scheme
proposed by Yakovleva [11] (Fig. 4.2), the first anodic peak at ‘a’ represents the
147

oxidation of the neutral PPyNSA to the PPyNSA intermediate radical cation. This
is further oxidized at a higher potential to PPyNSA radical cation at ‘b’. The
cathodic voltammogram shows the reduction of PPyNSA radical cation to the partly
reduced PPyNSA radical anion at ‘b'’ which is further reduced to the neutral
PPyNSA at a'.
The voltammograms in Figure 4.8 show that as the potential scan rate increases, the
anodic peak potentials (Ep,a) shifts positively, the cathodic peak potentials (Ep,c)
remained unchanged and all peak currents (Ip) increase progressively. The
independence of Ep,c on scan rate is characteristic of surface-bound thin film
electroactive species undergoing fast electron transfer reaction at the electrode. For
both redox couples a/a' and b/b', the peak separations ∆Ep (i.e Ep,a – Ep,c) is < 65
mV even at higher scan rates (results for higher scan rates are not shown) which
indicates that the shift in Ep,a values with scan rate is due to intra-molecular charge
transportation. Similar peaks characterize the voltammogram of polyaniline in 1M
HCl [26–29].
148
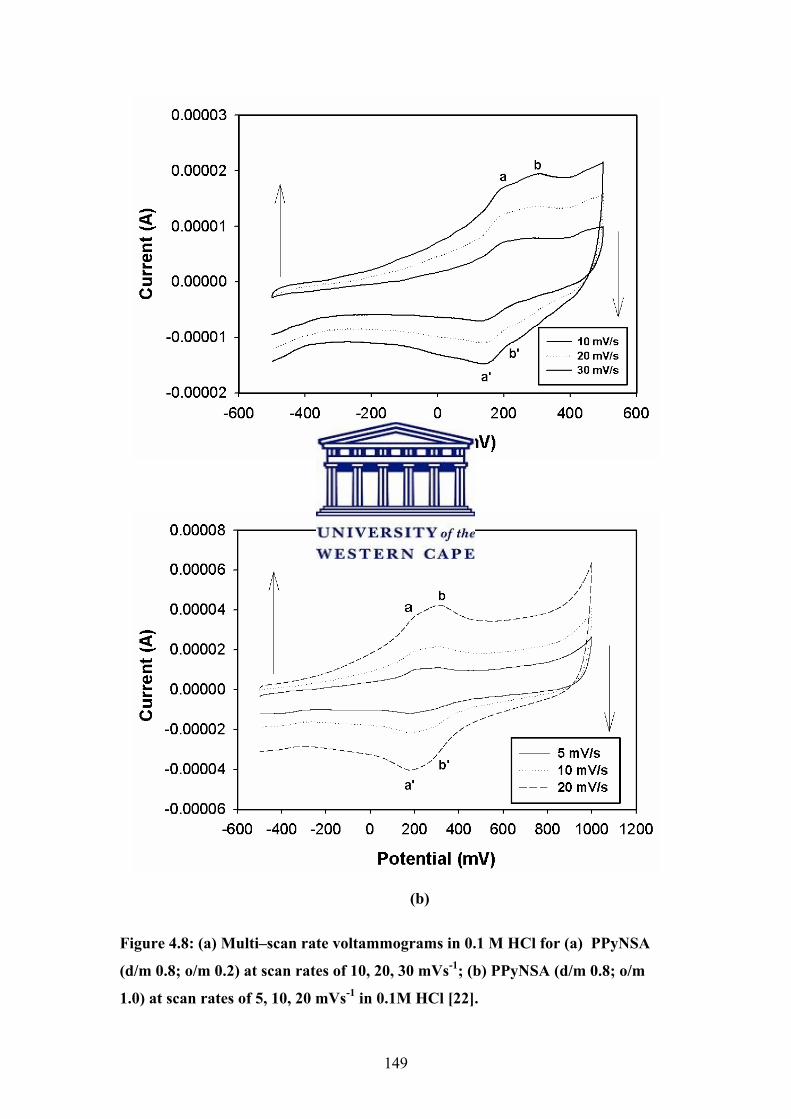
(a)
(b)
Figure 4.8: (a) Multi–scan rate voltammograms in 0.1 M HCl for (a) PPyNSA
(d/m 0.8; o/m 0.2) at scan rates of 10, 20, 30 mVs-1; (b) PPyNSA (d/m 0.8; o/m
1.0) at scan rates of 5, 10, 20 mVs-1 in 0.1M HCl [22].
149

Square wave and differential pulse voltammetry
The low frequency (2, 3, 4 and 5 Hz) square wave voltammograms (SWV) of
GCE/PPyNSA is presented in Fig 4.9. The voltammograms (Fig. 4.9 a and b) show
two redox couples (a/a' and b/b') that are close, broad and coupling at a formal
potential (Eo') of about 241±7 mV vrs. Ag/AgCl. This agrees with the estimated Eo'
value of 241±11 mV calculated for the CV of PPyNSA (d/m 0.8; o/m 1.0) (Fig. 4.8b).
The corresponding formal potentials for the emerging peak from the convolution of
the two-redox couples are shown in Fig 4.9b. The SWV data show that the separation
between the peak potentials (∆Ep) of redox couples a/a' and b/b' has a value of about
112 mV, which must have arisen from the overlapping of two closely related 1-
electron redox processes. Similar trend was observed for the PPyNSA (d/m 0.8; o/m
0.2) shown in Figure 4.8a. The anodic differential pulse voltammograms (DPV) of the
chemically doped PPyNSA [d/m 0.8, o/m 1] at low scan rates of 5 mV/s and 10 mV/s
are presented in Fig. 4.10. The anodic peaks show a convolution of two-merging
peaks at 195 mV and 265 mV showing that two anodic peaks may be involved. These
peak potentials are close to the anodic peak points obtained for the cyclic and square
wave voltammograms in Fig. 4 .8 and 4.9. Similar trend was observed on the
PPyNSA [d/m 0.8, o/m 0.2].
150

(a)
(b)
Figure 4.9: Typical anodic SWV of PPyNSA (d/m 0.8; o/m 1.0) using an
amplitude of 50 mV and at frequencies of 2, 3, 4 and 5 Hz showing (a) the
forward and reverse waves, (b) the net square wave responses.
151
Figure 4.10: Typical anodic DPV of PPyNSA (d/m 0.8; o/m 1.0) at scan rates of 5
and 10 mV/s using amplitude of 25 mV.
4.5.1.2 Electrode kinetics of GCE/PPyNSA systems
The cyclic voltammograms of PPyNSA (Fig. 4.8) show that both the anodic and
cathodic peak currents did not come to zero at the switch potentials, indicating that
the polymer is neither over-oxidized nor over-reduced during potential cycling. At the
potential window of -500 mV to 1000 mV, where the PPyNSA (d/m 0.8; o/m 1.0)
(Fig. 4.8b) is characterised, the Eo' value for couple a/a' is 184±9 mV while that of
couple b/b' is 298±12 mV within the scan rates of 5 mV to 30 mV. The mid point, i.e.,
1/2(Eo'a/a' - Eo'b/b'), of the two redox couples, a/a' and b/b', occur at 241±11 mV.
Kinetic evaluations based on data from the CV obtained at scan rates of 5 mV to 100
mV were used to study the electrode processes of the polymer systems. A summary of
152
the kinetic evaluation discussed underneath are summarised in Tables 4.4 for
PPyNSA (d/m 0.8; o/m 1.0) and Table 4.5 for the PPyNSA (d/m 0.8; o/m 0.2) system.
They gave peak separations of less than 60 mV at different scan rates between 5 and
100 mVs-1. In the GCE/ PPyNSA (d/m 0.8; o/m 1.0) system, which was evaluated
based on CVs at potential window of -500 to 1000 mV, the oxidation to reduction
peak current ratios |Ipa/Ipc)| range was 0.8 to 0.9 for redox couple a/a' and 1.0 to1.3
i.e. [1.23±0.08] for redox couple b/b'. The ∆Ep ranged from 3.8 to 23.4 mV i.e.
[17.5±9.0 mV] for a/a', and 11.3 to 54.1 mV i.e. [37±14 mV] for b/b'. The peak
current values show linear dependence on scan rates for the cathodic and anodic
peaks, with slopes of 1.45 to 1.87 x 10⁻⁴ A.s.V-1 and correlation coefficient (r2), of
0.997 to 0.998 for both anodic and cathodic plots. The intercept values, for the non-
faradaic currents caused by the charging of the electrical double layer were close to
zero being 4.6 x 10⁻⁶ A for the anodic plot and to 5.6 x 10⁻⁶ A for the cathodic plot.
This is an indication of a very thin layer of adsorbed electro active material at the
electrode surface undergoing near-Nernstian (quasi-reversible) reaction.
Similar trend was seen in the PPyNSA (d/m 0.8; o/m 0.2), (Fig 4.8a), studied at a
potential window of –500 mV to +500 mV at scan rates between 10 mV/s and 100
mV/s. The formal potential, Eº', was 176.3±5.4 mV with a peak separation of 48 to 61
mV i.e. [52.4±4.4 mV] and |Ipa / Ipc| of 0.98 to 1.22 i.e. [1.13±0.08] for a/a'. This is
indicative of a quasi-reversible system. The linear relationship of the peak currents
versus the scan rates featured a slope of 4.32 x 10⁻⁴ A.s.V-1 and 3.38 x 10⁻⁴ A.s.V-1 for
the anodic and cathodic plots respectively. The correlation coefficient (r2) for the
anodic and cathodic peaks is 0.999 and 0.998, while the intercepts are 3.37 x 10⁻⁶ A
and 4.36 x 10⁻⁶ A, respectively.
The surface concentration, Γ*, of the PPyNSA, was calculated from the peak currents
of the CV’s in Fig. 4.8 using the Brown-Anson method (26-29). The Γ* values were
2.60 x 10⁻⁸ mol cm-2 and 5.76 x 10⁻⁹ mol cm-2 for PPyNSA (o/m 1.0) and PPyNSA
(o/m 0.2) respectively. The results shows that Γ*PPyNSA (o/m 1.0) = 4.5 Γ*PPyNSA (o/m 0.2)
respectively. This agrees with the APS (oxidant) ratio in the two PPyNSA. As
expected the polypyrrole prepared with higher APS ratio is expected to have more
PPy.
153
The peak separations for the redox couple, a/a', of GCE/PPyNSA (d/m 0.8; o/m 0.2)
system in Fig. 4.8a increased progressively from 49 mV at 10 mVs-1 to 61 mV at 100
mVs-1 coupled with increase in the magnitude of the peak currents with increase in
scan rates. Similarly, the peak separations for the redox couple, a/a', in GCE/PPyNSA
(d/m 0.8; o/m 1.0) system (Fig.4.8b) increased progressively from 4 mV at 5 mVs-1 to
54 mV at 100 mVs-1. These trends show that the peak currents are diffusion
controlled. Thus the Randel- Sevčik equation (equation 3.6) was applied to determine
the diffusion coefficient (De) for electron hopping along the polymer chain [21].
Ip / ν1/2 = 2.686 x 10⁵ n3/2 A Γ*PPyNQS.De
1/2
Figures 4.11 (a) and (b) represent plots of the absolute magnitude of the cathodic peak
currents vrs. square root of scan rates for GCE/PPyNSA (d/m 0.8; o/m 0.2) and
GCE/PPyNSA (d/m 0.8; o/m 1.0) systems respectively. The charge transfer
coefficient, De, of the polymers were estimated from the slopes of the graphs to be
1.81 x 10⁻⁶ cm2s-1 and 1.21 x 10⁻⁶ cm2s-1 for PPyNSA (o/m 1.0) and PPyNSA (o/m
0.2) respectively [28, 29]. Thus the PPyNSA that was prepared with higher
oxidant/monomer ratio produced polymer with an enhanced charge transportion, i.e
better conductivity (See Fig. 4.13). The De values for PPyNSA agree with the
diffusion coefficient of 1.10 x 10⁻⁶ cm2s-1 reported for chloride ions in polypyrrole
[30].
154

(a)
(b)
Figure 4.11: Plot showing the variation of the modulus of both the anodic and
cathodic peak currents with square root of scan rates for (a) GCE/PPyNSA (d/m
0.8; o/m 0.2) system and (b) GCE/PPyNSA (d/m 0.8; o/m 1.0) in 0.1 M HCl.
155

The standard rate constant, kº, i.e. kº = φ (α. n. F. ν. De / RT) ½ [31-33] for the
electron transfer reaction of the polymer on GCE was calculated using the Nicholson
method. The φ (dimensionless parameter) value of 20 was obtained based on a peak
separation, ΔEp, value of 61.1 mV [31, 33] for the voltammogram at 100 mVs-1,
which gives the number of electron transferred, n, as 1. Assuming a transfer
coefficient, α value of 0.5, the kº values were calculated as 3.75 x 10⁻² cms-1 and 3.08
x 10-2 cms-1 for PPyNSA (o/m 1.0) and PPyNSA (o/m 0.2) respectively. This is
comparable with the rate constants reported for other conducting polymers, vis.:
Pt/PANI electrodes with kº values of 0.049 to 5.4 x 10⁻³ cms-1 [34] and Pt/PEDOT
electrodes with kº values of 1.5 to 45.3 x 10⁻³ cms-1 [35] under different synthesis
conditions.
The conductivity in the polypyrrole film on the electrode surface arises from the
electronic transfer along the conjugated л-molecular orbital coupled with the motion
of charge carriers in the material. When electron is removed from the л-system of the
PPy backbone, a polaronic radical cation is produced by the local distortion of charge
over four pyrrole units. Further oxidation of the polaronic radicals leads to formation
of the bipolarons, which are energetically more favourable [36]. The final
conductivity of the polymer is determined by the combination of two processes
namely; charge carrier mobility (‘hopping’) along individual polypyrrole segment and
the charge transfer between the dopant and the polymer segment. More research on
fuller understanding of the charge storage and transport mechanism in conducting
polymers is still going on [37].
156

Table 4.4. Summary of estimates of kinetic parameters for PPyNSA [d/m 0.8,
o/m 1.0] on GCE based on n = 1, and scan rate measurements from 10 – 100
mV/s.
Couple 1 (a/ a') Couple 2 (b/ b') Parameter
Anodic (a) Cathodic (a') Anodic (b) Cathodic (b')
Γ*PPyNSA 2.23 x 10⁻⁸ mol cm-2 2.54 x 10⁻⁸ mol cm-2 2.81 x 10⁻⁸ mol cm-2 2.18 x 10⁻⁸ mol cm-2
De PPyNSA 1.81 x 10⁻⁶cm2s-1 1.81 x 10⁻⁶cm2s-1 1.80 x 10⁻⁶cm2s-1 1.82 x 10⁻⁶cm2s-1
ķ º (100mV/s) 3.75 x 10⁻²cms-1 3.75 x 10⁻²cms-1
Eo' (mV)
∆Ep (mV)
Ip,a/Ip,c
187.4 299.5
3.8 – 23.4 11.3 – 54.1
0.8 – 0.9 1.05 – 1.27
Table 4.5. Summary of estimates of kinetic parameters for PPyNSA [d/m 0.8,
o/m 0.2] on GCE based on n = 1, and scan rate measurements from 10 – 100
mV/s. NB: The second couple at Eº (mV) of 275 mV, was not clearly resolved at
all scan rates.
Couple Average Parameter
Anionic (a) Cathodic (a')
Γ*PPyNSA 6.43 x 10⁻⁹ mol cm-2 5.09 x 10⁻⁹ mol cm-2 5.76 x 10⁻⁹ mol cm-2
De PPyNSA 1.22 x 10⁻⁶cm2s-1 1.21 x 10⁻⁶cm2s-1 1.22 x 10⁻⁶cm2s-1
ķ º (100mV/s)
Eo' (mV)
∆Ep (mV)
Ip,a/Ip,c
3.08 x 10⁻²cms-1
162.55
48.9 -61.1
0.98 – 1.22
157
4.5.1.3 Impedance studies PPyNSA systems
Electrochemical impedance spectroscopy (EIS) interrogation of PPyNSA were
performed with an ac amplitude of 10 mV for potentials -600 to 1000 mV over a
frequency range from 105 to 10-1 Hz. The behaviours of the of PPyNSA (d/m 0.8, o/m
1.0) system at different potentials in terms of conductivity vis-à-vis its charge storage
capacity at a low frequency of 10-1 Hz is presented in Fig. 4.12. The potentials at
which the polymer is most conductive were 100 – 300 mV with a real impedance
value of about 0.30 – 0.40 kΩ cm2 based on the unfitted data. Coincidentally, the
highest charge storage ability of 0.73 - 0.95 mF cm-2 was displayed at these potentials
with the highest value of 0.95 mF cm-2 observed at 300 mV (Fig. 4.12). Low
capacitance trend of ≤ 0.2 mF cm-2 were manifested at potentials less than -200 mV
within the potential window investigated. Similar behaviour was seen with the
PPyNSA (d/m 0.8, o/m o.2) system even though it showed lower trend of conductivity
as could be seen from the higher impedance values in Fig. 4.13. The trend of
conductivity for the three system at the low frequency value of 10-1 Hz shows that
PPyNSA (o/m 1.0) > PPyNSA (o/m 0.2) > PPyDW (Fig. 4.13). This confirms our
position that the NSA-doped polypyrrole from higher oxidant to monomer ratio offers
better charge transportation than that from a lower oxidant to monomer ratio. The
NSA doped polypyrrole shows maximum electroactivity at lower potential (100 – 300
mV) than the polypyrrole prepared from NSA- free medium, which shows maximum
charge transportation at about 400 – 600 mV (Fig. 4.13). The PPyNSA system is
therefore a better electrocatalyst than the PPyDW.
158

Figure 4.12: Plots of the real impedance (Z) and capacitance (C) data of PPyNSA
(d/m 0.8, o/m 1.0) system showing low frequency behaviours between -600 mV to
700 mV [22].
159

Figure 4.13: Plots of the real impedance (Z) data obtained at 0.1 Hz for PPyNSA
(d/m 0.8, o/m 1.0), PPyNSA (d/m 0.8, o/m 0.2) and PPyDW at different potentials
[22].
4.5.2 Electrosynthesised PPyHCl and PPyNSA
The electrosynthesis of the polypyrrole was first done in an electrolyte medium of
hydrochloric acid (pH, 1.1) using glassy carbon and platinum electrodes.
Subsequently, the electrosynthesis was explored with the introduction of naphthalene
sulphonic acid into the electrolyte (pH, 1.6) as described in chapter 3.
4.5.2.1 Voltammetric studies on electrosynthesised PPyHCl and PPyNSA
Electropolymerisation of PPyHCl
The voltammogramms for the electrosynthesis and characterisation of PPyHCl at
room temperature on platinum disc electrode is presented in Fig. 4.14. The
polymerization wave gave sharp oxidation and reduction peaks. The PPyHCl film
grown on GCE does not give similar sharp peaks but rather forming plateaus at the
160
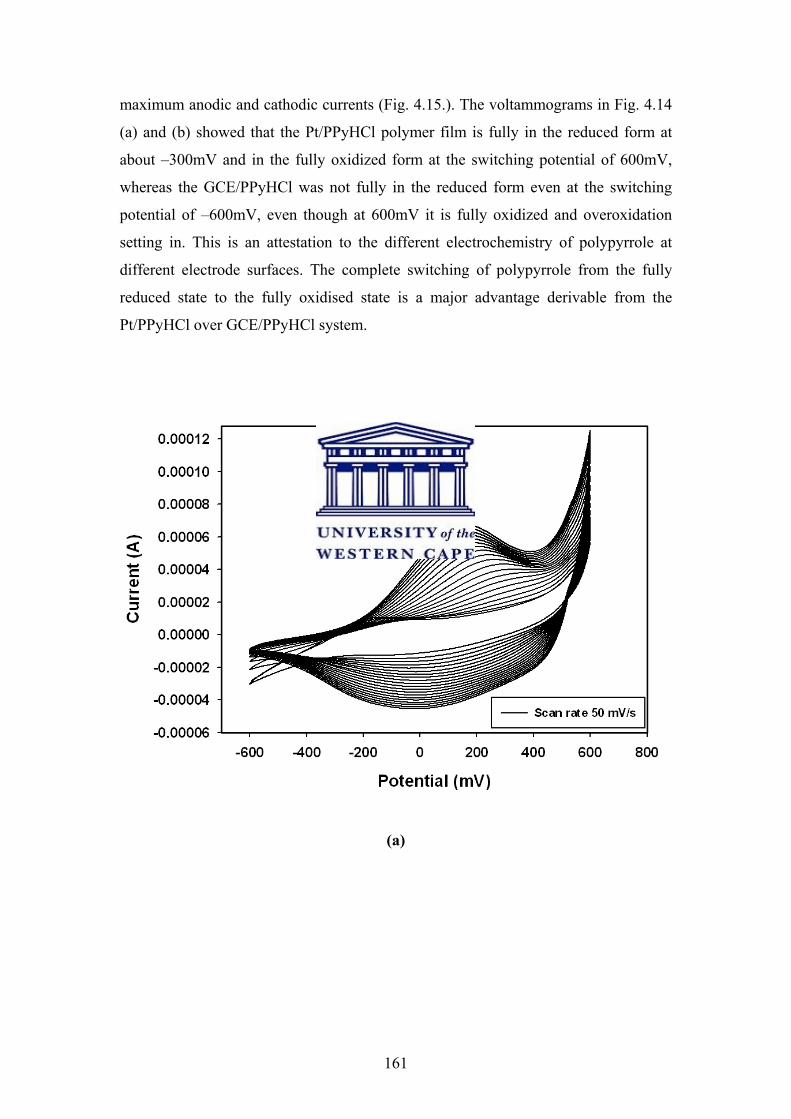
maximum anodic and cathodic currents (Fig. 4.15.). The voltammograms in Fig. 4.14
(a) and (b) showed that the Pt/PPyHCl polymer film is fully in the reduced form at
about –300mV and in the fully oxidized form at the switching potential of 600mV,
whereas the GCE/PPyHCl was not fully in the reduced form even at the switching
potential of –600mV, even though at 600mV it is fully oxidized and overoxidation
setting in. This is an attestation to the different electrochemistry of polypyrrole at
different electrode surfaces. The complete switching of polypyrrole from the fully
reduced state to the fully oxidised state is a major advantage derivable from the
Pt/PPyHCl over GCE/PPyHCl system.
(a)
161

(b)
Figure 4.14: (a) The polymerization voltammograms of Pt/PPyHCl (20 cycles)
from 0.1 M Pyrrole in 0.1 M HCl at 50 mV/s and (b) multi-scan rate
voltammograms for electropolymerized Pt/PPyNSA at 10 to 50 mV/s.
162

(a)
163
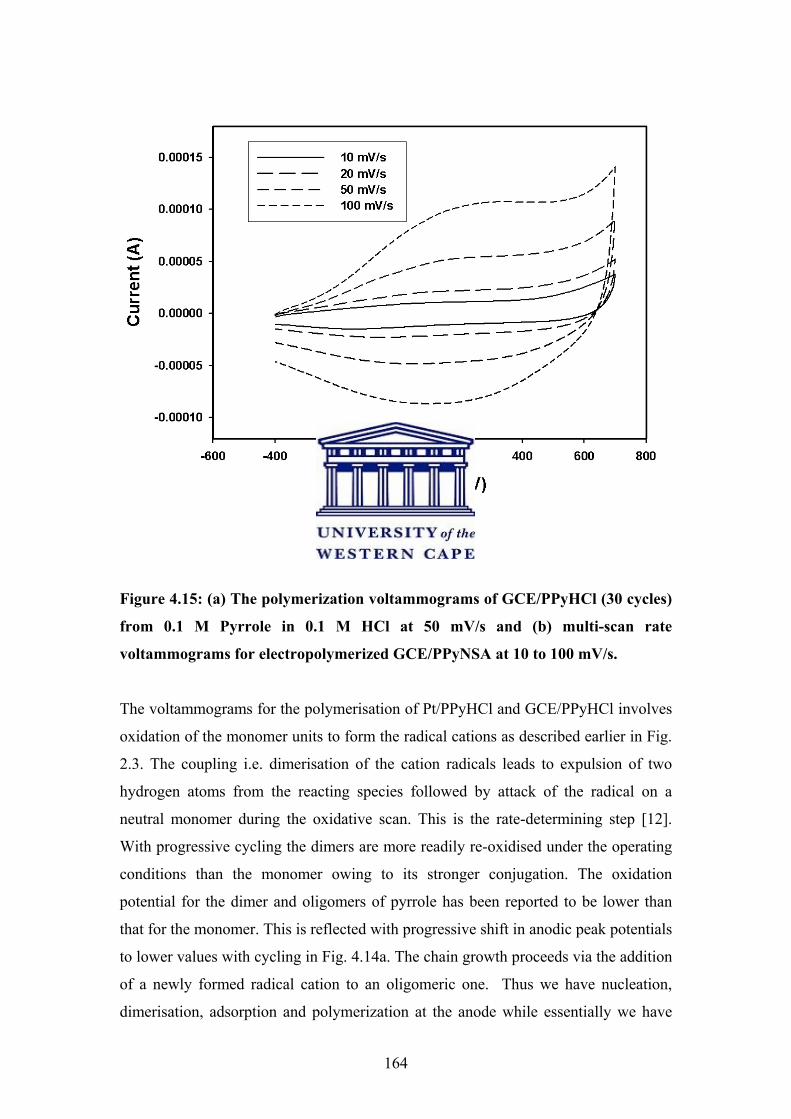
(b)
Figure 4.15: (a) The polymerization voltammograms of GCE/PPyHCl (30 cycles)
from 0.1 M Pyrrole in 0.1 M HCl at 50 mV/s and (b) multi-scan rate
voltammograms for electropolymerized GCE/PPyNSA at 10 to 100 mV/s.
The voltammograms for the polymerisation of Pt/PPyHCl and GCE/PPyHCl involves
oxidation of the monomer units to form the radical cations as described earlier in Fig.
2.3. The coupling i.e. dimerisation of the cation radicals leads to expulsion of two
hydrogen atoms from the reacting species followed by attack of the radical on a
neutral monomer during the oxidative scan. This is the rate-determining step [12].
With progressive cycling the dimers are more readily re-oxidised under the operating
conditions than the monomer owing to its stronger conjugation. The oxidation
potential for the dimer and oligomers of pyrrole has been reported to be lower than
that for the monomer. This is reflected with progressive shift in anodic peak potentials
to lower values with cycling in Fig. 4.14a. The chain growth proceeds via the addition
of a newly formed radical cation to an oligomeric one. Thus we have nucleation,
dimerisation, adsorption and polymerization at the anode while essentially we have
164
polymerisation at the cathode. The shifts of anodic peak position to lower potential
with cycling were due to the continuous ease of polymerization after the initiation of
the polymerization process. Subsequent growth of polymer layers can only take place
after the formation of conducting polymer nuclei at the electrode surface via
adsorption. Electrochemical evidence of this is the nucleation loop present at the
reduction switch-potential in the cyclic voltammogram in Fig. 4.14a.
Electropolymerisation of PPyNSA
The introduction of the surfactant (NSA) into the electrolyte medium caused a
reduction in the conductivity of the medium and thus posing greater difficulty in
electrolytic polymerisation. This trend is occasioned by organic nature of the NSA
which is less conducting than when pure HCl solution is used. The electrosynthesis of
PPyNSA on platinum disc electrode was not successful due to the high electrode
resistivity preventing initiation of polymerization process at the experimented
conditions. The observed trend in the electropolymerisation on GCE was however
better as there was less resistance to polymer adsorption on the electrode surface (Fig
4.16a). The multi scan voltammograms of the GCE/PPyNSA featured a diffusion
controlled system with peak separations ranging from 108 to 369mV while the |Ip,a /
Ip,c| ranged from 1.6 – 2.2 with lower values at low scan rates respectively (Fig.
4.16b). The GCE/PPyNSA redox peak potential points were unfortunately not sharp
at low scan rates. Sharper peaks were seen at scan rates of over 100 mVs-1 but they
were not kinetically related (Fig. 4.16b).
165

(a)
(b)
Figure 4.16: Polymerization voltammograms of GCE/PPyNSA (15 cycles) from
0.1 M Pyrrole and 0.05 M NSA in 0.1 M HCl at 50 mVs-1 (a), and multi scan rate
voltammogram for the electropolymerized GCE/PPyNSA at 5 to 400 mV/s (b).
166

Cyclic voltammetry (CV) of over-oxidized electrosynthesised PPyNSA
During the potentio-dynamic electro-synthesis of PPyNSA at room temperature in
excess of a potential higher than 800mV, I observed there was over oxidation of
PPyNSA. It had been reported that the use of platinum electrode for the synthesis of
metal-doped polypyrrole has the disadvantage of loss of polypyrrole activity at
potentials more anodic than 700mV and activity decrease at potentials more cathodic
than – 300mV [11]. This was traced to the high electro catalytic activity of
polypyrrole on platinum electrode. The electropolymerisation (10 cycles) of PPyNSA
on GCE using high anodic switch potential of 1500 mV from from 0.1 M Pyrrole and
0.05 M NSA in 0.1 M HCl using a scan rate of 20 mV/s at room temperature is shown
in Figure 4.17a. At the potential window of -800mV to 1500mV used, there was
cathodic growth over the first four cycles of the 10 cycles of polymerization after
which growth ceased. The anodic peak current showed continual decrease in peak
current with cycling. Upon characterisation of the film, there was no anodic peak
because of the overoxidation but the cathodic peak currents increased with scan rate
from 5 to 100 mV/s (Fig. 4.17b) after which there was progressive decrease in current
with increasing scan rate. The decrease in current is due to saturation of the electrode
surface with poor conducting film generated at the high potentials used for
polymerisation. The shifts in the anodic peak currents to lower potentials with
progressive cycling was due to the high potential used, which generated less
electroactive and less conducting film. Overoxidised PPy, despite its disadvantages of
decreased electroactivity, has wide electro analytical applications that utilize perm-
selectivity [9]. The overoxidation was however curtailed when the electrosynthesis
was done using an electrolyte/monomer mixture equilibrated at 0 ˚C within the same
potential window. Usage of higher scan rates for the polymerisation is undesireable as
it saturates the electrode surface faster.
167

(a)
(b)
Figure 4.17: (a) Polymerization voltammograms of GCE/PPyNSA (10 cycles)
from 0.1 M Pyrrole and 0.05 M NSA in 0.1 M HCl at 20 mVs-1 showing
overoxidation current pattern, (b) multiscan voltammograms.
168
4.5.2.2 Kinetic studies on electrosynthesised PPyHCl
Pt/PPyHCl The dynamics of electropolymerisation of PPyHCl is as shown in Fig 4.14. Analysis
of the polymerisation and the multiscan rates voltammogram displayed in Fig. 4.14 (a
and b), as well as the OSWV and DPV investigation showed that about 3 electrons
might be involved in the polymerisation process. The peak separation, ∆Ep, between
the anodic and cathodic peaks in Fig. 4.14b is about 171 mV which suggest that there
may be more than one redox couple involved in the electrochemistry as earlier
discussed for PPyNSA. The formal potential, Eº', of the PPyHCl system in the
hydrochloride electrolyte solution of 0.1 M HCl was estimated using the CV at 5
mV/s as 86.5 mV. This was arrived at using equation 3.1,
Eº' = (Ep,a + Ep,c) / 2 = (115.9 + 57.1) / 2 = 86.5 mV
From the CV for the polymerisation of Pt/PPyHCl, Fig 4.14a, the estimate for Eo' was
Eº' = (Ep,a + Ep,c) / 2 = (152 + 19)/2 = 85.6 mV.
Similarly the OSWV at 15 Hz, and square wave amplitude of 25 mV gave Eo'as 98.3
mV. Averaging the estimates of Eo' from these three approaches gave Eo'PPyHCl as
90.1±7.3 mV at the operating conditions.
The ratio of |Ip,a/Ip,c| was 1.88±0.24 over different scan rates between 5 to 50mV/s.
At higher scan rates, the ratio increases and thus reducing the quasireversibility of the
Pt/PPyHCl. Surface concentration (Γ*PPyHCl) at the electrode surface was estimated
from data generated at 5, 10, 20, 30, 40 and 50 mV/s using the Brown-Anson model
(equation 3.5) to be Γ*(anodic) of 1.32 x 10⁻⁸ mol cm-2 and Γ*(cathodic) of 5.93 x 10⁻⁹
mol cm-2. The Γ*(cathodic) value is a better indication of the concentration of the
PPyHCl film on the platinum surface as this is the form in which the polymer is
adsorbed on the electrode surface.
A plot of the peak currents versus square root of scan rates gave linear plots for both
anodic and cathodic waves. The slopes for the anodic and cathodic plots (Fig. 4.18)
was 9.4032 x 10⁻⁴ A / (V/s) ½ (r2 = 0.9793) and 4.2572 x 10⁻⁴ A / (V/s) ½ (r2 = 0.9928)
169
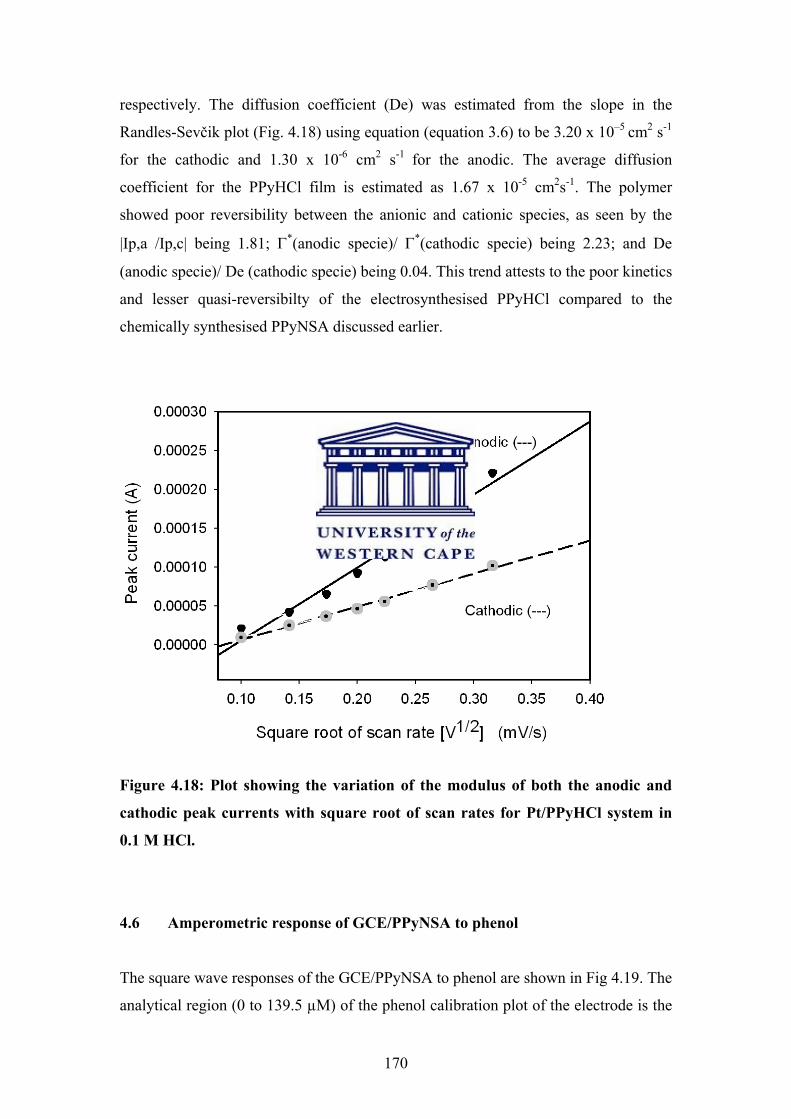
respectively. The diffusion coefficient (De) was estimated from the slope in the
Randles-Sevčik plot (Fig. 4.18) using equation (equation 3.6) to be 3.20 x 10⁻⁵ cm2 s-1
for the cathodic and 1.30 x 10⁻⁶ cm2 s-1 for the anodic. The average diffusion
coefficient for the PPyHCl film is estimated as 1.67 x 10⁻⁵ cm2s-1. The polymer
showed poor reversibility between the anionic and cationic species, as seen by the
|Ip,a /Ip,c| being 1.81; Γ*(anodic specie)/ Γ*(cathodic specie) being 2.23; and De
(anodic specie)/ De (cathodic specie) being 0.04. This trend attests to the poor kinetics
and lesser quasi-reversibilty of the electrosynthesised PPyHCl compared to the
chemically synthesised PPyNSA discussed earlier.
Figure 4.18: Plot showing the variation of the modulus of both the anodic and
cathodic peak currents with square root of scan rates for Pt/PPyHCl system in
0.1 M HCl.
4.6 Amperometric response of GCE/PPyNSA to phenol
The square wave responses of the GCE/PPyNSA to phenol are shown in Fig 4.19. The
analytical region (0 to 139.5 µM) of the phenol calibration plot of the electrode is the
170

Fig. 4.20 insert. The estimated electrode sensitivity was 3.1 mA.M-1 and the detection
limit was estimated from the noise to signal ratio of the SWV responses and found to
be 0.65 µM (i.e 2 x noise / sensitivity, where noise was estimated as 1 x 10⁻⁹ A). For
extended phenol concentration range, the GCE/PPyNSA electrode follow typical
hyperbolic Michaelis-Menten kinetics reaching IMax (maximum current) of 0.5µA at
phenol concentration of 333.3 µM. The apparent Michaelis-Menten constant (K′M)
was estimated as 160 µM. This K′M value is 48% of the observed maximum substrate
concentration of 333.3 µM for the PPyNSA-GCE sensor. Iwuoha et al [38] had
reported that maximum biosensor catalytic response is obtainable at ½ IMax, when the
K′M value is reached. The K′M value obtained is within the range 10-2 and 10-7 M
obtainable for enzyme catalysed reactions [39].
Figure 4.19: Graph of the square wave voltammetric response of GCE/PPyNSA
to different concentrations of phenol in 0.05 M HCl [22].
171

Figure 4.20: Calibration plots of GCE/PPyNSA sensor for phenol concentrations.
Insert is plot of the linear region. (Plots represent SWV responses at 70 mV
taken from Fig. 4.19) [22].
Conclusions
The effect of temperature, concentration of reacting species and synthesis conditions
have been identified as critical factors for yield and morphology in conducting
polymers of PPyNSA. This study showed that at optimal synthesis temperature of 0
oC, the highest yield of PPyNSA (99 %) is obtainable with d/m 0.8 and o/m 1.0. The
morphology of the polymer varies from thin sheets to fibres, micro rods/tubes and
nano micelles/rods/tubes. The diameters of the tubules range from 150 - 3000 nm
while the nano-sheets have a diameter of 20 nm. Use of APS-pyrrole mole
concentration ratio of 1.0 produced micelles with typical diameters of ca. 100 - 150
nm. The concentration of charge transfer species along the polymer chain through
doping with the NSA improved the solubility of the polypyrrole in organic solvents.
172
Besides, the use of NSA as dopant gave better electrochemistry than when only HCl
was used. PPyHCl was the least soluble of all the polypyrrole investigated. PPyNSA
(d/m 0.5 and o/m 0.2) gave the highest solubility; and its UV-Vis revealed polaron
and bipolaron concentration at 437 nm and 555 nm respectively. In
dodecylbenzenesulphonic acid doped polypyrrole the best compromise between
conductivity and solubility in m- cresol was found to be at o/m ratio of 0.13 [40].
FTIR result show better doping for PPyNSA (d/m 0.8, o/m 0.2) than for the PPyNSA
(d/m 0.8, o/m 1.0). EIS analysis together with OSWV data shows that the β-NSA
doped polypyrrole systems exhibit highest electroactivity at potentials between 200
mV and 300 mV. Test application of the GCE/PPyNSA electrode as phenol sensor
showed that PPyNSA based sensor can be used in the detection of phenol in water and
environmental samples. The dynamic linear range of the sensor showed that the
sensor is analytically useful at phenol concentrations of 2 – 10 µM and with the
extended hyperbolic curve higher concentration range of 0.65 - 139.5 µM could be
determined. This translates to phenol mass concentration of 6.7 - 1500 parts per
billion (ppb). This is within the range of phenol found in pharmaceutical industries
and refinery effluents.
References
1. Yang, Y.S., Liu, J. & Wan, M.X. (2002). Self-assembled conducting polypyrrole
micro/nanotubes, Nanotechnology, 13, 771-773.
2. Kassim, A., Basar, Z.B. & Mahmud, H.M.E. (2002). Effects of preparation
temperature on the conductivity of polypyrrole conducting polymer, Proc. Indian
Acad. Sci. (Chem. Sci.), 114, 155-162.
3. Wei, Z., Zhang, Z. & Wan, M. (2002). Formation mechanism of self –assembled
polyanaline micro/nanotubes, Langmuir, 18, 917–921.
4. Lee, J.Y., Kim, D.Y. & Kim, C.Y. (1995). Synthesis of soluble polypyrrole of the
doped state in organic solvents, Synthetic metals, 74, 103–106.
173
5. Turcu, R., Grecu, R., Brie, M., Peter, I., Bot, A. & Graupner, W. (2001).
Spectroscopic investigation of the electron delocalisation and molecular
conformational changes in polypyrrole induced by different doping ions, Studia
universitatis babes-bolyai, Physica, special issue, 216–222.
6. Asavapiriyanont, S., Chandler, G. K. & Gunawardena, G.A. (1984).
Electrodeposition of polypyrrole films from aqueous solutions, J. Electroanal. Chem.
177, 229 – 244.
7. Masunda, H. & Asano D. K. (2003). Preparation and properties of polypyrrole,
Synthetic Metals, 135 – 136, 43 – 44.
8. Cheng, F., Zhang, M. & Wang, H. (2005). Fabrication of polypyrrole nanaowire
and nanotube arrays, Sensors, 5, 245 – 249.
9. Duchet, J., Legras, R. & Demoustier-Champagne, S. (1998). Chemical synthesis of
polypyrrole: structure–properties relationship, Synthetic Metals, 98, 113 – 122.
10. Lu, Y., Pich, A. & Adler, H. (2003). Synthesis and characterization of nanometer-
sized polypyrrole composites, Synthetic Metals, 135 – 136, 37 – 38.
11. Yakovleva, A.A. (2000). Electrochemistry of polypyrrole films in aqueous
solutions: The character of the bond between the anion and the polymer matrix,
Russian Journal of Electrochemistry, 36(12), 1275-1282.
12. Vernitskaya, T.V. & Efimov, O.N. (1997). Polypyrrole: a conducting polymer; its
synthesis, properties and applications, Russian Chemical Reviews, 66(5): 443-457.
13. Ballav, N. & Bisvas, M. (2003). Preparation and Evaluation of a nanocomposite
of polythiophene with Al2O3, Polym. Int., 52, 179-184.
174
14. De Paoli, M-A., Zanelli, A., Mastragostino, M. & Rocco, A.M. (1997). An
electrochromic device combining polypyrrole and WO3 –II. Solid state device with
polymeric electrolyte, J. Electroanalytical Chemistry, 435, 217-224.
15. Lindfors, T., Bobacka, J. Lewenstam, A. & Ivaska, A. (1998). Study on soluble
polypyrrole as a component in all-solidstate ion-sensors. Electrochim. Acta., 43(23),
3503 – 3509.
16. Lee, H.J. & Park, S.M. (2005). Electrochemistry of conductive polymers 37.
Nanoscale monitoring of electrical properties during electrochemical growth of
polypyrrole and its aging, J. Phys. Chem. B, 109, 13247-13254.
17. Li, C.M. Sun, C.Q. Chen, W. & Pan, L. (2005). Electrochemical thin film
deposition of polypyrrole on different substrates, Surface and Coatings Technology,
198, 474–477.
18. Oh, K.W., Park, H.J. & Kim, S.H. (2005). Novel conducting polyaniline blends
with cyanoresin, J. Appl Polym Sci., 96, 1035-1042.
19. Han, D-H. Lee, H. J. & Park, S. (2004). Electrochemistry of conductive polymers
XXXV: Electrical and morphological characteristics of polypyrrole films prepared in
aqueous media studied by current sensing atomic force microscopy, Electrochim.
Acta, 50, 3085–3092.
20. Rajeshwar, K. & Ilanes, J. (1997). Environmental Electrochemistry:
Fundamentals and application in pollution abatement, Academy Press, New York,
USA, 453–470.
175
21. Akinyeye, R.O., Sekota, M., Baker, P. & Iwuoha, E. (2006). Chemical Synthesis
and Morphology of β–Naphthalene Sulphonic Acid Doped-Polypyrrole
Micro/Nanotubes, Fullerenes, Nanotubes and Carbon Nanostructures, 14, 49-55.
22. Akinyeye, R.O., Michira, I., Sekota, M., Al-Ahmed A., Baker, P. & Iwuoha, I.,
(2006). Electrochemical Interrogation and Sensor Applications of Nanostructured
Polypyrroles, Electroanalysis, 18(24), 2441-2450.
23. Kemp, W. (1988). Organic Spectroscopy, ELBS/Macmillan, 2nd ed., 204 – 206.
24. Geetha, S. & Trivedi, D.C. (2004). Studies on polypyrrole film in room
temperature melt, Materials Chemistry and Physics, 88, 388–397.
25. Rodríguez, I., Scharifker, B.R. & Mostany, J. (2000). In situ FTIR study of redox
and overoxidation processes in polypyrrole films, J. of Electroanalytical Chemistry,
491(1-2), 117-125.
26. E. I. Iwuoha, D. S. Villaverde, N. P. Garcia, M. R. Smyth, J. M. Pingarron,
Biosens. Bioelectron. 12 (8), (1997) 749–761.
27. Mathebe, N.G.R., Morrin, A. & Iwuoha, E.I. (2004). Electrochemistry and
scanning electron microscopy of polyaniline/peroxidase-based biosensor, Talanta, 64,
115-120.
28. Brahim, S., Wilson, A.N., Nariessingh, D., Iwuoha, E. & Guiseppi-Elie (2003).
Chemical and Biological Sensors Based on Electrochemical Detection Using
Conducting Electroactive Polymers, Microchim. Acta, 143, 123-137.
29. Brown, A. P. & Anson, F. C. (1977). “Cyclic and Differential Pulse Voltammetric
Behaviour of Reactants Confined to Electrode Surface”, Anal. Chem., 49, 1589-1595.
176
30. Paulse, C.D. & Pickup, P.G. (1988). J. Phys. Chem., 92, 7002, In Cascales J.J.L.
& Otero, T.F. (2004), Molecular dynamic simulation of the hydration and diffusion of
chloride ions from bulk water to polypyrrole matrix, J. Phys. Chem., 120(4), 1951-
1957.
31. Bard, A. J. & Faulkner, L. R. (2001). Electrochemical methods - Fundamentals
and Applications, John Wiley & Sons, Inc., 2nd edition, USA, chapters 6 & 10.
32. Zanello, P. (2003). Inorganic Electrochemistry: Theory, Practice and
Applications, Royal Society of Chemistry, Cambridge, UK, pp 49-135.
33. Nicholson, R.S. (1965). Theory and application of cyclic voltammetry for
measurement of electrode-reaction kinetics, Anal Chem., 35, 1351-1355.
34. Pauliukaite, R. Brett, C.M.A. & Monkman, A.P. (2004). Polyaniline fibres as
electrodes. Electrochemical Characterisation In Acid Solutions, Electrochimica Acta,
50, 159-167.
35. Sundfors, F., Bobacka, J., Ivasca, A. & Lewenstam, A. (2002). Electrochemical
impedance spectroscopy of oxidized poly(3,4–ethylenedioxythiophene) film
electrodes in aqueous solutions, Journal of Electroanalytical Chemistry, 489, 17–27.
36. Ateh, D.D., Navsaria, H.A. & Vadgama, P. (2006). Polypyrrole-based conducting
polymers and interactions with biological tissues, J. R. Soc. Interface, 3, 741–752
37. Papathanassiou, A.N., Grammatikakis, J., Sakellis, I., Sakkopoulos, S., Vitoratos,
E. & Dalas, E. (2005). Hopping charge transport mechanisms in conducting
polypyrrole: studying the thermal degradation of the dielectric relaxation. Appl. Phys.
Lett. 87, 154107.
38. Iwuoha, E. I., Rock, A. & Smith, M. R. (1999). Amperometric L-Lactate
Biosensors: 1. Lactic Acid Sensing Electrode Containing Lactate Oxidase in a
Composite Poly-L-lysine Matrix, Electroanalysis, 11(5) 367 – 373.
177

39. Chang, R. (1981). Physical Chemistry with Applications to Biological Systems,
Macmillan, New York.
40. Song, M. K., Kim, Y. T., Kim, B. S., Kim, J., Char, K. & Rhee, H. W. (2004).
Synthesis and characterization of soluble polypyrrole doped with
alkylbenzenesulphonic acids, Synth. Met., 141, 315 – 319.
178

Chapter Five
Results and discussion 2
Morphology, Spectroscopy, Electrochemistry and Applications of
novel polypyrroles-1, 2-napthaquinone-4-sulphonate (PPyNQS)
composite
This chapter gives the results for the chemical and electrochemical preparation,
characterization and application of polypyrrole modified with sodium salt of 1, 2-
napthaquinone-4-sulphonic acid (NQS). The chemical synthesis option was based on
the optimized conditions established for PPyNSA with a dopant to monomer (d/m)
mole concentration ratio of 0.8 and oxidant to monomer (o/m) mole concentration
ratios of 0.2 and 1. Yield, morphological and spectroscopic properties of the NQS-
doped polypyrrole nanomicelles is discussed. Electrochemical synthesis option was
employed for the evaluation of the redox properties and kinetics of the charge transfer
processes of the polymer. SNIFTIR spectroscopic result provided information on the
structural changes during oxidation and reduction and evidence of doping with NQS.
The test application of the PPyNQS electrode as a chemical sensor for benzidine and
naphthalene in aqueous medium is also presented.
5. Introduction
Having achieved some success in establishing optimum conditions for the synthesis of
highly electroactive, soluble and processable naphthalene sulphonic acid doped
polypyrrole PPyNSA via the chemical synthesis options [1, 2], which is one of the
major objectives of this study, it was desirable to further explore other surfactant
routes to the modification of polypyrrole. In this chapter, nanomicelles and nano-film
of novel polypyrrole 1, 2-napthaquinone-4-sulphonate (PPyNQS) was self assembled
with sodium salt of 1, 2-napthaquinone-4-sulphonic acid (NQS) and pyrrole (Py) in
179
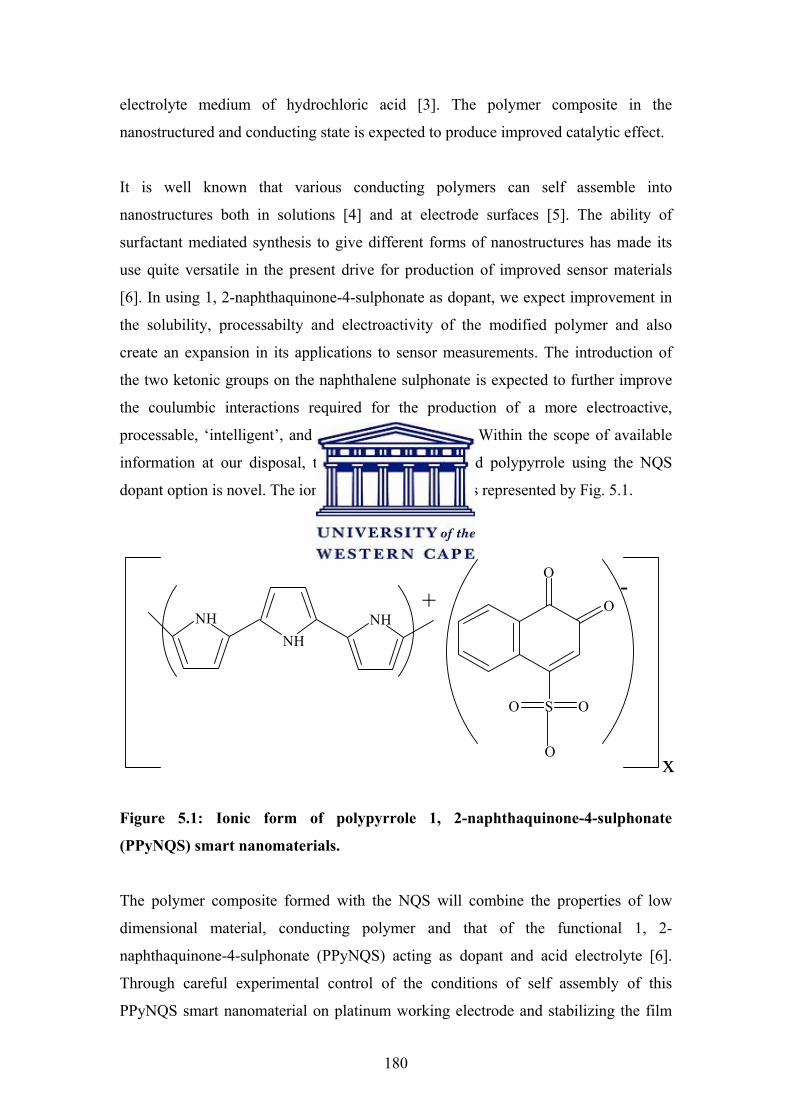
electrolyte medium of hydrochloric acid [3]. The polymer composite in the
nanostructured and conducting state is expected to produce improved catalytic effect.
It is well known that various conducting polymers can self assemble into
nanostructures both in solutions [4] and at electrode surfaces [5]. The ability of
surfactant mediated synthesis to give different forms of nanostructures has made its
use quite versatile in the present drive for production of improved sensor materials
[6]. In using 1, 2-naphthaquinone-4-sulphonate as dopant, we expect improvement in
the solubility, processabilty and electroactivity of the modified polymer and also
create an expansion in its applications to sensor measurements. The introduction of
the two ketonic groups on the naphthalene sulphonate is expected to further improve
the coulumbic interactions required for the production of a more electroactive,
processable, ‘intelligent’, and soluble polypyrrole [7]. Within the scope of available
information at our disposal, the synthesis of modified polypyrrole using the NQS
dopant option is novel. The ionic form of the polymer is represented by Fig. 5.1.
NHNH
NH+
O
O
SO O
O
-
x
Figure 5.1: Ionic form of polypyrrole 1, 2-naphthaquinone-4-sulphonate
(PPyNQS) smart nanomaterials.
The polymer composite formed with the NQS will combine the properties of low
dimensional material, conducting polymer and that of the functional 1, 2-
naphthaquinone-4-sulphonate (PPyNQS) acting as dopant and acid electrolyte [6].
Through careful experimental control of the conditions of self assembly of this
PPyNQS smart nanomaterial on platinum working electrode and stabilizing the film
180
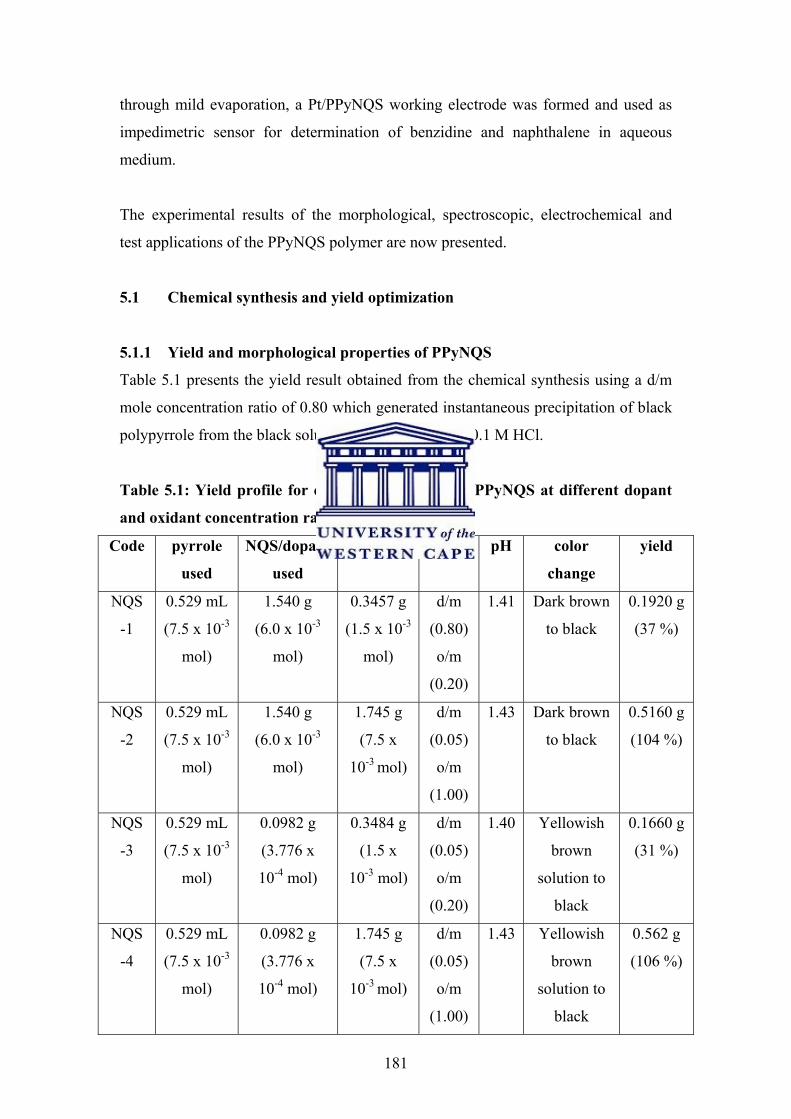
through mild evaporation, a Pt/PPyNQS working electrode was formed and used as
impedimetric sensor for determination of benzidine and naphthalene in aqueous
medium.
The experimental results of the morphological, spectroscopic, electrochemical and
test applications of the PPyNQS polymer are now presented.
5.1 Chemical synthesis and yield optimization
5.1.1 Yield and morphological properties of PPyNQS
Table 5.1 presents the yield result obtained from the chemical synthesis using a d/m
mole concentration ratio of 0.80 which generated instantaneous precipitation of black
polypyrrole from the black solution of pyrrole/NQS in 0.1 M HCl.
Table 5.1: Yield profile for chemically synthesised PPyNQS at different dopant
and oxidant concentration ratios.
Code pyrrole
used
NQS/dopant
used
APS used ratios pH color
change
yield
NQS
-1
0.529 mL
(7.5 x 10⁻³
mol)
1.540 g
(6.0 x 10⁻³
mol)
0.3457 g
(1.5 x 10⁻³
mol)
d/m
(0.80)
o/m
(0.20)
1.41 Dark brown
to black
0.1920 g
(37 %)
NQS
-2
0.529 mL
(7.5 x 10⁻³
mol)
1.540 g
(6.0 x 10⁻³
mol)
1.745 g
(7.5 x
10-3 mol)
d/m
(0.05)
o/m
(1.00)
1.43 Dark brown
to black
0.5160 g
(104 %)
NQS
-3
0.529 mL
(7.5 x 10⁻³
mol)
0.0982 g
(3.776 x
10-4 mol)
0.3484 g
(1.5 x
10-3 mol)
d/m
(0.05)
o/m
(0.20)
1.40 Yellowish
brown
solution to
black
0.1660 g
(31 %)
NQS
-4
0.529 mL
(7.5 x 10⁻³
mol)
0.0982 g
(3.776 x
10-4 mol)
1.745 g
(7.5 x
10-3 mol)
d/m
(0.05)
o/m
(1.00)
1.43 Yellowish
brown
solution to
black
0.562 g
(106 %)
181
Fig. 5.2 shows the SEM micrograph of dry powder of PPyNQS at nanometer range. It
displayed clusters of micelles and grains with diameters ranging from 50 – 150 nm,
which are compactly joined together with helical chains of about 20 nm diameters.
The cluster arrays provide large surface area for electron hopping. The existence of
this morphology is derived from the micelle guided growth process at optimum
conditions of dopant to monomer (d/m) mole concentration ratios of 0.05 and oxidant
to monomer (o/m) mole concentration ratios of 0.2 and 1 for Fig. 5.2a and b
respectively. The pyrrole molecules preferentially dissolved into the micellar
assembly of the surfactant because of the monomers hydrophobic nature and through
external nucleation generate networks of clusters [6]. This ordered arrangement led to
the micellic clusters seen in the micrograph.
The structure of the polymer might change from spherical to rod- and lamellar-shape
as the concentration of the surfactant increases. It is therefore important to ensure that
the surfactant’s critical micelle concentration (CMC) is not exceeded for production
of electroactive polymer. The optimized synthesis condition for the electrochemical
synthesis requires a maximum d/m ratio of 0.1. At higher concentrations of surfactant
the polymer is over-oxidised. The micellic clusters seen in the chemically synthesized
PPyNQS was obtainable at d/m concentration ratio of 0.05.
Fig. 5.3 shows the energy dispersive X-ray (EDX) spectra and the elemental analysis
for carbon, oxygen and sulphur based on the micrograph portion containing the
nanostructures. The proximate % elemental composition of C:89; O:5 and S:6 for
PPyNQS compares with that for PPyNSA, which was C:91; O:3 and S:3. The higher
% elemental composition S for PPyNQS is an indication of better surfactant
incorporation into the polymers structure via sulphonation of the polypyrrole moity.
Likewise the higher % elemental composition obtained for O in PPyNQS is traceable
to the ketonic group from NQS which gave additional contribution to what is
obtainable for NSA.
182
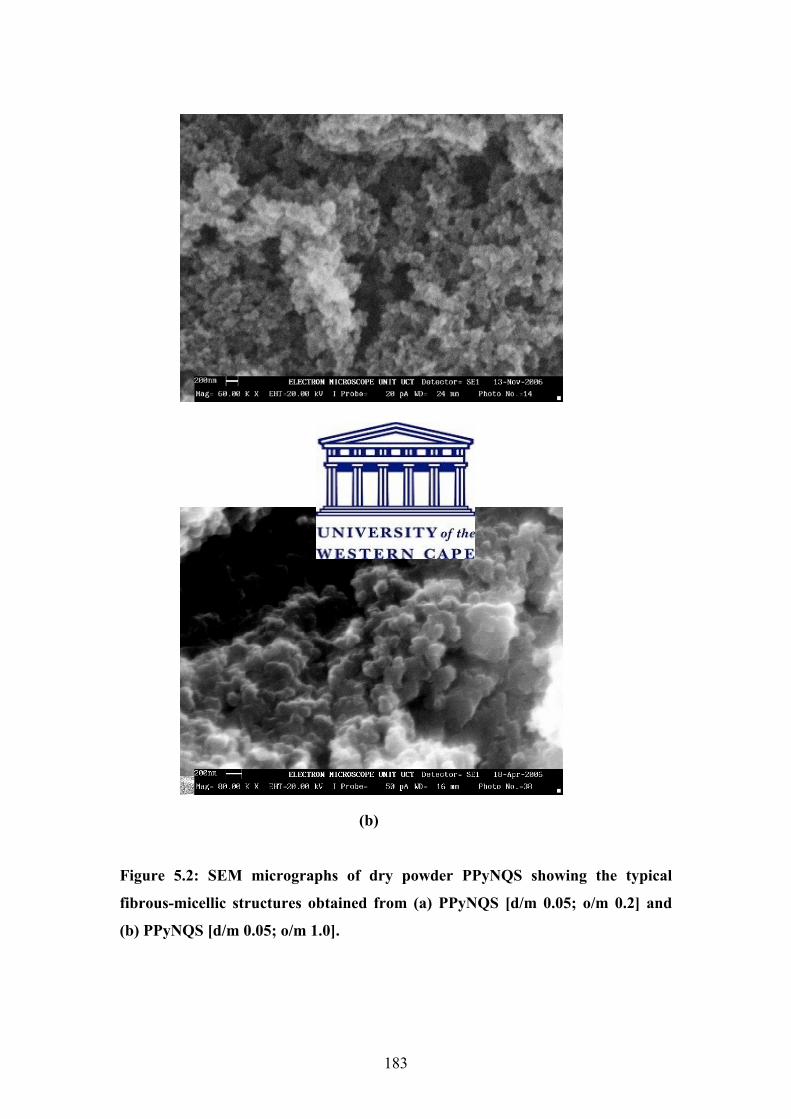
(a)
(b)
Figure 5.2: SEM micrographs of dry powder PPyNQS showing the typical
fibrous-micellic structures obtained from (a) PPyNQS [d/m 0.05; o/m 0.2] and
(b) PPyNQS [d/m 0.05; o/m 1.0].
183

Figure 5.3: SEM and EDX analysis for dry powder of PPyNQS (top) compared
with that from naphthalene sulphonic acid doped polypyrrole (PPyNSA).
5.1.2 Spectroscopic properties of PPyNQS
FTIR
Figure 5.4 shows the Fourier Transform Infra Red (FTIR) spectra of PPyNQS
obtained from the two o/m mole concentration ratios of 0.2 and 1.0 compared with
that where NQS was not used (PPyDW). The spectra showed the existence of all the
characteristic absorption bands for polypyrrole with slight variations in the absolute
values for the PPyDW, PPyNQS (d/m 0.05; o/m 0.2) and PPyNQS (d/m 0.05; o/m
1.0). The characteristic absorption bands observed were compared with those reported
by Geetha and Trivedi [8] for doped polypyrrole and presented in Table 5.2. The
absence of the usual N – H stretching vibration at 3400 cm-1 shows that the polymers
are not in the neutral state just as was observed for the PPyNSA system in chapter
four. The N – H stretching band for neutral polypyrrole at 1450 cm-1 shifted positively
by 11 cm-1 in PPyNQS (d/m 0.05, o/m 0.2) and by 8 in the more oxidized polypyrrole
PPyNQS (d/m 0.05, o/m 1.0). This is a confirmation that the polymers were not in the
%C = 89 %O = 5 %S = 6
PPYNQS
PPYNSA
%C = 91 %O = 3 %S = 3
184

aromatic states but rather in the excited polaronic states. The C=C and C-C stretching
band absorption at 1542 cm-1 in the two PPyNQS system is synonymous to the
absorption band of 1545 cm-1 characteristic of doped PPy [8]. The usual C-H
deformation at 1050 cm-1 for doped polypyrrole was observed at 1042 cm-1 for the
PPyNQS system. The sensitivity of the instrument could not resolve clearly the
doublet, asymmetric stretching of O=S=O at 1320 and 1288 cm-1 which is expected
for polypyrrole doped with sulphonic acids. More interesting investigation was sought
using SNIFTIR and the results are discussed underneath.
Wavenumber (cm-1)
1000200030004000
Tran
smitt
ance
(%)
20
40
60
80
100
a
b
c
Figure 5.4: FTIR spectra of polypyrroles in KBr medium for: (a) PPyDW, (b)
PPyNQS (d/m 0.05; o/m 0.2) and (c) PPyNQS (d/m 0.05; o/m 1.0).
185
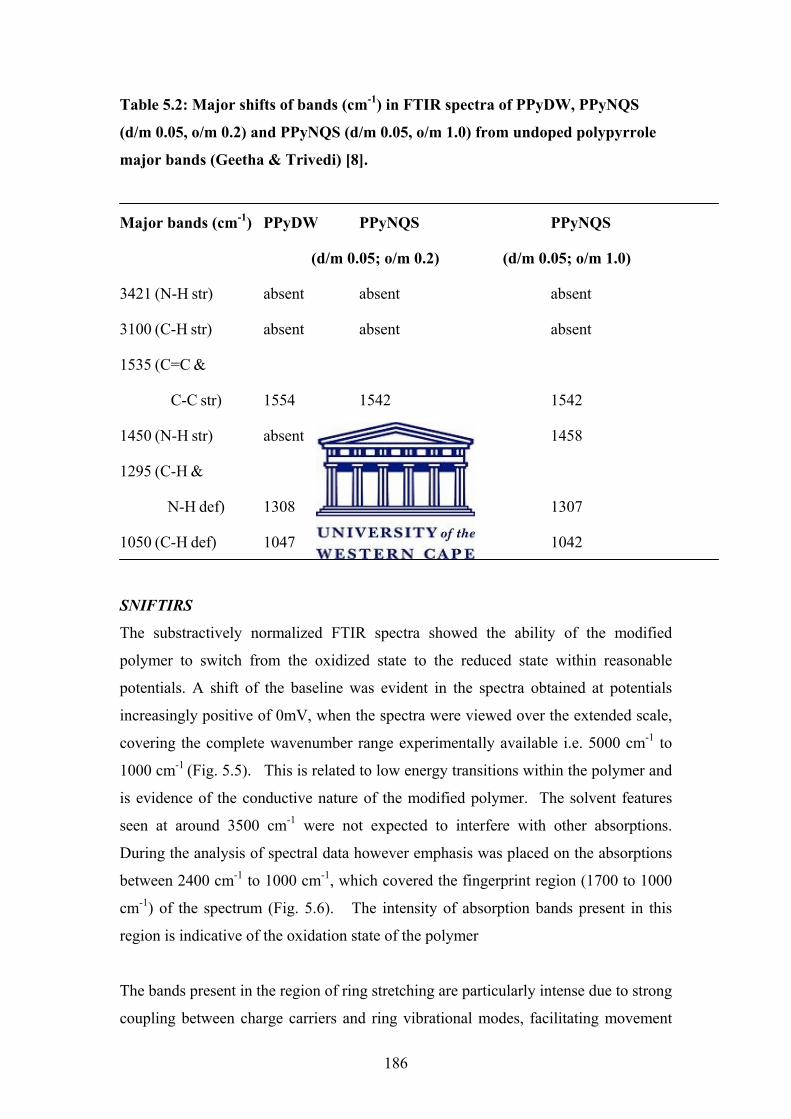
Table 5.2: Major shifts of bands (cm-1) in FTIR spectra of PPyDW, PPyNQS
(d/m 0.05, o/m 0.2) and PPyNQS (d/m 0.05, o/m 1.0) from undoped polypyrrole
major bands (Geetha & Trivedi) [8].
Major bands (cm-1) PPyDW PPyNQS PPyNQS
(d/m 0.05; o/m 0.2) (d/m 0.05; o/m 1.0)
3421 (N-H str) absent absent absent
3100 (C-H str) absent absent absent
1535 (C=C &
C-C str) 1554 1542 1542
1450 (N-H str) absent 1461 1458
1295 (C-H &
N-H def) 1308 1307 1307
1050 (C-H def) 1047 1042 1042
SNIFTIRS
The substractively normalized FTIR spectra showed the ability of the modified
polymer to switch from the oxidized state to the reduced state within reasonable
potentials. A shift of the baseline was evident in the spectra obtained at potentials
increasingly positive of 0mV, when the spectra were viewed over the extended scale,
covering the complete wavenumber range experimentally available i.e. 5000 cm-1 to
1000 cm-1 (Fig. 5.5). This is related to low energy transitions within the polymer and
is evidence of the conductive nature of the modified polymer. The solvent features
seen at around 3500 cm-1 were not expected to interfere with other absorptions.
During the analysis of spectral data however emphasis was placed on the absorptions
between 2400 cm-1 to 1000 cm-1, which covered the fingerprint region (1700 to 1000
cm-1) of the spectrum (Fig. 5.6). The intensity of absorption bands present in this
region is indicative of the oxidation state of the polymer
The bands present in the region of ring stretching are particularly intense due to strong
coupling between charge carriers and ring vibrational modes, facilitating movement
186

of carriers within conjugated polymer chains. These enhanced signals (IRAV bands)
are typical of doped conducting polymers. The vibrations occur as paired bands at
very close frequencies. The downward bands at 1531 and 1586 cm-1 were assigned
to C=C and C-C vibrations. The bands at 1432 and 1380 cm-1 are assigned to C=N
vibration. The band at 1294 cm-1 was assigned to N-H in plane contributions.
Evidence of the sulphonic acid presence in the doped polymer matrix was provided by
the absorption bands at 1172 and 1080 cm-1 in Fig. 5.6 assigned to the asymmetric
stretch of the O=S=O group [9-12]. An absorption band at 2340 cm-1 which increased
in intensity at potentials above 300 mV, is indicative of the presence of CO2 [9, 12,
13].
10002000300040005000Wavenumber cm-1
-20
-10
010
20Tr
ansm
ittan
ce [%
]
0 mV
600 mV
Finger print region
(enlarged)
H2O absorption
CO2
Figure 5.5: Full SNIFTIRS spectra of PPyNQS at 100 mV potential intervals
from 0 to 600 mV, vs calomel electrode.
187

Figure 5.6: Normalised SNIFTIRS spectra of PPyNQS showing the enlargement
of the finger print region.
UV-Vis results
The polymer showed good solubility in DMSO and DMF. Figure 5.7 shows the UV-
Vis of PPyNQS compared with that of polypyrrole prepared in distilled water in the
undoped state, (PPyDW) taken in DMF. The sharp peaks at 380, 750 and 820 nm
corresponds to the polaron, bipolaron and overlapped bi-polaron bands within the
polymeric structure [8, 14]. These absorptions are not associated with that of PPyDW.
The concentration of these charge carriers lends credence to the intrinsic high
electroactivity of PPyNQS through the incorporation of the surfactant dopant. The
wavelength absorption bands here are similar to that of polypyrrole doped with
naphthalene sulphonic acid in the optimized ratio of dopant/monomer (d/m)
concentration ratio of 0.5 and oxidant/monomer (o/m) concentration ratio of 0.2 [6].
188

Figure 5.7: UV-Vis results for PPyNQS compared with that of PPyDW.
5.2 Electrochemical investigation
5.2.1 Chemically synthesized PPyNQS:
Since our subsequent sensor application was based on the electrochemically generated
PPyNQS, the electrochemical investigation carried out was concentrated on the
electrochemically synthesized product.
5.2.2 Electrochemically synthesized PPyNQS
The electrosynthesis of PPyNQS in the acidic aqueous electrolyte was very successive
on both platinum and glassy carbon electrode. The choice of platinum electrode was
made because it offers a transparent surface for comparative spectroscopic studies.
Initial investigation showed that better electropolymerisation and film adherence is
obtainable at 50 mVs-1. At lower scan rates, the film formed was loosely adhered and
at higher scan rates there was poor polymer growth.
189
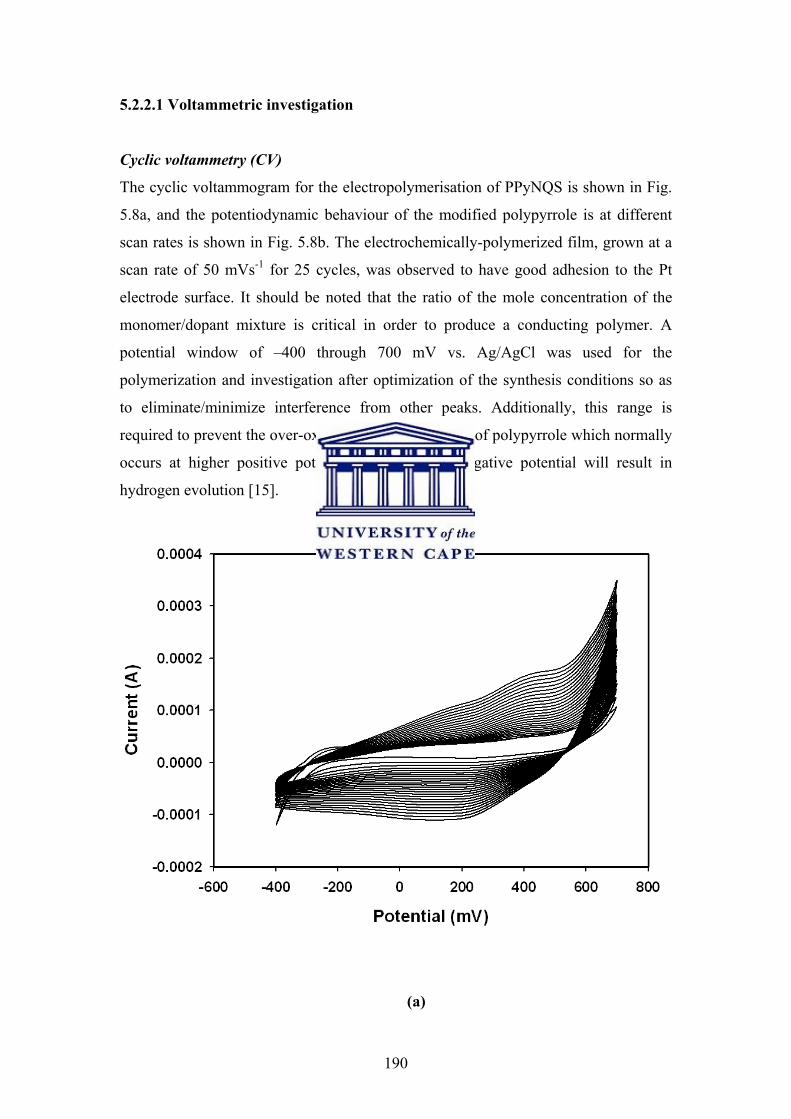
5.2.2.1 Voltammetric investigation
Cyclic voltammetry (CV)
The cyclic voltammogram for the electropolymerisation of PPyNQS is shown in Fig.
5.8a, and the potentiodynamic behaviour of the modified polypyrrole is at different
scan rates is shown in Fig. 5.8b. The electrochemically-polymerized film, grown at a
scan rate of 50 mVs-1 for 25 cycles, was observed to have good adhesion to the Pt
electrode surface. It should be noted that the ratio of the mole concentration of the
monomer/dopant mixture is critical in order to produce a conducting polymer. A
potential window of –400 through 700 mV vs. Ag/AgCl was used for the
polymerization and investigation after optimization of the synthesis conditions so as
to eliminate/minimize interference from other peaks. Additionally, this range is
required to prevent the over-oxidation and degradation of polypyrrole which normally
occurs at higher positive potentials, whilst a too negative potential will result in
hydrogen evolution [15].
(a)
190
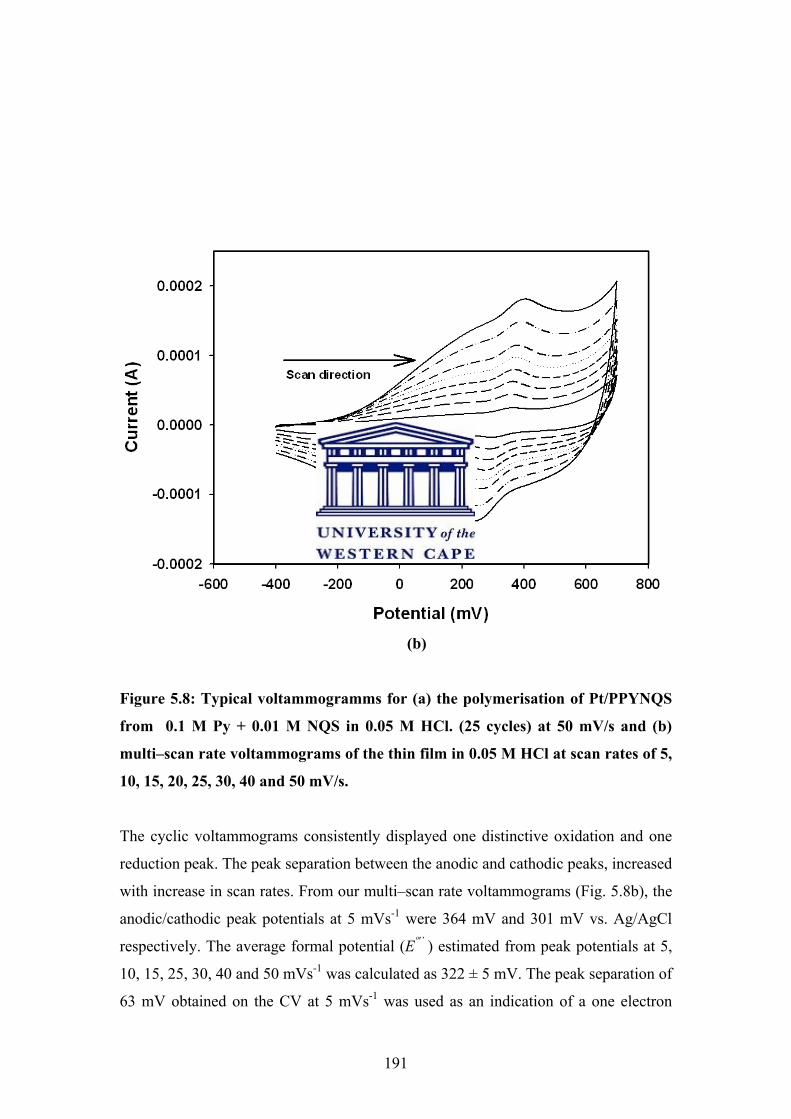
(b)
Figure 5.8: Typical voltammogramms for (a) the polymerisation of Pt/PPYNQS
from 0.1 M Py + 0.01 M NQS in 0.05 M HCl. (25 cycles) at 50 mV/s and (b)
multi–scan rate voltammograms of the thin film in 0.05 M HCl at scan rates of 5,
10, 15, 20, 25, 30, 40 and 50 mV/s.
The cyclic voltammograms consistently displayed one distinctive oxidation and one
reduction peak. The peak separation between the anodic and cathodic peaks, increased
with increase in scan rates. From our multi–scan rate voltammograms (Fig. 5.8b), the
anodic/cathodic peak potentials at 5 mVs-1 were 364 mV and 301 mV vs. Ag/AgCl
respectively. The average formal potential (Eº′’ ) estimated from peak potentials at 5,
10, 15, 25, 30, 40 and 50 mVs-1 was calculated as 322 ± 5 mV. The peak separation of
63 mV obtained on the CV at 5 mVs-1 was used as an indication of a one electron
191
process for the polymer (n = 1). Applying equation 3.2 gives an n value of 1.1.
Similar electron transfer of unity had been reported for the electropolymerisation of
polypyrrole doped with p-toluenesulphonate, [16].
Test for reversibility
In order to access the degree of reversibility of the oxidation and reduction processes
of PPyNQS, the following diagnostic tests attributed to Nicholson [17] and Matsunda
[18] were performed:
a) The change in |Ip| vs. square root of scan rates (ν1/2)
b) The |Ip,a / Ip,c | value was determined provided (αa = αc = 0.5)
c) The shifts in Ep,c with increasing ν was monitored
d) The change in ∆Ep with increasing ν was monitored and compared
with (59/n) mV obtainable for reversible systems
Data from the multi scan rate voltammetry at 5, 10, 15, 20, 25, 30, 40 and 50 mVs-1
(Fig 5.8b) were used to perform these diagnostic tests. Figure 5.9a shows the variation
of anodic and cathodic peak current with square root of the scan rates, while Fig. 5.9b
shows the variation of the modulus of both the anodic and cathodic peak current with
square root of the scan rates. Figure 5.9b shows that |Ip| increases for both anodic and
cathodic peak currents with increases in ν1/2. However, the relationship is not
proportional as |Ip| / ν1/2 is not a constant in either case. Figure 5.9b further depicts the
best-fit line for all data points with a slope of 1.0309 x 10⁻³ A / (V/s) ½ (correlation
coefficient of 98.1%); and a slope of 0.8025 x 10⁻³ A / (V/s) ½ (correlation coefficient
of 99.1%) for the anodic and cathodic peaks, respectively. Thus the results obtained
for test (a), satisfy the condition for quasi-reversibility. Based on the assumption that
the anodic and cathodic transfer coefficients (αa and αc) are equal to 0.5 for simple
electron transfer [19], the diagnostic test (b) reveals that ratio of the modulus of the
two peak currents shown in the multi plot voltammogram (Fig. 5.8b) gives 1.30 ±
0.05 which is approximately 1 over the range of 5, 10, 15, 20, 25, 30, 40 and 50 mVs-
1. This is in line with the specifications of quasi-reversible systems. Test (c) which
investigates the shifts in Ep,c with increasing ν is shown in Fig. 5.10a. It is seen that as
the scan rate increases the cathodic peak potential shifts to lower values, thus,
providing further evidence for quasi-reversibility. The final test (d) which investigates
192
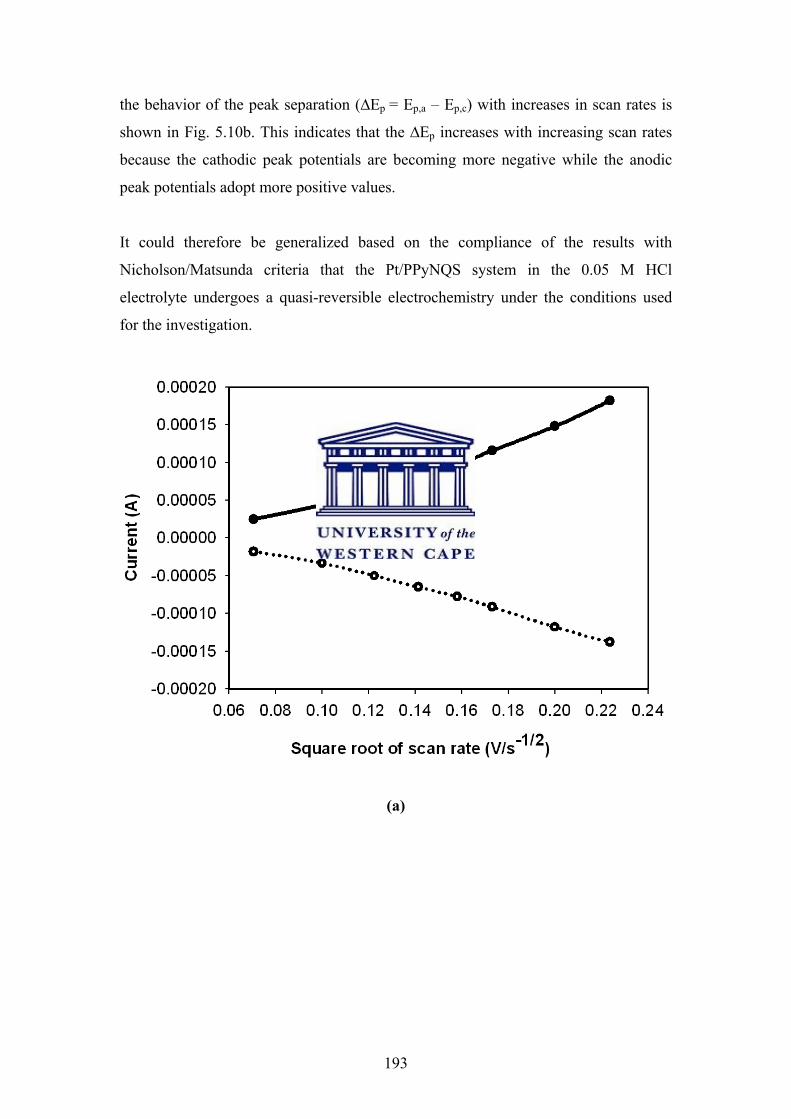
the behavior of the peak separation (∆Ep = Ep,a – Ep,c) with increases in scan rates is
shown in Fig. 5.10b. This indicates that the ∆Ep increases with increasing scan rates
because the cathodic peak potentials are becoming more negative while the anodic
peak potentials adopt more positive values.
It could therefore be generalized based on the compliance of the results with
Nicholson/Matsunda criteria that the Pt/PPyNQS system in the 0.05 M HCl
electrolyte undergoes a quasi-reversible electrochemistry under the conditions used
for the investigation.
(a)
193
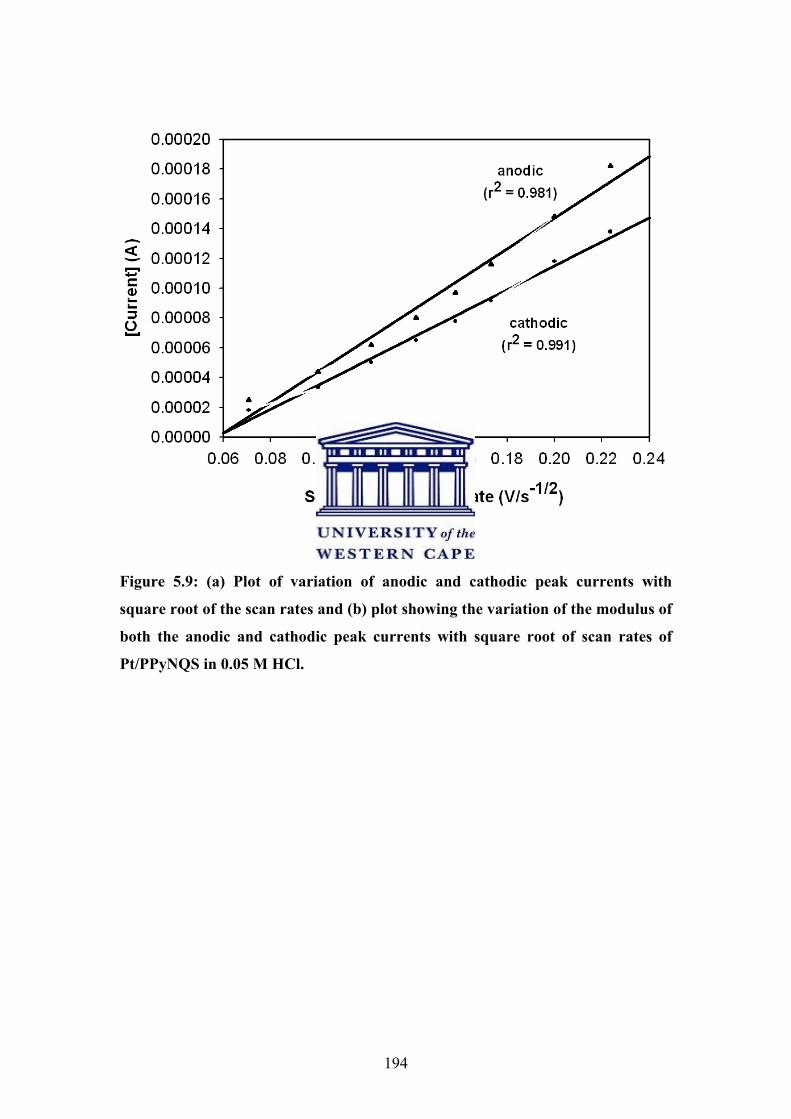
(b)
Figure 5.9: (a) Plot of variation of anodic and cathodic peak currents with
square root of the scan rates and (b) plot showing the variation of the modulus of
both the anodic and cathodic peak currents with square root of scan rates of
Pt/PPyNQS in 0.05 M HCl.
194
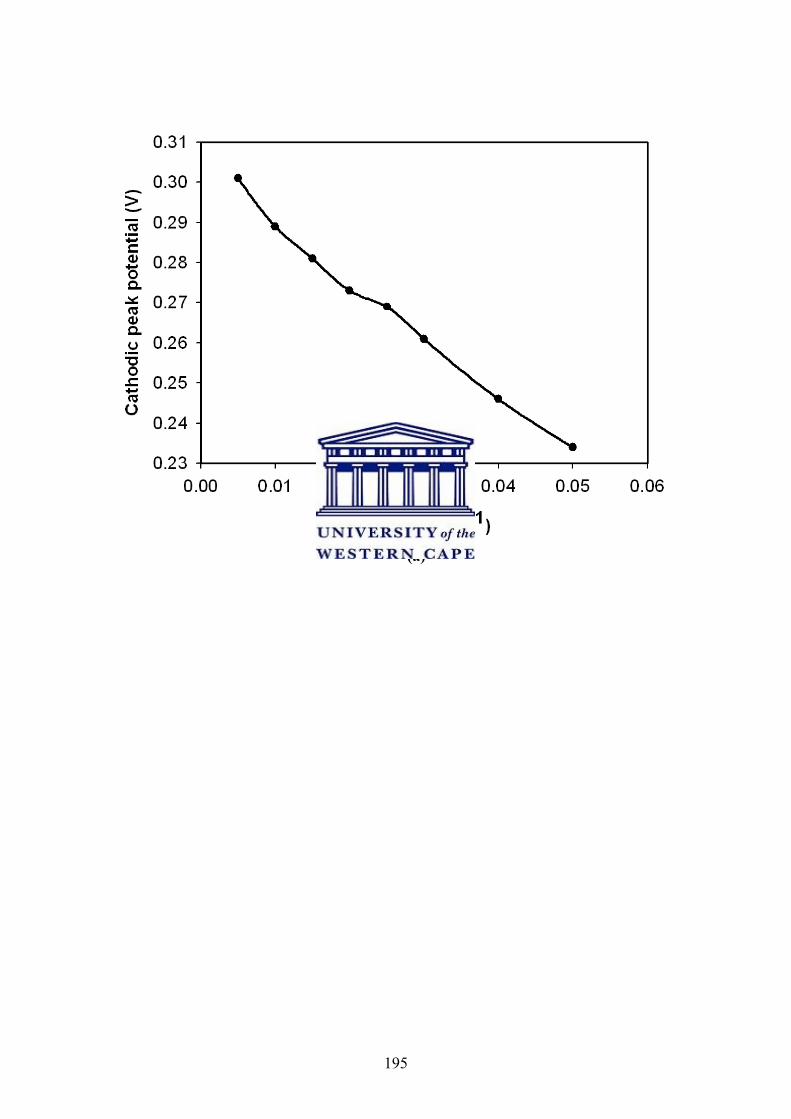
(a)
195
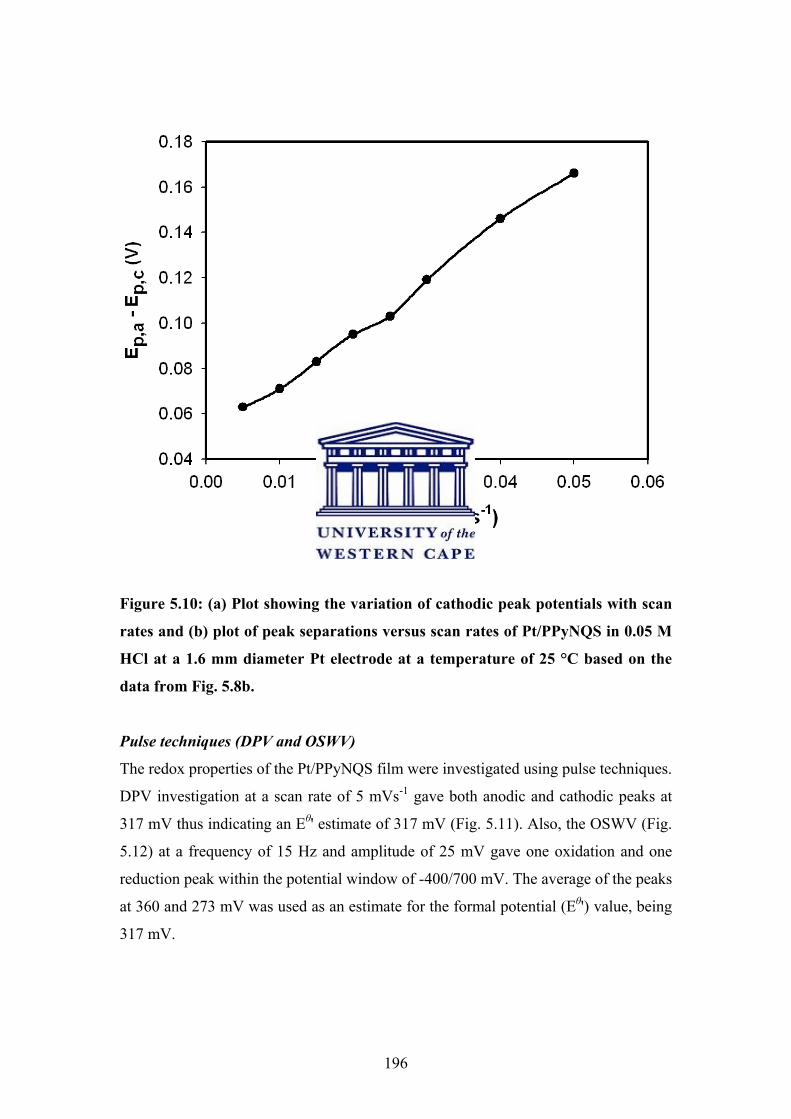
(b)
Figure 5.10: (a) Plot showing the variation of cathodic peak potentials with scan
rates and (b) plot of peak separations versus scan rates of Pt/PPyNQS in 0.05 M
HCl at a 1.6 mm diameter Pt electrode at a temperature of 25 °C based on the
data from Fig. 5.8b.
Pulse techniques (DPV and OSWV)
The redox properties of the Pt/PPyNQS film were investigated using pulse techniques.
DPV investigation at a scan rate of 5 mVs-1 gave both anodic and cathodic peaks at
317 mV thus indicating an Eθ' estimate of 317 mV (Fig. 5.11). Also, the OSWV (Fig.
5.12) at a frequency of 15 Hz and amplitude of 25 mV gave one oxidation and one
reduction peak within the potential window of -400/700 mV. The average of the peaks
at 360 and 273 mV was used as an estimate for the formal potential (Eθ') value, being
317 mV.
196

Figure 5.11: Differential pulse voltammograms for the anodic and cathodic wave
difference for Pt/PPyNQS film in 0.05 M HCl using a scan rate of 5 mV/s and 50
mV pulse amplitude.
197

Figure 5.12: Square wave voltammogram for the anodic and cathodic wave
difference for Pt/PPyNQS film in 0.05 M HCl using frequency of 15 Hz and 25
mV amplitude.
5.2.2.2 Kinetic analysis of the Pt/PPyNQS system
The Brown Anson model was used to estimate the surface concentration of the
polymer (Γ*PPyNQS) using the peak currents (Ip) obtained at different scan rates (ν)
between 5 mVs-1 and 50 mVs-1 [20]. Thus from equation 3.5:
Ip = n2 F2Γ*PPyNQS Aν / 4RT
198

The notations F, A, R and T are constants for the Faraday’s constant (96584 C mol-1),
working electrode area, molar gas constant and room temperature of 298 K
respectively. The plots in Fig. 5.13 showed linear relationship with correlation
coefficient (r2) of 0.994 and 0.999 respectively for the cathodic and anodic currents
vs. scan rates. The ratio of anodic peak current (Ip,a) to cathodic peak current (Ip,c)
ranged from 1.23 to 1.38 over the range of scan rates applied, which is not exactly
unity as required for fully reversible one electron transfer, which further gave
credence to the quasi-reversible electron transfer mechanism that was suggested. The
plot confirms the formation of a stable film whose density is slightly lower during
reduction (1.42 x 10⁻⁷ mol.cm-2) as compared to oxidation (1.83 x 10⁻⁷ mol.cm-2). This
computation was based on the Brown Anson model using the cathodic slope of 2.687
x 10-3 A.s./V and the anodic slope of 3.478 x 10⁻³ A.s./V. The intercept values, for
non- faradaic currents caused by charging of the electrical double layer at the
electrode interface were close to zero being 8.50 x 10⁻⁶ A for the cathodic plot and
9.47 x 10⁻⁶ A for the anodic plotm (Fig. 5.13). This further lays credence to the quasi-
reversible electrochemistry of the system.
The systems displayed progressive shift in anodic peak potential towards more
positive values coupled with shift in cathodic peak potential to less positive values
with increase in scan rate. The peak separations increase progressively from 63 mV at
5 mVs-1 to 166 mV at 50 mVs-1 coupled with increase in the magnitude of the peak
currents with increase in scan rates. This shows that the peak currents are diffusion
controlled. Thus the Randel-Sevčik equation (equation 3.6) was applied to determine
the diffusion coefficient (De) for electron hopping along the polymer chain [21].
Ip / ν1/2 = 2.686 x 10⁵ n3/2 A Γ*PPyNQS.De
1/2
Ip is the peak current in A, n is the number of electron transferred, ν is the scan rate in
V s-1, n is the no of electrons transferred, A is the surface area of the electrode in cm2,
Γ*PPyNQS is the surface concentration of the polymer film in mol cm-2, De is the rate
charges transportation in cm2.s-1 along the polymer chain. The slopes of the linear
plots shown in Fig. 5.9b are 1.0309 x 10⁻³ and 0.8025 x 10⁻³ A / (V/s) ½ for the
oxidation and reduction scan waves with a corresponding correlation coefficient of
0.981 and 0.991 respectively.
199
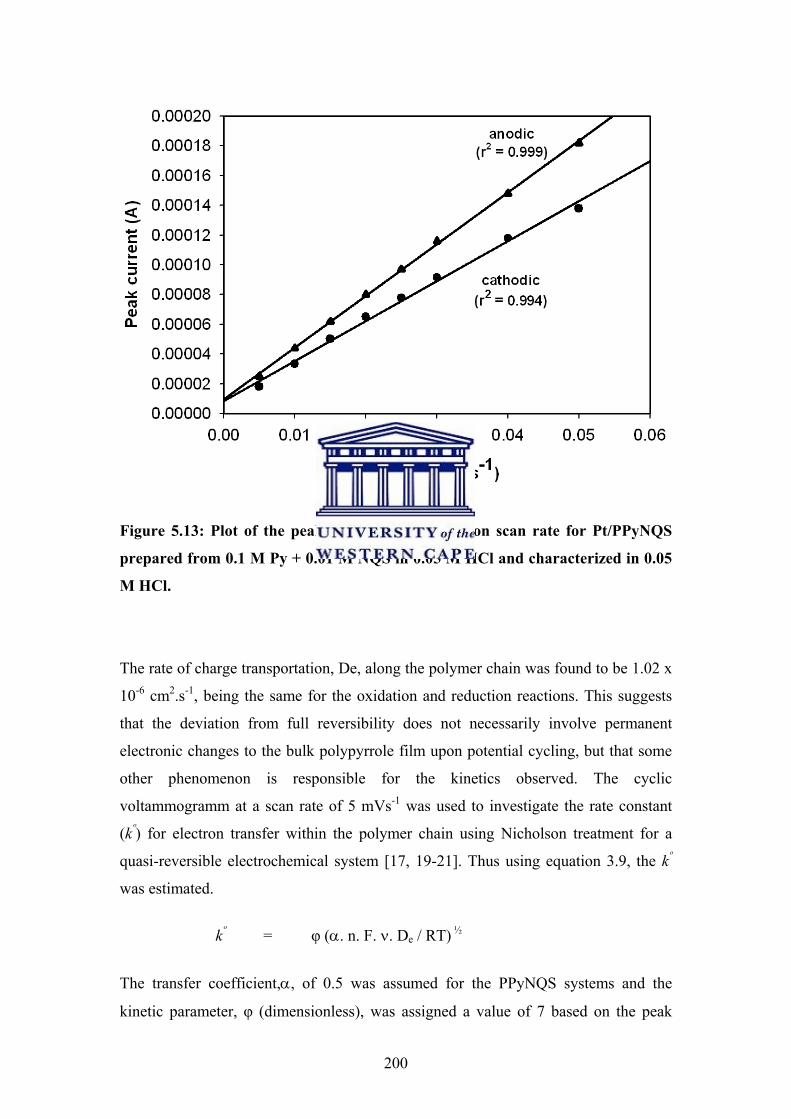
Figure 5.13: Plot of the peak current dependence on scan rate for Pt/PPyNQS
prepared from 0.1 M Py + 0.01 M NQS in 0.05 M HCl and characterized in 0.05
M HCl.
The rate of charge transportation, De, along the polymer chain was found to be 1.02 x
10-6 cm2.s-1, being the same for the oxidation and reduction reactions. This suggests
that the deviation from full reversibility does not necessarily involve permanent
electronic changes to the bulk polypyrrole film upon potential cycling, but that some
other phenomenon is responsible for the kinetics observed. The cyclic
voltammogramm at a scan rate of 5 mVs-1 was used to investigate the rate constant
(kº) for electron transfer within the polymer chain using Nicholson treatment for a
quasi-reversible electrochemical system [17, 19-21]. Thus using equation 3.9, the kº
was estimated.
kº = φ (α. n. F. ν. De / RT) ½
The transfer coefficient,α, of 0.5 was assumed for the PPyNQS systems and the
kinetic parameter, φ (dimensionless), was assigned a value of 7 based on the peak
200
separation, ΔEp, of 63 mV at a scan rate of 5 mVs-1 which indicated n = 1.1. The kº
value of 2.20 x 10⁻³ cm.s-1 obtained for the polymer at 5 mVs-1 shows that electron
hopping along the polymer chain at the low scan rate is quite facile. This is
comparable with the rate constants reported for other conducting polymers Vis. Pt/
polyaniline electrodes with kº values of 0.049 to 5.4 x 10⁻³ cms-1 in different
electrolytes [22] and Pt/poly(3,4-ethylenedioxythiophene) electrodes with kº values of
1.5 to 45.3 x 10⁻³ cms-1 when prepared under different conditions [23] under different
synthesis conditions.
5.2.2.3 Impedance spectroscopic investigation of Pt/PPyNQS
Electrochemical impedance spectroscopy (EIS) enables the separation of interfacial
electron transfer from concomitant electronic changes occurring within the bulk
material of the electrode on the basis of frequency dependent electrochemical
response. EIS data was collected, in consecutive 50 mV steps, in the potential range
corresponding to the oxidation of the polymer film (0 mV to 600 mV) and the
subsequent reduction by inversion of the steps in potential back to 0 mV. The values
obtained from the fit results of the data obtained from the impedance experiment
using the equivalent circuit in Fig. 5.14 is presented in tables 5.3 and 5.4. This
corresponds to the oxidative and reductive potential steppings respectively.
Typical data obtained at an applied potential of +50 mV vs. Ag/AgCl are shown in the
complex plane impedance plots of Fig.5.14 for a frequency range between 40,000 –
223 Hz. The data obtained over an extended frequency range of 100 KHz - 100 mHz
was analyzed using an equivalent electrical circuit consisting of the solution
resistance (Rs), an R1CPE1 parallel combination, where CPE is a constant phase
element, to model movement by electron hopping through the polymer film along the
polymer backbone, and a second R2C2 component in series representing the electrode
/solution interface, as indicated in [24, 25]. The CPE was modelled as a non-ideal
capacitance, according to equation 3.24
CPE = 1 / (Ciω) n equation 3.24
201

The CPE is defined by two values i.e. the capacitance, C, and the CPE exponent, n,
which has a value between 0.5 and 1 for a non-ideal capacitor. If n equals 1, the
equation is identical to that of a capacitor and smaller values can be related to surface
roughness and inhomogeneities, which lead to frequency dispersion. When a CPE is
placed in parallel to a resistor, a depressed semi-circle (Cole-Element) is produced.
Figure 5.14: Complex plane impedance plots of PPyNQS thin film electrode at
50 mV vs. Ag/AgCl in 0.05 M HCl during (•) step-by-step oxidation and (o)
subsequent reduction, (insert is the equivalent circuit used to fit the data).
202

Table 5.3: Analysis of the oxidative impedance data at the conductive polymer
electrode.
Potential
/mV
Rs
/Ωcm2
CPE1-T
/mFcm-2
CPE1-P Rct
/ Ωcm2
Cdl
/ µFcm-2
Rit
/ Ωcm2
50 10.54 0.98 0.597 20.88 28.0 4.22
100 10.11 1.98 0.553 17.76 28.8 3.74
150 10.00 2.58 0.538 14.81 32.9 3.13
200 9.67 2.94 0.543 11.87 32.9 3.14
250 9.59 3.40 0.532 11.19 34.7 2.87
300 9.68 3.55 0.529 10.76 35.5 2.77
350 9.85 3.14 0.545 10.88 34.7 2.74
400 9.55 3.30 0.533 11.52 34.5 2.95
Table 5.4: Analysis of reductive impedance data at the conductive polymer
electrode.
Potential
/mV
Rs
/ Ωcm2
CPE1-T
/mFcm-2
CPE1-P Rct
/ Ωcm2
Cdl
/ µFcm-2
Rit
/ Ωcm2
400 10.19 1.29 0.58 16.68 30.7 4.09
350 10.22 0.48 0.58 16.2 31.3 3.76
300 10.23 1.35 0.59 14.43 34.8 3.33
250 10.11 1.78 0.57 14.35 39.6 3.17
200 10.07 2.02 0.56 14.55 42.4 3.12
150 10.12 1.60 0.58 13.96 46.9 2.94
100 10.22 1.23 0.60 14.32 47.0 2.91
50 10.37 0.84 0.63 16.03 49.5 2.78
0 10.53 0.54 0.66 19.19 52.7 2.86
203

The solution resistance varied from 9.6 to 11.0 Ω. The values of R1 and CPE1 were
interpreted through the electrical characteristics of the electropolymerised PPyNQS
polymer bulk material. The capacitive nature of the bulk material was substantiated
by the inverse relationship between the capacitance and resistance values of the high
frequency loop. The polymer material showed good conductivity (10 – 20 Ω) and in
the region of the formal potential as obtained by voltammetric experiments, the
conductivity of the polymer material was measured as 10.8 Ω. The average value of n
for all experiments was 0.56, which is indicative of a rather rough morphology and
porous structure and is probably also associated with electron hopping along the
polymer backbone. The interface of the polymer with the HCl electrolyte showed
consistently low values of capacitance, C2 (30 μF) and resistance, R2 (2.7 - 4.2 Ω)
during the oxidation steps, the latter reaching a minimum value at the formal
oxidation potential. The electron transfer from solution to the polymer film during
oxidation is thought to be direct electron transfer without mediation by any surface
bound species, since the interfacial capacitance values of 16 μF hardly varied over the
potential range studied.
During the subsequent reduction steps, from 600 mV to 0 mV vs. Ag/AgCl, the
capacitance (2 mF) and the resistance (15.5 Ω) of the polymer bulk material remained
fairly constant. The bulk capacitance (CPE1) and resistance (R1) values were of the
same order of magnitude during the reduction steps as compared with oxidation.
However, a plot of the interfacial capacitance (C2) versus applied potential showed a
gradual increase in capacitance as the potential became more negative, and gradual
increase as it became more positive (Fig. 5.15). The capacitance values for the
oxidation and reduction trend intersect in the region of the formal potential (300 mV).
204

Figure 5.15: Plot of interfacial capacitance versus potential for the oxidation and
reduction of the PPyNQS thin film.
This trend suggests a disruption to the direct electron transfer kinetics observed during
oxidation. Evidence from SNIFTIRS equally suggests degradation of surface bound
polymer units by anions in solution (e.g. Cl-) which results in ring opening of surface
polymer units and eventual loss of CO2, similar to the structural degradation induced
in pyrrole under strongly basic conditions [26]. This surface chemistry could explain
the observed changes in EIS data and confirms the quasi-reversible oxidation kinetics
predicted by the scan-rate-dependent CV. The difference between the complex plane
impedance plots at 50 mV before oxidation and after reduction (Fig.5.15) is further
evidence of this.
Polymer structure and proposed mechanism for the surface chemistry
During the first cycle of electrochemical polymerization of pyrrole an inner layer is
formed upon which the polymerized polypyrrole grows. Subsequent cycling steps
allow for the development of the polymer chain resulting in the main layer and the
thickness thereof depends on the number of potential cycles employed. It is also the
main layer that influences overall film stability. The outer layer is produced by
polymer termination when the potential is turned off and is made up of mainly short
205
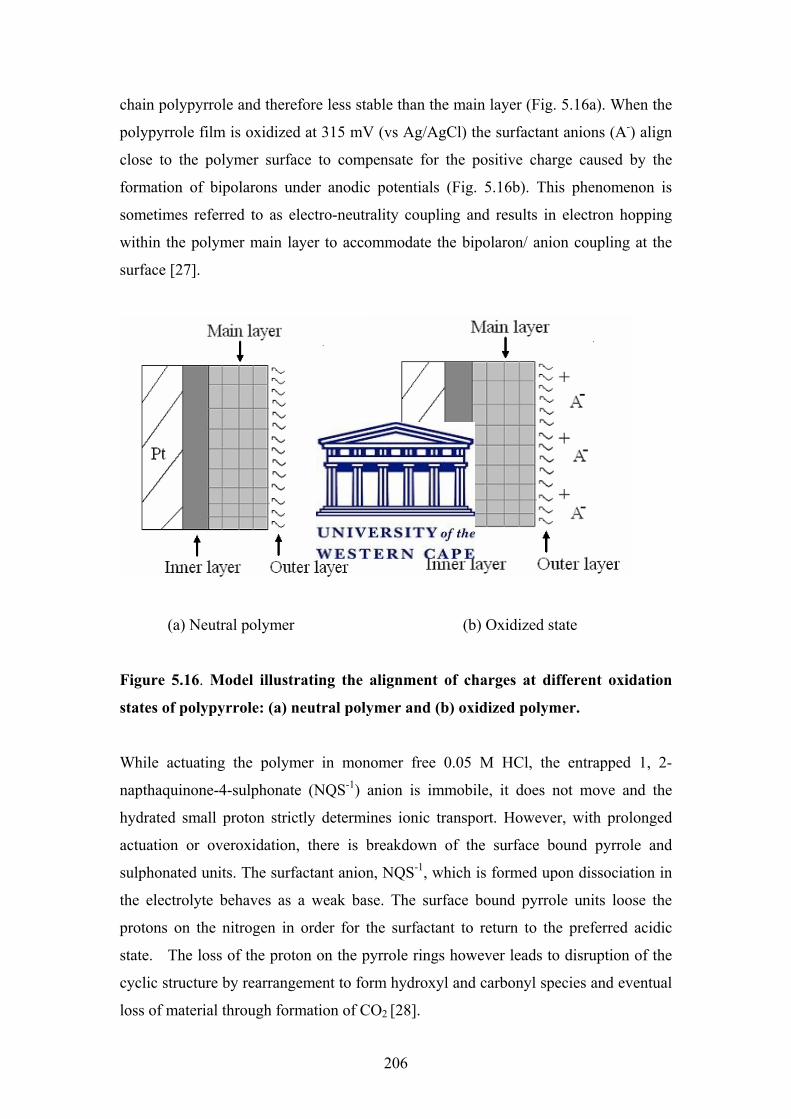
chain polypyrrole and therefore less stable than the main layer (Fig. 5.16a). When the
polypyrrole film is oxidized at 315 mV (vs Ag/AgCl) the surfactant anions (A-) align
close to the polymer surface to compensate for the positive charge caused by the
formation of bipolarons under anodic potentials (Fig. 5.16b). This phenomenon is
sometimes referred to as electro-neutrality coupling and results in electron hopping
within the polymer main layer to accommodate the bipolaron/ anion coupling at the
surface [27].
(a) Neutral polymer (b) Oxidized state
Figure 5.16. Model illustrating the alignment of charges at different oxidation
states of polypyrrole: (a) neutral polymer and (b) oxidized polymer.
While actuating the polymer in monomer free 0.05 M HCl, the entrapped 1, 2-
napthaquinone-4-sulphonate (NQS-1) anion is immobile, it does not move and the
hydrated small proton strictly determines ionic transport. However, with prolonged
actuation or overoxidation, there is breakdown of the surface bound pyrrole and
sulphonated units. The surfactant anion, NQS-1, which is formed upon dissociation in
the electrolyte behaves as a weak base. The surface bound pyrrole units loose the
protons on the nitrogen in order for the surfactant to return to the preferred acidic
state. The loss of the proton on the pyrrole rings however leads to disruption of the
cyclic structure by rearrangement to form hydroxyl and carbonyl species and eventual
loss of material through formation of CO2 [28].
206
This suggests that some pyrrole units on the surface of modified polypyrrole chain
undergoes ring opening [26]. The lone pair on the ring nitrogen combined with the
four π electrons of the two double bonds to give pyrrole an aromatic sextet of
electrons. The nitrogen is sp2-hybridised and acquires a positive charge as its lone
pair is delocalized around the ring [29, 30]. Therefore we propose a mechanism for
the oxidation of the polymer, which involves adsorption of the surfactant onto the
polypyrrole film on the electrode surface. The interaction of the surfactant anion with
the strongly polarized surface pyrrole units on the polymer backbone leads to
disruption of the induced aromaticity on the pyrrole. This results in the protonation of
the surfactant to yield the sulphonic acid and deprotonation of the ring nitrogen.
Further oxidation in the acid medium favors the reduction of the double bond adjacent
to the nitrogen, which leads to ring opening and subsequent rearrangement to produce
the more stable imine structure. The oxidation is irreversible and subsequent
electronic rearrangement transforms slowly to yield the capacitive material observed
under reduction conditions at around 200 mV vs. Ag/AgCl.
5.3 Modeling of the electrochemical and impedimetric properties of PPyNQS
In section 5.5.2.1, we established that the electrochemical behaviour of
electropolymerised PPyNQS on a platinum electrode involves a one electron, quasi-
reversible electrochemistry (ΔEp~60 mV), Eº′ of 322 mV and Ip,a / Ip,c is 1.3 with a
facile charge transport coefficient of 1.02 x 10⁻⁶ cm2s-1 [3]. Interfacial behaviour was
described with the equivalent circuit in Fig. 5.17 based on the characteristic
impedance profile obtainable at the potential (322 mV) where the polymer exhibits
maximum electro-activity (Fig. 5.18). The circuit defines two simultaneous kinetics;
one involving the bulk polymer material and the other taking place at the
electrolyte/polymer interface. The observed kinetics were investigated and used to
fashion out the relationship to changes in the analyte concentrations being sensed by
the transducer. The first intercept on the x-axis (Fig 5.18) is, typically, due to the
solution resistance Rs. It is independent from the applied potential for a given cell
configuration and typically about 10 Ohms. The high frequency semicircle is not fully
formed and hardly visible when the full frequency sweep is completed. However, by
207
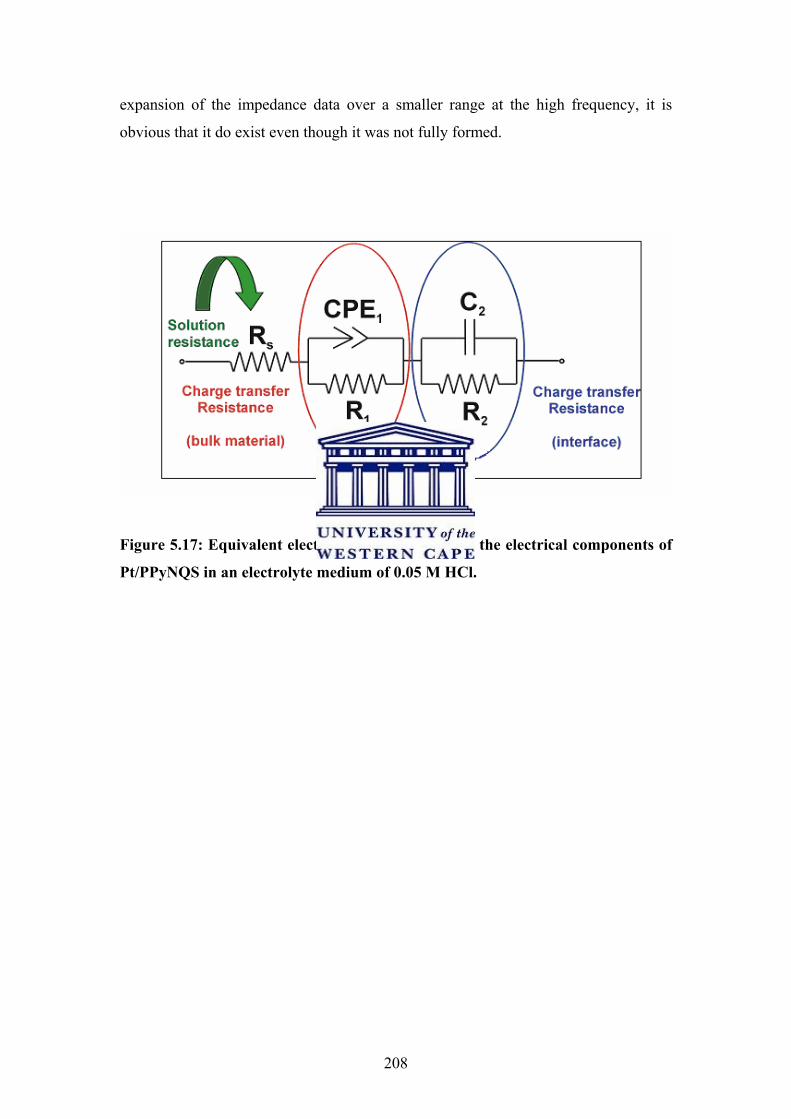
expansion of the impedance data over a smaller range at the high frequency, it is
obvious that it do exist even though it was not fully formed.
Figure 5.17: Equivalent electrical circuit describing the electrical components of
Pt/PPyNQS in an electrolyte medium of 0.05 M HCl.
208

Figure 5.18: Typical Nyquist plot (top), Bode plot (bottom) for the Pt/PPyNQS
system.
209

It has already been reported that the series combination of a resistance, R, and a
constant phase element as in Fig. 5.17 leads to a depressed arc in the Y plane [31].
The impedance transformation from high to low frequency is highlighted in the Bode
plot (Fig. 5.18, bottom). The inability of the polymer to exhibit constant impedance
over some frequency range at the low frequency end is a major peculiarity of this
system.
The interrogation of the impedance profiles revealed that the least value of interfacial
real impedance at the lowest frequency (10 mHz) was obtainable at 322 mV (Fig.
5.19), which is the potential at which the most conductive state is obtainable. This
potential coincidentally gave the highest capacitance for the polymer. The interfacial
impedance values as we switch to lower potentials from 322 mV are progressively
higher because of the transformation from conducting polypyrrole state to the neutral
state. At higher potentials to 322 mV, gradual over-oxidation of polypyrrole sets in
which is accompanied with increase in interfacial impedance. Similar transformation
in interfacial impedance has been reported for polyaniline as it switches through the
emaraldine (conducting) and the pernigraniline and leuco-emeraldine (insulating)
states [32].
Figure 5.19: Plot of the interfacial impedance and capacitance at different
perturbation potentials of the Pt/PPyNQS electrode.
210
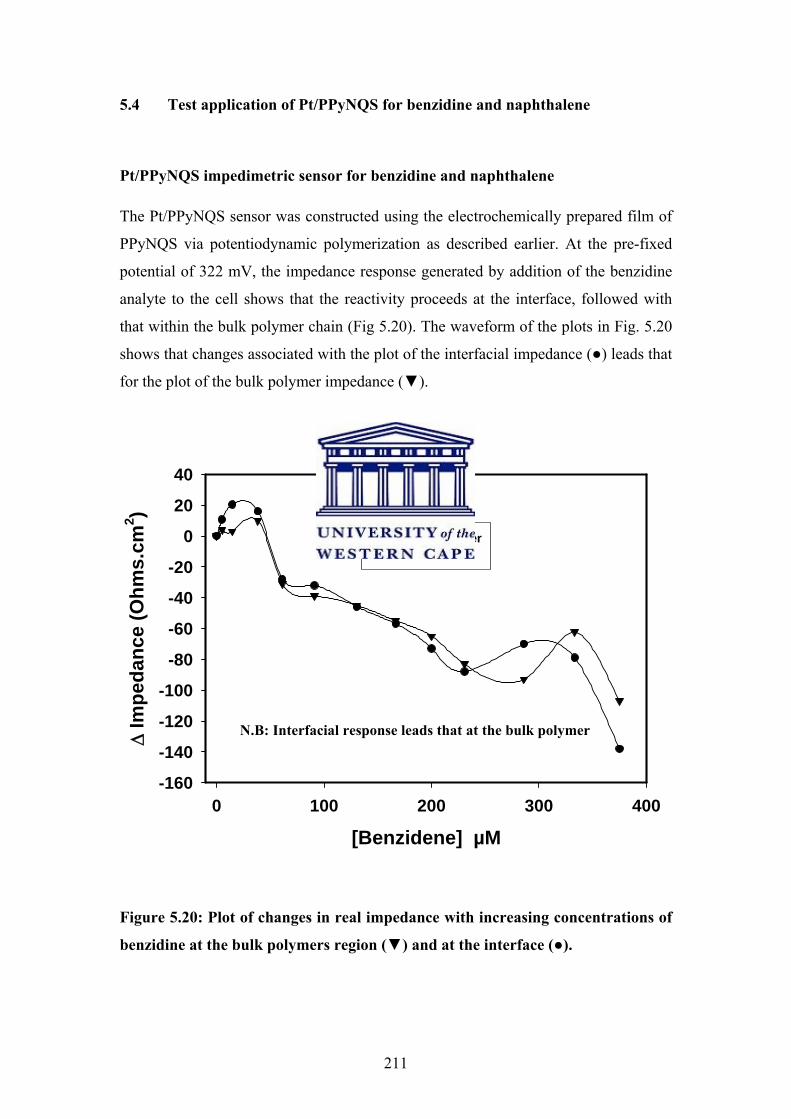
5.4 Test application of Pt/PPyNQS for benzidine and naphthalene
Pt/PPyNQS impedimetric sensor for benzidine and naphthalene The Pt/PPyNQS sensor was constructed using the electrochemically prepared film of
PPyNQS via potentiodynamic polymerization as described earlier. At the pre-fixed
potential of 322 mV, the impedance response generated by addition of the benzidine
analyte to the cell shows that the reactivity proceeds at the interface, followed with
that within the bulk polymer chain (Fig 5.20). The waveform of the plots in Fig. 5.20
shows that changes associated with the plot of the interfacial impedance () leads that
for the plot of the bulk polymer impedance ().
[Benzidene] µM0 100 200 300 400
Δ Im
peda
nce
(Ohm
s.cm
2 )
-160
-140
-120
-100
-80
-60
-40
-20
0
20
40
Bulk polymer Interface
N.B: Interfacial response leads that at the bulk polymer
Figure 5.20: Plot of changes in real impedance with increasing concentrations of
benzidine at the bulk polymers region () and at the interface ().
211

As the benzidine concentration was added to the electrolyte from 0 to 333 μM, the
impedance observed for the bulk polymer at the high frequency region (ca 10 KHz)
had values of 172 – 234 Ohms. The high frequency value of 10 KHz was chosen
because reproducible impedance measurements free of drift were obtainable as
against that obtained at the start up frequency of 100 KHz. At the interface mapped by
the low frequency region (ca 10 mHz), the impedance values were 840 -920 Ohms.
The relative change in the real impedance values at the two regions translates to 62
and 80 Ohms respectively. There is greater change in the interfacial impedance
compared to that of the bulk polymer impedance. In the contrary, we observed from
figures 5.21 and 5.22 that a more significant change in the capacitance values was
recorded for this system at the 0 and 333 μM extremes. While the bulk polymer
capacitance decreased from 72.7 to 57.1 μF, the interfacial capacitance decreased
from 4.7 to 3.7 mF. This translates to a difference in absolute capacitance values by a
factor of about 1000 times, with that at the interface being higher compared to that at
the bulk polymer (Fig. 5.21 and 5.22). This offers us a comparative advantage to
model the reactivity based on capacitance changes rather than the changes in the real
impedance.
Increasing concentration of BZD is insulating and thus increases the resistance of
the system. It also decreases the double layer capacitance at the electrode
interface. It could therefore be hypothesized that the sensing effect is occasioned
by the displacement of the double layer capacitance by the addition of the organic
compound. The interaction of the analyte (polar or non-polar) with the delocalized
positive charges along the polypyrrole chains induces changes in capacitance of
this nanostructured material.
The Pt/PPyNQS sensor effect is based on the normalized real impedance (Sn),
and/or that of the normalized real capacitance (Kn) as shown in equation 3.28 and
3.29 as used earlier by Hagen et al and described in chapter 3 [33].
Sn = |Zt| - |Z(t = 0)| equation 3.28
|Z(t = 0)|
212
Kn = |Ct| - |C(t = 0)| equation 3.29
|C(t = 0)|
When the Kn values (deviations of the magnitude of capacitance at a time t
containing a known concentration of the analyte from a value without analyte at t
= 0) for the electrochemical set up were plotted against increasing concentrations
of analytes, a hyperbolic curve defined by the equation: y = ax / (1 + bx) was
followed. Fig. 5.21 shows the plot for interfacial capacitance vs. [benzidine] with
a correlation coefficient, r2 value of 0.985 (n = 13), exhibiting a typical shape for
Michaelis-Menten kinetics. This could be used to determine benzidine
concentrations of 0 to 400 µM without total de-naturation of the sensor. A linear
plot defined by the equation y = 0.059x + 1.514 was observed at low
concentration range of 0 – 100 µM with a correlation coefficient, r2 of 0.992, (n =
5). From the linear plot (insert) shown in Fig. 5.21, low concentration range of 0 –
100 µM for benzidine could be determined with a sensitivity of 0.059 x 10⁻⁴
F/µM, i.e. 5.9 µF/µM, and detection limit of 3.407 µM. This concentration range
of 0 to100 µM for benzidine is obtainable in waste waters from contaminated
environment.
When similar plots were made for the normalized capacitance vs. benzidine
concentration at the bulk polymer region (Fig. 5.22), a seeming linear relationship
with r2 of 0.96 was seen as against hyperbolic trend seen for interfacial normalized
capacitance plots (Fig.5.21). This confirms that different kinetics of electron
transfer is taking place within the bulk polymer as well as at the interface.
213

[Benzidine] µM0 100 200 300 400
Δ C
apac
itanc
e (1
0-4 )
F
-2
0
2
4
6
8
10
12Interfacer2 = 0.985
0 20 40 60 80 10012345678
r ² = 0.992
Figure 5.21: Plot of changes in capacitance with increasing concentrations of
benzidine at the interface with insert showing the calibration curve for the linear
region.
214
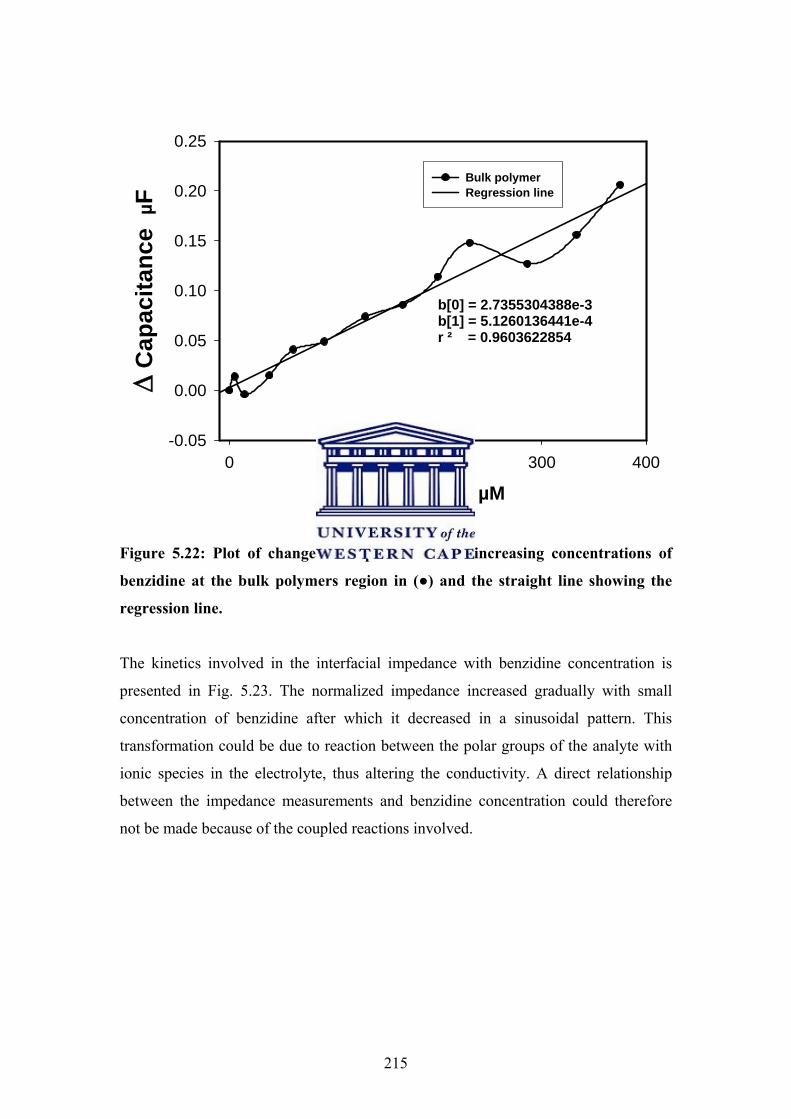
[Benzidene] µM0 100 200 300 400
Δ C
apac
itanc
e µ
F
-0.05
0.00
0.05
0.10
0.15
0.20
0.25
Bulk polymerRegression line
b[0] = 2.7355304388e-3b[1] = 5.1260136441e-4r ² = 0.9603622854
Figure 5.22: Plot of changes in capacitance with increasing concentrations of
benzidine at the bulk polymers region in () and the straight line showing the
regression line.
The kinetics involved in the interfacial impedance with benzidine concentration is
presented in Fig. 5.23. The normalized impedance increased gradually with small
concentration of benzidine after which it decreased in a sinusoidal pattern. This
transformation could be due to reaction between the polar groups of the analyte with
ionic species in the electrolyte, thus altering the conductivity. A direct relationship
between the impedance measurements and benzidine concentration could therefore
not be made because of the coupled reactions involved.
215
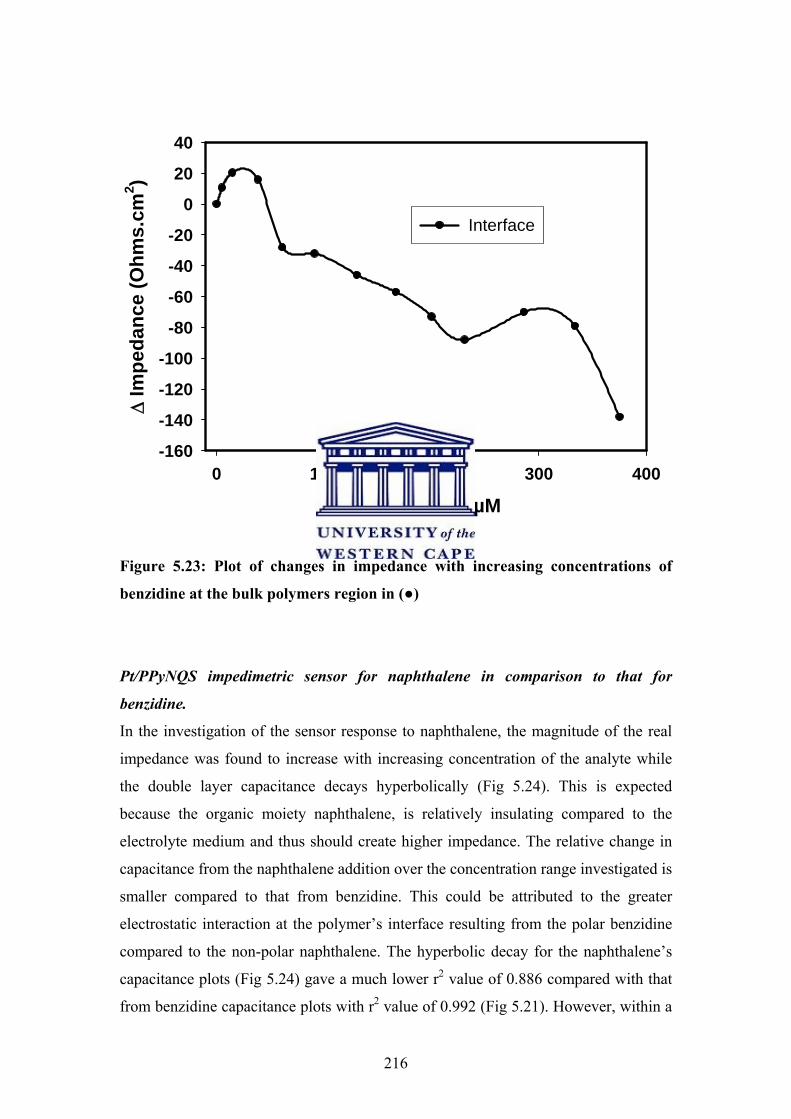
[Benzidene] µM0 100 200 300 400
Δ Im
peda
nce
(Ohm
s.cm
2 )
-160
-140
-120
-100
-80
-60
-40
-20
0
20
40
Interface
Figure 5.23: Plot of changes in impedance with increasing concentrations of
benzidine at the bulk polymers region in ()
Pt/PPyNQS impedimetric sensor for naphthalene in comparison to that for
benzidine.
In the investigation of the sensor response to naphthalene, the magnitude of the real
impedance was found to increase with increasing concentration of the analyte while
the double layer capacitance decays hyperbolically (Fig 5.24). This is expected
because the organic moiety naphthalene, is relatively insulating compared to the
electrolyte medium and thus should create higher impedance. The relative change in
capacitance from the naphthalene addition over the concentration range investigated is
smaller compared to that from benzidine. This could be attributed to the greater
electrostatic interaction at the polymer’s interface resulting from the polar benzidine
compared to the non-polar naphthalene. The hyperbolic decay for the naphthalene’s
capacitance plots (Fig 5.24) gave a much lower r2 value of 0.886 compared with that
from benzidine capacitance plots with r2 value of 0.992 (Fig 5.21). However, within a
216
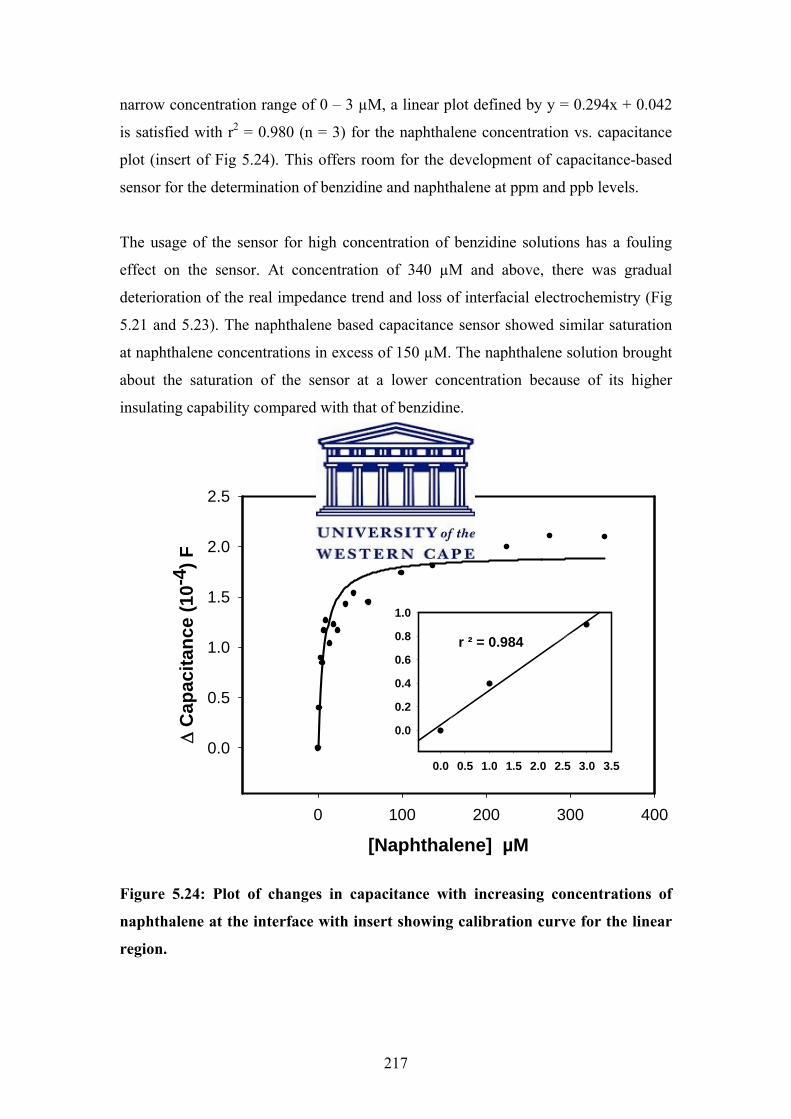
narrow concentration range of 0 – 3 µM, a linear plot defined by y = 0.294x + 0.042
is satisfied with r2 = 0.980 (n = 3) for the naphthalene concentration vs. capacitance
plot (insert of Fig 5.24). This offers room for the development of capacitance-based
sensor for the determination of benzidine and naphthalene at ppm and ppb levels.
The usage of the sensor for high concentration of benzidine solutions has a fouling
effect on the sensor. At concentration of 340 µM and above, there was gradual
deterioration of the real impedance trend and loss of interfacial electrochemistry (Fig
5.21 and 5.23). The naphthalene based capacitance sensor showed similar saturation
at naphthalene concentrations in excess of 150 µM. The naphthalene solution brought
about the saturation of the sensor at a lower concentration because of its higher
insulating capability compared with that of benzidine.
[Naphthalene] µM0 100 200 300 400
Δ C
apac
itanc
e (1
0-4 )
F
0.0
0.5
1.0
1.5
2.0
2.5
0.0 0.5 1.0 1.5 2.0 2.5 3.0 3.5
0.0
0.2
0.4
0.6
0.8
1.0
r ² = 0.984
r2 = 0.886
Figure 5.24: Plot of changes in capacitance with increasing concentrations of
naphthalene at the interface with insert showing calibration curve for the linear
region.
217

The electroactivity of the polymer is hindered by the repulsion to the ingress/egress of
counter ion at the polymers interface due to the restriction caused by the large NQS
moiety. This factor is responsible for the decrease in the double layer capacitance with
increase in analyte concentration. Higher concentration range of these pollutants
could be determined by using the hyperbolic curve of the normalized capacitance vs.
analyte concentrations. Polycyclic aromatic hydrocarbon (naphthalene) showed a
higher propensity to displace the interfacial double layer capacitance than the polar
benzidine moiety.
Conclusions
1, 2-napthaquinone–4-sulphonate have been successfully incorporated into the matrix
of polypyrrole on a platinum disc electrode through potential cycling in aqueous
solution of pyrrole-monomer (0.1 M) and the sodium salt of 1, 2-napthaquinone–4-
sulphonic acid-dopant (0.01 M) in 0.05 M HCl. The resulting polymer showed high
conductivity, optical changes, spectroscopic transitions and good electroactivity. The
polypyrrole thin film microelectrode was characterized electrochemically for the first
time and found to exhibit good electronic and spectroscopic properties. Voltammetric
investigations showed that the polymer exhibited quasi-reversible kinetics in a
potential window of -400 mV to 700 mV, with a formal potential of 322 mV vs.
Ag/AgCl. The diffusion coefficient was calculated to be 1.02 x 10⁻⁶ cm2 s-1 for a thin
film with a surface concentration of 1.83 x 10⁻⁷ mol cm-2 having a rate constant of
2.20 x 10⁻³ cm.s-1 at 5 mVs-1. The self-assembled film of the nanostructured-modified
polypyrrole showed good adherence on platinum disc electrode (Pt/PPyNQS) and
showed potential for use as anode for environmental sensor applications. The
modified polypyrrole is composed of nano micelles with diameters of 50 – 100 nm. It
displays high electroactivity and quasi-reversible electrochemistry. It also shows
stronger electrochemical activity than conventional PPy, improved solubility and
strong UV-Vis absorptions at 380, 750 and 820 nm for the polaron, bipolaron and
over lapped bi-polaron bands respectively. There was good correlation of data
between the electrochemical and spectro electrochemical investigation on the
modified polymer using cyclic voltammetry, differential pulse voltammetry, square
wave voltammetry, electrochemical impedance spectroscopy and SNIFTIRS. During
SNIFTIRS investigation of Pt/PPyNQS thin film, there was smooth transition from
the neutral to the polaronic and bipolaronic states as it was switched through a
218
potential window of –400 through 700 mV vs. Ag/AgCl. It is worth noting that the
NQSA doped polypyrrole showed strong emissions in aqueous dispersion, which
provides indication of potential applications in fabrication of various optometric
devices. The use of the Pt/PPyNQS novel impedimetric smart sensor for the detection
and quantification of benzidine and naphthaline in aqueous solutions proves
promising based on our preliminary investigation. Our test application of the
Pt/PPyNQS shows that sensors with good linear relationship (r2 > 0.98) between
capacitance and concentration for benzidine and naphthalene could be constructed
using a concentration range of 0 – 100 µM and 0 – 3 µM for benzidine and
naphthalene respectively.
References
1. Akinyeye, R.O., Sekota, M., Baker, P. & Iwuoha, E. (2006). Chemical Synthesis
and Morphology of β–Naphthalene Sulphonic Acid Doped-Polypyrrole
Micro/Nanotubes, Fullerenes, Nanotubes and Carbon Nanostructures, 14, 49-55.
2. Akinyeye, R.O., Michira, I., Sekota, M., Al-Ahmed A., Baker, P. & Iwuoha, I.,
(2006). Electrochemical Interrogation and Sensor Applications of Nanostructured
Polypyrroles, Electroanalysis, 18(24), 2441-2450.
3. Akinyeye, R.O., Michira, I., Sekota, M., Al-Ahmed A., Tito, D., Baker, P.G.L.,
Brett, C.M.A., Kalaji, M. & Iwuoha, I., (2007). Electrochemical Synthesis and
Characterization of 1, 2-Naphthaquinone-4-Sulphonic Acid Doped Polypyrrole,
Electroanalysis, 19(2-3), 303-309.
4. Li, C., Numaja, M., Bae, A-H., Sakurai, K. & Shinkai, S. (2005). Self-Assembly of
Supramolecular Chiral Insulated Molecular Wire, J. Am Chem Soc 127(13), 4548–
4549.
5. Huang, J. & Kaner, R.B. (2006). The intrinsic nanofibrilar morphology of
polyaniline, Chem. Commun, 367-376.
219
6. Lu, G., Li, C. & Shi, G. (2006). Polypyrrole micro- and nanowires synthesized by
electrochemical polymerization of pyrrole in the aqueous solutions of
pyrenesulphonic acid, Polymer 47(6), 1778–1784.
7. Barra, G.M.O., Jacques, L.B., Oréfice, R.L., Carneiro, J.R.G. (2004). Processing,
characterization and properties of conducting polyaniline-sulphonated SEBS block
copolymers, European Polymer Journal, 40(9), 2017-2023.
8. Geetha, S. & Trivedi, D.C. (2004). Studies on polypyrrole film in room temperature
melt, Materials Chemistry and Physics, 88, 388–397.
9. Benyoucef, A., Huerta, F., Vázquez, J.L. & Morallon, E. (2005). Synthesis and in-
situ FTIRS characterization of conducting polymers obtained from aminobenzoic acid
isomers at platinum electrodes, European Polymer Journal, 41, 843-852.
10. Lakshmi, R.T.S.M., Vyas, M.K., Brar, A.S. & Varma, I.K. (2006). Synthesis and
characterization of sulphonated PEES copolymers by NMR spectroscopy, European
Polymer Journal, 42(6), 1423-1432.
11. Cuentas-Gallegos, A.K. & Gomez-Romero, P. (2005). In-Situ Synthesis of
Polypyrrole-MnO2 Nanocomposite Hybrids, Journal of new materials for
electrochemical systems, 8, 181-188.
12. Rodríguez, I., Scharifker, B.R. & Mostany, J. (2000). In situ FTIR study of redox
and overoxidation processes in polypyrrole films, J. of Electroanalytical Chemistry,
491(1-2), 117-125.
13. Fermín, D.J., Teruel, H. & Scharifker, B.R. (1996). Changes in the population of
neutral species and charge carriers during electrochemical oxidation of polypyrrole,
J. Electroanal. Chem., 401, 207-214.
14. Lee, J.Y., Kim, D.Y. & Kim, C.Y. (1995). Synthesis of soluble polypyrrole of the
doped state in organic solvents, Synthetic Metals, 74, 103–106.
220

15. Smela, E. (1999). Microfabrication of PPy microactuators and other conjugated
polymer devices, Journal of Micromech. Microeng., 9, 1-18.
16. Heo, G., Lee, D. H. & Kim, K. H. (1994). Electropolymerization and
physicochemical properties of polypyrrole p-toluenesulphonate, Journal of Applied
Polymer Science, 54(7), 849 – 857.
17. Nicholson, R.S. (1965). Theory and application of cyclic voltammetry for
measurement of electrode-reaction kinetics, Anal Chem., 35, 1351-1355.
18. Matsunda, H. & Ayabe, Y.Z. (1955). Zur Theorie der Randles-Sevcikschen
Kathodenstrahl-Polarographie., Z Elektrochem, 59, 494-503.
19. Bard, A. J. & Faulkner, L. R. (2001). Electrochemical methods - Fundamentals
and Applications, John Wiley & Sons, Inc., 2nd edition, USA, chapters 6 & 10.
20. Brown, A. P. & Anson, F. C. (1977). “Cyclic and Differential Pulse Voltammetric
Behavior of Reactants Confined to Electrode Surface”, Anal. Chem., 49, 1589-1595.
21. Zanello, P. (2003). Inorganic Electrochemistry: Theory, Practice and
Applications, Royal Society of Chemistry, Cambridge, UK, pp49-135.
22. Pauliukaite, R. Brett, C.M.A. & Monkman, A.P. (2004). Polyaniline fibres as
electrodes. Electrochemical Characterisation In Acid Solutions, Electrochimica Acta,
50, 159-167.
23. Sundfors, F., Bobacka, J., Ivaska, A. & Lewenstam, A. (2002). Kinetics of
electron transfer between Fe(CN)63-/4- and poly(3,4-ethylenedioxythiophene) studied
by electrochemical impedance spectroscopy, Electrochimica Acta, 47, 2245-2251.
221
24. Grzeszczuk, M. & Żabińska-Olszak G. (1997). Effects of the Secondary
Counterions in the Electrochemistry of Polypyrrole, J. Electroanal. Chemistry, 427,
169-177.
25. Mahon, P.J., Paul, G.L., Keshishian, S. M. & Vassallo, A.M. (2000).
Measurement and modelling of the high-power performance of carbon-based
supercapacitors, Journal of Power Sources, 91(1), 68-76.
26. Xie, H. Yan, M. & Jiang, Z. (1997). Transition of polypyrrole from electroactive
to electroinactive state investigated by use of in situ FTIR spectroscopy,
Electrochimica Acta, 42 (15), 2361-2367.
27. Yuan, Y.J., Adeloju, S.B. & Wallace, G.G. (1999). In-situ electrochemical studies
on the redox properties of polypyrrole in aqueous solutions, European Polymer
Journal, 35, 1761-1772.
28. Rodríguez, I., Scharifker, B.R., Mostany, J. (2000). Voltammetric study of the
reduction and relaxation ofpoly(o-toluidine). Effect of the polymer thickness and
theexternal electrolyte nature and concentration, J. of Electroanalytical Chemistry,
491(1-2), 117-125.
29. Morrison, R.T. & Boyd, R.N. (1980). Organic Chemistry, Allyn and Bacon Inc.,
New York University, USA, 15th printing, pp. 1002 – 1026.
30. Loudon, G.M. (1988). Organic Chemistry, the Benjamin/Cummins publishing
company, California, USA, pp. 1043 – 1090.
31. Macdonald, J.S. (1987). Impedance Spectroscopy, Emphasizing Solid Materials
and Systems, John Wiley and Sons, New York, pp90-95.
32. Rajapakse, R.M.G., Tennkoon, D.T.B., Perera, J.S.H.Q., Bandara, W.M.A.T. &
Krishantha, D.M.M. (2005). Electrochemical Impedance Spectroscopic and Other
Studies of Polyaniline-Montmorillonite Intercalates, Journal of Composite Materials
39, 1985-1999.
222

33. Hagen, G., Dubbe, A., Rettig, F., Jerger, A., Birkhofer, T., Müller, R., Plog, C. &
Moos, R. (2006). Selective impedance based gas sensors for hydrocarbons using
ZSM-5 zeolite films with chromium (III) oxide interface, Sensors and Actuators B,
119, 441-448.
223
Chapter Six
Results and discussion 3
Spectroscopic and morphological studies of polypyrrole composites
with metal oxides (PPyWO3 and PPyZrO2)
This chapter presents results and discussion on the chemically synthesised metal
oxide modified polypyrrole. The hybrid materials based on WO3-x and ZrO2-y and
polypyrrole were prepared from the in-situ oxidation of pyrrole in acidic solution of
the individual metal oxide. Results obtained from the morphological and
spectroscopic investigation are discussed.
6.0 Introduction
Metal oxide modified polypyrrole have been used as organic/inorganic hybrid
electrodes for increased charge storage in electrochemical storage devices such as
supercapacitors and batteries [1-3]. While transition metal oxides incorporated into
the matrix of double layer activated carbons are used as double layer capacitors, based
on their high specific capacitance and relatively low electric conductivity, the metal
oxide nanohybrid-polypyrrole offers room for increased charge storage capacity and
conductivity because of the advantage of being both electroactive and conductive. The
effective energy storage generated from the nanohybrid of a fairly conducting
transition metal oxide with an electroactive and conducting organic polymer like
polypyrrole offers room for improved technological possibilities such as
electrochemical sensors and supercapacitors. In this study, in-situ reaction between
pyrrole and tungsten (VI) oxide or zirconium (IV) oxide in acidic solutions are used to
produce insoluble polypyrrole composites via oxidation with aqueous solution of
ammonium persulfate. While the pyrrole is oxidized to polypyrrole, the metal oxide in
solution also gets reduced to form insoluble particles in the process. The simultaneous
reactions coupled with stirring allows for the incorporation of the insoluble metal
oxide particles into the interstitial pores of the polymer. The polymer yield,
224
morphology and spectroscopic properties of the metal oxide polypyrroles are
discussed underneath.
6.1 Chemical synthesis of (PPyWO3 and PPyZrO2)
The dry product of the tungsten oxide modified polypyrrole (PPyWO3) and zirconium
oxide modified polypyrrole (PPyZrO2) obtained using the experimental procedure
described in Table 3.3 and 3.4 was investigated for their morphological and
spectroscopic properties.
6.1.1 Yield pattern of metal oxide modified polypyrroles
The yield obtained from the chemical synthesis in acidic solution prepared from a
metal-oxide:pyrrole mole concentration ratio of 0.8 and oxidant:pyrrole mole
concentration ratio of 0.2 and 1.0 for PPyWO3 and PPyZrO2 is presented in Table 6.1.
The pH indicated was determined after the polymerization reaction in the 0.1 M HCl
(pH = 1.2) is completed. The % yields represent the % of the dry polymer (g)
obtained from the pyrrole used (ml). The polymerization yields of the hybrid
polymers prepared from the higher o/m mole concentration ratio is higher than those
from the lower o/m mole concentration ratio at a fixed d/m mole concentration ratio
of 0.8. More polymer hybrid is obtained from the tungsten oxide modified
polypyrroles than that from zirconium oxide. This might be due to the relatively
higher mole equivalent of the tungsten oxide leading to higher weight for the
precipitated polymer. The evidence for the incorporation of the metal oxides into the
polymer matrix was provided by stigmation of the polymers micrograph with energy
dispersive x-ray (EDX) within the scanning electron microscope chamber. The EDX
spectra provided information on the proximate elemental analysis for the transition
metal, carbon, oxygen and sulphur in the nanoparticles assayed. Optimisation of the
chemical synthesis conditions to determine desirable maximum loading of metal
oxide into the polymers matrix for the production of a highly conducting polymer
composite state is still being investigated.
225
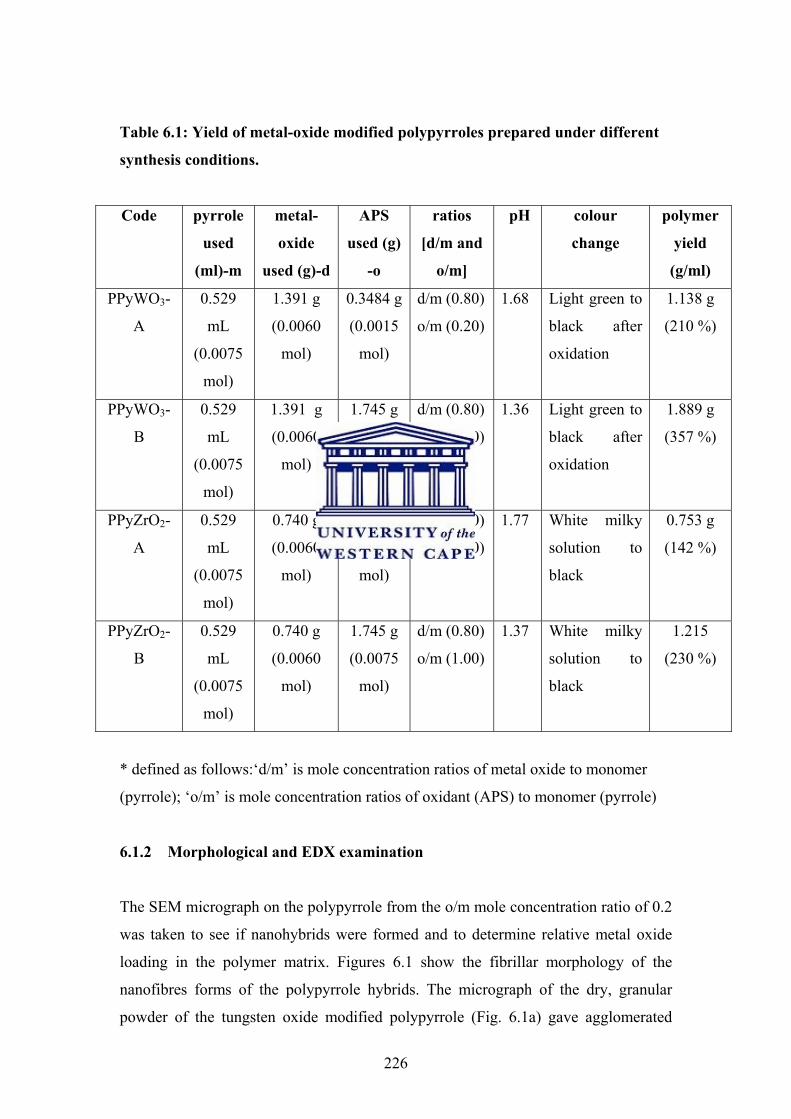
Table 6.1: Yield of metal-oxide modified polypyrroles prepared under different
synthesis conditions.
Code pyrrole
used
(ml)-m
metal-
oxide
used (g)-d
APS
used (g)
-o
ratios
[d/m and
o/m]
pH
colour
change
polymer
yield
(g/ml)
PPyWO3-
A
0.529
mL
(0.0075
mol)
1.391 g
(0.0060
mol)
0.3484 g
(0.0015
mol)
d/m (0.80)
o/m (0.20)
1.68 Light green to
black after
oxidation
1.138 g
(210 %)
PPyWO3-
B
0.529
mL
(0.0075
mol)
1.391 g
(0.0060
mol)
1.745 g
(0.0075
mol)
d/m (0.80)
o/m (1.00)
1.36 Light green to
black after
oxidation
1.889 g
(357 %)
PPyZrO2-
A
0.529
mL
(0.0075
mol)
0.740 g
(0.0060
mol)
0.3484 g
(0.0015
mol)
d/m (0.80)
o/m (0.20)
1.77 White milky
solution to
black
0.753 g
(142 %)
PPyZrO2-
B
0.529
mL
(0.0075
mol)
0.740 g
(0.0060
mol)
1.745 g
(0.0075
mol)
d/m (0.80)
o/m (1.00)
1.37 White milky
solution to
black
1.215
(230 %)
* defined as follows:‘d/m’ is mole concentration ratios of metal oxide to monomer
(pyrrole); ‘o/m’ is mole concentration ratios of oxidant (APS) to monomer (pyrrole)
6.1.2 Morphological and EDX examination
The SEM micrograph on the polypyrrole from the o/m mole concentration ratio of 0.2
was taken to see if nanohybrids were formed and to determine relative metal oxide
loading in the polymer matrix. Figures 6.1 show the fibrillar morphology of the
nanofibres forms of the polypyrrole hybrids. The micrograph of the dry, granular
powder of the tungsten oxide modified polypyrrole (Fig. 6.1a) gave agglomerated
226
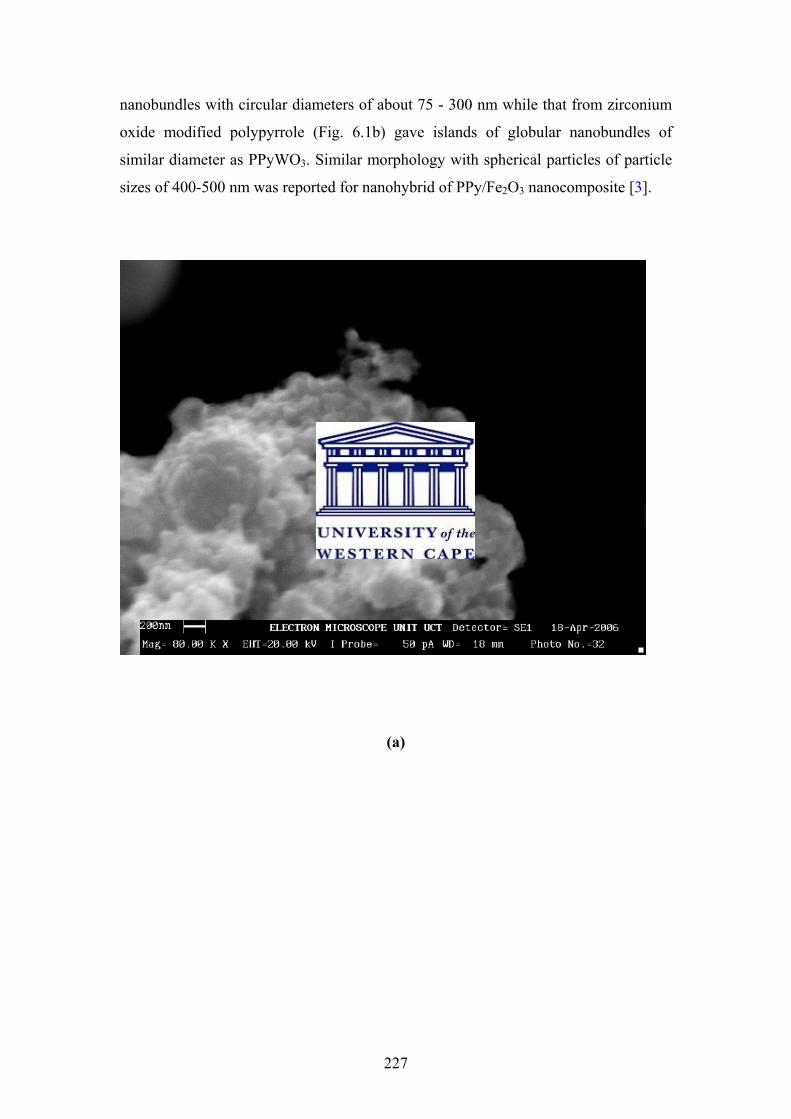
nanobundles with circular diameters of about 75 - 300 nm while that from zirconium
oxide modified polypyrrole (Fig. 6.1b) gave islands of globular nanobundles of
similar diameter as PPyWO3. Similar morphology with spherical particles of particle
sizes of 400-500 nm was reported for nanohybrid of PPy/Fe2O3 nanocomposite [3].
(a)
227

(b)
Figure 6.1: SEM micrographs of dry powder of metal oxide modified polypyrrole
showing the typical fibrous nanostructures from (a) PPyWO3 [d/m 0.8; o/m 0.2]
and (b) PPyZrO2 [d/m 0.8; o/m 0.2].
Table 6.3 presents the proximate elemental composition obtained from the EDX
spectra of different polypyrroles. Evidence of the incorporation of the metal oxides
was revealed in the respective metal oxide modified polypyrrole. The higher product
yield observed from the PPyWO3 was also corroborated by the higher metal loading
of about 12 % for PPyWO3 as against about 8 % seen in PPyZrO2 (Table 6.3).
Furthermore, the data shows lower % carbon from the metal oxide modified polymers
(PPyWO3 and PPyZrO2) compared to the organic acid modified polymers (PPyNSA
and PPyNQS). The order of decreasing % carbon is PPyNSA > PPyNQS > PPyZrO2
> PPyWO3. The relatively lower % sulphur in the metal oxide modified polypyrrole is
attributed to the absence of surfactants whereas the sulfonated polypyrroles have
higher % sulphur. The observed 1.5 % sulphur in the metal oxide modified
228

polypyrrole must have originated from the oxidant (APS) used in the polymers
preparation. Higher values for the surfactant modified PPy is therefore not surprising.
Table 6.2: Comparative trend of elemental composition (C, S, O, W, Zr, others)
in different modified polypyrroles prepared at from d/m ratio of 0.8 and o/m
ratio 0.2 by EDX spectroscopic analysis.
samples C (%)
S (%)
O (%)
W (%)
Zr (%)
others (%)
total (%)
PPyNSA 91.84 5.24 2.66 - - 0.26 100.00
PPyNQS 89.37 5.46 4.58 - - 0.67 100.08
PPyWO3 82.55 1.47 4.05 11.77 - 0.22 100.06
PPyZrO2 87.23 1.15 3.92 - 7.55 0.15 100.00
6.2 Spectroscopic properties of metal oxide modified polypyrroles
6.2.1 UV-Vis Spectroscopy
Figures 6.2 present the UV-Vis spectra for the metal oxide modified polypyrrole.
Similar trend of spectra were obtained on the polymer composites of PPyWO3 (Fig.
6.2A) and PPyZrO2 (Fig. 6.2B) using different o/m mole concentration ratios of 0.2
and 1. For the PPyWO3, a small absorption maxima at 325 nm for the conjugated
double bonds (i.e. π to π* transition) is indicated. The red shift from the normal π to
π*absorption at about 295 nm might be due to the inclusion of the solvated tungsten
oxide along the polymers matrix [4]. The polaronic absorption is poorly formed at
about 480 nm (Fig. 6.2A). Similar trend of spectra were seen for the PPyZrO2 (Fig.
6.2B). Absence of sharp polaronic absorption and bipolaronic absorption at higher
229
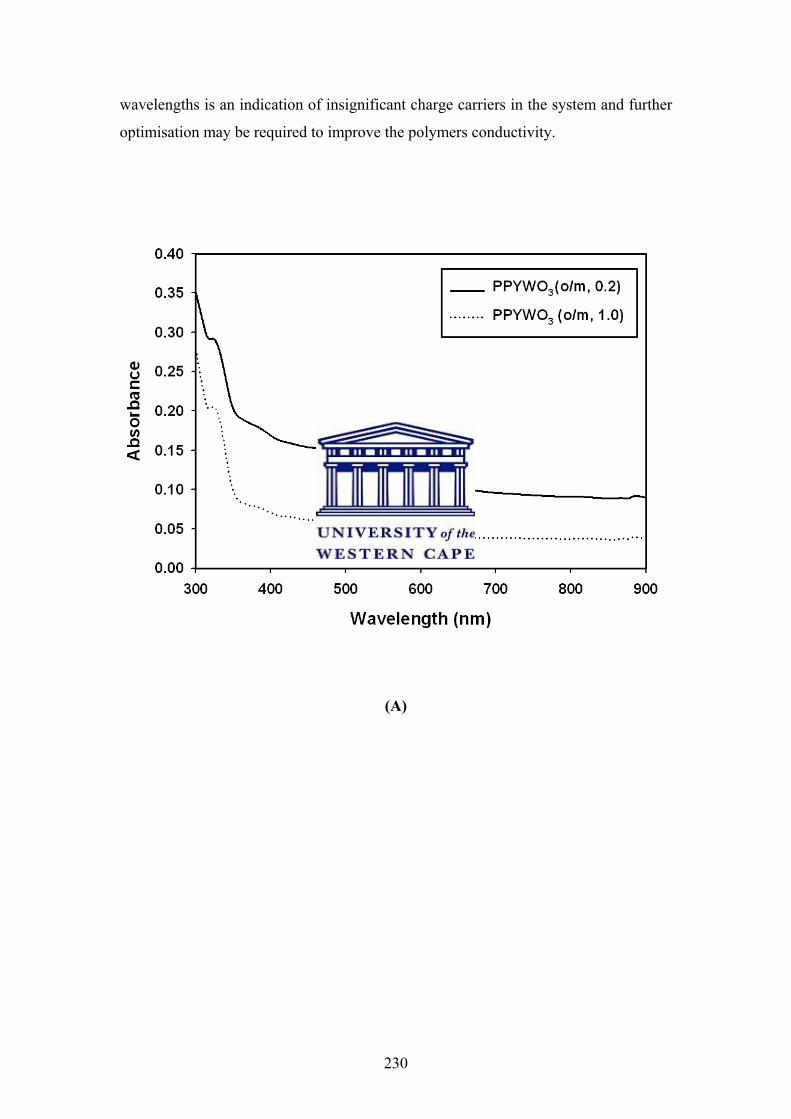
wavelengths is an indication of insignificant charge carriers in the system and further
optimisation may be required to improve the polymers conductivity.
(A)
230

(B)
Figure 6.2: UV-Vis results for metal oxide modified polypyrrole prepared under
different synthesis conditions: Fig. 6.2A: PPyWO3 from o/m 0.2 and 1.0; and Fig.
6.2B: PPyZrO2 from o/m 0.2 and 1.0.
6.2.2 FTIR spectral studies
Figure 6.3 shows the IR spectra of the metal oxide modified polypyrrole. Fig. 6.3A
gives spectra for PPyWO3 and metal oxide free polypyrrole (PPyDW) while Fig. 6.3B
gives the spectra for PPyZrO2 and metal oxide free polypyrrole (PPyDW)
respectively. The Tables 6.3 and 6.4 present’s data on some characteristic bands for
231
the polymers and compared with those reported for polypyrrole by Geetha and Trivedi
[5]. All the characteristic absorption bands for the metal oxide modified polypyrrole
were observed especially at the fingerprint region of 1000 – 1700 cm-1 with slight
variation in the absolute values (Tables 6.3 and 6.4). The usual N – H stretching at
3400 cm-1 in neutral polypyrrole is present in both PPyWO3 and PPyZrO2 samples,
though with slight variations, indicating that the polymers are not in the doped state as
was observed in the earlier investigation on PPyDW, PPyNSA (d/m 0.8, o/m 0.2) and
PPyNSA (d/m 0.8, o/m 1.0) [6].
The most interesting feature in the IR spectra is the lower wavelength absorption band
at 822 cm-1 for PPyWO3 (Fig. and 558 cm-1 for PPyZrO2. Similar low band absorption
at around 500 cm-1 was reported for polypyrrole-manganese (IV) oxide
nanocomposite hybrids [1]. Furthermore, an extra sharp peak due to the C=C/C-C
vibrational modes at 1636 – 1720 cm-1, depending on the metal ion and the oxidant
concentration used, was seen in the spectra of the metal oxide modified polypyrroles.
This peak is assigned to the shifted peak from 1540 cm-1 due to significant
overoxidation of the polypyrrole matrix [1, 6]. The oxidising nature of the metal oxide
coupled with that of the oxidant might have caused this over-oxidation. This will
invariably reduce the electronic conductivity and ultimately loss or reduced
electrochemical activity. These characters in the metal oxide modified polypyrrole
attest to the incorporation of the metal oxide in the polypyrrole. The included
inorganic component in the hybrid is a reduced metal ion resulting from the oxidative
polymerisation. Thus, the reduced for in which the metal oxide precipitate could be
represented as WO3-x and ZrO2-y respectively where x and y are integers showing the
extent of oxidation in each case [1].
232

(A)
233
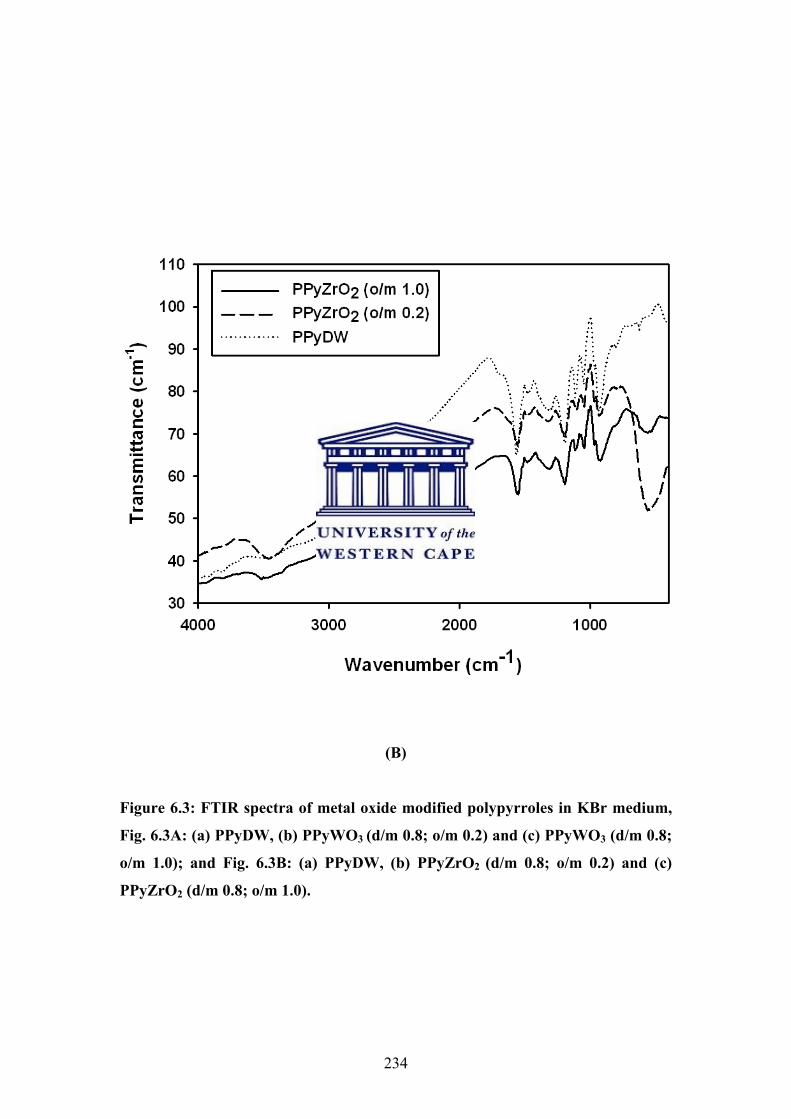
(B)
Figure 6.3: FTIR spectra of metal oxide modified polypyrroles in KBr medium,
Fig. 6.3A: (a) PPyDW, (b) PPyWO3 (d/m 0.8; o/m 0.2) and (c) PPyWO3 (d/m 0.8;
o/m 1.0); and Fig. 6.3B: (a) PPyDW, (b) PPyZrO2 (d/m 0.8; o/m 0.2) and (c)
PPyZrO2 (d/m 0.8; o/m 1.0).
234
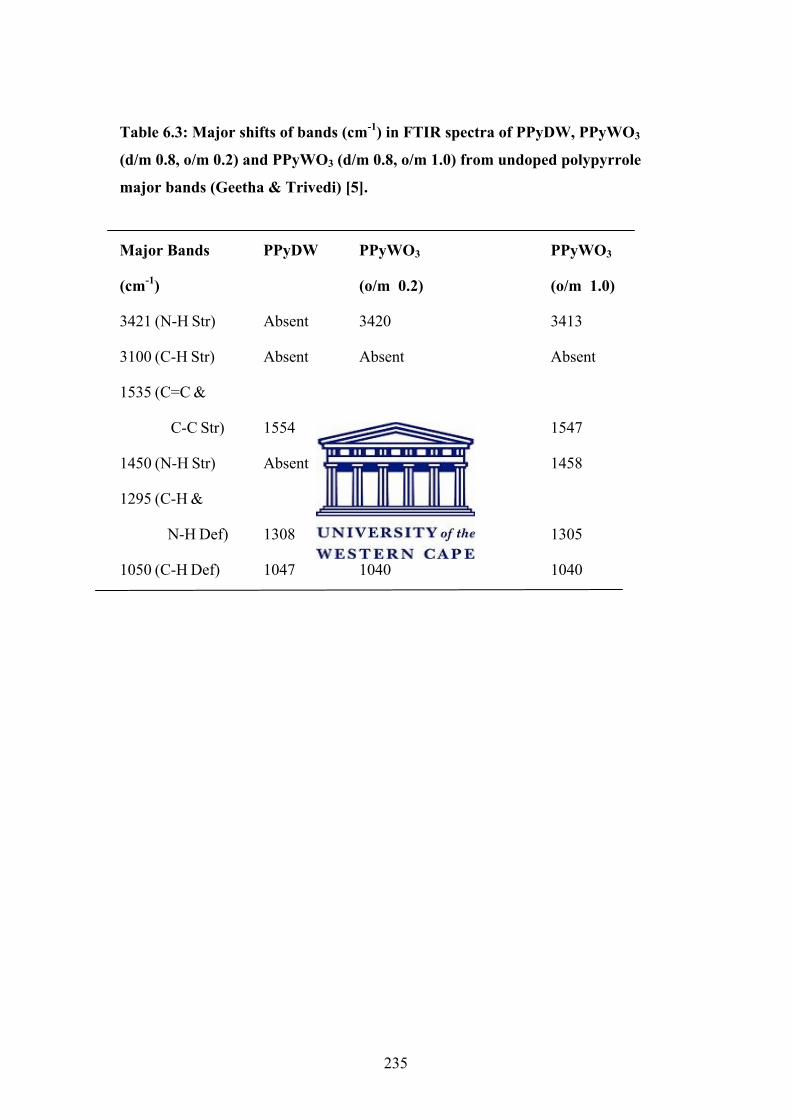
Table 6.3: Major shifts of bands (cm-1) in FTIR spectra of PPyDW, PPyWO3
(d/m 0.8, o/m 0.2) and PPyWO3 (d/m 0.8, o/m 1.0) from undoped polypyrrole
major bands (Geetha & Trivedi) [5].
Major Bands PPyDW PPyWO3 PPyWO3
(cm-1) (o/m 0.2) (o/m 1.0)
3421 (N-H Str) Absent 3420 3413
3100 (C-H Str) Absent Absent Absent
1535 (C=C &
C-C Str) 1554 1550 1547
1450 (N-H Str) Absent 1461 1458
1295 (C-H &
N-H Def) 1308 1305 1305
1050 (C-H Def) 1047 1040 1040
235

Table 6.4: Major shifts of bands (cm-1) in FTIR spectra of PPyDW, PPyZrO2
(d/m 0.8, o/m 0.2) and PPyZrO2 (d/m 0.8, o/m 1.0) from undoped polypyrrole
major bands (Geetha & Trivedi) [5].
Major Bands PPyDW PPyZrO2 PPyZrO2
(cm-1) (o/m 0.2) (o/m 1.0)
3421 (N-H str) Absent 3461 3468
3100 (C-H str) Absent Absent Absent
1535 (C=C &
C-C str) 1554 1556 1558
1450 (N-H str) Absent Absent Absent
1295 (C-H &
N-H def) 1308 1311 1307
1050 (C-H def) 1047 1045 1045
Conclusions
This preliminary investigation on metal oxide modified polypyrrole has shown that
significant modification of the polypyrrole matrix is generated by the in-situ
polymerisation. The metal oxide nanoparticles served as a support to the
polymerisation process of pyrrole and lead to a more porous structure with a higher
specific surface area. Nanohybrids are readily formed via the in-situ polymerisation in
acidic aqueous medium. Two simultaneous processes have been hypothesised; namely
the oxidation of pyrrole to polypyrrole and the reduction of the WO3 to WO3-x (or
ZrO2 to ZrO2-y). The investigated polymers do not show significant features indicative
of reasonable composition of charge carriers required for electrocatalytic application
and further optimisation of synthesis conditions to come up with an ideal metal oxide
loading is required. Evidence of incorporation of the metal oxide into the polymers
matrix was provided by both EDX and FTIR spectroscopic analysis. Electrochemical
236

characterisation and test application of the nanohybrids will be looked into in future
work. The likely scope of application of the hybrid polymers are in electrochromic
devices and metal oxide sensors (MOS) that are operated at elevated temperatures.
References
1. Cuentas-Gallegos, A.K. and Gómez-Romero, P. (2005). In-Situ Synthesis of
Polypyrrole-MnO2−x Nanocomposite Hybrids, J. New. Mat. Electrochem. Systems, 8,
181-188.
2. Rocco, A.M., De Paoli, M-A., Zanelli, A. & Mastragostino, M. (1996). An
electrochromic device combining polypyrrole and WO3 –I. Liquid electrolyte,
Electrochimica Acta, 41(18), 2805-2816.
3. Mallouki, M., Tran-Van, F. Sarrzin, C., Simon, P., Daffos, B. De, A, Chevrot, C.
and Fauvarque, J. (2007). Polypyrrole-Fe2O3 nanohybrid materials for
electrochemical storage, J. Solid State Electrochem, 11, 398-406.
4. Kemp, W. (1988). Organic Spectroscopy, ELBS/Macmillan, 2nd ed., 204 – 206.
5. Geetha, S. & Trivedi, D.C. (2004). Studies on polypyrrole film in room temperature
melt, Materials Chemistry and Physics, 88, 388–397.
6. Rodríguez, I., Scharifker, B.R. & Mostany, J. (2000). In situ FTIR study of redox
and overoxidation processes in polypyrrole films, J. of Electroanalytical Chemistry,
491(1-2), 117-125.
7. Akinyeye, R.O., Michira, I., Sekota, M., Al-Ahmed A., Baker, P. & Iwuoha, I.,
(2006). Electrochemical Interrogation and Sensor Applications of Nanostructured
Polypyrroles, Electroanalysis, 18(24), 2441-2450.
237
Chapter Seven
Conclusions and Recommendations
7.1 Conclusions
This research work has investigated the aqueous synthesis, characterization and
amperometric/impedimetric applications of some polypyrrole involving modification
with different polyaromatic hydrocarbon sulphonic acid (PAHSA) and transition
metal oxides of WO3 and ZrO2. The PAHSA used are β–naphthalene sulphonic acid
(NSA) and the sodium salt of 1, 2-napthaquinone-4-sulphonic acid (NQS). In order to
follow the transition in the properties of the modified polypyrrole with different
synthesis conditions, controls synthesis were carried out as follows:
Polypyrrole was chemically synthesized using oxidant of ammonium
persulphate (APS) without the use of acidic medium of hydrochloric acid as
the electrolyte (PPyDW),
Polypyrrole was chemically synthesized using oxidant of ammonium
persulphate (APS) in acidic medium of hydrochloric acid as the electrolyte
(PPyHCl) otherwise referred to as polypyrrole (PPy).
The investigation involved synthesis at different temperatures, dopant to monomer
mole concentrations ratios (d/m), oxidant to monomer mole concentrations ratios
(o/m), use of different electrodes for electrochemical synthesis and variation of ph and
electrochemical potential window. A general electrochemical characterization of the
polymers was undertaking to ascertain electroactivity of the derived polymers.
Morphological and spectroscopic characterizations were also used to determine the
existence of nanostructures and their intrinsic properties. Test applications on the
modified polypyrroles with good morphological, spectroscopic and electrochemical
properties were investigated for some common pollutants in waste water. The testing
was aimed at determining if there is amperometric or impedimetric response to
changing concentrations of the pollutants in waste water. The study have provided a
platform for the production of various chemical and biological sensors based on the
238
broad evaluation of the morphology, spectroscopic, electrochemical and test
applications explored in this study.
7.2 Main scientific contributions of the dissertation
Production of various nanostructures of polypyrrole using surfactant mediated
synthesis was successfully carried out within the first one year of this study.
The polymerization of pyrrole in β–naphthalene sulphonic acid (NSA) gave
nanotubules, nanomicelles or nanosheets of polypyrrole (PPy) morphologies
depending on the amount of NSA in the polymer and the temperature of the
reaction. The modified polypyrrole from NQS is composed of mainly
nanomicelles with diameters of 50 – 100 nm.
Validation of the electrochemistry of the various polypyrrole transition states
during cycling. Electrochemical analysis of PPyNSA reveals two redox
couples: a/a′ - partly oxidized polypyrrole-naphthalene sulphonate radical
cation/neutral polypyrrole naphthalene sulphonate; b/b′ - fully oxidized
naphthalene sulphonate radical cation/partly reduced polypyrrole-naphthalene
sulphonate radical anion which are closely associated. However, CV, SWV
and EIS showed that PPyNQS had single redox couple with a quasi reversible
electrochemistry at low scan rates.
Modification of polypyrrole with NQS was carried out for the first time and
conditions for the chemical and electrochemical synthesis were optimized.
Validation of the electrochemistry of the nanostructured modified polypyrrole
(PPy) self assembled with sodium salt of 1, 2-napthaquinone-4-sulphonic acid
(NQSA) and pyrrole (Py) on platinum disc electrode (Pt/PPyNQS). The
incorporation of the NQS dopant in the polymer matrix was validated by in-
situ SNIFTIR investigation.
The synergy of synthesis conditions, morphology of modified polypyrroles,
UV-Vis and FTIR properties of the polymer materials in different solvents,
and the electrochemical properties at different electrodes and potentials were
used to establish optimum synthesis conditions for PPyHCl, PPyNSA,
PPyNQS. Further optimizations are still required for the metal oxide modified
polypyrroles.
Kinetic study shows PPyNQS had slightly higher rate constant (ko) than
PPyNSA being 3.08 x 10⁻² cm s-1 @ 100 mV/s for PPyNSA and 3.75 x 10⁻²
239

cm s-1 @ 100 mVs-1 for PPyNQS which are close to literature values for
other conducting polymers.
Beside, the PPyNQS adhered better to the electrode surface than the PPyNSA
and it is relatively more stable to many potential cycling.
Impedimetric investigation attest to redox activities at potential between 200 -
300 mV for PPyNSA and 320 mV for PPyNQS at the polymers/electrolyte
interface.
Test application of the GCE/PPyNSA electrode as phenol sensor in aqueous
acidic medium showed that PPyNSA based sensor can be used in the
amperometric detection of phenol in water and environmental samples. The
dynamic linear range of the sensor showed that the sensor is analytically
useful at phenol concentrations of 0.65-139.5 µM. This translates to phenol
mass concentration of 6.7-1500 parts per billion (ppb). This is within the range
of phenol found in pharmaceutical industries and refinery effluents.
Test application of the Pt/PPyNQS electrode as benzidine sensor in aqueous
acidic medium showed that PPyNQS based sensor can be used in the
impedimetric detection of phenol in water and industrial waste water effluents.
An impedimetric transduction mechanism was proposed for the interaction of
analytes of benzidine and naphthalene with a film of PPyNQS on platinum
disc electrode based on the high impedimetric pattern observed at low
frequency.
7.3 Recommendations for future work The polyaromatic hydrocarbon sulphonic acid (PAHSA) and transition metal oxides
evaluated in this dissertation represent only a sample of their respective groups. While
more conclusive study is required on the metal oxide modified polypyrrole, further
evaluation on other PAHSA should be explored for their potential use as
electrocatalytic sensor devices. The developed sensor systems based on PPyNSA and
PPyNQS should be explored for use as biological sensors at neutral pHs.
The morphological study on the electrochemically generated films in this study could
not be carried out due to lack of instrumentation for in-situ simultaneous
240

electropolymerisation and morphological evaluation. It will be needful to further
validate that the features observed on the chemically synthesized polymers as being
readily reproducible or improved upon in electrochemically generated film.
The inability of the polypyrrole used in this study to attain a constant impedance value
at low frequency is a major limitation in the development of direct impedimetric and
capacitive sensor in this study. Conditions for the attainment of this desirable
impedance pattern for the polymer systems should be explored.
Obviously, the ultimate objective is to have assembly of chemical sensors for
determination of environmental pollutants, particularly the anthropogenic ones such
as benzenoids e.g. benzene, toluene, ethylbenzene and xylene isomers –BTEX, that
are also volatile organic pollutants -VOC’s; chlorinated compounds e.g.
trichloroethylene, -TCE; polycyclic aromatic hydrocarbons -PAHs, e.g. naphthalene,
fluroanthene, pyrene; and polychlorinated biphenyls (PCBs) and other priority organic
pollutants (POP’s) such as benzidine, phenol and its derivatives. The development of
E-Noses that can determine many of these analytes simultaneously is an objective that
should be met in the nearest future.
7.4 Output from the dissertation 7.4.1 Contributions at conferences 1. Akinyeye, R., Iwuoha, E. & Baker, P.G.L.: Interfacial Characterisation of
Modified Conductive Polymer Sensor Materials, 8th UNESCO School and
IUPAC Conference on Macromolecules and Materials Science, 4-9 June 2005,
Flic en Flac, Mauritus.
2. Akinyeye, R.: Chemical and Electrochemical Synthesis of Polypyrrole
Impedimetric Sensors, Presentation to the Sensor Research Group, University
of the Western Cape, Bellville, South Africa, 6th December, 2005.
3. Akinyeye, R., Gwagwa, X. Y., Iwuoha, E. I. & Baker, P.G.L.: Interfacial
Characterisation of Modified Conductive Polymer Sensor Materials, 4th
241

International Conference on Instrumental Methods of Analysis: Modern
Trends and Applications, 2-6 October 2005, Iraklion, Crete Greece, Book of
Abstracts, p191.
4. Baker, P.G.L., Akinyeye, R.O., Sekota, M., Ahmed, A., Khan, R., Brett,
C.M.A., & Iwuoha, E.: Electrochemical Characterisation of Polypyrrole
Modified with 1, 2-Naphthaquinone-4-sulphonic acid, 11th International
Conference on Electrochemistry, ESEAC 2006, Bordeaux, France, 11–15 June
2006.
5. Akinyeye, R.: Chemical and Electrochemical Synthesis of Polypyrrole
Impedimetric Sensors, Presentation to the Department of Chemistry,
University of the Western Cape, Bellville, South Africa, 18th October, 2006.
6. Akinyeye, R.O., Michira, M., Klink, M., Somerset, V., Sekota, M., Ahmed,
A-Al., Ignaszak, A., Baker P. & Iwuoha, E.: Electrokinetics and Sensor
Applications of Polypyrrole Modified with 1, 4-Naphthaquinone Sulphonic
acid (NQSA), The 9th International Symposium On Kinetics in Analytical
Chemistry, Marrakech, Morocco, November 2–4, 2006, Book of Abstracts,
p21.
7. Iwuoha, E., Baker, P., Michira, M., Akinyeye, R., Sekota, M., Ahmed,A-
Al., Alemu H. & Ngila, J.C., Kinetic Modelling and Drug Metabolism
Biosensor for Antiretroviral Drugs, The 9th International Symposium on
Kinetics in Analytical Chemistry, Marrakech, Morocco, November 2–4,
2006, Book of Abstracts p33.
8. Akinyeye, R.O., Michira, M., Klink, M., Somerset, V., Sekota, M.,
Ahmed, A-Al., Ignaszak, A., Baker P. & Iwuoha, E. Polypyrrole 1, 4-
Naphthaquinone Sulphonate (PPYNS) Smart Nanomaterial for Impedimetric
Sensors, South African Nanotechnology Initiative, Nanoafrica 2006
International Conference, University of Cape Town, Capetown, South
Africa, November, 26–29, 2006, Book of Abstracts, p6.
242

9. Baker, P.G.L., Akinyeye, R.O., Michira, I. Sekota, M., Ahmed, A-Al., &
Iwuoha, E.: Electrochemical and Sensor Dynamics of Nanostructured
Polypyrroles, South African Nanotechnology Initiative, Nanoafrica 2006
International Conference, University Of Cape Town, Capetown, South
Africa, November, 26–29, 2006, Book of Abstracts, p13.
10. Iwuoha, E., Baker, P., Michira, M., Akinyeye, R., Sekota, M., Ahmed, A- Al.:
Electrochemical Interrogation of Cytochrome P450 (2D6) Nanobiosensors.
South African Nanotechnology Initiative, Nanoafrica 2006 International
Conference, University of Cape Town, Capetown, South Africa, November,
26–29, 2006, Book of Abstracts, p33.
11. Akinyeye, R.O., Michira, M., Klink, M., Somerset, V., Baker, P. &
Iwuoha, E.: Electochemistry and Application of Nanostructured Conducting
Polypyrrole Modified with β-Naphthalene Sulphonic Acid (NSA) for the
Determination of some Priority Organic Pollutants (POPs) in Waste Water,
38th National Convention of the South African Chemical Institute, University
of Kwazulu Natal, Durban, South Africa, December 3–8, 2006.
12. Akinyeye, R.O., Ignaszak, A., Ahmed, A-Al., Baker, P. & and Iwuoha, E.:
Synthesis, Electro-Kinetics and Sensor Applications of Sulphonated
Polypyrrole For The Determination of Anthropogenic Organic Pollutants, 6th
EBASI International Conference at Ithemba Labs, Stallenbosch, South Africa,
23rd –26th, January, 2007.
13. Akinyeye, R.O., Michira, M., Klink, M., Somerset, V., Arotiba, O. A.,
Owino, J.O., Ignaszak, A. Ahmed, A.Al, Waryo, T.T., Baker, P.G.L. &
Iwuoha, E.I.: Impedimetric Applications of Nanostructured Conducting
Polypyrroles for the Determination of Some Anthropogenic Organic
Pollutants in Waste Water, Abstract ID: Conf116a1624, ICMAT 2007
Conference, Singapore, 1-6th June, 2007.
243

7.4.2 Manuscripts and publications authored or co-authored from the PhD
study.
1. Akinyeye, R.0, Sekota, M., Baker, P. & Iwuoha, E. (2006). Chemical
Synthesis And Morphology of β-Naphthalene Sulphonic Acid Doped
Polypyrrole Micro/Nanotubes, Fullerenes, Nanotubes & Carbon
Nanostructures, 14, 49-55.
2. Akinyeye, R.O., Michira, M., Sekota, M., Ahmed, A-Al, Baker, P. &.
Iwuoha, E. (2006): Electrochemical Interrogation and Sensor Applications of
Nanostructured Polypyrroles, Electroanalysis, 18(24), 2441 – 2450.
3. Akinyeye, R.O., Michira, M., Sekota, M., Ahmed, A-Al, Tito, D. Baker,
P.G.L., Brett, C.M.A., Kalaji, M. & Iwuoha, E. (2007). Electrochemical
Synthesis and Characterization of 1, 2-Napthaquinone-4-Sulphonic Acid
Doped Polypyrrole, Electroanalysis, 19(2-3), 303–309.
4. Michira, M., Klink, M., Akinyeye, R.O., Somerset, V., Sekota, M., Ahmed,
A-Al, Baker, P.G.L. & Iwuoha, E.I. (2007). Anthracene Sulphonic Acid-
Doped Polyanilines: Electrodynamics and Application as Amperometric
Peroxide Biosensor, Chapter 5 in Recent Advances in Analytical
Electrochemistry, 0 – 00, ISBN: 978-81-7895-274-1, edited by Kenneth I.
Ozoemena (in press).
5. Akinyeye, R.O., Michira, M., Botha, S., Baker, P. & Iwuoha, E. (2007).
Electrocatalytic Sensor Applications of Nanostructured Polypyrroles and
Polythiophenes, Chapter 4 in Recent Advances in Analytical Electrochemistry,
0 – 00, ISBN: 978-81-7895-274-1, edited by Kenneth I. Ozoemena (in press).
6. Akinyeye, R., Anna Ignaszak, Al-Ahmed Amir, Priscilla Baker and
Emmanuel Iwuoha. (2007). Electrochemically Printed Polypyrrole
Impedimetric Nanosensor for Benzidine, EBASI 2007 Conference Paper
submitted for publication in Afican Physical Review Journal (in review).
244

7. Akinyeye, R.O., M., Klink, Ignaszak, A., Ahmed, A-Al, Baker, P., & Iwuoha,
E. (2007). Impedimetric Applications of Nanostructured Conducting
Polypyrroles for the Determination of some Anthropogenic Organic
Pollutants in Wastewater, ICMAT 2007 Conference Paper in “Encyclopedia
of Advanced Materials: Science and Engineering” (under Review).
8. V Somerset V., Klink M., Akinyeye R., Sekota M., Al-Ahmed A., Baker P.
and Iwuoha E. (2006). Spectroelectrochemical Reactivities of Novel
Polyaniline Nanotube Pesticide Biosensors. Paper presented at the 9th Annual
UNESCO/IUPAC Conference on Macromolecules: Polymers for Advanced
Applications, for publication in Macromolecular Symposia, 2007 (in press).
9. Michira, I, Akinyeye R, Somerset V, Klink M. J, Sekota M, Al-Ahmed A,
Baker P.G.L., Iwuoha E. (2006): Synthesis, Characterisation of Novel
Polyaniline Nanomaterials and Application in Amperometric Biosensors.
Paper presented at the 9th Annual UNESCO/IUPAC Conference on
Macromolecules: Polymers for Advanced Applications, for publication in
Macromolecular Symposia, 2007 (in press).
10. Klink, M.J., Somerset, V.S., Akinyeye, R., Baker, P.G.L., Iwuoha, E.I.
(2007), Electrochemical Properties and Characterization of Novel Poly (2, 5
dimethoxyaniline) Nanostructures, submitted for publication in European
Polymer Journal, 2007 (under review).
245
Related Documents