Nonmuscle Myosin IIA-Dependent Force Inhibits Cell Spreading and Drives F-Actin Flow Yunfei Cai,* Nicolas Biais,* Gregory Giannone,* Monica Tanase,* Guoying Jiang,* Jake M. Hofman, y Chris H. Wiggins, z Pascal Silberzan, § Axel Buguin, § Benoit Ladoux, { and Michael P. Sheetz* *Department of Biological Sciences, and y Department of Physics, Columbia University, New York, New York; z Department of Applied Physics and Applied Mathematics, Center for Computational Biology and Bioinformatics, Columbia University, New York, New York; § Physico-Chimie Curie, Unite ´ Mixte de Recherche Centre National de la Recherche Scientifique 168, Institut Curie, Paris, France; and { Matie `re et Syste `mes Complexes, CNRS UMR 7057/Universite ´ Paris 7, Paris, France ABSTRACT Nonmuscle myosin IIA (NMM-IIA) is involved in the formation of focal adhesions and neurite retraction. However, the role of NMM-IIA in these functions remains largely unknown. Using RNA interference as a tool to decrease NMM-IIA expression, we have found that NMM-IIA is the major myosin involved in traction force generation and retrograde F-actin flow in mouse embryonic fibroblast cells. Quantitative analyses revealed that ;60% of traction force on fibronectin-coated surfaces is contributed by NMM-IIA and ;30% by NMM-IIB. The retrograde F-actin flow decreased dramatically in NMM-IIA-depleted cells, but seemed unaffected by NMM-IIB deletion. In addition, we found that depletion of NMM-IIA caused cells to spread at a higher rate and to a greater area on fibronectin substrates during the early spreading period, whereas deletion of NMM-IIB appeared to have no effect on spreading. The distribution of NMM-IIA was concentrated on the dorsal surface and approached the ventral surface in the periphery, whereas NMM-IIB was primarily concentrated around the nucleus and to a lesser extent at the ventral surface in cell periphery. Our results suggest that NMM-IIA is involved in generating a coherent cytoplasmic contractile force from one side of the cell to the other through the cross-linking and the contraction of dorsal actin filaments. INTRODUCTION Myosin IIs are actin-based motor proteins in eukaryotic cells. They form bipolar filaments and are presumed to contract the actin cytoskeleton. Lower eukaryotes such as Dictyostelium d. express a single myosin II protein. In contrast, higher eukaryotes express a variety of myosin IIs which are classi- fied into muscle myosin IIs and nonmuscle myosin IIs (NMM-IIs) (1). Activities of NMM-IIs play important roles in a variety of cell functions ranging from mitotic spindle assembly (2) to cytokinesis (3), cell spreading (4–6), cell mi- gration (7), and growth cone outgrowth (8). Thus far, three different nonmuscle myosin II isoforms (NMM-IIA, MMM-IIB, and NMM-IIC) have been identified in higher eukaryotes, and they are widely distributed in hu- man and mouse organs but exhibit differential tissue expres- sion patterns (9). Of them, NMM-IIC is absent during the earliest stages of development (9). Most cells in vertebrates express comparable levels of NMM-IIA and NMM-IIB (1) with some exceptions such as neuronal cells in which NMM- IIB is predominantly expressed (1,10). In both neuronal (10) and nonneuronal cells (11–15), NMM-IIA and NMM-IIB have distinct but overlapping distributions. Depending on cell types, the same NMM-II isoform may be distributed differently. Furthermore, both NMM-IIA and NMM-IIB interact with different proteins (16–19), which indicates that they may have distinct functions. Finally, NMM-IIA and NMM-IIB undergo dynamic reorganization in motile cells (13,15,20), implying that their biological functions are related to their dynamic reorganization. Deletion of NMM-IIB results in a decrease in cellular traction force (12,21,22), the rate of neurite outgrowth (8,23), and the size of growth cones (8). It is accepted that the ad- vance of growth cones is inversely proportional to retrograde F-actin flow that is mediated by myosin activity (24,25). NMM-IIs appear to be responsible for driving F-actin retro- grade flow in neuronal cells (20), but the involvement of other myosins also has been suggested (26). NMM-IIB null fibroblasts have defects in directional migration as a conse- quence of the multiple, unstable and disorganized protrusions of the cell edge; however, the instantaneous rates of cell movement are in the normal range (12). In comparison with NMM-IIB, relatively less is known about the roles of NMM-IIA. NMM-IIA seems to drive neurite retraction in neuronal cells (27). Antisense oligonu- cleotide treatment of NMM-IIA induces rearrangement of the actin cytoskeleton and decreases cell-matrix adhesion in neuroblastoma cells (28). A similar phenotype is also ob- served in Hela cells when a truncated fragment of the myosin IIA heavy chain is overexpressed (29). Knockout of NMM- IIA leads to impaired embryonic cell-cell adhesion, as in- dicated by the disappearance of E-cadherin and b-catenin from cell-cell adhesion sites (30). In a previous study, we showed that inhibition of myosin light chain kinase (MLCK) blocked periodic lamellipodial contractions (31), indicating that NMM-II activity is critical Submitted March 9, 2006, and accepted for publication July 20, 2006. Address reprint requests to Dr. Michael P. Sheetz, Dept. of Biological Sciences, Columbia University, Sherman Fairchild Center, Rm. 713, 1212 Amsterdam Ave., New York, NY 10027. Tel.: 212-854-4857; Fax: 212-854-6399; E-mail: [email protected]. Ó 2006 by the Biophysical Society 0006-3495/06/11/3907/14 $2.00 doi: 10.1529/biophysj.106.084806 Biophysical Journal Volume 91 November 2006 3907–3920 3907

Welcome message from author
This document is posted to help you gain knowledge. Please leave a comment to let me know what you think about it! Share it to your friends and learn new things together.
Transcript
Nonmuscle Myosin IIA-Dependent Force Inhibits Cell Spreadingand Drives F-Actin Flow
Yunfei Cai,* Nicolas Biais,* Gregory Giannone,* Monica Tanase,* Guoying Jiang,* Jake M. Hofman,y
Chris H. Wiggins,z Pascal Silberzan,§ Axel Buguin,§ Benoit Ladoux,{ and Michael P. Sheetz**Department of Biological Sciences, and yDepartment of Physics, Columbia University, New York, New York; zDepartment of AppliedPhysics and Applied Mathematics, Center for Computational Biology and Bioinformatics, Columbia University, New York, New York;§Physico-Chimie Curie, Unite Mixte de Recherche Centre National de la Recherche Scientifique 168, Institut Curie, Paris, France;and {Matiere et Systemes Complexes, CNRS UMR 7057/Universite Paris 7, Paris, France
ABSTRACT Nonmuscle myosin IIA (NMM-IIA) is involved in the formation of focal adhesions and neurite retraction. However,the role of NMM-IIA in these functions remains largely unknown. Using RNA interference as a tool to decrease NMM-IIAexpression, we have found that NMM-IIA is the major myosin involved in traction force generation and retrograde F-actin flow inmouse embryonic fibroblast cells. Quantitative analyses revealed that ;60% of traction force on fibronectin-coated surfaces iscontributed by NMM-IIA and ;30% by NMM-IIB. The retrograde F-actin flow decreased dramatically in NMM-IIA-depleted cells,but seemed unaffected by NMM-IIB deletion. In addition, we found that depletion of NMM-IIA caused cells to spread at a higherrate and to a greater area on fibronectin substrates during the early spreading period, whereas deletion of NMM-IIB appeared tohave no effect on spreading. The distribution of NMM-IIA was concentrated on the dorsal surface and approached the ventralsurface in the periphery, whereas NMM-IIB was primarily concentrated around the nucleus and to a lesser extent at the ventralsurface in cell periphery. Our results suggest that NMM-IIA is involved in generating a coherent cytoplasmic contractile forcefrom one side of the cell to the other through the cross-linking and the contraction of dorsal actin filaments.
INTRODUCTION
Myosin IIs are actin-based motor proteins in eukaryotic cells.
They form bipolar filaments and are presumed to contract the
actin cytoskeleton. Lower eukaryotes such as Dictyostelium d.
express a single myosin II protein. In contrast, higher
eukaryotes express a variety of myosin IIs which are classi-
fied into muscle myosin IIs and nonmuscle myosin IIs
(NMM-IIs) (1). Activities of NMM-IIs play important roles
in a variety of cell functions ranging from mitotic spindle
assembly (2) to cytokinesis (3), cell spreading (4–6), cell mi-
gration (7), and growth cone outgrowth (8).
Thus far, three different nonmuscle myosin II isoforms
(NMM-IIA, MMM-IIB, and NMM-IIC) have been identified
in higher eukaryotes, and they are widely distributed in hu-
man and mouse organs but exhibit differential tissue expres-
sion patterns (9). Of them, NMM-IIC is absent during the
earliest stages of development (9). Most cells in vertebrates
express comparable levels of NMM-IIA and NMM-IIB (1)
with some exceptions such as neuronal cells in which NMM-
IIB is predominantly expressed (1,10). In both neuronal (10)
and nonneuronal cells (11–15), NMM-IIA and NMM-IIB
have distinct but overlapping distributions. Depending on
cell types, the same NMM-II isoform may be distributed
differently. Furthermore, both NMM-IIA and NMM-IIB
interact with different proteins (16–19), which indicates that
they may have distinct functions. Finally, NMM-IIA and
NMM-IIB undergo dynamic reorganization in motile cells
(13,15,20), implying that their biological functions are
related to their dynamic reorganization.
Deletion of NMM-IIB results in a decrease in cellular
traction force (12,21,22), the rate of neurite outgrowth (8,23),
and the size of growth cones (8). It is accepted that the ad-
vance of growth cones is inversely proportional to retrograde
F-actin flow that is mediated by myosin activity (24,25).
NMM-IIs appear to be responsible for driving F-actin retro-
grade flow in neuronal cells (20), but the involvement of
other myosins also has been suggested (26). NMM-IIB null
fibroblasts have defects in directional migration as a conse-
quence of the multiple, unstable and disorganized protrusions
of the cell edge; however, the instantaneous rates of cell
movement are in the normal range (12).
In comparison with NMM-IIB, relatively less is known
about the roles of NMM-IIA. NMM-IIA seems to drive
neurite retraction in neuronal cells (27). Antisense oligonu-
cleotide treatment of NMM-IIA induces rearrangement of
the actin cytoskeleton and decreases cell-matrix adhesion
in neuroblastoma cells (28). A similar phenotype is also ob-
served in Hela cells when a truncated fragment of the myosin
IIA heavy chain is overexpressed (29). Knockout of NMM-
IIA leads to impaired embryonic cell-cell adhesion, as in-
dicated by the disappearance of E-cadherin and b-catenin
from cell-cell adhesion sites (30).
In a previous study, we showed that inhibition of myosin
light chain kinase (MLCK) blocked periodic lamellipodial
contractions (31), indicating that NMM-II activity is critical
Submitted March 9, 2006, and accepted for publication July 20, 2006.
Address reprint requests to Dr. Michael P. Sheetz, Dept. of Biological
Sciences, Columbia University, Sherman Fairchild Center, Rm. 713, 1212
Amsterdam Ave., New York, NY 10027. Tel.: 212-854-4857; Fax:
212-854-6399; E-mail: [email protected].
� 2006 by the Biophysical Society
0006-3495/06/11/3907/14 $2.00 doi: 10.1529/biophysj.106.084806
Biophysical Journal Volume 91 November 2006 3907–3920 3907

for fibroblasts to probe the extracellular substrate during
spreading and migration. However, there are some important
questions remaining to be addressed. For example, what are
the roles of NMM-IIA and NMM-IIB in cell spreading?
Does NMM-IIA contribute to cellular traction force? To
answer those questions, we have explored the roles of NMM-
IIs in several aspects of cell motility including traction force
generation, retrograde F-actin flow, and cell spreading in
MEF cells. The findings are all consistent with the hypoth-
esis that NMM-IIA has a primary role in developing a cohe-
rent, contractile network from one side of the cell to the other.
MATERIALS AND METHODS
Antibodies and materials
Polyclonal rabbit antibodies against the heavy chains of NMM-IIA and
NMM-IIB were obtained as a gift from Dr. Robert Adelstein (National In-
stitutes of Health, Bethesda, MD) and purchased from Covance (Richmond,
CA), respectively. Monoclonal antibody against NMM II-B (clone CMII 23)
was from Developmental Studies, Hybridoma Bank (University of Iowa,
Iowa City, IA). Polyclonal rabbit anti-b-actin antibody was from Abcam
(Cambridge, MA). Monoclonal anti-vinculin antibody and LPA were from
Sigma (St. Louis, MO). Rhodamine-phalloidin, all fluorophore-conjugated
secondary antibodies, and Calcein-AM were from Molecular Probes (Eugene,
OR). Blebbistatin and cytochalasin D were from Calbiochem (San Diego,
CA). Fibronectin used for coating coverslips and micro-posts was from Roche
(Indianapolis, IN). Laminin was from Invitrogen (Carlsbad, CA). GFP
(green fluorescent protein) -NMM-IIA and -IIB constructs were described
elsewhere (22).
Cell culture and transfection
All MEF cell lines were maintained in Dulbecco’s modified Eagle medium
(DMEM) (Invitrogen) supplemented with 10% NCS except that the medium
for the RPTP cell lines was supplemented with 10% FBS. Plasmid trans-
fection was performed with FuGene 6 (Roche) or Nucleofector II (Amaxa,
Gaithersburg, MD).
Silencing of nonmuscle NMM-IIA
The pSilencer H1-3.1 puro vector (Ambion, Austin, TX) was used to express
hairpin short interfering RNA (siRNA) targeting mouse nonmuscle NMM-
IIA (accession No. NM_022410). The targeting sequence is: GGTGAA-
GGTGAACAAGGAC. 48–72 h after transfection of cells with siRNA
expression plasmid, puromycin was added to the medium to eliminate
untransfected cells and obtain a survival pool of transfected cells. For clonal
stable cell lines, cells were clonally selected in 96-well plates. As control, a
plasmid encoding a hairpin siRNA whose sequence is not found in the
mouse databases (provided by Ambion) was used.
Western blot
Cell lysates were separated in SDS-PAGE and transferred to Millipore
nitrocellulose membranes (Billerica, Massachusetts). Then, the membranes
were blocked with blocking solution (10% glycerol, 2% Bio-Rad nonfat dry
milk (Hercules, CA) in PBS) overnight at 4�C, followed by incubation with
primary antibodies as listed above. Bound primary antibodies were detected
by ECL detection (Amersham, Piscataway, NJ). The polyclonal rabbit
antibody, not monoclonal antibody, against the heavy chain of NMM-IIB
was used in the Western blot analysis.
Coverslip and cell preparation forspreading assays
Coverslips were prepared as previously described (31,32). Cells were
detached with trypsin/EDTA and the trypsin was inactivated by 1 mg/ml
soybean trypsin inhibitor (Sigma). The cells were then suspended in DMEM
without serum and incubated for 20 min at 37�C. For total internal reflection
fluorescence (TIRF) microscopy of cell-spreading experiments, cells were
incubated with 0.2 mM Calcein-AM for another 20 min before being plated
onto substrates.
Immunofluorescence staining
Cells on coverslips were fixed in 3.7% formaldehyde and permeabilized
with 0.1% Triton X-100 and then incubated with primary antibodies in PBS/
2% BSA followed by incubation with secondary antibodies. Actin filaments
were stained with rhodamine-phalloidin. Epifluorescence and TIRF images
were captured on an Olympus IX81 inverted microscope (objectives,
Olympus PIanApo 403/1.35 oil or 603/1.45 oil; cooled CCD camera,
Roper Scientific; imaging software, SimplePCI).
Measurement of traction forces with micro-posts
The polydimethylsiloxane (PDMS) micro-posts were prepared and charac-
terized as described previously (33). The dimension of the PDMS micro-
posts was 1 mm in diameter, 2 mm center-to-center, and 6 mm in height. The
spring constant of the posts was 1.87 nN/mm. To coat posts with fibronectin,
arrays of posts were immersed in 10 mg/ml of fibronectin solution for 1 hr at
37�C and then washed with DPBS. Then, cells were plated on the posts in a
37�C incubator for 90 min. The tips of the posts were visualized with a
LUCPIanFI 403/0.60 air objective in bright-field mode on an IX71
Olympus inverted microscope (cooled CCD camera, Roper Scientific;
imaging software, SimplePCI). A multiple-particle tracking program (33)
was used to analyze the displacement of the posts. Briefly, this multiple
particle-tracking program calculated the position of each post for an acquired
image. This routine was based on the fact that, in bright-field microscopy,
micro-posts acted as wave-guides and appeared bright whereas the back-
ground appeared dark. We were able to identify positions of micro-posts
with good accuracy by determining the center of mass of the corresponding
bright pixels. To detect deflection of a micro-post, it was necessary to know,
in addition to its actual position, the unbent position, which was difficult
because micro-posts covered by cells can never be considered as being at
rest. To overcome this difficulty, our method relied on the characteristic that
the array of micro-posts was an extremely regular hexagonal lattice. Al-
though each micro-post in a square array would be the intersection of a row
and a column of the matrix, each micro-post belonged to three rows with
angles of 60� and 120� between them in a hexagonal lattice. To determine
the rest position of a given covered micro-post, the computer program
located the positions of the uncovered posts belonging to the same row and
fitted them linearly. The unbent position of the pillar was estimated as the
intersection of two lines, given by the rows to which it belongs.
The spatial resolution was 5 nm, corresponding to 9 pN force, in the
experimental system used in this study. We analyzed the systematic error in
force measurement. To obtain it, we selected random areas where there were
no cells in the images acquired from independent samples and measured the
displacement of micro-posts. The systematic error was 0.0155 nN per post,
which was subtracted in the calculation of the cell traction force.
Coupling of fibronectin to beads
Magnetic beads (100 ml of 2.7-mm) (Dynal Biotech) were washed with 0.1
M carbonate buffer and 0.02 M phosphate buffer sequentially before being
incubated in 750 ml 2% carbodiimide/phosphate buffer for 3 h at room
temperature. The beads were then washed with 0.1 M borate buffer and
3908 Cai et al.
Biophysical Journal 91(10) 3907–3920
incubated with 400 mg of albumin from chicken egg white (Sigma). The
beads were incubated in 1 ml of 0.1 M ethanolamine, washed with 0.02 M
phosphate buffer, and biotinylated with 450 mg NHS-LC biotin (Pierce). The
beads were incubated in 500 ml 10 mg/ml BSA/PBS overnight at 4�C. Then,
30 ml beads were incubated with 16 ml 10mg/ml avidin (Molecular Probes)
for 30 min at room temperature, washed with BSA/PBS, and incubated with
5 mg purified biotin-fibronectin for 30 min at room temperature.
Retrograde F-actin flow assay
Cells were plated onto laminin (40 mg/ml) -coated coverslips preloaded with
fibronectin-coated 2.7-mm magnetic beads to allow spread at 37�C. Two-
second time-lapse images of beads transported centripetally on surface of
spreading cells were captured on an IX81 Olympus inverted microscope
(objective, Olympus PIanApo 603/1.45 oil; cooled CCD camera, Roper
Scientific; imaging software, SimplePCI).
TIRF microscopy
To study spreading, the entire cell spreading process of cells labeled with
Calcein-AM was captured as previously described (32). To follow the
dynamics of GFP-NMM-IIA and GFP-NMM-IIB in cells, time-lapse images
were captured with a cooled CCD camera (Roper Scientific) attached to an
Olympus IX81 inverted microscope (objective, Olympus PIanApo 603/
1.45 oil; imaging software, SimplePCI) coupled to the 488-nm excitation
light from an Inova argon-ion laser.
Image analysis of TIRF images andbead movement
To quantify the size of vinculin-containing focal adhesions, a threshold
(value depending on individual images) was applied to vinculin TIRF
images. ‘‘Particle analysis’’ function in ImageJ was then used to calculate
the size (area) of focal adhesions.
To quantify cell spread area and generate a velocity map, sequential TIRF
images for the study of cell spreading were analyzed using a method as
described elsewhere (34). In detail, time-lapse image sequences were
analyzed with Matlab (The Mathworks, Natick, MA). The expectation-
maximization (35) algorithm was used to calculate the maximum likelihood
probability distribution over pixel intensities for each frame, constrained to
the functional form of a weighted sum of two normal distributions (one
describing a class of foreground pixels at high intensities, the other a class of
background pixels at low intensities) (36). The inferred mean intensities
were used to perform background subtraction and foreground normalization,
allowing for robust handling of varying contrast and brightness between
frames. An averaging filter (applied over both space and time) was used to
mollify noise in the normalized image sequence; expectation-maximization
was then reapplied to update pixel intensity model parameters. Given a user-
prescribed sensitivity (i.e., relative probability) for assignment to the
foreground class, a threshold pixel value was calculated and used to convert
the grayscale image sequence to a binary one. The resulting set of fore-
ground pixels defined a simple closed curve delineating the edge of the cell,
which was then parameterized by arc length to accommodate cells with
nonconvex morphologies. For each point on the boundary, the normal ve-
locity was calculated as the ratio of temporal differences in pixel intensities
to the magnitude of spatial differences at that point (a simpler case of the
vectorial velocity inference problem often addressed by optical flow
methods) (37). Results are displayed in color-coded plots, as in Fig. 5,
E–H, where points on the cell boundary are specified by time (in minutes)
and arc length (in microns); red coloring represents protrusion events
whereas blue represents retraction events. Velocities with an absolute value
,0.5 mm/min are not shown in the plots, as they are not considered to be
relevant events. They are reflected as colorless patches among red and blue
ones. Plotting velocity as a function of arc length and time gave the dynamic
motility pattern of a cell. The area bounded by the cell contour was also
calculated and plotted as a function of time.
Kymograph analyses of GFP-NMM-II TIRF images were performed
using ImageJ software.
Bead movement on spreading cells was analyzed as following: a custom
nano-tracking ImageJ plug-in was used to determine the coordinates of
beads in sequential images. Then, the coordinates were loaded to a custom
velocity function in Igor software to analyze the instantaneous velocity and
the average velocity.
Statistical analysis
All statistical analyses were performed with a Student’s t-test tool.
RESULTS
Traction force is reduced inNMM-IIA-knockdown cells
To study the functions of NMM-IIA, we knocked down its
expression in mouse embryonic fibroblast (MEF) cells using
plasmid-based RNA interference (RNAi). Several RPTP
(namely RPTPa1/1 cells described elsewhere (38)) NMM-
IIA-knockdown clonal cell lines were generated. They all had
similar phenotypes. We focused our further analyses on the
RPTP NMM-IIA-knockdown stable line 6 (RPTP-C6) that
showed ;85% reduction of NMM-IIA protein levels com-
pared with control cells (Fig. 1 A). To investigate the effect of
knockdown in different cell backgrounds, we also knocked
down NMM-IIA in NIH3T3 cells and studied the NIH3T3
NMM-IIA-knockdown stable line 4 (NIH3T3-C4) (Fig. 1 A).
The knockdowns were specific since NMM-IIB, b-actin, and
vinculin were not affected (Fig. 1 A). Furthermore, the con-
trol siRNA plasmid had no effect on the expression of those
proteins (Fig. 1 A). In the rest of the experiments presented
here, the control cells for the study of NMM-IIA functions
were cells transfected with the control plasmid (designated as
RPTP-control or NIH3T3-control) unless specifically noted.
NMM-IIB contributed to traction force in neurons (21) and
MEF cells (12,22). It has been proposed that NMM-IIA
generated traction force as well. Nonetheless, no direct
evidence has been reported yet. To determine whether NMM-
IIA contributed to substrate traction force, we used different
force sensing substrates. On deformable silicone sheets (39),
RPTP-control cells generated more and longer wrinkles than
RPTP-C6 cells in the presence of serum 90 min after plating
as revealed in supplemental Fig. S1 (see Supplementary
Material). The reduction of substrate traction force was also
observed in NIH3T3-C4 stable cells compared with NIH3T3-
control cells (Fig. S1). This result clearly indicated that
NMM-IIA contributed to force generation. For comparison,
we also performed the same assay on the NMM-IIB�/�
(NMM-IIB knockout) cell line and its control, NMM-IIB1/1
cell line (Fig. S1). Both cell lines have no NMM-IIC (12,22).
NMM-IIB�/� cells wrinkled less than NMM-IIB1/1 cells
on silicone sheets (Fig. S1), in agreement with previous
Myosin IIA Regulates Cell Motility 3909
Biophysical Journal 91(10) 3907–3920

studies using collagen gels (22) and deformable polyacryla-
mide gels (12).
To get a more quantitative measure of the traction forces,
we employed deformable arrays of micro-posts as previously
described by us (33) and Tan et al. (40). The arrays of micro-
posts used in this study were 1 mm in diameter and 2 mm
center-to-center. Cells only applied traction force to the tips
of the posts because they attached and spread on the tips of
the posts without spreading down along the posts (data
not shown), as was previously demonstrated using scanning
electron microscopy (33). The NMM-II-deficient and control
cells were plated on the micro-posts coated with fibronectin
in the presence of serum. Cells generated maximal pulling
force after 60–120 min on the posts (40). Hence, we plated
cells for 90 min, and then imaged the well-spread living cells
and the micro-posts (Fig. 1 B) for quantification of traction
force. As shown in Fig. 1 B, the posts were bent inward at the
cell edge, indicating that inward pulling forces were exerted
on the posts by cells. The magnitude of the deflection of
individual posts was obtained by measuring the distance
between the deflected position and the resting position of the
posts using a custom program (33). By adding up the force
applied by the cells on all independently bent posts, we
obtained the total cell force. RPTP-C6 cells generated
;53.4% of the force detected in RPTP-control cells (Table
1). NIH3T3-C4 maintained ;41.6% of the traction force of
NIH3T3-control cells (Table 1). The average of force
generated by those two NMM-IIA-knockdown cell lines
was 47.5% of the controls. Thus, loss of ;85% of the NMM-
IIA (Fig. 1 A) resulted in the loss of ;52.5% of the traction
force. Since the NMM-IIA had a similar distribution pattern
in control cells and NMM-IIA-knockdown cells (Fig. 2), we
assumed that there was a linear relationship between the
level of NMM-IIA and its contribution to traction force.
We therefore proportionally calculated the contribution of
NMM-IIA to the total cell traction force and found that
NMM-IIA was responsible for ;60% of the traction force.
On the other hand, comparison of traction force between
NMM-IIB1/1 cells and NMM-IIB�/� cells revealed that
NMM-IIB protein accounted for ;30% of the traction force
(Table 1). Thus, NMM-IIA contributes the major fraction of
fibroblast traction force. This appeared to agree with what
Lo et al. previously suggested using two-dimensional poly-
acrylamide gel surfaces (12).
We also measured the relative force contribution of
NMM-IIA and NMM-IIB by knocking down NMM-IIA in
NMM-IIB�/� cells to obtain NMM-IIB�/�_IIA-knockdown
(NMM-IIB�/�_IIAKD) cells. This led to the production of
;20% of the cells with two or more nuclei. A similar phe-
notype was displayed by cells treated with blebbistatin, a
specific inhibitor of NMM-IIs (3). In our experiments, we
transfected NMM-IIB�/� cells with NMM-IIA siRNA ex-
pression plasmid and then enriched the population of trans-
fected cells by antibiotic selection for three days. Thus, a
transient pool of NMM-IIB�/�_IIAKD cells was obtained.
FIGURE 1 Force generation involves NMM-IIA. (A) Cell lysates from six
cell lines were subjected to Western blotting for NMM-IIA, NMM-IIB,
vinculin, and b-actin. The RPTP-C6 and NIH3T3-C4 cells containing the
NMM-IIA siRNA expression plasmid have lower expression levels of
NMM-IIA than their respective control cells. RPTP-control-1 and NIH3T3-
control-1 were untransfected control cells. RPTP-control-2 (designated as
RPTP-control in other experiments) and NIH3T3-control-2 (designated as
NIH3T3-control in other experiments) were cells transfected with a control
siRNA plasmid. (B) A representative bright-field image of living cells
spreading on arrays of 10 mg/ml fibronectin-coated micro-posts (1 mm in
diameter and 2 mm center-to-center) in the presence of serum for 90 min at
37�C. Each bright spot represents the tip of a post. Posts covered by the cell
are within the green circles automatically generated by a custom multiple-
particle tracking program (see Materials and Methods for details). Cells
pulled posts inward along the cell edge. Scale bar, 10 mm. Inset is a higher
magnification view of posts boxed in the red square. (C) Western blot
analysis of lysates of NMM-IIB�/�_IIAKD and NMM-IIB�/� cells (with
control plasmid), showing that NMM-IIA expression is suppressed in
NMM-IIB�/�_IIAKD cells.
3910 Cai et al.
Biophysical Journal 91(10) 3907–3920
Immunoblotting (Fig. 1 C) showed that only ;20% of
control levels of NMM-IIA was present in NMM-IIB�/
�_IIAKD cells. Force measurement with micro-post assay
revealed that knockdown of NMM-IIA in NMM-IIB�/� cells
led to a decrease of traction force. Subtraction of the force in
NMM-IIB�/�_IIAKD (;46 nN) cells from that in NMM-
IIB�/� cells (;123 nN) (Table 1) gave ;77 nN, which was
the force value contributed by ;80% of the NMM-IIA.
Proportional calculation of force indicated that the contribu-
tion of NMM-IIA to total force was ;97 nN, which was
;55% of the force seen in NMM-IIB1/1 cells. Thus, NMM-
IIA was again shown to contribute to the major fraction of
fibroblast traction force.
Because force measurements were conducted in the pres-
ence of serum, we tested if the activation level of NMM-II
accounted for the differences seen in the level of traction
force. To maximally activate myosin contraction, we added
external lysophosphatidic acid (10 mM LPA) to NMM-IIB1/1,
NMM-IIB�/�, and NMM-IIB�/�_IIAKD cells. About the
same levels of traction force were generated before and after
TABLE 1 Micro-post assay of force-generation capacity of control cells and NMM-II-deficient cells
Force/post (nN) Total cell force (nN) % Relative to control force
RPTP-control 0.23 6 0.07 (n ¼ 18) 378 6 113 (n ¼ 18) 100
RPTP-C6 0.12 6 0.03 (n ¼ 20) 202 6 38 (n ¼ 20) 53.4
NIH3T3-control 0.23 6 0.05 (n ¼ 18) 276 6 78 (n ¼ 18) 100
NIH3T3-C4 0.10 6 0.03 (n ¼ 20) 115 6 31 (n ¼ 20) 41.6
NMM-IIB1/1 0.18 6 0.04 (n ¼ 18) 178 6 29 (n ¼ 18) 100
NMM-IIB�/� 0.17 6 0.06 (n ¼ 24) 123 6 38 (n ¼ 24) 69.1
NMM-IIB�/�_IIAKD 0.06 6 0.02 (n ¼ 26) 46 6 21 (n ¼ 26) 25.8
NMM-IIB1/1 (LPA) 0.23 6 0.03 (n ¼ 17) 171 6 30 (n ¼ 17) 96.1
NMM-IIB�/� (LPA) 0.18 6 0.04 (n ¼ 18) 118 6 34 (n ¼ 18) 66.3
NMM-IIB�/�_IIAKD (LPA) 0.07 6 0.02 (n ¼ 17) 53 6 20 (n ¼ 17) 29.8
NMM-IIB1/1 (blebbistatin) 0.06 6 0.02 (n ¼ 19) 38 6 20 (n ¼ 19) 21.3
NMM-IIB1/1 (CD) 0.03 6 0.02 (n ¼ 15) 21 6 7.1 (n ¼ 15) 11.8
RPTP-control (CD) 0.04 6 0.02 (n ¼ 14) 31 6 8.0 (n ¼ 14) 8.2
NIH3T3-control (CD) 0.04 6 0.02 (n ¼ 17) 28 6 6.5 (n ¼ 17) 10.1
Total cell force was obtained by multiplying the total post displacement by the spring constant. The average force/post was calculated by dividing the total
cell force by the number of micro-posts covered by a cell. Systematic error (;0.0155 nN per post) was excluded in the calculation of force/post and total cell
force. Force values shown are average mean 6 SD. LPA, lysophosphatidic acid; CD, cytochalasin D.
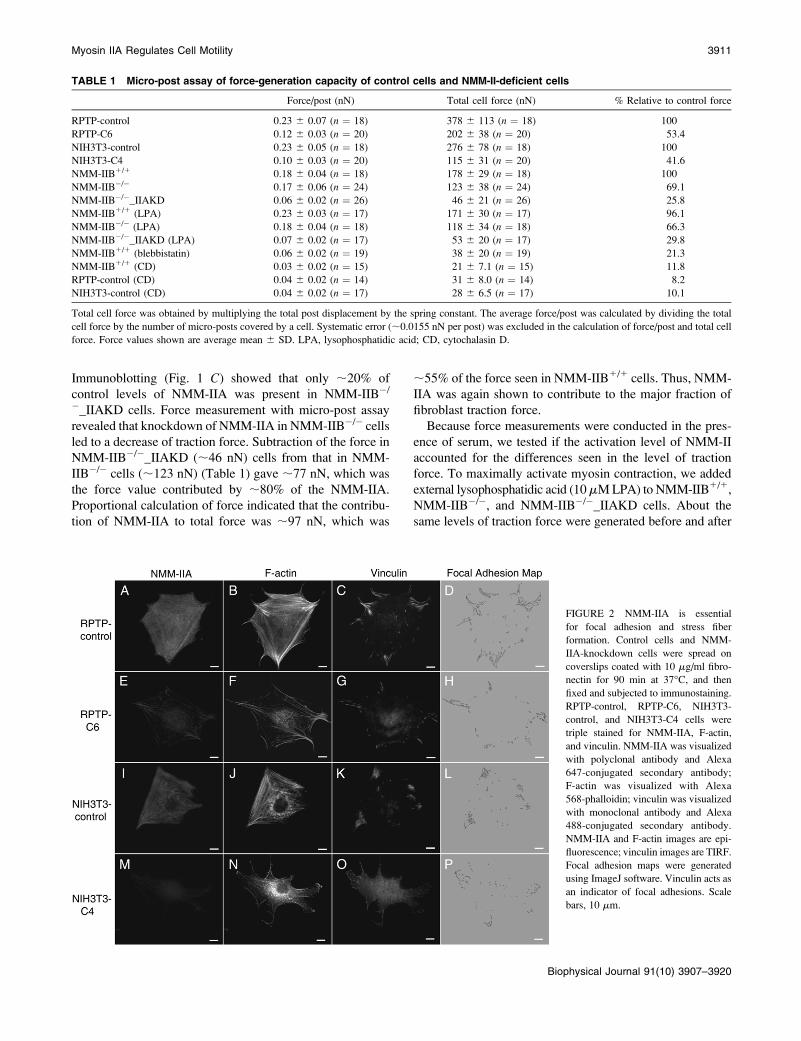
FIGURE 2 NMM-IIA is essential
for focal adhesion and stress fiber
formation. Control cells and NMM-
IIA-knockdown cells were spread on
coverslips coated with 10 mg/ml fibro-
nectin for 90 min at 37�C, and then
fixed and subjected to immunostaining.
RPTP-control, RPTP-C6, NIH3T3-
control, and NIH3T3-C4 cells were
triple stained for NMM-IIA, F-actin,
and vinculin. NMM-IIA was visualized
with polyclonal antibody and Alexa
647-conjugated secondary antibody;
F-actin was visualized with Alexa
568-phalloidin; vinculin was visualized
with monoclonal antibody and Alexa
488-conjugated secondary antibody.
NMM-IIA and F-actin images are epi-
fluorescence; vinculin images are TIRF.
Focal adhesion maps were generated
using ImageJ software. Vinculin acts as
an indicator of focal adhesions. Scale
bars, 10 mm.
Myosin IIA Regulates Cell Motility 3911
Biophysical Journal 91(10) 3907–3920

30 min of exposure to external LPA (Table 1). We did not
observe noticeable differences in cell traction force after 5,
10, 15, 20, and 30 min exposure to external LPA (data not
shown). This experiment indicated that NMM-II was fully
activated in the presence of serum and the traction force level
was indeed primarily dependent upon the NMM-II protein
level. Since NMM-IIB/-_IIAKD cells still retained ;25.8%
of the traction force seen in NMM-IIB1/1 cells, we inhibited
NMM-II activity in NMM-IIB1/1 cells with 50 mM bleb-
bistatin for 40 min and analyzed the force output. We found
that the blebbistatin-treated NMM-IIB1/1 cells still retained
;21.3% of the force (Table 1). Similar to cells treated with
the general inhibitor of myosin ATPase, 2,3-butanedione-2-
monoxime (BDM) (40), cells treated with blebbistatin might
have residual myosin activity. That could include the resid-
ual activity of NMM-II and/or the activity of other myosins.
To test this possibility and determine the lowest traction
force values, we disrupted the actin cytoskeleton of NMM-
IIB1/1 cells by treating them with 1 mg/ml cytochalasin
D for 20 min and found that the traction force was down
to 21 6 7.1 nN, 11.8% of untreated NMM-IIB1/1 cells
(Table 1). This suggests that the NMM-IIB1/1 cells likely re-
tained residual NMM-II activity after treatment with 50 mM
blebbistatin in our experiments. We also measured the
traction force in RPTP-control and NIH3T3-control cells
treated with 1 mg/ml cytochalasin D. They produced 31 6
8.0 nN (8.2% of untreated RPTP-control cells) and 28 6 6.5
nN (10.1% of untreated NIH3T3-control cells), respectively.
Those force values were fairly close to the force generated by
NMM-IIB1/1 cells treated with cytochalasin D. The mea-
sured force in cells treated with cytochalasin D could be due
to membrane tension, adhesion-generated forces, or limited
sensitivity at low force measurement in our system. This
remains to be determined.
Thus, we concluded that, based on the force measurements
with three different MEF cell lines, NMM-IIA contributed
;60% and NMM-IIB contributed ;30% of the total traction
force. The remainder ;10% was from other factors.
NMM-IIA regulates formation of stress fibersand focal adhesions
The actomyosin system was found to be essential for the
formation of focal contacts (41–45). Previous studies of
NMM-IIA in other cells lines including Hela cells (29) and
neuroblastoma cells (28) showed that NMM-IIA regulates
the formation of stress fibers and focal adhesions. This
prompted us to examine the focal adhesions and stress fibers
in NMM-IIA-knockdown MEF cells. MEF cells were spread
on a fibronectin substrate for 90 min before fixation and
immunostaining because, at this time point, normal fibroblast
cells were able to polarize and form focal adhesions and
stress fibers. Staining of NMM-IIA showed that RPTP-C6
cells had significantly less NMM-IIA than RPTP-control
cells (Fig. 2), which fitted with the previous immunoblotting
(Fig. 1 A). The suppression of NMM-IIA led to a reduction
of stress fibers in RPTP-C6 (Fig. 2 F) cells. The remaining
NMM-IIA in RPTP-C6 cells (Fig. 2 E) formed a punctate
pattern in stress fibers and lateral cortex, similar to RPTP-
controls (Fig. 2 A). This was also confirmed with confocal
microscopy (data not shown). In addition to a reduced num-
ber of stress fibers, RPTP-C6 cells appeared to have increased
dot-like actin staining concentrated in the perinuclear area.
The increase of dot-like actin was probably a result of increased
disassembly of stress fibers caused by the deficiency of
NMM-IIA in cells (28). Concomitantly, the size of the focal
adhesions as indicated by vinculin staining was clearly
smaller in RPTP-C6 cells (Fig. 2 G) than in RPTP-control
cells (Fig. 2 C). The same phenotype was also observed
when NMM-IIA was depleted in NIH3T3 cells (Fig. 2, I–P).
Focal adhesions were the sites where cells primarily trans-
mitted force to the substrate (46). In light of this, we quantified
and compared the size of focal adhesions in NMM-IIA-
knockdown cells versus control cells. The vinculin TIRF
images were used to quantify the focal adhesion size in cells
because we found there was interference from the perinu-
clear region when epifluorescent and confocal images were
used for analysis. Since both focal complexes and focal
adhesions contained vinculin (47), we used a size filter to
discriminate between focal complexes and focal adhesions.
Focal complexes were defined as small dots with an apparent
diameter of ;0.7 mm, similar to the size of focal complexes
reported elsewhere (48). We quantified focal adhesions in
control versus NMM-IIA-knockdown cells and found that
RPTP-C6 and NIH3T3-C4 cells had ;34% and ;25% of
the focal adhesion area of their respective control cells (also
see Fig. 3). As demonstrated above with micro-posts assay,
FIGURE 3 Quantitative comparisons of the focal adhesions in control
and NMM-IIA-knockdown cells. On fibronectin substrate, the area of focal
adhesions in NMM-IIA-deficient cells is significantly smaller than controls.
The focal adhesion area in RPTP-C6 cells (82.0 6 19.4 mm2) is ;34% of
that of RPTP-control cells (243.3 6 50.4 mm2). The focal adhesion area in
NIH3T3-C4 cells (33.0 6 6.4 mm2) is ;25% of that of NIH3T3-control cells
(133.8 6 28.3 mm2). Each measurement is from 16-20 cells. t-test, P ,
0.005. Error bars show mean 6 SD.
3912 Cai et al.
Biophysical Journal 91(10) 3907–3920

RPTP-C6 and NIH3T3-C4 cells retained ;53.4% and
;41.6% force of their control cells (Table 1). Thus, the
ratios of the loss of focal adhesions to the loss of traction
force were ;1.37 and ;1.27 for PTP-C6 and NIH3T3-C4,
respectively. Those ratios were close and indicated that the
size of focal adhesions positively correlates with the force
(40,46,49).
Retrograde F-actin flow depends on NMM-IIA
Retrograde F-actin flow is regulated by myosin-based
contractile force in a variety of cell types (20,25,50,51).
Therefore, it is logical to examine the influence of force-
producing NMM-IIs on the retrograde F-actin flow in MEF
cells. To this end, we analyzed the centripetal movement of
fibronectin-coated beads on the surface of spreading MEFs.
Bead movement on the cell surface has been shown to reflect
the rearward movement of the actin cytoskeleton (20,24,31).
We chose to analyze the bead movement in the 3.0-mm-wide
lamellar region that was ;2.0 mm away from the cell leading
edge (Fig. 4, A and B) because there was little or no NMM-II
in the lamellipodium (Fig. 6) (52) and the average width of
lamellipodium in MEFs was ;1–2 mm (31). In these
experiments, cells were plated onto laminin-coated cover-
slips preloaded with fibronectin-coated beads. As cells
spread on the substrate, they picked up the beads and
transported them centripetally (Fig. 4, A and B) (20,25). Most
beads were transported steadily toward the center of cells and
stopped in the perinuclear area. Occasionally, beads stopped
moving after passing the lamellipodium and those beads
were not counted. More beads stopped moving on NMM-
IIA-knockdown cells than controls. For the purpose of
comparison, we analyzed the beads that were picked up by
the cells reaching the late spreading stage where cells were
very active but the cell edge remained relatively in equilib-
rium. Both control cells (i.e., RPTP-control in Fig. 4 B) and
NMM-IIA-knockdown cells (i.e., RPTP-C6 in Fig. 4 B)
could transport beads to the perinuclear region eventually,
but velocity analysis revealed that beads moved at a lower
velocity on RPTP-C6 cells (21.0 6 5.7 nm/s, n ¼ 15 beads,
12 cells) than on RPTP-control cells (58.6 6 11.9 nm/s, n ¼12 beads, 10 cells) (Fig. 4 C; Supplementary Movies 1 and
2). This indicated that NMM-IIA contributed significantly to
retrograde F-actin flow and that NMM-IIB was not able to
compensate for the loss of NMM-IIA in powering retrograde
F-actin flow during early spreading period.
Did NMM-IIB drive actin flow as well? To compare the
roles of NMM-IIA and NMM-IIB in F-actin flow, we first
investigated the effect of ablation of NMM-IIB on the
retrograde F-actin flow in MEF cells. Surprisingly, the
rearward velocity of fibronectin-coated beads on NMM-
IIB�/� cells (59.0 6 25.0 nm/s, n¼ 25 beads, 23 cells, Fig. 4
D; Supplementary Movie 3) was similar to that on NMM-
IIB1/1 cells (57.5 6 20.0 nm/s, n¼ 26 beads, 18 cells, Fig. 4
D; Supplementary Movie 4). When NMM-IIB�/�_IIAKD
cells were analyzed, they displayed reduced capacity to
transport beads (24.0 6 10.1 nm/s, n ¼ 29 beads, 20 cells,
Fig. 4 D; Supplementary Movie 5). This further supported
the hypothesis that NMM-IIA, not NMM-IIB, was involved
in retrograde F-actin transport in MEF cells.
FIGURE 4 Retrograde F-actin flow is driven by
NMM-IIA, not NMM-IIB. (A) A differential interfer-
ence contrast image taken from a time-lapse movie of
fibronectin-coated 2.7-mm magnetic beads transported
on the surface of a MEF cell. White arrow depicts the
centripetal direction of bead movement. The white line
fragment in parallel to the white arrow spans a 3.0-mm-
wide region used to analyze the velocity of bead
movement. Scale bar, 5 mm. (B) Representative beads
transported on control MEF cells (RPTP-control) and
NMM-IIA-knockdown MEF cells (RPTP-C6) cells
were sampled, and the distance from the center of the
beads to the leading edge of the cell was plotted versus
time. The fragments of the traces between the two
horizontal lines (3.0 mm apart, as indicated by the
double-headed arrow) correspond to the travel distance
of beads as depicted by the white line fragment in panel
A. (C) Average velocity of bead movement on RPTP-
control cells and RPTP-C6 cells. t-test, P , 0.001. (D)
Bead movement rate is similar on NMM-IIB1/1 cells
and NMM-IIB�/� cells. Average velocity of bead
movement on NMM-IIB�/�_IIAKD cells is signifi-
cantly slower than on NMM-IIB1/1 cells and NMM-
IIB�/� cells (untransfected cells or cells transfected
with control plasmid). t-test, P , 0.001. Error bars
show mean 6 SD.
Myosin IIA Regulates Cell Motility 3913
Biophysical Journal 91(10) 3907–3920
NMM-IIA impedes early cell spreading
It was generally accepted that there was an inverse relation-
ship between retrograde F-actin flow and cell protrusion
(24,50). If NMM-II powered retrograde F-actin flow, then
the cell protrusion should be augmented when NMM-II was
depleted. Consistent with this concept was the finding that
cells spread larger when NMM-II activity was inhibited by
pharmacological regents (4). In light of this, we have fol-
lowed and analyzed the spreading processes of Calcein AM-
labeled MEF cells on fibronectin substrates to dissect the
roles of NMM-IIA and NMM-IIB in cell spreading using the
TIRF microscope system as previously described (32) (see
Fig. 5 A for selected time-lapse TIRF images of a control
MEF cell spreading on fibronectin). Time 0 refers to the
moment at which cell spread area was large enough (;100
mm2) to be analyzed (32). Typically, the average time for
MEF cells to reach to their fully spread stage on fibronectin
was ;16 min in our experiments. We examined the role of
NMM-IIB in cell spreading by comparing NMM-IIB1/1 and
NMM-IIB�/� MEFs. NMM-IIB1/1 (1254 6 301 mm2
(average 6 standard variation), n ¼ 30 cells) and NMM-
IIB�/� (1265 6 446 mm2, n ¼ 34 cells) cells had similar
spread area after spreading for 16 min (Fig. 5 B), which
indicated that NMM-IIB seemingly had no influence on cell
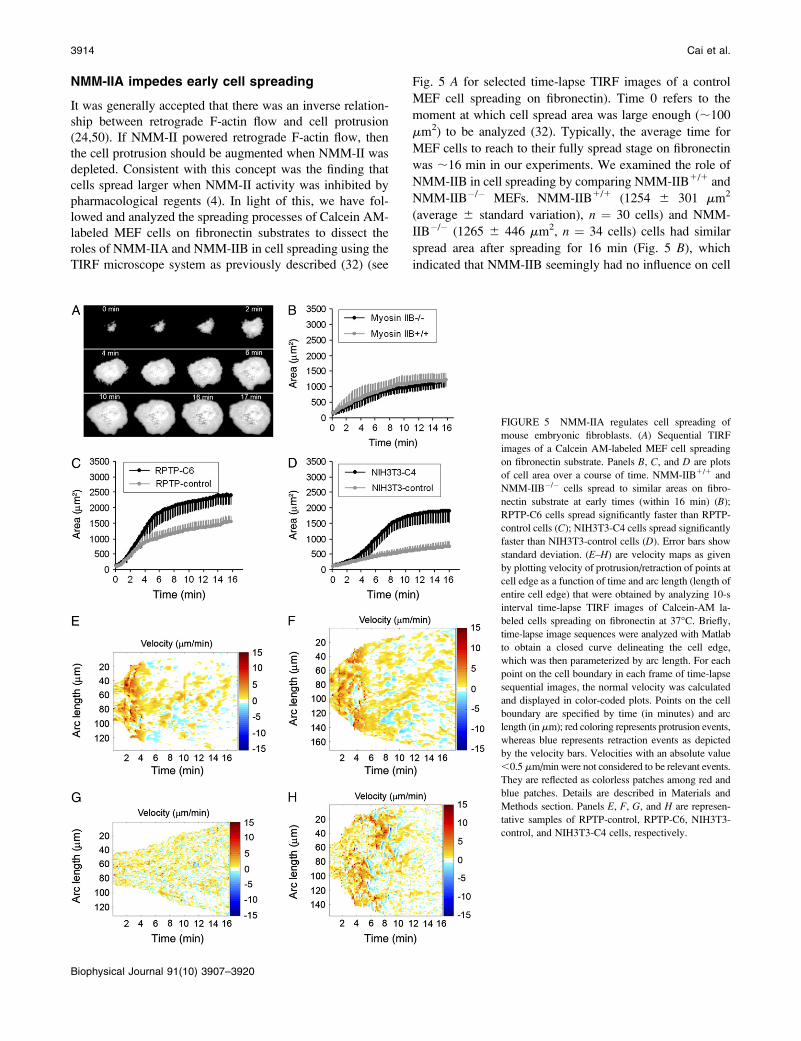
FIGURE 5 NMM-IIA regulates cell spreading of
mouse embryonic fibroblasts. (A) Sequential TIRF
images of a Calcein AM-labeled MEF cell spreading
on fibronectin substrate. Panels B, C, and D are plots
of cell area over a course of time. NMM-IIB1/1 and
NMM-IIB�/� cells spread to similar areas on fibro-
nectin substrate at early times (within 16 min) (B);
RPTP-C6 cells spread significantly faster than RPTP-
control cells (C); NIH3T3-C4 cells spread significantly
faster than NIH3T3-control cells (D). Error bars show
standard deviation. (E–H) are velocity maps as given
by plotting velocity of protrusion/retraction of points at
cell edge as a function of time and arc length (length of
entire cell edge) that were obtained by analyzing 10-s
interval time-lapse TIRF images of Calcein-AM la-
beled cells spreading on fibronectin at 37�C. Briefly,
time-lapse image sequences were analyzed with Matlab
to obtain a closed curve delineating the cell edge,
which was then parameterized by arc length. For each
point on the cell boundary in each frame of time-lapse
sequential images, the normal velocity was calculated
and displayed in color-coded plots. Points on the cell
boundary are specified by time (in minutes) and arc
length (in mm); red coloring represents protrusion events,
whereas blue represents retraction events as depicted
by the velocity bars. Velocities with an absolute value
,0.5 mm/min were not considered to be relevant events.
They are reflected as colorless patches among red and
blue patches. Details are described in Materials and
Methods section. Panels E, F, G, and H are represen-
tative samples of RPTP-control, RPTP-C6, NIH3T3-
control, and NIH3T3-C4 cells, respectively.
3914 Cai et al.
Biophysical Journal 91(10) 3907–3920
spread area. In contrast, the depletion of NMM-IIA resulted
in a significant increase in the spread area. The RPTP-control
cells spread slower than the RPTP-C6 cells (Fig. 5 C). After
the initial spreading process, the RPTP-control cells spread
to a smaller area than the RPTP-C6 cells (Fig. 5 C). The
average rate of increase in cell spread area for RPTP-C6 cells
was 150 6 32.6 mm2/min (n¼ 40 cells), or ;1.54-fold faster
than that of RPTP-control cells (97.5 6 24.2 mm2/min, n ¼41 cells). Correspondingly, the average of cell spread area of
RPTP-C6 (2360 6 298 mm2) was ;1.47-fold as large as that
(1610 6 182 mm2) of RPTP-control cells after 16 min. To
see whether depletion of NMM-IIA caused other MEF cell
lines to spread faster, we examined NIH3T3-control and
NIH3T3-C4 cells. The average time for NIH3T3-C4 cells to
reach to their fully spread stage was ;16 min. However, it
took ;40 min on average for NIH3T3-controls to fully
spread to a smaller area. For comparison of early cell
spreading within the same time scale, we quantified the first
16 min spreading of NIH3T3-control and NIH3T3-C4 cells.
NIH3T3-C4 cells spread (113.1 6 26.0 mm2/min, n ¼ 36
cells) ;2.7-fold faster than NIH3T3-control cells (41.8 6
19.8mm2/min, n¼ 38 cells), and the spread area of NIH3T3-
C4 cells (1910 6 387 mm2) was ;2.5-fold larger than
NIH3T3-control cells (749 6 150 mm2). All the above
differences were significant (t-test, p , 0.001). The same
spreading assay was also applied to at least four other NMM-
IIA knockdown stable cell lines and they also spread to a
larger area than controls (data not shown).
The details of cell edge protrusion/retraction in control and
NMM-IIA-knockdown MEF cells could be visualized in
velocity maps (Fig. 5, E–H). In the first several (;4.5)
minutes, protrusion of the cell edge was dominant in both
RPTP-control cells (Fig. 5 E) and RPTP-C6 cells (Fig. 5 F).
The velocity of cell edge protrusion (red color) was similar in
both cell lines during this period; but between 4.5 and 6 min,
RPTP-C6 cells clearly had a higher velocity of edge
protrusion than RPTP-controls. At later times (from ;6 to
;16 min), RPTP-C6 cells had obvious longer and more
extensive protrusion events than RPTP-control cells al-
though the highest velocity of local edge protrusion was
similar. In RPTP-C6 cells, the fraction of the edge that was
stationary (colorless patches among red and blue ones in
velocity plots) was smaller than in RPTP-control cells,
indicating that the rate of area increase was greater. In terms
of edge retraction (blue color), both cell lines had a similar ve-
locity distribution of edge retraction events. When NIH3T3-
control cells (Fig. 5 G) were compared with NIH3T3-C4
cells (Fig. 5 H), the controls had a much slower velocity of
edge protrusion as well as shorter and smaller protrusion
events through almost the entire spreading process. Again,
the distributions of retraction events were comparable in
NIH3T3-control and NIH3T3-C4 cells. Thus, the instanta-
neous process of edge movement was dramatically greater in
extent and velocity when NMM-IIA was depleted.
Given the above findings in force and retrograde F-actin
flow analyses, we suggest that NMM-IIA, not NMM-IIB,
powers early cytoplasmic contractions that inhibited the rate
of spreading and resulted in a decreased spread area at early
times.
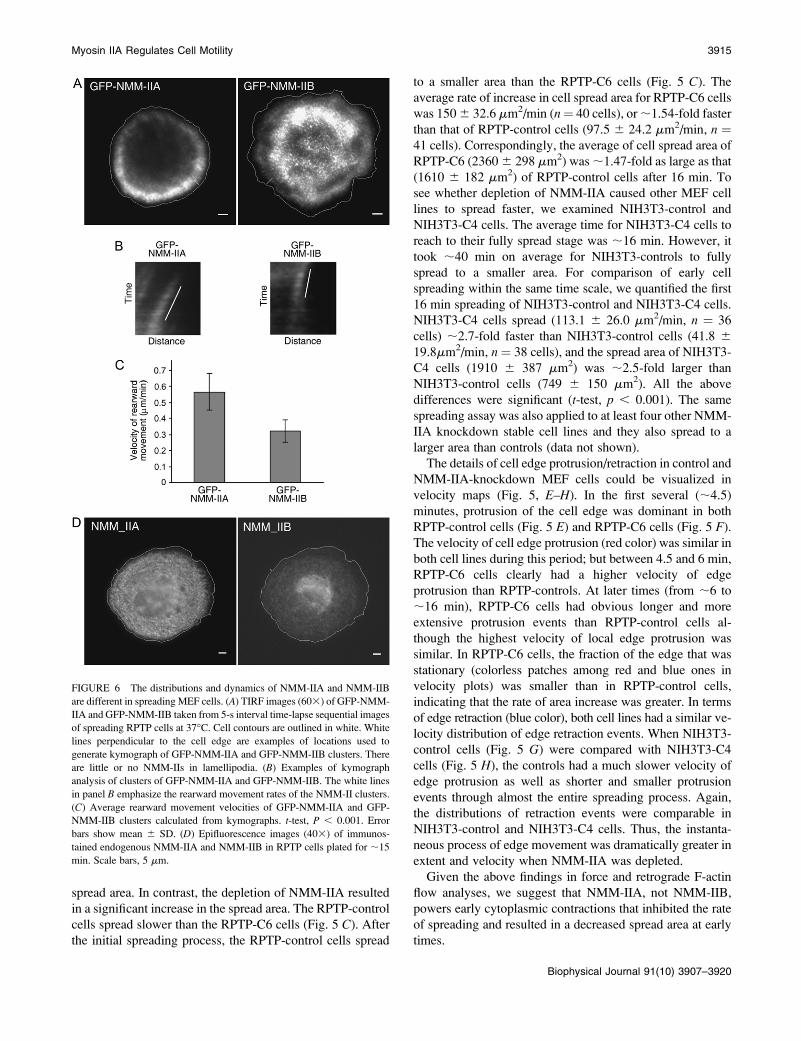
FIGURE 6 The distributions and dynamics of NMM-IIA and NMM-IIB
are different in spreading MEF cells. (A) TIRF images (603) of GFP-NMM-
IIA and GFP-NMM-IIB taken from 5-s interval time-lapse sequential images
of spreading RPTP cells at 37�C. Cell contours are outlined in white. White
lines perpendicular to the cell edge are examples of locations used to
generate kymograph of GFP-NMM-IIA and GFP-NMM-IIB clusters. There
are little or no NMM-IIs in lamellipodia. (B) Examples of kymograph
analysis of clusters of GFP-NMM-IIA and GFP-NMM-IIB. The white lines
in panel B emphasize the rearward movement rates of the NMM-II clusters.
(C) Average rearward movement velocities of GFP-NMM-IIA and GFP-
NMM-IIB clusters calculated from kymographs. t-test, P , 0.001. Error
bars show mean 6 SD. (D) Epifluorescence images (403) of immunos-
tained endogenous NMM-IIA and NMM-IIB in RPTP cells plated for ;15
min. Scale bars, 5 mm.
Myosin IIA Regulates Cell Motility 3915
Biophysical Journal 91(10) 3907–3920

NMM-IIA has different distribution and dynamicsfrom NMM-IIB in spreading MEF cells
Since NMM-IIA and NMM-IIB displayed differential cel-
lular functions in our studies, we investigated whether
NMM-IIA and NMM-IIB had different distributions and
dynamics in spreading MEF cells. To this end, we first
examined GFP-NMM-IIA and GFP-NMM-IIB adjacent to
the interface of RPTP MEF cells with extracellular substrate
using TIRF microscopy. Both NMM-IIA and NMM-IIB
(Fig. 6 A) were in discrete clusters. There were few or no
NMM-II clusters in the lamellipodia of spreading RPTP
cells. NMM-IIA was extremely rich in the front lamellar
region but present in inner regions of the cell at a very low
density (Fig. 6 A). In contrast, NMM-IIB was seen primarily
in the perinuclear region of cells (Fig. 6 A). Close exam-
ination of sequential TIRF images demonstrated that both
NMM-II isoforms underwent rearward movement (Supple-
mentary Movies 6 and 7). In the inner regions, NMM-II
clusters showed several different movement behaviors.
Clusters showed irregular, slow rearward movement (even
forward movement occasionally) with occasional lateral
movement or stationary periods. In the front lamellar re-
gions, clusters clearly moved rearward and the velocities of
movement of NMM-IIA and NMM-IIB clusters were
different. To compare their velocities, we analyzed kymo-
graphs of GFP-NMM-IIA and GFP-NMM-IIB clusters in the
periphery of front lamellar regions (Fig. 6 B) and calculated
velocities from the slopes. NMM-IIA (0.56 6 0.11 mm/min,
Fig. 6 C, n ¼ 50 clusters, 6 cells) moved rearward sig-
nificantly faster than NMM-IIB (0.32 6 0.07 mm/min, Fig. 6
C, n ¼ 40 clusters, 5 cells), in agreement with earlier studies
in endothelial cells (14).
TIRF only detects fluorescence within a few hundred
nanometers of the substrates. To examine whether NMM-
IIA and NMM-IIB were in the area not adjacent to the cell-
substrate contact surface, we spread RPTP MEF cells for
;15 min, immunostained for NMM-IIA and NMM-IIB and
performed epifluorescent microscopy. Although epifluores-
cent images could not tell us whether NMM-IIs were in the
cortex or in other areas of cytoplasm, it was important for us
to determine whether we could see similar distribution
patterns of NMM-IIA and NMM-IIB throughout entire cell
space as those we saw with TIRF microscopy. Epifluorescent
images (Fig. 6 D) showed that NMM-IIA and NMM-IIB had
punctate distributions outside of the lamellipodium. Inter-
estingly, NMM-IIA was relatively uniformly distributed in a
3–10 mm ring extending from the back of the lamellipodium
inward. To confirm TIRF and epifluorescent images,
confocal microscopy was carried out. The confocal Z-stacks
(supplemental Fig. S2, Supplementary Material), together
with the TIRF and epifluorescent images, indicated that
NMM-IIA accumulated at high density near the cell-
substrate interface in the outer portion of the lamellar region.
In the inner region of cells, NMM-IIA was concentrated
above the cell-substrate interface in a cortical distribution.
On the other hand, NMM-IIB was concentrated in perinu-
clear regions in epifluorescent and TIRF images (Fig. 6) as
well as confocal Z-stacks (Fig. S2). The dramatic differences
in NMM-IIA and NMM-IIB distributions were consistent
with their different functional activities.
DISCUSSION
We find that ;90% or more of the traction force generated
by MEF cells on a fibronectin-coated substrate is lost with
the removal of NMM-IIs. NMM-IIA is responsible for the
majority (;60%) of the force whereas NMM-IIB accounts
for a smaller fraction (;30%). Our force analyses are in
agreement the work from Lo et al., who demonstrated that
NMM-IIB�/� fibroblasts retained the majority of the traction
force on flexible polyacrylamide substrates (12). This is
consistent with earlier observations of functional differences
between the two NMM-II isoforms (12,13,53,54). In addi-
tion, there is a larger cell spread area on fibronectin at early
times with the loss of NMM-IIA but not NMM-IIB. NMM-
IIA may be responsible for pulling in the actin cytoskeleton
and counteracting cell spreading. In support of this, the rate
of edge movement outward is increased in NMM-IIA-
knockdown cells. Further, the rate of inward actin cytoskel-
eton transport is decreased dramatically in NMM-IIA-
knockdown cells. Analyses of GFP-NMM-IIA and GFP-
NMM-IIB clusters indicate that NMM-IIA moves inward
more rapidly than NMM-IIB. Thus, we favor the hypothesis
that contraction of NMM-IIA is a major factor in organizing
a coherent cytoskeleton that is able to generate force from
one side of the cell to the other by pulling the actin cyto-
skeleton inward.
Several lines of evidence indicate that NMM-IIs are major
force generators in nonmuscle cells although they are not the
only force generators needed for cell migration. In the
amoeboid cells of Dictyostelium d., migration in the absence
of NMM-II is greatly slowed when the cells need to generate
force to move (55,56). In NMM-IIB�/� MEF cells, there is
considerable evidence of decreased force generation from
other groups (12,21) and in this study (Table 1). However,
NMM-IIA is the major contributor to mechanical force
generation in MEF cells, responsible for ;60% of the total
traction force. Interestingly, NMM-IIB�/�_IIAKD cells still
generated 25.8% of force generated by NMM-IIB1/1 cells.
The remaining ;20% of NMM-IIA expressed in NMM-
IIB�/�_IIAKD cells may be responsible for about half of the
force. Some of the measured force may be due to the adhe-
sion of the cell to the post tips and the fluctuations in cell
volume without a significant myosin contribution, since
significant forces (;10% of control) are observed after
cytochalasin D inhibition of actin filament assembly. When
exposing the cells to LPA, we found that there was still
decreased traction force generated by NMM-IIA-knockdown
3916 Cai et al.
Biophysical Journal 91(10) 3907–3920
cells, indicating the overall contractility of these cells is
dependent upon the level of NMM-IIA and not the amount of
activation. There are several caveats to the quantification of
total cell force, such as cell area or the expression level
of other myosins; however, we only find inward contractile
forces and not extensile forces (for all cells). After taking into
account the ;10% of the post force generated by adherence
and possibly volume changes, we estimate that ;90% or
more of the fibroblast tension on micro-posts is due to
NMM-IIs and the contribution of other myosins is not above
the errors in our measurements (estimated at ;5 nN).
There are additional consequences to the loss of NMM-
IIA related to the rearward flow of F-actin and the spreading
process. As others have observed for cells strongly adherent
to the substrate, the loss of the retrograde force leads to an
increase in cell extension, consistent with the ‘‘clutch’’
hypothesis (50,57,58). NMM-IIA-based contractile force
leads to retrograde slipping of actin cytoskeleton with respect
to focal adhesions as well as expansion of those contacts.
When force is reduced and the adhesive contacts remain,
there is reduced retrograde F-actin flow. Since actin assem-
bly and retrograde F-actin flow are uncoupled processes (25),
the net effect of reduced retrograde F-actin flow and sus-
tained actin assembly is an increase in cell protrusion rate
(Fig. 5). The increased area with NMM-IIA depletion is found
only at early times after spreading and at later times (e.g., 90
min after plating) the cells have an area similar to control
cells (Fig. 2). One explanation for this change is that the cells
in a polarized phase do not have the same organization of
NMM-IIA (59). An example of the changes in myosin
organization in different phases of motility is the redistribu-
tion of NMM-IIB to the leading lamellipodia when cells are
pulling on collagen fibers in three-dimensional (3-D) sub-
strates as opposed to moving on two-dimensional (2-D)
collagen-coated glass (22). Thus, we suggest that NMM-IIA
is a primary motor for actin rearward movement that inhibits
cell spreading in the contractile phase of cell spreading on
2-D surfaces (31).
A number of earlier studies are consistent with our
observation of the roles of NMM-IIA in spreading MEFs.
Inhibition of NMM-II activity with the protein kinase
inhibitor staurosporine or the MLCK inhibitor KT5926
facilitates fibroblast spreading (4) and inhibits F-actin flow in
the cell center of sea urchin coelomocytes (51). Inhibition of
myosin activity by NEM-inactivated myosin S1 fragments or
by BDM enhances growth cone advance of Aplysia bag cell
neurons (25). Further support is from a very recent report by
Medeiros et al. who reported that F-actin retrograde flow is
remarkably decreased in Aplysia bag cell neurons treated
with blebbistatin (60). One important part of our findings is
that we have addressed that NMM-IIA, not NMM-IIB,
primarily regulates cell protrusion and retrograde F-actin
flow of spreading MEF cells. In agreement with this idea is
that overexpression of NMM-IIA does not rescue the change
of growth cone turning caused by the loss of NMM-IIB in
explanted neurons of NMM-IIB knockout mice (61). These
findings support the concept that NMM-IIA and NMM-IIB
have distinct functions.
In conjunction with the reduction of force in NMM-IIA-
deficient MEF cells, there are fewer focal adhesions and stress
fibers, as expected from previous studies demonstrating that
force correlates with the size of focal adhesions (40,46).
NMM-IIA is the major force generator and is essential for the
development of focal adhesions and stress fibers (Fig. 2)
(28,29). NMM-IIB generates some mechanical force as well
(Table 1) (12) but seems not to be involved in the devel-
opment of focal adhesions and stress fibers (12). This is
consistent with the picture that NMM-IIB may be more
involved in local force generation on 2-D substrates or 3-D
force generation in lamellipodial regions (22), whereas
NMM-IIA may function primarily in 2-D force generation
from one side to the other in fibroblasts.
Different distributions as well as different activity levels
may account for the different functional roles of NMM-IIA
and NMM-IIB. One possibility is that NMM-IIA may con-
nect the central cytoskeleton to the peripheral actin cyto-
skeleton in cells spreading on 2-D surfaces, which is supported
by the observation that, near the fibronectin-coated glass
substrate, NMM-IIA accumulates at high density in the front
portion of the lamellar region, whereas in regions around the
nucleus, NMM-IIA is rich above the nucleus in the cortical
region of cells (Fig. 6 and supplemental Fig. S2). The pe-
ripheral actin filaments that are transported rearward by
NMM-IIA are presumably linked to the other parts of the cell
by a coherent cytoskeleton in which NMM-IIA plays a sig-
nificant role as a cross-linker. In early cell spreading where
substrate contacts have not matured, the loss of NMM-IIA
will weaken the coherence, resulting in accelerated and
uncoordinated cell spreading. Unlike NMM-IIA, NMM-IIB
seems not to be the driving force for the rearward F-actin
transport. NMM-IIB is localized much more in perinuclear
regions than in other cytoplasmic areas in early spreading
cells (Fig. 6 and supplemental Fig. S2). It is tempting to
argue that NMM-IIB might be close to substrate contacts
throughout the cell, and, therefore, no detectable difference
in retrograde flow was detected between NMM-IIB1/1 and
NMM-IIB�/� cells using the bead assay, and yet it does con-
tribute to traction forces and peripheral contractions in
spreading. On 2-D substrates, NMM-IIB may be largely in
an inactive pool that is stored in the perinuclear region and
then recruited for peripheral contractions or fiber pulling
(Fig. 6). The higher concentrations of NMM-IIA above the
surface further supports our hypothesis that it is primarily
involved in the radial contraction of peripheral actin and
developing a cohesive cytoskeleton on 2-D surfaces.
The distinct functions of MM-IIA and NMM-IIB are also
perhaps related to their different biochemical characteristics,
interaction partners, and dynamics. NMM-IIA has about a
threefold greater actin-activated ATPase rate and transloca-
tion rate for actin filaments than NMM-IIB does (53).
Myosin IIA Regulates Cell Motility 3917
Biophysical Journal 91(10) 3907–3920

Accordingly, the kinetic mechanisms for NMM-IIA and
NMM-IIB are significantly different. NMM-IIA has a low
duty ratio characteristic similar to that of muscle myosin and
therefore is better structured for contraction over longer
distances (9,54). Indeed, the distribution of NMM-IIA is
indistinguishable from smooth muscle myosin II when both
were micro-injected into endothelial cells (14). In contrast,
NMM-IIB has a moderately high duty ratio (9,54). There-
fore, it might be mainly involved in maintaining cell tension
in a static manner (9). Those biochemical properties fit well
with our hypothesis that NMM-IIA, but not NMM-IIB, pulls
the inward flow of lamellar actin network during cell
spreading on 2-D. Moreover, both NMM-IIs have different
protein interaction partners (16–19). As further support, the
studies of NMM-IIA and NMM-IIB dynamics in spreading
MEF cells (Fig. 6) and migrating endothelial cells (14)
demonstrate that NMM-IIB clusters undergo slower rear-
ward movement than NMM-IIA clusters, which seems
consistent with NMM-IIB being more involved in static
maintenance of tension. There are at least two possible
scenarios where NMM-IIB may function on 2-D substrates.
In the first scenario, the perinuclear NMM-IIB, by generating
tension, may mechanically participate in directing the
orientation of nucleus or hold the nucleus in place during
cell spreading, e.g., the NMM-II activity that is involved in
reorientation of nucleus in migrating cells (62). The NMM-
IIB at the lamellar margin may mechanically coordinate the
lateral protrusion activities of cell edge (12), but with no
obvious effects on cell spread area. The NMM-IIB at the
lamellar margin also may be involved in the periodic
lamellipodial contractions as described in our previous study
(31). In light of the observation that MLCK travels to the
proximal boundary of lamellipodium from the leading edge
during periodic lamellipodial contractions as a component of
a signal complex (31), it is tempting to speculate that NMM-
IIB (and/or NMM-IIA) may be critical for the continuance of
periodic contraction cycles. In the second scenario, NMM-
IIB may exhibit cell motility state-dependent roles. At early
cell-spread times, NMM-IIB may primarily modulate vesicle
trafficking (63) and may be rarely involved in cell edge
protrusion or retraction in early spreading cells. However at
later times, NMM-IIB may significantly regulate cell motil-
ity, for instance, by stabilizing the polarity of MEF cells (12)
or contracting the actin cytoskeleton for tail detachment in
migrating cells (13). It seems unlikely that NMM-IIB
contributes to actin flow at later times because the rearward
F-actin flow in the tail of locomoting Dictyostelium is NMM-
II-independent (64) and the functional loss of NMM-IIB
does not change the rearward actin flow in MEF cells on a
2-D collagen substrate (22).
In cells that are spread on 2-D surfaces, NMM-IIA appears
to have an important role in developing a coherent cyto-
skeleton that generates force on the substrate. If we consider
the fact that traction force is greater with greater length of
substrate contact, then the increase in spread area with
depletion of NMM-IIA may partially compensate for the loss
of force. However, the increased spread area with NMM-IIA
depletion highlights its role in contracting the cell cytoskel-
eton. To contract the cytoskeleton, NMM-IIA forms filaments
at the periphery that then move inward and disassemble.
Such a dynamic cycle is necessary to enable the cell to
continue to generate force when actin filaments are assem-
bling in the periphery, moving inward and disassembling.
The sites of NMM-IIA and NMM-IIB filament assembly are
distinct and mainly lie in the lamellar regions behind the
lamellipodia. Thus, the peripheral actin can be drawn inward
by the periodic assembly of NMM-II filaments in lamellar
region. How mechanical force plays a role in modulating
NMM-IIA filament assembly and in signaling pathways (48)
is currently unclear. However, these observations indicate
that NMM-IIA has a very critical role in developing
contractile traction forces of cells at several different levels.
Note added in proof: During the revision of this manuscript, Betapudi et al.
published observations of the roles of nonmuscle myosin II isoforms in
MDA-MB-231 breast cancer cell spreading and migration (Betapudi, V., L.
S. Licate, and T. T. Egelhoff. Cancer Res. 2006. 66:4725-4733). They
found that depletion of NMM-IIA leads to an increase (37% larger than
controls) of cell spread area 60 min after plating, which is in agreement with
our finding reported in this study. However, their finding that depletion of
NMM-IIB decreases (27% smaller than controls) cell spreading does not
match our observation in MEFs. They suggested that NMM-II contributes
to generation of protrusive forces in these cells and that NMM-IIB
facilitates cell lamellar protrusion. We did not observe outward pushing of
micro-posts at cell edge by fibroblasts plated for 90 min or 60 min. The
discrepancy between their observations and ours about the effect of NMM-
IIB on cell area may be due to the different distributions of NMM-IIs in the
different cell types. Both NMM-IIA and NMM-IIB are preferentially
localized to the lamellar margin in MDA-MB-231 breast cancer cells,
which is different from those in spreading MEFs (Fig. 6 in this study).
We thank Benjamin J. Dubin-Thaler for the help in image processing,
Olivier Rossier and Nils Gauthier for the valuable comments for the
manuscript, and Harry Xenias and other people in the laboratory of Michael
P. Sheetz for their excellent assistance.
This work was supported by a National Institutes of Health grant to Michael
P. Sheetz (GM-36277). The authors have no conflict of interest.
REFERENCES
1. Sellers, J. R. 2000. Myosins: a diverse superfamily. Biochim. Biophys.Acta. 1496:3–22.
2. Rosenblatt, J., L. P. Cramer, B. Baum, and K. M. McGee. 2004.Myosin II-dependent cortical movement is required for centrosomeseparation and positioning during mitotic spindle assembly. Cell. 117:361–372.
3. Straight, A. F., A. Cheung, J. Limouze, I. Chen, N. J. Westwood, J. R.Sellers, and T. J. Mitchison. 2003. Dissecting temporal and spatialcontrol of cytokinesis with a myosin II Inhibitor. Science. 299:1743–1747.
4. Wakatsuki, T., R. B. Wysolmerski, and E. L. Elson. 2003. Mechanicsof cell spreading: role of myosin II. J. Cell Sci. 116:1617–1625.
5. van Leeuwen, F. N., S. van Delft, H. E. Kain, R. A. van der Kammen,and J. G. Collard. 1999. Rac regulates phosphorylation of the myosin-II heavy chain, actinomyosin disassembly and cell spreading. Nat. CellBiol. 1:242–248.
3918 Cai et al.
Biophysical Journal 91(10) 3907–3920

6. Arthur, W. T., L. A. Petch, and K. Burridge. 2000. Integrin engage-ment suppresses RhoA activity via a c-Src-dependent mechanism.Curr. Biol. 10:719–722.
7. Totsukawa, G., Y. Wu, Y. Sasaki, D. J. Hartshorne, Y. Yamakita,S. Yamashiro, and F. Matsumura. 2004. Distinct roles of MLCK andROCK in the regulation of membrane protrusions and focal adhesiondynamics during cell migration of fibroblasts. J. Cell Biol. 164:427–439.
8. Tullio, A. N., P. C. Bridgman, N. J. Tresser, C. C. Chan, M. A. Conti,R. S. Adelstein, and Y. Hara. 2001. Structural abnormalities develop inthe brain after ablation of the gene encoding nonmuscle myosin II-Bheavy chain. J. Comp. Neurol. 433:62–74.
9. Golomb, E., X. Ma, S. S. Jana, Y. A. Preston, S. Kawamoto, N. G.Shoham, E. Goldin, M. A. Conti, J. R. Sellers, and R. S. Adelstein.2004. Identification and characterization of nonmuscle myosin II–C, anew member of the myosin II family. J. Biol. Chem. 279:2800–2808.
10. Rochlin, M. W., K. Itoh, R. S. Adelstein, and P. C. Bridgman. 1995.Localization of myosin II A and B isoforms in cultured neurons. J. CellSci. 108:3661–3670.
11. Maupin, P., C. L. Phillips, R. S. Adelstein, and T. D. Pollard. 1994.Differential localization of myosin-II isozymes in human cultured cellsand blood cells. J. Cell Sci. 107:3077–3090.
12. Lo, C. M., D. B. Buxton, G. C. Chua, M. Dembo, R. S. Adelstein, andY. L. Wang. 2004. Nonmuscle myosin IIb is involved in the guidanceof fibroblast migration. Mol. Biol. Cell. 15:982–989.
13. Kolega, J. 2003. Asymmetric distribution of myosin IIB in migratingendothelial cells is regulated by a rho-dependent kinase and contributesto tail retraction. Mol. Biol. Cell. 14:4745–4757.
14. Kolega, J. 1998. Cytoplasmic dynamics of myosin IIA and IIB: spatial‘sorting’ of isoforms in locomoting cells. J. Cell Sci. 111:2085–2095.
15. Saitoh, T., S. Takemura, K. Ueda, H. Hosoya, M. Nagayama, H. Haga,K. Kawabata, A. Yamagishi, and M. Takahashi. 2001. Differential locali-zation of non-muscle myosin II isoforms and phosphorylated regula-tory light chains in human MRC-5 fibroblasts. FEBS Lett. 509:365–369.
16. Obungu, V. H., A. Lee Burns, S. K. Agarwal, S. C. Chandrasekharapa, R.S. Adelstein, and S. J. Marx. 2003. Menin, a tumor suppressor, associateswith nonmuscle myosin II-A heavy chain. Oncogene. 22:6347–6358.
17. Huang, H., M. Paliouras, I. Rambaldi, P. Lasko, and M. Featherstone.2003. Nonmuscle myosin promotes cytoplasmic localization of PBX.Mol. Cell. Biol. 23:3636–3645.
18. Krzewski, K., X. Chen, J. S. Orange, and J. L. Strominger. 2006.Formation of a WIP-, WASp-, actin-, and myosin IIA-containingmultiprotein complex in activated NK cells and its alteration by KIRinhibitory signaling. J. Cell Biol. 173:121–132.
19. Clark, K., M. Langeslag, B. van Leeuwen, L. Ran, A. G. Ryazanov, C.G. Figdor, W. H. Moolenaar, K. Jalink, and F. N. van Leeuwen. 2006.TRPM7, a novel regulator of actomyosin contractility and cell adhe-sion. EMBO J. 25:290–301.
20. Brown, M. E., and P. C. Bridgman. 2003. Retrograde flow rate isincreased in growth cones from myosin IIB knockout mice. J. Cell Sci.116:1087–1094.
21. Bridgman, P. C., S. Dave, C. F. Asnes, A. N. Tullio, and R. S.Adelstein. 2001. Myosin IIB is required for growth cone motility.J. Neurosci. 21:6159–6169.
22. Meshel, A. S., Q. Wei, R. S. Adelstein, and M. P. Sheetz. 2005. Basicmechanism of three-dimensional collagen fibre transport by fibroblasts.Nat. Cell Biol. 7:157–164.
23. Wylie, S. R., P. J. Wu, H. Patel, and P. D. Chantler. 1998. Aconventional myosin motor drives neurite outgrowth. Proc. Natl. Acad.Sci. USA. 95:12967–12972.
24. Lin, C. H., and P. Forscher. 1995. Growth cone advance is inverselyproportional to retrograde F-actin flow. Neuron. 14:763–771.
25. Lin, C. H., E. M. Espreafico, M. S. Mooseker, and P. Forscher. 1996.Myosin drives retrograde F-actin flow in neuronal growth cones.Neuron. 16:769–782.
26. Diefenbach, T. J., V. M. Latham, D. Yimlamai, C. A. Liu, I. M.Herman, and D. G. Jay. 2002. Myosin 1c and myosin IIB serve
opposing roles in lamellipodial dynamics of the neuronal growth cone.J. Cell Biol. 158:1207–1217.
27. Wylie, S. R., and P. D. Chantler. 2003. Myosin IIA drives neuriteretraction. Mol. Biol. Cell. 14:4654–4666.
28. Wylie, S. R., and P. D. Chantler. 2001. Separate but linked functions ofconventional myosins modulate adhesion and neurite outgrowth. Nat.Cell Biol. 3:88–92.
29. Wei, Q., and R. S. Adelstein. 2000. Conditional expression of atruncated fragment of nonmuscle myosin II-A alters cell shape but notcytokinesis in HeLa cells. Mol. Biol. Cell. 11:3617–3627.
30. Conti, M. A., S. Even-Ram, C. Liu, K. M. Yamada, and R. S.Adelstein. 2004. Defects in cell adhesion and the visceral endodermfollowing ablation of nonmuscle myosin heavy chain II-A in mice.J. Biol. Chem. 279:41263–41266.
31. Giannone, G., B. J. Dubin-Thaler, H. G. Dobereiner, N. Kieffer, A. R.Bresnick, and M. P. Sheetz. 2004. Periodic lamellipodial contractionscorrelate with rearward actin waves. Cell. 116:431–443.
32. Dubin-Thaler, B. J., G. Giannone, H. G. Dobereiner, and M. P. Sheetz.2004. Nanometer analysis of cell spreading on matrix-coated surfacesreveals two distinct cell states and STEPs. Biophys. J. 86:1794–1806.
33. du Roure, O., A. Saez, A. Buguin, R. H. Austin, P. Chavrier, P.Silberzan, and B. Ladoux. 2005. Force mapping in epithelial cellmigration. Proc. Natl. Acad. Sci. USA. 102:2390–2395.
34. Dobereiner, H.-G., B. Dubin-Thaler, J. Hofman, H. Xenias, T. Sims,G. Giannone, M. L. Dustin, C. Wiggins, and M. P. Sheetz. 2006.Lateral membrane waves constitute a universal dynamic pattern ofmotile cells. Phys. Rev. Lett. 97:038102.
35. Hastie, T., R. J. Tibshirani, and J. H. Friedman. 2001. The Elements ofStatistical Learning Theory. Springer, New York, NY.
36. Kittler, J., and J. Illingworth. 1986. Minimum error thresholding.Pattern Recognit. 19:41–47.
37. Poggio, T., V. Torre, and C. Koch. 1985. Computational vision andregularization theory. Nature. 317:314–319.
38. von Wichert, G., G. Jiang, A. Kostic, K. De Vos, J. Sap, and M. P.Sheetz. 2003. RPTP-alpha acts as a transducer of mechanical force onalphav/beta3-integrin-cytoskeleton linkages. J. Cell Biol. 161:143–153.
39. Burton, K., J. H. Park, and D. L. Taylor. 1999. Keratocytes generatetraction forces in two phases. Mol. Biol. Cell. 10:3745–3769.
40. Tan, J. L., J. Tien, D. M. Pirone, D. S. Gray, K. Bhadriraju, and C. S.Chen. 2003. Cells lying on a bed of microneedles: an approach toisolate mechanical force. Proc. Natl. Acad. Sci. USA. 100:1484–1489.
41. Chrzanowska-Wodnicka, M., and K. Burridge. 1996. Rho-stimulatedcontractility drives the formation of stress fibers and focal adhesions.J. Cell Biol. 133:1403–1415.
42. Helfman, D. M., E. T. Levy, C. Berthier, M. Shtutman, D. Riveline,I. Grosheva, A. Lachish-Zalait, M. Elbaum, and A. D. Bershadsky.1999. Caldesmon inhibits nonmuscle cell contractility and interfereswith the formation of focal adhesions. Mol. Biol. Cell. 10:3097–3112.
43. Rottner, K., A. Hall, and J. V. Small. 1999. Interplay between Rac andRho in the control of substrate contact dynamics. Curr. Biol. 9:640–648.
44. Pelham, R. J., Jr., and Y. Wang. 1997. Cell locomotion and focaladhesions are regulated by substrate flexibility. Proc. Natl. Acad. Sci.USA. 94:13661–13665.
45. Delanoe-Ayari, H., R. Al Kurdi, M. Vallade, D. Gulino-Debrac, andD. Riveline. 2004. Membrane and acto-myosin tension promote cluster-ing of adhesion proteins. Proc. Natl. Acad. Sci. USA. 101:2229–2234.
46. Balaban, N. Q., U. S. Schwarz, D. Riveline, P. Goichberg, G. Tzur,I. Sabanay, D. Mahalu, S. Safran, A. Bershadsky, L. Addadi, and B. Geiger.2001. Force and focal adhesion assembly: a close relationship studied usingelastic micropatterned substrates. Nat. Cell Biol. 3:466–472.
47. Zaidel-Bar, R., C. Ballestrem, Z. Kam, and B. Geiger. 2003. Earlymolecular events in the assembly of matrix adhesions at the leadingedge of migrating cells. J. Cell Sci. 116:4605–4613.
48. Riveline, D., E. Zamir, N. Q. Balaban, U. S. Schwarz, T. Ishizaki,S. Narumiya, Z. Kam, B. Geiger, and A. D. Bershadsky. 2001. Focal
Myosin IIA Regulates Cell Motility 3919
Biophysical Journal 91(10) 3907–3920
contacts as mechanosensors: externally applied local mechanical forceinduces growth of focal contacts by an mDia1-dependent and ROCK-independent mechanism. J. Cell Biol. 153:1175–1186.
49. Sawada, Y., and M. P. Sheetz. 2002. Force transduction by Tritoncytoskeletons. J. Cell Biol. 156:609–615.
50. Jurado, C., J. R. Haserick, and J. Lee. 2005. Slipping or gripping?Fluorescent speckle microscopy in fish keratocytes reveals twodifferent mechanisms for generating a retrograde flow of actin. Mol.Biol. Cell. 16:507–518.
51. Henson, J. H., T. M. Svitkina, A. R. Burns, H. E. Hughes, K. J.MacPartland, R. Nazarian, and G. G. Borisy. 1999. Two componentsof actin-based retrograde flow in sea urchin coelomocytes. Mol. Biol.Cell. 10:4075–4090.
52. Ponti, A., M. Machacek, S. L. Gupton, C. M. Waterman-Storer, andG. Danuser. 2004. Two distinct actin networks drive the protrusion ofmigrating cells. Science. 305:1782–1786.
53. Kelley, C. A., J. R. Sellers, D. L. Gard, D. Bui, R. S. Adelstein, andI. C. Baines. 1996. Xenopus nonmuscle myosin heavy chain isoformshave different subcellular localizations and enzymatic activities. J. CellBiol. 134:675–687.
54. Kovacs, M., F. Wang, A. Hu, Y. Zhang, and J. R. Sellers. 2003.Functional divergence of human cytoplasmic myosin II: kineticcharacterization of the non-muscle IIA isoform. J. Biol. Chem. 278:38132–38140.
55. Uchida, K. S., T. Kitanishi-Yumura, and S. Yumura. 2003. Myosin IIcontributes to the posterior contraction and the anterior extensionduring the retraction phase in migrating Dictyostelium cells. J. Cell Sci.116:51–60.
56. Wessels, D., D. R. Soll, D. Knecht, W. F. Loomis, A. De Lozanne, andJ. Spudich. 1988. Cell motility and chemotaxis in Dictyosteliumamebae lacking myosin heavy chain. Dev. Biol. 128:164–177.
57. Suter, D. M., and P. Forscher. 2000. Substrate-cytoskeletal coupling asa mechanism for the regulation of growth cone motility and guidance.J. Neurobiol. 44:97–113.
58. Suter, D. M., L. D. Errante, V. Belotserkovsky, and P. Forscher. 1998.The Ig superfamily cell adhesion molecule, apCAM, mediates growthcone steering by substrate-cytoskeletal coupling. J. Cell Biol. 141:227–240.
59. Dobereiner, H. G., B. J. Dubin-Thaler, G. Giannone, and M. P. Sheetz.2005. Force sensing and generation in cell phases: analyses of complexfunctions. J. Appl. Physiol. 98:1542–1546.
60. Medeiros, N. A., D. T. Burnette, and P. Forscher. 2006. Myosin IIfunctions in actin-bundle turnover in neuronal growth cones. Nat. CellBiol. 8:215–226.
61. Turney, S. G., and P. C. Bridgman. 2005. Laminin stimulates andguides axonal outgrowth via growth cone myosin II activity. Nat.Neurosci. 8:717–719.
62. Gomes, E. R., S. Jani, and G. G. Gundersen. 2005. Nuclear movementregulated by Cdc42, MRCK, myosin, and actin flow establishes MTOCpolarization in migrating cells. Cell. 121:451–463.
63. Togo, T., and R. A. Steinhardt. 2004. Nonmuscle myosin IIA and IIBhave distinct functions in the exocytosis-dependent process of cellmembrane repair. Mol. Biol. Cell. 15:688–695.
64. Fukui, Y., T. Kitanishi-Yumura, and S. Yumura. 1999. Myosin II-independent F-actin flow contributes to cell locomotion in dictyoste-lium. J. Cell Sci. 112:877–886.
3920 Cai et al.
Biophysical Journal 91(10) 3907–3920
Related Documents