University of Wollongong Research Online Faculty of Engineering and Information Sciences - Papers: Part A Faculty of Engineering and Information Sciences 2015 Nonlinear response of laterally loaded rigid piles in sliding soil Wei Dong Guo University of Wollongong, [email protected] Research Online is the open access institutional repository for the University of Wollongong. For further information contact the UOW Library: [email protected] Publication Details Guo, W. (2015). Nonlinear response of laterally loaded rigid piles in sliding soil. Canadian Geotechnical Journal, 52 (7), 903-925.

Welcome message from author
This document is posted to help you gain knowledge. Please leave a comment to let me know what you think about it! Share it to your friends and learn new things together.
Transcript
University of WollongongResearch Online
Faculty of Engineering and Information Sciences -Papers: Part A Faculty of Engineering and Information Sciences
2015
Nonlinear response of laterally loaded rigid piles insliding soilWei Dong GuoUniversity of Wollongong, [email protected]
Research Online is the open access institutional repository for the University of Wollongong. For further information contact the UOW Library:[email protected]
Publication DetailsGuo, W. (2015). Nonlinear response of laterally loaded rigid piles in sliding soil. Canadian Geotechnical Journal, 52 (7), 903-925.
Nonlinear response of laterally loaded rigid piles in sliding soil
AbstractThis paper proposes a new, integrated two-layer model to capture nonlinear response of rotationally restrainedlaterally loaded rigid piles subjected to soil movement (sliding soil, or lateral spreading). First, typical pileresponse from model tests (using an inverse triangular loading profile) is presented, which includes profiles ofultimate on-pile force per unit length at typical sliding depths, and the evolution of pile deflection, rotation,and bending moment with soil movement. Second, a new model and closed-form expressions are developedfor rotationally restrained passive piles in two-layer soil, subjected to various movement profiles. Third, thesolutions are used to examine the impact of the rotational restraint on nonlinear response of bending moment,shear force, on-pile force per unit length, and pile deflection. Finally, they are compared with measuredresponse of model piles in sliding soil, or subjected to lateral spreading, and that of an in situ test pile inmoving soil. The study indicates the following: (i) nonlinear response of rigid passive piles is owing to elasticpile-soil interaction with a progressive increase in sliding depth, whether in sliding soil or subjected to lateralspreading; (ii) theoretical solutions for a uniform movement can be used to model other soil movementprofiles upon using a modification factor in the movement and its depth; and (iii) a triangular and a uniformpressure profile on piles are theoretically deduced along lightly head-restrained, floating-base piles, andrestrained-base piles, respectively, once subjected to lateral spreading. Nonlinear response of an in situ test pilein sliding soil and a model pile subjected to lateral spreading is elaborated to highlight the use and theadvantages of the proposed solutions, along with the ranges of four design parameters deduced from 10 testpiles.
DisciplinesEngineering | Science and Technology Studies
Publication DetailsGuo, W. (2015). Nonlinear response of laterally loaded rigid piles in sliding soil. Canadian GeotechnicalJournal, 52 (7), 903-925.
This journal article is available at Research Online: http://ro.uow.edu.au/eispapers/4486
Nonlinear response of laterally loaded rigid piles in sliding soil Wei Dong Guo (2014)
i
Date revised: 12 November, 2013, 8 May, 2014, 22 August, 2014 1
2
Title: Nonlinear response of laterally loaded rigid piles in sliding soil 3
Wei Dong Guo 4
5
Affiliation and address: 6
Associate Professor Wei Dong Guo 7
School of Civil, Mining & Environmental Engineering 8
University of Wollongong, NSW 2522, Australia 9
Email: [email protected]; [email protected] 10
Tel: (61-2) 4221 3036 11 12 Number of tables: 4 13
Number of figures: 18 14
15
Key words: piles, closed-form solutions, soil movement, soil-structure interaction 16
17
Page 1 of 48
Nonlinear response of laterally loaded rigid piles in sliding soil Wei Dong Guo (2014)
ii
Nonlinear response of laterally loaded rigid piles in sliding soil 18
19
Wei Dong Guo 20
School of Civil, Mining and Environmental Engineering, The University of Wollongong, Australia 21 Tel: (61-2) 42213036 Email: [email protected]; [email protected] 22
23
ABSTRACT 24
This paper proposes a new, integrated 2-layer model to capture nonlinear response of rotationally 25
restrained laterally loaded rigid piles subjected to soil movement (sliding soil, or lateral spreading). 26
First, typical pile response from model tests (using an inverse triangular loading profile) is 27
presented, which includes profiles of ultimate on-pile force per unit length at typical sliding depths, 28
and the evolution of pile deflection, rotation, and bending moment with soil movement. Second, a 29
new model and closed-form expressions are developed for rotationally restrained passive piles in 2-30
layer soil, subjected to various movement profiles. Third, the solutions are used to examine the 31
impact of the rotational restraint on nonlinear response of bending moment, shear force, on-pile 32
force per unit length, and pile deflection. And finally, they are compared with measured response of 33
model piles in sliding soil, or subjected to lateral spreading, and that of an in-situ test pile in moving 34
soil. 35
The study indicates that (1) nonlinear response of rigid passive piles is owing to elastic pile-36
soil interaction with a progressive increase in sliding depth, whether in sliding soil or subjected to 37
lateral spreading. (2) Theoretical solutions for a uniform movement can be used to model other soil 38
movement profiles upon using a modification factor in the movement and its depth. And (3) A 39
triangular and a uniform pressure profile on piles are theoretically deduced along lightly head-40
restrained, floating-base piles, and restrained-base piles, respectively, once subjected to lateral 41
spreading. Nonlinear response of an in-situ test pile in sliding soil and a model pile subjected to 42
lateral spreading is elaborated to highlight the use and the advantages of the proposed solutions, 43
along with the ranges of four design parameters deduced from ten test piles. 44
45
Key words: passive piles, analytical solutions, non-linear response, soil-structure interaction 46
47
Page 2 of 48
Nonlinear response of laterally loaded rigid piles in sliding soil Wei Dong Guo (2014)
1
Nonlinear response of laterally loaded rigid piles in sliding soil 48
Wei Dong Guo 49
School of Civil, Mining and Environmental Engineering, The University of Wollongong, Australia 50 Tel: (61-2) 42213036 Email: [email protected]; [email protected]
1. INTRODUCTION 52
Passive piles are known as these piles that are subjected to soil movement and are commonly used 53
for stabilizing a sliding slope, supporting bridge abutments, and providing a lateral pressure barrier 54
adjacent to a pile driving or an excavation operation. Design of these passive piles may alter with 55
pile-slide relative position, and pile-soil relative stiffness (Guo 2003; Guo 2008). More importantly, 56
vertically loaded piles need to be checked against passive loading, induced by lateral spreading in 57
earthquake zone. 58
Elastic solutions were proposed to simulate slope stabilising piles subjected to a uniform soil 59
movement (Fukuoka 1977), and to model piles under an inverse triangular profile of moving soil 60
(Cai and Ugai 2003). The later solutions compare well with measured response of six in-situ piles, 61
albeit using measured sliding thrust and gradient of soil movement with depth for each pile. All the 62
predictions are unfortunately not related to magnitude of the soil movement (Ito and Matsui 1975; 63
De Beer and Carpentier 1977; Viggiani 1981; Chmoulian 2004). Guo (2003) proposed to gain a 64
fictitious load on a passive pile for each magnitude of soil movement (ws). The load is subsequently 65
employed to predict response of the passive pile using the elastic-plastic solutions for a laterally 66
loaded pile underpinned by the limiting force per unit length (pu), and modulus of subgrade reaction 67
(ks). The closed-form solutions well capture non-linear response of two infinitely long, passive 68
piles, and six upper rigid (in sliding layer) and low flexible (in stable layer) piles (Guo 2012) 69
against measured data using a progressively increasing ‘slip’ (equivalent to loading) depth. 70
Nevertheless, they are not applicable to piles rigid in both sliding and stable layers, for which new 71
solutions are required to avoid overestimating bending moment in passive piles (Chen and Poulos 72
1997) by considering nonlinear response. 73
Numerical analyses have been extensively conducted (Stewart et al. 1994; Poulos 1995; 74
Chow 1996; Bransby and Springman 1997), which demonstrate the dominant impact of the pu 75
profile and pile-soil relative stiffness on the pile response (Guo 2012). Several p-y curves (p = force 76
per unit length, y = local pile displacement) for liquefied soil are suggested, such as those using an 77
average p-multiplier (Brandenberg et al. 2005), an average residual strength (Seed and Harder 1990; 78
Wang and Reese 1998; Olson and Stark 2002; Idriss and Boulanger 2007), and a dilation-based 79
liquefaction model (Rollins et al. 2005). These p-y curves, while useful for some pertinent 80
circumstances (Franke and Rollins 2013), offer values of on-pile force per unit length (thus pu) 81
Page 3 of 48
Nonlinear response of laterally loaded rigid piles in sliding soil Wei Dong Guo (2014)
2
different by up to an order of magnitude. Naturally, the existing methods such as the p-y curve 82
based analysis (Chen et al. 2002; Smethurst and Powrie 2007; Frank and Pouget 2008) are not 83
sufficiently accurate. The pu and the modulus k can be effectively and uniquely deduced using 84
measured nonlinear response and elastic-plastic solutions, as has been done recently for about 70 85
laterally loaded piles (Guo 2006; Guo 2008). 86
An extensive experimental and numerical analysis has been conducted over the past decades 87
on response of piles subjected to lateral spreading (Jakrapiyanun 2002; Boulanger et al. 2003; 88
Kagawa et al. 2004; Cubrinovskia et al. 2006; Juirnarongrit and Ashford 2006). The response is 89
generally characterised by rigid pile-liquefied sand interaction, as the liquefied sand is of very low 90
stiffness and strength. The impact of soil movement on the pile is largely captured using a stipulated 91
uniform, or a linearly distributed limiting pressure, from which simple solutions were developed 92
using equilibrium of force and bending moment of the pile (Dobry et al. 2003; He et al. 2009). The 93
solutions for rigid passive piles (Fukuoka 1977; Viggiani 1981; Cai and Ugai 2003; Dobry et al. 94
2003; Brandenberg et al. 2005) may work well for certain cases, but they generally break down 95
theoretically without compatible displacement between piles and the moving soil. For instance, 96
some measured data indicate a linear variation of bending moment along piles, which generally do 97
not support a uniform or a triangular distributed p profiles as stipulated (Dobry et al. 2003; He et al. 98
2009), neither support ~10 times different average p over typical piles observed in previous study. 99
Guo (2014) recently developed a concentrated load (P-) based model, a power-law pressure 100
(p-based) model and 2-layer model to capture the impact of soil movement on rigid piles using the 101
load P or the distributed pressure p. New closed-form solutions were developed for each model, in 102
light of equilibrium of force and moment, and displacement compatibility (rigorous) for the pile-soil 103
system. In particular, the solutions for the 2-layer model yield a limiting pressure on the passive pile 104
about one-third that on active piles, which is in accord with measured data. Nevertheless, the model 105
application domain is confined to a uniform soil movement, free rotational constraint along pile 106
(e.g. head-rotational stiffness kA = 0, base-rotational stiffness kB = 0), and no head constrained 107
force H (= 0), nor bending moment Mo (= 0). Experimental data (Dobry et al. 2003; He et al. 2009) 108
indicate the on-pile p (thus pile response) varies with distance, stiffness and profile of soil 109
movement. A non-liquefied layer may cause dragging on a lateral spreading layer, which may be 110
encapsulated as a rotational stiffness (thus moment MA), a concentrated thrust H at the top of 111
underlying layer, and a moment Mo due to loading eccentricity of H (Dobry et al. 2003; 112
Brandenberg et al. 2005). To predict the pile response, new solutions are required. 113
This paper presents new displacement-compatible solutions to capture nonlinear response of 114
laterally loaded rigid piles subjected to moving soil. First, the response (on-pile force per unit 115
Page 4 of 48
Nonlinear response of laterally loaded rigid piles in sliding soil Wei Dong Guo (2014)
3
length, deflection, shear force, and bending moment) of five model piles is highlighted, subjected to 116
an inverse ‘triangular’ profile of soil movement to sliding depths of (0.18~0.5)l (l = pile 117
embedment). Second, an advanced 2-layer model for laterally loaded rigid piles in sliding soil is 118
proposed, including the constraints on the top-layer (kA ≠ 0, H ≠ 0, and Mo ≠ 0, with a subgrade 119
modulus ks), and the base-layer (kB ≠ 0, with mks), respectively. New closed-form expressions are 120
developed for the model, which are illustrated in non-dimensional charts. Third, the solutions are 121
employed to capture nonlinear evolution of bending moment, shear force, on-pile force per unit 122
length, and pile deflection by using a gradually increased sliding depth and on-pile pressure. They 123
are elaborated, respectively, for one pile in sliding soil and another one subjected to lateral 124
spreading. Finally, the solutions are used to predict response of four model piles and one in-situ test 125
pile in sliding soil, and that of six model piles subjected to lateral spreading. Input parameters of the 126
model are deduced against the measured data to facilitate the use of the new solutions. 127
2. MODEL TESTS ON PASSIVE PILES 128
Guo and Ghee (2006) devised a square shear apparatus with 1×1 m2 in plan and 0.8 m in 129
height to simulate response of passive piles (see Fig. 1a). Horizontal force was applied laterally (via 130
the lateral jack) on a loading block to translate the aluminum frames of the upper portion of the 131
shear box (thus the adjacent sand). The loading block was made to a uniform (U), an inverse 132
triangular (T) (as shown in Fig. 1a) and an arc (A) shape. It generates a U, T or A profile of soil 133
movement (thus referred to as U, T or A profiles) at the loading location, respectively, but an 134
unknown sand movement across the shear box and around the test pile. The model piles tested, 135
referred to as d32 or d50 piles, were all made of aluminum tube with 1,200 mm in length. The d32 136
piles are featured by d (diameter) = 32 mm, t (wall thickness) = 1.5 mm, and EpIp (calculated 137
bending stiffness) = 1.28×10⁶ kNmm
2; whereas the d50 piles have d = 50 mm, t = 2.0 mm, and EpIp 138
= 5.89×10⁶ kNmm
2. The d50 and d32 piles were tested to model rigid and flexible piles, respectively 139
in a sand that has a unit weight of 16.27 kN/m3, and an angle of internal friction of 38
o. During the 140
shearing, the sand surface was free of loading, the pile was thus only subjected to lateral pressure 141
caused by the moving sand, apart from the overburden pressure (typically, ~ 11.4 kPa at pile-tip 142
level, and with an average of 3.25~6.5 kPa) due to self-weight. Advancing the lateral T block 143
horizontally (see Fig. 1a), for instance, the frames (thus the sand) was displaced downwards (to a 144
maximum depth lm) with each 10 mm horizontal movement (measured on the top frame), until a 145
total lateral (frame) movement wf (see Fig. 1a) of 110 ~150 mm was achieved. The model sand 146
samples are predominantly sheared under an overburden stress of 3.25~6.5 kPa (at lm = 200~400 147
Page 5 of 48
Nonlinear response of laterally loaded rigid piles in sliding soil Wei Dong Guo (2014)
4
mm). The lateral shear force (measured in the loading jack) increased by about 10% for each 148
additional test pile (Guo and Qin 2010). 149
Five tests of T32-0 on the d32 piles (without vertical load on pile-head) using T block are 150
reviewed herein. They were conducted to a final sliding depth lm of 125, 200, 250, 300, and 350 151
mm, respectively for a pile embedment l of 700 mm (Guo and Qin 2010). Each test provides 152
readings of ten pairs of strain gauges (along the pile length), two LVDTs (for displacements at pile-153
head level, and pile rotation), and the force on the lateral jack under each frame movement. They 154
were input into a spreadsheet program (via Microsoft Excel VBA) to obtain the profiles of (1) 155
bending moment; (2) inclination and deflection, respectively (from 1st
and 2nd
order numerical 156
integration of the bending moment, respectively); and (3) shear force, and soil reaction (by using 157
single and double numerical differentiation of the bending moment, respectively) (Guo and Qin 158
2006). Typical response is presented here, including (i) The profile of the net force per unit length 159
p on the pile to a final sliding depth lm shown in Fig. 2a; (ii) The evolution of pile deflection wg (≈ 160
0.72wf-42 mm) at ground-line with the total soil movement wf in Fig. 2b; (iii) The normalised 161
rotation angle ωrksl/p (ωr = rotation angle, ks = modulus of subgrade reaction) versus pile-head 162
displacement wgks/p in Fig. 2c; and (iv) The maximum bending moment Mm for each displacement 163
wg in Fig. 2d. Similar response of d50 pile is noted, which is presented here in Fig. 2c only. 164
These tests reveal (i) a progressive increase in the on-pile force per unit length p with the 165
sliding depth lm, which is described by p = pllm/l with pl being the maximum p at pile-tip level (see 166
Fig. 2a); (ii) the pile-deflection wg (at ground-line) being a fraction of the shear frame (soil) 167
movement wf (see Fig. 2b); (iii) a linear correlation (thus elastic pile-soil interaction) between wg 168
and ωr for typical sliding depths of lm (see Fig. 2c); (iv) A highly nonlinear dependence between the 169
pile deflection wg and the maximum bending moment Mm (see Fig. 2d). A gradually increased lm 170
and the on-pile p (with depth) in Fig. 2a with soil movement thus render the nonlinear relationship 171
between wg and Mm in Fig. 2d. It is worthy to stress that the on-pile p for a sliding depth of 350 mm 172
(with lm/l = 0.5) in Fig. 2a should be the largest (see later discussion) for a uniform soil movement. 173
The peak p at a reduced 0.3 m indicates the impact of soil movement profile (e.g. via a factor α) 174
around the test piles. 175
3. ADVANCED 2-LAYER MODEL AND SOLUTIONS 176
A pile is classified as rigid, once the pile-soil relative stiffness, Ep/ sG~
exceeds 0.052(l/ro)4, as with a 177
laterally loaded free-head pile (Guo 2006; Guo 2008). Note that Ep = Young’s modulus of an 178
equivalent solid pile; ro = an outside radius of a cylindrical pile; and sG~
= average shear modulus 179
Page 6 of 48
Nonlinear response of laterally loaded rigid piles in sliding soil Wei Dong Guo (2014)
5
over the embedment l. 180
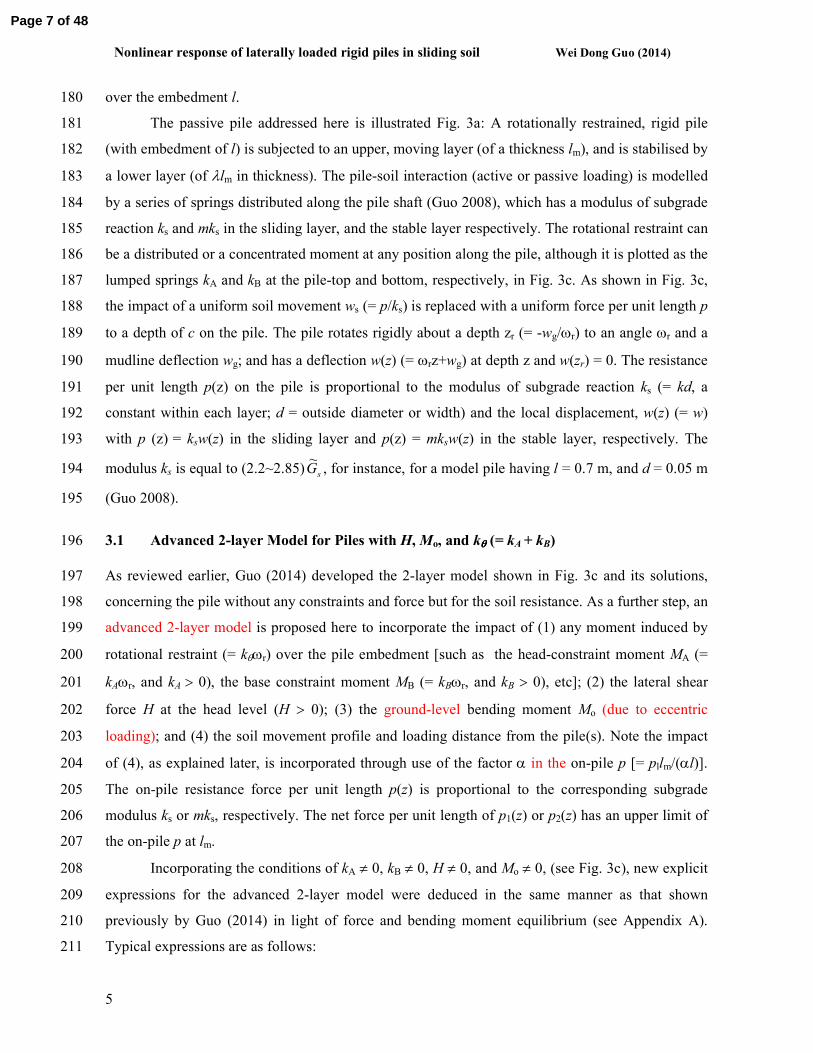
The passive pile addressed here is illustrated Fig. 3a: A rotationally restrained, rigid pile 181
(with embedment of l) is subjected to an upper, moving layer (of a thickness lm), and is stabilised by 182
a lower layer (of λlm in thickness). The pile-soil interaction (active or passive loading) is modelled 183
by a series of springs distributed along the pile shaft (Guo 2008), which has a modulus of subgrade 184
reaction ks and mks in the sliding layer, and the stable layer respectively. The rotational restraint can 185
be a distributed or a concentrated moment at any position along the pile, although it is plotted as the 186
lumped springs kA and kB at the pile-top and bottom, respectively, in Fig. 3c. As shown in Fig. 3c, 187
the impact of a uniform soil movement ws (= p/ks) is replaced with a uniform force per unit length p 188
to a depth of c on the pile. The pile rotates rigidly about a depth zr (= -wg/ωr) to an angle ωr and a 189
mudline deflection wg; and has a deflection w(z) (= ωrz+wg) at depth z and w(zr) = 0. The resistance 190
per unit length p(z) on the pile is proportional to the modulus of subgrade reaction ks (= kd, a 191
constant within each layer; d = outside diameter or width) and the local displacement, w(z) (= w) 192
with p (z) = ksw(z) in the sliding layer and p(z) = mksw(z) in the stable layer, respectively. The 193
modulus ks is equal to (2.2~2.85) sG~
, for instance, for a model pile having l = 0.7 m, and d = 0.05 m 194
(Guo 2008). 195
3.1 Advanced 2-layer Model for Piles with H, Mo, and kθθθθ (= kA + kB) 196
As reviewed earlier, Guo (2014) developed the 2-layer model shown in Fig. 3c and its solutions, 197
concerning the pile without any constraints and force but for the soil resistance. As a further step, an 198
advanced 2-layer model is proposed here to incorporate the impact of (1) any moment induced by 199
rotational restraint (= kθωr) over the pile embedment [such as the head-constraint moment MA (= 200
kAωr, and kA > 0), the base constraint moment MB (= kBωr, and kB > 0), etc]; (2) the lateral shear 201
force H at the head level (H > 0); (3) the ground-level bending moment Mo (due to eccentric 202
loading); and (4) the soil movement profile and loading distance from the pile(s). Note the impact 203
of (4), as explained later, is incorporated through use of the factor α in the on-pile p [= pllm/(αl)]. 204
The on-pile resistance force per unit length p(z) is proportional to the corresponding subgrade 205
modulus ks or mks, respectively. The net force per unit length of p1(z) or p2(z) has an upper limit of 206
the on-pile p at lm. 207
Incorporating the conditions of kA ≠ 0, kB ≠ 0, H ≠ 0, and Mo ≠ 0, (see Fig. 3c), new explicit 208
expressions for the advanced 2-layer model were deduced in the same manner as that shown 209
previously by Guo (2014) in light of force and bending moment equilibrium (see Appendix A). 210
Typical expressions are as follows: 211
Page 7 of 48
Nonlinear response of laterally loaded rigid piles in sliding soil Wei Dong Guo (2014)
6
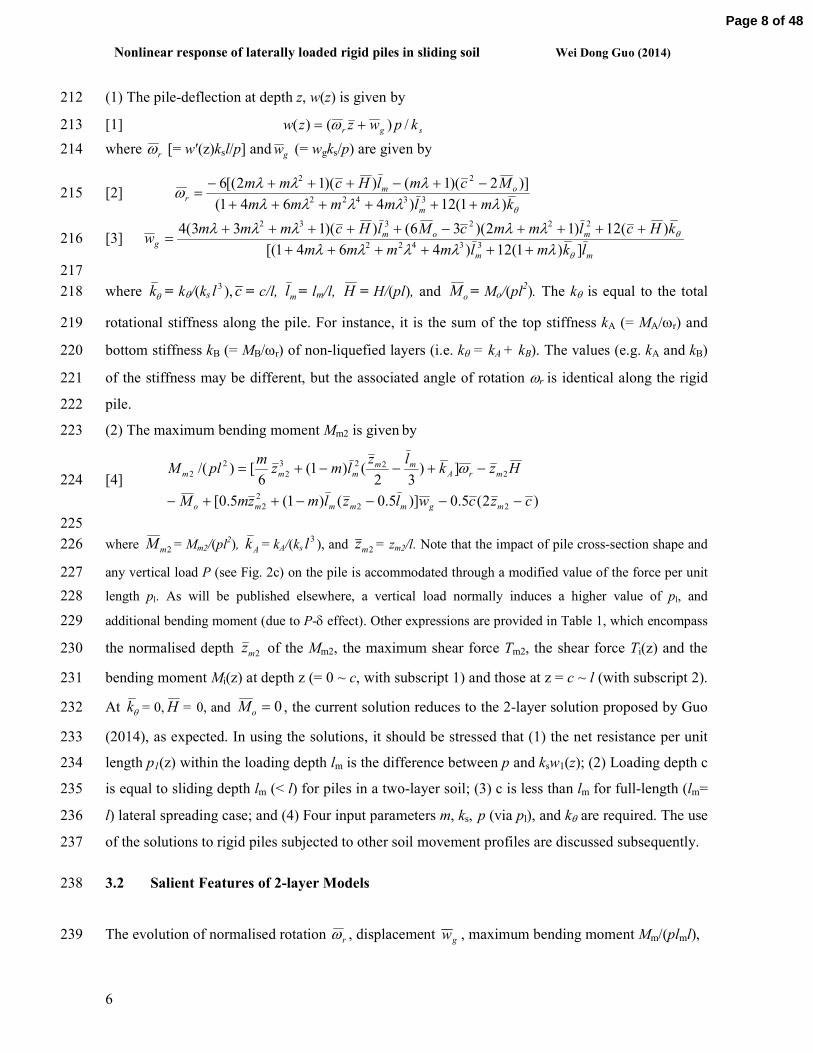
(1) The pile-deflection at depth z, w(z) is given by 212
[1] sgr kpwzzw /)()( += ω 213
where rω [= w′(z)ksl/p] and gw (= wgks/p) are given by 214
[2] θλλλλλ
λλλω
kmlmmmm
McmlHcmm
m
omr
)1(12)4641(
)]2)(1())(12[(633422
22
++++++−+−+++−
= 215
[3] mm
momg
lkmlmmmm
kHclmmcMlHcmmmw
])1(12)4641[(
)(12)12)(36())(133(433422
222332
θ
θ
λλλλλλλλλλ
++++++++++−+++++
= 216
217
where θk = kθ/(ks3l ), c = c/l, ml = lm/l, H = H/(pl), and oM = Mo/(pl
2). The kθ is equal to the total 218
rotational stiffness along the pile. For instance, it is the sum of the top stiffness kA (= MA/ωr) and 219
bottom stiffness kB (= MB/ωr) of non-liquefied layers (i.e. kθ = kA + kB). The values (e.g. kA and kB) 220
of the stiffness may be different, but the associated angle of rotation ωr is identical along the rigid 221
pile. 222
(2) The maximum bending moment Mm2 is given by 223
[4]
)2(5.0)]5.0()1(5.0[
])32
()1(6
[)/(
22
2
2
2223
2
2
2
czcwlzlmzmM
Hzklz
lmzm
plM
mgmmmmo
mrAmm
mmm
−−−−++−
−+−−+= ω 224
225
where 2mM = Mm2/(pl2), Ak = kA/(ks3l ), and 2mz = zm2/l. Note that the impact of pile cross-section shape and 226
any vertical load P (see Fig. 2c) on the pile is accommodated through a modified value of the force per unit 227
length pl. As will be published elsewhere, a vertical load normally induces a higher value of pl, and 228
additional bending moment (due to P-δ effect). Other expressions are provided in Table 1, which encompass 229
the normalised depth 2mz of the Mm2, the maximum shear force Tm2, the shear force Ti(z) and the 230
bending moment Mi(z) at depth z (= 0 ~ c, with subscript 1) and those at z = c ~ l (with subscript 2). 231
At θk = 0, H = 0, and 0=oM , the current solution reduces to the 2-layer solution proposed by Guo 232
(2014), as expected. In using the solutions, it should be stressed that (1) the net resistance per unit 233
length p1(z) within the loading depth lm is the difference between p and ksw1(z); (2) Loading depth c 234
is equal to sliding depth lm (< l) for piles in a two-layer soil; (3) c is less than lm for full-length (lm= 235
l) lateral spreading case; and (4) Four input parameters m, ks, p (via pl), and kθ are required. The use 236
of the solutions to rigid piles subjected to other soil movement profiles are discussed subsequently. 237
3.2 Salient Features of 2-layer Models 238
The evolution of normalised rotation rω , displacement gw , maximum bending moment Mm/(plml), 239
Page 8 of 48
Nonlinear response of laterally loaded rigid piles in sliding soil Wei Dong Guo (2014)
7
and maximum shear force Tm/(plm) with the normalised sliding depth ml was obtained using 2-layer 240
model (Guo 2014) and the current advanced 2-layer model for a few typical m values. Some salient 241
features of the two 2-layer models are noted, such as 242
(i) The calculated on-pile pressure is close to the measured values on passive piles in clay 243
(Viggiani 1981), which reveals an elastic pile-soil interaction. The estimated maximum shear 244
force, however, is higher than the measured values in the model piles (Guo 2014) in sliding 245
sand (and on the safe side). 246
(ii) The normalised maximum bending moment Mmks/plm at various normalised displacements of 247
gw compares well with the boundary element solution (BEM) (Chen and Poulos 1997) upon 248
using a pile deflection wg = ws (= p/ks) for a uniform soil movement (Guo 2012); and 249
(iii) The nonlinear pile response (e.g. the moment Mm, the pile-displacement wg) is originated from 250
a gradual increase in the sliding depth lm and the associated increase in the on-pile force per 251
unit length p (= pllm/l). 252
Equations [1] – [4] and those expressions in Table 1 are deduced for a uniform movement of sliding 253
soil, but they can be used to predict response of piles subjected to other shapes of soil movement, as 254
explained below: 255
• The current solutions for a uniform soil movement ws (= pile displacement wg) are obtained 256
first. The movement ws and its depth lm are then modified as ws/α (i.e. wg/α = ws) and lm/α, 257
respectively. They then become these for an inverse triangular moving soil (i.e. IT ws), for 258
instance, by taking α = 0.72, and match well with the corresponding BEM solution (see Fig. 259
4a). The use of wg/α = ws is also justified for all piles as elaborated subsequently. 260
• The current model tests show wg= 0.72ws (α = 1.39, see Fig. 1b, ws ≈ wf -42 mm, ignoring the 261
42 mm ineffective movement.). The high α value may be attributed to other profiles (e.g. a 262
trapezoid) of soil movement under the T-block loading. The α value in later examples is equal 263
to 0.59 (in-situ test piles) and 1.39-1.5 (for the model tests in sliding soil or subjected to lateral 264
spreading). 265
The use of α is convenient to capture the overall impact of soil movement on passive piles. In 266
practice, a pile may be embedded in a sandwiched liquefied layer with an upper and a lower non-267
liquefied layer (see Fig. 4b1). As mentioned previously, the impact of the upper non-liquefied layer 268
on the pile is encapsulated as a shear force (H), and a rotational moment MA (= kAωr) that exerts at 269
the top of the liquefied layer (see Fig. 4b); whereas that of the lower layer on the pile is captured 270
using a rotational constraint MB (= kBωr). The modelling of the pile-soil interaction during lateral 271
Page 9 of 48
Nonlinear response of laterally loaded rigid piles in sliding soil Wei Dong Guo (2014)
8
spreading thus becomes resolving the advanced 2-layer model in Fig. 3c but for the following 272
salient features: 273
• The total soil movement ws is equal to the displacement wg of the rigid pile subjected to lateral 274
spreading, which consists of rotational and translational components. The relative (rotational) 275
pile displacement between the top and base displacements is equal to w′(z)l (rotation w′(z) = 276
ωr). The net local displacement y between the pile and the surrounding soil at depth z is equal to 277
ωrz (= zrω ) after deducting the translation component. The associated resistance force per unit 278
length p(z) is equal to ωrzp (= pzrω ) after deducting the translational resistance wgks (see eq. 279
[1]). The displacement w(z) and the force per unit length p(z) constitute the p-y (w) curve at the 280
depth z. 281
• The net pressure gradually increases to a maximum and subsequently reduces with the lateral 282
movement. A translational resistance may stay at a very large soil movement, and holds a 283
residual bending moment if kB ≠ 0. 284
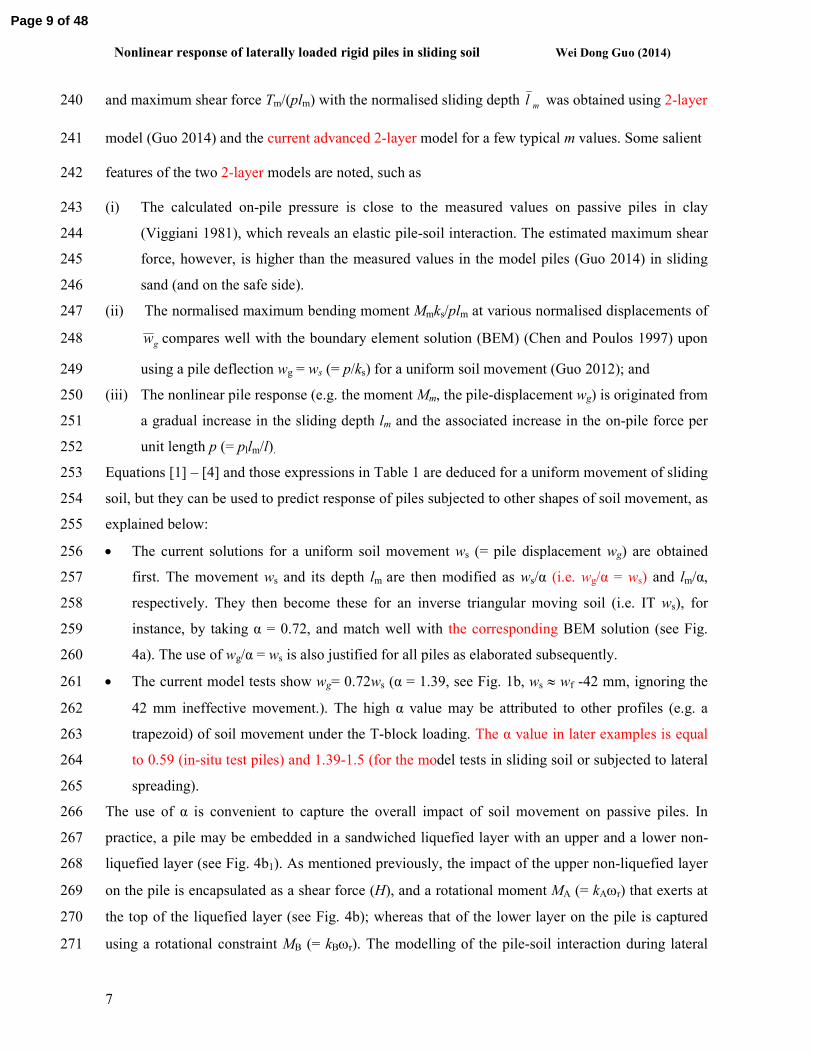
4. PARAMETRIC ANALYSIS (H = 0, Mo = 0) 285
Out of the four input parameters m, ks, p (via pl), and kθ, the two parameters ks and p are used as 286
normalisers. Parametric analysis was thus only focused on the impact of rotational stiffness and the 287
modulus non-homogeneity m on pile response, and is presented in form of 288
(i) normalised soil movement (= αwgks/p) induced by increasing normalised sliding depths [= 289
lm/(αl)] (see Fig. 5); 290
(ii) normalised pile-soil relative displacement (= ωrksl/p) with the normalised soil displacement 291
(= αwgks/p) (Fig. 6); 292
(iii) normalised bending moment [= Mm/(plml)] with the normalised soil movement (Fig. 7); 293
(iv) normalised thrust [= Tm/(plm)] at sliding depth (Fig. 8) and that at true depth (Fig. 9), 294
respectively; and 295
(v) normalised profiles of bending moment M(z)/(plml), shear force T(z)/(plm), on-pile force per 296
unit length p(z)/p, and pile-displacement w(z)/l for a normalised sliding depth ml of 0.75 297
(Fig. 10). 298
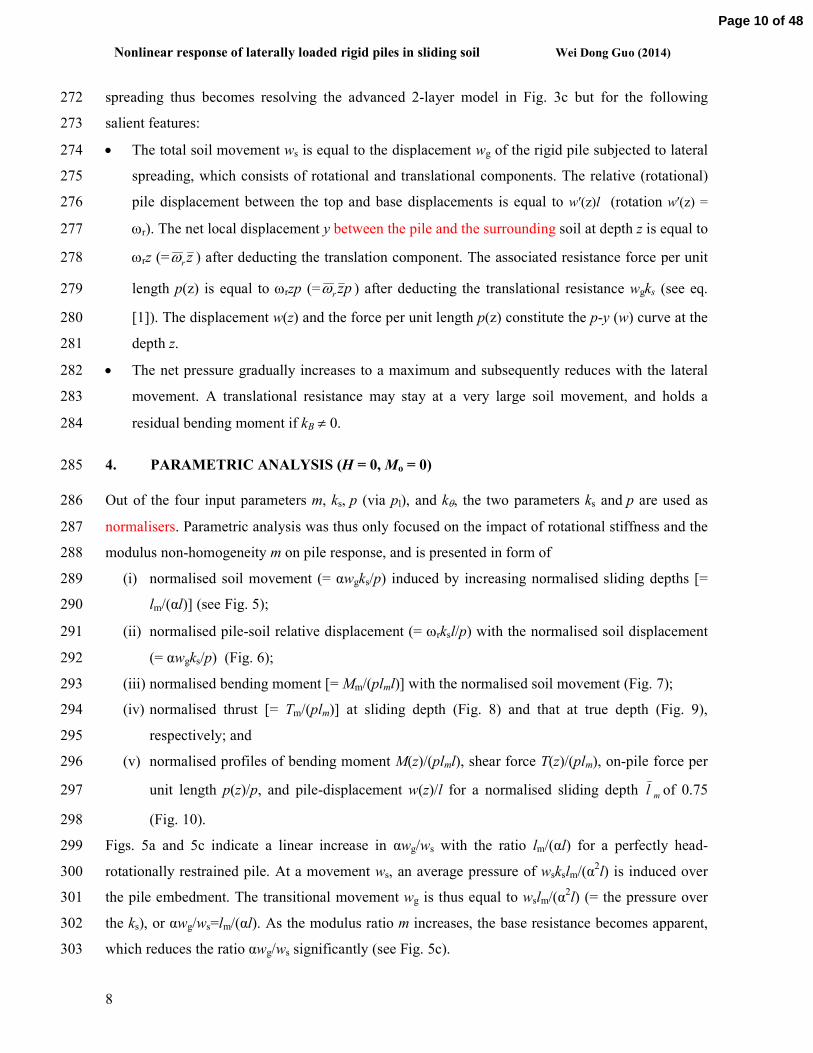
Figs. 5a and 5c indicate a linear increase in αwg/ws with the ratio lm/(αl) for a perfectly head-299
rotationally restrained pile. At a movement ws, an average pressure of wskslm/(α2l) is induced over 300
the pile embedment. The transitional movement wg is thus equal to wslm/(α2l) (= the pressure over 301
the ks), or αwg/ws=lm/(αl). As the modulus ratio m increases, the base resistance becomes apparent, 302
which reduces the ratio αwg/ws significantly (see Fig. 5c). 303
Page 10 of 48
Nonlinear response of laterally loaded rigid piles in sliding soil Wei Dong Guo (2014)
9
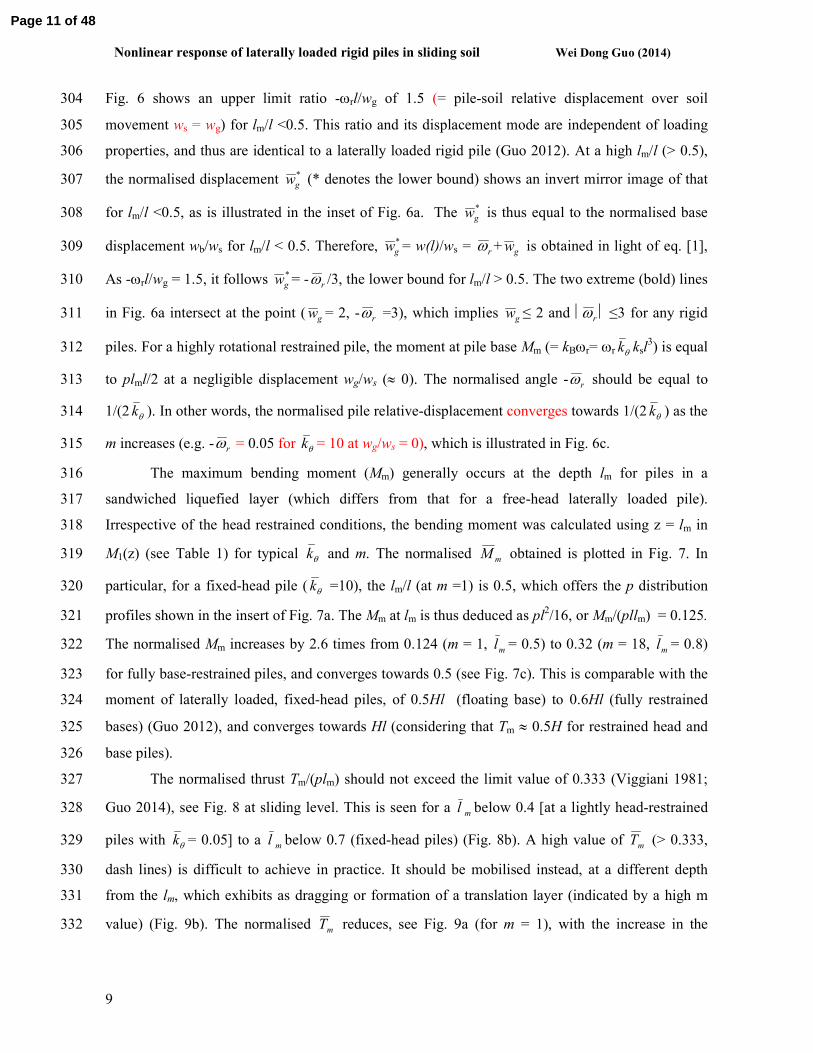
Fig. 6 shows an upper limit ratio -ωrl/wg of 1.5 (= pile-soil relative displacement over soil 304
movement ws = wg) for lm/l <0.5. This ratio and its displacement mode are independent of loading 305
properties, and thus are identical to a laterally loaded rigid pile (Guo 2012). At a high lm/l (> 0.5), 306
the normalised displacement *
gw (* denotes the lower bound) shows an invert mirror image of that 307
for lm/l <0.5, as is illustrated in the inset of Fig. 6a. The *
gw is thus equal to the normalised base 308
displacement wb/ws for lm/l < 0.5. Therefore, *
gw = w(l)/ws = rω + gw is obtained in light of eq. [1], 309
As -ωrl/wg = 1.5, it follows *
gw = - rω /3, the lower bound for lm/l > 0.5. The two extreme (bold) lines 310
in Fig. 6a intersect at the point ( gw = 2, - rω =3), which implies gw ≤ 2 and rω ≤3 for any rigid 311
piles. For a highly rotational restrained pile, the moment at pile base Mm (= kBωr= ωr θk ksl3) is equal 312
to plml/2 at a negligible displacement wg/ws (≈ 0). The normalised angle - rω should be equal to 313
1/(2 θk ). In other words, the normalised pile relative-displacement converges towards 1/(2 θk ) as the 314
m increases (e.g. - rω = 0.05 for θk = 10 at wg/ws = 0), which is illustrated in Fig. 6c. 315
The maximum bending moment (Mm) generally occurs at the depth lm for piles in a 316
sandwiched liquefied layer (which differs from that for a free-head laterally loaded pile). 317
Irrespective of the head restrained conditions, the bending moment was calculated using z = lm in 318
M1(z) (see Table 1) for typical θk and m. The normalised mM obtained is plotted in Fig. 7. In 319
particular, for a fixed-head pile ( θk =10), the lm/l (at m =1) is 0.5, which offers the p distribution 320
profiles shown in the insert of Fig. 7a. The Mm at lm is thus deduced as pl2/16, or Mm/(pllm) = 0.125. 321
The normalised Mm increases by 2.6 times from 0.124 (m = 1, ml = 0.5) to 0.32 (m = 18,
ml = 0.8) 322
for fully base-restrained piles, and converges towards 0.5 (see Fig. 7c). This is comparable with the 323
moment of laterally loaded, fixed-head piles, of 0.5Hl (floating base) to 0.6Hl (fully restrained 324
bases) (Guo 2012), and converges towards Hl (considering that Tm ≈ 0.5H for restrained head and 325
base piles). 326
The normalised thrust Tm/(plm) should not exceed the limit value of 0.333 (Viggiani 1981; 327
Guo 2014), see Fig. 8 at sliding level. This is seen for a ml below 0.4 [at a lightly head-restrained 328
piles with θk = 0.05] to a ml below 0.7 (fixed-head piles) (Fig. 8b). A high value of mT (> 0.333, 329
dash lines) is difficult to achieve in practice. It should be mobilised instead, at a different depth 330
from the lm, which exhibits as dragging or formation of a translation layer (indicated by a high m 331
value) (Fig. 9b). The normalised mT reduces, see Fig. 9a (for m = 1), with the increase in the 332
Page 11 of 48
Nonlinear response of laterally loaded rigid piles in sliding soil Wei Dong Guo (2014)
10
normalised stiffness θk , which is not realistic for the head-constrained piles. The fact is that at a 333
high θk , the Tm normally occurs at sliding level, and should be based on Fig. 8. In addition, at a 334
high sliding depth, a much lower, normalised thrust will be induced, as it is governed by Mode A 335
( ml > 0.4~0.7) in Fig. 9a, as discussed previously (Guo 2014). Finally, Figs. 5 through to 9 are for 336
elastic response by using the on-pile force per unit length p. 337
The impact of base-rotational stiffness (kA = 0, and kB ≠ 0) on the distribution profiles along 338
a typical pile subjected to lateral spreading is evident (see Fig. 10). A free-head and floating-base 339
pile will induce these profiles in dashed lines, whereas a fully fixed-base pile ( θk = infinitely large) 340
may induce a uniform pi(z) in ith
layer and a uniform pile-displacement w(z) with depth z. The 341
assumed triangular and uniform p profiles (Dobry et al. 2003; He et al. 2009) are thus justified for a 342
lightly head-restrained pile (e.g. θk = 0.1), and a fully fixed-base pile, respectively. 343
Finally, the impact of the applied shear force H and bending moment Mo on the prediction 344
can be examined through eq. [2]. It is not discussed here, but illustrated through the next example. 345
5. CASE PREDICTIONS 346
The 2-layer model (i.e. the current advanced model with kA= kB = 0, H = 0, and Mo = 0) well 347
predicts the nonlinear response of all model piles in sliding soil (Guo 2014) but for overestimating 348
the maximum shear force. As will be published elsewhere, the overestimation can be avoided by 349
introducing a transitional layer into either 2-layer model and using slightly different values of ks, m 350
and pl (see Fig. 2d, for instance). The predictions adopt a linearly increasing force per unit length p 351
[= pllm/(αl)] with the normalised sliding depth (lm/l) in the elastic solution. Assuming a uniform p to 352
a sliding depth of ilm/10 [lm = an assumed final sliding depth, say, lm = (0.7~0.9)l for full length 353
lateral spreading], calculation is made for step i = 1, and for i = 2, .., 10, respectively. At the final 354
sliding depth lm (i =10), for instance, the model pile-soil system is illustrated in Fig. 11a (upper 355
figure). The uniform p (applied) should become a triangular increase (for a number of steps), as is 356
depicted in Fig. 11a (lower figure), and is different from the net on-pile p1(z). The new features of 357
the advanced model is examined, respectively, next by analysing an in-situ pile in sliding soil with 358
H ≠ 0, and Mo ≠ 0 (kA = kB = 0), a model pile subjected to lateral spreading with kA≠ 0, and kB ≠ 0 359
(H = 0), and base rotationally-constrained (kB ≠0) piles subjected to full length, lateral spreading 360
(kA= H =Mo= 0). 361
Page 12 of 48
Nonlinear response of laterally loaded rigid piles in sliding soil Wei Dong Guo (2014)
11
5.1 An In-situ Test Pile in Sliding Soil (H ≠≠≠≠ 0, Mo ≠≠≠≠ 0) 362
Frank and Pouget (2008) reported response of an pipe pile installed in downslope of an ‘sliding’ 363
embankment. The pile (11.0 m in length, 0.915 m in diameter, and 19 mm in wall thickness) was 364
instrumented with strian gauges. The soil movement was monitored using inclinometers and 365
piezometers, which shows a trapezoidal movement profile to a sliding depth of 6.8 m. The soil has 366
an average undrained shear strength su of 88 kPa, a unit weight γs of 17.0 kN/m3, and an effective 367
angle of internal friction φ of 24.5o. During the 16- years-long test, the pile was pulled back by 368
applying force H and moment Mo (at ~ 0.5 m above ground level) four times, while the soil sliding 369
continued (thus the p exerted). The measured response by Frank and Pouget (2008) is plotted in 370
Figs.11b -11d, including (b) the time-evolution of maximum bending moment Mm1 at a depth of 371
3.75m and the shear load Tm1 at pile-head level plotted as the dash line of Mm1 [= 0.25Tm1l (Guo and 372
Qin 2010) using the measured load Tm1]; (c) the five profiles of force per unit length along the pile p 373
after each ‘pulling back’ and at year 1999; And (d) The four pile-deflection profiles prior to and 374
after each pulling-back. The applied bending moment Mo, and shear load H are provided in Table 2, 375
along with the measured values of the Mm1 and the ground-line displacement wg. The measured 376
bending moment profiles during and after each of the four pulling-back are plotted in Fig. 12. The 377
displacement profiles exhibit the feature of laterally loaded, fixed-head piles during each pulling-378
back; whereas the linearly decreased displacement after each pre-pulling-back (from the ground-379
line to the sliding depth of 6.8 m) resembles that of a rigid pile subjected to passive loading. The 380
theory for laterally loaded piles and the advanced 2-layer models are thus employed for the 381
predictions, respectively. 382
To conduct the 2-layer prediction, the pile and soil properties were as follows: l = 11.0 m, d = 383
0.915 m, and c = lm= 6.8 m (λ = 0.618). The pl = pu at l = 11.0 m was estimated as 749.7 kN/m [= 384
0.75γsKp2dz] (see Fig. 11c), in light of γs = 17.0 kN/m
3, φ = 24.5
o, and d = 0.915 m. The ultimate pl 385
increases with the repetition of the pulling-backs (see Table 2). 386
Taking pl = 0.9pu for the 1986 pulling-back, for instance, the p (= pllm/l) was estimated as 417.1 387
kN/m at the sliding level. The applied moment Mo (= -94 kNm), and the pile-head load H = 0 (see 388
Table 2) offer 0M = -1.863×10⁻³
[= -94/(417.1×11)], and H = 0. With θk = 0, kA = 0, and taking m 389
= 4.5, and ks = 2.86 MPa (lower than the k for lateral loading due to a large pile-soil relative 390
movement), the normalised ratios of rω = -1.458, and gw =1.251 were obtained, respectively, using 391
eqs. [2] and [3]. These values allow profiles of displacement, bending moment, shear force to be 392
predicted using the expressions in Table 1. The predicted and measured displacement and moment 393
profiles are plotted in Figs. 11d and 12a, respectively. Furthermore, the depths zm1 and zm2 of 394
Page 13 of 48
Nonlinear response of laterally loaded rigid piles in sliding soil Wei Dong Guo (2014)
12
maximum bending moment Mm1 and Mm2 were estimated as 3.729 m ( 1mz = 0.345), and 8.217 m 395
(2mz = 0.717) in the sliding and the stable layer, respectively. The moment Mm1 and Mm2 were 396
estimated as -345.23 kNm, and 659.23 kNm, respectively using M1(zm1) and M2(zm2) (see Table 1, 397
and eq. [4]). As for the 1986-pulling stage, the input values were Mo = -209 kNm, H = 310 kN, m = 398
5.5 (high value for large dragging), and ks = 2.86 MPa. The predictions were made, and are also 399
shown in the figures, respectively. 400
As with the analysis of 1986 measurement, the predictions were repeated for other three stages 401
(in 1988, 1992 and 1995) using the values of Mo, H, m, and ks (see Table 2), and are shown in Figs. 402
11d and 12. Overall the predicted and the measured bending moment profiles agree with each other 403
for each stage (see Figs. 12a-12d) on 5 Nov. 1986, 11 Nov. 1988, 1 Oct. 1992 and 6 July, 1995, 404
respectively, so do the deflection profiles of the pre-pulling backs. Note the deflection and bending 405
moment profiles during the pulling-back (solid symbols) should be predicted using the solutions for 406
a laterally loaded pile, which are not pursued herein. In contrast, the profiles of bending moment 407
during pull-backs depend solely on the ultimate on-pile pressure (at a sufficiently large pile-soil 408
movement), and thus were estimated using the advanced 2-layer model. 409
The variations of the bending moments Mm1 and Mm2 with the pile-head displacement wg during 410
the loading cycles are illustrated in Figs. 13a and 13b for the sliding layer and the stable layer, 411
respectively. A simplified loading of Mo = 0, and H = 0 kN, along with m = 4.5, ks = 2.86 MPa, and 412
pl = 900 kN/m (= 1.2×749.68kN/m) were used to predict the evolution of the maximum bending 413
moments with the overall soil movement (with α = 0.588), and that with the pile-head displacement 414
over the 16 years, respectively. They are plotted in Figs. 13c and 13d, respectively. The predictions 415
compare well with the measured data after the swap between -Mm1 at a depth of 3.75 m with the 416
Mm2 at depth 8-9 m. The predicted base displacement wb versus the moment Mm curve does 417
compare well with the measured wg versus Mm curve at 8-9 m as expected. The swaps between the 418
moments Mm1 and Mm2 at the depths, and between the displacements wb and wg thus verify the 419
impact of the deep sliding (lm/l > 0.5) on the displacement depicted in the insert of Fig. 6a. 420
Furthermore, the impact of non-homogeneity m and any dragging ( θk > 0) may be assessed against 421
Figs. 7a and 7b. 422
5.2 Piles Subjected to Lateral Spreading 423
Abdoun et al (2003) conducted 8 centrifuge tests on 9 models of single piles and pile 424
groups, at a centrifugal acceleration of 50g (g = gravity). The models were excited in flight with an 425
input base acceleration that has 40 cycles of uniform acceleration, a prototype amplitude of 0.3g 426
Page 14 of 48
Nonlinear response of laterally loaded rigid piles in sliding soil Wei Dong Guo (2014)
13
and frequency of 2 Hz. Accelerometers and pore pressure transducers were installed in the soil to 427
measure lateral accelerations and excess pore pressures; lateral LVDTs were mounted on the 428
flexible walls of the laminar box to monitor the free-field soil lateral deformations; and strain 429
gauges were used to measure bending moments in the piles. 430
Their Model 3 for a single pile tested in a two-layer soil profile is simulated herein, as an 431
example. The 8-m-long pile was embedded in a 6-m-thick liquefiable sand layer (with a relative 432
density Dr of 40%) overlying a 2-m-thick layer of slightly cemented sand (with a cohesion of 5.1 433
kPa, and an internal friction angle of 34.5°). The pile test measured ground movement (ws), the pile-434
soil relative displacement (lωr), and the maximum bending moments (Mm) (Abdoun et al. 2003). 435
They are plotted in Fig. 14, which encompass a cyclic and a permanent component. The moment 436
Mm was measured at a depth of 5.75 m in the liquefied layer. It increased to 113 kNm at a 437
maximum pile-head deflection of 270 mm, and subsequently decreased (together with the 438
deflection), despite the continual increase in the free-field (lateral spreading) movement. The 439
ultimate measured profiles of the bending moments, and the soil movements are plotted in Figs. 15a 440
and 15c, respectively. 441
(a) 2-layer Model Prediction 442
The current prediction for the Model 3 test, renamed as C1-M3 (see Table 3, ‘M3’ denotes 443
‘Model 3 test’) utilises m = 1.9, ks = 23 kPa, pl = 30 kN/m, l = 8 m, H = 0, and kB = kθ = 3.821 444
MNm/radian ( θk = 0.317). The pl = pu at l = 8.0 m was estimated as 0.9γsKp2dz, in light of γs 445
(effective) = 9.0 kN/m3, φ = 0
o, and d = 0.475 m. The kθ value is only two-third of 5.738 446
MNm/radian adopted previously (Dobry et al. 2003), owing to incorporating the impact of the soil 447
modulus ks (ignored previously). The value of modulus ks was obtained from tests on model rigid 448
piles in sliding sand, which is 15~60 kPa (Guo and Qin 2010). The calculation is done in three 449
steps: First, specifying a sliding depth lm (= c = 0.1l < final sliding depth), the normalised rotation 450
rω and displacement gw were calculated using eqs. [2] and [3], respectively. Second, the maximum 451
bending moment Mm (at a depth of 5.75 m), shear force Tm and on-pile force per unit length p were 452
calculated using the expressions in Table 1 (see Table 4). Third, the first and second calculation 453
steps are repeated for a series of new c = lm (say, 0.2l, 0.4l, 0.6l, 0.8l, and l), which enable the 454
results shown in Table 4. The obtained ws and Mm values for each lm/l, for instance, are plotted 455
together to formulate the ws~Mm (bold, solid) curve (see Fig. 14b). Likewise, the ws and lωr values, 456
and the lωr and Mm values for each lm/l are plotted as bold, solid curves in Figs. 14c and 14d, 457
respectively. 458
Page 15 of 48
Nonlinear response of laterally loaded rigid piles in sliding soil Wei Dong Guo (2014)
14
Importantly, it should be stressed that (i) The pile movement is the relative displacement 459
between the pile- head and toe, to be consistent with the measured data; (ii) The effective soil 460
movement ws around the pile location is equal to 0.667wg (α = 1.5); and (iii) Increasing the sliding 461
depth lm (= c) and the on-pile force per unit length p allow nonlinear response to be captured. The 462
Mm and lωr predicted compare well, respectively, with the measured evolution of the Mm (see Fig. 463
14b), and the pile-head displacement (Fig. 14c) with the (ground-level free-field displacement) ws. 464
The bending moment Mm eventually drops to 27 kN-m (?). It would drop further without the stable 465
layer (kB > 0), as noted in other centrifuge tests (Motamed and Towhata 2010). The predicted lωr ~ 466
Mm curve shows an increase and decrease cycle, which agrees with the measured relationship as 467
well (Fig. 14d). In the same manner, the calculations were repeated by taking m = 1 and the 468
predictions are plotted in Figs. 14b and 14c as well, which serve well as a lower bound for the 469
bending moment, and the pile displacement, respectively. 470
With the same parameters of H = 0, c = lm = 6 m, l = 8 m, λ = 0.333, ks = 23 kPa, pl = 30 471
kN/m, and kθ = 3.821 MNm/radian, the following were predicted using the expressions in Table 1: 472
the profiles of bending moment M(z), shear force T(z), pile displacement w(z), the net force per unit 473
length p1(z) at ultimate state; and the p-y(w) curves at depths of 2 m, 3 m, and 4 m, and 5.75 m. 474
They are plotted in Figs. 15a through 15e, respectively. A good prediction of the M(z) is noted 475
against the measured data, so is the force per unit length pi(z) against similar centrifuge tests 476
(González et al. 2009). The predicted average p1(z) over the 6-m liquefied layer is 7.23 kN/m 477
(increasing linearly from 4.46 to 10 kN/m). The associated on-pile pressure is 9.47 ~20.4 kPa, 478
which agrees well with the previous suggestions, so do the p-y curves. Finally, the impact of 479
selected θk (= 0.326) on the prediction can be ascertained from Fig. 10. 480
(b) Prediction for Case C2-M5a 481
In the same test series as the Model 3 test, Abdoun et al (2003) presented Model 5a test (i.e. C2-482
M5a in Table 3). The test was identical to the Model 3 (C1-M3) test, but for having a rectangular 483
pile cap [2×2.5×0.5 m (in thickness)] rigidly connected to the top of the pile. The C2-M5a test thus 484
has a 2.5×0.5 m side area exposed to the soil pressure pushing on the cap during lateral spreading. 485
The experiment indicates a prototype Mmax of 170 kNm at a pile-head deflection of 350 mm. The 486
measured data allow the parameters ks, m, kθ and pl for the pile to be deduced, which are provided in 487
Table 3. This deduced pl for the C2-M5a test (with a cap) was 33% higher than for the C1-M3 test 488
(without a cap). The response is not detailed herein owing to limited space. 489
Page 16 of 48
Nonlinear response of laterally loaded rigid piles in sliding soil Wei Dong Guo (2014)
15
5.3 Piles (with known kB) in Single Layer Subjected to Lateral Spreading 490
He et al (2009) investigated the response of single piles in Models 1, 2, 3 and 6 tests (or C3-491
M1 through to C6-M6 in Table 3, respectively) subjected to liquefaction-induced lateral soil flow 492
(with ground sloping up to 6 degrees). The piles were ‘fixed’ to the base before construction of the 493
soil stratum (which had a relative density of 40–50%, and saturated density of 19 kN/m3). Each pile 494
was instrumented with strain gauges along the shaft, and with a displacement transducer at the pile 495
head, to allow for estimating bending moments and deformation in the pile due to lateral soil flow. 496
Each model was instrumented with accelerometers and pore pressure sensors in a sand stratum. 497
As with the above-calculation, the single, base rotationally restrained piles C3-M1 through 498
to C6-M6 subjected to lateral spreading were studied. The measured maximum bending moment 499
and ground-line pile-deflection at an ‘ultimate’ soil movement for each pile are tabulated in Table 500
3; and the response profiles are plotted in Fig. 16. The measured data allow the parameters ks, m, kθ 501
and pl (see Table 3) for each pile to be deduced using the current advanced 2-layer solutions. 502
In using the 2-layer model for the base-restrained piles in a full-length liquefied soil (lm = l), 503
the loading depth c is taken as (0.75~0.9)l, as a reduced bending moment at a distance of 504
(0.1~0.25)l about the base (e.g. in Fig. 16d) is observed, resembling that along retaining walls. The 505
exact loading depth c was deduced by fitting current solutions to measured bending moment profile 506
for the known base rotational stiffness kB. This is briefly described next for each test. 507
Case C3-M1: The original Model 1 test (He, et al, 2009) on a flexible pile having a base 508
stiffness kB of 185.0 MNm/rad and on a rigid pile with kB = 8.5 MNm/rad was tested in 509
Kasumigaura saturated sand (5.0 m in thickness) using a large laminar soil container [~12×3.5×6m 510
(high)]. The sand (Kagawa et al. 2004) has D50 = 0.31 mm, fines content Fc = 3%, and uniformity 511
coefficient Cu = 3. Displacement transducers were mounted on the laminar container exterior wall 512
to measure free-field lateral displacement. 513
Cases C4-M2~C6-M6: The Model 2, 3, and 6 tests adopted silica sand (from a San Diego, 514
CA quarry), which has the properties of (He et al. 2009) D50 = 0.32 mm, a fines content Fc below 515
2%, and a uniformity coefficient Cu of 1.5. The tests were conducted in the sand saturated in a 516
medium laminar container [4m×1.8m×2m (high)] (Jakrapiyanun 2002). The pile-base stiffness kB 517
was reported as 0.11 MNm/rad (C4-M2), and 0.2 MNm/rad (C5-M3), respectively. As with Model 518
1(C3-M1), a single, vertical pile in each test was installed in the container with a 2o inclined (to the 519
horizontal) ground surface. Model 6 (C6-M6) was conducted using a levelled, rigid-wall container 520
[4m×1.8m×2 m (high)], within which the soil surface was inclined at a slope of 6%. The Model C6-521
M6 has a kB = 0.3 MNm/rad, for a single, concrete pile. 522
Page 17 of 48
Nonlinear response of laterally loaded rigid piles in sliding soil Wei Dong Guo (2014)
16
During the tests, the pile-head and soil displacements were found alike prior to the onset of 523
liquefaction. Thereafter, the pile-displacement increases to its peak and decreases slightly, as the 524
ground continues to displace laterally. The bending moment exhibits a similar increase-decrease 525
pattern. Pertinent moment and displacement profiles are plotted in Fig. 16, and a maximum bending 526
moment Mm generally attains the value of kθωr around the pile-base. Typical maximum pile-head 527
displacements and moments induced in model tests are provided in Table 3. 528
Using the 2-layer model and the parameters in Table 3, the predictions using Table 1 529
expressions were made concerning (a1) the bending moment profile M(z) and (a2) the pile 530
displacement profile w(z) for test C3-M1; (b) the M(z) for test C4-M2; (c) the M(z) and w(z) for test 531
C5-M3, and (d) the M(z) for test C6-M6. The predicted profiles of M(z) agree with the measured 532
data in Figs. 16a1, 16b, 16c1 and 16d, respectively, so do the predicted profiles of w(z) against the 533
available data in Figs. 16a2 and 16c2. 534
Overall given measured response, the modulus ks may be adjusted to fit evolution of soil 535
movement ws; the values of m and kθ adjusted to match maximum bending moment, rotational angle 536
and displacement of a pile (base stiffness of lower layer); and the pl adjusted to fit on-pile pressure 537
(thus distribution of bending moment with depth). The current model warrants force, moment 538
equilibrium and displacement compatibility. The deduction is thus rigorous. Nevertheless, the 539
deduced parameters for full-length lateral spreading may vary with soil movement profile, which is 540
unknown without the Mm versus ws curve etc. The parameters deduced are thus provided here for 541
reference only. 542
The kθ values deduced are consistent between C1-M3 and C2-M5a tests (Group 1). The 543
normalised stiffness θk deduced is close to the pile-base stiffness Bk for C4 and C5 piles (He et al. 544
2009); whereas the values of kB for C4-C6 tests are also in good agreement with reported data. As 545
for the C4 test, the stiffness kB is lower than the reported of 18.5 MN-m/rad, indicating the impact 546
of other rotational constraint along the pile. As θk = 0.32~1.1, the piles may exhibit the features of 547
fixed-head piles ( θk = 10). For instance, the ratio αwg/ws may increase linearly with the sliding 548
depth (see Fig. 5c). 549
The calculation of pl for the fixed-base piles in a single layer is rather new. The pl would be 550
estimated as 19.5 kN/m (= γs’Kp
2dz) for C3 pile using z = 4.8 m, γs
’ = 9.0 kN/m
3, φ = 5
o, and d = 551
0.318 m, which is far below the deduced 50 kN/m. The pl would be estimated as 29 kN/m (= γsdz, 552
50% the deduced pl) using the overburden pressure (He et al. 2009). The on-pile force per unit 553
length pl on C4 and C5 piles was deduced 7.3, and 9.9 kN/m, which are close to 7.72 kN/m (C4), 554
and 7.52 kN/m (C5) estimated using pl = γsdz, respectively; whereas the deduced pl of 8.8 kN/m for 555
Page 18 of 48
Nonlinear response of laterally loaded rigid piles in sliding soil Wei Dong Guo (2014)
17
C6 is about twice the estimated value of 4.33 kN/m ( = γsdz) The estimated on-pile pressures (≈ p/d) 556
was 9.5~30 kPa (C1-C2), and 2.7~4.7 kPa (C4-C6), which are in good accord with reported values 557
(He et al. 2009). The C3 test induced a pressure about twice that on C2, which may be attributed to 558
the large kB value. The average on-pile pressure (over pile embedment) and the pile-base level 559
pressure seem to increase with the base rotational stiffness kB, as is seen in Fig. 17a for the 560
investigated tests C1-C6. In contrast, the pile-head level pressure seems to increase with the pile 561
diameter (see Fig. 17b). 562
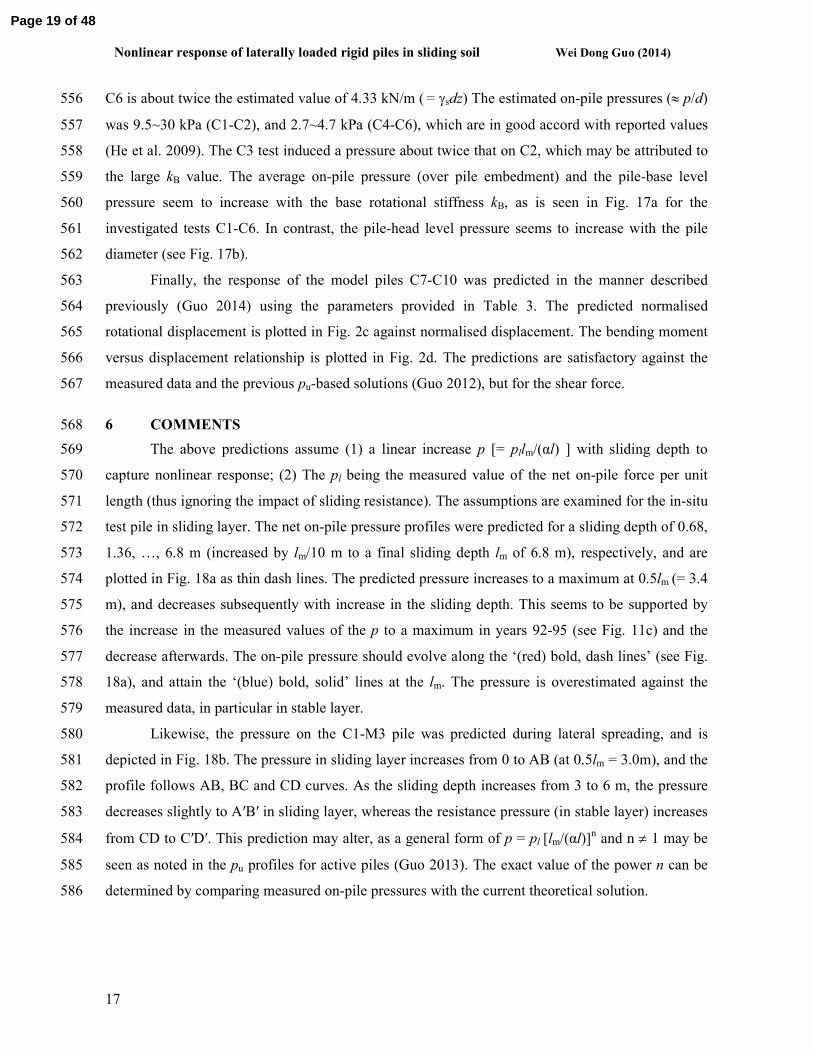
Finally, the response of the model piles C7-C10 was predicted in the manner described 563
previously (Guo 2014) using the parameters provided in Table 3. The predicted normalised 564
rotational displacement is plotted in Fig. 2c against normalised displacement. The bending moment 565
versus displacement relationship is plotted in Fig. 2d. The predictions are satisfactory against the 566
measured data and the previous pu-based solutions (Guo 2012), but for the shear force. 567
6 COMMENTS 568
The above predictions assume (1) a linear increase p [= pllm/(αl) ] with sliding depth to 569
capture nonlinear response; (2) The pl being the measured value of the net on-pile force per unit 570
length (thus ignoring the impact of sliding resistance). The assumptions are examined for the in-situ 571
test pile in sliding layer. The net on-pile pressure profiles were predicted for a sliding depth of 0.68, 572
1.36, …, 6.8 m (increased by lm/10 m to a final sliding depth lm of 6.8 m), respectively, and are 573
plotted in Fig. 18a as thin dash lines. The predicted pressure increases to a maximum at 0.5lm (= 3.4 574
m), and decreases subsequently with increase in the sliding depth. This seems to be supported by 575
the increase in the measured values of the p to a maximum in years 92-95 (see Fig. 11c) and the 576
decrease afterwards. The on-pile pressure should evolve along the ‘(red) bold, dash lines’ (see Fig. 577
18a), and attain the ‘(blue) bold, solid’ lines at the lm. The pressure is overestimated against the 578
measured data, in particular in stable layer. 579
Likewise, the pressure on the C1-M3 pile was predicted during lateral spreading, and is 580
depicted in Fig. 18b. The pressure in sliding layer increases from 0 to AB (at 0.5lm = 3.0m), and the 581
profile follows AB, BC and CD curves. As the sliding depth increases from 3 to 6 m, the pressure 582
decreases slightly to A′B′ in sliding layer, whereas the resistance pressure (in stable layer) increases 583
from CD to C′D′. This prediction may alter, as a general form of p = pl [lm/(αl)]n and n ≠ 1 may be 584
seen as noted in the pu profiles for active piles (Guo 2013). The exact value of the power n can be 585
determined by comparing measured on-pile pressures with the current theoretical solution. 586
Page 19 of 48
Nonlinear response of laterally loaded rigid piles in sliding soil Wei Dong Guo (2014)
18
7 CONCLUSIONS 587
An advanced 2-layer model and closed-form solutions are developed to capture nonlinear 588
response of rotationally restrained, rigid passive piles subjected to soil movement (sliding soil or 589
lateral spreading). In particular, the pile-head displacement is generally measured as relative 590
displacement ωrl during lateral spreading, which is different from wg for piles in sliding soil, but 591
both cases have a soil moment wg/α. The model has been successfully used to capture the response 592
of all model piles and one in-situ test pile in sliding soil, two piles in 2-layer soil and four fixed-593
base single piles in single layer subjected to lateral spreading. The study reveals a dominant elastic 594
pile-soil interaction around the piles, which causes nonlinear response through a progressive 595
increase in sliding depth lm and the on-pile force per unit length p [= pllm/(αl)]. The impact of profile 596
and source of the movement ws on passive piles is effectively incorporated using a modified sliding 597
depth of lm/α and movement ws/α, respectively. Other conclusions are drawn as follows: 598
• The predicted pile response (for a uniform movement) can be converted into that under an 599
inverse triangular soil movement by factoring the ws and its depth lm as ws/α and lm/α (α = 600
0.72), respectively. The α values are deduced as 0.59 and 1.39~1.5, respectively, for an in-601
situ test pile (in sliding soil) and nine model piles (in sliding soil or subjected to lateral 602
spreading). 603
• A triangular and a uniform p profile (Dobry et al. 2003; He et al. 2009) may be induced along 604
a lightly head-restrained, floating-base pile and fixed-base piles, respectively. The pressure 605
increases with the base rotational stiffness. 606
The good predictions can be achieved using four parameters ks, m, kθ and pl (or pu), and a series of 607
stipulated sliding depths. In particular, they (e.g. ks and pu) may be determined using the low-cost 608
model shear tests (rather than shaking tables). Nevertheless, more experiment are required to verify 609
the impact of rotational stiffness kθ on the normalised thrust mT , as the mT at kθ = 0 is overestimated 610
without considering the dragging impact for the model piles in sliding soil. The study on exact 611
variation of p with lm/l is also recommended. 612
REFERENCES 613
Abdoun, T., Dobry, R., O'Rourke, T. D. and Goh, S. H. 2003. Pile response to lateral spreads: 614
Centrifuge modeling. Journal of Geotechnical and Geoenvironmental Engineering, ASCE 615
129(10): 869-878. 616
Boulanger, R. W., Kutter, B. L., Brandenberg, S. J., Singh, P. and Chang, D. 2003. Pile foundations 617
in liquefied and laterally spreading ground during earthquakes: Centrifuge experiments and 618
analyses. Rep. No. UCD/CGM-03/01, Center for Geotechnical Modeling, Univ. of 619
California, Davis. California, USA. 620
Page 20 of 48
Nonlinear response of laterally loaded rigid piles in sliding soil Wei Dong Guo (2014)
19
Brandenberg, S. J., Boulanger, R. W. and Kutter, B. L. 2005. Discussion of "Single piles in lateral 621
spreads: field bending moment evaluation" by R. Dobry, T. Abdoun, T. D. O'Rourke, and S. 622
H. Goh. Journal of Geotechnical and Geoenvironmental Engineering, American Society of 623
Civil Engineers 131(4): 529-534. 624
Brandenberg, S. J., Boulanger, R. W., Kutter, B. L. and Chang, D. 2005. Static pushover analyses 625
of pile groups in liquefied and laterally spreading ground in centrifuge tests. J. Geotech. and 626
Geoenvir. Engrg Div., ASCE 133(9): 1055–1066. 627
Bransby, M. F. and Springman, S. M. 1997. Centrifuge modelling of pile groups adjacent to 628
surcharge loads. Soils and Foundations 37(2): 39-49. 629
Cai, F. and Ugai, K. 2003. Response of flexible piles under laterally linear movement of the sliding 630
layer in landslides. Canadian Geotechnical Journal 40(1): 46-53. 631
Chen, L. T. and Poulos, H. G. 1997. Piles subjected to lateral soil movements. Journal of 632
Geotechnical and Geoenvironmental Engineering, ASCE 123(9): 802-811. 633
Chen, L. T., Poulos, H. G., Leung, C. F., Chow, Y. K. and Shen, R. F. 2002. Discussion of 634
"Behavior of pile subject to excavation-induced soil movement.". Journal of Geotechnical 635
and Geoenvironmental Engineering, American Society of Civil Engineers 128(3): 279-281. 636
Chmoulian, A. 2004. Briefing: Analysis of piled stabilization of landslides. Proceedings of the 637
Institution of Civil Engineers, Geotechnical Engineering 157(2): 55-56. 638
Chow, Y. K. 1996. Analysis of piles used for slope stabilization. International Journal for 639
Numerical and Analytical Methods in Geomechanics 20(9): 635-646. 640
Cubrinovskia, M., Kokushob, T. and Ishihara, K. 2006. Interpretation from large-scale shake table 641
tests on piles undergoing lateral spreading in liquefied soils. Soil Dynamics and Earthquake 642
Engineering 26(275-286. 643
De Beer, E. and Carpentier, R. 1977. Discussion on 'Methods to estimate lateral force acting on 644
stabilising piles' By Ito, T., and Matsui, T. (1975). Soil and Foundations 17(1): 68-82. 645
Dobry, R., Abdoun, T., O'Rourke, T. D. and Goh, S. H. 2003. Single piles in lateral spreads: field 646
bending moment evaluation. Journal of Geotechnical and Geoenvironmental Engineering, 647
American Society of Civil Engineers 129(10): 879-889. 648
Frank, R. and Pouget, P. 2008. Experimental pile subjected to long duration thrusts owing to a 649
moving slope. Geotechnique 58(8): 645-658. 650
Franke, K. W. and Rollins, K. M. 2013. Simplified hybrid p-y spring model for liquefied soils. 651
Journal of Geotechnical and Geoenvironmental Engineering, ASCE 139(4): 564-576. 652
Fukuoka, M. 1977. The effect of horizontal loads on piles due to landslides. In Proceedings 9th
653
International Conference on Soil Mechanics and Foundation Engineering, Speciality session 654
10, Tokyo: 27-42. 655
González, L., Abdoun, T. and Dobry, R. 2009. Effect of soil permeability on centrifuge modeling of 656
pile response to lateral spreading. Journal of Geotechnical and Geoenvironmental 657
Engineering, ASCE 135(1): 62-73. 658
Guo, W. D. 2003. A simplified approach for piles due to soil movement. In Proc. 12th
Panamerican 659
conference on soil mechanics and geotechnical engineering, Cambridge, Massachusettes, 660
USA, Verlag Gluckauf GMBH. Essen (Germany). 2: 2215-2220. 661
Guo, W. D. 2006. On limiting force profile, slip depth and lateral pile response. Computers and 662
Geotechnics 33(1): 47-67. 663
Guo, W. D. 2008. Laterally loaded rigid piles in cohesionless soil. Canadian Geotechnical Journal 664
45(5): 676-697. 665
Guo, W. D. 2012. Theory and practice of pile foundations. Boca Raton, London, New York, CRC 666
press. 667
Guo, W. D. 2013. Simple model for nonlinear response of fifty-two laterally loaded piles. Journal of 668
Geotechnical and Geoenvironmental Engineering, ASCE 139(2): 234-252. 669
Page 21 of 48
Nonlinear response of laterally loaded rigid piles in sliding soil Wei Dong Guo (2014)
20
Guo, W. D. 2014. Elastic models for nonlinear response of rigid passive piles. International Journal 670
for Numerical and Analytical Methods in Geomechanicsin press): DOI: 10.1002/nag.2292. 671
Guo, W. D. and Qin, H. Y. 2006. Vertically loaded piles in sand subjected to triangular profiles of 672
soil movements. In Proceedings of 10th
International Conference on Piling and Foundations, 673
Amsterdam, Netherland 1: paper no. 1371. 674
Guo, W. D. and Qin, H. Y. 2010. Thrust and bending moment of rigid piles subjected to moving 675
soil. Can. Geotech. J. 47(2): 180-196. 676
Guo, W. D., Qin, H. Y. and Ghee, E. H. 2006. Effect of soil movement profiles on vertically loaded 677
single piles. In Proc. International Conf. on Physical Modelling in Geotechnics Hong Kong, 678
China, Taylor & Francis Group plc, London, UK. 2: 841-846. 679
He, L., Elgamal, A., Abdoun, T., Abe, A., Dobry, R., Hamada, M., Menses, J., Sato, M., Shantz, T. 680
and Tokimatsu, K. 2009. Liquefaction-induced lateral load on pile in a medium Dr sand 681
layer. Journal of Earthquake Engineering 13(916-938. 682
Idriss, I. M. and Boulanger, R. W. 2007. SPT- and CPT-based relationships for the residual shear 683
strength of liquefied soils. In Proc., 4th Int. Conf. on Earthquake Geotechnical Engineering, 684
K. D. Pitilakis, ed.,, Dordrecht, Netherlands. 1: 1-22. 685
Ito, T. and Matsui, T. 1975. Methods to estimate lateral force acting on stabilizing piles. Soils and 686
Foundations 15(4): 43-59. 687
Jakrapiyanun, W. 2002. Physical modeling of dynamic soil-foundation-structure-interaction using a 688
laminar container. Civil Engineering. San Diego, La Jolla, University of California. Ph.D. 689
Juirnarongrit, T. and Ashford, S. A. 2006. Soil–pile response to blast-induced lateral spreading. II: 690
Analysis and assessment of the p-y method. Journal of Geotechnical and Geoenvironmental 691
Engineering, American Society of Civil Engineers 132(2): 163-172. 692
Kagawa, T., Sato, M., Minowa, C., Abe, A. and Tazoh, T. 2004. Centrifuge simulations of 693
largescale shaking table tests: Case studies. J. Geotech. and Geoenvir. Engrg Div., ASCE 694
130(7): 663-672. 695
Motamed, R. and Towhata, I. 2010. Shaking table model tests on pile groups behind quay walls 696
subjected to lateral spreading. Journal of Geotechnical and Geoenvironmental Engineering, 697
ASCE 136(3): 477-489. 698
Olson, S. M. and Stark, T. D. 2002. Liquefied strength ratio from liquefaction flow failure case 699
histories. Canadian Geotechnical Journal 39(2)(629-647. 700
Poulos, H. G. 1995. Design of reinforcing piles to increase slope stability. Canadian Geotechnical 701
Journal 32(5): 808-818. 702
Qin, H. Y. 2010. Response of pile foundations due to lateral force and soil movements. School of 703
Engineering. Gold Coast, Griffith University. Ph.D. 704
Rollins, K. M., Gerber, T. M., Lane, J. D. and Ashford, S. 2005. Lateral resistance of a full-scale 705
pile group in liquefied sand. J. Geotech. and Geoenvir. Engrg Div., ASCE 131(1): 115-706
125. 707
Seed, R. B. and Harder, L. F. 1990. SPT-based analysis of cyclic pore pressure generation and 708
undrained residual strength. In Proc., H. Bolton Seed Memorial Symp.,BiTech,, Richmond, 709
BC, Canada. 2: 351-376. 710
Smethurst, J. A. and Powrie, W. 2007. Monitoring and analysis of the bending behaviour of discrete 711
piles used to stabilise a railway embankment. Geotechnique 57(8): 663-677. 712
Stewart, D. P., Jewell, R. J. and Randolph, M. F. 1994. Design of piled bridge abutment on soft clay 713
for loading from lateral soil movements. Geotechnique 44(2): 277-296. 714
Viggiani, C. 1981. Ultimate lateral load on piles used to stabilise landslide. In Proc. 10th Int. Conf. 715
Soil Mech. and Found. Engrg., Stockholm, Sweden. 3: 555-560. 716
Wang, S.-T. and Reese, L. C. 1998. Design of pile foundations in liquefied soils. In Proc., 717
Geotechnical Earthquake Engineering and Soil Dynamics III, P. Dakoulas, M. Yegian, and 718
R. Holtz, eds.,, Reston, VA. 2: 1331-1343. 719
Page 22 of 48
Nonlinear response of laterally loaded rigid piles in sliding soil Wei Dong Guo (2014)
21
720
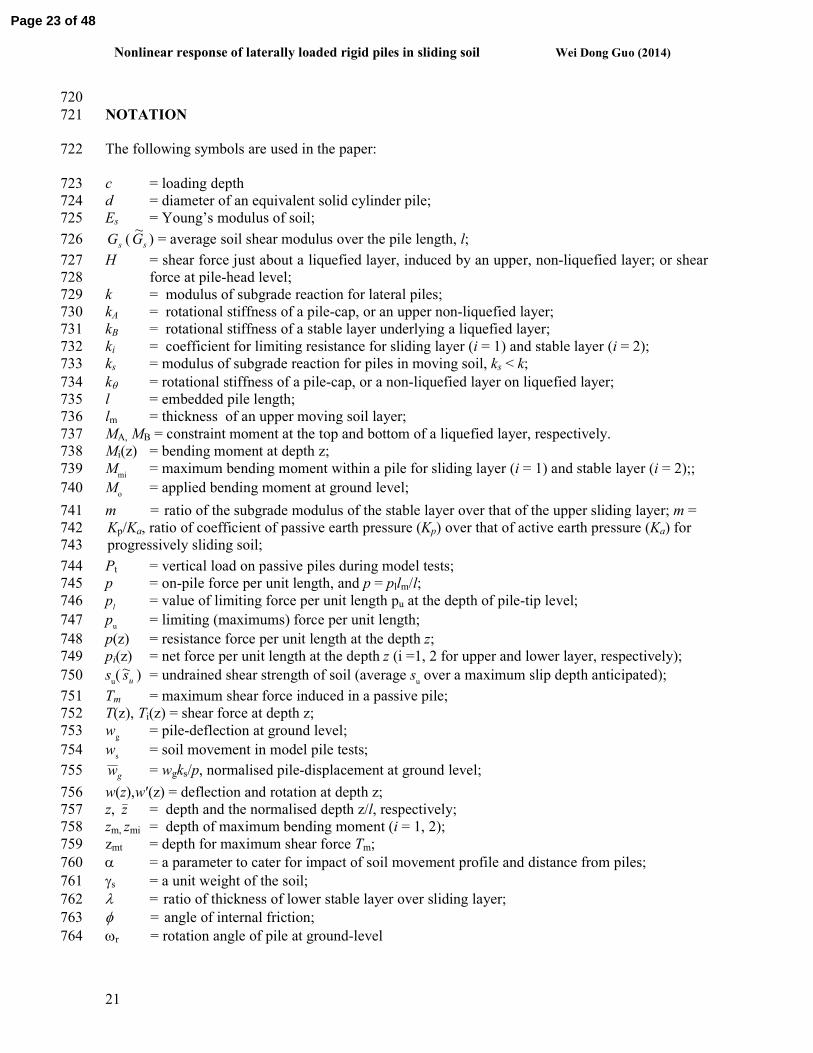
NOTATION 721
The following symbols are used in the paper: 722
c = loading depth 723
d = diameter of an equivalent solid cylinder pile; 724
Es = Young’s modulus of soil; 725
sG ( sG~
) = average soil shear modulus over the pile length, l; 726
H = shear force just about a liquefied layer, induced by an upper, non-liquefied layer; or shear 727
force at pile-head level; 728
k = modulus of subgrade reaction for lateral piles; 729
kA = rotational stiffness of a pile-cap, or an upper non-liquefied layer; 730
kB = rotational stiffness of a stable layer underlying a liquefied layer; 731
ki = coefficient for limiting resistance for sliding layer (i = 1) and stable layer (i = 2); 732
ks = modulus of subgrade reaction for piles in moving soil, ks < k; 733
kθ = rotational stiffness of a pile-cap, or a non-liquefied layer on liquefied layer; 734
l = embedded pile length; 735
lm = thickness of an upper moving soil layer; 736
MA, MB = constraint moment at the top and bottom of a liquefied layer, respectively. 737
Mi(z) = bending moment at depth z; 738
Mmi
= maximum bending moment within a pile for sliding layer (i = 1) and stable layer (i = 2);; 739
Mo = applied bending moment at ground level; 740
m = ratio of the subgrade modulus of the stable layer over that of the upper sliding layer; m = 741
Kp/Ka, ratio of coefficient of passive earth pressure (Kp) over that of active earth pressure (Ka) for 742
progressively sliding soil; 743
Pt = vertical load on passive piles during model tests; 744
p = on-pile force per unit length, and p = pllm/l; 745
pl = value of limiting force per unit length pu at the depth of pile-tip level; 746
pu = limiting (maximums) force per unit length; 747
p(z) = resistance force per unit length at the depth z; 748
pi(z) = net force per unit length at the depth z (i =1, 2 for upper and lower layer, respectively); 749
su( us~ ) = undrained shear strength of soil (average s
u over a maximum slip depth anticipated); 750
Tm = maximum shear force induced in a passive pile; 751
T(z), Ti(z) = shear force at depth z; 752
wg = pile-deflection at ground level; 753
ws = soil movement in model pile tests; 754
gw = wgks/p, normalised pile-displacement at ground level; 755
w(z),w′(z) = deflection and rotation at depth z; 756
z, z = depth and the normalised depth z/l, respectively; 757
zm, zmi = depth of maximum bending moment (i = 1, 2); 758
zmt = depth for maximum shear force Tm; 759
α = a parameter to cater for impact of soil movement profile and distance from piles; 760
γs = a unit weight of the soil; 761
λ = ratio of thickness of lower stable layer over sliding layer; 762
φ = angle of internal friction; 763
ωr = rotation angle of pile at ground-level 764
Page 23 of 48
Nonlinear response of laterally loaded rigid piles in sliding soil Wei Dong Guo (2014)
22
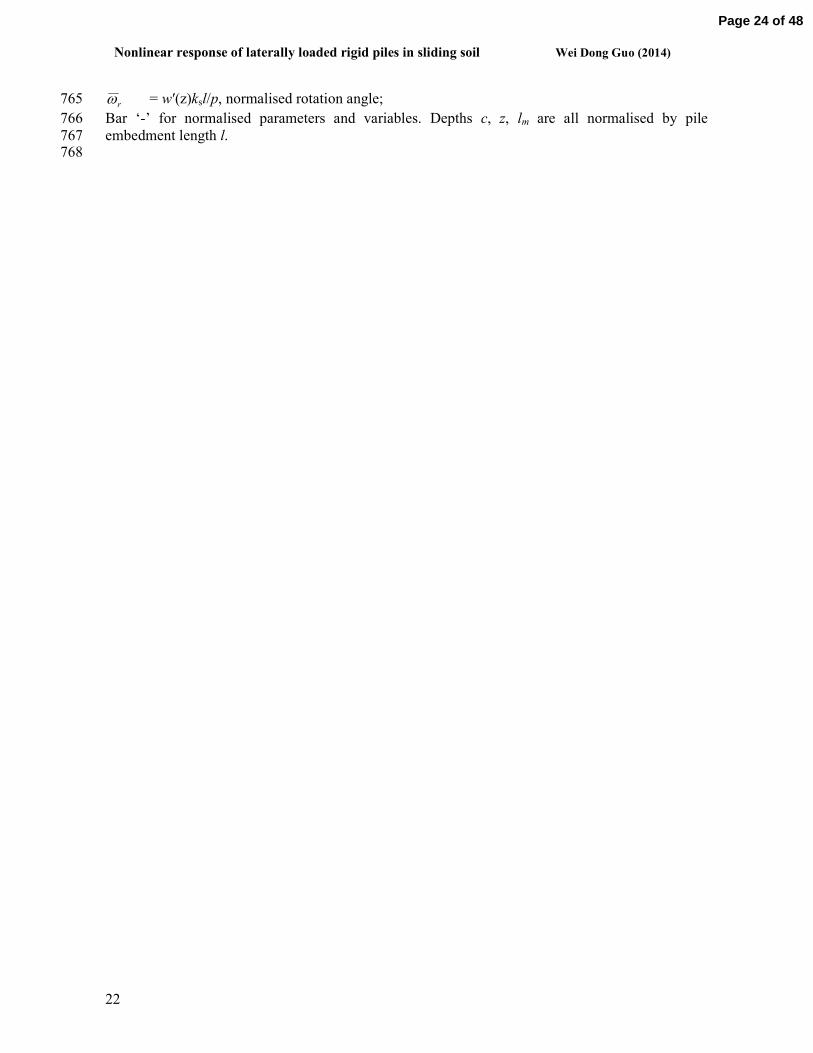
rω = w′(z)ksl/p, normalised rotation angle; 765
Bar ‘-’ for normalised parameters and variables. Depths c, z, lm are all normalised by pile 766
embedment length l. 767 768
Page 24 of 48
Nonlinear response of laterally loaded rigid piles in sliding soil Wei Dong Guo (2014)
23
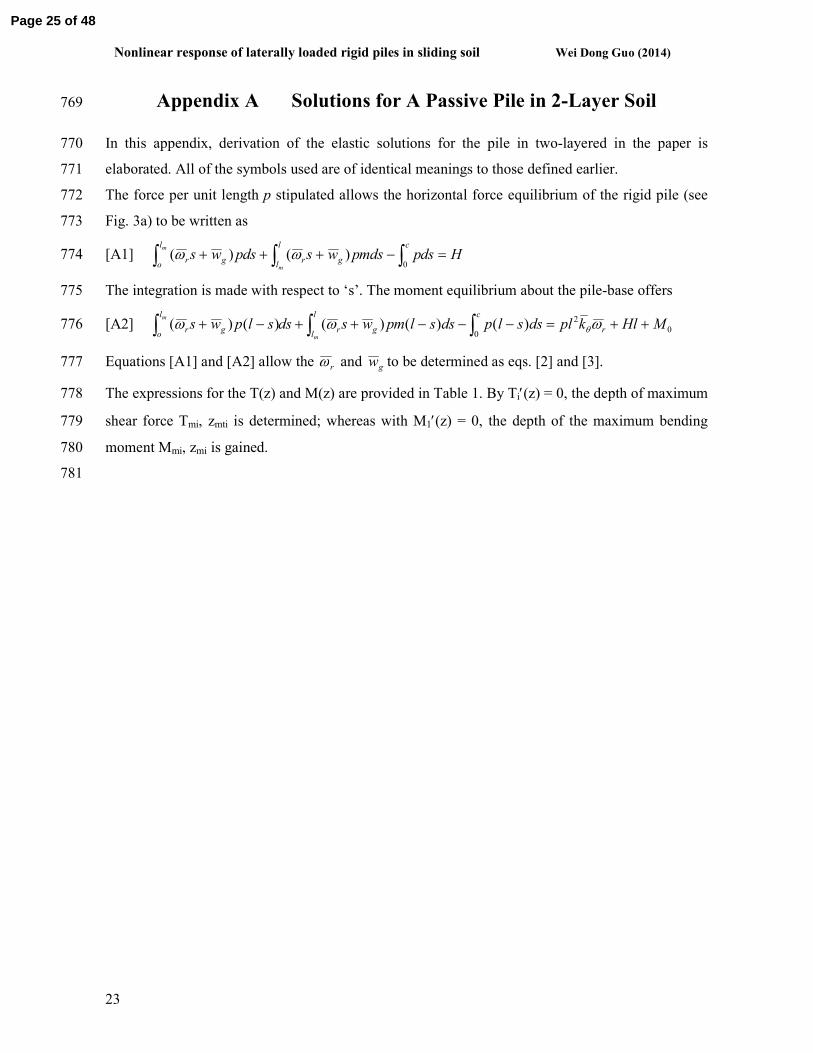
Appendix A Solutions for A Passive Pile in 2-Layer Soil 769
In this appendix, derivation of the elastic solutions for the pile in two-layered in the paper is 770
elaborated. All of the symbols used are of identical meanings to those defined earlier. 771
The force per unit length p stipulated allows the horizontal force equilibrium of the rigid pile (see 772
Fig. 3a) to be written as 773
[A1] Hdspmdspwsdspwscl
lgr
l
ogr
m
m
=−+++ ∫∫∫ 0)()( ωω 774
The integration is made with respect to ‘s’. The moment equilibrium about the pile-base offers 775
[A2] 0
2
0)()()()()( MHlkpldsslpdsslmpwsdsslpws r
cl
lgr
l
ogr
m
m
++=−−−++−+ ∫∫∫ ωωω θ 776
Equations [A1] and [A2] allow the rω and gw to be determined as eqs. [2] and [3]. 777
The expressions for the T(z) and M(z) are provided in Table 1. By Ti′(z) = 0, the depth of maximum 778
shear force Tmi, zmti is determined; whereas with M1′(z) = 0, the depth of the maximum bending 779
moment Mmi, zmi is gained. 780
781
Page 25 of 48
Nonlinear response of laterally loaded rigid piles in sliding soil Wei Dong Guo (2014)
24
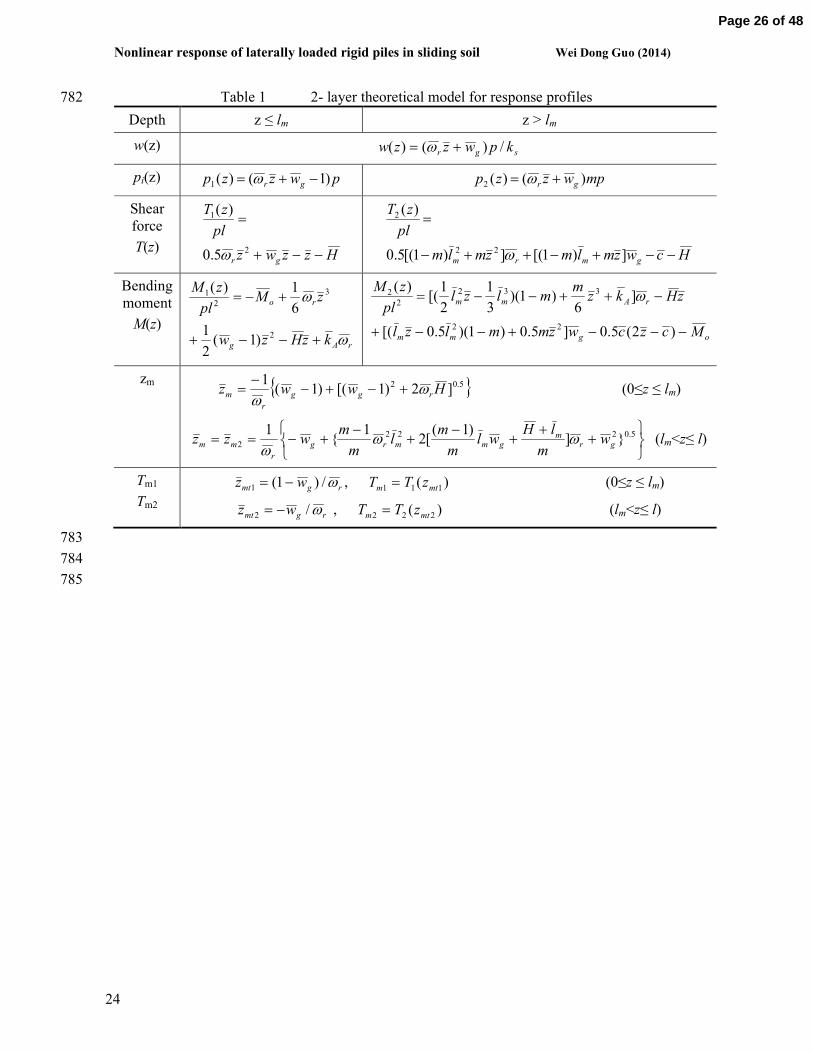
Table 1 2- layer theoretical model for response profiles 782
Depth z ≤ lm z > lm
w(z) sgr kpwzzw /)()( += ω
pi(z) pwzzp gr )1()(1 −+= ω mpwzzp gr )()(2 += ω
Shear
force
T(z) Hzzwz
pl
zT
gr −−+
=
2
1
5.0
)(
ω
Hcwzmlmzmlm
pl
zT
gmrm −−+−++−
=
])1[(])1[(5.0
)(
22
2
ω
Bending
moment
M(z)
rAg
ro
kzHzw
zMpl
zM
ω
ω
+−−+
+−=
2
3
2
1
)1(2
1
6
1)(
ogmm
rAmm
Mczcwzmmlzl
zHkzm
mlzlpl
zM
−−−+−−+
−++−−=
)2(5.0]5.0)1)(5.0[(
]6
)1)(3
1
2
1[(
)(
22
332
2
2 ω
zm { }5.02 ]2)1[()1(1
Hwwz rgg
r
m ωω
+−+−−
= (0≤z ≤ lm)
++
+−
+−
+−== 5.0222
2 }])1(
[21
{1
grm
gmmrg
r
mm wm
lHwl
m
ml
m
mwzz ωω
ω
(lm<z≤ l)
Tm1
Tm2 rgmt wz ω/)1(1 −= ,
)( 111 mtm zTT =
(0≤z ≤ lm)
rgmt wz ω/2 −= , )( 222 mtm zTT = (lm<z≤ l)
783
784
785
Page 26 of 48
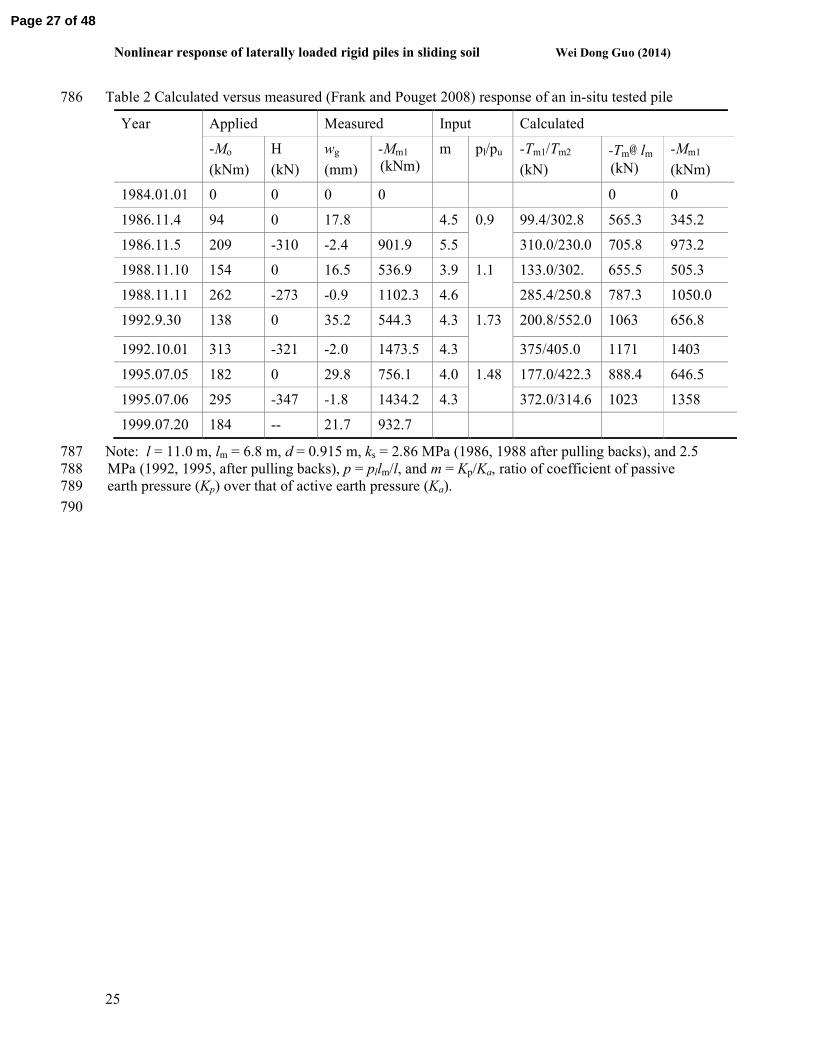
Nonlinear response of laterally loaded rigid piles in sliding soil Wei Dong Guo (2014)
25
Table 2 Calculated versus measured (Frank and Pouget 2008) response of an in-situ tested pile 786
Year Applied Measured Input Calculated
-Mo
(kNm)
H
(kN)
wg
(mm)
-Mm1
(kNm)
m pl/pu -Tm1/Tm2
(kN)
-Tm@ lm
(kN)
-Mm1
(kNm)
1984.01.01 0 0 0 0 0 0
1986.11.4 94 0 17.8 4.5 0.9
99.4/302.8 565.3 345.2
1986.11.5 209 -310 -2.4 901.9 5.5 310.0/230.0 705.8 973.2
1988.11.10 154 0 16.5 536.9 3.9 1.1
133.0/302. 655.5 505.3
1988.11.11 262 -273 -0.9 1102.3 4.6 285.4/250.8 787.3 1050.0
1992.9.30 138 0 35.2 544.3 4.3 1.73
200.8/552.0 1063 656.8
1992.10.01 313 -321 -2.0 1473.5 4.3 375/405.0 1171 1403
1995.07.05 182 0 29.8 756.1 4.0 1.48 177.0/422.3 888.4 646.5
1995.07.06 295 -347 -1.8 1434.2 4.3 372.0/314.6 1023 1358
1999.07.20 184 -- 21.7 932.7
Note: l = 11.0 m, lm = 6.8 m, d = 0.915 m, ks = 2.86 MPa (1986, 1988 after pulling backs), and 2.5 787
MPa (1992, 1995, after pulling backs), p = pllm/l, and m = Kp/Ka, ratio of coefficient of passive 788
earth pressure (Kp) over that of active earth pressure (Ka). 789
790
Page 27 of 48
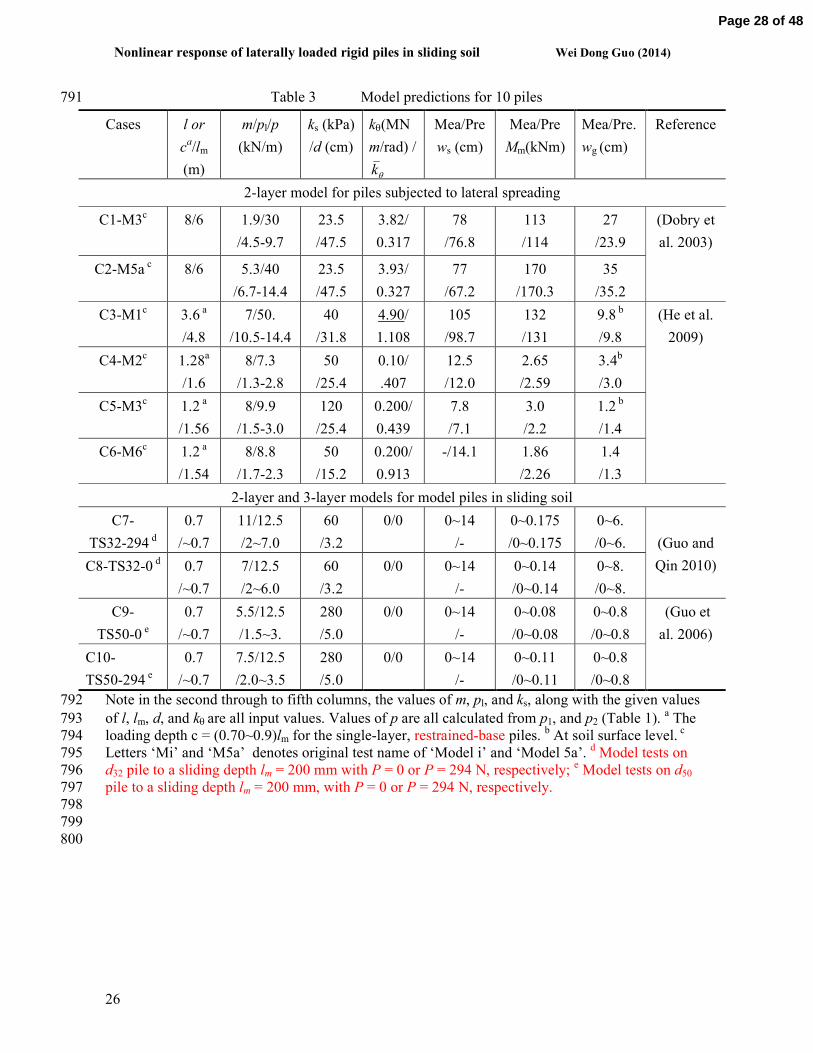
Nonlinear response of laterally loaded rigid piles in sliding soil Wei Dong Guo (2014)
26
Table 3 Model predictions for 10 piles 791
Cases l or
ca/lm
(m)
m/pl/p
(kN/m)
ks (kPa)
/d (cm)
kθ(MN
m/rad) /
θk
Mea/Pre
ws (cm)
Mea/Pre
Mm(kNm)
Mea/Pre.
wg (cm)
Reference
2-layer model for piles subjected to lateral spreading
C1-M3c 8/6 1.9/30
/4.5-9.7
23.5
/47.5
3.82/
0.317
78
/76.8
113
/114
27
/23.9
(Dobry et
al. 2003)
C2-M5a c 8/6 5.3/40
/6.7-14.4
23.5
/47.5
3.93/
0.327
77
/67.2
170
/170.3
35
/35.2
C3-M1c 3.6
a
/4.8
7/50.
/10.5-14.4
40
/31.8
4.90/
1.108
105
/98.7
132
/131
9.8 b
/9.8
(He et al.
2009)
C4-M2c 1.28
a
/1.6
8/7.3
/1.3-2.8
50
/25.4
0.10/
.407
12.5
/12.0
2.65
/2.59
3.4b
/3.0
C5-M3c 1.2
a
/1.56
8/9.9
/1.5-3.0
120
/25.4
0.200/
0.439
7.8
/7.1
3.0
/2.2
1.2 b
/1.4
C6-M6c 1.2
a
/1.54
8/8.8
/1.7-2.3
50
/15.2
0.200/
0.913
-/14.1 1.86
/2.26
1.4
/1.3
2-layer and 3-layer models for model piles in sliding soil
C7-
TS32-294 d
0.7
/~0.7
11/12.5
/2~7.0
60
/3.2
0/0 0~14
/-
0~0.175
/0~0.175
0~6.
/0~6.
(Guo and
Qin 2010) C8-TS32-0 d
0.7
/~0.7
7/12.5
/2~6.0
60
/3.2
0/0 0~14
/-
0~0.14
/0~0.14
0~8.
/0~8.
C9-
TS50-0 e
0.7
/~0.7
5.5/12.5
/1.5~3.
280
/5.0
0/0 0~14
/-
0~0.08
/0~0.08
0~0.8
/0~0.8
(Guo et
al. 2006)
C10-
TS50-294 e
0.7
/~0.7
7.5/12.5
/2.0~3.5
280
/5.0
0/0 0~14
/-
0~0.11
/0~0.11
0~0.8
/0~0.8
Note in the second through to fifth columns, the values of m, pl, and ks, along with the given values 792
of l, lm, d, and kθ are all input values. Values of p are all calculated from p1, and p2 (Table 1). a The 793
loading depth c = (0.70~0.9)lm for the single-layer, restrained-base piles. b At soil surface level.
c 794
Letters ‘Mi’ and ‘M5a’ denotes original test name of ‘Model i’ and ‘Model 5a’. d Model tests on 795
d32 pile to a sliding depth lm = 200 mm with P = 0 or P = 294 N, respectively; e Model tests on d50 796
pile to a sliding depth lm = 200 mm, with P = 0 or P = 294 N, respectively. 797
798
799
800
Page 28 of 48
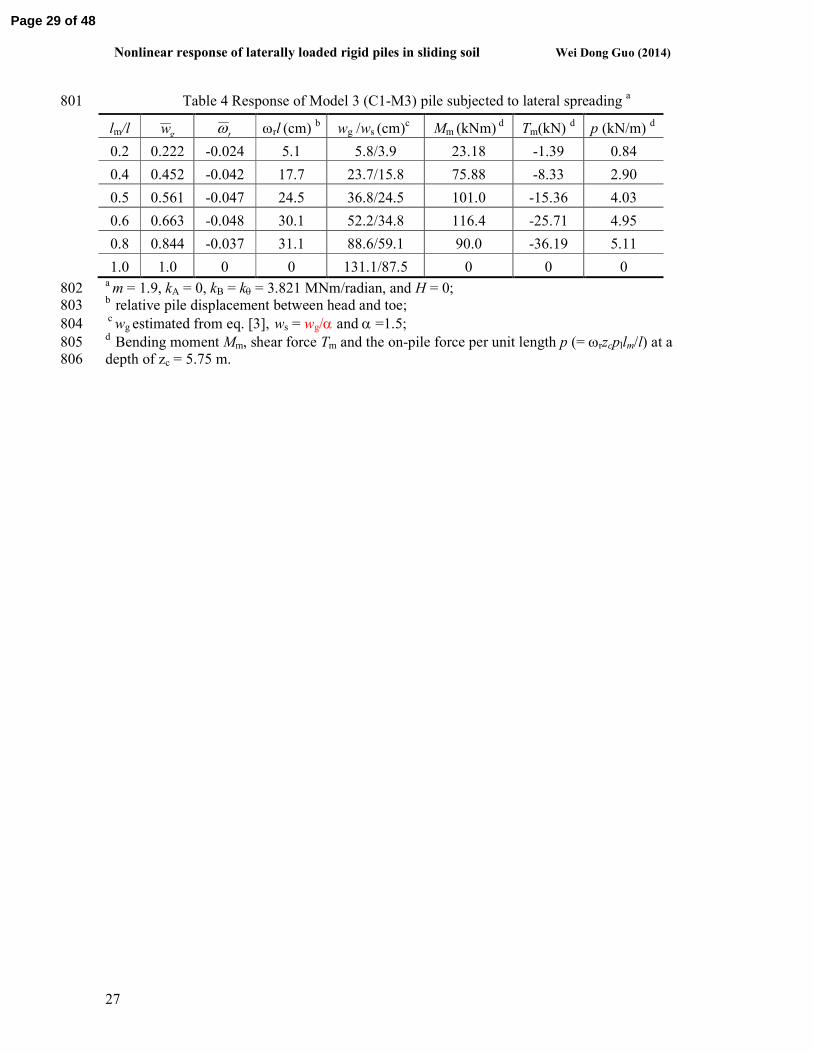
Nonlinear response of laterally loaded rigid piles in sliding soil Wei Dong Guo (2014)
27
Table 4 Response of Model 3 (C1-M3) pile subjected to lateral spreading a 801
lm/l gw rω ωrl (cm)
b wg /ws (cm)
c Mm (kNm)
d Tm(kN)
d p (kN/m)
d
0.2 0.222 -0.024 5.1 5.8/3.9 23.18 -1.39 0.84
0.4 0.452 -0.042 17.7 23.7/15.8 75.88 -8.33 2.90
0.5 0.561 -0.047 24.5 36.8/24.5 101.0 -15.36 4.03
0.6 0.663 -0.048 30.1 52.2/34.8 116.4 -25.71 4.95
0.8 0.844 -0.037 31.1 88.6/59.1 90.0 -36.19 5.11
1.0 1.0 0 0 131.1/87.5 0 0 0 a m = 1.9, kA = 0, kB = kθ = 3.821 MNm/radian, and H = 0; 802
b relative pile displacement between head and toe;
803
c wg
estimated from eq. [3],
ws = wg/α and α =1.5; 804
d Bending moment Mm, shear force Tm and the on-pile force per unit length p (= ωrzcpllm/l) at a 805
depth of zc = 5.75 m.806
Page 29 of 48
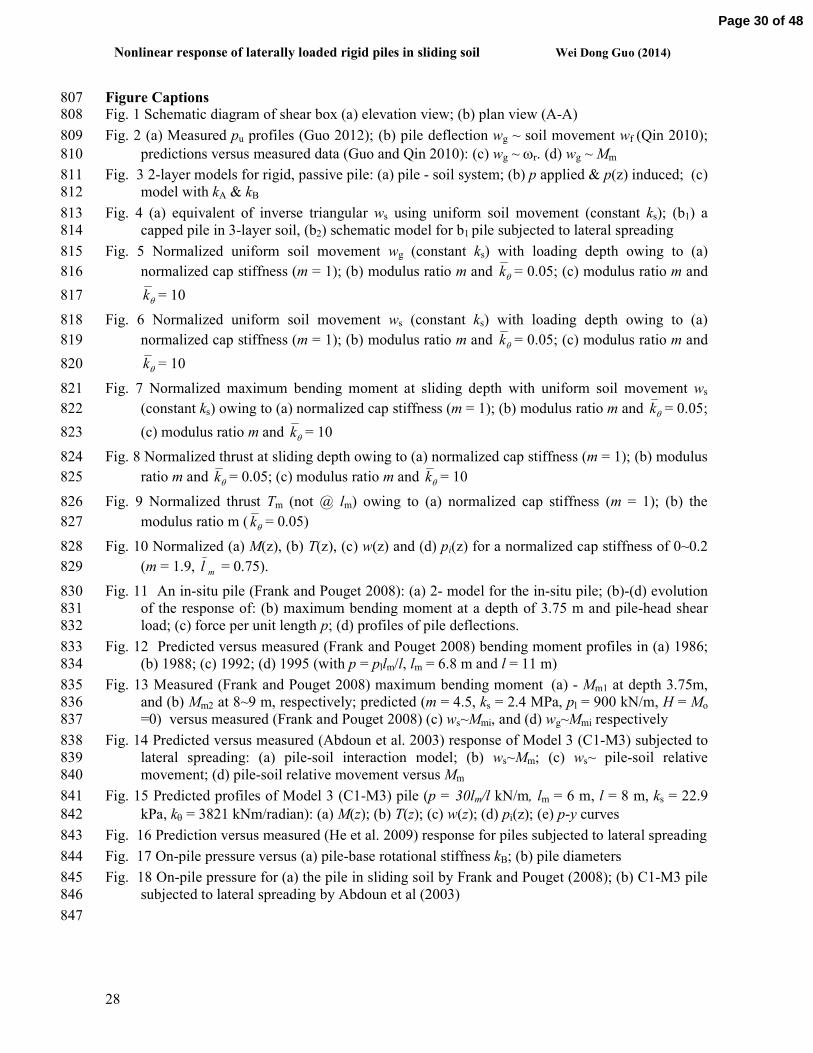
Nonlinear response of laterally loaded rigid piles in sliding soil Wei Dong Guo (2014)
28
Figure Captions 807 Fig. 1 Schematic diagram of shear box (a) elevation view; (b) plan view (A-A) 808
Fig. 2 (a) Measured pu profiles (Guo 2012); (b) pile deflection wg ~ soil movement wf (Qin 2010); 809
predictions versus measured data (Guo and Qin 2010): (c) wg ~ ωr. (d) wg ~ Mm 810
Fig. 3 2-layer models for rigid, passive pile: (a) pile - soil system; (b) p applied & p(z) induced; (c) 811
model with kA & kB 812
Fig. 4 (a) equivalent of inverse triangular ws using uniform soil movement (constant ks); (b1) a 813
capped pile in 3-layer soil, (b2) schematic model for b1 pile subjected to lateral spreading 814
Fig. 5 Normalized uniform soil movement wg (constant ks) with loading depth owing to (a) 815
normalized cap stiffness (m = 1); (b) modulus ratio m and θk = 0.05; (c) modulus ratio m and 816
θk = 10 817
Fig. 6 Normalized uniform soil movement ws (constant ks) with loading depth owing to (a) 818
normalized cap stiffness (m = 1); (b) modulus ratio m and θk = 0.05; (c) modulus ratio m and 819
θk = 10 820
Fig. 7 Normalized maximum bending moment at sliding depth with uniform soil movement ws 821
(constant ks) owing to (a) normalized cap stiffness (m = 1); (b) modulus ratio m and θk = 0.05; 822
(c) modulus ratio m and θk = 10 823
Fig. 8 Normalized thrust at sliding depth owing to (a) normalized cap stiffness (m = 1); (b) modulus 824
ratio m and θk = 0.05; (c) modulus ratio m and θk = 10 825
Fig. 9 Normalized thrust Tm (not @ lm) owing to (a) normalized cap stiffness (m = 1); (b) the 826
modulus ratio m ( θk = 0.05) 827
Fig. 10 Normalized (a) M(z), (b) T(z), (c) w(z) and (d) pi(z) for a normalized cap stiffness of 0~0.2 828
(m = 1.9, ml = 0.75). 829
Fig. 11 An in-situ pile (Frank and Pouget 2008): (a) 2- model for the in-situ pile; (b)-(d) evolution 830
of the response of: (b) maximum bending moment at a depth of 3.75 m and pile-head shear 831
load; (c) force per unit length p; (d) profiles of pile deflections. 832
Fig. 12 Predicted versus measured (Frank and Pouget 2008) bending moment profiles in (a) 1986; 833
(b) 1988; (c) 1992; (d) 1995 (with p = pllm/l, lm = 6.8 m and l = 11 m) 834
Fig. 13 Measured (Frank and Pouget 2008) maximum bending moment (a) - Mm1 at depth 3.75m, 835
and (b) Mm2 at 8~9 m, respectively; predicted (m = 4.5, ks = 2.4 MPa, pl = 900 kN/m, H = Mo 836
=0) versus measured (Frank and Pouget 2008) (c) ws~Mmi, and (d) wg~Mmi respectively 837
Fig. 14 Predicted versus measured (Abdoun et al. 2003) response of Model 3 (C1-M3) subjected to 838
lateral spreading: (a) pile-soil interaction model; (b) ws~Mm; (c) ws~ pile-soil relative 839
movement; (d) pile-soil relative movement versus Mm 840
Fig. 15 Predicted profiles of Model 3 (C1-M3) pile (p = 30lm/l kN/m, lm = 6 m, l = 8 m, ks = 22.9 841
kPa, kθ = 3821 kNm/radian): (a) M(z); (b) T(z); (c) w(z); (d) pi(z); (e) p-y curves 842
Fig. 16 Prediction versus measured (He et al. 2009) response for piles subjected to lateral spreading 843
Fig. 17 On-pile pressure versus (a) pile-base rotational stiffness kB; (b) pile diameters 844
Fig. 18 On-pile pressure for (a) the pile in sliding soil by Frank and Pouget (2008); (b) C1-M3 pile 845
subjected to lateral spreading by Abdoun et al (2003) 846
847
Page 30 of 48
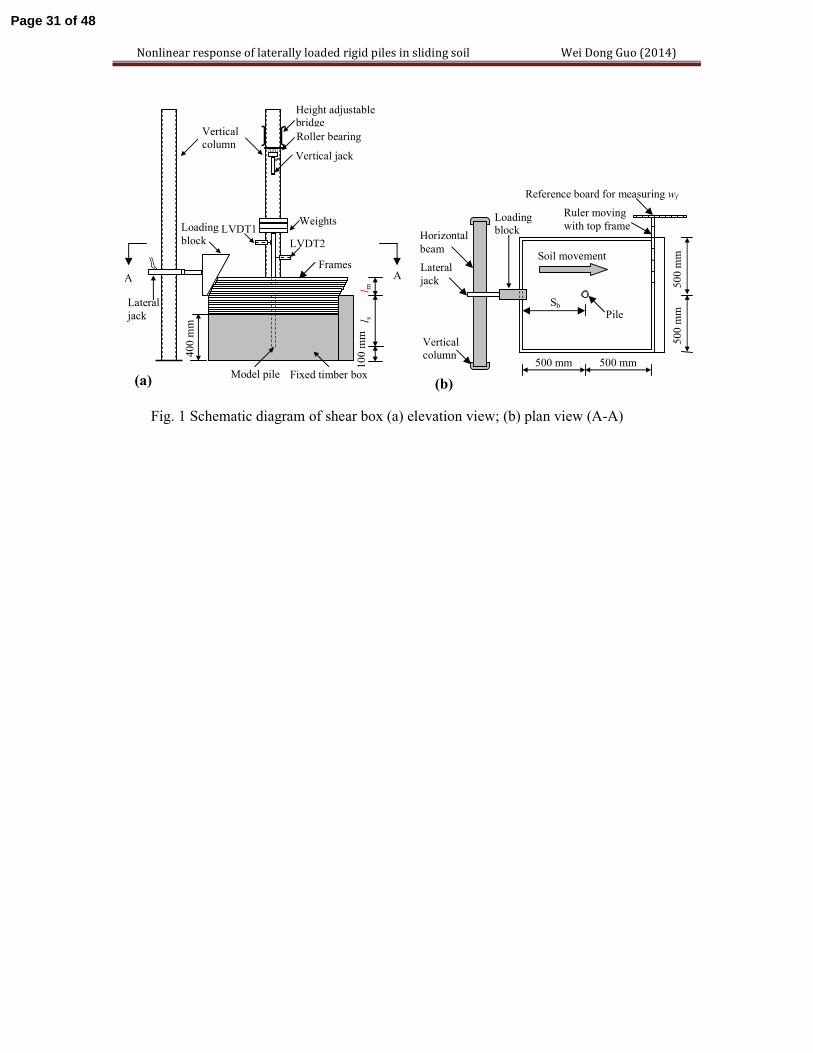
Nonlinear response of laterally loaded rigid piles in sliding soil Wei Dong Guo (2014)
(a) (b)
Loading
block
Vertical
column
Model pile Fixed timber box
Roller bearing
Lateral
jack
LVDT1
Vertical jack
l s
l m
400 m
m
Weights
Height adjustable bridge
Frames
LVDT2
100 m
m
500 m
m
500 m
m
500 mm
Soil movement
Loading block
500 mm
Ruler moving
with top frame
Pile
Lateral
jack
Horizontal
beam
Sb
Reference board for measuring wf
Vertical
column
A A
Fig. 1 Schematic diagram of shear box (a) elevation view; (b) plan view (A-A)
Page 31 of 48
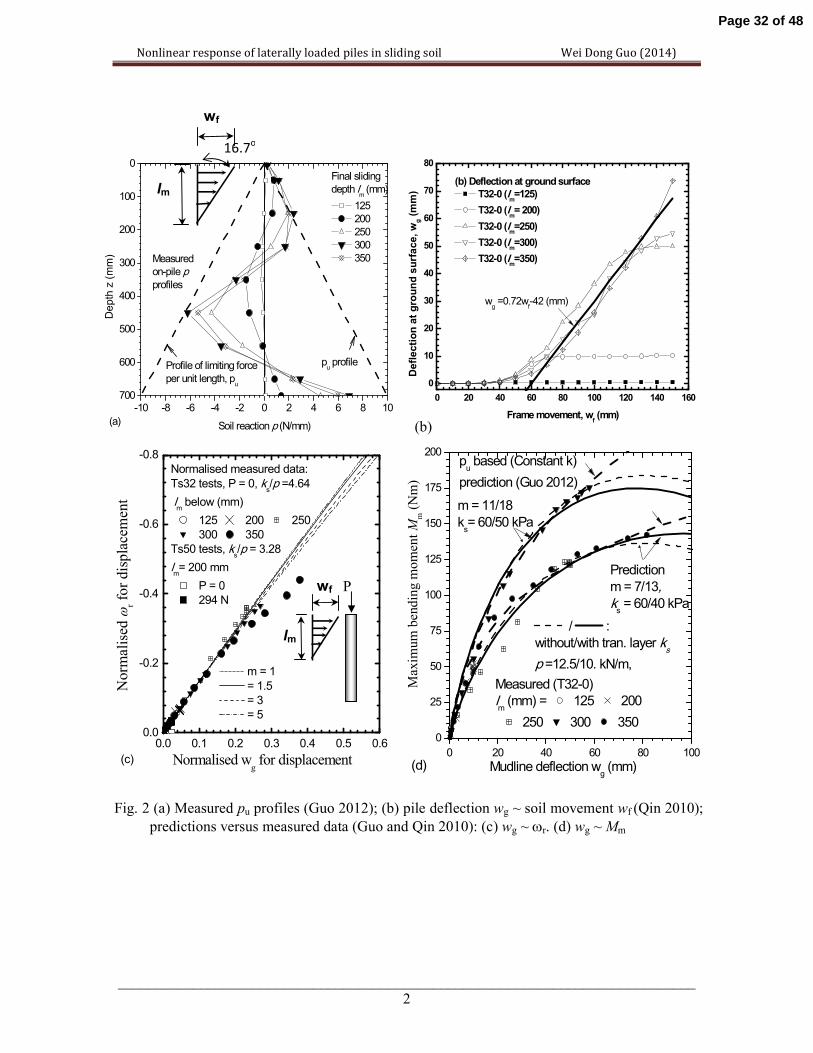
Nonlinear response of laterally loaded piles in sliding soil Wei Dong Guo (2014)
_____________________________________________________________________________
2
0.0 0.1 0.2 0.3 0.4 0.5 0.60.0
-0.2
-0.4
-0.6
-0.8
m = 1
= 1.5
= 3
= 5
Normalised measured data:
Ts32 tests, P = 0, ks/p =4.64
lm below (mm)
125 200 250
300 350
Ts50 tests, ks/p = 3.28
lm= 200 mm
P = 0
294 N
Norm
alised ω
r for displacement
Normalised wg for displacement(c)
Fig. 2 (a) Measured pu profiles (Guo 2012); (b) pile deflection wg ~ soil movement wf (Qin 2010);
predictions versus measured data (Guo and Qin 2010): (c) wg ~ ωr. (d) wg ~ Mm
(b)
wf
16.7o
lm
0 20 40 60 80 100
0
25
50
75
100
125
150
175
200
/ :
without/with tran. layer ks
p =12.5/10. kN/m,
pu based (Constant k)
prediction (Guo 2012)
Measured (T32-0)
lm (mm) = 125 200
250 300 350
Maxim
um bending m
oment M
m (Nm)
Mudline deflection wg (mm)
m = 11/18
ks= 60/50 kPa
Prediction
m = 7/13,ks = 60/40 kPa
(d)
700
600
500
400
300
200
100
0
-10 -8 -6 -4 -2 0 2 4 6 8 10
pu profile
Measured
on-pile pprofiles
(a)
Soil reaction p (N/mm)
Depth z (mm)
Final sliding
depth lm (mm)
125
200
250
300
350
Profile of limiting force
per unit length, pu
0 20 40 60 80 100 120 140 160
0
10
20
30
40
50
60
70
80
Deflection at ground surface, w
g (mm)
Frame movement, wf (mm)
(b) Deflection at ground surface
T32-0 (lm=125)
T32-0 (lm= 200)
T32-0 (lm=250)
T32-0 (lm=300)
T32-0 (lm=350)
wg =0.72w
f-42 (mm)
P wf
lm
Page 32 of 48
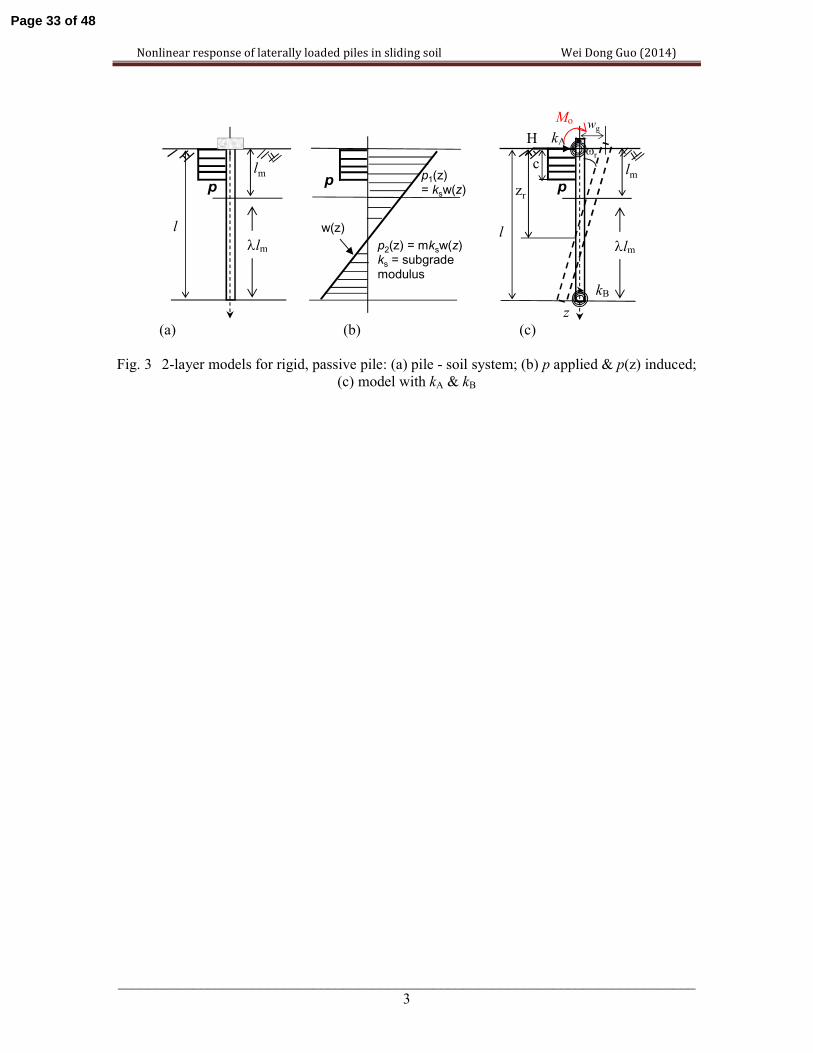
Nonlinear response of laterally loaded piles in sliding soil Wei Dong Guo (2014)
_____________________________________________________________________________
3
w(z)
p1(z) = ksw(z)
p
p2(z) = mksw(z)ks = subgrade modulus
z
wg
l
lm
zrp
ωr
c
l
lmp
(a) (b) (c)
Fig. 3 2-layer models for rigid, passive pile: (a) pile - soil system; (b) p applied & p(z) induced;
(c) model with kA & kB
kB
λlm λlm
kA
H
Mo
Page 33 of 48
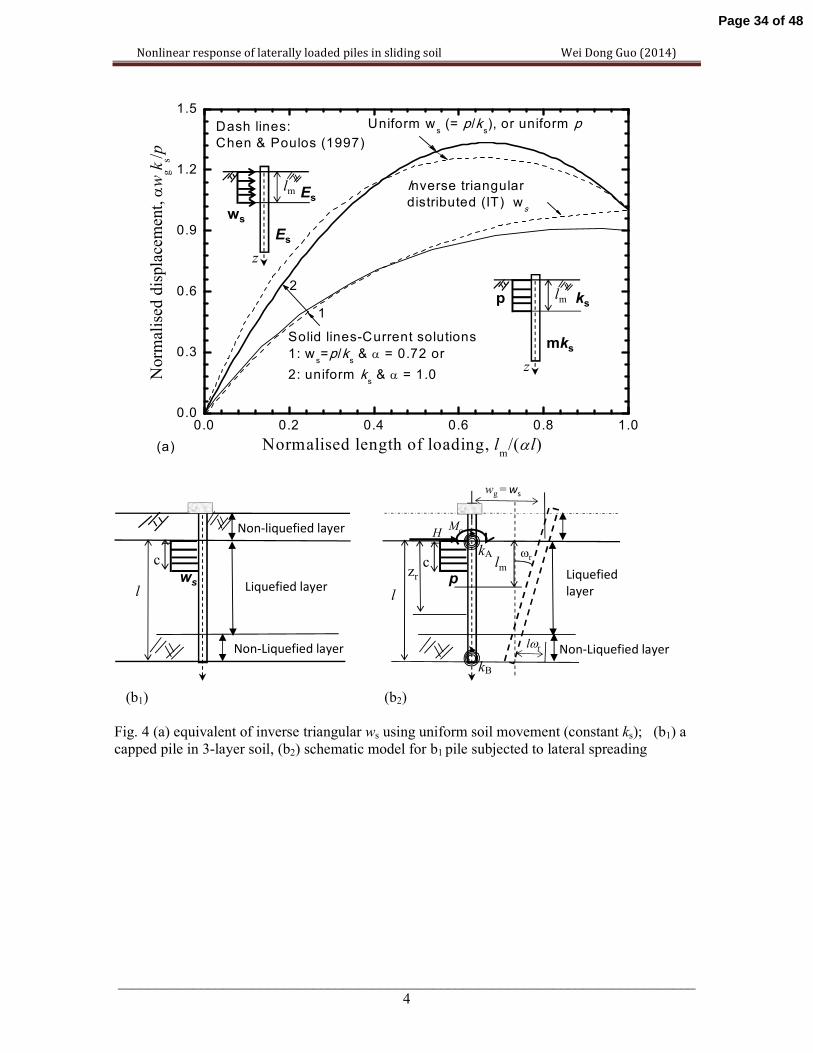
Nonlinear response of laterally loaded piles in sliding soil Wei Dong Guo (2014)
_____________________________________________________________________________
4
ws
c
Liquefied layer
Non-liquefied layer
Non-Liquefied layer
l
l
wg =ws
lmzr p
ωrc
lωr
H
Liquefied
layer
Non-Liquefied layer
Mo
(b1) (b2)
Fig. 4 (a) equivalent of inverse triangular ws using uniform soil movement (constant ks); (b1) a
capped pile in 3-layer soil, (b2) schematic model for b1 pile subjected to lateral spreading
0.0 0.2 0.4 0.6 0.8 1.00.0
0.3
0.6
0.9
1.2
1.5
Inverse triangulardistributed (IT) w
s
Dash lines:
Chen & Poulos (1997)
Solid lines-Current solutions
1: ws=p/k
s & α = 0.72 or
2: uniform ks & α = 1.0
Uniform ws (= p/k
s), or uniform p
Norm
alised displacement, αw
gk s/p
Normalised length of loading, lm/(αl)
1
2
(a)
z
lmp ks
mks
z
lm
ws
Es
Es
kA
kB
Page 34 of 48
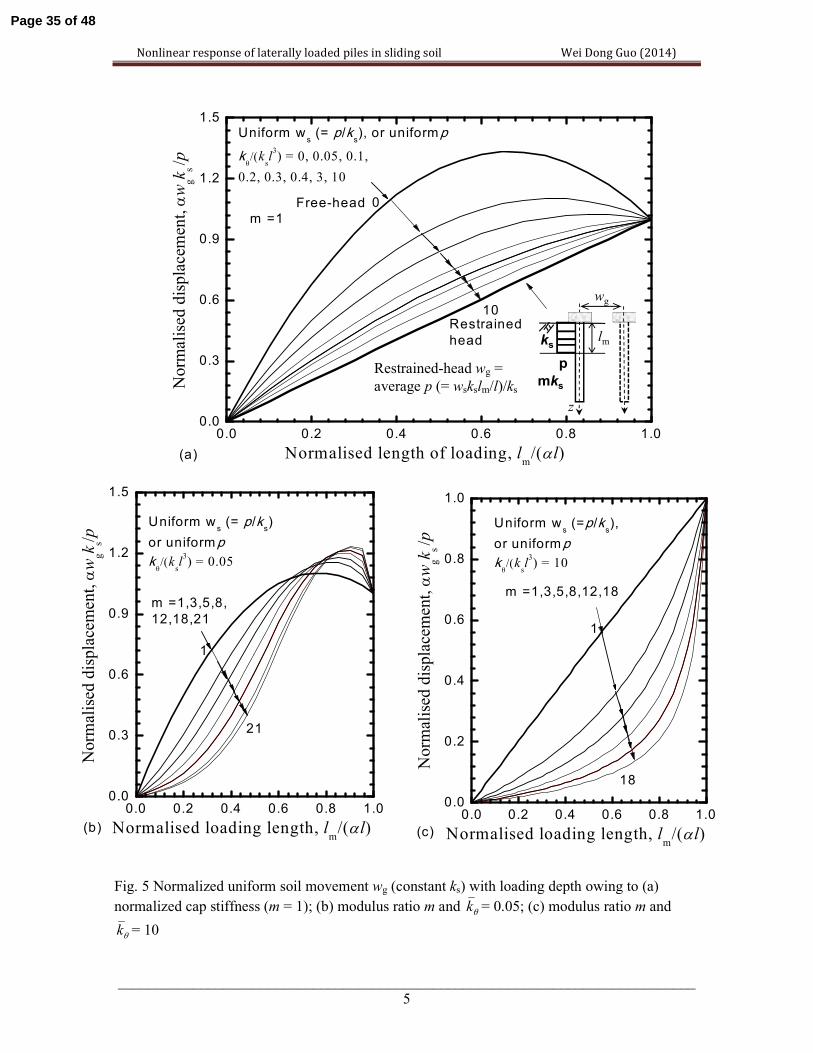
Nonlinear response of laterally loaded piles in sliding soil Wei Dong Guo (2014)
_____________________________________________________________________________
5
Fig. 5 Normalized uniform soil movement wg (constant ks) with loading depth owing to (a)
normalized cap stiffness (m = 1); (b) modulus ratio m and θk = 0.05; (c) modulus ratio m and
θk = 10
0.0 0.2 0.4 0.6 0.8 1.00.0
0.3
0.6
0.9
1.2
1.5
Restrained
head
Uniform ws (= p/k
s), or uniformp
kθ/(k
sl3) = 0, 0.05, 0.1,
0.2, 0.3, 0.4, 3, 10
Norm
alised displacement, αw
gk s
/p
Normalised length of loading, lm/(αl)
0
10
(a)
m =1
Free-head
0.0 0.2 0.4 0.6 0.8 1.00.0
0.3
0.6
0.9
1.2
1.5
Uniform ws (= p/k
s)
or uniformp
kθ/(k
sl3) = 0.05
Norm
alised displacement, αw
gk s/p
Normalised loading length, lm/(αl)
21
(b)
m =1,3,5,8,
12,18,21
1
0.0 0.2 0.4 0.6 0.8 1.00.0
0.2
0.4
0.6
0.8
1.0
Uniform ws (=p/k
s),
or uniformp
kθ/(k
sl3) = 10
Norm
alised displacement, αw
gk s
/p
Normalised loading length, lm/(αl)
18
(c)
m =1,3,5,8,12,18
1
z
lm
p
ks
mks
wg
Restrained-head wg =
average p (= wskslm/l)/ks
Page 35 of 48
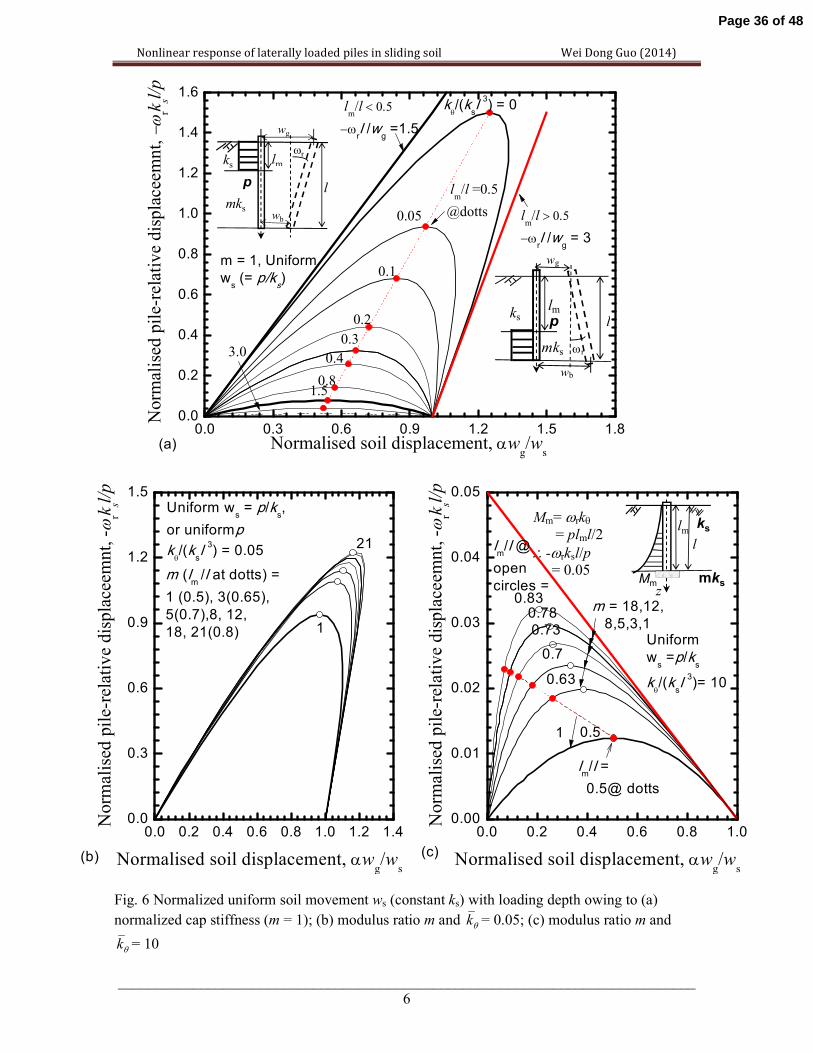
Nonlinear response of laterally loaded piles in sliding soil Wei Dong Guo (2014)
_____________________________________________________________________________
6
Fig. 6 Normalized uniform soil movement ws (constant ks) with loading depth owing to (a)
normalized cap stiffness (m = 1); (b) modulus ratio m and θk = 0.05; (c) modulus ratio m and
θk = 10
0.0
0.2
0.4
0.6
0.8
1.0
1.2
1.4
1.6
0.0 0.3 0.6 0.9 1.2 1.5 1.8
lm/l > 0.5
−ωrl /w
g = 3
3.0
1.50.8
0.3
0.4
0.2
0.1
0.05
kθ/(k
sl 3) = 0
lm/l =0.5
@dotts
m = 1, Uniform
ws (= p/k
s)
Normalised soil displacement, αwg/w
s
Norm
alised pile-relative displaceem
nt, −
ωrksl/p
(a)
lm/l < 0.5
−ωrl /w
g =1.5
0.0 0.2 0.4 0.6 0.8 1.0 1.2 1.40.0
0.3
0.6
0.9
1.2
1.5
m (lm /l at dotts) =
1 (0.5), 3(0.65),
5(0.7),8, 12,
18, 21(0.8)
Uniform ws = p/k
s,
or uniformp
kθ/(k
sl 3) = 0.05
Norm
alised pile-relative displaceem
nt, -
ωrksl/p
Normalised soil displacement, αwg/w
s(b)
1
21
0.0 0.2 0.4 0.6 0.8 1.00.00
0.01
0.02
0.03
0.04
0.05
lm/l @
open
circles =
lm/l =
0.5@ dotts
m = 18,12,
8,5,3,1Uniform
ws =p/k
s
kθ/(k
sl 3)= 10
Norm
alised pile-relative displaceem
nt, -
ωrksl/p
Normalised soil displacement, αwg/w
s
(c)
1
0.830.78
0.73
0.7
0.63
0.5
wg
l
lmks
p
ωr
mkswb
Mm= ωrkθ
= plml/2
∴-ωrksl/p
= 0.05
wg
llmks p
ωrmks
wb
z
lm ks
Mm mks
l
Page 36 of 48
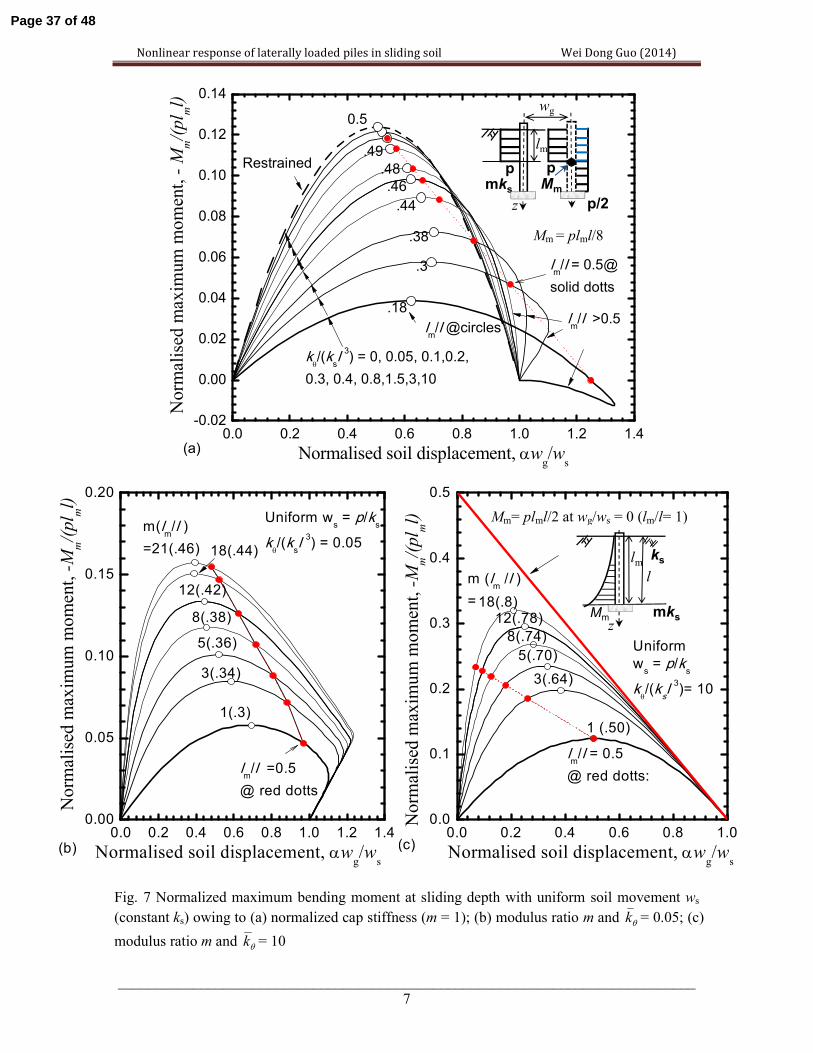
Nonlinear response of laterally loaded piles in sliding soil Wei Dong Guo (2014)
_____________________________________________________________________________
7
Fig. 7 Normalized maximum bending moment at sliding depth with uniform soil movement ws
(constant ks) owing to (a) normalized cap stiffness (m = 1); (b) modulus ratio m and θk = 0.05; (c)
modulus ratio m and θk = 10
-0.02
0.00
0.02
0.04
0.06
0.08
0.10
0.12
0.14
0.0 0.2 0.4 0.6 0.8 1.0 1.2 1.4
lm/l @circles
.49
.46
.44
.48
kθ/(k
sl 3) = 0, 0.05, 0.1,0.2,
0.3, 0.4, 0.8,1.5,3,10
lm/l = 0.5@
solid dotts
Normalised soil displacement, αwg/w
s
Norm
alised m
axim
um m
oment, - M
m/(pl ml)
(a)
Restrained
.18
.3
.38
0.5
lm/l >0.5
0.00
0.05
0.10
0.15
0.20
0.0 0.2 0.4 0.6 0.8 1.0 1.2 1.4
lm/l =0.5
@ red dotts
3(.34)
1(.3)
5(.36)
8(.38)
12(.42)
18(.44)
m(lm/l )
=21(.46)
Uniform ws = p/k
s
kθ/(k
sl 3) = 0.05
Normalised soil displacement, αwg/w
s
Norm
alised m
axim
um m
oment, -Mm/(pl ml)
(b)
0.0
0.1
0.2
0.3
0.4
0.5
0.0 0.2 0.4 0.6 0.8 1.0
lm/l = 0.5
@ red dotts:
8(.74)
18(.8)
3(.64)
1 (.50)
5(.70)
12(.78)
m (lm /l )
=
Uniform
ws = p/k
s
kθ/(k
sl 3)= 10
Normalised soil displacement, αwg/w
s
Norm
alised m
axim
um m
oment, -Mm/(pl ml)
(c)
Mm= plml/2 at wg/ws = 0 (lm/l= 1)
Mm = plml/8
wg
z
lm
pmks
p
p/2
Mm
z
lm ks
Mm mks
l
Page 37 of 48
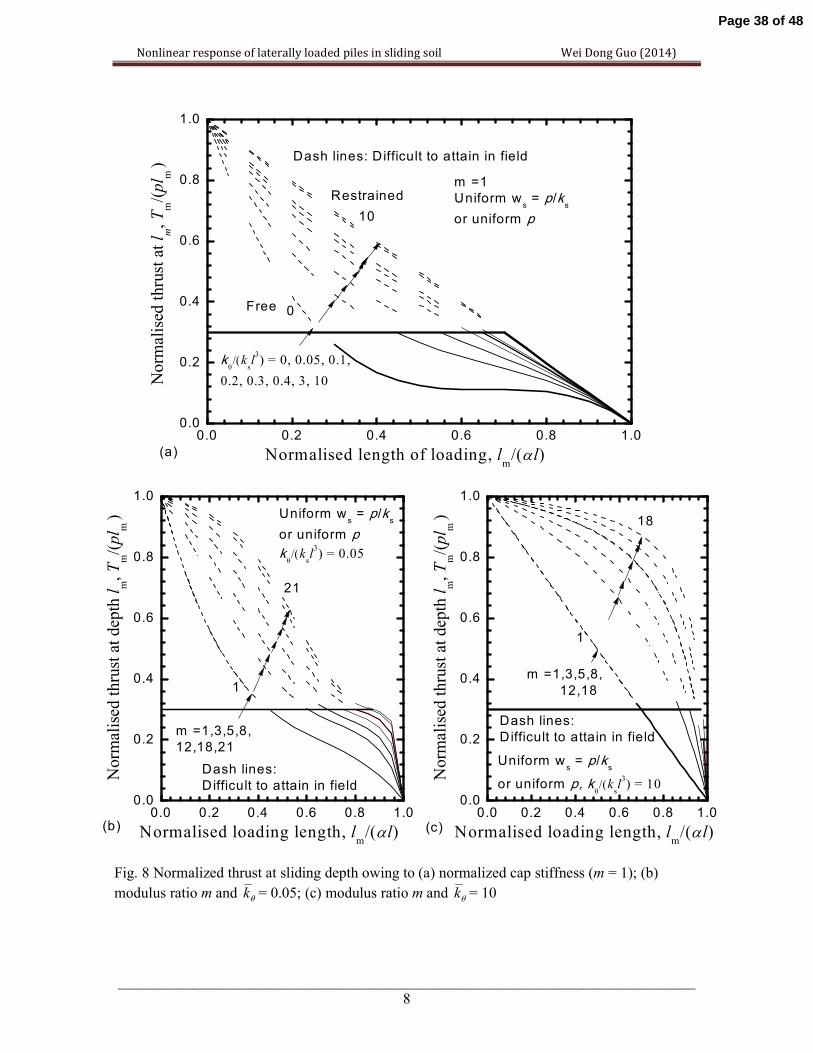
Nonlinear response of laterally loaded piles in sliding soil Wei Dong Guo (2014)
_____________________________________________________________________________
8
Fig. 8 Normalized thrust at sliding depth owing to (a) normalized cap stiffness (m = 1); (b)
modulus ratio m and θk = 0.05; (c) modulus ratio m and θk = 10
0.0 0.2 0.4 0.6 0.8 1.00.0
0.2
0.4
0.6
0.8
1.0
21
Uniform ws = p/k
s
or uniform p
kθ/(k
sl3) = 0.05
Norm
alised thrust at depth lm, Tm/(pl m
)
Normalised loading length, lm/(αl)
1
(b)
m =1,3,5,8,
12,18,21
Dash lines:
Difficult to attain in field
0.0 0.2 0.4 0.6 0.8 1.00.0
0.2
0.4
0.6
0.8
1.0
m =1
Uniform ws = p/k
s
or uniform p
Free 0
kθ/(k
sl3) = 0, 0.05, 0.1,
0.2, 0.3, 0.4, 3, 10
Norm
alised thrust at l m, Tm/(pl m
)
Normalised length of loading, lm/(αl)(a)
10
Restrained
Dash lines: Difficult to attain in field
0.0 0.2 0.4 0.6 0.8 1.00.0
0.2
0.4
0.6
0.8
1.0
18
Uniform ws = p/k
s
or uniform p, kθ/(k
sl3) = 10
Norm
alised thrust at depth lm, Tm/(pl m
)
Normalised loading length, lm/(αl)
1
(c)
m =1,3,5,8,
12,18
Dash lines:
Difficult to attain in field
Page 38 of 48
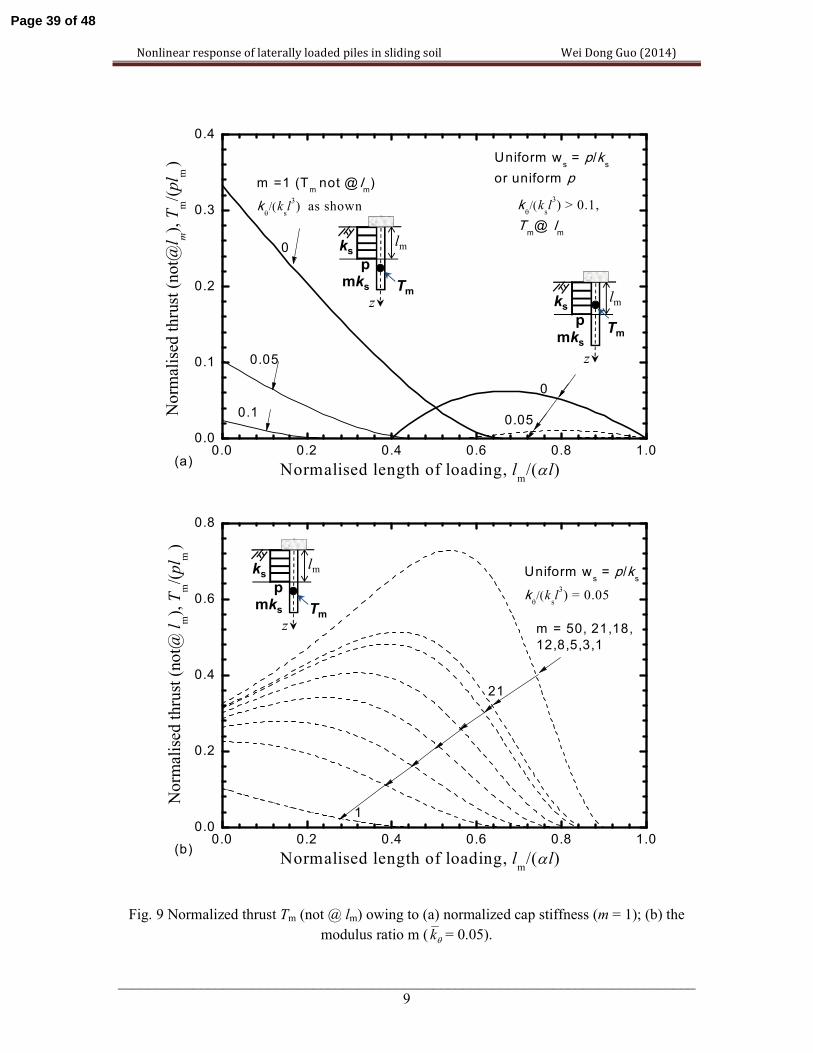
Nonlinear response of laterally loaded piles in sliding soil Wei Dong Guo (2014)
_____________________________________________________________________________
9
Fig. 9 Normalized thrust Tm (not @ lm) owing to (a) normalized cap stiffness (m = 1); (b) the
modulus ratio m ( θk = 0.05).
0.0 0.2 0.4 0.6 0.8 1.00.0
0.1
0.2
0.3
0.4
0.05
0
0.05
0.1
Uniform ws = p/k
s
or uniform p
0
m =1 (Tm not @ l
m)
kθ/(k
sl3) as shown
Norm
alised thrust (not@l m), T
m/(pl m
)
Normalised length of loading, lm/(αl)
(a)
kθ/(k
sl3) > 0.1,
Tm@ l
m
0.0 0.2 0.4 0.6 0.8 1.00.0
0.2
0.4
0.6
0.8
21
Uniform ws = p/k
s
kθ/(k
sl3) = 0.05
Norm
alised thrust (not@
lm), T
m/(pl m
)
Normalised length of loading, lm/(αl)
1
(b)
m = 50, 21,18,
12,8,5,3,1
z
lm
p
ks
mks Tm
z
lm
p
ks
mks Tm
z
lm
p
ks
mksTm
Page 39 of 48
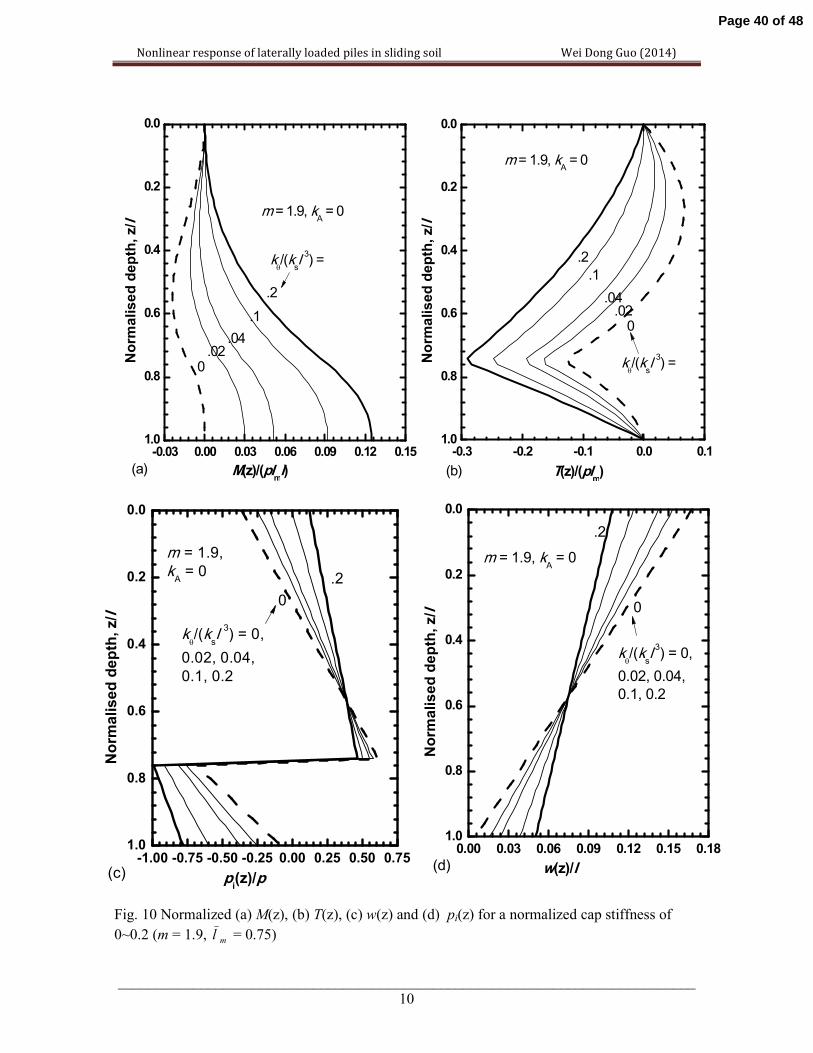
Nonlinear response of laterally loaded piles in sliding soil Wei Dong Guo (2014)
_____________________________________________________________________________
10
Fig. 10 Normalized (a) M(z), (b) T(z), (c) w(z) and (d) pi(z) for a normalized cap stiffness of
0~0.2 (m = 1.9, ml = 0.75)
1.0
0.8
0.6
0.4
0.2
0.0
-0.03 0.00 0.03 0.06 0.09 0.12 0.15
.2
.1
.04
0
M(z)/(plml)
Norm
alised depth, z/l
kθ/(k
sl 3) =
.02
m = 1.9, kA = 0
(a)
1.0
0.8
0.6
0.4
0.2
0.0
-0.3 -0.2 -0.1 0.0 0.1
.2
.1
.04
0
T(z)/(plm)
Norm
alised depth, z/l
kθ/(k
sl 3) =
.02
m = 1.9, kA = 0
(b)
1.0
0.8
0.6
0.4
0.2
0.0
0.00 0.03 0.06 0.09 0.12 0.15 0.18
.2
0
w(z)/l
Norm
alised depth, z/l
kθ/(k
sl 3) = 0,
0.02, 0.04,
0.1, 0.2
m = 1.9, kA = 0
(d)
1.0
0.8
0.6
0.4
0.2
0.0
-1.00 -0.75 -0.50 -0.25 0.00 0.25 0.50 0.75
.2
0
pi(z)/p
Norm
alised depth, z/l
kθ/(k
sl 3) = 0,
0.02, 0.04,
0.1, 0.2
m = 1.9,
kA = 0
(c)
Page 40 of 48
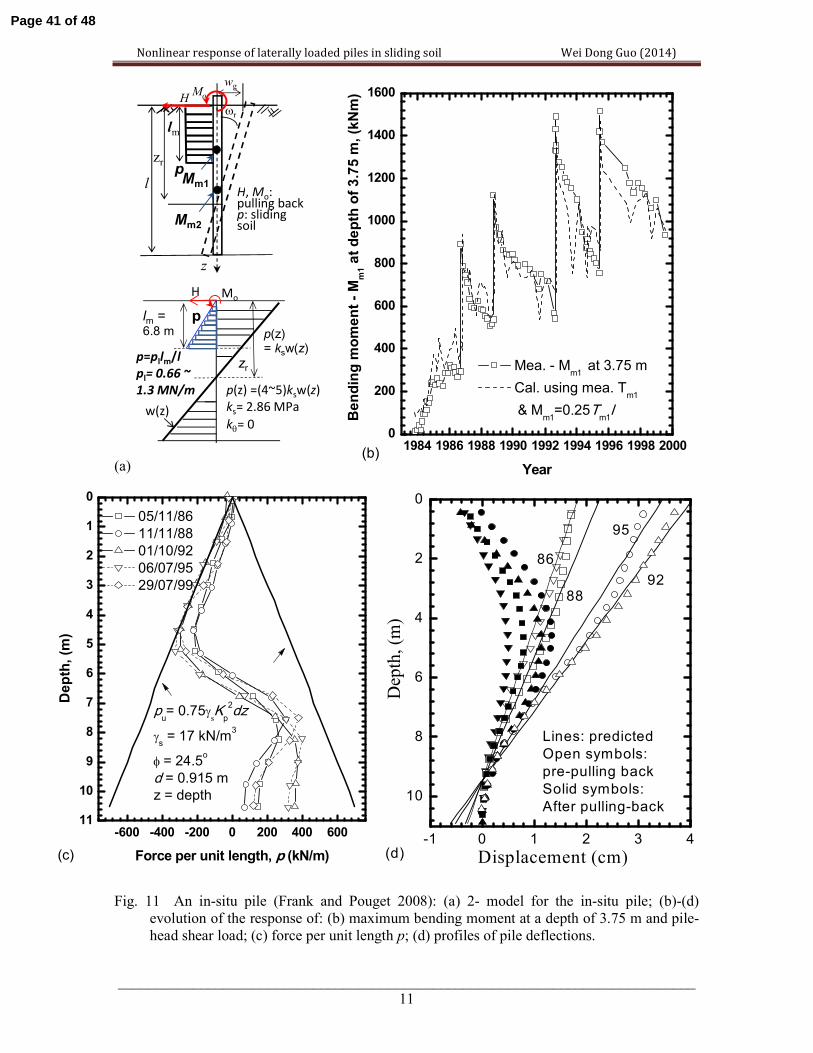
Nonlinear response of laterally loaded piles in sliding soil Wei Dong Guo (2014)
_____________________________________________________________________________
11
(a)
Fig. 11 An in-situ pile (Frank and Pouget 2008): (a) 2- model for the in-situ pile; (b)-(d)
evolution of the response of: (b) maximum bending moment at a depth of 3.75 m and pile-
head shear load; (c) force per unit length p; (d) profiles of pile deflections.
-600 -400 -200 0 200 400 60011
10
9
8
7
6
5
4
3
2
1
0
05/11/86
11/11/88
01/10/92
06/07/95
29/07/99
Depth, (m
)
Force per unit length, p (kN/m)
pu= 0.75γ
sK
p
2dz
γs = 17 kN/m
3
φ = 24.5o
d = 0.915 mz = depth
(c)
1984 1986 1988 1990 1992 1994 1996 1998 20000
200
400
600
800
1000
1200
1400
1600
Mea. - Mm1 at 3.75 m
Cal. using mea. Tm1
& Mm1=0.25T
m1l
Bending m
oment - M
m1 at depth of 3.75 m
, (kNm)
Year(b)
-1 0 1 2 3 4
10
8
6
4
2
0
Depth, (m
)
Displacement (cm)(d)
Lines: predicted
Open symbols:
pre-pulling back
Solid symbols:
After pulling-back
86
88
95
92
H, Mo:pulling backp: sliding soil
wg
z
l
zrp
ωr
lm
HMo
Mm1
Mm2
p(z) =(4~5)ksw(z)
ks= 2.86 MPa
kθ= 0
pp(z) = ksw(z)p=pllm/l
pl= 0.66 ~
1.3 MN/m
w(z)
lm =6.8 m
zr
MoH
Page 41 of 48
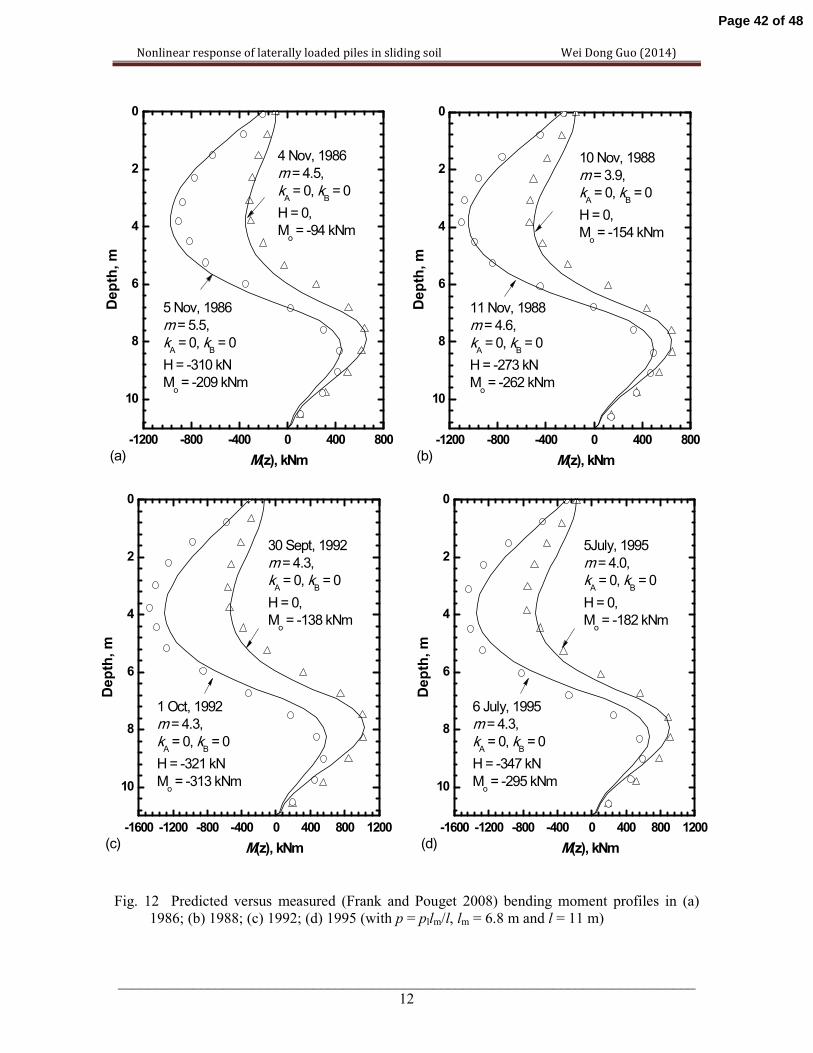
Nonlinear response of laterally loaded piles in sliding soil Wei Dong Guo (2014)
_____________________________________________________________________________
12
Fig. 12 Predicted versus measured (Frank and Pouget 2008) bending moment profiles in (a)
1986; (b) 1988; (c) 1992; (d) 1995 (with p = pllm/l, lm = 6.8 m and l = 11 m)
10
8
6
4
2
0
-1200 -800 -400 0 400 800
5 Nov, 1986
m = 5.5, kA = 0, k
B = 0
H = -310 kN
Mo = -209 kNm
M(z), kNm
Depth, m
4 Nov, 1986
m = 4.5, kA = 0, k
B = 0
H = 0,
Mo = -94 kNm
(a)
10
8
6
4
2
0
-1200 -800 -400 0 400 800
11 Nov, 1988
m = 4.6, kA = 0, k
B = 0
H = -273 kN
Mo = -262 kNm
M(z), kNm
Depth, m
10 Nov, 1988
m = 3.9, kA = 0, k
B = 0
H = 0,
Mo = -154 kNm
(b)
10
8
6
4
2
0
-1600 -1200 -800 -400 0 400 800 1200
1 Oct, 1992
m = 4.3, kA = 0, k
B = 0
H = -321 kN
Mo = -313 kNm
M(z), kNm
Depth, m
30 Sept, 1992
m = 4.3, kA = 0, k
B = 0
H = 0,
Mo = -138 kNm
(c)
10
8
6
4
2
0
-1600 -1200 -800 -400 0 400 800 1200
6 July, 1995
m = 4.3, kA = 0, k
B = 0
H = -347 kN
Mo = -295 kNm
M(z), kNm
Depth, m
5July, 1995
m = 4.0, kA = 0, k
B = 0
H = 0,
Mo = -182 kNm
(d)
Page 42 of 48
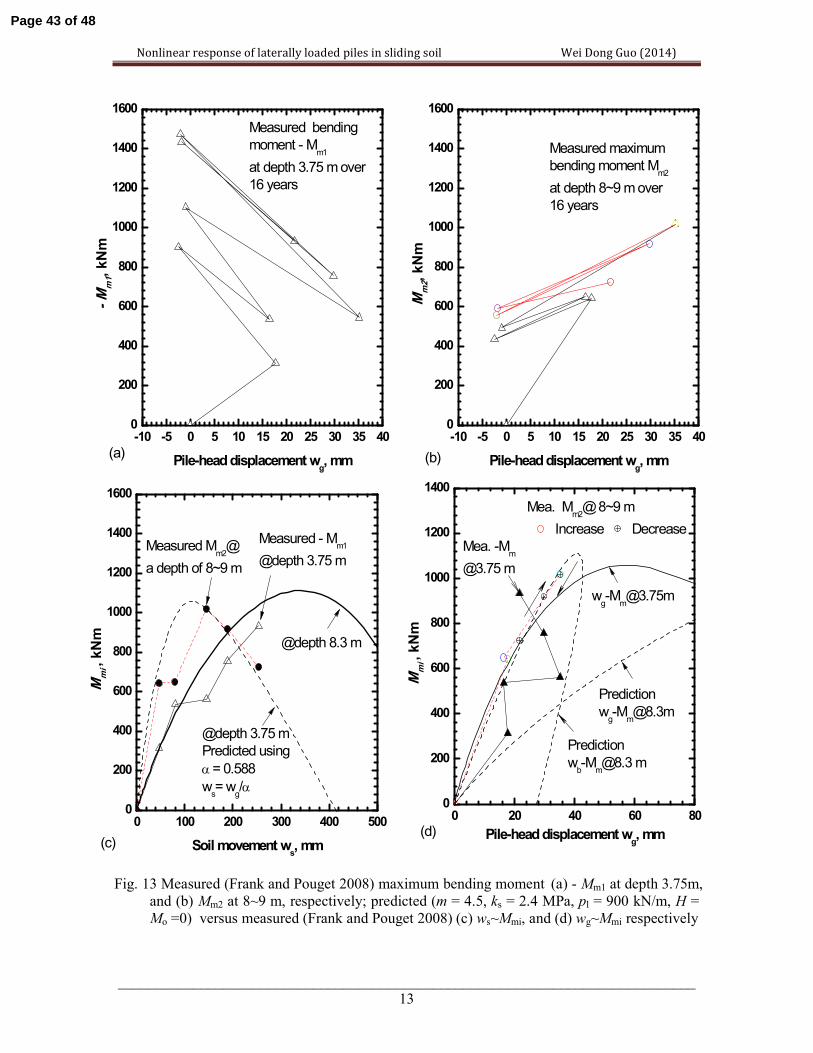
Nonlinear response of laterally loaded piles in sliding soil Wei Dong Guo (2014)
_____________________________________________________________________________
13
Fig. 13 Measured (Frank and Pouget 2008) maximum bending moment (a) - Mm1 at depth 3.75m,
and (b) Mm2 at 8~9 m, respectively; predicted (m = 4.5, ks = 2.4 MPa, pl = 900 kN/m, H =
Mo =0) versus measured (Frank and Pouget 2008) (c) ws~Mmi, and (d) wg~Mmi respectively
-10 -5 0 5 10 15 20 25 30 35 400
200
400
600
800
1000
1200
1400
1600
- M
m1, kNm
Pile-head displacement wg, mm
Measured bending
moment - Mm1
at depth 3.75 m over
16 years
(a)
0 100 200 300 400 5000
200
400
600
800
1000
1200
1400
1600
@depth 8.3 m
Measured Mm2@
a depth of 8~9 m
Measured - Mm1
@depth 3.75 m
Mmi , kNm
Soil movement ws, mm(c)
@depth 3.75 m
Predicted using
α = 0.588
ws= w
g/α
-10 -5 0 5 10 15 20 25 30 35 400
200
400
600
800
1000
1200
1400
1600
Mm2, kNm
Pile-head displacement wg, mm
Measured maximum
bending moment Mm2
at depth 8~9 m over
16 years
(b)
0 20 40 60 800
200
400
600
800
1000
1200
1400
wg-M
Prediction
wb-M
Mea. -Mm
@3.75 m
Mmi , kNm
Pile-head displacement wg, mm
Mea. Mm2@ 8~9 m
Increase Decrease
(d)
Prediction
wg-M
Page 43 of 48
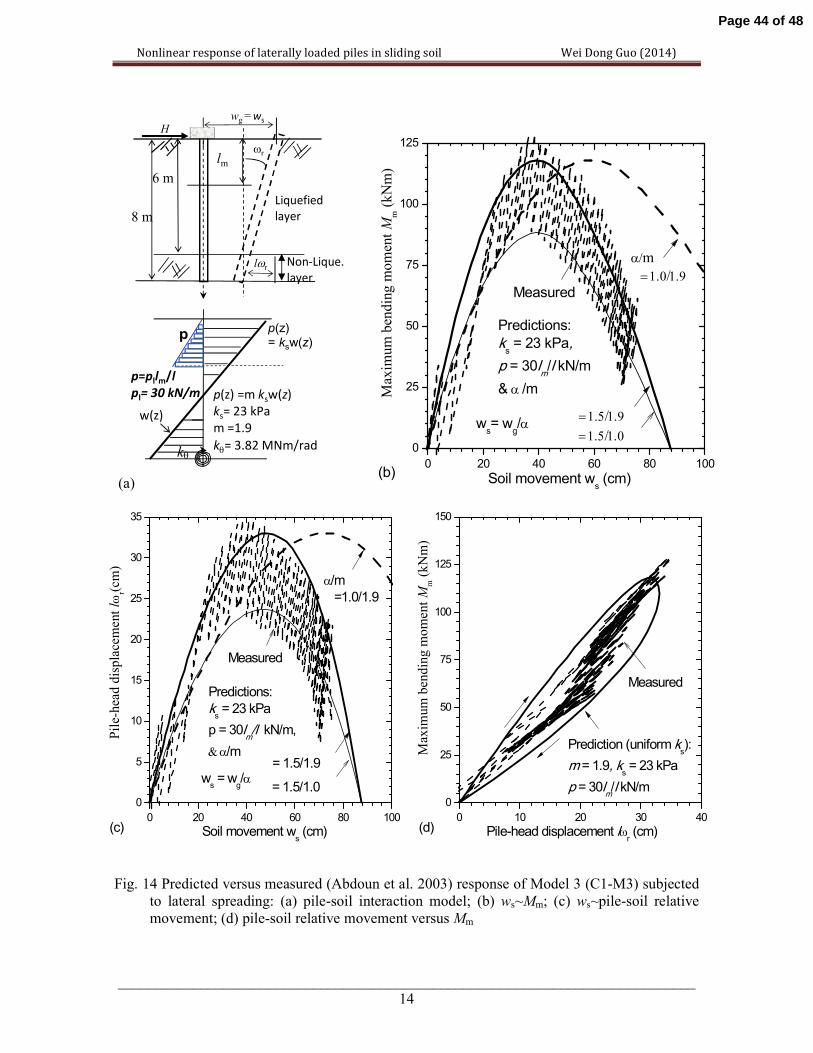
Nonlinear response of laterally loaded piles in sliding soil Wei Dong Guo (2014)
_____________________________________________________________________________
14
(a)
Fig. 14 Predicted versus measured (Abdoun et al. 2003) response of Model 3 (C1-M3) subjected
to lateral spreading: (a) pile-soil interaction model; (b) ws~Mm; (c) ws~pile-soil relative
movement; (d) pile-soil relative movement versus Mm
0 10 20 30 40
0
25
50
75
100
125
150
Measured
Maxim
um bending m
oment M
m (kNm)
Pile-head displacement lωr (cm)
Prediction (uniform ks):
m = 1.9, ks = 23 kPa
p = 30lm/l kN/m
(d)0 20 40 60 80 100
0
5
10
15
20
25
30
35
= 1.5/1.0
= 1.5/1.9
α/m
=1.0/1.9
Measured
Pile-head displacement lω
r(cm
)
Soil movement ws (cm)
Predictions:
ks = 23 kPa
p = 30lm/l kN/m,
& α/m
(c)
ws = w
g/α
0 20 40 60 80 100
0
25
50
75
100
125
α/m
= 1.0/1.9
= 1.5/1.0
= 1.5/1.9
Measured
Maxim
um bending m
oment M
m (kNm)
Soil movement ws (cm)
Predictions:
ks = 23 kPa,
p = 30lm/l kN/m
& α /m
(b)
ws= w
g/α
wg =ws
8 m
lm
6 m
ωr
lωr
H
Liquefied
layer
Non-Lique.
layer
kθ
p(z) =m ksw(z)
ks= 23 kPa
m =1.9
kθ= 3.82 MNm/rad
p p(z) = ksw(z)
p=pllm/l
pl= 30 kN/m
w(z)
Page 44 of 48
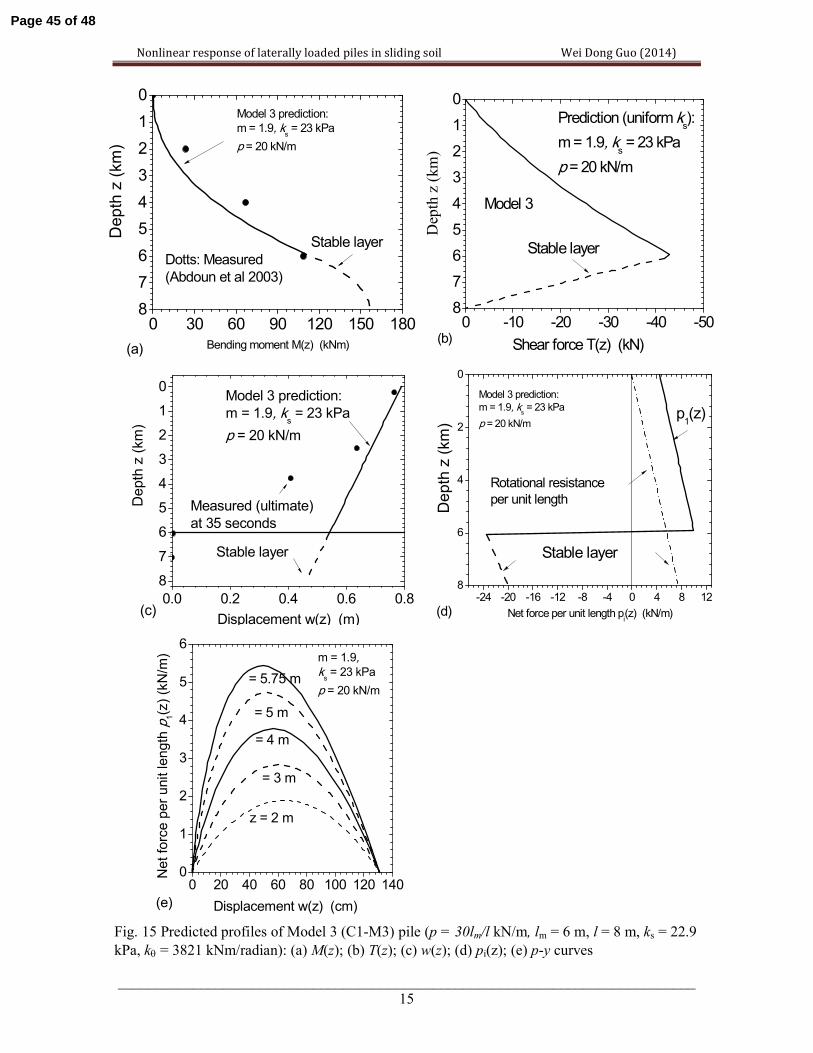
Nonlinear response of laterally loaded piles in sliding soil Wei Dong Guo (2014)
_____________________________________________________________________________
15
Fig. 15 Predicted profiles of Model 3 (C1-M3) pile (p = 30lm/l kN/m, lm = 6 m, l = 8 m, ks = 22.9
kPa, kθ = 3821 kNm/radian): (a) M(z); (b) T(z); (c) w(z); (d) pi(z); (e) p-y curves
0 -10 -20 -30 -40 -508
7
6
5
4
3
2
1
0
Stable layer
Model 3
Depth z (km)
Shear force T(z) (kN)
Prediction (uniform ks):
m = 1.9, ks = 23 kPa
p = 20 kN/m
(b)
0.0 0.2 0.4 0.6 0.8
8
7
6
5
4
3
2
1
0
Measured (ultimate)
at 35 seconds
Depth z (km)
Displacement w(z) (m)
Model 3 prediction:
m = 1.9, ks = 23 kPa
p = 20 kN/m
(c)
Stable layer
-24 -20 -16 -12 -8 -4 0 4 8 128
6
4
2
0
Depth z (km)
Net force per unit length pi(z) (kN/m)
Model 3 prediction:
m = 1.9, ks = 23 kPa
p = 20 kN/m
(d)
Stable layer
Rotational resistance
per unit length
p1(z)
0 20 40 60 80 100 120 1400
1
2
3
4
5
6
= 5.75 m
= 4 m
= 5 m
= 3 m
Net force per unit length p
1(z) (kN/m)
Displacement w(z) (cm)
m = 1.9, ks = 23 kPa
p = 20 kN/m
z = 2 m
(e)
0 30 60 90 120 150 1808
7
6
5
4
3
2
1
0
Dotts: Measured
(Abdoun et al 2003)
Depth z (km)
Bending moment M(z) (kNm)
Model 3 prediction:
m = 1.9, ks = 23 kPa
p = 20 kN/m
(a)
Stable layer
Page 45 of 48
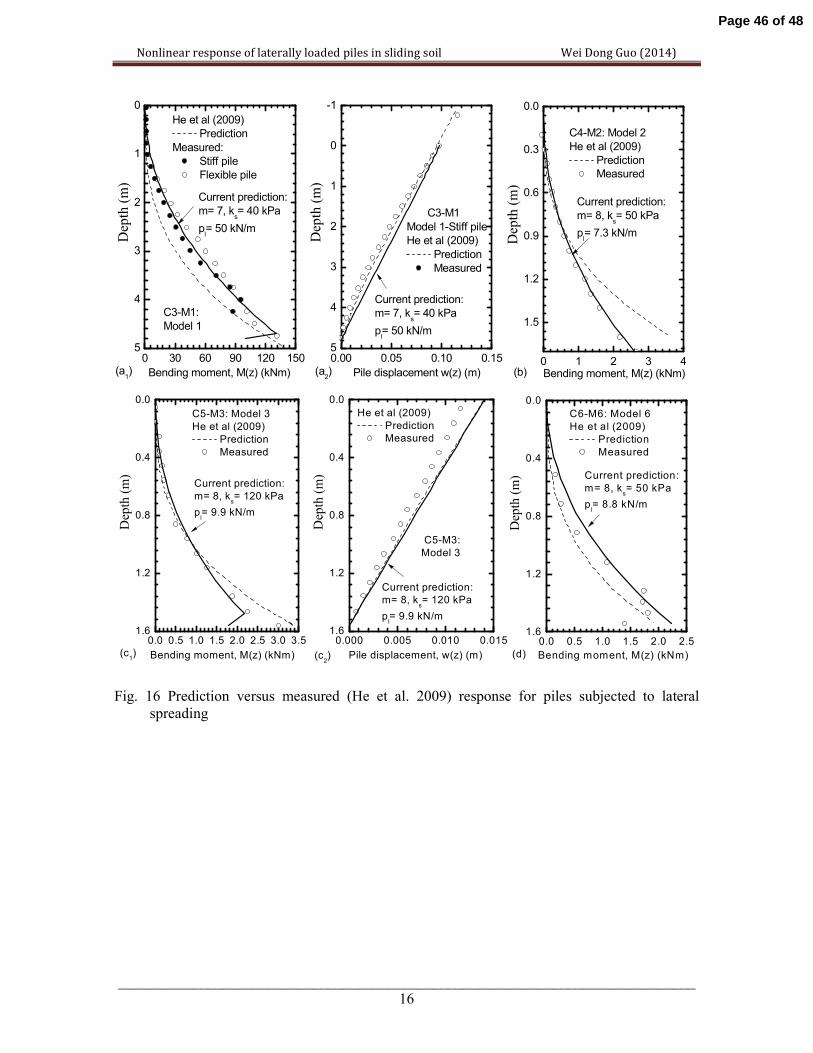
Nonlinear response of laterally loaded piles in sliding soil Wei Dong Guo (2014)
_____________________________________________________________________________
16
5
4
3
2
1
0
0 30 60 90 120 150
C3-M1:
Model 1
He et al (2009)
Prediction
Measured:
Stiff pile
Flexible pile
Current prediction:
m= 7, ks= 40 kPa
pl= 50 kN/m
Depth (m)
Bending moment, M(z) (kNm) (a1)
5
4
3
2
1
0
-1
0.00 0.05 0.10 0.15
C3-M1
Model 1-Stiff pile
He et al (2009)
Prediction
Measured
Current prediction:
m= 7, ks= 40 kPa
pl= 50 kN/m
Depth (m)
Pile displacement w(z) (m) (a2)
1.5
1.2
0.9
0.6
0.3
0.0
0 1 2 3 4
C4-M2: Model 2
He et al (2009)
Prediction
Measured
Current prediction:
m= 8, ks= 50 kPa
pl= 7.3 kN/m
Depth (m)
Bending moment, M(z) (kNm) (b)
1.6
1.2
0.8
0.4
0.0
0.0 0.5 1.0 1.5 2.0 2.5 3.0 3.5
C5-M3: Model 3
He et al (2009)
Prediction
Measured
Current prediction:
m= 8, ks= 120 kPa
pl= 9.9 kN/m
Depth (m)
Bending moment, M(z) (kNm) (c1)
1.6
1.2
0.8
0.4
0.0
0.000 0.005 0.010 0.015
C5-M3:
Model 3
He et al (2009)
Prediction
Measured
Current prediction:
m= 8, ks= 120 kPa
pl= 9.9 kN/m
Depth (m)
Pile displacement, w(z) (m) (c2)
1.6
1.2
0.8
0.4
0.0
0.0 0.5 1.0 1.5 2.0 2.5
C6-M6: Model 6
He et al (2009)
Prediction
Measured
Current prediction:
m= 8, ks= 50 kPa
pl= 8.8 kN/m
Depth (m)
Bending moment, M(z) (kNm) (d)
Fig. 16 Prediction versus measured (He et al. 2009) response for piles subjected to lateral
spreading
Page 46 of 48
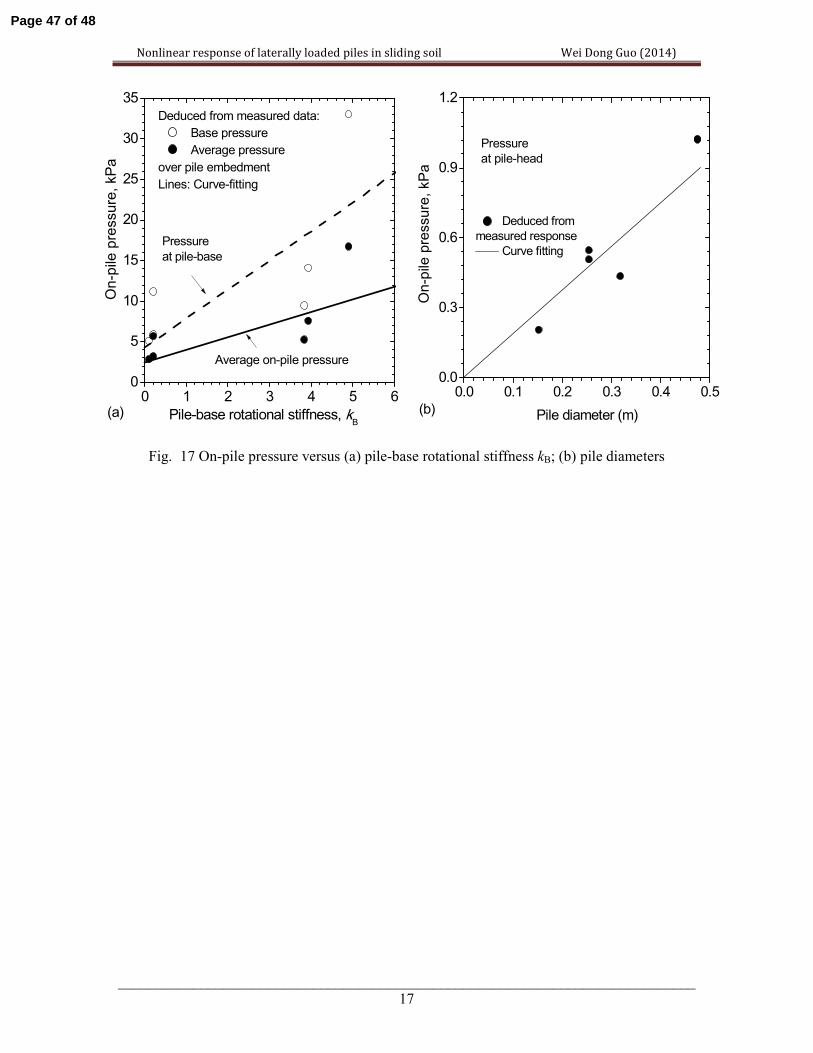
Nonlinear response of laterally loaded piles in sliding soil Wei Dong Guo (2014)
_____________________________________________________________________________
17
Fig. 17 On-pile pressure versus (a) pile-base rotational stiffness kB; (b) pile diameters
0 1 2 3 4 5 60
5
10
15
20
25
30
35
Deduced from measured data:
Base pressure
Average pressure
over pile embedment
Lines: Curve-fitting
On-pile pressure, kPa
Pile-base rotational stiffness, kB
Average on-pile pressure
(a)
Pressure
at pile-base
0.0 0.1 0.2 0.3 0.4 0.50.0
0.3
0.6
0.9
1.2
Deduced from
measured response
Curve fitting
On-pile pressure, kPa
Pile diameter (m)(b)
Pressure
at pile-head
Page 47 of 48
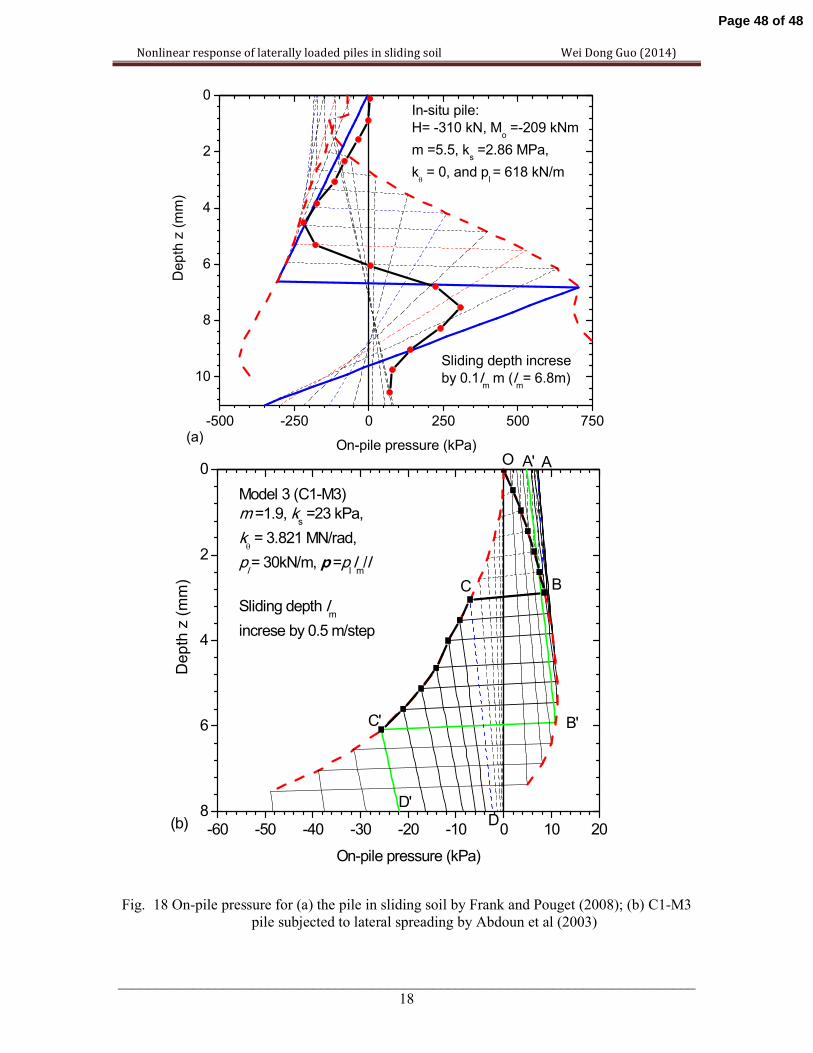
Nonlinear response of laterally loaded piles in sliding soil Wei Dong Guo (2014)
_____________________________________________________________________________
18
Fig. 18 On-pile pressure for (a) the pile in sliding soil by Frank and Pouget (2008); (b) C1-M3
pile subjected to lateral spreading by Abdoun et al (2003)
10
8
6
4
2
0
-500 -250 0 250 500 750
Sliding depth increse by 0.1l
m m (l
m= 6.8m)
In-situ pile:
H= -310 kN, Mo =-209 kNm
m =5.5, ks =2.86 MPa,
kθ = 0, and p
l = 618 kN/m
(a)
On-pile pressure (kPa)
Depth z (mm)
8
6
4
2
0
-60 -50 -40 -30 -20 -10 0 10 20
A
D
B'
Model 3 (C1-M3)
m =1.9, ks =23 kPa,
kθ = 3.821 MN/rad,
pl = 30kN/m, p =p
l lm/l
Sliding depth lm
increse by 0.5 m/step
(b)
On-pile pressure (kPa)
Depth z (mm)
A'
BC
O
C'
D'
Page 48 of 48
Related Documents