Biogeosciences, 8, 3375–3389, 2011 www.biogeosciences.net/8/3375/2011/ doi:10.5194/bg-8-3375-2011 © Author(s) 2011. CC Attribution 3.0 License. Biogeosciences Nonlinear controls on evapotranspiration in arctic coastal wetlands A. K. Liljedahl 1,2 , L. D. Hinzman 1 , Y. Harazono 1,3 , D. Zona 4,8 , C. E. Tweedie 5 , R. D. Hollister 6 , R. Engstrom 7 , and W. C. Oechel 8 1 International Arctic Research Center, University of Alaska Fairbanks, Fairbanks, AK-99775, USA 2 Water and Environmental Research Center, University of Alaska Fairbanks, Fairbanks, AK-99775, USA 3 Osaka Prefecture University, Sakai, Osaka-599-8531, Japan 4 Research Group of Plant and Vegetation Ecology, University of Antwerp, B-2610 Wilrijk, Belgium 5 Department of Biology, University of Texas at El Paso, El Paso, TX-79968, USA 6 Department of Biology, Grand Valley State University, Allendale, MI-49401, USA 7 Department of Geography, The George Washington University, Washington, DC-20052, USA 8 Department of Biology, San Diego State University, San Diego, CA-92182, USA Received: 1 June 2011 – Published in Biogeosciences Discuss.: 5 July 2011 Revised: 6 November 2011 – Accepted: 7 November 2011 – Published: 18 November 2011 Abstract. Projected increases in air temperature and precip- itation due to climate change in Arctic wetlands could dra- matically affect ecosystem function. As a consequence, it is important to define controls on evapotranspiration, the major pathway of water loss from these systems. We quantified the multi-year controls on midday Arctic coastal wetland evapo- transpiration, measured with the eddy covariance method at two vegetated, drained thaw lake basins near Barrow, Alaska. Variations in near-surface soil moisture and atmospheric va- por pressure deficits were found to have nonlinear effects on midday evapotranspiration rates. Vapor pressure deficits (VPD) near 0.3 kPa appeared to be an important hydrologi- cal threshold, allowing latent heat flux to persistently exceed sensible heat flux. Dry (compared to wet) soils increased bulk surface resistance (water-limited). Wet soils favored ground heat flux and therefore limited the energy available to sensible and latent heat flux (energy-limited). Thus, mid- day evapotranspiration was suppressed from both dry and wet soils but through different mechanisms. We also found that wet soils (ponding excluded) combined with large VPD, resulted in an increased bulk surface resistance and there- fore suppressing evapotranspiration below its potential rate (Priestley-Taylor α< 1.26). This was likely caused by the limited ability of mosses to transfer moisture during large at- mospheric demands. Ultimately, in addition to net radiation, the various controlling factors on midday evapotranspiration (i.e., near-surface soil moisture, atmospheric vapor pressure, Correspondence to: A. K. Liljedahl ([email protected]) and the limited ability of saturated mosses to transfer wa- ter during high VPD) resulted in an average evapotranspi- ration rate of up to 75 % of the potential evapotranspiration rate. These multiple limitations on midday evapotranspira- tion rates have the potential to moderate interannual variation of total evapotranspiration and reduce excessive water loss in a warmer climate. Combined with the prevailing maritime winds and projected increases in precipitation, these curbing mechanisms will likely prevent extensive future soil drying and hence maintain the presence of coastal wetlands. 1 Introduction The response of Arctic wetland hydrology to projected cli- mate warming is uncertain. Evapotranspiration is the least understood component in the hydrologic cycle (Kane et al., 1989, 1992; V¨ or¨ osmarty et al., 2001; Woo et al., 2008), though regional studies have proposed both increased (Lafleur, 1993) and unchanged (Rouse et al., 1992) future evapotranspiration rates in Arctic coastal wetlands. Evapo- transpiration is the major pathway for water loss from the flat tundra landscape (Rovansek et al., 1996; Mendez et al., 1998; Bowling et al., 2003). A region that has for a long time sequestered carbon will shift to a carbon source if soil dry- ing occurs (Oechel et al., 1998; Olivas et al., 2010) and thus, causing a positive feedback to global climate warming. A vast majority of extremely low-gradient tundra is lo- cated within 135 km of the Arctic Ocean (Walker et al., 2005; Minke et al., 2007). The summer climate of the coastal zone is controlled by a steady mesoscale phenomenon – a nearly Published by Copernicus Publications on behalf of the European Geosciences Union.

Welcome message from author
This document is posted to help you gain knowledge. Please leave a comment to let me know what you think about it! Share it to your friends and learn new things together.
Transcript
Biogeosciences, 8, 3375–3389, 2011www.biogeosciences.net/8/3375/2011/doi:10.5194/bg-8-3375-2011© Author(s) 2011. CC Attribution 3.0 License.
Biogeosciences
Nonlinear controls on evapotranspiration in arctic coastal wetlands
A. K. Liljedahl 1,2, L. D. Hinzman1, Y. Harazono1,3, D. Zona4,8, C. E. Tweedie5, R. D. Hollister6, R. Engstrom7, andW. C. Oechel8
1International Arctic Research Center, University of Alaska Fairbanks, Fairbanks, AK-99775, USA2Water and Environmental Research Center, University of Alaska Fairbanks, Fairbanks, AK-99775, USA3Osaka Prefecture University, Sakai, Osaka-599-8531, Japan4Research Group of Plant and Vegetation Ecology, University of Antwerp, B-2610 Wilrijk, Belgium5Department of Biology, University of Texas at El Paso, El Paso, TX-79968, USA6Department of Biology, Grand Valley State University, Allendale, MI-49401, USA7Department of Geography, The George Washington University, Washington, DC-20052, USA8Department of Biology, San Diego State University, San Diego, CA-92182, USA
Received: 1 June 2011 – Published in Biogeosciences Discuss.: 5 July 2011Revised: 6 November 2011 – Accepted: 7 November 2011 – Published: 18 November 2011
Abstract. Projected increases in air temperature and precip-itation due to climate change in Arctic wetlands could dra-matically affect ecosystem function. As a consequence, it isimportant to define controls on evapotranspiration, the majorpathway of water loss from these systems. We quantified themulti-year controls on midday Arctic coastal wetland evapo-transpiration, measured with the eddy covariance method attwo vegetated, drained thaw lake basins near Barrow, Alaska.Variations in near-surface soil moisture and atmospheric va-por pressure deficits were found to have nonlinear effectson midday evapotranspiration rates. Vapor pressure deficits(VPD) near 0.3 kPa appeared to be an important hydrologi-cal threshold, allowing latent heat flux to persistently exceedsensible heat flux. Dry (compared to wet) soils increasedbulk surface resistance (water-limited). Wet soils favoredground heat flux and therefore limited the energy availableto sensible and latent heat flux (energy-limited). Thus, mid-day evapotranspiration was suppressed from both dry andwet soils but through different mechanisms. We also foundthat wet soils (ponding excluded) combined with large VPD,resulted in an increased bulk surface resistance and there-fore suppressing evapotranspiration below its potential rate(Priestley-Taylorα < 1.26). This was likely caused by thelimited ability of mosses to transfer moisture during large at-mospheric demands. Ultimately, in addition to net radiation,the various controlling factors on midday evapotranspiration(i.e., near-surface soil moisture, atmospheric vapor pressure,
Correspondence to:A. K. Liljedahl([email protected])
and the limited ability of saturated mosses to transfer wa-ter during high VPD) resulted in an average evapotranspi-ration rate of up to 75 % of the potential evapotranspirationrate. These multiple limitations on midday evapotranspira-tion rates have the potential to moderate interannual variationof total evapotranspiration and reduce excessive water loss ina warmer climate. Combined with the prevailing maritimewinds and projected increases in precipitation, these curbingmechanisms will likely prevent extensive future soil dryingand hence maintain the presence of coastal wetlands.
1 Introduction
The response of Arctic wetland hydrology to projected cli-mate warming is uncertain. Evapotranspiration is the leastunderstood component in the hydrologic cycle (Kane etal., 1989, 1992; Vorosmarty et al., 2001; Woo et al.,2008), though regional studies have proposed both increased(Lafleur, 1993) and unchanged (Rouse et al., 1992) futureevapotranspiration rates in Arctic coastal wetlands. Evapo-transpiration is the major pathway for water loss from theflat tundra landscape (Rovansek et al., 1996; Mendez et al.,1998; Bowling et al., 2003). A region that has for a long timesequestered carbon will shift to a carbon source if soil dry-ing occurs (Oechel et al., 1998; Olivas et al., 2010) and thus,causing a positive feedback to global climate warming.
A vast majority of extremely low-gradient tundra is lo-cated within 135 km of the Arctic Ocean (Walker et al., 2005;Minke et al., 2007). The summer climate of the coastal zoneis controlled by a steady mesoscale phenomenon – a nearly
Published by Copernicus Publications on behalf of the European Geosciences Union.

3376 A. K. Liljedahl et al.: Nonlinear controls on evapotranspiration
24-h sea breeze (Moritz, 1977; Walsh, 1977; Kozo, 1979,1982), resulting in low diurnal temperature fluctuations andlow atmospheric vapor pressure deficits (VPD). All compo-nents of the coastal wetland energy balance, except net radia-tion, depend on wind direction, with cold, moist maritime airsuppressing evapotranspiration losses (Rouse et al., 1987).One may expect the sea breeze to continue in a warmer cli-mate, though the fate of future evapotranspiration rates fromcoastal wetlands is uncertain.
Measurement of energy fluxes in arctic environments ischallenging due to climatic and logistical constraints. Hence,most field studies are of relatively short duration. There areseveral field studies of arctic surface energy exchange (seeEugster et al., 2000) and water balance (see Kane and Yang,2004), but few studies have conducted multi-year analyses ofevapotranspiration measured using the eddy covariance tech-nique.
Here we present results from one of the longest time se-ries of flux measurements available for any arctic ecosys-tem, represented by two vegetated, drained thaw lake basins(five summers at one site; three summers in an adjacentsite) on the Arctic Coastal Plain of Alaska. Our objectiveis to define mechanisms controlling midday evapotranspira-tion rates from seasonally inundated arctic coastal wetlands.We hypothesize that the evapotranspiration experiences mul-tiple controls apart from surface net radiation. Defining thesecontrols is important in order to refine our understanding ofthe hydrologic regime and the role of tundra ecosystems inglobal climate feedbacks.
2 Background
Extremely low-relief wetlands represent a significant portion(>400 000 km2) of the pan-Arctic landscape (Walker et al.,2005) and are unique in that they exist in an environment witha desert-like annual precipitation (∼250 mm yr−1). Sparsesummer runoff (Brown et al., 1968; Kane et al., 2008) limitsthe summer net water balance to summer precipitation mi-nus evapotranspiration. A negative summer net water bal-ance is common (Mendez et al., 1998), but this is offset byan annual replenishment of water from snowmelt (Rovanseket al., 1996). The abundance of snowmelt water results inextensive surface inundation during the first week followingsnowmelt (Bowling et al., 2003; Woo et al., 2006). Springrunoff is not generated until surface stores are replenished(Rovansek et al., 1996; Bowling and Lettenmaier, 2010). Ac-cordingly, evapotranspiration is the major pathway for waterloss in summer and also affects the lateral exports of water.
Evapotranspiration from wet and moist tundra ecosys-tems of the North Slope of Alaska is estimated to be 0.8–4.2 mm day−1, resulting in estimated annual totals rangingfrom 70 to 190 mm (see summary by Vourlitis and Oechel,1997). A majority (55 to 85 %) of this evapotranspiration isrepresented by evaporation from moss and open water (see
review by Engstrom et al., 2006), even though bryophytesreceive only 10–20 % of direct solar radiation during a clearsummer day (Miller and Tieszen, 1972). Upward migrationof water inSphagnummoss, attributed to capillary flow, hasbeen shown to occur from water tables located at 0.2 m depth(Hayward and Clymo, 1982; Price et al., 2009). Capillarywater flow in moss, and hence moss evaporation, is neg-ligible at water potentials below−0.1 MPa (Hayward andClymo, 1982). In comparison, stomatal closure due to waterstress by the typical vascular plants occurs at soil water po-tentials of−0.4 MPa (Arctophila fulva) to −1.2 MPa (Carexaquatilis) (Stoner and Miller, 1975; Johnson and Caldwell,1975). Total transpiration is closely related to Leaf Area In-dex (LAI), as stomatal closure is rare at wet, coastal Arcticsites (Miller and Tieszen, 1972). However, plant-scale stud-ies have also shown that the conductance of tundra plantscan be reduced by leaf cell water stress, induced by vaporpressure gradients between the leaf and the ambient air thatrange from 0.7 to 2 kPa (Johnson and Caldwell, 1975). Tun-dra bryophytes are extremely sensitive to air vapor pressuredeficits, due to the direct changes in tissue water content(Oechel and Sveinbjornsson, 1978).
The effect of maritime air mass on surface energy parti-tioning has been observed in tundra 135 km inland from theArctic coast (Harazono et al., 1998). Cold, moisture-ladenair along the coast boosts the partitioning of surface energyinto sensible heat flux (H), caused by (a) a steep temper-ature gradient between the ground surface and air, favoringH ; and (b) a nearly saturated air mass that reduces latent heatflux (LE) (Rouse et al., 1987; Lafleur and Rouse, 1988, 1995;Price, 1991; Harazono et al., 1998; Boike et al., 2008). Thisdynamic explains, at least partly, the observation that despitewet soils, evapotranspiration is generally below its potentialrate in coastal arctic wetlands (Rouse et al., 1987; Mendezet al., 1998). However, it is unclear what values in vaporpressure deficits lead to significant changes in surface energypartitioning and evapotranspiration rates.
Soil moisture may also play a major role in tundra sur-face energy balance partitioning. Surface energy partitioningshifted from being dominated by latent heat in the early sea-son, when the water table was near the ground surface, to be-ing dominated by sensible heat in late summer, when the wa-ter table was at 30 cm depth at a coastal wet and moist herba-ceous tundra site (Vourlitis and Oechel, 1997). Further, wetorganic soils transfer heat more efficiently than dry organicsoils (Farouki, 1981; Hinzman et al., 1991), which, in theory,would leave less net radiation available to sensible and latentheat fluxes. This prompts questions about whether the Arc-tic wetlands display important controlling mechanisms onthe local hydrological system, constraining evapotranspira-tion rates not only when near-surface conditions are dry, butalso when they are wet.
Biogeosciences, 8, 3375–3389, 2011 www.biogeosciences.net/8/3375/2011/

A. K. Liljedahl et al.: Nonlinear controls on evapotranspiration 3377
46
FIGURE 1 896
897
898
899
900
901 Fig. 1. The Central Marsh (CM) and the Biocomplexity Experi-ment (BE) sites are located at separate vegetated, drained thaw lakebasins within 3 km of the ocean, outside the town of Barrow, North-ern Alaska.
3 Site description
The two sites, hereafter referred to as Central Marsh(CM, at 71◦19′12.5′′ N, 156◦37′20.211′′ W, elevation 1 m)and the Biocomplexity Experiment (BE, at 71◦16′51.17′′ N,156◦35’47.28′′ W, elevation 4.5 m), are located 4.5 km apart,and both are only a few kilometers from the ocean near Bar-row, Alaska, on the Arctic Coastal Plain (Fig. 1). Meanannual air temperature at Barrow Airport is−12◦C (1977–2009), with a summer (June through August) average of3.3◦C. A large amount of the annual adjusted precipita-tion (173 mm, 1977–2009) falls during June through August(72 mm). Fog and drizzle are common during the summerbecause the area receives a steady cool, moist wind (mean5 m s−1) off the ocean from the east-northeast (Shulski andWendler, 2007). The BE site is located in the control treat-ment of a large-scale hydrologic manipulation experimentthat began in 2007 (identified as the South site in the workby Zona et al., 2009). Unlike the other treatments, this sitedid not have manipulated water tables.
The BE and CM sites are representative of vegetated,drained thaw lake basins that appear to have drained be-
tween 50 and 300 yr ago (Hinkel et al., 2003). The sites arepoorly drained and are characterized by wet meadow tun-dra with Typic Aquiturbels soils (Bockheim et al., 1999)underlain by 600 m thick permafrost (Brown and Johnson,1965). Low-centered ice-wedge polygons are found at thevegetated, drained thaw lake basin while high-centered ice-wedge polygons cover the upland areas of the watershed.Vegetated, drained thaw lake basins (Mackay, 1963) occupyapproximately 26 % of the Arctic Coastal Plain (Hinkel etal., 2005) and 50 % of the Barrow Peninsula north of∼71◦
latitude (Hinkel et al., 2003). Longer-term (>2 yr) energybalance measurements of vegetated, drained thaw lakes arelimited, constraining our understanding of interannual con-trols of evapotranspiration rates from this vast region.
Non-vascular vegetation contributes significantly tobiomass and land cover (Webber, 1974, 1978; Oechel andSveinbjornsson, 1978; Rastorfer, 1978). Bryophytes repre-sent between 60 and 95 % of the overall live biomass in sim-ilar wet meadow communities (Tieszen, 1978), with muchof the variation due to small-scale heterogeneity associatedwith micro-topography (Tieszen, 1978; Hollister and Fla-herty, 2010). Across the BE drained lake bed, mosses rep-resent most of the live above-ground biomass (Zona et al.,2009, 2010, 2011). Up to 60 % of the ecosystem’s net day-time CO2 uptake at the end of the growing season at BE isrepresented bySphagnum(Zona et al., 2011). Accordingly,controls on evapotranspiration rates from this landscape arelikely dominated by moss evaporation processes.
The sites differ somewhat in vascular plant composi-tion, LAI (green biomass, unless otherwise stated), and theamount of standing dead biomass (which is defined as at-tached or upright dead plant matter).Arctophila fulvais thedominant vascular plant species at the CM site, where veg-etation is also represented by sedges, mosses, and lichens.LAI at the CM site reached 1.4 in mid-August of 2001(Mano, 2003). Mid-August LAI reached 0.58 in 2006 at theBE vegetated, drained lake, where the vascular plant cov-erage is dominated byCarex aquatilis(Zona et al., 2011).Sedges at the BE site did not experience water stress in mid-July of 2008 (P. Olivas, unpublished data). Standing deadleaf biomass in the Barrow area reaches 1.23 m2 m−2 (Den-nis et al., 1978). The CM site has a larger abundance ofstanding dead biomass than the BE site (personal observa-tion). End of growing season plant senescence extends fromthe end of August to late September (Myers and Pitelka,1979).
The sparseness of live subsurface material at depthsgreater than 25 cm at Barrow suggests that the cold temper-atures near the bottom of the active layer limit vascular rootgrowth (Dennis and Johnson, 1970). Moss may reach a thick-ness of 20 cm at wet sites, but the bulk of their living biomassis usually within∼1 cm of the soil surface (Engstrom et al.,2005). The rate of thaw is at its highest in early summer andthe maximum thaw depth (active layer depth) is reached inlate August/September. The active layer depth at a nearby
www.biogeosciences.net/8/3375/2011/ Biogeosciences, 8, 3375–3389, 2011

3378 A. K. Liljedahl et al.: Nonlinear controls on evapotranspiration
drained lake basin varied from 19 to 62 cm (36 cm mean)from 1995–2009, while the mean active layer depth at the BEsite was 30 cm in 2006 and 26 cm in 2007 and 2008 (Shiklo-manov et al., 2010).
4 Methods
The controls on midday evapotranspiration rates were as-sessed through surface energy balance partitioning, the Mc-Naughton and Jarvis�-factor, and by solving for parametersin the Penman-Monteith and the Priestley-Taylor equations.The results were then analyzed in the context of soil moistureand meteorological conditions.
4.1 Measurements
We collected summer (June through August) measurementsfor five years (1999–2003) at the CM site and for three years(2006–2008) at the BE site. Energy flux measurements weretaken at a 10 Hz sampling interval using an eddy covariancesystem. The path length of our anemometer and gas analyzersensor at CM was 10 cm, and the separation distance betweenthe center of the sonic anemometer and the open-path IRGAsensors was 16 cm. The three components of wind speed,air temperature, and water vapor concentration from thesesensors were recorded on a magneto-optical disc by a digi-tal recorder (Teac, DRM3). At BE, the sensor separation ofthe Li-7500 and WindMasterPro was 10 cm. The Li-7500was calibrated every two to four weeks, using ultra high pu-rity nitrogen as zero and a dew point generator (Li-610, Li-COR) that produced an air stream with a known water vapordew point. Micrometeorological variables were sampled ona data logger every 5 s (CM) or 10 s (BE), and then averagedevery 30 min. Additional descriptions of the measurementsand data analysis are presented in the work of Harazono etal. (2003) and Zona et al. (2009).
Measurements of volumetric water content (VWC) at twolocations within the CM drained lake basin were taken in2000–2003 by inserting a 7 cm Vitel probe (Hydra soil mois-ture probe, Vitel Inc.) vertically into the ground. The instru-ment was calibrated through comparison to multiple oven-dried soil samples (Engstrom et al., 2005). The CM site wasoften inundated in early summer. Such events are presentedhere as 100 % VWC to indicate ponding.
Hourly atmospheric air pressure for the years 1999–2003were obtained from the NCDC web archive (http://cdo.ncdc.noaa.gov/cgi-bin/cdo/cdostnsearch.pl) and used in the calcu-lations of the psychrometric constant. Long-term records ofdaily precipitation and air temperature were retrieved fromthe National Climatic Data Center (NCDC) web archive forthe Barrow Airport (STN 700260, WBAN 27502,http://www.ncdc.noaa.gov/cgi-bin/res40.pl?page=gsod.html). Thecharacteristic increase in net radiation (Rn) defined thestart date of the summer. We adjusted the daily precipi-tation to account for gage undercatch, according to Yang
et al. (1998). Snow accumulation was retrieved from theCircumpolar Active Layer Monitoring program (http://www.udel.edu/Geography/calm/).
4.2 Eddy covariance calculations
We calculated flux of heat and momentum at 30 min. inter-vals, according to typical covariance calculation procedures.The following corrections were applied (Harazono et al.,2003; Zona et al., 2009): humidity effect on the sonic ther-mometry (Kaimal and Gaynor, 1991); effects of path lengthand sensor separation on the spectrum for high-frequencyflux ranges (Moore, 1986); air density effects (Webb et al.,1980; Leuning et al., 1982); and coordinate rotation (Tan-ner and Thurtell, 1969). We removed calculated flux duringrain, fog, and low wind, which may have caused a bias (i.e.,reduced representation of low evapotranspiration rates). Ex-treme amplitudes in the flux data (greater than three timesthe average) were removed. At the BE site, fluxes of la-tent heat, sensible heat and momentum were calculated usingthe EdiRe program and software (version 1.4.3.1169, RobertClement, University of Edinburgh). No gap-filling was per-formed when analyzing the bulk parameters and energy fluxratios. Midday represented half-hourly values around solarnoon (defined as±2 h from local solar noon,∼14:00 AlaskaStandard Time). Extreme (greater than six times the aver-age) amplitudes in bulk parameters were removed. All anal-yses, except the total daily evapotranspiration, represent non-gap-filled midday values. For daily evapotranspiration rates,gap filling was performed for missing data (<3.5 consecu-tive hours), using linear interpolation. The ending date of thestudy periods was 31 August and the start date in each yearwas, at the earliest, the first day after the snowmelt comple-tion, although the effective dates depended upon the availabledata.
4.3 Soil moisture analysis
Unfrozen soil moisture, in percent saturation, was estimatedfrom volumetric water content measurements at 10 cm depthat the BE site. The spring peak in soil moisture was assumedto represent saturated conditions (100 %, all micro and macropore spaces filled with liquid water). In winter, the organicsoil was assumed to have 6 % saturation (Hinzman et al.,1991). Soil water potential (ψ) was calculated by fitting acurve, after van Genuchten (1980), to a measured water po-tential sequence (WP4-T, Decagon Devices) from a surfaceorganic moss layer sampled at the BE site.
4.4 Analysis of resistances and equilibrium evaporation
The Penman-Monteith equation (Monteith, 1973) is ex-pressed in terms of aerodynamic (ra) and bulk surface re-sistance (rc):
Biogeosciences, 8, 3375–3389, 2011 www.biogeosciences.net/8/3375/2011/
A. K. Liljedahl et al.: Nonlinear controls on evapotranspiration 3379
LE=sQa+
ρCp [es(Ta)−ea]ra
s+γ [1+rc/ra](1)
wheres is the slope of the saturation vapor pressure curveversus temperature modified from Brutsaert (1982);Qa isavailable energy (W m−2); γ is the psychrometric constant(kPa K−1); ρ the air density (kg m−3); Cp is the specificheat capacity of air (kJ kg−1 K−1) at constant pressure;esis the saturation vapor pressure (kPa) atTa, which is theambient air temperature (K); andea is the air vapor pres-sure (kPa). Shallow ponded water can represent a signifi-cant portion (<50 %) of the net radiation partitioning (Hara-zono et al., 1998). Therefore, we definedQa as the sumof sensible (H) and latent heat (LE) fluxes, since no wa-ter temperature measurements were obtained. The aerody-namic resistance,ra (s m−1), is calculated from Eq. (2) fol-lowing Monteith (1973), with an additional term on the rightside representing the laminar boundary layer resistance fromThom (1975) and Lafleur and Rouse (1988):
ra=u
u∗2+
4
u∗(2)
whereu∗ is friction velocity (m s−1) obtained by eddy co-variance measurements andu is wind speed. From hereforward, the sum of the aerodynamic and laminar boundarylayer resistance in Eq. (2) is referred to as aerodynamic re-sistance (ra). The aerodynamic resistance is the bulk meteo-rological descriptor of the role of atmospheric turbulence inevaporation.
Isothermal resistance,ri , (m s−1)was originally defined byMonteith (1965) and is sometimes referred to as the climato-logical resistance. It is the ratio of the water vapor deficit toavailable energy at the canopy:
ri =ρ ·Cp
γ
[es−ea]
Qa(Stewart and Thom, 1973) (3)
Equations (1), (3), and the Bowen ratio,β, which is the ratioof sensible over latent heat, can be combined to solve for thebulk surface resistance,rc (m s−1):
rc = (1+β)ri +
(βs
γ−1
)ra (4)
The bulk surface resistance characterizes the control of wa-ter loss by vascular plants, non-vascular vegetation, and bareground.
The bulk surface resistance approaches zero either becausethe surface boundary layer becomes saturated and VPD = 0or the air travels over an unsaturated surface with constantrcand the moisture deficit in the air becomes equal to the valueof the surface. Arc close to 0 results in the Penman-MonteithEquation (Monteith, 1973) collapsing into:
LE=α
(s
s+γ
)Qa (Priestley and Taylor, 1972) (5)
which is known as the Priestley-Taylor equation. The evap-otranspiration is referred to as “equilibrium” whenα equals
one, which is most commonly achieved when VPD = 0 (notethat equilibrium rates can also be measured over unsaturatedsurfaces and VPD>0). This method assumes that latent heatflux depends only upon the absolute temperature and avail-able energy. Results from a variety of arctic sites, both wetand dry, indicate that latent heat flux is often above the equi-librium rate (see Engstrom et al., 2002), as originally sug-gested by Priestley and Taylor (1972) at a non-water-limitedgrassland. Large-scale mixing of the planetary boundarylayer and the entrainment of drier air from above the mixedlayer results in evaporation over saturated surfaces greaterthan the “equilibrium” rate (McNaughton and Jarvis, 1983;DeBruin, 1983). DeBruin (1983) indicates thatα is a func-tion of wind speed, surface roughness, and bulk surface re-sistance. Here we defined the potential evapotranspiration bysetting theα-value to 1.26 (Priestley and Taylor, 1972).
The McNaughton and Jarvis�-factor sets the relative im-portance ofrc andra:
�=
(1+
s
s+γ
rc
ra
)−1
(6)
A vigorous turbulent mixing of the air mass suppresses�
by promoting increased VPD at the surface. Limited atmo-spheric mixing results in� approaching unity (McNaughtonand Jarvis, 1983). However,� will approach 0 as long asrc � ra. In general, VPD is the main driver of evapotranspi-ration when� is low, while net radiation has the dominantcontrol when� is near 1.
5 Results
5.1 Meteorological and hydrologic conditions
Analyzed measurements represented the thawed seasonthrough August (1999–2003 and 2006–2008). Mean airtemperature (June–August, 3.2◦C) and precipitation (June–September 86 mm) were near the long-term means (3.4◦Cand 99 mm, respectively, from 1979–2008), though largeinterannual variations occurred (Table 1). Summer 2007brought unusually high air temperatures (5.4◦C) and lowprecipitation (24 mm). Most of the 2007 summer precipi-tation occurred in a single event in mid-August. During allstudy periods, 77 % of daily precipitation rates were less than2 mm day−1. Trace observations (<0.13 mm) represented33 % of all recorded events. Accumulated winter precipi-tation ranged from 93 to 158 mm of snow water equivalent(SWE).
The maritime nature of both sites led to low variability inVPD and air temperature. Mean daily VPD was 0.08 kPa,with a typical diurnal min and max of 0.02 and 0.17 kPa,respectively. Mean midday VPD was similar during allyears (0.10–0.13 kPa) except during summer of 2007, whenVPD was higher (0.17 kPa) (Table 1). The maximum VPD
www.biogeosciences.net/8/3375/2011/ Biogeosciences, 8, 3375–3389, 2011
3380 A. K. Liljedahl et al.: Nonlinear controls on evapotranspiration
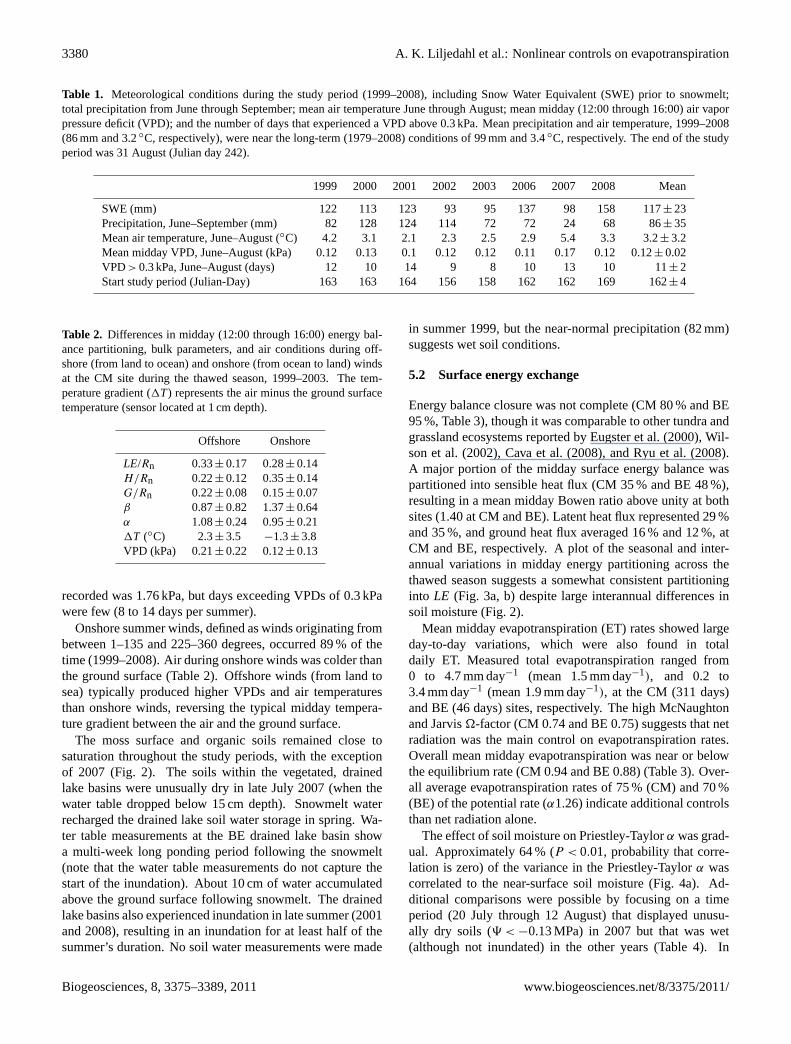
Table 1. Meteorological conditions during the study period (1999–2008), including Snow Water Equivalent (SWE) prior to snowmelt;total precipitation from June through September; mean air temperature June through August; mean midday (12:00 through 16:00) air vaporpressure deficit (VPD); and the number of days that experienced a VPD above 0.3 kPa. Mean precipitation and air temperature, 1999–2008(86 mm and 3.2◦C, respectively), were near the long-term (1979–2008) conditions of 99 mm and 3.4◦C, respectively. The end of the studyperiod was 31 August (Julian day 242).
1999 2000 2001 2002 2003 2006 2007 2008 Mean
SWE (mm) 122 113 123 93 95 137 98 158 117± 23Precipitation, June–September (mm) 82 128 124 114 72 72 24 68 86± 35Mean air temperature, June–August (◦C) 4.2 3.1 2.1 2.3 2.5 2.9 5.4 3.3 3.2± 3.2Mean midday VPD, June–August (kPa) 0.12 0.13 0.1 0.12 0.12 0.11 0.17 0.12 0.12± 0.02VPD>0.3 kPa, June–August (days) 12 10 14 9 8 10 13 10 11± 2Start study period (Julian-Day) 163 163 164 156 158 162 162 169 162± 4
Table 2. Differences in midday (12:00 through 16:00) energy bal-ance partitioning, bulk parameters, and air conditions during off-shore (from land to ocean) and onshore (from ocean to land) windsat the CM site during the thawed season, 1999–2003. The tem-perature gradient (1T) represents the air minus the ground surfacetemperature (sensor located at 1 cm depth).
Offshore Onshore
LE/Rn 0.33± 0.17 0.28± 0.14H/Rn 0.22± 0.12 0.35± 0.14G/Rn 0.22± 0.08 0.15± 0.07β 0.87± 0.82 1.37± 0.64α 1.08± 0.24 0.95± 0.211T (◦C) 2.3± 3.5 −1.3± 3.8VPD (kPa) 0.21± 0.22 0.12± 0.13
recorded was 1.76 kPa, but days exceeding VPDs of 0.3 kPawere few (8 to 14 days per summer).
Onshore summer winds, defined as winds originating frombetween 1–135 and 225–360 degrees, occurred 89 % of thetime (1999–2008). Air during onshore winds was colder thanthe ground surface (Table 2). Offshore winds (from land tosea) typically produced higher VPDs and air temperaturesthan onshore winds, reversing the typical midday tempera-ture gradient between the air and the ground surface.
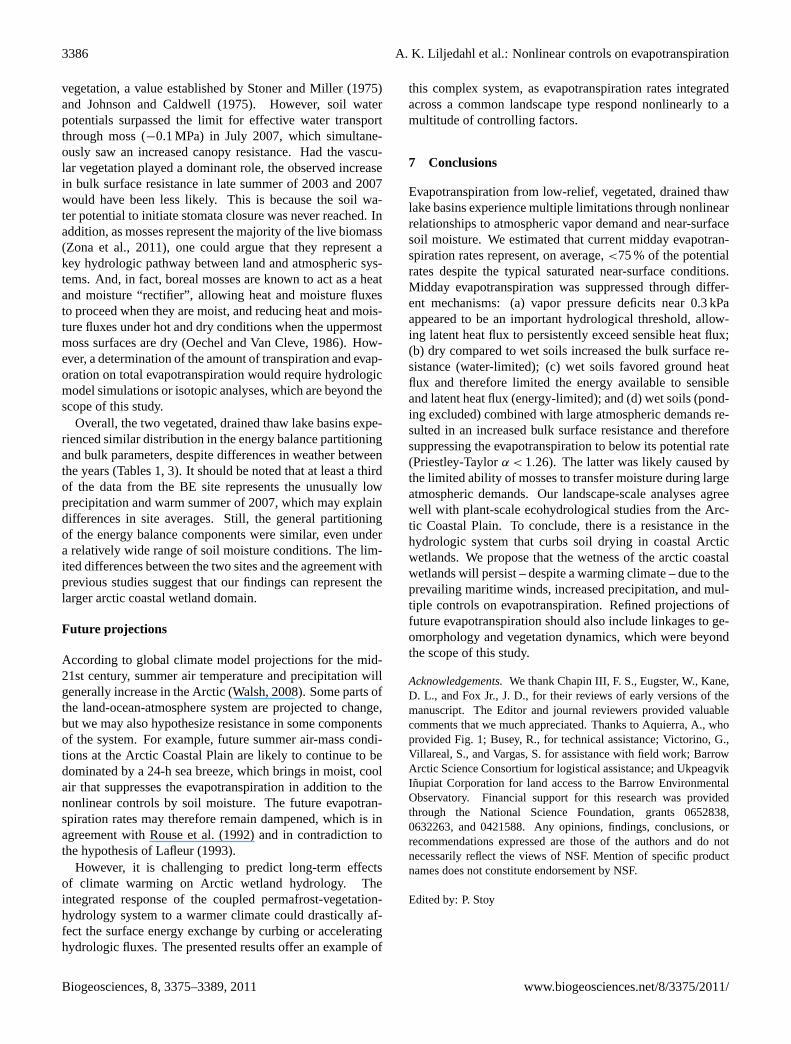
The moss surface and organic soils remained close tosaturation throughout the study periods, with the exceptionof 2007 (Fig. 2). The soils within the vegetated, drainedlake basins were unusually dry in late July 2007 (when thewater table dropped below 15 cm depth). Snowmelt waterrecharged the drained lake soil water storage in spring. Wa-ter table measurements at the BE drained lake basin showa multi-week long ponding period following the snowmelt(note that the water table measurements do not capture thestart of the inundation). About 10 cm of water accumulatedabove the ground surface following snowmelt. The drainedlake basins also experienced inundation in late summer (2001and 2008), resulting in an inundation for at least half of thesummer’s duration. No soil water measurements were made
in summer 1999, but the near-normal precipitation (82 mm)suggests wet soil conditions.
5.2 Surface energy exchange
Energy balance closure was not complete (CM 80 % and BE95 %, Table 3), though it was comparable to other tundra andgrassland ecosystems reported by Eugster et al. (2000), Wil-son et al. (2002), Cava et al. (2008), and Ryu et al. (2008).A major portion of the midday surface energy balance waspartitioned into sensible heat flux (CM 35 % and BE 48 %),resulting in a mean midday Bowen ratio above unity at bothsites (1.40 at CM and BE). Latent heat flux represented 29 %and 35 %, and ground heat flux averaged 16 % and 12 %, atCM and BE, respectively. A plot of the seasonal and inter-annual variations in midday energy partitioning across thethawed season suggests a somewhat consistent partitioninginto LE (Fig. 3a, b) despite large interannual differences insoil moisture (Fig. 2).
Mean midday evapotranspiration (ET) rates showed largeday-to-day variations, which were also found in totaldaily ET. Measured total evapotranspiration ranged from0 to 4.7 mm day−1 (mean 1.5 mm day−1), and 0.2 to3.4 mm day−1 (mean 1.9 mm day−1), at the CM (311 days)and BE (46 days) sites, respectively. The high McNaughtonand Jarvis�-factor (CM 0.74 and BE 0.75) suggests that netradiation was the main control on evapotranspiration rates.Overall mean midday evapotranspiration was near or belowthe equilibrium rate (CM 0.94 and BE 0.88) (Table 3). Over-all average evapotranspiration rates of 75 % (CM) and 70 %(BE) of the potential rate (α1.26) indicate additional controlsthan net radiation alone.
The effect of soil moisture on Priestley-Taylorα was grad-ual. Approximately 64 % (P < 0.01, probability that corre-lation is zero) of the variance in the Priestley-Taylorα wascorrelated to the near-surface soil moisture (Fig. 4a). Ad-ditional comparisons were possible by focusing on a timeperiod (20 July through 12 August) that displayed unusu-ally dry soils (9 <−0.13 MPa) in 2007 but that was wet(although not inundated) in the other years (Table 4). In
Biogeosciences, 8, 3375–3389, 2011 www.biogeosciences.net/8/3375/2011/

A. K. Liljedahl et al.: Nonlinear controls on evapotranspiration 3381
47
FIGURE 2 902
903
904 905
0
20
40
60
80
100
Central Marsh
Ponding
4-Sep10-Jul12-Jun
2000
2001
2002
2003
15-May 7-Aug
So
il m
ois
ture
(VW
C %
)
a)
0
20
40
60
80
100
Biocomplexity Experiment
So
il m
ois
ture
(% s
atu
ratio
n)
-15
-10
-5
0
5
10
15
c)
b) 2006
2007
2008
7-Aug10-Jul12-Jun15-May
Ground surface
4-Sep
Wa
ter
ta
ble
(cm
)
Fig. 2. The soil water status during the study period (no measurements from 1999) at the CM site(a) and the BE site (b andc). Panels(a)and(b) represent multiple locations across the vegetated, drained lake basins, while panel(c) is a continuous record of volumetric soil watercontent measurements at 10 cm depth near the BE eddy covariance tower, converted into % saturation.
Table 3. Mean midday (12:00 through 16:00) energy balance parti-tioning and bulk parameters at the CM (1999–2003) and BE (2006–2008) sites during the thawed season (through August).
Central Marsh Biocomplexity Experiment
LE/Rn 0.29± 0.15 0.35± 0.07H/Rn 0.35± 0.14 0.48± 0.12G/Rn 0.16± 0.07 0.12± 0.05Closure 0.80± 0.23 0.95± 0.13β 1.40± 0.67 1.40± 0.39� 0.74± 0.22 0.75± 0.17α 0.94± 0.22 0.88± 0.15rc (s m−1) 46± 40 46± 38ra (s m−1) 62± 38 63± 27ri (s m−1) 14± 14 12± 12
Closure = (LE+H +G)/Rn
addition to decreased Priestley-Taylorα-value, the dry soilconditions showed reduced�. Bulk surface resistance alsoresponded to dry (rc 57 s m−1) and wet (41 s m−1) soils, anddisplayed a statistically significant trend in summer 2003 and2007. Accordingly, reduced soil moisture had a suppressingeffect on ET.
Despite the differences in Priestley-Taylorα andrc, late-summer partitioning of net radiation intoLE was strikinglysimilar between dry and wet soils (37 and 34 %, respec-tively). This suggests controls additional to bulk surface re-sistance for ET. Wet soils increased the partitioning to groundheat flux from∼6 % (dry) to 14 % (saturated conditions)(Fig. 4b, Table 4), which resulted in less energy availableto middayLE andH .
VPD affected the energy balance partitioning and thePriestley-Taylorα. Latent heat fluxes from a wet surfacewere always slightly larger than sensible heat fluxes (Bowenratios below unity) if VPDs were above 0.25 (2006), 0.31(2007), and 0.28 kPa (2008) (Fig. 5). A VPD above thesethresholds during wet soils (including ponding) resulted in aPriestley-Taylorα near one or higher. On the other hand, un-usually dry soil (9 <−0.13 MPa, 20 July–12 August 2007)resulted in evapotranspiration below the equilibrium rate, de-spite VPD reaching 1.7 kPa. Nevertheless, a VPD>1.2 kParesulted in latent heat flux that exceeded the sensible heatflux at dry soils.
A VPD below and above 0.3 kPa resulted in significantlydifferent bulk parameters during wet soils (no ponding) (Ta-ble 5). A VPD>0.3 kPa resulted in slightly increasedPriestley-Taylorα and a doubledrc, while β and � was
www.biogeosciences.net/8/3375/2011/ Biogeosciences, 8, 3375–3389, 2011

3382 A. K. Liljedahl et al.: Nonlinear controls on evapotranspiration
48
FIGURE 3a 906
907
908
0.0
0.5
1.0
1.5
LE
H
G
0
100
200
3001999
0.0
0.5
1.0
1.5
0
100
200
3002001
Mid
day L
E
(W m
-2)
0.0
0.5
1.0
1.5
0
100
200
3002002
0.0
0.5
1.0
1.5
0
100
200
3002000
15-May 12-Jun 10-Jul 7-Aug 4-Sep0.0
0.5
1.0
1.5
Mid
day E
nerg
y P
art
itio
nin
g
(% o
f R
n)
0
100
200
300
Central Marsh
2003
Fig. 3a.The variation in the mean midday energy balance partition-ing and evapotranspiration rates during summer 1999–2003 at theCentral Marsh site.
49
FIGURE 3b 909
910
911 912
0.0
0.5
1.0
1.5
LE
H
G
0
100
200
300
Biocomplexity
2006
15-May 12-Jun 10-Jul 7-Aug 4-Sep0.0
0.5
1.0
1.5
0
100
200
300Mid
day E
nerg
y P
art
itio
nin
g
(% o
f R
n)
2008
Mid
day L
E
(W m
-2)
0.0
0.5
1.0
1.5
0
100
200
3002007
Fig. 3b. The variation in the mean midday energy balance partition-ing and evapotranspiration rates during summer 2006–2008 at theBiocomplexity Experiment site.
50
FIGURE 4 913
914
915 916
0.6
0.8
1.0
1.2
1.4
-0.15 -0.10 -0.05 0.00
0.0
0.1
0.2
0.3
b)
a)
R2 0.64
p <0.01
Pri
estle
y-T
aylo
r a
lph
a v
alu
e
R2 0.69
p <0.01
Gro
un
d h
ea
t flu
x /
Ne
t ra
dia
tio
n
Water Potential, MPa
Fig. 4. The rate of evapotranspiration in relation to(a) the equi-librium rate (Priestley-Taylorα) and(b) near-surface soil moistureat the BE site. The partitioning of net radiation,Rn, into groundheat flux is linearly correlated to near-surface soil moisture (10 cmdepth). The results represents mean midday values at the BE site.
reduced (15 July–15 August 1999–2003 and 2006). Highbulk surface resistance (∼100 s m−1) often occurred with el-evated VPD throughout the study period (Fig. 6). The resultssuggest that (a) net radiation was the primary control onET in wet soils when VPD<0.3 kPa and (b) increased bulksurface resistance suppressed the evapotranspiration duringlarge atmospheric demand even if the soils were wet.
Surface energy partitioning depended on wind direction(Table 2). Onshore winds favored energy partitioning intosensible heat flux (β1.37), while the Bowen ratio was slightlybelow unity during offshore conditions (0.87) at the CMsite. Partitioning into both ground and latent heat increasedwith offshore winds, while the sensible heat flux portion de-creased. No onshore-offshore analysis was performed at theBE site, as onshore and offshore wind directions representdiffering landscape features (drained thaw lake and uplands,respectively).
Two days in late July 2000 showed the cascading effectson meteorological conditions and surface energy balance thatwere induced by altered wind directions (Fig. 7). The first
Biogeosciences, 8, 3375–3389, 2011 www.biogeosciences.net/8/3375/2011/

A. K. Liljedahl et al.: Nonlinear controls on evapotranspiration 3383
Table 4. Mean midday energy partitioning and bulk parametersat the BE site between 20 July and 12 August during wet, but notinundated (2006 and 2008), and dry (2007) soil moisture conditions.Only days with VPD below 0.3 kPa are included. Dry soil moistureconditions represent9 <−0.13 MPa at 10 cm depth, which equalsa water table at∼15 cm depth, and no prior precipitation.
Wet Dry
LE/Rn 0.34± 0.08 0.37± 0.05H/Rn 0.43± 0.10 0.65± 0.06G/Rn 0.14± 0.04 0.06± 0.02Closure 0.91± 0.14 1.08± 0.08β 1.33± 0.32 1.79± 0.25� 0.76± 0.08 0.63± 0.04α 0.89± 0.09 0.72± 0.06rc (s m−1) 41± 22 57± 14ra (s m−1) 63± 19 48± 10ri (s m−1) 10± 6 7± 6
Closure = (LE+H +G)/Rn, Dry =9 <−0.13 MPa
day represented near-normal meteorological conditions, withonshore winds resulting in an equal partitioning ofLE andH . Offshore winds occurred during the following day, whichresulted in high VPD (1.3 kPa), withLE dominatingH . TheLE exceededH when the VPD passed 0.37 kPa (see Fig. 7,vertical dashed lines). Conversely,LE andH became equallater in the afternoon when the VPD returned to 0.37 kPa.Bulk surface resistance and Priestley-Taylorα responded ac-cordingly, with increasing mean midday bulk surface resis-tance (from 75 to 128 s m−1) and increasing Priestley-Taylorα (from 0.84 to 1.03).
6 Discussion
Our analyses confirm earlier landscape-scale work fromcoastal Arctic wetlands that relied on Bowen ratio and en-ergy balance techniques as well as plant-scale ecohydrolog-ical studies from the Arctic Coastal Plain. The high Mc-Naughton and Jarvis�-factor suggests that net radiation wasthe main control on evapotranspiration rates, but our resultsshow that midday evapotranspiration rates are additionallyconstrained during both wet and dry near-surface conditions.We concur with previous studies that state the importanceof maritime air mass favoring sensible heat (large tempera-ture gradients) and suppressing latent heat flux (low VPD)(Rouse et al., 1987; Lafleur and Rouse, 1988; Price, 1991;Harazono et al., 1998). We also show that near-surface soilmoisture conditions and VPD express nonlinear effects onmidday evapotranspiration. Ultimately, the various control-ling factors (i.e., net radiation; soil moisture; VPD; and, de-spite wet near-surface soils, bulk surface resistance duringhigh VPD) reduced the evapotranspiration under a range ofmeteorological and hydrologic conditions, which have thepotential to buffer interannual variation of total evapotran-
Table 5. Average midday energy balance partitioning and bulk pa-rameters during VPD below and above 0.3 kPa at the CM (1999–2003) and BE (2006) sites, during wet, but not inundated, near-surface soil moisture conditions (15 July–15 August).
Wet SoilsVPD<0.3 kPa VPD>0.3 kPa
LE/Rn 0.30± 0.14 0.36± 0.14H/Rn 0.38± 0.16 0.35± 0.14G/Rn 0.15± 0.08 0.14± 0.07Closure 0.83± 0.21 0.83± 0.19β 1.45± 0.61 1.04± 0.53� 0.72± 0.22 0.59± 0.17α 0.89± 0.20 0.91± 0.25rc (s m−1) 51± 47 114± 61ra (s m−1) 63± 45 64± 42ri (s m−1) 13± 12 39± 24
Wet soils =9� −0.13 MPa
spiration. Midday evapotranspiration rates were, on average,70 % (BE) and 75 % (CM) of the potential rate as defined bya Priestley-Taylorα-value of 1.26.
The generally low vapor pressure deficits (mean midday0.12 kPa) play an important role in suppressing the evap-otranspiration from arctic coastal wetlands. A VPD near0.3 kPa appears to represent a threshold during wet near-surface soils (Fig. 5). Above 0.3 kPa, latent heat fluxes al-ways dominated sensible heat fluxes, and the evapotranspira-tion rates always remained near or above the equilibrium rate(Fig. 5, Table 5).
Despite large interannual variations in mean summer airtemperature, the number of days exceeding a VPD of 0.3 kPavaried only between 8 (2003) and 14 days (2001). In addi-tion, it was the coldest summer (2001) that had the most daysabove 0.3 kPa, although the two warmest summers (1999 and2007) trailed closely behind (12 and 13 days, respectively).Hence, warmer mean summer air temperatures did not nec-essarily mean an increased number of days with VPDs above0.3 kPa.
An increased atmospheric demand favored the partition-ing of net radiation intoLE, but an increased bulk surfaceresistance – despite wet soils – prevented evapotranspirationfrom reaching its potential rate (α ∼1.26) (Table 5). The re-duction in� suggests that VPD increased its role in drivingevapotranspiration when VPD reached above 0.3 kPa. Simul-taneously, a VPD>0.3 kPa more than doubled the bulk sur-face resistance, which limited any increase in the Priestley-Taylorα. The rate of water movement through moss (capil-lary forces upwards from the water table) is likely not ableto support potential evaporation rates. Our landscape-scalefindings agree with earlier plot-scale studies of tundra vas-cular and non-vascular conductance (inverse of resistance)(Johnson and Caldwell, 1975; Oechel and Sveinbjornsson,
www.biogeosciences.net/8/3375/2011/ Biogeosciences, 8, 3375–3389, 2011

3384 A. K. Liljedahl et al.: Nonlinear controls on evapotranspiration
51
FIGURE 5 917
918
919 920
0.0 0.5 1.0 1.5 2.00.0 0.5 1.0
0.0
0.5
1.0
1.5
2.0
0.0 0.5 1.0
0.0
0.5
1.0
1.5
2.0
2.5
3.0
Wet surface
Dry surface2007
VPD (kPa)
b)
2006
Prie
stle
y-T
aylo
r a
lph
a v
alu
e
2008
Wet surface
Dry surface
2007a)
2006
Bo
we
n R
atio
2008
Fig. 5. The relationship between mean hourly air vapor pressure deficit (VPD) and(a) Bowen ratio (β) or (b) Priestley-Taylorα duringdiffering soil moisture conditions at the BE site, 2006–2008. Dry soils represent a soil water potential<−0.13 MPa at 10 cm depth. Thevertical dashed lines represent the identified critical value of VPD. VPDs above this threshold resulted in aβ < 1 and a Priestley-Taylorα near or above 1. The identified VPD thresholds were 0.25 (2006), 0.31 (2007), and 0.28 kPa (2008) for wet soils and 1.19 kPa for drysoils (2007).
1978), in which surface cover (despite wet soils) was unableto deliver enough moisture when atmospheric demands werehigh.
Hence, the evapotranspiration from the two studied vege-tated, drained thaw lakes was suppressed during both low andhigh VPDs, but through differing mechanisms. The lowerVPDs present a direct atmospheric constraint as the air is un-able to hold much additional moisture. High VPD resultsin an indirect constraint on evapotranspiration rates throughan insufficient transfer rate of water through the moss layer,expressed through an increased bulk surface resistance.
Near-surface soil moisture plays an important role incontrolling energy balance in vegetated, drained thaw lakebasins. The higher Priestley-Taylorα and the lower bulk sur-face resistances during high near-surface soil moisture pre-sented reduced constraints on evapotranspiration (Fig. 4a,Table 4). However, the linkage between evapotranspiration
and soil moisture appears to be more complex, since the ra-tio of latent heat flux to net radiation was similar betweendry and wet soils during VPDs<0.3 kPa. The increased par-titioning into ground heat flux during wet (compared to dry)soils reduced the energy available for midday sensible andlatent heat flux – a phenomenon which has also been dis-cussed by McFadden et al. (1998). Not unlike the discussionabout the nonlinear controls of VPD on evapotranspiration,we suggest that midday evapotranspiration was suppressedduring both dry and wet soils but through differing mecha-nisms: (a) energy limitations (wet soils) through an increasedpartitioning of net radiation into ground heat flux and (b) wa-ter limitations (dry soils).
The multiple nonlinear controls may moderate the spa-tial variability in the energy partitioning from different veg-etation types. Short-term mid-summer measurements ofLE/Rn at tussock, tussock-shrub, shrub, and wet sedge tundra
Biogeosciences, 8, 3375–3389, 2011 www.biogeosciences.net/8/3375/2011/

A. K. Liljedahl et al.: Nonlinear controls on evapotranspiration 3385
52
FIGURE 6 921
922
923
924 925
926
1-Jun 29-Jun 27-Jul 24-Aug
0
200
400
e)2003
R 0.57
p<0.01
0
200
400
b)
2000
0
200
400
c)
Bulk
surf
ace
resis
tance
(s m
-1)
2001
0
200
400
d)
2002
0
200
400
a) Resistance
1999
2
1
0
VPD
2
1
0
2
1
0
VP
D (k
Pa)
2
1
0
2
1
0
2
1
0
Central Marsh
0
200
400
f)
Bulk
surf
ace
resis
tance
(s m
-1)
2006
0
200
400
g)R 0.57
p<0.01
2007
1-Jun 29-Jun 27-Jul 24-Aug
0
200
400
h)
2008
2
1
0
2
1
0
VP
D
(kP
a)
2
1
0
Biocomplexity Experiment
Fig. 6. Mean midday values of bulk surface resistance (rc) and VPDat the CM(a–e)and BE(f–h) sites.
ranged from 35 to 42 % (mean 38 %) (McFadden et al.,1998), which is close to our wet and dry mid-summer condi-tions (34–37 %). It is apparent, however, that there is quitea large variability inLE/Rn between sites and time periodsfrom a multitude of short-term eddy covariance measure-ments across the North Slope of Alaska (Eugster et al., 2000).Nevertheless, values inLE/Rn and other measures presentedin this study, agree well with those reported by Harazono etal. (1998), Eugster et al. (2000), McFadden et al. (1998), andMcFadden and Chapin III (2003) of non-shrub coastal sitesin Arctic Alaska. Accordingly, the details presented in thisstudy are representative of the Arctic Coastal Plain (<135 kmfrom the ocean) even though the energy partitioning (andcontrols on ET) may show similarities to other locations.
The measurements employed in this study cannot distin-guish transpiration from evaporation, but our results can becompared to past findings. Firstly, measured mean ET rates(1.5 and 1.9 mm day−1) were more than twice the maximumvascular transpiration (0.2 mm day−1) estimated by Millerand Tieszen (1972) during peak LAI. Secondly, the measurednear-surface soil water potentials never reached the soil wa-ter potentials for stomatal closure typical for tundra vascular
53
FIGURE 7 927
928
Fig. 7. Meteorological conditions, energy balance, and bulk param-eters during a two-day time period (22 and 23 July 2000), when thewind shifted from onshore to offshore. The high VPD on 23 Julycoincides with offshore winds. Latent heat became the dominantheat sink when air vapor pressure deficit reached above 0.3 kPa.
www.biogeosciences.net/8/3375/2011/ Biogeosciences, 8, 3375–3389, 2011
3386 A. K. Liljedahl et al.: Nonlinear controls on evapotranspiration
vegetation, a value established by Stoner and Miller (1975)and Johnson and Caldwell (1975). However, soil waterpotentials surpassed the limit for effective water transportthrough moss (−0.1 MPa) in July 2007, which simultane-ously saw an increased canopy resistance. Had the vascu-lar vegetation played a dominant role, the observed increasein bulk surface resistance in late summer of 2003 and 2007would have been less likely. This is because the soil wa-ter potential to initiate stomata closure was never reached. Inaddition, as mosses represent the majority of the live biomass(Zona et al., 2011), one could argue that they represent akey hydrologic pathway between land and atmospheric sys-tems. And, in fact, boreal mosses are known to act as a heatand moisture “rectifier”, allowing heat and moisture fluxesto proceed when they are moist, and reducing heat and mois-ture fluxes under hot and dry conditions when the uppermostmoss surfaces are dry (Oechel and Van Cleve, 1986). How-ever, a determination of the amount of transpiration and evap-oration on total evapotranspiration would require hydrologicmodel simulations or isotopic analyses, which are beyond thescope of this study.
Overall, the two vegetated, drained thaw lake basins expe-rienced similar distribution in the energy balance partitioningand bulk parameters, despite differences in weather betweenthe years (Tables 1, 3). It should be noted that at least a thirdof the data from the BE site represents the unusually lowprecipitation and warm summer of 2007, which may explaindifferences in site averages. Still, the general partitioningof the energy balance components were similar, even undera relatively wide range of soil moisture conditions. The lim-ited differences between the two sites and the agreement withprevious studies suggest that our findings can represent thelarger arctic coastal wetland domain.
Future projections
According to global climate model projections for the mid-21st century, summer air temperature and precipitation willgenerally increase in the Arctic (Walsh, 2008). Some parts ofthe land-ocean-atmosphere system are projected to change,but we may also hypothesize resistance in some componentsof the system. For example, future summer air-mass condi-tions at the Arctic Coastal Plain are likely to continue to bedominated by a 24-h sea breeze, which brings in moist, coolair that suppresses the evapotranspiration in addition to thenonlinear controls by soil moisture. The future evapotran-spiration rates may therefore remain dampened, which is inagreement with Rouse et al. (1992) and in contradiction tothe hypothesis of Lafleur (1993).
However, it is challenging to predict long-term effectsof climate warming on Arctic wetland hydrology. Theintegrated response of the coupled permafrost-vegetation-hydrology system to a warmer climate could drastically af-fect the surface energy exchange by curbing or acceleratinghydrologic fluxes. The presented results offer an example of
this complex system, as evapotranspiration rates integratedacross a common landscape type respond nonlinearly to amultitude of controlling factors.
7 Conclusions
Evapotranspiration from low-relief, vegetated, drained thawlake basins experience multiple limitations through nonlinearrelationships to atmospheric vapor demand and near-surfacesoil moisture. We estimated that current midday evapotran-spiration rates represent, on average,<75 % of the potentialrates despite the typical saturated near-surface conditions.Midday evapotranspiration was suppressed through differ-ent mechanisms: (a) vapor pressure deficits near 0.3 kPaappeared to be an important hydrological threshold, allow-ing latent heat flux to persistently exceed sensible heat flux;(b) dry compared to wet soils increased the bulk surface re-sistance (water-limited); (c) wet soils favored ground heatflux and therefore limited the energy available to sensibleand latent heat flux (energy-limited); and (d) wet soils (pond-ing excluded) combined with large atmospheric demands re-sulted in an increased bulk surface resistance and thereforesuppressing the evapotranspiration to below its potential rate(Priestley-Taylorα < 1.26). The latter was likely caused bythe limited ability of mosses to transfer moisture during largeatmospheric demands. Our landscape-scale analyses agreewell with plant-scale ecohydrological studies from the Arc-tic Coastal Plain. To conclude, there is a resistance in thehydrologic system that curbs soil drying in coastal Arcticwetlands. We propose that the wetness of the arctic coastalwetlands will persist – despite a warming climate – due to theprevailing maritime winds, increased precipitation, and mul-tiple controls on evapotranspiration. Refined projections offuture evapotranspiration should also include linkages to ge-omorphology and vegetation dynamics, which were beyondthe scope of this study.
Acknowledgements.We thank Chapin III, F. S., Eugster, W., Kane,D. L., and Fox Jr., J. D., for their reviews of early versions of themanuscript. The Editor and journal reviewers provided valuablecomments that we much appreciated. Thanks to Aquierra, A., whoprovided Fig. 1; Busey, R., for technical assistance; Victorino, G.,Villareal, S., and Vargas, S. for assistance with field work; BarrowArctic Science Consortium for logistical assistance; and UkpeagvikInupiat Corporation for land access to the Barrow EnvironmentalObservatory. Financial support for this research was providedthrough the National Science Foundation, grants 0652838,0632263, and 0421588. Any opinions, findings, conclusions, orrecommendations expressed are those of the authors and do notnecessarily reflect the views of NSF. Mention of specific productnames does not constitute endorsement by NSF.
Edited by: P. Stoy
Biogeosciences, 8, 3375–3389, 2011 www.biogeosciences.net/8/3375/2011/
A. K. Liljedahl et al.: Nonlinear controls on evapotranspiration 3387
References
Bockheim, J. G., Everett, L. R., Hinkel, K. M., Nelson, F. E., andBrown, J.: Soil organic carbon storage and distribution in tundra,Barrow, Alaska, Soil Sci. Soc. Am. J., 63, 934–940, 1999.
Boike, J., Wile, C., and Abniozva, A.: Climatology and sum-mer energy and water balance of polygonal tundra in theLena River Delta, Siberia, J. Geophys. Res., 113, G03025,doi:10.1029/2007JG000450, 2008.
Bowling, L. C. and Lettenmaier, D. P.: Modeling the effects of lakesand wetlands on the water balance of arctic environments, J. Hy-drometeorol., 11, 276–295, 2010.
Bowling, L. C., Kane, D. L., Gieck, R. E., Hinzman, L. D.,and Lettenmaier, D. P.: The role of surface storage in alow-gradient Arctic watershed, Water Resour. Res., 39, 1087,doi:10.1029/2002WR001466, 2003.
Brown, J. and Johnson, P. L.: Pedo-ecological investigations at Bar-row, Alaska, US Army Cold Regions Research and EngineeringLab., Hanover, USA, Tech. Rep., 159:32, 32 pp., 1965.
Brown, J. R., Dingman, S. L., and Lewellen, R. I.: Hydrology ofa drainage basin on the Alaskan Coastal Plain, US Army ColdRegions Research and Engineering Lab., Hanover, USA, Res.Rep., 240, 18 pp., 1968.
Brutsaert, W.: Evaporation into the atmosphere, reprinted 1991,Kluwer Academic Publishers, Dordrecht, The Netherlands, 299pp., 1982.
Cava, D., Contini, D., Donateo, A., and Martano P.: Analysis ofshort-term closure of the surface energy balance above short veg-etation, Agr. Forest Meteorol., 148, 82–93, 2008.
DeBruin, H. A. R.: A model for the Priestley–Taylor parameterα,J. Clim. Appl. Meteorol., 22, 572–578, 1983.
Dennis, J. G. and Johnson, P. L.: Shoot and rhizome-root standingcrops of tundra vegetation at Barrow, Alaska, Arctic Alpine Res.,2, 253–266, 1970.
Dennis, J. G., Tieszen, L. L., and Vetter, M. A.: Seasonal dynamicsof above- and below-ground production of vacular plants at Bar-row, Alaska, in: Vegetation and production ecology of an AlaskaArctic tundra, edited by: Tieszen, L. L., Springer-Verlag, NewYork, 113–140, 1978.
Engstrom, R., Hope, A. Stow, D. A., Vourlitis, G. L., and Oechel,W. C.: Priestley-Taylor coefficient: Variability and relationshipto NDVI in tundra landscapes, J. Am. Water Resour. As., 38,1647–1659, 2002.
Engstrom, R., Hope, A., Kwon, H., Stow, D., and Zamolodchikov,D.: Spatial distribution of near surface soil moisture and its rela-tionship to microtopography in the Alaskan Arctic coastal plain,Nord. Hydrol., 36, 219–234, 2005.
Engstrom, R., Hope, A., Kwon, H., Harazono, Y., Mano, M., andOechel, W. C.: Modeling evapotranspiration in Arctic coastalplain ecosystems using a modified BIOME-BGC model, J. Geo-phys. Res., 111, G02021,doi:10.1029/2005JG000102, 2006.
Eugster, W., Rouse, W., Pielke, R. A., McFadden, J. P., Baldocchi,D. D., Kittel, T. G. F., Chapin III, F. S., Liston, G. E., Vidale,P. L., Vaganov, E., and Chambers, S.: Land-atmosphere energyexchange in Arctic tundra and boreal forest: Available data andfeedbacks to climate, Glob. Change Biol., 6, 84–115, 2000.
Farouki, O. T.: Thermal properties of soil, US Army Cold RegionsResearch and Engineering Lab., Hanover, N.H., Report 81–1,1981.
Harazono, Y., Yoshimoto, M., Mano, M., Vourlitis, G. L., and
Oechel, W. C.: Characteristics of energy and water budgets overwet sedge and tussock tundra ecosystems at North Slope Alaska,Hydrol. Process., 12, 2163–2183, 1998.
Harazono, Y., Mano, M., Miyata, A., Zulueta, R. C., and Oechel,W. C.: Inter-annual carbon dioxide uptake of a wet sedge tundraecosystem in the Arctic, Tellus, 55B, 215–231, 2003.
Hayward, P. M. and Clymo, R. S.: Profiles of water-content andpore-size in Sphagnum and peat, and their relation to peat bogecology, Royal Soc. London Series B-Biol. Sci. Conf. Proceed.,215, 299–325, 1982.
Hinkel, K. M., Eisner, W. R., Bockheim, J. G., Nelson, F. E., Peter-son, K. M., and Dai, X.: Spatial extent, age, and carbon stocks indrained thaw lake basins on the Barrow Peninsula, Alaska, Arct.Antarct. Alp. Res., 35, 291–300, 2003.
Hinkel, K. M., Frohn, R. C., Nelson, F. E., Eisner, W. R., and Beck,R. A.: Morphometric and spatial analysis of thaw lakes anddrained lake basins in the western Arctic Coastal Plain, Alaska,Permafrost Periglac., 16, 327–341, 2005.
Hinzman, L. D., Kane, D. L., Gieck, R. E., and Everett, K. R.:Hydrological and thermal properties of the active layer in theAlaskan Arctic, Cold Reg. Sci. Technol., 19, 95–110, 1991.
Hollister, R. D. and Flaherty, K. J.: Above- and below-groundplant biomass response to experimental warming in north-ern Alaska, Appl. Veg. Sci., 13, 1–10,doi:10.1111/j.1654-109X.2010.01079.x, 2010.
Johnson, D. A. and Caldwell, M. M.: Gas exchange of four Arcticand Alpine tundra plant species in relation to atmospheric andsoil moisture stress, Oecologia, 21, 93–108, 1975.
Kaimal, J. C. and Gaynor, J. E.: Another look at sonic thermometry,Bound. Lay. Meteorol., 56, 401–410, 1991.
Kane, D. L. and Yang, D.: Overview of water balance determina-tions for high latitude watersheds, in: Northern Research BasinsWater Balance, edited by: Kane, D. L. and Yang, D., IAHS, Ox-fordshire, UK, 1–12, 2004.
Kane, D. L., Hinzman, L. D., Benson, C. S., and Everett, K. R.:Hydrology of Imnavait Creek, an watershed, Holarctic Ecol., 12,262–269, 1989.
Kane, D. L., Hinzman, L. D., Woo, M.-K., and Everett, K. R.:Arctic hydrology and climate change, in: Arctic Ecosystem ina Changing Climate, edited by: Chapin III, F. S., Jeffries, R. L.,Reynolds, J. E., Shaver, G. R., and Svoboda, J., Academic, SanDiego, CA, 35–57, 1992.
Kane, D. L., Gieck, R. E., and Hinzman, L. D.: Water balance fora low-gradient watershed in Northern Alaska, in: Proceedingsof the Ninth International Conference on Permafrost, edited by:Kane, D. L. and Hinkel, K. M., University of Alaska Fairbanks,AK, 883–888, 2008.
Kozo, T. L.: Evidence for sea breezes on the Alaskan Beaufort Seacoast, Geophys. Res. Lett., 6, 849–852, 1979.
Kozo, T. L.: An observational study of sea breezes along theAlaskan Beaufort Sea coast: Part 1, J. Appl. Meteorol., 21, 891–905, 1982.
Lafleur, P. M.: Potential water balance response to climatic warm-ing: The case of a coastal wetland ecosystem of the James Baylowland, Wetlands, 13, 270–276, 1993.
Lafleur, P. M. and Rouse, W. R.: The influence of surface coverand climate on energy partitioning and evaporation in a subarcticwetland, Bound. Lay. Meteorol., 44, 327–347, 1988.
Lafleur, P. M. and Rouse, W. R.: Energy partitioning at treeline
www.biogeosciences.net/8/3375/2011/ Biogeosciences, 8, 3375–3389, 2011

3388 A. K. Liljedahl et al.: Nonlinear controls on evapotranspiration
forest and tundra sites and its sensitivity to climate change, At-mos. Ocean, 33, 121–133, 1995.
Leuning, R., Ohtaki, E., Denmead, O. T., and Lang, A. R. G.: Ef-fects of heat and water vapor transport on eddy covariance mea-surement of CO2 fluxes, Bound. Lay. Meteorol., 23, 209–222,1982.
Mackay, J. R.: The Mackenzie Delta area, N. W. T., Departmentof Mines and Technical Surveys, Ottawa, Canada, GeographicalBranch Memoir 8, 202 pp., 1963.
Mano, M.: Study on the budget of carbon dioxide and methane at anarctic coastal wet sedge tundra, Ph.D. thesis, Chiba Univ., Chiba,Japan, 2003 (in Japanese).
McFadden, J. P. and Chapin III, F. S.: Subgrid-scale variability inthe surface energy balance of arctic tundra, J. Geophy. Res., 103,28947–28961, 1998.
McFadden, J. P., Eugster, W., and Chapin III, F. S.: A regional studyof the controls on water vapor and carbon exchange in arctic tun-dra, Ecology, 84, 2762–2776, 2003.
McNaughton, K. and Jarvis, P. G.: Predicting effects of vegetationchanges on transpiration and evaporation, in: Water deficits andplant growth, Vol. VII, edited by: Koslowski, T. T., AcademicPress, NY, 1–47, 1983.
Mendez, J., Hinzman, L. D., and Kane, D. L.: Evapotranspirationfrom a wetland complex on the Arctic Coastal Plain of Alaska,Nord. Hydrol., 29, 303–330, 1998.
Miller, P. C. and Tieszen, L.: A preliminary model of processesaffecting primary production in the Arctic tundra, Arctic AlpineRes., 4, 1–18, 1972.
Minke, M., Donner, N., Karpov, N., De Klerk, P., and Joosten, H.:Distribution, diversity, development and dynamics of polygonsmires: Examples from Northeast Yakutia (Siberia), PeatlandsInt., 1, 36–40, 2007.
Monteith, J. L.: Evaporation and the environment, Symp. Soc. Exp.Biol., 19, 205–234, 1965.
Monteith, J. L.: Principles of Environmental Physics, EdwardArnold, London, 1973.
Moore, C. J.: Frequency response corrections for eddy correlationsystem, Bound. Lay. Meteorol., 37, 17–35, 1986.
Moritz, R. E.: On a possible sea-breeze circulation near Barrow,Alaska, Arctic Alpine Res., 9, 427–431, 1977.
Myers, J. P. and Pitelka, F. A.: Variations in summer temperaturepatterns near Barrow, Alaska: Analysis and ecological interpre-tation, Arctic Alpine Res., 11, 131–144, 1979.
Oechel, W. C. and Sveinbjornsson, B.: Photosynthesis of Arc-tic Bryophytes, in: Vegetation and Production Ecology of anAlaskan Arctic Tundra, edited by: Tieszen, L. L., Springer Ver-lag, NY, 1978.
Oechel, W. C. and van Cleve, K.: The role of bryophytes in nutrientcycling in the taiga, in: Forest ecosystems in the Alaskan taiga:A synthesis of structure and function, edited by: van Cleve, K.,Chapin III, F. S., Flanagan, P. W., Viereck, L. A., and Dyrness,C. T., Springer-Verlag, NY, 121–137, 1986.
Oechel, W. C., Vourlitis, G. L., Hastings, S. J., Ault, R. P., andBryant, P.: The effects of water table manipulation and elevatedtemperature on the net CO2 flux of wet sedge tundra ecosystems,Glob. Change Biol., 4, 77–90, 1998.
Olivas, P. C., Oberbauer, S. F., Tweedie, C. E., Oechel, W. C.,and Kuchy, A.: Responses of CO2 flux components of AlaskanCoastal Plain tundra to shifts in water table, J. Geophys. Res.,
115, G00I05,doi:10.1029/2009JG001254, 2010.Price, J.: Evaporation from a blanket bog in a foggy coastal envi-
ronment, Bound. Lay. Meteorol., 57, 391–406, 1991.Price, J., Edwards, T. W. D., Yi, Y., and Whittington, P. N.: Physi-
cal and isotopic characterization of evaporation from Sphagnummoss, J. Hydrol., 369, 175–182, 2009.
Priestley, C. H. B. and Taylor, R. J.: On the assessment of surfaceheat flux and evaporation using large–scale parameters, Mon.Weather Rev., 100, 81–92, 1972.
Rastorfer, J. R.: Composition and bryomass of the moss layers oftwo wet-tundra meadow communities near Barrow, Alaska, in:Vegetation and Production Ecology of an Alaskan Arctic Tundra,edited by: Tieszen, L. L., Springer-Verlag, NY, 169–184, 1978.
Rouse, W. R., Hardill, S. G., and Lafleur, P.: The energy balancein the coastal environment of James and Hudson Bay during thegrowing season, J. Climatol., 7, 165–179, 1987.
Rouse, W. R., Carlson, D. W., and Wieck, E. J.: Impacts of sum-mer warming on the energy and water balance of wetland tundra,Climatic Change, 22, 305–326, 1992.
Rovansek, R. J., Hinzman, L. D., and Kane, D. L.: Hydrology ofa tundra wetland complex on the Alaskan Arctic Coastal Plain,USA, Arctic Alpine Res., 28, 311–317, 1996.
Ryu, Y., Baldocchi, D. D., Ma, S., and Hehn, T.: Interannual vari-ability of evapotranspiration and energy exchange over an an-nual grassland in California, J. Geophys. Res., 113, D09104,doi:10.1029/2007JD009263, 2008.
Shiklomanov, N. I., Streletskiy, D. A., Nelson, F. E., Hollis-ter, R. D., Romanovsky, V. E., Tweedie, C. E., and Brown,J.: Decadal variations of active-layer thickness in moisture-controlled landscapes, Barrow, Alaska, J. Geophys. Res., 115,G00I04,doi:10.1029/2009JG001248, 2010.
Shulski, M. and Wendler, G.: Climate of Alaska, University ofAlaska Press, Fairbanks, AK, 216 pp., 2007.
Stewart, J. B. and Thom, A. S.: Energy budget in pine forest, Q. J.Roy. Meteor. Soc., 99, 154–170, 1973.
Stoner, W. A. and Miller, P. C.: Water relations of plant species inthe wet coastal tundra at Barrow, Alaska, Arctic Alpine Res., 7,109–124, 1975.
Tanner, C. B. and Thurtell, G. W.: Anemoclinometer measure-ments of Reynolds stress and heat transport in the atmosphericsurface layer, University of Wisconsin, USA, available from USArmy Electronic Command, Atmospheric Sciences Laboratory,Ft. Huachuca, AZ 85613., Tech Rep. ECOM-66-G22-F, 82 pp.,1969.
Thom, A. S.: Momentum, mass, and heat exchange of plant com-munities, in: Vegetation and the Atmosphere, Vol. 1, edited by:Monteith, J. L., Academic Press, NY, 57–110, 1975.
Tieszen, L. L.: Vegetation and production ecology of an AlaskanArctic tundra, Ecological Studies, Springer-Verlag, New York,NY, 1978.
van Genuchten, M. T. A.: Closed-form equation for predicting thehydraulic conductivity of unsaturated soils, Soil Sci. Soc. Am. J.,44, 892–898, 1980.
Vorosmarty, C. J., Hinzman, L. D., Peterson, B. J., Bromwich, D.H., Hamilton, L. C., Morison, J., Romanovsky, V. E., Sturm, M.,and Webb, R. S.: The hydrologic cycle and its role in Arctic andglobal environmental change: A rational and strategy for syn-thesis study, Arctic Res. Consortium of the US, Fairbanks, AK,Report, 84 pp., 2001.
Biogeosciences, 8, 3375–3389, 2011 www.biogeosciences.net/8/3375/2011/

A. K. Liljedahl et al.: Nonlinear controls on evapotranspiration 3389
Vourlitis, G. L. and Oechel, W. C.: Landscape scale CO2, H2Ovapor and energy flux of moist-wet coastal tundra ecosystem overtwo growing seasons, J. Ecol., 85, 575–590, 1997.
Walker, D. A., Raynolds, M. K., Daniels, F. J. A., Einarsson, E.,Elvebakk, A., Gould, W. A., Katenin, A. E., Skholod, S. S.,Markon, C. J., Evgeny, S., Moskalenko, N. G., Talbot, S. S., andYurtsev, B. A.: The circumpolar arctic vegetation map, J. Veg.Sci., 16, 267–282, 2005.
Walsh, J. E.: Measurement of the temperature, wind, and moisturedistribution across the northern coast of Alaska, Arctic AlpineRes., 9, 175–182, 1977.
Walsh, J. E.: Climate of the Arctic Marine Environment, Ecol.Appl., 18, 3–22, 110, 2008.
Webb, E. K., Pearman, G. I., and Leuning, R.: Correction of fluxmeasurements for density effects due to heat and water vaportransfer, Q. J. Roy. Meteor. Soc., 106, 85–100, 1980.
Webber, P. J.: Tundra primary productivity, in: Arctic and AlpineEnvironments, edited by: Ives, J. D. and Barry, R. G., Methuen,London, UK, 445–473, 1974.
Webber, P. J.: Spatial and temporal variation of the vegetationand its productivity, in: Vegetation and Production Ecology ofan Alaskan Arctic Tundra, edited by: Tieszen L. L., Springer-Verlag, NY, 37–112, 1978.
Wilson, K., Goldstein, A., Falge, E., Aubinet, M., Baldocchi, D.,Berbigier, P., Berndorfer, C., Ceulemans, R., Dolman, H., Field,C., Grelle, A., Ibrom, A., Law, B. E., Kowalski, A., Meyers, T.,Moncrieff, J., Monson, R., Oechel, W., Tenhunen, J., Valentini,R., and Verma, S.: Energy balance closure at FLUXNET sites,Agr. Forest Meteorol., 113, 223–243, 2002.
Woo, M.-K., Young, K. L., and Brown, L.: High-Arctic patchy wet-lands: Hydrologic variability and their sustainability, Phys. Ge-ogr., 27, 297–307, 2006.
Woo, M. K., Kane, D. L., Carey, S. K., and Yang, D.: Progressin permafrost hydrology in the new millennium, PermafrostPeriglac., 19, 237–254, 2008.
Yang, D., Goodison, B. E., Ishida, S., and Benson, C.: Adjustmentof daily precipitation data of 10 climate stations in Alaska: Ap-plications of world meteorological organization intercomparisonresults, Water Resour. Res., 34, 241–256, 1998.
Zona, D., Oechel, W. C., Kochendorfer, J., Paw U, K. T., Salyuk,A. N., Olivas, P. C., Oberbauer, S. F., and Lipson, D.: Methanefluxes during the initiation of a large-scale water able manip-ulation experiment in the Alaskan Arctic tundra, Global Bio-geochem. Cy., 23, GB2013,doi:10.1029/2009GB003487, 2009.
Zona, D., Oechel, W. C., Peterson, K. M., Clements, R. J.,Paw, K. T., and Ustin, S. L.: Characterization of the carbonfluxes of a vegetated drained lake basin chronosequence on theAlaskan Arctic Coastal Plain, Glob. Change Biol., 16, 1870–1882, doi:10:1111/j.1365-2486.2009.02107.x, 2010.
Zona, D., Oechel, W. C., Richards, J. H., Hastings, S., Kopetz, I.,Ikawa, H., and Oberbauer, S.: Light stress avoidance mecha-nisms in Sphagnum dominated wet coastal Arctic tundra ecosys-tem in Alaska, Ecology, 9, 633–644, 2011.
www.biogeosciences.net/8/3375/2011/ Biogeosciences, 8, 3375–3389, 2011
Related Documents