Noninvasive Continuous Arterial Blood Pressure Monitoring with Nexfin ® Jerson R. Martina, M.Sc.,* Berend E. Westerhof, M.Sc., Ph.D.,† Jeroen van Goudoever, M.Sc., Ph.D.,‡ Edouard M. F. H. de Beaumont, M.D.,§ Jasper Truijen, M.D., Yu-Sok Kim, M.D., Rogier V. Immink, M.D.,# Dorothea A. Jo ¨ bsis, M.D.,** Markus W. Hollmann, M.D., Ph.D.,†† Jaap R. Lahpor, M.D., Ph.D.,‡‡ Bas A. J. M. de Mol, M.D., Ph.D.,§§ Johannes J. van Lieshout, M.D., Ph.D. ABSTRACT Background: If invasive measurement of arterial blood pres- sure is not warranted, finger cuff technology can provide continuous and noninvasive monitoring. Finger and radial artery pressures differ; Nexfin (BMEYE, Amsterdam, The Netherlands) measures finger arterial pressure and uses phys- iologic reconstruction methodologies to obtain values com- parable to invasive pressures. Methods: Intra-arterial pressure (IAP) and noninvasive Nexfin arterial pressure (NAP) were measured in cardiotho- racic surgery patients, because invasive pressures are avail- able. NAP-IAP differences were analyzed during 30 min. Tracking was quantified by within-subject precision (SD of individual NAP-IAP differences) and correlation coef- ficients. The ranges of pressure change were quantified by within-subject variability (SD of individual averages of NAP and IAP). Accuracy and precision were expressed as group average SD of the differences and considered acceptable when smaller than 5 8 mmHg, the Associa- tion for the Advancement of Medical Instrumentation criteria. Results: NAP and IAP were obtained in 50 (34 – 83 yr, 40 men) patients. For systolic, diastolic, mean arterial, and pulse pressure, median (25–75 percentiles) correlation coefficients were 0.96 (0.91– 0.98), 0.93 (0.87– 0.96), 0.96 (0.90 – 0.97), and 0.94 (0.85– 0.98), respectively. Within-subject precisions were 4 2, 3 1, 3 2, and 3 2 mmHg, and within-subject variations 13 6, 6 3, 9 4, and 7 4 mmHg, indicating precision over a wide range of pressures. Group average SD of the NAP-IAP differences were 1 7, 3 6, 2 6, and 3 4 mmHg, meeting criteria. Differences were not related to mean arterial pressure or heart rate. Conclusion: Arterial blood pressure can be measured non- invasively and continuously using physiologic pressure re- construction. Changes in pressure can be followed and values are comparable to invasive monitoring. * Research Scientist, Department of Cardiothoracic Surgery, Uni- versity Medical Center Utrecht, Utrecht, The Netherlands. † Clinical Program Manager, BMEYE B.V., Amsterdam, The Netherlands, and Senior Research Fellow, Laboratory for Clinical Cardiovascular Physiology, AMC Heart Failure Research Center, Amsterdam, The Netherlands. ‡ Vice President of Resarch and Development, BMEYE B.V., and Senior Research Fellow, Laboratory for Clinical Cardio- vascular Physiology, AMC Heart Failure Research Center. § Anes- thesiologist, Department of Anesthesiology, Academic Medical Cen- ter, University of Amsterdam, Amsterdam, The Netherlands. Research Fellow, Laboratory for Clinical Cardiovascular Physiol- ogy, AMC Heart Failure Research Center. # Anesthesiologist, ** Re- searcher, †† Professor, Department of Anesthesiology, Academic Medical Center, University of Amsterdam. ‡‡ Professor, Department of Cardiothoracic Surgery, University Medical Center Utrecht. §§ Professor, Department of Cardiothoracic Surgery, Academic Medical Center, University of Amsterdam, and Professor, Depart- ment of Biomedical Engineering, Eindhoven University of Technol- ogy, Eindhoven, The Netherlands. Professor, School of Biomed- ical Sciences, University of Nottingham Medical School, Queen’s Medical Centre, Nottingham, United Kingdom, and Director, Acute Medical Care Unit, Department of Internal Medicine, Academic Medical Center, University of Amsterdam, and Director, Laboratory for Clinical Cardiovascular Physiology, AMC Heart Failure Research Center. Received from the Department of Internal Medicine, Academic Medical Center, University of Amsterdam, Amsterdam, The Nether- lands. Submitted for publication February 28, 2011. Accepted for publication January 27, 2012. Supported by grant No. 2006B027 from The Netherlands Heart Foundation, The Hague, The Nether- lands (to Dr. Truijen), and grant No. 2004.00.00 from The Dutch Diabetes Foundation, Amersfoort, The Netherlands (to Dr. Kim). Drs. van Goudoever and Westerhof are employees of and own shares of the BMEYE B.V., Amsterdam, The Netherlands. Address correspondence to Dr. Westerhof: BMEYE B.V. Center- point 1, 4th floor, Hoogoorddreef 60, 1101 BE Amsterdam, The Neth- erlands. [email protected]. This article may be accessed for personal use at no charge through the Journal Web site, www. anesthesiology.org. Copyright © 2012, the American Society of Anesthesiologists, Inc. Lippincott Williams & Wilkins. Anesthesiology 2012; 116:1092–103 This article is featured in “This Month in Anesthesiology.” Please see this issue of ANESTHESIOLOGY, page 9A. What We Already Know about This Topic • Recent studies have shown the feasibility of noninvasive and continuous blood pressure measurement during surgical pro- cedures. However, accuracy and precision are still debated. What This Article Tells Us That Is New • This study in cardiothoracic patients shows that intraoperative noninvasive blood pressure measurements using a recently developed device (Nexfin) incorporating physiologic recon- structive modeling are closely correlated to invasive blood pressure monitoring over a wide range of pressure changes. Anesthesiology, V 116 • No 5 May 2012 1092

Welcome message from author
This document is posted to help you gain knowledge. Please leave a comment to let me know what you think about it! Share it to your friends and learn new things together.
Transcript

Noninvasive Continuous Arterial Blood PressureMonitoring with Nexfin®
Jerson R. Martina, M.Sc.,* Berend E. Westerhof, M.Sc., Ph.D.,† Jeroen van Goudoever, M.Sc., Ph.D.,‡Edouard M. F. H. de Beaumont, M.D.,§ Jasper Truijen, M.D.,� Yu-Sok Kim, M.D.,� Rogier V. Immink, M.D.,#Dorothea A. Jobsis, M.D.,** Markus W. Hollmann, M.D., Ph.D.,†† Jaap R. Lahpor, M.D., Ph.D.,‡‡Bas A. J. M. de Mol, M.D., Ph.D.,§§ Johannes J. van Lieshout, M.D., Ph.D.��
ABSTRACT
Background: If invasive measurement of arterial blood pres-sure is not warranted, finger cuff technology can providecontinuous and noninvasive monitoring. Finger and radialartery pressures differ; Nexfin� (BMEYE, Amsterdam, TheNetherlands) measures finger arterial pressure and uses phys-iologic reconstruction methodologies to obtain values com-parable to invasive pressures.Methods: Intra-arterial pressure (IAP) and noninvasiveNexfin arterial pressure (NAP) were measured in cardiotho-racic surgery patients, because invasive pressures are avail-
able. NAP-IAP differences were analyzed during 30 min.Tracking was quantified by within-subject precision (SDof individual NAP-IAP differences) and correlation coef-ficients. The ranges of pressure change were quantified bywithin-subject variability (SD of individual averages ofNAP and IAP). Accuracy and precision were expressed asgroup average � SD of the differences and consideredacceptable when smaller than 5 � 8 mmHg, the Associa-tion for the Advancement of Medical Instrumentationcriteria.Results: NAP and IAP were obtained in 50 (34–83 yr, 40men) patients. For systolic, diastolic, mean arterial, and pulsepressure, median (25–75 percentiles) correlation coefficientswere 0.96 (0.91–0.98), 0.93 (0.87–0.96), 0.96 (0.90–0.97), and 0.94 (0.85–0.98), respectively. Within-subjectprecisions were 4 � 2, 3 � 1, 3 � 2, and 3 � 2 mmHg, andwithin-subject variations 13 � 6, 6 � 3, 9 � 4, and 7 � 4mmHg, indicating precision over a wide range of pressures.Group average � SD of the NAP-IAP differences were �1 �7, 3 � 6, 2 � 6, and �3 � 4 mmHg, meeting criteria.Differences were not related to mean arterial pressure orheart rate.Conclusion: Arterial blood pressure can be measured non-invasively and continuously using physiologic pressure re-construction. Changes in pressure can be followed and valuesare comparable to invasive monitoring.
* Research Scientist, Department of Cardiothoracic Surgery, Uni-versity Medical Center Utrecht, Utrecht, The Netherlands. † ClinicalProgram Manager, BMEYE B.V., Amsterdam, The Netherlands, andSenior Research Fellow, Laboratory for Clinical CardiovascularPhysiology, AMC Heart Failure Research Center, Amsterdam, TheNetherlands. ‡ Vice President of Resarch and Development, BMEYEB.V., and Senior Research Fellow, Laboratory for Clinical Cardio-vascular Physiology, AMC Heart Failure Research Center. § Anes-thesiologist, Department of Anesthesiology, Academic Medical Cen-ter, University of Amsterdam, Amsterdam, The Netherlands.� Research Fellow, Laboratory for Clinical Cardiovascular Physiol-ogy, AMC Heart Failure Research Center. # Anesthesiologist, ** Re-searcher, †† Professor, Department of Anesthesiology, AcademicMedical Center, University of Amsterdam. ‡‡ Professor, Departmentof Cardiothoracic Surgery, University Medical Center Utrecht.§§ Professor, Department of Cardiothoracic Surgery, AcademicMedical Center, University of Amsterdam, and Professor, Depart-ment of Biomedical Engineering, Eindhoven University of Technol-ogy, Eindhoven, The Netherlands. �� Professor, School of Biomed-ical Sciences, University of Nottingham Medical School, Queen’sMedical Centre, Nottingham, United Kingdom, and Director, AcuteMedical Care Unit, Department of Internal Medicine, AcademicMedical Center, University of Amsterdam, and Director, Laboratoryfor Clinical Cardiovascular Physiology, AMC Heart Failure ResearchCenter.
Received from the Department of Internal Medicine, AcademicMedical Center, University of Amsterdam, Amsterdam, The Nether-lands. Submitted for publication February 28, 2011. Accepted forpublication January 27, 2012. Supported by grant No. 2006B027from The Netherlands Heart Foundation, The Hague, The Nether-lands (to Dr. Truijen), and grant No. 2004.00.00 from The DutchDiabetes Foundation, Amersfoort, The Netherlands (to Dr. Kim).Drs. van Goudoever and Westerhof are employees of and ownshares of the BMEYE B.V., Amsterdam, The Netherlands.
Address correspondence to Dr. Westerhof: BMEYE B.V. Center-point 1, 4th floor, Hoogoorddreef 60, 1101 BE Amsterdam, The Neth-erlands. [email protected]. This article may be accessedfor personal use at no charge through the Journal Web site, www.anesthesiology.org.
Copyright © 2012, the American Society of Anesthesiologists, Inc. LippincottWilliams & Wilkins. Anesthesiology 2012; 116:1092–103
� This article is featured in “This Month in Anesthesiology.”Please see this issue of ANESTHESIOLOGY, page 9A.
What We Already Know about This Topic
• Recent studies have shown the feasibility of noninvasive andcontinuous blood pressure measurement during surgical pro-cedures. However, accuracy and precision are still debated.
What This Article Tells Us That Is New
• This study in cardiothoracic patients shows that intraoperativenoninvasive blood pressure measurements using a recentlydeveloped device (Nexfin�) incorporating physiologic recon-structive modeling are closely correlated to invasive bloodpressure monitoring over a wide range of pressure changes.
Anesthesiology, V 116 • No 5 May 20121092
D URING surgical procedures, an arterial access is reg-ularly required for continuous blood pressure moni-
toring and blood gas sampling. If no arterial line is required,blood pressure can be measured noninvasively with an upperarm cuff device, but only on an intermittent basis. Moreover,upper arm cuff devices have a low accuracy1 and do notreliably track large changes in arterial pressure.2 In criticallyill patients, oscillometric measurements are consistentlylower than direct blood pressure measurements.3,4 Noninva-sive and continuous monitoring of blood pressure is of po-tential benefit during nonmajor surgical procedures. Withthe finger cuff technology,5 blood pressure can be measurednoninvasively and continuously. Devices using this technol-ogy, such as the Finapres (Ohmeda, Englewood, CO), havebeen clinically evaluated and used in a variety of settings.5–10
The ability to track changes in blood pressure was consideredadequate5 but concerns about accuracy or precision wereraised.11
The arterial pressure waveform changes gradually fromthe brachial artery to the finger arteries with a decrease indiastolic pressure and an occasional increase in systolic pres-sure because of the narrowing of the arteries. These effectsexplain the scatter that was sometimes seen with the Fi-napres11,12 and which thus far limited the clinical applicationof finger cuff technology-based devices. The Nexfin�(BMEYE B.V., Amsterdam, The Netherlands) is a new de-vice using finger cuff technology. As opposed to the Finapres,brachial arterial blood pressure is reconstructed from themeasured finger arterial blood pressure using previously pub-lished waveform filtering to approximate a brachial pressurewave, together with pressure level correction compensatingfor the proximal-to-distal pressure drop.13,14 Appendix 1 de-scribes the principles of finger arterial pressure measurementtechnology and finger-to-brachial pressure reconstruction indetail. We tested the hypothesis that with these implementedmethodologies arterial pressure measured at the finger ap-proaches more proximally measured pressures. To that pur-pose we compared Nexfin arterial pressure (NAP) with intra-arterial pressure (IAP) in cardiothoracic surgery patients,quantifying accuracy, precision, and tracking capability.
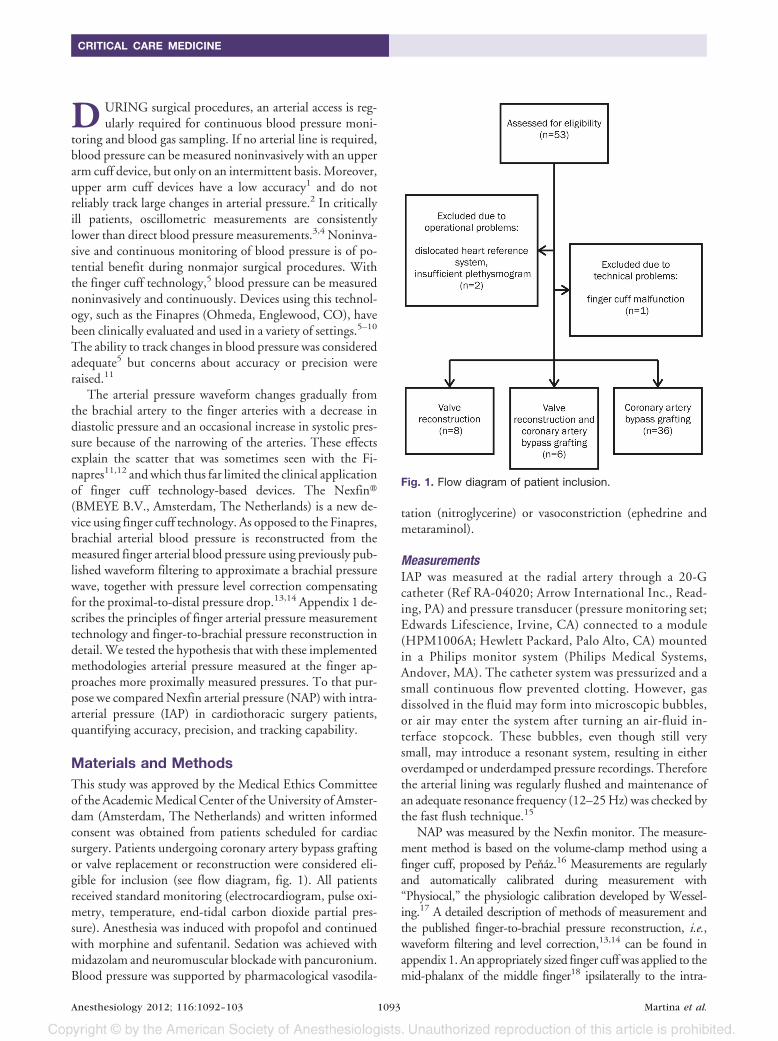
Materials and MethodsThis study was approved by the Medical Ethics Committeeof the Academic Medical Center of the University of Amster-dam (Amsterdam, The Netherlands) and written informedconsent was obtained from patients scheduled for cardiacsurgery. Patients undergoing coronary artery bypass graftingor valve replacement or reconstruction were considered eli-gible for inclusion (see flow diagram, fig. 1). All patientsreceived standard monitoring (electrocardiogram, pulse oxi-metry, temperature, end-tidal carbon dioxide partial pres-sure). Anesthesia was induced with propofol and continuedwith morphine and sufentanil. Sedation was achieved withmidazolam and neuromuscular blockade with pancuronium.Blood pressure was supported by pharmacological vasodila-
tation (nitroglycerine) or vasoconstriction (ephedrine andmetaraminol).
MeasurementsIAP was measured at the radial artery through a 20-Gcatheter (Ref RA-04020; Arrow International Inc., Read-ing, PA) and pressure transducer (pressure monitoring set;Edwards Lifescience, Irvine, CA) connected to a module(HPM1006A; Hewlett Packard, Palo Alto, CA) mountedin a Philips monitor system (Philips Medical Systems,Andover, MA). The catheter system was pressurized and asmall continuous flow prevented clotting. However, gasdissolved in the fluid may form into microscopic bubbles,or air may enter the system after turning an air-fluid in-terface stopcock. These bubbles, even though still verysmall, may introduce a resonant system, resulting in eitheroverdamped or underdamped pressure recordings. Thereforethe arterial lining was regularly flushed and maintenance ofan adequate resonance frequency (12–25 Hz) was checked bythe fast flush technique.15
NAP was measured by the Nexfin monitor. The measure-ment method is based on the volume-clamp method using afinger cuff, proposed by Penaz.16 Measurements are regularlyand automatically calibrated during measurement with“Physiocal,” the physiologic calibration developed by Wessel-ing.17 A detailed description of methods of measurement andthe published finger-to-brachial pressure reconstruction, i.e.,waveform filtering and level correction,13,14 can be found inappendix 1. An appropriately sized finger cuff was applied to themid-phalanx of the middle finger18 ipsilaterally to the intra-
Fig. 1. Flow diagram of patient inclusion.
CRITICAL CARE MEDICINE
Anesthesiology 2012; 116:1092–103 Martina et al.1093

arterial catheter. The “heart reference system” measured andcorrected the hydrostatic difference between the finger and theheart. The “finger side” was fixated next to the measurementfinger and the “heart side” at the arterial pressure transducerlevel.18
The analog signals of IAP, the unreconstructed noninva-sive finger arterial pressure (FAP) and the reconstructed ar-terial pressure (NAP; i.e., following application of finger-to-brachial pressure reconstruction) measured by the Nexfinwere sampled at 200 Hz and stored on a hard disk.
Blood pressure measurement commenced before the pa-tient was sedated and continued throughout surgery (see ap-pendix 2 for details). Measurements have been obtained dur-ing induction and (off-pump) maintenance. The investigatorwas blinded to the pharmacological agents used, and phar-macological management was not considered in the dataanalysis.
AnalysisFAP and NAP were compared with IAP on a beat-to-beatbasis. Beats were matched (analysis software developed in-house) allowing a maximum time window of 80 ms betweenthe start of the upstroke in the respective pressure waveforms.Matched signals that were recorded during Physiocal calibra-tion of the NAP were not taken into account. Signals werevisually inspected for any artifacts, such as beats detectedduring transients just after a fast flush. These artifacts weremanually removed. The sets of matched IAP, FAP, and NAPbeats, the values for systolic, mean (obtained by integrationof the pressure curve divided by the duration of the cardiaccycle), diastolic, and pulse pressure were saved in a data file.
A detailed description and a graphical representation ofthe statistical procedures can be found in appendix 2. Foreach patient recording, matched beats over a 30-min periodwere extracted. The starting point for including data in theanalysis was chosen on the basis of the following criteria: theNexfin monitor should have minimally reached a Physiocalinterval of 50 beats and the arterial line must have beenflushed. To compare systolic, diastolic, mean, and pulse pres-sure from FAP and NAP with those from IAP, in each patienta Bland and Altman19 approach was followed: the values ofeach pair of FAP and IAP beats, and of NAP and IAP beats,were averaged and their FAP � IAP and NAP � IAP differ-ences were computed. Next, 10-s averages were calculated,resulting in 180 consecutive data sets per patient. The 10-saverages of systolic and diastolic NAP were plotted againstthe systolic and diastolic IAP as scatter plots for each indi-vidual patient. Also for these data, the correlation coefficients(Pearson product moment correlation, separately for systolicand diastolic values) were calculated. Consistency was as-sessed by dividing the 180-point data sets into three sets of 60points each. From the NAP � IAP differences in these sets,Cronbach’s � and intraclass correlation coefficients were cal-culated. The differences of these three sets were comparedwith their average difference in each patient.
For each patient, the mean and SD of the 180 averages ofNAP and IAP are shown in Bland-Altman19 plots as hori-zontal coordinates where the SDs express the range of pres-sures for each patient (“within-subject variability”). Simi-larly, the mean and SD of the 180 NAP � IAP differences ofeach patient represent the vertical coordinate in the Bland-Altman plot, where the SDs are measures of the individualconsistency (“within-subject precision”). These means andSDs of the 180 data sets for each patient were used in thegroup statistics.
Mean � SD of the FAP � IAP and NAP � IAP differ-ences over the group were defined as accuracy and precision.Differences were compared with the 5 � 8 mmHg criterionformulated by the Association for the Advancement of Med-ical Instrumentation.20 To investigate whether the differ-ences are related to mean arterial blood pressure (MAP),respectively, heart rate (see appendix 1) linear regressionanalysis was performed. Pressure dependency was evaluatedby comparison of systolic, diastolic, mean, and pulse NAP �IAP differences between the quartiles based on their corre-sponding pressures, MAP, and heart rate.
For data collection, statistical analyses and plotting, Mi-crosoft Office Excel 2007 (Microsoft Corporation, Red-mond, WA), SPSS 19 (IBM SPSS Statistics 19, IBM Corpo-ration, Somers, NY), and Sigmaplot 11 (Systat Software Inc.,Chicago, IL) were used.
Results
A total of 53 patients were included; data of three patientswere excluded from analysis because of technical or opera-tional problems (fig. 1). In one patient, the heart referencesystem was dislocated, causing an unknown offset in theNAP; in another patient the finger cuff was malfunctioning;and in the third patient finger blood flow was insufficient.Thus, data of 50 patients were available for analysis (table 1).The ranges of IAP were 37–182 mmHg for systolic pressure,25–110 mmHg for diastolic pressure, 33–133 mmHg forMAP, and 4–92 mmHg for pulse pressure. In total, 2.3% ofthe data were deleted owing to artifacts, of which more thantwo-thirds were related to the invasive measurement (damp-ing and flushing of the catheter). Noninvasive measurementsshowed occasional oscillations in the finger cuff pressureapart from loss of data because of Physiocal calibration.
Figure 2 shows a representative example of varying IAP andNAP during surgery. The effect of the brachial pressure recon-
Table 1. Patient Characteristics
Average � SD Range
Age (years) 63 � 8 34–83Height (cm) 174 � 10 157–196Weight (kg) 85 � 15 56–130Body mass index (kg/m2) 28 � 4 21–39
Fifty patients, 40 men and 10 women.
Validation of Nexfin Monitor
Anesthesiology 2012; 116:1092–103 Martina et al.1094

struction by waveform filtering (reducing systolic peaking) andlevel correction (reducing pressure drop) is illustrated in figure 3.
Figure 4 shows the scatter plots of all patients. Correlationcoefficients, within-subject variability, and within-subjectprecision are summarized in table 2. Table 3 gives measuresof consistency of three consecutive periods of the pressuredifferences, showing good to excellent Cronbach’s alphas(see appendix 2 for interpretation). When the differences ofthese three sets were compared with their average differencein each patient, group average � SD were within 2 � 4mmHg for systolic pressure, within 1 � 3 mmHg for MAP,and within 1 � 2 mmHg for diastolic and pulse pressure.Figure 5 shows Bland-Altman plots of the individual patientaverages plus SDs of systolic, diastolic, mean, and pulse pres-sure. Table 4 lists all IAP and NAP pressures and the NAP �IAP differences. NAP tracked changes in IAP over a widerange of pressures during cardiothoracic surgery (fig. 4). Thisis quantified in the Bland-Altman plots (fig. 5) and in tables2 and 3, demonstrating that, although individual measure-ments may have a bias, the differences with IAP are constant.
The group’s averaged NAP � IAP differences (n � 50)remained within the 5 � 8 mmHg Association for the Ad-vancement of Medical Instrumentation criterion. Regressionanalysis revealed no significant relation between the differ-ences and MAP and heart rate, respectively. When systolic,diastolic, mean, and pulse pressures were divided in quartiles,their respective NAP � IAP differences were not signifi-cantly different, nor did quartiles based on MAP and heartrate show any differences.
Values for unreconstructed finger arterial pressures, FAP andFAP � IAP are given in table 5. For unreconstructed pressuresthe bias in systolic and MAP is too large for the Association forthe Advancement of Medical Instrumentation criteria.
DiscussionThe main finding of this study is that implementation ofphysiologic models together with new finger cuff technolo-gies renders noninvasive continuous blood pressure measure-ment feasible. Changes in IAP were tracked, maintainingprecision over the wide ranges of pressure during cardiotho-racic surgery.
The arterial pressure waveform changes when travelingfrom the brachial artery to the finger arteries. Systolic peak-ing results in higher pulse pressures, which was noticed inearlier devices such as the Finapres. The transfer function inthe Nexfin was able to reciprocate this. In the smaller arteries,
Fig. 2. Noninvasive (A) and invasive pressures (B) during aperiod of hemodynamic instability. The startup of Nexfin (A) isvisible as a staircase; the gaps at regular intervals are causedby the Physiocal calibration, which is more frequently activeat startup. Three short periods with simultaneous invasive(bold) and noninvasive pressures are shown in detail: a periodaround a Physiocal (C1), part of the hypotensive episode(C2), and cardiac arrhythmias (C3).
Fig. 3. The effect of pressure reconstruction in two patients(A and B). In the panels A1 and B1, the radial pressure (bold)is combined with the unreconstructed finger pressure; in thepanels A2 and B2 radial pressure is combined with the re-constructed pressure. A sharp systolic peak in the radialpressure is increased in the raw finger pressure measurement(A1). This increase is reduced by waveform filtering; in addi-tion to this, the level correction lifts the curve up (A2). Also alarger pressure drop from radial to finger (B1) is reduced bylevel correction (B2). Because there is no clear systolic peak-ing, waveform filtering has little effect in this patient.
CRITICAL CARE MEDICINE
Anesthesiology 2012; 116:1092–103 Martina et al.1095

such as those of the hand and fingers, resistance to flowbecomes manifest, causing an overall decrease in pressure.The level correction method brings the pressure levels closeto brachial values.13,14 Reconstructed brachial arterial pres-
sure, here referred to as NAP, was compared with radialpressure, which usually has a somewhat larger pulse pressurethan brachial pressure. This explains the underestimation ofthe pulse pressure of NAP. Nonetheless, NAP � IAP differ-
Fig. 4. Scatter plots for noninvasive arterial pressure versus invasive arterial pressure of all 50 patients. Boxes are systolicpressures, circles are diastolic pressures. In each patient-panel 180 systolic and 180 diastolic values are given. Lines representidentity. For correlation coefficients see table 2.
Validation of Nexfin Monitor
Anesthesiology 2012; 116:1092–103 Martina et al.1096

ences remained small; the differences between unrecon-structed finger arterial pressures and IAP were larger. Thepresent study did not focus on the influence of pharmaco-logical hemodynamic management on the NAP. However,pharmacological interventions, although not specificallyidentified, were included in the analysis.
Moreover, the NAP � IAP differences did not depend onblood pressure and heart rate level, indicating that NAP iscomparable with IAP in the presence of hemodynamicchanges. This is supported by the close correlation over awide range of pressures.
The Association for the Advancement of Medical Instru-mentation20 has suggested an average bias of maximal 5 � 8mmHg. These standards are applied when comparing mea-surements from noninvasive intermittent blood pressure de-vices with invasively determined arterial pressure measure-ments. However, there has been no agreement regardingaccuracy criteria of noninvasive devices that assess the entirearterial pressure waveform compared with invasive bloodpressure or noninvasive standards as Riva-Rocci/Korot-koff.21 Nonetheless, reconstructed NAP was within theselimits, whereas the unreconstructed finger arterial pressurewas not. During only one measurement the plethysmo-graphical signals were insufficient to obtain adequate bloodpressure readings. Thus, in most patients measurements werepossible, and we attribute this to the high intensity/highsensitivity plethysmograph. Generally, use of Nexfin may bebeneficial in cases when an arterial line is not indicated or
feasible, whereas the surgical procedures still involve majorfluid shifts or require monitoring for rapid hemodynamicchanges. Nexfin application is not possible in case of in-sufficient or absent blood flow to the finger as in vascular
Table 2. Within-subject (n � 180) Data Averaged overthe Group (n � 50)
r Median(25–75%)
Within-subjectVariability
Within-subjectPrecision
Systolic 0.96 (0.91–0.98) 12.9 � 6.1 4.4 � 1.9Diastolic 0.93 (0.87–0.96) 6.3 � 2.7 2.7 � 1.1Mean 0.96 (0.90–0.97) 8.6 � 4.0 3.4 � 1.8Pulse 0.94 (0.85–0.98) 7.4 � 4.0 2.8 � 1.6
Individual within-subject variability and precision are indicated infigure 5 as horizontal and vertical error bars, respectively. Groupaverage � SD; pressures in mmHg.r � coefficient of correlation (Pearson product moment); within-subject precision � average SD of the individual differencesbetween invasive and noninvasive pressures; within-subject vari-ability � average SD of individual averaged invasive and nonin-vasive pressures.
Table 3. Consistency of Three Periods of the PressureDifferences over the Group (n � 50)
Crombach’s �ICC (Lower Bound–
Upper Bound)
Systolic NAP � IAP 0.89 0.73 (0.61–0.82)Diastolic NAP � IAP 0.96 0.89 (0.84–0.94)Mean NAP � IAP 0.95 0.86 (0.79–0.92)Pulse NAP � IAP 0.86 0.67 (0.53–0.78)
IAP � invasive pressure; ICC � intraclass correlation coefficient(two-way mixed, single measures); NAP � noninvasive pressure.
Fig. 5. Bland-Altman plots for systolic, diastolic, mean, and pulsepressure; each with data of 50 patients. Individual averages � SDsof the pressure ranges (x-axis) and errors (y-axis). Drawn lines areaverages and dashed lines indicate � SD and � 2 SD (SD deter-mined over the individual patient averages). Both the x-axis andy-axis have the same scale. Note that the x-axis of the systolicpressure runs from 50 to 200 mmHg. The SDs in parallel to thex-axis (showing the individual variability in blood pressure) arelarger than the 1 s parallel to the y-axis (showing the individualvariability in the difference between noninvasive and invasive arte-rial pressure). This indicates that over a wide range of pressurelevels invasive and noninvasive pressures give comparable values.
Table 4. Group (n � 50) Averaged Pressures andPressure Differences
IAP NAP NAP � IAP
Systolic 99 � 13 99 � 13 �0.5 � 6.7Diastolic 56 � 8 59 � 6 2.8 � 6.4Mean 70 � 9 73 � 9 2.2 � 6.4Pulse 43 � 10 40 � 9 �3.3 � 3.7
Data expressed as average � SD; pressures in mmHg.IAP � invasive pressures; NAP � noninvasive pressure.
CRITICAL CARE MEDICINE
Anesthesiology 2012; 116:1092–103 Martina et al.1097

disease, e.g., M. Raynaud, and conditions with extremevasoconstriction.
Recently, Nexfin performance was assessed in a smallgroup of critically ill patients.22 Although the authors sug-gested the opposite, MAP appeared reliable as it was withinthe Association for the Advancement of Medical Instrumen-tation criteria. Measurements with the Nexfin do not needexternal calibration, whereas other devices using finger cufftechnology, such as the Finometer (FMS, Amsterdam, TheNetherlands)23,24 and the CNAP (CNSystems Medizintech-nik AG, Graz, Austria), require calibration with an upperarm cuff.25
In conclusion, the Nexfin measures arterial blood pres-sure noninvasively and continuously using physiologic pres-sure reconstruction. This reconstruction results in valuescomparable with those invasively obtained, in the presence ofthe considerable hemodynamic perturbations during cardiacsurgery. This supports the feasibility of noninvasive contin-uous arterial pressure monitoring when invasive measure-ments are not indicated.
Appendix 1: Measurement of FingerArterial Pressure and Finger-to-brachialPressure Reconstruction
Finger Cuff TechnologyThe Nexfin (BMEYE B.V., Amsterdam, The Netherlands, fig. 6) isa device using finger cuff technology with high sensitivity optical
components and digital control systems. The measurement methodbuilds on the volume-clamp method as introduced by Penaz.16
Arterial blood volume of the finger is measured by an optical ple-thysmograph, which is mounted inside the cuff. The plethysmo-graph uses a light-emitting diode and a sensitive photo diode with ahigh signal-to-noise ratio. At measurement startup, the finger cuffpressure is increased in a staircase-like fashion (fig. 2) and an initialassessment of the pressure-diameter relation of the artery is made.Then blood pressure measurement starts and a fast feedback systemcontrols finger cuff pressure, keeping arterial blood volume at aconstant level (clamped). During measurement, the pressure in thecuff should equal real-time finger blood pressure so that the arterialwall is “unloaded.” The unloaded state is ascertained by applying aphysiologic calibration (“Physiocal”) as developed by Wesseling.17
A Physiocal is regularly and automatically performed during mea-surement to define and maintain the diameter at which the fingerartery should be clamped, thus compensating for vasomotor-relatedchanges in finger arteries. The Physiocal algorithm includes thesearch procedure and criterion for the automated determinationand periodic adjustment of the arterial unloaded volume. It explorespart of the pressure-diameter relation by analyzing the plethysmo-gram at a number of steady pressure levels, and is able to track theunloaded diameter of a finger artery even if smooth muscle tonechanges. To maintain the correct unloaded diameter of the fingerartery, Physiocals are performed at regular intervals.17,24 A conse-quence is that the measurement of blood pressure is temporarilyinterrupted for two or more beats. The interval between successivePhysiocal periods of the NAP signal depends on the stability of thepressure-diameter characteristics of the finger artery, and normallyan interval of 30 beats or higher is considered to indicate stability ofthe NAP measurement,18 although shorter intervals do not neces-sarily indicate that a measurement is not reliable.
A “heart reference system” measures the hydrostatic differencebetween the finger and the heart and corrects for any changes in theheight of the hand with respect to heart level.18
Finger-to-brachial Pressure ReconstructionWhen traveling from the brachial artery to the finger arteries, thearterial pressure waveform changes gradually in shape and in abso-lute levels. Specifically, diastolic pressure decreases from the bra-chial to the finger measurement site because of flow resistance in thesmaller arteries.14 In addition, when traveling from the brachial tothe radial measurement site, the narrowing of arteries enhancesarterial pressure wave reflection, which results in peaking of systolicand thus pulse pressure (fig. 7). This can be described as a resonancefrequency in the transfer function (fig. 8) and thus can be accountedfor with an inverse model.14 This is referred to as waveform filter-ing. The waveform filtering is done with a digital filter, which workson a series of the samples of the digitized signal, each sample with itsown multiplication factor. In this way the filtering can be per-formed in the same rate as the samples come in. The development ofa digital filter should be done with several precautions, notablysampling frequency exceeding the Nyquist frequency, removing thetransient response before the filter assuming the desired steady statefrequency response, and reduction of unwanted side lobes in thefilter frequency response by the use of Hamming weighting. Driftsin the baseline of the signals should be eliminated.14
Beyond the level of the radial artery down to the finger arteries,the frictional losses prevail, resulting in reduced pressure levels. Apopulation-based level correction formula can rectify this pressure
Table 5. Group (n � 50) Averaged Pressures andPressure Differences for Unreconstructed FingerMeasurements
FAP FAP � IAP
Systolic 90 � 13 �9.5 � 7.4Diastolic 51 � 8 �5.0 � 6.5Mean 63 � 9 �7.6 � 6.4Pulse 39 � 9 �4.3 � 5.4
Data expressed as average � SD; pressures in mmHg.FAP � unreconstructed finger arterial pressure; IAP � invasivearterial pressure.
Fig. 6. The Nexfin monitor system (in the background) withthe finger cuff applied to the finger.
Validation of Nexfin Monitor
Anesthesiology 2012; 116:1092–103 Martina et al.1098
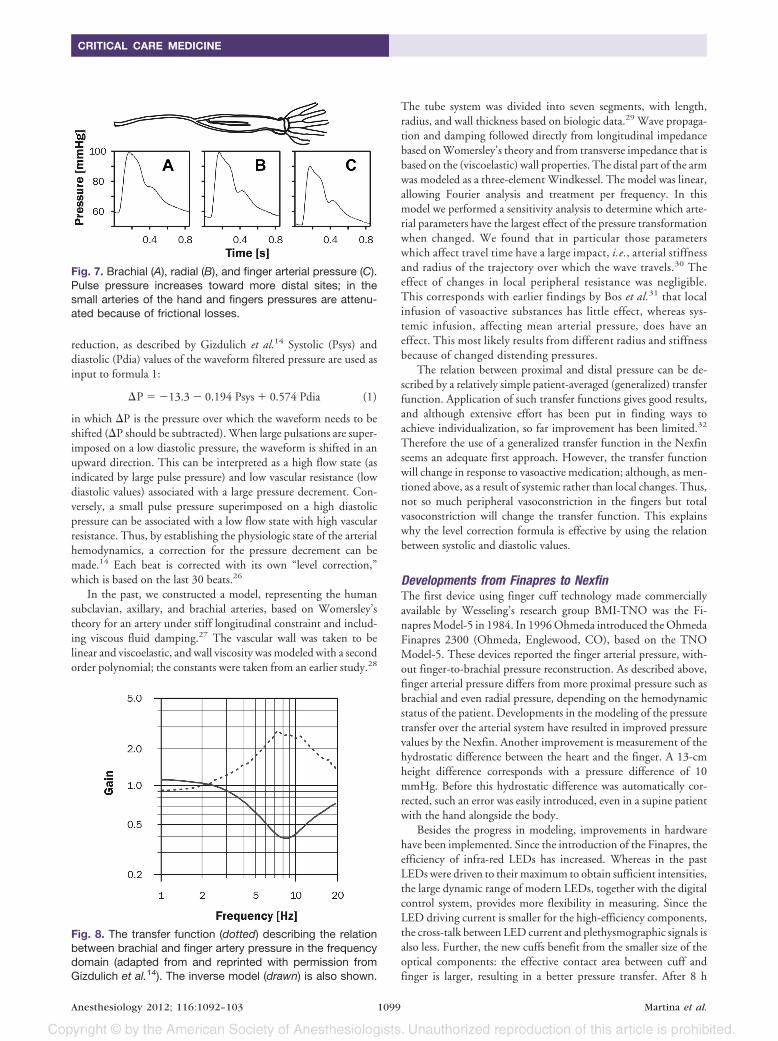
reduction, as described by Gizdulich et al.14 Systolic (Psys) anddiastolic (Pdia) values of the waveform filtered pressure are used asinput to formula 1:
�P � �13.3 � 0.194 Psys � 0.574 Pdia (1)
in which �P is the pressure over which the waveform needs to beshifted (�P should be subtracted). When large pulsations are super-imposed on a low diastolic pressure, the waveform is shifted in anupward direction. This can be interpreted as a high flow state (asindicated by large pulse pressure) and low vascular resistance (lowdiastolic values) associated with a large pressure decrement. Con-versely, a small pulse pressure superimposed on a high diastolicpressure can be associated with a low flow state with high vascularresistance. Thus, by establishing the physiologic state of the arterialhemodynamics, a correction for the pressure decrement can bemade.14 Each beat is corrected with its own “level correction,”which is based on the last 30 beats.26
In the past, we constructed a model, representing the humansubclavian, axillary, and brachial arteries, based on Womersley’stheory for an artery under stiff longitudinal constraint and includ-ing viscous fluid damping.27 The vascular wall was taken to belinear and viscoelastic, and wall viscosity was modeled with a secondorder polynomial; the constants were taken from an earlier study.28
The tube system was divided into seven segments, with length,radius, and wall thickness based on biologic data.29 Wave propaga-tion and damping followed directly from longitudinal impedancebased on Womersley’s theory and from transverse impedance that isbased on the (viscoelastic) wall properties. The distal part of the armwas modeled as a three-element Windkessel. The model was linear,allowing Fourier analysis and treatment per frequency. In thismodel we performed a sensitivity analysis to determine which arte-rial parameters have the largest effect of the pressure transformationwhen changed. We found that in particular those parameterswhich affect travel time have a large impact, i.e., arterial stiffnessand radius of the trajectory over which the wave travels.30 Theeffect of changes in local peripheral resistance was negligible.This corresponds with earlier findings by Bos et al.31 that localinfusion of vasoactive substances has little effect, whereas sys-temic infusion, affecting mean arterial pressure, does have aneffect. This most likely results from different radius and stiffnessbecause of changed distending pressures.
The relation between proximal and distal pressure can be de-scribed by a relatively simple patient-averaged (generalized) transferfunction. Application of such transfer functions gives good results,and although extensive effort has been put in finding ways toachieve individualization, so far improvement has been limited.32
Therefore the use of a generalized transfer function in the Nexfinseems an adequate first approach. However, the transfer functionwill change in response to vasoactive medication; although, as men-tioned above, as a result of systemic rather than local changes. Thus,not so much peripheral vasoconstriction in the fingers but totalvasoconstriction will change the transfer function. This explainswhy the level correction formula is effective by using the relationbetween systolic and diastolic values.
Developments from Finapres to NexfinThe first device using finger cuff technology made commerciallyavailable by Wesseling’s research group BMI-TNO was the Fi-napres Model-5 in 1984. In 1996 Ohmeda introduced the OhmedaFinapres 2300 (Ohmeda, Englewood, CO), based on the TNOModel-5. These devices reported the finger arterial pressure, with-out finger-to-brachial pressure reconstruction. As described above,finger arterial pressure differs from more proximal pressure such asbrachial and even radial pressure, depending on the hemodynamicstatus of the patient. Developments in the modeling of the pressuretransfer over the arterial system have resulted in improved pressurevalues by the Nexfin. Another improvement is measurement of thehydrostatic difference between the heart and the finger. A 13-cmheight difference corresponds with a pressure difference of 10mmHg. Before this hydrostatic difference was automatically cor-rected, such an error was easily introduced, even in a supine patientwith the hand alongside the body.
Besides the progress in modeling, improvements in hardwarehave been implemented. Since the introduction of the Finapres, theefficiency of infra-red LEDs has increased. Whereas in the pastLEDs were driven to their maximum to obtain sufficient intensities,the large dynamic range of modern LEDs, together with the digitalcontrol system, provides more flexibility in measuring. Since theLED driving current is smaller for the high-efficiency components,the cross-talk between LED current and plethysmographic signals isalso less. Further, the new cuffs benefit from the smaller size of theoptical components: the effective contact area between cuff andfinger is larger, resulting in a better pressure transfer. After 8 h
Fig. 7. Brachial (A), radial (B), and finger arterial pressure (C).Pulse pressure increases toward more distal sites; in thesmall arteries of the hand and fingers pressures are attenu-ated because of frictional losses.
Fig. 8. The transfer function (dotted) describing the relationbetween brachial and finger artery pressure in the frequencydomain (adapted from and reprinted with permission fromGizdulich et al.14). The inverse model (drawn) is also shown.
CRITICAL CARE MEDICINE
Anesthesiology 2012; 116:1092–103 Martina et al.1099

operation the Nexfin automatically stops measuring and closes therecording file. Monitoring can be resumed, but a different fingershould be selected for measurement. On theoretical grounds thereliability may be influenced by procedures involving temporaryartery distortion by extreme upper limb anteflexion.
Appendix 2: Analysis and Statistics
Data InclusionPreparations for the recording of invasive and noninvasive pressureswere made shortly after the patient had taken place on the operationtable. A Nexfin cuff was applied to the finger and the radial arterywas cannulated; figure 9 shows a schematic overview. Recordingbegan as soon as the Nexfin was started. Of the simultaneous re-cordings, 30-min periods of matched beats were selected for eachpatient. The same length of data were used for all patients, so thatdata from all patients carried the same weight in the analyses. Thisperiod commenced after the noninvasive pressure recording hadsufficiently stabilized, as indicated by a Physiocal interval of 50beats or higher, and after the arterial line had been flushed. Depend-ing on the achievement of these two requirements, recordings couldcomprise induction of anesthesia, pharmacological hemodynamicmanagement, and surgery, until the start of the extracorporeal cir-culation (fig. 9). Figure 10 illustrates the outlined period with actualrecordings from one patient.
Data typically excluded from the analysis is illustrated in figure11, where damping (before catheter flushing) or even repetitivedamping of the invasive pressure recording does not allow a mean-ingful comparison. In figure 12, an example is given of erraticnoninvasive arterial pressure with unrealistically low pulse pressurebecause of a faulty cuff (see fig. 1).
We also calculated the accuracy and precision of NAP comparedwith IAP over all available data. This approach is scientifically ob-jectionable since artifacts were not excluded, so two methods werenot compared per se, but also the effect of errors present in eithermethod. It should be acknowledged that IAP, which serves as areference method, is commonly fraught with errors (fig. 11). Fur-ther, the included data per patient depended on the length of theirrespective recording. With these caveats, the findings for NAP �IAP were �1.2 � 7.9, 3.3 � 5.4, 2.4 � 6.3, and �4.5 � 3.7mmHg for systolic, diastolic, mean, and pulse pressures, respec-
tively, still meeting the criteria of the Association for the Advance-ment of Medical Instrumentation criteria.
Patient StatisticsOf each patient, a 30-min period of IAP, FAP, and NAP wereanalyzed. For each beat systolic, mean, diastolic and pulse pressureswere determined, and also their respective (FAP � IAP)/2 and(NAP � IAP)/2 averages together with their FAP � IAP andNAP � IAP differences. Then, for each patient 10-s averages werecomputed, resulting in 180 data sets for systolic, mean, diastolic,and pulse pressures of IAP and NAP and similarly for IAP and FAP(fig. 13). The period of the averaging was chosen to be between 1 s(or approximately no beat averaging) and 1 min, which we considertoo slow for monitoring. Monitors generally apply such averaging,to avoid jumpy readings, without the risk of missing events. Infigure 13 (“patient”) an example is given for IAP and NAP; systolic,mean, diastolic, and pulse pressures were all treated in the samemanner. The systolic and diastolic NAP 10-s values (column B, b1
… b180, fig. 13) were plotted versus the corresponding IAP 10 svalues (column A, a1 … a180) as individual scatter plots (fig. 4 in themain text of this study) and Pearson’s correlation coefficients werecalculated over these columns. Median and interquartile range ofthe correlation coefficients in the group were represented in table 2of the main text. Consistency of the data were assessed by dividingcolumn D in three equal parts of a length of 60 NAP � IAPdifferences and calculating Cronbach’s � and the intraclass correla-tion coefficient (ICC). Internal consistency by Cronbach’s � isconsidered excellent for � � 0.9, good for 0.9 � � � 0.8, accept-able for 0.8 � � � 0.7, questionable for 0.7 � � � 0.6, poor for0.6 � � � 0.5, and unacceptable for 0.5 � �. Since the ICCcalculates contribution of the variability in the differences in a pa-tient relative to the total variability, the ICC is sensitive to the rangeof values in the group. The variability in the differences is ratherlow, resulting in relatively low ICC values.
Fig. 9. Schematic overview of measurements during cardio-thoracic surgery. After cannulation of the radial artery andapplication of the Nexfin, invasive and noninvasive bloodpressures were recorded. Nexfin was allowed to stabilizeuntil the interval between Physicals was 50 or greater andanalyses were started following flushing of the arterial line.The analyzed data can include periods before and after in-duction of anesthesia. Measurements were included irre-spective of pharmacological hemodynamic management orsurgical procedures.
Fig. 10. Example recording from startup of noninvasivearterial pressure recording with Nexfin (A) until the start ofextracorporeal circulation after 8,500 s. The interval be-tween Physiocals was 50 beats was reached after 201 s.The radial artery catheter was flushed at 1,650 s and 6,700s. The flushes can be seen in the invasive arterial pressurerecording (B).
Validation of Nexfin Monitor
Anesthesiology 2012; 116:1092–103 Martina et al.1100

Next, we followed a methodological approach, which is an ex-tension of the traditional Bland and Altman representation ofdata.19 When two methods are compared, the average of each mea-surement pair is the x value and their difference is the y-value. Foreach patient the mean of the NAP and IAP averages is accompaniedby an SD (in the x direction), and similarly, the mean of the NAP �IAP differences is accompanied by an SD (in the y direction). In thisway the individual data can be represented in Bland-Altman fash-ion,19 which allows assessment of both individual differences (pa-tient-related) and of group differences (measurement system-re-lated) including the range over which these were determined. Workof Bland and Altman includes a method for calculating the confi-dence of the limits of agreement with multiple measurements perindividual but did not focus on simultaneously displaying bothindividual and group statistics.33 Thus, each patient contributedone point with horizontal and vertical error bars (fig. 5). The x- and
y-coordinates for each patient in the Bland-Altman plot were ob-tained as follows (fig. 13). The average (I) over column C, thus overthe (NAP � IAP)/2 averages, gave the x-coordinate of a patient inthe Bland-Altman plot. The average (K) over the column D, thusover the NAP � IAP differences, gave the y-coordinate. The errorbars in the Bland-Altman plot were the SDs over the same columns:J over column C for the x-coordinate, and L over column D for they-coordinate. The values E and G and I, J, K and L of each patientwere then used in the calculation of the group statistics.
Group StatisticsThe 50 patients all contributed their statistics mentioned above; seefigure 13 (“group”). The average and SD over the IAP, NAP, andNAP � IAP columns, thus over E (e1 … e50), G (g1 … g50) and K(k1 … k50) values of each patient were represented in table 4 in themain text. Of column K, the average (U) and SD (V) were used toassess the compliance with the Association for the Advancement ofMedical Instrumentation criteria (average and SD over a group ofpatients smaller than 5 � 8 mmHg).20
The average (S) and SD (T) over the “SD (NAP � IAP)/2”column (J) gave the within-subject variability; average (W) and SD(X) over the “SD (NAP � IAP)” column (L) gave the within-subjectprecision.21 These values are the group statistics describing what isvisually represented in the Bland-Altman plots (fig. 5) and are rep-
Fig. 11. Simultaneous recordings of noninvasive and invasivearterial pressure in two patients (A and B). Gaps at approxi-mately 70-s intervals in the noninvasive pressure are causedby Physiocals (A1). Damping of the invasive arterial pressurewave (A2) is corrected by catheter flushing (around 2,850 s).For another recording (noninvasive arterial pressure is givenas reference, B1) the invasive arterial pressure (B2) showedrepetitive damping of the wave notwithstanding frequentflushing of the catheter.
Fig. 12. In the magnified part (A), the oscillations in theunsuccessful recording of noninvasive arterial pressure (B)because of a malfunctioning finger cuff are clearly visible.Invasive arterial pressure is given in C. Other warning signs ofthe problematic recording are: very low pulse pressure (if ithad been an invasive measurement, the arterial line would beflushed), short interval between Physiocals, and multistepPhysiocal.
CRITICAL CARE MEDICINE
Anesthesiology 2012; 116:1092–103 Martina et al.1101

resented in table 2 in the main text. Comparing tables 2 and 3 withtable 4 gives insight into the performance in an individual and in agroup, respectively.
To determine pressure-related differences in the NAP � IAP values(column D in fig. 13), systolic, diastolic, mean, and pulse pressureswere divided in quartiles according to their respective levels (column C)as well as according to MAP and heart rate and tested by ANOVA. Nodifferences were detected (see Results of the main text).
References1. Marino PL, Sutin KM: The ICU Book. 3rd ed. Philadelphia:
Lippincott Williams & Wilkins; 2007:151– 61
2. Wax DB, Lin HM, Leibowitz AB: Invasive and concomitantnoninvasive intraoperative blood pressure monitoring: Ob-served differences in measurements and associated therapeu-tic interventions. ANESTHESIOLOGY 2011; 115:973– 8
3. Bur A, Hirschl MM, Herkner H, Oschatz E, Kofler J, Woiset-schlager C, Laggner AN: Accuracy of oscillometric bloodpressure measurement according to the relation betweencuff size and upper-arm circumference in critically ill pa-tients. Crit Care Med 2000; 28:371– 6
4. Bur A, Herkner H, Vlcek M, Woisetschlger C, Derhaschnig U,Delle Karth G, Laggner AN, Hirschl MM: Factors influencingthe accuracy of oscillometric blood pressure measurement incritically ill patients. Crit Care Med 2003; 31:793–9
5. Imholz BP, Wieling W, van Montfrans GA, Wesseling KH:Fifteen years experience with finger arterial pressure moni-toring: Assessment of the technology. Cardiovasc Res 1998;38:605–16
6. Imholz BP, Settels JJ, van der Meiracker AH, Wesseling KH,Wieling W: Non-invasive continuous finger blood pressuremeasurement during orthostatic stress compared to intra-arterial pressure. Cardiovasc Res 1990; 24:214 –21
7. Imholz BP, Parati G, Mancia G, Wesseling KH: Effects ofgraded vasoconstriction upon the measurement of fingerarterial pressure. J Hypertens 1992; 10:979 – 84
8. Bos WJ, Imholz BP, van Goudoever J, Wesseling KH, van Mont-frans GA: The reliability of noninvasive continuous finger bloodpressure measurement in patients with both hypertension andvascular disease. Am J Hypertens 1992; 5:529–35
9. Bogert LW, Harms MP, Pott F, Secher NH, Wesseling KH, vanLieshout JJ: Reconstruction of brachial pressure from finger arte-rial pressure during orthostasis. J Hypertens 2004; 22:1873–80
10. Immink RV, van den Born BJ, van Montfrans GA, KoopmansRP, Karemaker JM, van Lieshout JJ: Impaired cerebral auto-regulation in patients with malignant hypertension. Circula-tion 2004; 110:2241–5
11. Gibbs NM, Larach DR, Derr JA: The accuracy of Finapresnoninvasive mean arterial pressure measurements in anes-thetized patients. ANESTHESIOLOGY 1991; 74:647–52
12. Jellema WT, Imholz BP, van Goudoever J, Wesseling KH, vanLieshout JJ: Finger arterial versus intrabrachial pressure andcontinuous cardiac output during head-up tilt testing inhealthy subjects. Clin Sci 1996; 91:193–200
13. Gizdulich P, Imholz BP, van den Meiracker AH, Parati G,Wesseling KH: Finapres tracking of systolic pressure andbaroreflex sensitivity improved by waveform filtering. J Hy-pertens 1996; 14:243–50
14. Gizdulich P, Prentza A, Wesseling KH: Models of brachial tofinger pulse wave distortion and pressure decrement. Car-diovasc Res 1997; 33:698 –705
15. Gardner RM: Direct blood pressure measurement– dynamicresponse requirements. ANESTHESIOLOGY 1981; 54:227–36
16. Wesseling KH: A century of noninvasive arterial pressuremeasurement: From Marey to Penaz and Finapres. Homeo-stasis 1995; 36:50 – 66
17. Wesseling KH, de Wit B, van der Hoeven GMA, van Goudo-ever J, Settels JJ: Physiocal, calibrating finger vascular phys-iology for Finapres. Homeostasis 1995; 36:76 – 82
18. Nexfin HD Operator’s manual 2008; 0086 – 06.
19. Bland JM, Altman DG: Statistical methods for assessing agree-ment between two methods of clinical measurement. Lancet1986; 1:307–10
20. Association for the Advancement of Medical Instrumenta-tion: American national standard for electronic or automatedsphygmomanometers 2002; 1–25
21. Eeftinck Schattenkerk DW, van Lieshout JJ, van denMeiracker AH, Wesseling KR, Blanc S, Wieling W, van Mont-frans GA, Settels JJ, Wesseling KH, Westerhof BE: Nexfinnoninvasive continuous blood pressure validated againstRiva-Rocci/Korotkoff. Am J Hypertens 2009; 22:378 – 83
22. Stover JF, Stocker R, Lenherr R, Neff TA, Cottini SR, Zoller B,Bechir M: Noninvasive cardiac output and blood pressuremonitoring cannot replace an invasive monitoring system incritically ill patients. BMC Anesthesiol 2009; 9:6
23. Guelen I, Westerhof BE, van Der Sar GL, van Montfrans GA,Kiemeneij F, Wesseling KH, Bos WJ: Validation of brachialartery pressure reconstruction from finger arterial pressure.J Hypertens 2008; 26:1321–7
24. Bogert LW, van Lieshout JJ: Non-invasive pulsatile arterialpressure and stroke volume changes from the human finger.Exp Physiol 2005; 90:437– 46
25. Jeleazcov C, Krajinovic L, Munster T, Birkholz T, Fried R,Schuttler J, Fechner J: Precision and accuracy of a new
Fig. 13. Statistical handling of data for each patient (A) andfor the group (B) for systolic, mean, diastolic, and pulsepressures of invasive (IAP) and noninvasive arterial pressure(NAP). For comparing IAP and unreconstructed finger arterialpressure (FAP) a similar approach was followed. The average(I) over column C, thus over the 10s averages of (NAP �IAP)/2, gave the x-coordinate of a patient in the Bland-Altmanplot. The average (K) over the column D, thus over the 10 saverages of NAP � IAP differences, gave the y-coordinate.The error bars in the Bland-Altman plot were the SDs over thesame columns: J over column C for the x-coordinate, and Lover column D for the y-coordinate. The values E and G andI, J, K, and L of each patient were then used in the calculationof the group statistics.
Validation of Nexfin Monitor
Anesthesiology 2012; 116:1092–103 Martina et al.1102

device (CNAPTM) for continuous non-invasive arterial pres-sure monitoring: Assessment during general anaesthesia. Br JAnaesth 2010; 105:264 –72
26. Bos WJW, van Goudoever J, van Montfrans GA, van denMeiracker AH, Wesseling KH: Reconstruction of brachialartery pressure from noninvasive finger pressure measure-ments. Circulation 1996; 94:1870 –5
27. Womersley JR: The mathematical analysis of the arterialcirculation in a state of oscillatory motion. Technical ReportWade-TR 1957; 56 – 614
28. Westerhof N, Noordergraaf A: Arterial viscoelasticity: A gen-eralized model. Effect on input impedance and wave travel inthe systematic tree. J Biomech 1970; 3:357–79
29. Westerhof N, Bosman F, De Vries CJ, Noordergraaf A: Analogstudies of the human systemic arterial tree. J Biomech 1969;2:121– 43
30. Westerhof BE, Guelen I, Stok WJ, Wesseling KH, Spaan JA,Westerhof N, Bos WJ, Stergiopulos N: Arterial pressure trans-fer characteristics: Effects of travel time. Am J Physiol HeartCirc Physiol 2007; 292:H800 –7
31. Bos WJW, van den Meiracker AH, Wesseling KH, SchalekampMA: Effect of regional and systemic changes in vasomotortone on finger pressure amplification. Hypertension 1995;26:315–20
32. Westerhof BE, Guelen I, Stok WJ, Lasance HA, Ascoop CA,Wesseling KH, Westerhof N, Bos WJ, Stergiopulos N, SpaanJA: Individualization of transfer function in estimation ofcentral aortic pressure from the peripheral pulse is notrequired in patients at rest. J Appl Physiol 2008; 105:1858 – 63
33. Bland JM, Altman DG: Agreement between methods of mea-surement with multiple observations per individual. J Biop-harm Stat 2007; 17:571– 82
ANESTHESIOLOGY REFLECTIONS FROM THE WOOD LIBRARY-MUSEUM
Peerless: Poet Poe and Keller’s Laudanum
In November of 1848, Edgar Allan Poe (1809–1849) drank over 30 times the recommended dose ofopium elixir (“laudanum”) but failed in this suicide attempt. A year later, on Election Day in 1849, adelirious Poe was believed to have been drugged to coerce him to vote in multiple locations. He diedshortly after. Poe was memorialized in 2009 on a 42-cent postage stamp (left). Poe never sampledthe Keller’s Peerless Laudanum supplied in later years from a wooden box (right) by Baltimoredruggists Carr, Owens & Heineman. (Copyright © the American Society of Anesthesiologists, Inc.)
George S. Bause, M.D., M.P.H., Honorary Curator, ASA’s Wood Library-Museum of Anesthesi-ology, Park Ridge, Illinois, and Clinical Associate Professor, Case Western Reserve University,Cleveland, Ohio. [email protected].
CRITICAL CARE MEDICINE
Anesthesiology 2012; 116:1092–103 Martina et al.1103
Related Documents