1 23 European Journal of Wildlife Research ISSN 1612-4642 Volume 58 Number 1 Eur J Wildl Res (2012) 58:117-126 DOI 10.1007/s10344-011-0551-9 Nonbiological factors affecting track censuses: implications for sampling design and reliability Carolina Ángela Soto Navarro, Sonja Desniça & Francisco Palomares Fernández

Welcome message from author
This document is posted to help you gain knowledge. Please leave a comment to let me know what you think about it! Share it to your friends and learn new things together.
Transcript
1 23
European Journal of WildlifeResearch ISSN 1612-4642Volume 58Number 1 Eur J Wildl Res (2012) 58:117-126DOI 10.1007/s10344-011-0551-9
Nonbiological factors affecting trackcensuses: implications for sampling designand reliability
Carolina Ángela Soto Navarro, SonjaDesniça & Francisco PalomaresFernández

1 23
Your article is protected by copyright and
all rights are held exclusively by Springer-
Verlag. This e-offprint is for personal use only
and shall not be self-archived in electronic
repositories. If you wish to self-archive your
work, please use the accepted author’s
version for posting to your own website or
your institution’s repository. You may further
deposit the accepted author’s version on a
funder’s repository at a funder’s request,
provided it is not made publicly available until
12 months after publication.
ORIGINAL PAPER
Nonbiological factors affecting track censuses:implications for sampling design and reliability
Carolina Ángela Soto Navarro & Sonja Desniça &
Francisco Palomares Fernández
Received: 3 February 2011 /Revised: 9 May 2011 /Accepted: 16 May 2011 /Published online: 24 May 2011# Springer-Verlag 2011
Abstract Track census is a widely used method for rapidfaunal assessments, which assumes that differences in trackcount numbers mainly reflect differences in speciesabundance due to some biological factors. However, somemethodological and climatic variables might affect resultsof track censuses. Here, we tested the effect of climaticvariables, such as maximum temperature, humidity, windspeed or days since last rain, and methodological factorssuch as censusing day period, distance from transect tovegetation edge, substrate condition or observer, on thenumber of tracks of mammal carnivores and some of theirpotential prey detected in sandy substrates. We sampled 2×2 km2 located within the scrubland area of Doñana NationalPark (southwestern Spain) for carnivore and severalpotential prey tracks. Our results showed differences inthe number of tracks detected between observers and asignificant interaction between observers and the day periodwhen censuses were carried out. Moreover, the variablesincreasing the quality of the substrate (higher environmen-tal humidity, lower wind speed and days since last rain) notonly led to a greater detection of carnivore tracks but,depending on the size of the species sampled othervariables such as distance from transects to the vegetationborder, also affected results. We recommend restrictingsampling to certain fixed weather conditions when planningto monitor relative animal abundance from track censuses.When not possible, climatic or methodological variables
should be included as covariates in analyses that try to testfor the biological factors affecting wildlife abundance,taking into account that these variables, which affect thenumber of tracks detected could vary between years.
Keywords Climatic variables . Census methods .
Carnivores . Small mammals . Sandy substrate . Trackcounts
Introduction
Determining occurrence and estimating population abun-dance of species is fundamental for their conservation,research and management (Caughley and Sinclair 1994;Silveira et al. 2003; Sadlier et al. 2004). This is particularlydifficult and poses many practical problems on a largespatial scale and in long-term monitoring for cryptic specieswith nocturnal and solitary habits, large home ranges, low-density populations and an elusive nature, such as mostmammalian carnivore species and their prey.
Few methods are suitable for monitoring elusive, low-density species (Mills et al. 2000) in spite of the amount ofavailable monitoring methods (Williams et al. 2002;Liebenberg et al. 2010), but indirect sampling methods,such as track counts on suitable natural substrates (e.g.,snow, mud or sand), have been traditionally used toovercome these problems (e.g., Stephenson 1986; Smallwoodand Fitzhugh 1995; Zaumyslova 2000; Gusset and Burgener2005; Datta et al. 2008; Funston et al. 2010).
The broad application of natural sign surveys, such astrack counts, has firmly established their use as a tool forwildlife detection. Track surveys do not rely upon specialtechnology or equipment, can be relatively straightforwardand quick to conduct and can easily incorporate multispe-
Communicated by P. Acevedo
C. Á. Soto Navarro (*) : S. Desniça : F. Palomares FernándezDepartment of Conservation Biology,Estación Biológica de Doñana CSIC,C/Américo Vespucio, s/n,41092, Isla de la Cartuja, Seville, Spaine-mail: [email protected]
Eur J Wildl Res (2012) 58:117–126DOI 10.1007/s10344-011-0551-9
Author's personal copy
cies and large geographic area objectives. Moreover, trackcounts do not require a behavioral response to attractants orother survey equipment, thus there are potentially fewerspecies-specific limitations and biases inherent to tracksurveys (Long et al. 2008). Nevertheless, field-basedspecies identification may be ambiguous or unfeasible, soadditional efforts and highly skilled and experiencedtrackers are needed to validate the identification of speciesor individuals. This weakness related to species identifica-tion combined with the limited availability of appropriatetracking mediums or conditions, the ephemeral andweather-dependent character of tracks and the inconsistentsurvey designs and quality control procedures have resultedin a growing criticism of track surveys and the need toimprove survey efforts to meet more rigorous standards.
Although strong relationships between kilometricabundance indices (KAIs), obtained by spotlight counts,and population size have been previously reported (e.g.,Newsome et al. 1989; Short et al. 1997; Garel et al. 2010),it is important to highlight that track censuses can only betaken as indices of presence, relative abundance or densityestimators (Anderson 2001) and that such indices are ratedclosely to true animal abundance across habitat types,observers, and other factors (see Gibbs 2000). Herein, thenumber of tracks of certain species encountered on atransect will depend on biological factors such as theirabundance, food density and distribution, vegetationstructure and intraspecific or interspecific interferenceincluding humans (e.g., Odonoghue et al. 1997; Shapiraet al. 2008; Bayne et al. 2008; Blaum et al. 2009), butthere are other classes of variables that affect the index(Buckland et al. 1993). These variables are related to theobserver including the observer’s training and experience,eyesight and fatigue level, the environment (i.e., climaticconditions and local habitats) and aspects of the speciesitself such as their body size (Anderson 2001; Mackenzieand Kendall 2002). Among the variables associated withthe environment such as wind speed, temperature, humid-ity, cloud cover, time of sunrise or days from the last rainor snow, many have been previously suggested aspotential influences on the results of track sampling(Norton 1990; Hayward et al. 2002; Long et al. 2008).These nonbiological factors constitute an important sourceof error, as they affect the probability of detection andtherefore the count. If they are not considered whendesigning a monitoring program, they can increasevariance or uncertainty for the estimates of relativeabundance indices (Thompson et al. 1989).
Despite the potential influence that the abovementionedfactors may have on track counts, specific studies on thesubject are scarce (Jennelle et al. 2002; Karanth et al. 2003,but see Stander 1998; Balme et al. 2009; Zielinski andSchlexer 2009). Nevertheless, there is a growing suggestion
to include measures of precision and estimates of thedetection probability when using indices values (usuallyraw counts) purporting to measure relative abundance (e.g.,Anderson 2001; Rosenstock et al. 2002; Engeman 2003).
Here, we studied how methodological and climaticfactors affected the number of tracks detected in surveyscarried out on sand-based substrates. Specifically, weexamined whether some climatic variables, such as maxi-mum temperature, average relative humidity, maximumwind speed or days since last rain, and methodologicalfactors, such as censusing day period, distance fromtransect to vegetation edge, substrate condition or observer,may affect the number of tracks detected for a set of sevenmammalian carnivores and some of their potential prey onsandy substrates in Southwestern Spain, and how, depend-ing on the size of the animals surveyed, different factorscould affect the detection probability.
Methods
Study area
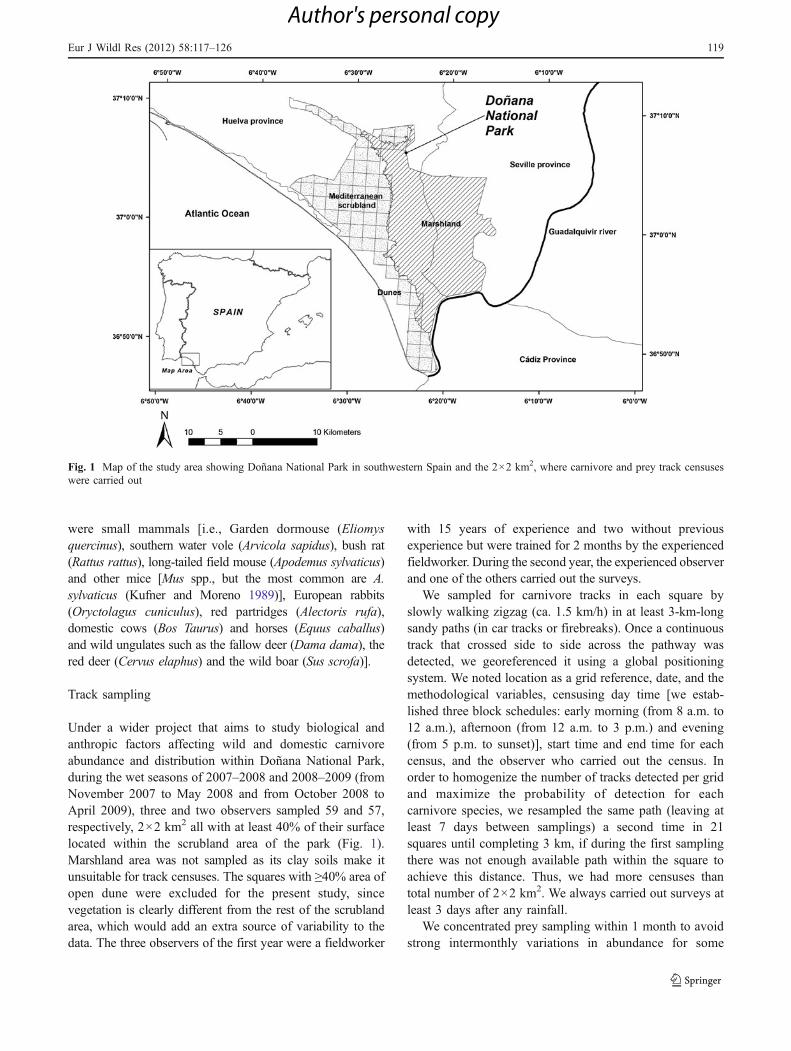
The study was carried out in Doñana National Park insouthwestern Spain (37°9′N, 6°26′W). This is a 550 km2
flat sandy area at sea level bordered to the south and westby the Atlantic Ocean and to the east by the GuadalquivirRiver mouth. The climate is Mediterranean subhumid (i.e.,characterized by mild wet winters and hot dry summers),with an average annual rainfall of 500–600 mm. There arethree main environmental units in the park: marshland,dunes and Mediterranean scrubland (Fig. 1). Track censuseswere restricted to the scrubland area, which is mainlycharacterized by heterogeneous patches of xerophyticspecies, such as Halimium sp. and Cistus sp., andhygrophytic ones, such as Erica sp., with some patches ofJuniperus phoenicea and Pistacia lentiscus shrubs. Inter-spersed with the scrubland, there are scattered cork oaktrees (Quercus suber) and wild olive trees (Olea europea),and a few patches of pine Pinus pinea and eucalyptusEucalyptus sp. plantations. The Mediterranean scrublandrepresents approximately half of the National Park surfacearea.
Carnivore species in our study area are the red fox(Vulpes vulpes), the Eurasian badger (Meles meles), theEgyptian mongoose (Herpestes ichneumon), the commongenet (Genetta genetta), the polecat (Mustela putorius), theIberian lynx (Lynx pardinus), the European otter (Lutralutra), wild and domestic cat (Felis sp.), and domestic dog(Canis familiaris). Polecats and otters were excluded fromour study because of their low abundance.
Potential target prey species for hunting or consumption ascarrion by the carnivore community and sampled in our study
118 Eur J Wildl Res (2012) 58:117–126
Author's personal copy
were small mammals [i.e., Garden dormouse (Eliomysquercinus), southern water vole (Arvicola sapidus), bush rat(Rattus rattus), long-tailed field mouse (Apodemus sylvaticus)and other mice [Mus spp., but the most common are A.sylvaticus (Kufner and Moreno 1989)], European rabbits(Oryctolagus cuniculus), red partridges (Alectoris rufa),domestic cows (Bos Taurus) and horses (Equus caballus)and wild ungulates such as the fallow deer (Dama dama), thered deer (Cervus elaphus) and the wild boar (Sus scrofa)].
Track sampling
Under a wider project that aims to study biological andanthropic factors affecting wild and domestic carnivoreabundance and distribution within Doñana National Park,during the wet seasons of 2007–2008 and 2008–2009 (fromNovember 2007 to May 2008 and from October 2008 toApril 2009), three and two observers sampled 59 and 57,respectively, 2×2 km2 all with at least 40% of their surfacelocated within the scrubland area of the park (Fig. 1).Marshland area was not sampled as its clay soils make itunsuitable for track censuses. The squares with ≥40% area ofopen dune were excluded for the present study, sincevegetation is clearly different from the rest of the scrublandarea, which would add an extra source of variability to thedata. The three observers of the first year were a fieldworker
with 15 years of experience and two without previousexperience but were trained for 2 months by the experiencedfieldworker. During the second year, the experienced observerand one of the others carried out the surveys.
We sampled for carnivore tracks in each square byslowly walking zigzag (ca. 1.5 km/h) in at least 3-km-longsandy paths (in car tracks or firebreaks). Once a continuoustrack that crossed side to side across the pathway wasdetected, we georeferenced it using a global positioningsystem. We noted location as a grid reference, date, and themethodological variables, censusing day time [we estab-lished three block schedules: early morning (from 8 a.m. to12 a.m.), afternoon (from 12 a.m. to 3 p.m.) and evening(from 5 p.m. to sunset)], start time and end time for eachcensus, and the observer who carried out the census. Inorder to homogenize the number of tracks detected per gridand maximize the probability of detection for eachcarnivore species, we resampled the same path (leaving atleast 7 days between samplings) a second time in 21squares until completing 3 km, if during the first samplingthere was not enough available path within the square toachieve this distance. Thus, we had more censuses thantotal number of 2×2 km2. We always carried out surveys atleast 3 days after any rainfall.
We concentrated prey sampling within 1 month to avoidstrong intermonthly variations in abundance for some
Fig. 1 Map of the study area showing Doñana National Park in southwestern Spain and the 2×2 km2, where carnivore and prey track censuseswere carried out
Eur J Wildl Res (2012) 58:117–126 119
Author's personal copy
species (e.g., see Kufner 1986; Palomares et al. 2001 forsmall mammals and European rabbits, respectively). Thus, wecarried out the sampling of prey tracks in April 2009 alongtransects in every 2×2 km2 sampled for carnivore tracks.These transects for prey species were walked as they were forcarnivore tracks, were 25 m in length and approximately1.7 m wide (i.e., the area of a four-wheel-drive car) and werelocated in the middle of the census path and separated by atleast 300 m. We recorded the location as a grid reference,date, observer, and the following methodological variables:distance from nearest border of census transect to the closestvegetation border (not recorded for carnivore track censusesas they were carried out by zigzag walking), pathway wheretransects were established (firebreaks or car tracks) andquality of the substrate for detecting tracks based on thepresence of grass [we established two categories: good (whengrassy groundcover was less than 10% in any part of the 25-mtransect) and fair (when grassy groundcover in any part of the25-m transect was between 11% and 30%)]. We consideredunsuitable for prey counts transects in which grassy ground-cover was more than 30% in some part of the transect.
The climatic variables result from an average of themaximum temperature (calculated as the average of themaximum temperature measured on the census day and themaximum temperature measured in two consecutive daysbefore the census day), relative humidity, maximum windspeed, and the number of days since last rain. The data wasobtained from a station located inside Doñana NationalPark (Control RM1 meteorological station; latitude: 37°1′18″, longitude: 6°33′17″; http://icts.ebd.csic.es).
Data analyses
In order to avoid linearity assumptions, we preliminaryexplored the shape of the response for each landscapevariable before fitting them into the final equations (Austin2002). With this aim, we fit generalized additive models(GAMs; Hastie and Tibshirani 1990) using carnivore KAIsand the number of prey tracks as response variables andfitting smoothing splines with 3 degrees of freedom tomodel every climatic and methodological continuous effect.The smoothed variables were then turned into suitableparametric terms guided by visual inspection of the partialresidual plots (Crawley 2005). The postulated models werethen fit to the track census dataset using generalized linearmodels (GLMs) with the log link, negative binomialerror structure and linear and nonlinear responses tofixed effects in accordance with the GAM results. Weanalyzed the effect of methodological variables observer(observer) and censusing day time (day_time), andclimatic variables maximum temperature (max_temp),average relative humidity (humidity), maximum windspeed on census day (wind_speed), and days since last
rain (last_rain) on the carnivore KAI. We also included inthe models the interactions between observer and day_time, asthe number of samplings carried out by each observer in eachdaily time period was different. Correlations between pre-dictors were always low (r<0.6) so we fitted full models (i.e.,models including all the methodological and climaticvariables). As for some 2×2 km2, we carried out more thanone census, our sampling unit was the census and not thesquare. We examined the effect of the above variables ontotal carnivore abundance index, small carnivore (from 1 to5 kg of body mass) abundance index (including the commongenet, wild and domestic cats and the Egyptian mongoose)and medium-sized carnivore (>7 kg of body mass) abun-dance index (including the red fox, the Eurasian badger, theIberian lynx and the domestic dog).
We followed a backward regression model selectionprocedure excluding variables contributing least to themodel (i.e., variables with P>0.3) before models wererefitted. Only variables with P≤0.05 were interpreted asstatistically significant. Overdispersion was not a problem[f was close to 1 (1.14–1.21)] for any of the models (Zuuret al. 2007). We analyzed data separately for each studyyear as the number of observers changed and to maximizethe variability between conditions, which could affect thenumber of tracks detected on sand substrates.
We also performed GLMs with negative binomial errorsand log link function to analyse the effect of observer,distance from border of census transects to the closestvegetation border (dist_veg.), type of path (place) whereprey censuses were carried out (firebreaks or car tracks),quality of the substrate (quality) and climatic variableslast_rain, max_temp, humidity and wind_speed on trackcounts data of prey species. We also included in the modelsthe interactions between observer and quality and observerand place. Prey data were grouped as total prey, small prey(small mammals), medium-sized prey (rabbits and partridges)and large prey (cows, horses and ungulates). Correlationbetween predictors was low (r<0.5), so we fitted full models.Overdispersion was not a problem (f = 1.04–1.24). Thesample unit to adjust GLM was the 25-m transects.
To simplify models and their understanding, we alsofollowed a backward regression model selection procedureexcluding variables with P>0.3, and then refitted themodels. All statistical analyses were performed using theSAS® 9.2 statistical software (SAS Institute, Cary, NC,USA), GAM and GLM were fitted using the gam andgenmod procedures, respectively.
Results
A total of 471 km were walked and 8,373 carnivore trackswere found during surveys, with the red fox, the Eurasian
120 Eur J Wildl Res (2012) 58:117–126
Author's personal copy
badger and the Egyptian mongoose being the most recordedspecies (Table 1). For prey, 5,000 tracks were detected on11,575 m sampled (Table 2). Prey species more oftendetected were ungulates (i.e. fallow deer, red deer, wildboar) and rabbits.
For the first year, there were differences in the numberof tracks detected among observers for all small andmedium carnivores, and the number of tracks decreasedwhen wind speed increased for total carnivores, increasedwhen humidity was higher for small carnivores and washighest during the afternoon for medium-sized carnivores(Table 3, Fig. 2). A significant interaction was alsodetected between the censusing day period and theobserver, with the three observers finding more medium-sized carnivore tracks in the evening than in the morningor afternoon (Table 3, Fig. 2d).
During the second year, more tracks were detected whenhumidity increased for total and medium-sized carnivores,and fewer small carnivore tracks were recorded when dailymaximum temperature and days since last rain increased(Table 3, Fig. 3).
Most of the variables considered affected the totalnumber of prey tracks detected (Table 4). Thus, the numberof tracks for total prey increased when the daily maximumtemperature, humidity and days since last rain increased(Fig. 4c), and decreased when wind speed and distance tovegetation edge was highest. Furthermore, the number oftotal tracks was higher when samplings were carried out incar tracks than in firebreaks (Fig. 4b), one observer detectedmore tracks than the other (Fig. 4a), and there was asignificant interaction between observer and place (Fig. 4d).Some interesting exceptions to this general pattern werefound when data were separated by type of prey (Table 4).For small prey, the number of tracks was not affected bywind speed, humidity, maximum daily temperature anddays since last rain, and the interaction between observer
and place was not found. For medium-sized prey, thenumber of tracks found was not affected by wind speed,daily maximum temperature and days from the last rain, butin this case quality of the road did affect results, with ahigher number of tracks being detected at transects withoutgrass. Finally, the number of large prey tracks was notaffected by daily maximum temperature, distance tovegetation, type of path, or observer, and there was nointeraction between observer and place.
Discussion
Track censuses can provide a rapid and cost-effectiveassessment of relative abundance of a species, but improvingtheir performance and robustness by understanding the factorsthat potentially affect them is a key step for the design ofsound monitoring programs. Indeces derived from tracksurveys are partially a function of animal abundance but arealso a function of a long list of methodological and climaticvariables and characteristics of the species being surveyed.Our results support the hypothesis that nonbiologicalfactors can affect the number of animal tracks detected insurveys and must be taken into account when planning tostudy animal abundance, distribution or the biologicalfactors determining them.
The aim of this study is not to establish a standardprotocol to carry out track censuses in sandy substrates butto identify how different methodological and climaticvariables can affect the number of tracks detected incensuses. Nevertheless, as a rule, our study shows howvariables increasing the quality of the substrate (e.g., higherenvironmental humidity, lower wind speed and few dayssince last rain) allowed the detection of a greater number oftracks. Previous studies had suggested that these type ofvariables could influence results, but no quantitative data
Table 1 Carnivore kilometric abundance index (KAI, tracks/km) in the scrubland area of Doñana National Park during the wet seasons of2007–2008 and 2008–2009
2007–2008 2008–2009
Species Positive censuses Total numberof tracks
KAI(mean±SD)
Range Positivecensuses
Total numberof tracks
KAI(mean±SD)
Range
Lynx pardinus 19 65 0.4±0.9 0–5.4 14 75 0.4±0.9 0–5.0
Meles meles 68 599 3.9±5.1 0–20.6 53 666 3.7±3.8 0–17.3
Herpestes ichneumon 60 631 4.0±4.4 0–21.1 48 544 2.8±3.3 0–12.5
Vulpes vulpes 76 3,138 17.7±9.1 2.4–44.2 61 2,333 11.9±6.5 1.2–32.6
Genetta genetta 21 160 0.8±2.3 0–15.9 20 66 0.4±0.7 0–2.8
Felis sp. 8 25 0.2±0.8 0–5.7 17 27 0.1±0.3 0–1.3
Canis familiaris 12 23 0.2±0.7 0–5.9 11 21 0.1±0.3 0–2.0
The number of censuses was 76 and 62 for each study year, respectively
Eur J Wildl Res (2012) 58:117–126 121
Author's personal copy
had been provided (but see Hayward et al. 2002; Bayne etal. 2008). For instance, to determine the presence ofmountain lions Felis concolor californica, through tracksurveys, Van Dyke et al. (1986) and Smallwood andFitzhugh (1995) recommended excluding desert areas orwindy conditions. Other authors (Zielinski et al. 1995;Bayne et al. 2005) have made recommendations for snowtracking to detect the presence of a wide diversity of speciessuch as American martens (Martes americana), Canadalynx (Lynx canadensis), wolverines (Gulo gulo), coyotes(Canis lastrans), red foxes (V. vulpes), bobcats (Lynx rufus),grey wolves (Canis lupus) or mountain lions (Pumaconcolor), among others. Recommendations include avoid-ing tracking during snowfall and waiting until the second
morning after a snowfall, carrying out tracking early in themorning during periods of melting and freezing and nottracking on south-facing slopes.
Moreover, in Europe and other arid regions of Australia,India, South America or South Africa where track surveysoccurring in dust, mud or sand are more broadly employed,many authors have also tried to standardize survey designand effort by suspending searches of tracks for ≥24 h afterprecipitation or periods of high winds (≥24 km/h) and alsoby using only early morning observations for analysis (e.g.,Stander et al. 1998; Sargeant et al. 2005; Evans et al. 2009;Funston et al. 2010).
There was some exception to the general rule stated. Apositive correlation was found between number of tracksrecorded and days since last rain for large prey species.Their large size rendered their tracks easily recognizable inpoor substrate conditions.
Other methodological variables also affected resultsdepending on the size of the species sampled. A highernumber of prey species tracks were detected when transectsran near a vegetation border or in car tracks. This resultcould be caused by two different reasons. Vegetation mustexert a protective effect against wind and maintain a higherlevel of moisture on the sand, thereby increasing substratequality for detecting tracks. Also, medium and small preymay prefer to remain near a vegetation edge to decrease
Table 2 Total number of tracks detected and the mean index ofabundance (tracks/25 m) for each group of potential prey speciesalong 463 25-m transects
Species group Number of tracks Mean ± SD Range
Small mammals 233 0.5±1.4 0–13
Rabbits 2,132 4.6±9.4 0–115
Partridges 260 0.6±1.3 0–11
Cows/horses 210 0.4±1.6 0–18
Ungulates 2,165 4.7±9.4 0–33
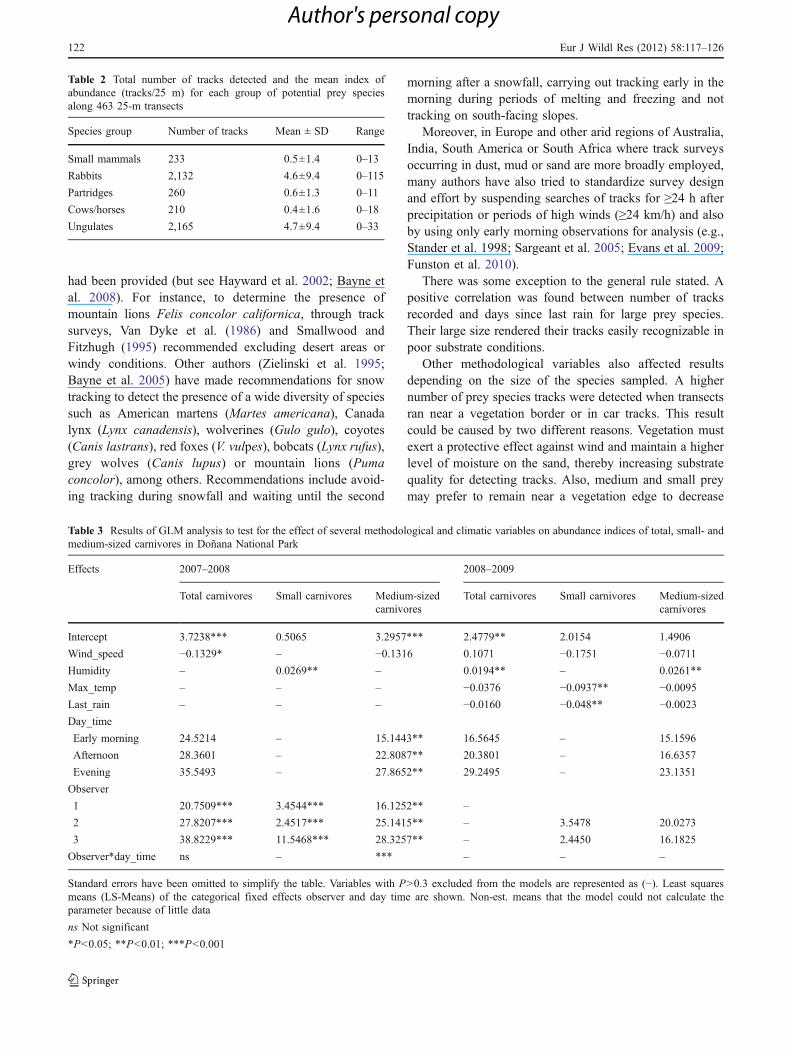
Table 3 Results of GLM analysis to test for the effect of several methodological and climatic variables on abundance indices of total, small- andmedium-sized carnivores in Doñana National Park
Effects 2007–2008 2008–2009
Total carnivores Small carnivores Medium-sizedcarnivores
Total carnivores Small carnivores Medium-sizedcarnivores
Intercept 3.7238*** 0.5065 3.2957*** 2.4779** 2.0154 1.4906
Wind_speed −0.1329* – −0.1316 0.1071 −0.1751 −0.0711Humidity – 0.0269** – 0.0194** – 0.0261**
Max_temp – – – −0.0376 −0.0937** −0.0095Last_rain – – – −0.0160 −0.048** −0.0023Day_time
Early morning 24.5214 – 15.1443** 16.5645 – 15.1596
Afternoon 28.3601 – 22.8087** 20.3801 – 16.6357
Evening 35.5493 – 27.8652** 29.2495 – 23.1351
Observer
1 20.7509*** 3.4544*** 16.1252** –
2 27.8207*** 2.4517*** 25.1415** – 3.5478 20.0273
3 38.8229*** 11.5468*** 28.3257** – 2.4450 16.1825
Observer*day_time ns – *** – – –
Standard errors have been omitted to simplify the table. Variables with P>0.3 excluded from the models are represented as (−). Least squaresmeans (LS-Means) of the categorical fixed effects observer and day time are shown. Non-est. means that the model could not calculate theparameter because of little data
ns Not significant
*P<0.05; **P<0.01; ***P<0.001
122 Eur J Wildl Res (2012) 58:117–126
Author's personal copy
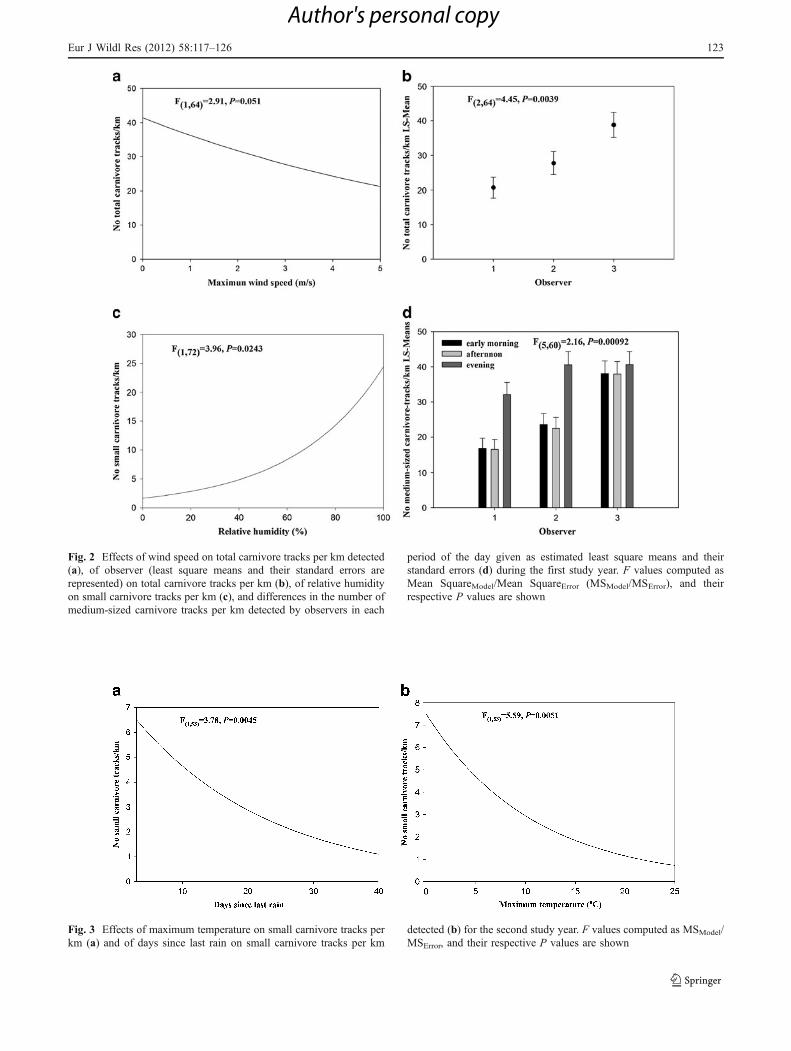
Fig. 2 Effects of wind speed on total carnivore tracks per km detected(a), of observer (least square means and their standard errors arerepresented) on total carnivore tracks per km (b), of relative humidityon small carnivore tracks per km (c), and differences in the number ofmedium-sized carnivore tracks per km detected by observers in each
period of the day given as estimated least square means and theirstandard errors (d) during the first study year. F values computed asMean SquareModel/Mean SquareError (MSModel/MSError), and theirrespective P values are shown
Fig. 3 Effects of maximum temperature on small carnivore tracks perkm (a) and of days since last rain on small carnivore tracks per km
detected (b) for the second study year. F values computed as MSModel/MSError, and their respective P values are shown
Eur J Wildl Res (2012) 58:117–126 123
Author's personal copy
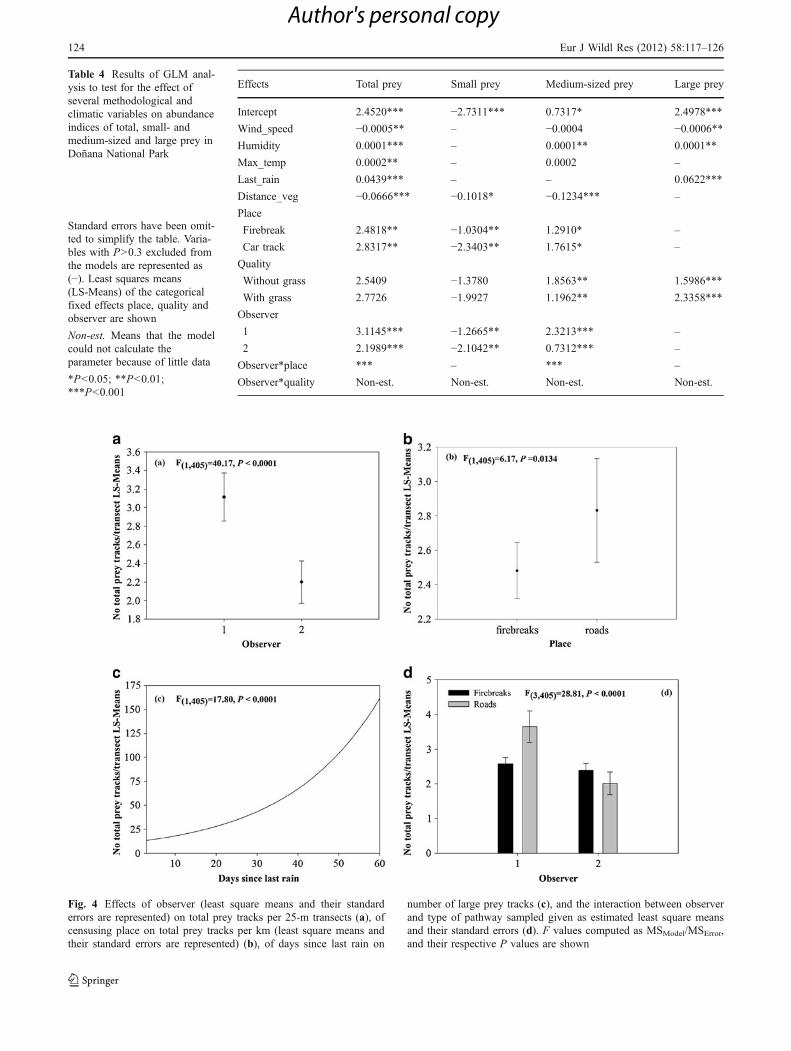
Effects Total prey Small prey Medium-sized prey Large prey
Intercept 2.4520*** −2.7311*** 0.7317* 2.4978***
Wind_speed −0.0005** – −0.0004 −0.0006**Humidity 0.0001*** – 0.0001** 0.0001**
Max_temp 0.0002** – 0.0002 –
Last_rain 0.0439*** – – 0.0622***
Distance_veg −0.0666*** −0.1018* −0.1234*** –
Place
Firebreak 2.4818** −1.0304** 1.2910* –
Car track 2.8317** −2.3403** 1.7615* –
Quality
Without grass 2.5409 −1.3780 1.8563** 1.5986***
With grass 2.7726 −1.9927 1.1962** 2.3358***
Observer
1 3.1145*** −1.2665** 2.3213*** –
2 2.1989*** −2.1042** 0.7312*** –
Observer*place *** – *** –
Observer*quality Non-est. Non-est. Non-est. Non-est.
Table 4 Results of GLM anal-ysis to test for the effect ofseveral methodological andclimatic variables on abundanceindices of total, small- andmedium-sized and large prey inDoñana National Park
Standard errors have been omit-ted to simplify the table. Varia-bles with P>0.3 excluded fromthe models are represented as(−). Least squares means(LS-Means) of the categoricalfixed effects place, quality andobserver are shown
Non-est. Means that the modelcould not calculate theparameter because of little data
*P<0.05; **P<0.01;***P<0.001
Fig. 4 Effects of observer (least square means and their standarderrors are represented) on total prey tracks per 25-m transects (a), ofcensusing place on total prey tracks per km (least square means andtheir standard errors are represented) (b), of days since last rain on
number of large prey tracks (c), and the interaction between observerand type of pathway sampled given as estimated least square meansand their standard errors (d). F values computed as MSModel/MSError,and their respective P values are shown
124 Eur J Wildl Res (2012) 58:117–126
Author's personal copy
predation risk (Hughes and Ward 1993, but see Moreno etal. 1996).
Nevertheless, it is necessary to note that our results werenot consistent among size groups or between years,probably because many of the variables that affectdetectability, and therefore the count, exhibit time trends(i.e. vary between years) further confounding the value andinterpretation of the index. This is an important issue as itmakes track censuses incomparable across different climat-ic and methodological conditions.
Our results also showed differences in the number oftracks detected among observers. Moreover, the differenceswere more apparent in poor substrate conditions, when thetracks of nocturnal species would have suffered the greatestdeterioration due to time, sun or wind, as was suggested bythe significant interaction found between observer and thecensus day time. This result shows some observers are ableto detect more tracks at one period of the day than others,probably depending on their performance. The effect of theobserver in the number of tracks detected could also bepartially related to the census speed, as differences amongobservers in their average speed as a function of theirexperience were detected (data not shown). The quality ofdata had been previously questioned depending on the skilllevel of observers (Bider 1968; Smallwood and Fitzhugh1995; Anderson 2001; Wilson and Delahay 2001; Silveiraet al. 2003). For this reason, suggestions have been recentlyproposed to decrease differences among observers or toevaluate observer skills (Sadlier et al. 2004; Evans 20062009; Zielinski and Schlexer 2009).
Different approaches might be used to reduce thepossible influence of methodological and climatic variableson track counts. One would be to limit track censuses tosome given weather conditions, which would ensure aconstant substrate quality for detecting tracks. Furthermore,to keep constant the time of the day, days from the last rainor snow, observers involved in the sampling or distance tovegetation borders will also help to diminish variability inthe number of tracks recorded. Some of these suggestionshave been approached by maintaining constant substratequality through the use of artificial substrates and byerasing and resampling newly left tracks on transects for agiven fixed number of days (Gruber et al. 2008; Watts et al.2008; Russell et al. 2009; Zielinski and Schlexer 2009).
Avoiding such potentially confounding effects in datacollection should be a fundamental design concept(Engeman 2003). However, it is not always possible toconsider these meteorological or methodological issueswhen carrying out large-scale samplings or when largevolumes of data are needed for population estimationprocedures. Thus, we also propose that these possiblemeteorological or methodological variables be recordedand to include them as covariates in any further statistical
analysis aiming to test for biological factors affectingrelative animal abundance (also see Smallwood andFitzhugh 1995). Survey design and statistical rigor areimportant, but we agree with previous authors (e.g.,Thompson et al. 1998; Nichols et al. 2000; Anderson2001; Yoccuz et al. 2001; Mackenzie and Kendall 2002)that estimating relative abundance based on indices alone(e.g., raw counts) is naive and that the focus of effortsought to be on estimating detection probabilities as well.
These results could be applied to a variety of researchfields, both for testing validity of preexisting data andimproving the suitability and performance of future studiesbased on track surveys. Although the indices derived fromtrack censuses are only partially a function of animalabundance (Anderson 2001), if the variables associated withthe observer, the environment, and characteristics of thespecies being surveyed are controlled, the reliability of theinformation extracted from these methods may be improved.
Acknowledgments This research was funded by the projectsCGL2004-00346/BOS (Spanish Ministry of Education and Science)and 17/2005 (Spanish Ministry of the Environment; National ParksResearch Program). Land-Rover España lent us two vehicles for thiswork. We are very grateful especially to J.C. Rivilla for theirassistance during fieldwork. C. Soto was also supported by a JAE-Predoc grant from the CSIC.
References
Anderson DR (2001) The need to get the basics right in wildlifestudies. Wildl Soc Bull 29:1294–1297
Austin MP (2002) Spatial prediction of species distribution: aninterface between ecological theory and statistical modelling.Ecol Model 157:101–118
Balme GA, Hunter LTB, Slotow R (2009) Evaluating methods forcounting cryptic carnivores. J Wildl Manag 73(3):433–441
Bayne E, Moses R, Boutin S (2005) Evaluation of winter trackingprotocols as a method for monitoring mammals in the AlbertaBiodiversity Monitoring Program. Rep Alta Biodivers MonitProgr, Vegreville, Alberta, Canada
Bayne EM, Boutin S et al (2008) Ecological factors influencing thespatial pattern of Canada lynx relative to its southern range edgein Alberta, Canada. Can J Zool Rev Can Zool 86(10):1189–1197
Bider JR (1968) Animal activity in uncontrolled terrestrial communi-ties as determined by a sand transect technique. Ecol Monogr 38(3):269–308
Blaum N, Tietjen B et al (2009) Impact of livestock husbandry onsmall- and medium-sized carnivores in Kalahari savannahrangelands. J Wildl Manag 73(1):60–67
Buckland ST, Anderson DR, Burnham KP, Laake JL (1993) Distancesampling: estimating abundance of biological populations.Chapman and Hall, London, p 446
Caughley G, Sinclair ARE (1994) Wildlife ecology and management.Blackwell, Oxford
Crawley MJ (2005) Statistics: an introduction using R. Wiley,Chichester
Datta A, Anand MO, Naniwadekar R (2008) Empty forests: largecarnivore and prey abundance in Namdapha National Park,north-east India. Biol Conserv 141(5):1429–1435
Eur J Wildl Res (2012) 58:117–126 125
Author's personal copy
Engeman RM (2003) More on the need to get the basics right:population indices. Wildl Soc Bull 31:286–287
Evans J (2006) Observer error in identifying species using indirectsigns: analysis of a river otter track survey technique. Thesis,Texas A&M University, College Station, TX, USA
Evans et al (2009) Determining observer reliability in counts of riverotter tracks. J Wildl Manag 73:426–432
Funston PJ, Frank L et al (2010) Substrate and species constraints onthe use of track incidences to estimate African large carnivoreabundance. J Zool 281(1):56–65
Garel M, Bonenfant C, Hamann JL, Klein F, Gaillard JM (2010) Areabundance indices derived from spotlight counts reliable tomonitor red deer populations? Wildl Biol 16(1)
Gibbs JP (2000) Monitoring populations. In: Boitani L, Fuller T (eds)Research techniques in animal ecology: controversies andconsequences. Columbia Univ Press, New York, pp 213–247
Gruber B, Reineking B et al (2008) A new method for estimatingvisitation rates of cryptic animals via repeated surveys of indirectsigns. J Appl Ecol 45(2):728–735
Gusset M, Burgener N (2005) Estimating larger carnivore numbersfrom track counts and measurements. Afr J Ecol 43(4):320–324
Hastie TJ, Tibshirani RJ (1990) Generalized additive models.Chapman & Hall, London
Hayward GD, Miquelle DG et al (2002) Monitoring Amur tigerpopulations: characteristics of track surveys in snow. Wildl SocBull 30(4):1150–1159
Hughes JJ, Ward D (1993) Predation risk and distance to cover affectforaging behaviour in Namib Desert gerbils. Anim Behav 46:1243–1245
Jennelle CS, Runge MC, MacKenzie DI (2002) The use ofphotographic rates to estimate densities of tigers and othercryptic mammals: a comment on misleading conclusions. AnimConserv 5:119–120
Karanth KU, Nichols JD et al (2003) Science deficiency inconservation practice: the monitoring of tiger populations inIndia. Anim Conserv 6:141–146
Kufner MB (1986) Tamaño actividad, densidad relativa y preferenciasde hábitat de los pequeños y medianos mamíferos de Doñana,como factores condicionantes de su tasa de predación. Thesis,Universidad Autónoma, Madrid, Spain
Kufner MB, Moreno YS (1989) Abundancia y amplitud de losdesplazamientos de Apodemus sylvaticus en cuatro biotopos deDoñana que difieren en cobertura vegetal. Doñana, ActaVertebrata 16:179–181
Liebenberg et al (2010) Practical tracking. Stackpole BooksLong et al 2008. Noninvasive survey methods for carnivores. Island
PressMacKenzie DI, Kendall WL (2002) How should detection probability
be incorporated into estimates of relative abundance. Ecology83:2387–2393
Mills LS, Citta J et al (2000) Estimating animal abundance using non-invasive DNA sampling: promise and pitfalls. Ecol Appl 10(1):283–294
Moreno S, Villafuerte R, Delibes M (1996) Cover is safe during theday but dangerous at night: the use of vegetation by Europeanwild rabbits. Can J Zool 74:1656–1660
Newsome AE, Parer I, Catling PC (1989) Prolonged prey suppressionby carnivores—predator-removal experiments. Oecologia78:458–467
Nichols JD, Hines JE, Sauer JR, Fallon FW, Fallon JE, Heglund PJ(2000) A double-observer approach for estimating detectionprobability and abundance from counts. Auk 117:393–408
Norton PM (1990) How many leopards? A criticism of Martin andde Meulenaer’s population estimates for Africa. S Afr J Sci86:218–220
Odonoghue M, Boutin S et al (1997) Numerical responses of coyotesand lynx to the snowshoe hare cycle. Oikos 80(1):150–162
Palomares F, Delibes M et al (2001) Spatial ecology of Iberian lynxand abundance of European rabbits in South western Spain.Wildl Monogr 148:1–36
Rosenstock SS, Anderson DR, Giesen KM, Leukering T, Carter MF(2002) Landbird counting techniques: current practices and analternative. Auk 119:46–53
Russell JC, Hasler N et al (2009) Automatic track recognition offootprints for identifying cryptic species. Ecol 90:2007–2013
Sadlier LMJ, Webbon CC et al (2004) Methods of monitoring redfoxes Vulpes vulpes and badgers Meles meles: are field signs theanswer? Mamm Rev 34:–7598
Sargeant GA, Sovada MA et al (2005) Markov chain Monte Carloestimation of species distributions: a case study of the swift foxin western Kansas. J Wildl Manag 69:483–497
Shapira I, Sultan H et al (2008) Agricultural farming alters predator–preyinteractions in nearby natural habitats. Anim Conserv 11(1):1–8
Short J, Turner B, Risbey DA, Carnamah R (1997) Control of feralcats for nature conservation: II. Population reduction bypoisoning. Wildl Res 24:703–714
Silveira L, Jácomo ATA, Diniz-Filho JAF (2003) Camera trap, linetransect census and track surveys: a comparative evaluation. BiolConserv 114:351–355
Smallwood KS, Fitzhugh EL (1995) A track count for estimatingmountain lion Felis concolor californica population trend. BiolConserv 71:251–259
Stander PE (1998) Spoor counts as indices of large carnivorepopulations: the relationship between spoor frequency, samplingeffort and true density. J Appl Ecol 35:378–385
Stephenson RO (1986) Development of lynx population estimationtechniques. Alaska Department of Fish and Game, Project W-22-2,W-22-3, W-22-4, and W-22-5, Res. Final Report, 84 pp
Thompson ID, Davidson IJ et al (1989) Use of track transects to measurethe relative occurrence of some boreal mammals in uncut forest andregenerations stands. Can J Zool 67:1816–1823
Thompson WL, White GC, Gowan C (1998) Monitoring vertebratepopulations. Academic Press, San Diego, CA, USA
Van Dyke FG, Brocke RH, Shaw HG (1986) Use of road track counts asindexes of mountain lion presence. J Wildl Manag 50(1):102–109
Watts CH, Thornburrow D et al (2008) Tracking tunnels: a novelmethod for detecting a threatened New Zealand giant weta(Orthoptera: Anostostomatidae). N Z J Ecol 31:92–97
Williams BK, Nichols JD, Conroy MJ (2002) Analysis and manage-ment of animal populations: modeling, estimation, and decisionmaking. Academic Press, San Diego, CA, USA, pp 1–1040
Wilson GJ, Delahay RJ (2001) A review of methods to estimate theabundance of terrestrial carnivores using field signs andobservation. Wildl Res 28(2):151–164
Yoccuz NG, Nichols JD, Boulinier T (2001) Monitoring of biologicaldiversity in space and time. Trends Ecol Evol 16:446–453
Zaumyslova OYu (2000) Long term population-dynamics of ungulatesin the Sikhote-Alin Reserve from winter transect count data. In:Astafiev AA (ed) Analysis of long-term monitoring data ofnature components in nature reserves in the Russian Far East.USAID, Dalnauka, Vladivostok, pp 70–79
Zielinski WJ, Schlexer FV (2009) Inter-observer variation in identi-fying mammals from their tracks at enclosed track plate stations.Northwest Sci 83(4):299–307
Zielinski WJ, Kucera TE, Barrett RH (1995) American marten, fisher,lynx, and wolverine: survey methods for their detection. USDAforest service, Pacific Southwest Research Station generaltechnical report PSW-GTR-157, Albany, CA
Zuur AF, Ieno EN and Smith GM (2007). Analysing ecological data.Springer. 680p
126 Eur J Wildl Res (2012) 58:117–126
Author's personal copy
Related Documents