Nonalcoholic Steatohepatitis Versus Steatosis: Adipose Tissue Insulin Resistance and Dysfunctional Response to Fat Ingestion Predict Liver Injury and Altered Glucose and Lipoprotein Metabolism Giovanni Musso, 1 Maurizio Cassader, 2 Franco De Michieli, 2 Floriano Rosina, 1 Fabio Orlandi, 1 and Roberto Gambino 2 Nonalcoholic fatty liver disease (NAFLD) ranges from simple steatosis (SS) to nonalcoholic steatohepatitis (NASH). Though liver-related risk seems confined to NASH, it is currently unclear whether NASH has a higher risk of cardiovascular disease (CVD) and diabetes than SS as a result of the coexistence of obesity and other cardiometabolic confounders. Adipose tissue is an emerging modulator of liver disease in NAFLD and of cardiometabolic disease in the general population. We evaluated in SS and NASH (1) glucose homeostasis and cardiovas- cular risk profile and (2) the effect of adipose tissue dysfunction, assessed in fasting condi- tions and postprandially, on liver injury, glucose and lipoprotein metabolism, and markers of early atherosclerosis. Forty nonobese, nondiabetic, normolipidemic biopsy-proven NAFLD patients (20 with SS and 20 with NASH) and 40 healthy subjects, matched for overall/ab- dominal adiposity and metabolic syndrome, underwent an oral fat load test, with measure- ment of plasma triglyceride-rich lipoproteins, oxidized low-density lipoproteins, adipokines, and cytokeratin-18 fragments, and an oral glucose tolerance test with minimal model analysis to yield glucose homeostasis parameters. Circulating endothelial adhesion molecules were measured, and adipose tissue insulin resistance (adipose IR) index and visceral adiposity index were calculated. Despite similar fasting values, compared to SS, NASH showed a more atherogenic postprandial lipoprotein profile, an altered adipokine response (i.e., higher resis- tin increase and an adiponectin fall), and hepatocyte apoptosis activation after fat ingestion. Adipose IR index, endothelial adhesion molecules, and hepatic insulin resistance progres- sively increased across NAFLD stages. NASH, but not SS, showed an impaired pancreatic b-cell function. On multiple regression analysis, adipose IR index and postprandial adiponec- tin independently predicted liver histology and altered cardiometabolic parameters. Conclusion: Adipose tissue dysfunction, including a maladaptive adipokine response to fat ingestion, modulates liver injury and cardiometabolic risk in NAFLD. (HEPATOLOGY 2012;56:933-942) N onalcoholic fatty liver disease (NAFLD) affects 30% of the general adult population and up to 80% of obese and diabetic sub- jects 1 and is considered the hepatic manifestation of metabolic syndrome. NAFLD ranges from simple stea- tosis (SS) to steatosis plus necroinflammation (e.g., nonalcoholic steatohepatitis; NASH) with or without fibrosis. 2 Emerging evidence suggests that NAFLD is Abbreviations: adipose IR, adipose tissue insulin resistance; AI, adaptation index; ALT, alanine aminotransferase; ANOVA, analysis of variance; ApoA1, apolipoprotein A1; ApoE, apolipoprotein E; AUC, area under the curve; BMI, body mass index; CGI, CP-genic index; CI, confidence interval; CK-18, cytokeratin-18; CRP, C-reactive protein; CVD, cardiovascular disease; ER, endoplasmic reticulum; FFAs, free fatty acids; HDL-C, high-density lipoprotein cholesterol; hs-CRP, high-sensitivity CRP; iAUC, incremental area under the curve; ICAM-1, intercellular adhesion molecule 1; IR, insulin resistance; IV, intravenous; LDL-C, low-density lipoprotein cholesterol; MTP, microsomal triglyceride transfer protein; NAFLD, nonalcoholic fatty liver disease; NAS, NAFLD activity score; NASH, nonalcoholic steatohepatitis; NT, nitrotyrosine; OGIS, oral glucose insulin sensitivity; OGTT, oral glucose tolerance test; OR, odds ratio; oxLDLs, oxidized low-density lipoproteins; SEM, standard error of the mean; SS, simple steatosis; T2DM, type 2 diabetes mellitus; Tg, triglycerides; TRLPs, triglyceride-rich lipoproteins; VAI, visceral adiposity index; VLDL, very-low-density lipoprotein. From the 1 Gradenigo Hospital, Torino, Italy; and 2 Department of Internal Medicine, University of Turin, Turin, Italy. Received January 1, 2012; accepted March 19, 2012. This work was funded, in part, by the Piedmont Region Funds Comitato Interministeriale per la Programmazione Economica 2008. 933

Welcome message from author
This document is posted to help you gain knowledge. Please leave a comment to let me know what you think about it! Share it to your friends and learn new things together.
Transcript
Nonalcoholic Steatohepatitis Versus Steatosis:Adipose Tissue Insulin Resistance and DysfunctionalResponse to Fat Ingestion Predict Liver Injury and
Altered Glucose and Lipoprotein MetabolismGiovanni Musso,1 Maurizio Cassader,2 Franco De Michieli,2 Floriano Rosina,1
Fabio Orlandi,1 and Roberto Gambino2
Nonalcoholic fatty liver disease (NAFLD) ranges from simple steatosis (SS) to nonalcoholicsteatohepatitis (NASH). Though liver-related risk seems confined to NASH, it is currentlyunclear whether NASH has a higher risk of cardiovascular disease (CVD) and diabetes thanSS as a result of the coexistence of obesity and other cardiometabolic confounders. Adiposetissue is an emerging modulator of liver disease in NAFLD and of cardiometabolic disease inthe general population. We evaluated in SS and NASH (1) glucose homeostasis and cardiovas-cular risk profile and (2) the effect of adipose tissue dysfunction, assessed in fasting condi-tions and postprandially, on liver injury, glucose and lipoprotein metabolism, and markers ofearly atherosclerosis. Forty nonobese, nondiabetic, normolipidemic biopsy-proven NAFLDpatients (20 with SS and 20 with NASH) and 40 healthy subjects, matched for overall/ab-dominal adiposity and metabolic syndrome, underwent an oral fat load test, with measure-ment of plasma triglyceride-rich lipoproteins, oxidized low-density lipoproteins, adipokines,and cytokeratin-18 fragments, and an oral glucose tolerance test with minimal model analysisto yield glucose homeostasis parameters. Circulating endothelial adhesion molecules weremeasured, and adipose tissue insulin resistance (adipose IR) index and visceral adiposityindex were calculated. Despite similar fasting values, compared to SS, NASH showed a moreatherogenic postprandial lipoprotein profile, an altered adipokine response (i.e., higher resis-tin increase and an adiponectin fall), and hepatocyte apoptosis activation after fat ingestion.Adipose IR index, endothelial adhesion molecules, and hepatic insulin resistance progres-sively increased across NAFLD stages. NASH, but not SS, showed an impaired pancreaticb-cell function. On multiple regression analysis, adipose IR index and postprandial adiponec-tin independently predicted liver histology and altered cardiometabolic parameters. Conclusion:Adipose tissue dysfunction, including a maladaptive adipokine response to fat ingestion,modulates liver injury and cardiometabolic risk in NAFLD. (HEPATOLOGY 2012;56:933-942)
Nonalcoholic fatty liver disease (NAFLD)affects 30% of the general adult populationand up to 80% of obese and diabetic sub-
jects1 and is considered the hepatic manifestation of
metabolic syndrome. NAFLD ranges from simple stea-tosis (SS) to steatosis plus necroinflammation (e.g.,nonalcoholic steatohepatitis; NASH) with or withoutfibrosis.2 Emerging evidence suggests that NAFLD is
Abbreviations: adipose IR, adipose tissue insulin resistance; AI, adaptation index; ALT, alanine aminotransferase; ANOVA, analysis of variance; ApoA1,apolipoprotein A1; ApoE, apolipoprotein E; AUC, area under the curve; BMI, body mass index; CGI, CP-genic index; CI, confidence interval; CK-18,cytokeratin-18; CRP, C-reactive protein; CVD, cardiovascular disease; ER, endoplasmic reticulum; FFAs, free fatty acids; HDL-C, high-density lipoproteincholesterol; hs-CRP, high-sensitivity CRP; iAUC, incremental area under the curve; ICAM-1, intercellular adhesion molecule 1; IR, insulin resistance; IV,intravenous; LDL-C, low-density lipoprotein cholesterol; MTP, microsomal triglyceride transfer protein; NAFLD, nonalcoholic fatty liver disease; NAS, NAFLDactivity score; NASH, nonalcoholic steatohepatitis; NT, nitrotyrosine; OGIS, oral glucose insulin sensitivity; OGTT, oral glucose tolerance test; OR, odds ratio;oxLDLs, oxidized low-density lipoproteins; SEM, standard error of the mean; SS, simple steatosis; T2DM, type 2 diabetes mellitus; Tg, triglycerides; TRLPs,triglyceride-rich lipoproteins; VAI, visceral adiposity index; VLDL, very-low-density lipoprotein.From the 1Gradenigo Hospital, Torino, Italy; and 2Department of Internal Medicine, University of Turin, Turin, Italy.Received January 1, 2012; accepted March 19, 2012.This work was funded, in part, by the Piedmont Region Funds Comitato Interministeriale per la Programmazione Economica 2008.
933
associated with an increased risk of liver-related com-plications, of type 2 diabetes mellitus (T2DM), andof cardiovascular disease (CVD).3 Though liver-related risk appears to be confined to NASH, it iscurrently unclear whether NASH confers a higherrisk of CVD and T2DM than SS as a result of thevarying epidemiological association of NASH and SSwith other cardiometabolic confounders, includingobesity and metabolic syndrome, which prevents anyinference on the independent effect of NASH/SS oncardiometabolic risk and on mechanisms underlyingboth liver disease progression and cardiometabolicrisk in NAFLD.Adipose tissue is emerging as a key mediator of car-
diometabolic disorders in the general population andof liver disease in NAFLD, likely through the modula-tion of lipotoxic free fatty acid (FFA) metabolism andof pro- and anti-inflammatory cytokine secretion.4-5
Consistently, abdominal adiposity excess, as quantifiedby magnetic resonance, correlated with liver fat inhealthy subjects and with severity of inflammation andfibrosis in NASH.5,6
Among dietary factors, excessive fat ingestion hasbeen consistently linked to the pathogenesis of obesity,CVD, and T2DM in the general population7 and toliver injury in animal models of NASH,8 whereas theevidence connecting dietary fat excess to NAFLD inhumans is controversial.We hypothesized that adipose tissue dysfunction
may mediate both liver disease progression and cardi-ometabolic risk in NAFLD, and that a maladaptiveadipocyte response to dietary fat modulates liverinjury and cardiometabolic risk in NAFLD, even inthe absence of overall/abdominal adiposity excess. Wetherefore assessed the association of adipose tissuedysfunction, evaluated both in fasting conditionsthrough two recently proposed indexes (the adiposetissue insulin resistance [adipose IR] index5 and thevisceral adiposity index [VAI]9,10) and dynamically af-ter an oral fat challenge, with liver histology, glucose/lipoprotein metabolism, and markers of early athero-sclerosis in nondiabetic, nonobese patients withbiopsy-proven SS or NASH matched for overall/abdominal adiposity and traditional cardiometabolicrisk factors.
Patients and MethodsSubjects. Among 85 patients referred by family
physicians to our hepato-metabolic clinic for chronicliver enzyme elevations, we selected 40 nonobese, non-diabetic, normolipidemic biopsy-proven NAFLDpatients (20 with SS and 20 with NASH) who werematched for age, sex, body mass index (BMI), waistcircumference, and metabolic syndrome features with-out clinical evidence of CVD. NASH was definedaccording to Brunt’s definition,11 and histological fea-tures were scored according to NASH ClinicalResearch Network criteria.12 Besides histological evi-dence, the diagnosis of NAFLD required all the fol-lowing criteria: persistently (>6 months) elevated liverenzymes; ultrasonographic bright liver without anyother liver or biliary tract disease; negative viralmarkers; and a history of alcohol consumption <20 g/day in men and <10 g/day in women, as assessed by adetailed interview extended to family members and bya validated questionnaire filled in daily for 1 week bypatients.Exclusion criteria were as follows: obesity (BMI
�30 kg/m2); diabetes (fasting plasma glucose �126mg/dL or plasma glucose �200 mg/dL at þ2 hourson oral glucose tolerance test [OGTT] or antidiabeticdrugs); overt dyslipidemia (fasting serum cholesterol�200 mg/dL or plasma triglyceride [Tg] �200 mg/dL); exposure to occupational hepatotoxins or drugsknown to be steatogenic, hepatotoxic, or to affectlipid/glucose metabolism; positive autoimmune or ce-liac disease markers; and abnormal serum a1-antitrip-sin, ceruloplasmin, or thyroid hormones. Mutations inthe hemochromatosis genes, HFE and transferrin re-ceptor 2, were detected in patients and controls usingmultiplex amplification reaction (Nuclear LaserMedicine, Milan, Italy). Liver iron concentration andhepatic iron index were assessed from 2 mg of dry-weight tissue by atomic absorption spectroscopy.Of 103 healthy subjects enrolled in a population-
based cohort study, 40 controls matched for age, gen-der, BMI, waist circumference, and metabolic syn-drome features were randomly identified. To furtherrule out subclinical liver disease in controls, besides anegligible alcohol intake (<20 g/day in men and <10g/day in women) and healthy abdomen ultrasound,
Address reprint requests to: Giovanni Musso, Gradenigo Hospital, Corso Regina Margherita 8, 10132 Torino, Italy. E-mail: [email protected]; fax:þ39118151320.CopyrightVC 2012 by the American Association for the Study of Liver Diseases.View this article online at wileyonlinelibrary.com.DOI 10.1002/hep.25739Potential conflict of interest: Nothing to report.Additional Supporting Information may be found in the online version of this article.
934 MUSSO ET AL. HEPATOLOGY, September 2012
the upper healthy alanine aminotransferase (ALT) limitwas set at 30 (males) and 20 U/L (females).13
Patients and controls gave their consent to the study,which was conducted according to the Declaration ofHelsinki.Anthropometry. Percent body fat was estimated by
the bioelectrical impedance analysis method (TBF-202;Tanita, Tokyo, Japan), which was previously validatedagainst dual X-ray absorption.14 Abdominal visceral fatarea (cm2) was calculated using the equations devel-oped by Stanforth et al. and validated against com-puted tomography in Caucasians.15
Adipose Tissue (Dys)Function Indices. The adiposeIR index was calculated as the product of fasting FFAs� fasting plasma insulin5; the VAI, incorporatingBMI, waist circumference, fasting Tg, and high-densitylipoprotein cholesterol (HDL-C) was calculated as pre-viously described.10
Genetic Analyses. Patients and controls were geno-typed for microsomal triglyceride transfer protein(MTP) �493 G/T and apolipoprotein E (ApoE) poly-morphisms, which are well-known modulators of lipo-protein metabolism and liver disease in NAFLD16 (seeSupporting Appendix).Alimentary Record. Subjects filled in a daily dietary
record for 1 week, according to the European Prospec-tive Investigation into Cancer and Nutrition protocol,which was analyzed using the WINFOOD database(Medimatica, Teramo, Italy), as previously described.17
Inflammatory Markers and Cytokines. Serumhigh-sensitivity C-reactive protein (hs-CRP), adiponec-tin, tumor necrosis factor-alpha, resistin, and leptinwere measured as described in the SupportingAppendix.Endothelial Dysfunction. Soluble adhesion mole-
cules E-selectin and intercellular adhesion molecule 1(ICAM-1), which are validated markers of endothelialdysfunction and subclinical atherosclerosis,18 weremeasured (see Supporting Appendix).Nitrosative Stress. Plasma nitrotyrosine (NT) was
chosen as a marker of nitrosative stress, which isinvolved in the pathogenesis of cardiovascular compli-cations in insulin-resistant conditions and liver injuryin NASH.19,20 Fasting plasma NT was determined bya commercial enzyme-linked immunosorbent assay kitproduct by HyCult Biotechnology b.v. (sold in Italyby Pantec, Turin, Italy).Oral Fat Load. In westernized countries, people
spend a substantial part of their life in the postprandialphase and postprandial lipemia is an emerging CVDrisk factor.21 Within 2 weeks of completion of the ali-mentary record, participants underwent a 10-hour oral
fat tolerance test, as previously described17 (see Sup-porting Appendix). Blood samples were drawn and im-mediately stored at �20�C every 2 hours for 10 hours.The following parameters were measured: (1) plasmatotal cholesterol, Tg, HDL-C, apolipoprotein A1(ApoA1), and FFAs were measured by automated en-zymatic methods; (2) Tg-rich lipoproteins (TRLPs)were isolated through preparative ultracentrifugationand subfractionated (see supporting Appendix); and(3) circulating oxidized low-density lipoproteins(oxLDLs), adipokines (e.g., resistin and adiponectin),and cytokeratin-18 (CK-18) fragments (a marker ofhepatocyte apoptosis and hepatic necroinflammation inNASH3) were also measured (see SupportingAppendix).OGTT-Derived Indices of Glucose Homeostasis. After
completion of the alimentary record, participantsunderwent a standard 75-g OGTT: Circulating glu-cose, insulin, and C-peptide were measured every 30minutes and analyzed through the minimal modelmethod to yield parameters of glucose homeostasis (seeSupporting Appendix). Insulin sensitivity was esti-mated from a model of glucose clearance, which pro-vides oral glucose insulin sensitivity (OGIS), an indexof whole body insulin sensitivity, and muscle and he-patic insulin resistance (IR) index were calculated fromthe OGTT, as previously validated against a clamp innondiabetic subjects.22,23 The following indices of b-cell function were also calculated: the CP-genic index(CGI) and the integrated index of b-cell function ad-aptation index (AI), which relates b-cell insulin secre-tion to insulin sensitivity and represents an integratedparameter of b-cell function. The OGTT-derived AIwas previously validated against the frequently sampledintravenous (IV) glucose tolerance test minimal modelin NAFLD24 and nondiabetic subjects.25,26 The incre-tin effect (i.e., the effectiveness of ingested glucose instimulating b-cell insulin secretion, compared to IVglucose) was also calculated, as described in the Sup-porting Appendix.Statistical Analysis. Data are expressed as mean 6
standard error of the mean (SEM). Differences acrossgroups were analyzed by analysis of variance (ANOVA)and then by Bonferroni’s correction, when variableswere normally distributed; otherwise, Kruskal-Wallis’test, followed by Dunn’s post-hoc test, was used tocompare nonparametric variables. Normality was eval-uated by Shapiro-Wilk’s test. Fisher’s exact test or thechi-square test were used to compare categorical varia-bles, as appropriate.Area under the curve (AUC) and incremental AUC
(iAUC) of parameters measured during the oral fat
HEPATOLOGY, Vol. 56, No. 3, 2012 MUSSO ET AL. 935
test and the OGTT were computed by the trapezoidmethod. Multivariate repeated-measures ANOVA wasused to test the interaction between time and groupduring the oral fat load test. When a significant inter-action was found between factors, differences acrossgroups were analyzed by ANOVA followed by Bonfer-roni’s correction, if variables were normally distributed;otherwise, Kruskal-Wallis’ test was performed, followedby Dunn’s post-hoc test, to compare nonparametricvariables. Differences were considered statistically sig-nificant at P < 0.05.
Analysis of dietary, anthropometric, and metabolicparameters and of genetic polymorphisms was madeusing Spearman’s correlation test. Genetic polymor-phisms were modeled as an additive effect, with quan-titative predictor variables reflecting the number ofrisk alleles (0, 1, or 2). When a relation was found onunivariate analysis, multiple regression analyses wereused to estimate the relationship between different var-iables after log transformation of skewed data.A logistic regression model was used to identify in-
dependent predictors for NASH and for advanced
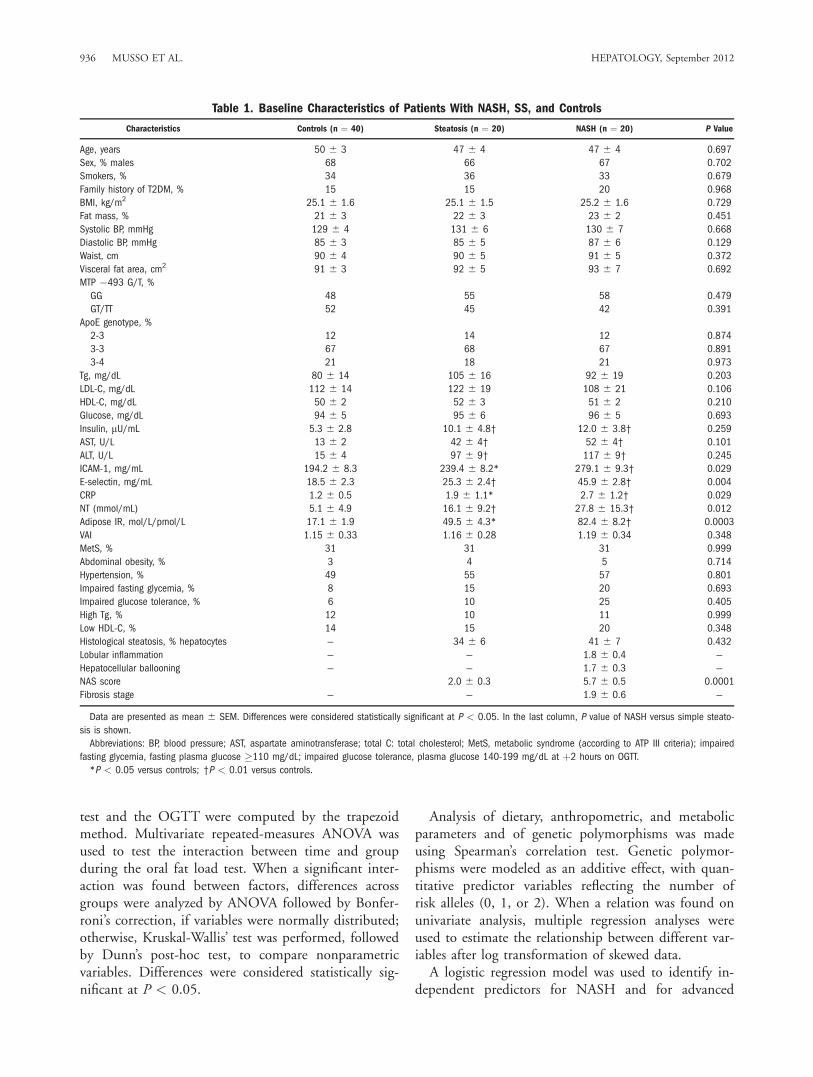
Table 1. Baseline Characteristics of Patients With NASH, SS, and Controls
Characteristics Controls (n ¼ 40) Steatosis (n ¼ 20) NASH (n ¼ 20) P Value
Age, years 50 6 3 47 6 4 47 6 4 0.697
Sex, % males 68 66 67 0.702
Smokers, % 34 36 33 0.679
Family history of T2DM, % 15 15 20 0.968
BMI, kg/m2 25.1 6 1.6 25.1 6 1.5 25.2 6 1.6 0.729
Fat mass, % 21 6 3 22 6 3 23 6 2 0.451
Systolic BP, mmHg 129 6 4 131 6 6 130 6 7 0.668
Diastolic BP, mmHg 85 6 3 85 6 5 87 6 6 0.129
Waist, cm 90 6 4 90 6 5 91 6 5 0.372
Visceral fat area, cm2 91 6 3 92 6 5 93 6 7 0.692
MTP �493 G/T, %
GG 48 55 58 0.479
GT/TT 52 45 42 0.391
ApoE genotype, %
2-3 12 14 12 0.874
3-3 67 68 67 0.891
3-4 21 18 21 0.973
Tg, mg/dL 80 6 14 105 6 16 92 6 19 0.203
LDL-C, mg/dL 112 6 14 122 6 19 108 6 21 0.106
HDL-C, mg/dL 50 6 2 52 6 3 51 6 2 0.210
Glucose, mg/dL 94 6 5 95 6 6 96 6 5 0.693
Insulin, lU/mL 5.3 6 2.8 10.1 6 4.8† 12.0 6 3.8† 0.259
AST, U/L 13 6 2 42 6 4† 52 6 4† 0.101
ALT, U/L 15 6 4 97 6 9† 117 6 9† 0.245
ICAM-1, mg/mL 194.2 6 8.3 239.4 6 8.2* 279.1 6 9.3† 0.029
E-selectin, mg/mL 18.5 6 2.3 25.3 6 2.4† 45.9 6 2.8† 0.004
CRP 1.2 6 0.5 1.9 6 1.1* 2.7 6 1.2† 0.029
NT (mmol/mL) 5.1 6 4.9 16.1 6 9.2† 27.8 6 15.3† 0.012
Adipose IR, mol/L/pmol/L 17.1 6 1.9 49.5 6 4.3* 82.4 6 8.2† 0.0003
VAI 1.15 6 0.33 1.16 6 0.28 1.19 6 0.34 0.348
MetS, % 31 31 31 0.999
Abdominal obesity, % 3 4 5 0.714
Hypertension, % 49 55 57 0.801
Impaired fasting glycemia, % 8 15 20 0.693
Impaired glucose tolerance, % 6 10 25 0.405
High Tg, % 12 10 11 0.999
Low HDL-C, % 14 15 20 0.348
Histological steatosis, % hepatocytes — 34 6 6 41 6 7 0.432
Lobular inflammation — — 1.8 6 0.4 —
Hepatocellular ballooning — — 1.7 6 0.3 —
NAS score 2.0 6 0.3 5.7 6 0.5 0.0001
Fibrosis stage — — 1.9 6 0.6 —
Data are presented as mean 6 SEM. Differences were considered statistically significant at P < 0.05. In the last column, P value of NASH versus simple steato-
sis is shown.
Abbreviations: BP, blood pressure; AST, aspartate aminotransferase; total C: total cholesterol; MetS, metabolic syndrome (according to ATP III criteria); impaired
fasting glycemia, fasting plasma glucose �110 mg/dL; impaired glucose tolerance, plasma glucose 140-199 mg/dL at þ2 hours on OGTT.
*P < 0.05 versus controls; †P < 0.01 versus controls.
936 MUSSO ET AL. HEPATOLOGY, September 2012
(i.e., stage 3) fibrosis. Based on univariate analysis, thecovariates were OGIS, homeostasis model assessment,C-reactive protein (CRP), endothelial adhesion mole-cules, fasting and postprandial adiponectin/resistin/CK-18/FFAs, adipose IR index, and VAI.Statistical analyses were done using STATISTICA
software (version 5.1; StatSoft Italia, Padua, Italy).
ResultsBaseline Characteristics. Compared to controls,
NAFLD patients had higher adipose IR index, plasmaendothelial adhesion molecules (e.g., E-selectin andICAM-1), CRP, and NT and lower adiponectin levels.Compared to patients with SS, NASH had higher adi-pose IR index, endothelial adhesion molecules, andNT, but did not differ in any other anthropometric ormetabolic parameter (Table 1). The percentage ofpatients with impaired glucose tolerance was higher inNASH than in SS, although the difference was notstatistically significant.Histological features of patients with NASH and SS
are described in the Supporting Appendix.Alimentary Record. There was no difference in
daily total energy and macro- or micronutrient(including type of fat) and antioxidant vitamin intakeamong controls, SS patients, and patients with NASH.Daily alcohol intake was also similar across groups: 11
6 4 versus 13 6 6 versus 15 6 6 g (P > 0.5 for allcomparisons).Oral Fat Load. ApoE and MTP �493 G/T geno-
type distribution did not differ between NASH, SS,and controls (Table 1).Despite similar fasting values across the three
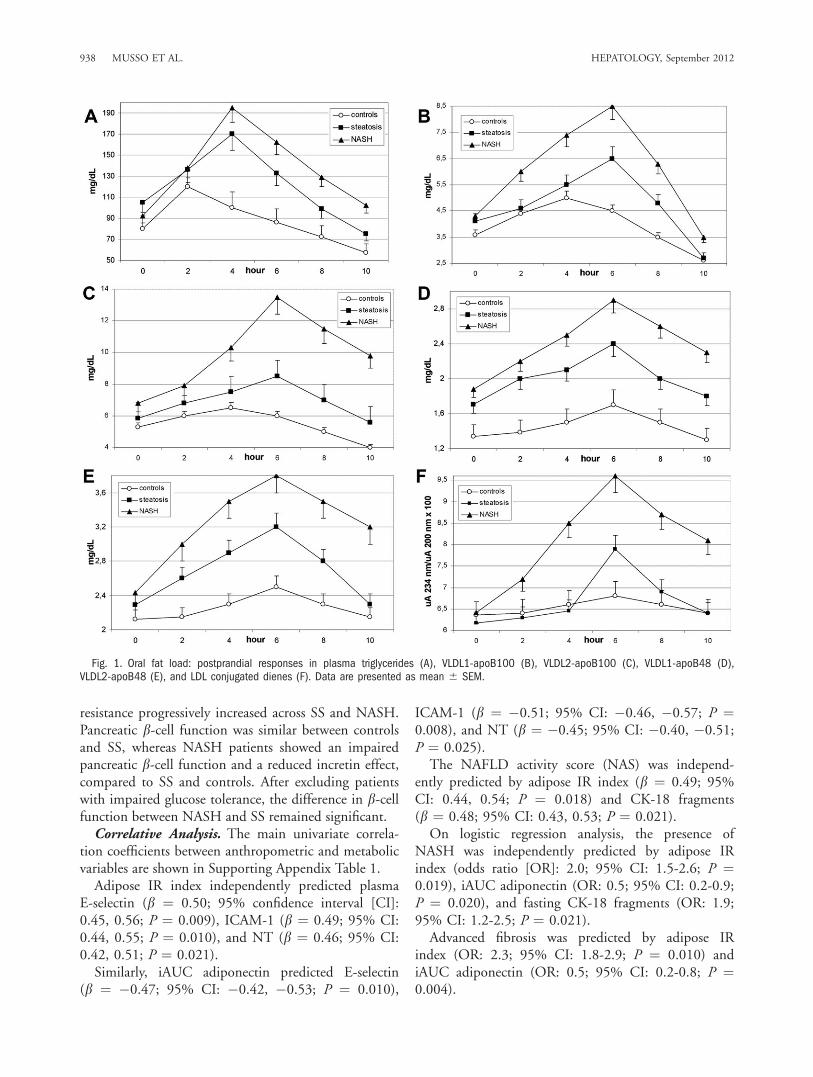
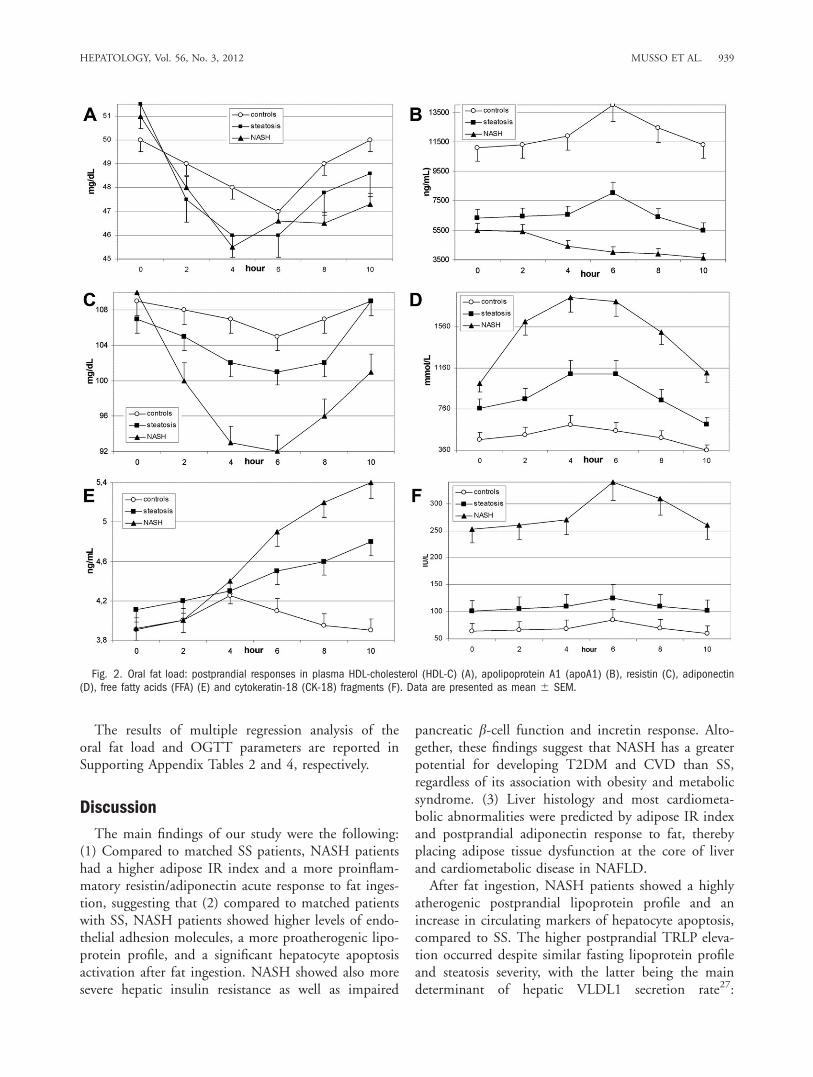
groups, postprandial Tg, very-low-density lipoprotein(VLDL)1 and VLDL2 of both intestinal and hepaticorigin, oxLDLs, and resistin responses progressivelyincreased across SS and NASH. HDL-C and ApoA1levels fell more consistently in NASH than in SS andwere deeper in SS than in controls. Plasma low-densitylipoprotein cholesterol (LDL-C) and insulin values didnot significantly change from baseline during the test(Table 2; Figs. 1 and 2).Adiponectin significantly increased in controls post-
prandially. Despite similar fasting levels in SS andNASH, adiponectin increased postprandially in SS,whereas it slowly decreased in NASH. Plasma CK-18levels increased postprandially in NASH, but not in SSand controls, indicating a significant apoptosis activa-tion after fat ingestion in the former (Table 2; Fig. 2).OGTT-Derived Parameters of Glucose Homeosta-
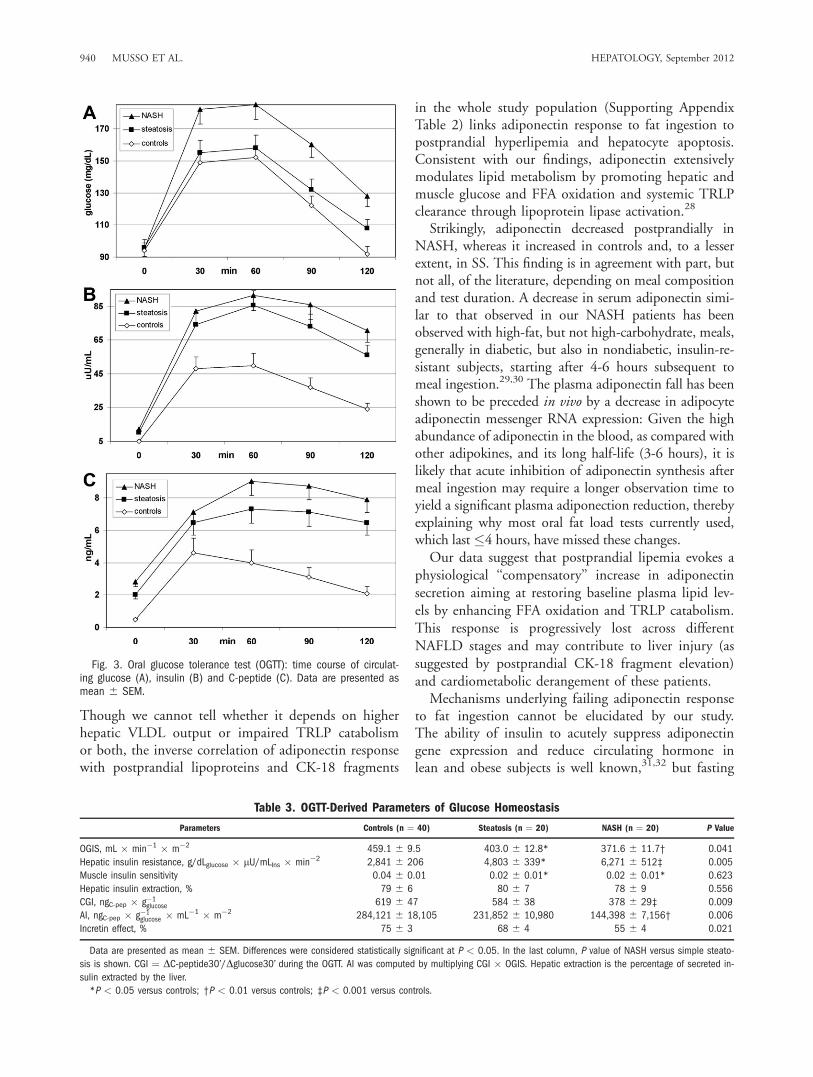
sis. Time course of circulating glucose, insulin, and C-peptide is shown in Fig. 3, and OGTT-derived param-eters of glucose homeostasis are reported in Table 3.OGIS progressively declined and hepatic insulin
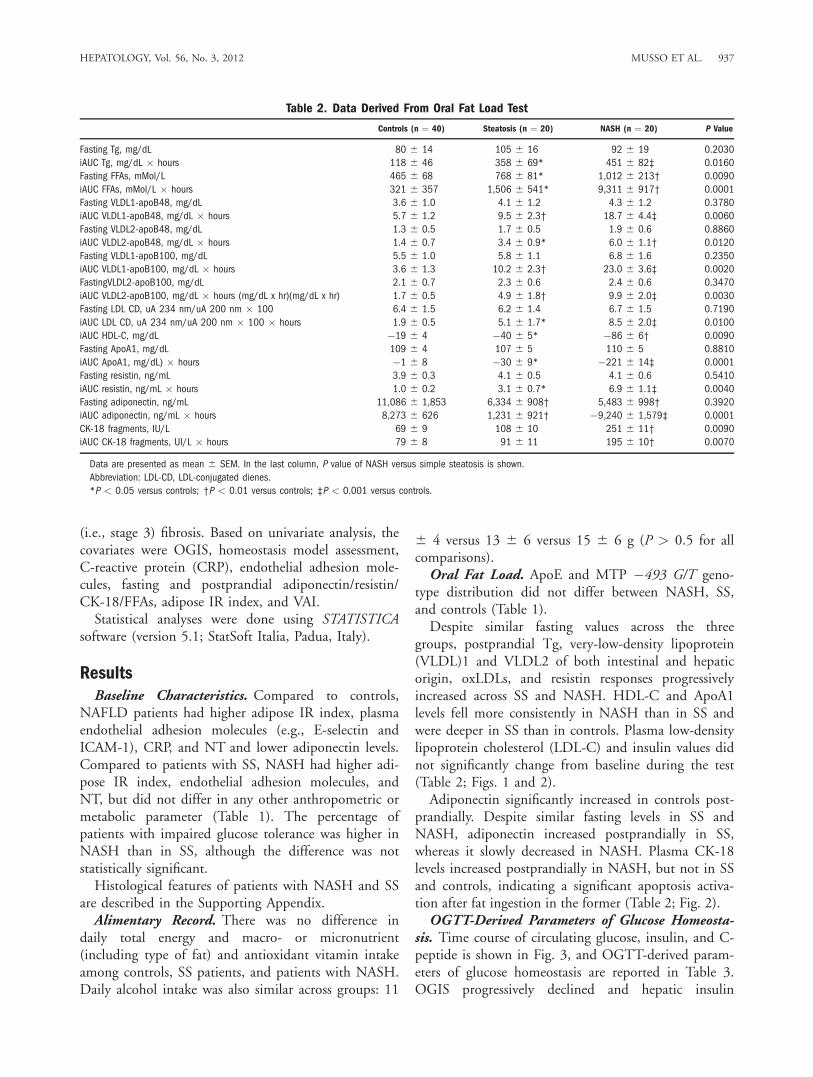
Table 2. Data Derived From Oral Fat Load Test
Controls (n ¼ 40) Steatosis (n ¼ 20) NASH (n ¼ 20) P Value
Fasting Tg, mg/dL 80 6 14 105 6 16 92 6 19 0.2030
iAUC Tg, mg/dL � hours 118 6 46 358 6 69* 451 6 82‡ 0.0160
Fasting FFAs, mMol/L 465 6 68 768 6 81* 1,012 6 213† 0.0090
iAUC FFAs, mMol/L � hours 321 6 357 1,506 6 541* 9,311 6 917† 0.0001
Fasting VLDL1-apoB48, mg/dL 3.6 6 1.0 4.1 6 1.2 4.3 6 1.2 0.3780
iAUC VLDL1-apoB48, mg/dL � hours 5.7 6 1.2 9.5 6 2.3† 18.7 6 4.4‡ 0.0060
Fasting VLDL2-apoB48, mg/dL 1.3 6 0.5 1.7 6 0.5 1.9 6 0.6 0.8860
iAUC VLDL2-apoB48, mg/dL � hours 1.4 6 0.7 3.4 6 0.9* 6.0 6 1.1† 0.0120
Fasting VLDL1-apoB100, mg/dL 5.5 6 1.0 5.8 6 1.1 6.8 6 1.6 0.2350
iAUC VLDL1-apoB100, mg/dL � hours 3.6 6 1.3 10.2 6 2.3† 23.0 6 3.6‡ 0.0020
FastingVLDL2-apoB100, mg/dL 2.1 6 0.7 2.3 6 0.6 2.4 6 0.6 0.3470
iAUC VLDL2-apoB100, mg/dL � hours (mg/dL x hr)(mg/dL x hr) 1.7 6 0.5 4.9 6 1.8† 9.9 6 2.0‡ 0.0030
Fasting LDL CD, uA 234 nm/uA 200 nm � 100 6.4 6 1.5 6.2 6 1.4 6.7 6 1.5 0.7190
iAUC LDL CD, uA 234 nm/uA 200 nm � 100 � hours 1.9 6 0.5 5.1 6 1.7* 8.5 6 2.0‡ 0.0100
iAUC HDL-C, mg/dL �19 6 4 �40 6 5* �86 6 6† 0.0090
Fasting ApoA1, mg/dL 109 6 4 107 6 5 110 6 5 0.8810
iAUC ApoA1, mg/dL) � hours �1 6 8 �30 6 9* �221 6 14‡ 0.0001
Fasting resistin, ng/mL 3.9 6 0.3 4.1 6 0.5 4.1 6 0.6 0.5410
iAUC resistin, ng/mL � hours 1.0 6 0.2 3.1 6 0.7* 6.9 6 1.1‡ 0.0040
Fasting adiponectin, ng/mL 11,086 6 1,853 6,334 6 908† 5,483 6 998† 0.3920
iAUC adiponectin, ng/mL � hours 8,273 6 626 1,231 6 921† �9,240 6 1,579‡ 0.0001
CK-18 fragments, IU/L 69 6 9 108 6 10 251 6 11† 0.0090
iAUC CK-18 fragments, UI/L � hours 79 6 8 91 6 11 195 6 10† 0.0070
Data are presented as mean 6 SEM. In the last column, P value of NASH versus simple steatosis is shown.
Abbreviation: LDL-CD, LDL-conjugated dienes.
*P < 0.05 versus controls; †P < 0.01 versus controls; ‡P < 0.001 versus controls.
HEPATOLOGY, Vol. 56, No. 3, 2012 MUSSO ET AL. 937
resistance progressively increased across SS and NASH.Pancreatic b-cell function was similar between controlsand SS, whereas NASH patients showed an impairedpancreatic b-cell function and a reduced incretin effect,compared to SS and controls. After excluding patientswith impaired glucose tolerance, the difference in b-cellfunction between NASH and SS remained significant.Correlative Analysis. The main univariate correla-
tion coefficients between anthropometric and metabolicvariables are shown in Supporting Appendix Table 1.Adipose IR index independently predicted plasma
E-selectin (b ¼ 0.50; 95% confidence interval [CI]:0.45, 0.56; P ¼ 0.009), ICAM-1 (b ¼ 0.49; 95% CI:0.44, 0.55; P ¼ 0.010), and NT (b ¼ 0.46; 95% CI:0.42, 0.51; P ¼ 0.021).Similarly, iAUC adiponectin predicted E-selectin
(b ¼ �0.47; 95% CI: �0.42, �0.53; P ¼ 0.010),
ICAM-1 (b ¼ �0.51; 95% CI: �0.46, �0.57; P ¼0.008), and NT (b ¼ �0.45; 95% CI: �0.40, �0.51;P ¼ 0.025).The NAFLD activity score (NAS) was independ-
ently predicted by adipose IR index (b ¼ 0.49; 95%CI: 0.44, 0.54; P ¼ 0.018) and CK-18 fragments(b ¼ 0.48; 95% CI: 0.43, 0.53; P ¼ 0.021).On logistic regression analysis, the presence of
NASH was independently predicted by adipose IRindex (odds ratio [OR]: 2.0; 95% CI: 1.5-2.6; P ¼0.019), iAUC adiponectin (OR: 0.5; 95% CI: 0.2-0.9;P ¼ 0.020), and fasting CK-18 fragments (OR: 1.9;95% CI: 1.2-2.5; P ¼ 0.021).Advanced fibrosis was predicted by adipose IR
index (OR: 2.3; 95% CI: 1.8-2.9; P ¼ 0.010) andiAUC adiponectin (OR: 0.5; 95% CI: 0.2-0.8; P ¼0.004).
Fig. 1. Oral fat load: postprandial responses in plasma triglycerides (A), VLDL1-apoB100 (B), VLDL2-apoB100 (C), VLDL1-apoB48 (D),VLDL2-apoB48 (E), and LDL conjugated dienes (F). Data are presented as mean 6 SEM.
938 MUSSO ET AL. HEPATOLOGY, September 2012
The results of multiple regression analysis of theoral fat load and OGTT parameters are reported inSupporting Appendix Tables 2 and 4, respectively.
Discussion
The main findings of our study were the following:(1) Compared to matched SS patients, NASH patientshad a higher adipose IR index and a more proinflam-matory resistin/adiponectin acute response to fat inges-tion, suggesting that (2) compared to matched patientswith SS, NASH patients showed higher levels of endo-thelial adhesion molecules, a more proatherogenic lipo-protein profile, and a significant hepatocyte apoptosisactivation after fat ingestion. NASH showed also moresevere hepatic insulin resistance as well as impaired
pancreatic b-cell function and incretin response. Alto-gether, these findings suggest that NASH has a greaterpotential for developing T2DM and CVD than SS,regardless of its association with obesity and metabolicsyndrome. (3) Liver histology and most cardiometa-bolic abnormalities were predicted by adipose IR indexand postprandial adiponectin response to fat, therebyplacing adipose tissue dysfunction at the core of liverand cardiometabolic disease in NAFLD.After fat ingestion, NASH patients showed a highly
atherogenic postprandial lipoprotein profile and anincrease in circulating markers of hepatocyte apoptosis,compared to SS. The higher postprandial TRLP eleva-tion occurred despite similar fasting lipoprotein profileand steatosis severity, with the latter being the maindeterminant of hepatic VLDL1 secretion rate27:
Fig. 2. Oral fat load: postprandial responses in plasma HDL-cholesterol (HDL-C) (A), apolipoprotein A1 (apoA1) (B), resistin (C), adiponectin(D), free fatty acids (FFA) (E) and cytokeratin-18 (CK-18) fragments (F). Data are presented as mean 6 SEM.
HEPATOLOGY, Vol. 56, No. 3, 2012 MUSSO ET AL. 939
Though we cannot tell whether it depends on higherhepatic VLDL output or impaired TRLP catabolismor both, the inverse correlation of adiponectin responsewith postprandial lipoproteins and CK-18 fragments
in the whole study population (Supporting AppendixTable 2) links adiponectin response to fat ingestion topostprandial hyperlipemia and hepatocyte apoptosis.Consistent with our findings, adiponectin extensivelymodulates lipid metabolism by promoting hepatic andmuscle glucose and FFA oxidation and systemic TRLPclearance through lipoprotein lipase activation.28
Strikingly, adiponectin decreased postprandially inNASH, whereas it increased in controls and, to a lesserextent, in SS. This finding is in agreement with part, butnot all, of the literature, depending on meal compositionand test duration. A decrease in serum adiponectin simi-lar to that observed in our NASH patients has beenobserved with high-fat, but not high-carbohydrate, meals,generally in diabetic, but also in nondiabetic, insulin-re-sistant subjects, starting after 4-6 hours subsequent tomeal ingestion.29,30 The plasma adiponectin fall has beenshown to be preceded in vivo by a decrease in adipocyteadiponectin messenger RNA expression: Given the highabundance of adiponectin in the blood, as compared withother adipokines, and its long half-life (3-6 hours), it islikely that acute inhibition of adiponectin synthesis aftermeal ingestion may require a longer observation time toyield a significant plasma adiponection reduction, therebyexplaining why most oral fat load tests currently used,which last �4 hours, have missed these changes.Our data suggest that postprandial lipemia evokes a
physiological ‘‘compensatory’’ increase in adiponectinsecretion aiming at restoring baseline plasma lipid lev-els by enhancing FFA oxidation and TRLP catabolism.This response is progressively lost across differentNAFLD stages and may contribute to liver injury (assuggested by postprandial CK-18 fragment elevation)and cardiometabolic derangement of these patients.Mechanisms underlying failing adiponectin response
to fat ingestion cannot be elucidated by our study.The ability of insulin to acutely suppress adiponectingene expression and reduce circulating hormone inlean and obese subjects is well known,31,32 but fasting
Fig. 3. Oral glucose tolerance test (OGTT): time course of circulat-ing glucose (A), insulin (B) and C-peptide (C). Data are presented asmean 6 SEM.
Table 3. OGTT-Derived Parameters of Glucose Homeostasis
Parameters Controls (n ¼ 40) Steatosis (n ¼ 20) NASH (n ¼ 20) P Value
OGIS, mL � min�1 � m�2 459.1 6 9.5 403.0 6 12.8* 371.6 6 11.7† 0.041
Hepatic insulin resistance, g/dLglucose � lU/mLIns � min�2 2,841 6 206 4,803 6 339* 6,271 6 512‡ 0.005
Muscle insulin sensitivity 0.04 6 0.01 0.02 6 0.01* 0.02 6 0.01* 0.623
Hepatic insulin extraction, % 79 6 6 80 6 7 78 6 9 0.556
CGI, ngC-pep � g�1glucose 619 6 47 584 6 38 378 6 29‡ 0.009
AI, ngC-pep � g�1glucose � mL�1 � m�2 284,121 6 18,105 231,852 6 10,980 144,398 6 7,156† 0.006
Incretin effect, % 75 6 3 68 6 4 55 6 4 0.021
Data are presented as mean 6 SEM. Differences were considered statistically significant at P < 0.05. In the last column, P value of NASH versus simple steato-
sis is shown. CGI ¼ DC-peptide30’/Dglucose30’ during the OGTT. AI was computed by multiplying CGI � OGIS. Hepatic extraction is the percentage of secreted in-
sulin extracted by the liver.
*P < 0.05 versus controls; †P < 0.01 versus controls; ‡P < 0.001 versus controls.
940 MUSSO ET AL. HEPATOLOGY, September 2012

insulinemia was similar between NASH and SS anddid not significantly change during the oral fat loadtest. The amount and type of dietary fat regulates adi-ponectin secretion without affecting insulin levels33 byacting on nuclear sterol regulatory element-bindingprotein 1c,34 but dietary fat intake of our NASH andSS patients were similar. We speculate that a stronggenetic background may underlie both the severe adi-pose tissue resistance to insulin antilipolytic action,leading to very high circulating FFA levels, and in themaladaptive response to fat ingestion, leading to analtered adiponectin/resistin response. Among novelcandidate genes conferring susceptibility to obesity andits complications, the transcription factor, activatorprotein 2 beta, has been recently shown to promoteadipocyte hypertrophy and IR and to down-regulateadiponectin expression postprandially, shifting adipo-kine expression toward a proinflammatory profile.35,36
Another potential culprit is that the endoplasmicreticulum (ER) resident thiol protein, ERp44, a keymediator of ER stress, has been shown to regulate post-translational modifications of adiponectin, reducing adi-pocyte content and secretion of this adipokine.37,38
NASH showed also more severely impaired hepaticinsulin action and pancreatic b-cell function than SS.The correlation of hepatic IR and b-cell function indi-ces with adipose IR index and postprandial adiponec-tin response (Table 4 and Supporting Appendix Table2) suggest the absence of the protective action of adi-ponectin on b-cells and the rise in lipotoxic FFAs maysynergistically impair hepatic insulin sensitivity andpancreatic b-cell function, further increasing the riskof T2DM, compared to SS.39,40
Lomonaco et al. have recently connected adipose IRindex to glucose metabolism, traditional cardiovascularrisk factors, and histological fibrosis in obese NAFLDpatients with metabolic syndrome.41 We expanded theconcept of adipose tissue dysfunction by showing thatinsulin-resistant and lipolytic adipocytes are also charac-terized by a maladaptive adipokine response to fat inges-tion, which may be central for liver injury and cardiome-tabolic complications of NASH.42 These two features ofdysfunctional adipocytes are detectable even in the ab-sence of adiposity excess, which may subsequently derivefrom these functional changes: In fact, besides their sys-temic actions, adiponectin and resistin act in an auto-crine and paracrine manner by enhancing FFA oxidationand adipocyte lipoprotein lipase activity,43 respectively:Therefore, the imbalance between these two adipokinesmay promote adipocyte enlargement and obesity.Our study has strengths and limitations: The strengths
are the careful selection of nonobese otherwise healthy bi-
opsy-proven NAFLD subjects and their thorough cardio-metabolic characterization; the limitations are the smallnumber of patients and the cross-sectional design, whichprevents any causal inference from the present study.Future research should elucidate molecular mecha-
nisms underlying adipocyte dysfunction and verify theappealing concept that a maladaptive adipocyteresponse to a chronic, daily, repetitive stress such as fatingestion links chronic overfeeding to obesity and itscomplications. In the meantime, emerging evidencesuggests that the restoration of adipocyte insulin sensi-tivity with thiazolinideniones and incretin analogs maysynergistically benefit liver disease and associated cardi-ometabolic abnormalities in NAFLD.44-45
Our data provide also a rationale for prospectivelyevaluating simple, fasting adipose tissue dysfunctionindices, such as adipose IR index, as a screening toolfor individuating NAFLD patients at increased overallhealth-related risk in larger independent cohorts ofunselected NAFLD patients.46,47
References1. Ratziu V, Bellentani S, Cortez-Pinto H, Day C, Marchesini G. A posi-
tion statement on NAFLD/NASH based on the EASL 2009 specialconference. J Hepatol 2010;53:372-384.
2. Musso G, Gambino R, Cassader M. Non-alcoholic fatty liver diseasefrom pathogenesis to management: an update. Obes Rev 2010;11:430-445.
3. Musso G, Gambino R, Cassader M, Pagano GF. Meta-analysis: natural his-tory of non-alcoholic fatty liver disease (NAFLD) and diagnostic accuracyof non-invasive tests for liver disease severity. Ann Med 2011;43:617-649.
4. van der Poorten D, Milner KL, Hui J. Visceral fat: a key mediator ofsteatohepatitis in metabolic liver disease. HEPATOLOGY 2008;48:449-457.
5. Gastaldelli A, Cusi K, Pettiti M. Relationship between hepatic/visceralfat and hepatic insulin resistance in nondiabetic and type 2 diabeticsubjects. Gastroenterology 2007;133:496-506.
6. Park BJ, Kim YJ, Kim DH. Visceral adipose tissue area is an independ-ent risk factor for hepatic steatosis. J Gastroenterol Hepatol 2008;23:900-907.
7. Harding AH, Day NE, Khaw KT, Bingham S, Luben R, Welsh A,Wareham NJ. Dietary fat and the risk of clinical type 2 diabetes: theEuropean prospective investigation of Cancer-Norfolk study. Am J Epi-demiol 2004;159:73-82.
Table 4. Multiple Regression Analysis: OGTT-DerivedParameters of Glucose Homeostasis IndependentlyPredicted by Adipose IR and iAUC Adiponectin in
Study Subjects (n 5 80)
Dependent variable b (95% CI) P Value
Adipose IR index
OGIS �0.45 (�0.35, �0.72) 0.025
Hepatic insulin resistance 0.45 (0.39, 0.53) 0.020
iAUC adiponectin
Hepatic insulin resistance �0.49 (0.42, 0.56) 0.012
CGI 0.45 (0.41, 0.50) 0.021
AI 0.46 (0.41, 0.51) 0.018
Incretin effect 0.47 (0.42, 0.53) 0.020
HEPATOLOGY, Vol. 56, No. 3, 2012 MUSSO ET AL. 941
8. Carmiel-Haggai M, Cederbaun, Nieto N. A high-fat diet leads to theprogression of non-alcoholic fatty liver disease in obese rats. FASEB J2005;19:136-138.
9. Amato MC, Giordano C, Galia M, Criscimanna A, Vitabile S, MidiriM; for the AlkaMeSy Study Group. Visceral adiposity index (VAI): areliable indicator of visceral fat function associated with cardiometa-bolic risk. Diabetes Care 2010;33:920-922.
10. Petta S, Amato M, Cabibi D, Camm�a C, Di Marco V, Giordano C.Visceral adiposity index is associated with histological findings and highviral load in patients with chronic hepatitis C due to genotype 1. HEPA-
TOLOGY 2010;52:1543-1552.11. Brunt EM. Nonalcoholic steatohepatitis: definition and pathology.
Semin Liver Dis 2001;21:3-16.12. Kleiner DE, Brunt EM, Van Natta M, Behling C, Contos MJ, Cum-
mings OW, et al. Design and validation of a histological scoring systemfor nonalcoholic fatty liver disease. HEPATOLOGY 2005;41:1313-1321.
13. Chang Y, Ryu S, Sung E, Jang Y. Higher concentrations of alanineaminotransferase within the reference interval predict non-alcoholicfatty liver disease. Clin Chem 2007;53:686-692.
14. Nunez C, Gallagher D, Visser M, Pi-Sunyer FX, Wang Z, Heynsfield SB.Bioimpedance analysis: evaluation of leg-to-leg system based on pressarecontact footpad electrodes. Med Sci Sports Exerc 1997;29:524-531.
15. Stanforth PR, Jackson AS, Green JS, Gagnon J, Rankinen T, DespresJ-P, Bouchard C. Generalized abdominal visceral fat prediction modelsfor black and white adults aged 17-65 y: the Heritage Family study. In-tern J Obes 2004;28:925-932.
16. Musso G, Gambino R, Cassader M. Recent insights into hepatic lipidmetabolism in non-alcoholic fatty liver disease (NAFLD). Prog LipidRes 2009;48:1-26.
17. Musso G, Gambino R, Pacini G, Pagano G, Durazzo M, Cassader M.Transcription factor 7-like 2 polymorphism modulates glucose and lipidhomeostasis, adipokine profile, and hepatocyte apoptosis in NASH. HE-
PATOLOGY 2009;49:426-435.18. Ridker PM, Hennekens CH, Roitman-Johnson B, Stampfer MJ, Allen
J. Plasma concentration of soluble intercellular adhesion molecule 1and risks of future myocardial infarction in apparently healthy men.Lancet 1998;351:88-92.
19. Pacher P, Szabo C. Role of peroxynitrite in the pathogenesis of cardiovascu-lar complications of diabetes. Curr Opin Pharmacol 2006;6:136-141.
20. Gambino R, Musso G, Cassader M. Redox balance in the pathogenesisof nonalcoholic fatty liver disease: mechanisms and therapeutic oppor-tunities. Antioxid Redox Signal 2011;15:1325-1365.
21. O’Keefe JH, Bell DS. Postprandial hyperglycemia/hyperlipidemia (post-prandial dysmetabolism) is a cardiovascular risk factor. Am J Cardiol2007;100:899-904.
22. Mari A, Pacini G, Murphy E, Ludvik B, Nolan JJ. A model-basedmethod for assessing insulin sensitivity from the oral glucose tolerancetest. Diabetes Care 2001;24:539-548.
23. Abdul-Ghani MA, Matsuda M, Balas B, DeFronzo RA. Muscle andliver insulin resistance indexes derived from the oral glucose tolerancetest. Diabetes Care 2007;30:89-94.
24. Musso G, Gambino R, Cassader M. Lipoprotein metabolism mediatesthe association of MTP polymorphism with beta-cell dysfunction inhealthy subjects and in nondiabetic normolipidemic patients with non-alcoholic steatohepatitis. J Nutr Biochem 2010;21:834-840.
25. Cobelli C, Toffolo GM, Dalla Man C. Assessment of beta-cell functionin humans, simultaneously with insulin sensitivity and hepatic extrac-tion, from intravenous and oral glucose tests. Am J Physiol EndocrinolMetab 2007;293:E1-E15.
26. Tura A, Kautzky-Willer A, Pacini G. Insulinogenic indices from insulinand C-peptide: comparison of beta-cell function from OGTT andIVGTT. Diabetes Res Clin Pract 2006;72:298-301.
27. Adiels M, Taskinen MR, Packard C, Caslake MJ, Soro-Paavonen A,Westerbacka J, et al. Overproduction of large VLDL particles is drivenby increased liver fat content in man. Diabetologia 2006;49:755-765.
28. Ng TW, Watts GF, Farvid MS, Chan DC, Barrett PH. Adipocytokinesand VLDL metabolism: independent regulatory effects of adiponectin,
insulin resistance, and fat compartments on VLDL apolipoprotein B-100 kinetics? Diabetes 2005;54:795-802.
29. Esposito K, Nappo F, Giugliano F, Di Palo C, Ciotola M, Barbieri M,et al. Meal modulation of circulating interleukin 18 and adiponectinconcentrations in healthy subjects and in patients with type 2 diabetesmellitus. Am J Clin Nutr 2003;78:1135-1140.
30. Annuzzi G, Bozzetto L, Patti L, Santangelo C, Giacco R, Di Marino L,et al. Type 2 diabetes mellitus is characterized by reduced postprandialadiponectin response: a possible link with diabetic postprandial dyslipi-demia. Metabolism 2010;59:567-574.
31. Halleux CM, Takahashi M, Del Porte ML, Detry R, Funahashi T,Matsuzawa Y, et al. Secretion of adiponectin and regulation of apM1gene expression in human visceral abdominal tissue. Biochem BiophysRes Commun 2001;288:1102-1107.
32. Brame LA, Considine RV, Yamauchi M, Baron AD, Mather KJ. Insulinand endothelin in the acute regulation of adiponectin in vivo inhumans. Obes Res 2005;13:582-588.
33. Mostad IL, Qvistad E, Bjerve KS, Grill VE. Effects of a 3-day low fatdiet on metabolic control, insulin sensitivity, lipids, and lipoproteinhormones in Norwegian subjects with hypertriacylglycerolemia andtype 2 diabetes. Scand J Clin Lab Invest 2004;64:656-574.
34. Seo JB, Moon HM, Noh MJ, Lee YS, Jeong HW, Yoo EJ, et al. Adipo-cyte determination- and differentiation-dependent factor 1/sterol regu-latory element-binding protein 1c regulates mouse adiponectinexpression. J Biol Chem 2004;279:22108-22117.
35. KondoM, Ugi S, Morino K, Fuke T, Obata T, Yoshizaki T, et al. Postpran-dial activation of protein kinase Cl regulates the expression of adipocyto-kines via the transcription factor AP-2b. Int J MolMed 2011;28:95-100.
36. Meng X, Kondo M, Morino K, Fuke T, Obata T, Yoshizaki T, et al.Transcription factor AP-2beta: a negative regulator of IRS-1 geneexpression. Biochem Biophys Res Commun 2010;392:526-532.
37. Long Q, Lei T, Feng B, Yin C, Jin D, Wu Y, et al. Peroxisome prolifer-ator-activated receptor-gamma increases adiponectin secretion via tran-scriptional repression of endoplasmic reticulum chaperone proteinERp44. Endocrinology 2010;151:3195-3203.
38. Mollica MP, Lionetti L, Putti R, Cavaliere G, Gaita M, Barletta A. Fromchronic overfeeding to hepatic injury: role of endoplasmic reticulumstress and inflammation. Nutr Metab Cardiovasc Dis 2011;21:222-230.
39. Fryirs MA, Barter PJ, Appavoo M. Effects of high-density lipoproteinson pancreatic beta-cell insulin secretion. Arterioscler Thromb Vasc Biol2010;30:1642-1648.
40. Giacca A, Xiao C, Oprescu AI, Carpentier AC, Lewis GF. Lipid-induced pancreatic b-cell dysfunction: focus on in vivo studies. Am JPhysiol Endocrinol Metab 2011;300:E255-E262.
41. Lomonaco R, Ortiz-Lopez C, Orsak B, Webb A, Hardies J, DarlandC, et al. Effect of adipose tissue insulin resistance on metabolic parame-ters and liver histology in obese patients with NAFLD. Hepatology2011 Dec 10. doi: 10.1002/hep.25539.
42. Arsov T, Carter CZ, Nolan CJ, Petrovsky N, Goodnow CC, Teoh NC.Adaptive failure to high-fat diet characterizes steatohepatitis in Alms1mutant mice. Biochem Biophys Res Comm 2006;342:1152-1159.
43. Kim SJ, Nian C, McIntosh CH. Resistin is a key mediator of glucose-de-pendent insulinotropic polypeptide (GIP) stimulation of lipoprotein lipase(LPL) activity in adipocytes. J Biol Chem 2007;282:34139-34147.
44. Gastaldelli A, Harrison SA, Belfort-Aguilar R, Hardies LJ, Balas B,Schenker S, Cusi K. Importance of changes in adipose tissue insulin resist-ance to histological response during thiazolidinedione treatment of patientswith nonalcoholic steatohepatitis. HEPATOLOGY 2009;50:1087-1093.
45. Bandsma RH, Lewis GF. Newly appreciated therapeutic effect of GLP-1 receptor agonists: reduction in postprandial lipemia. Atherosclerosis2010;212:40-41.
46. Musso G, Gambino R, Cassader M. Need for a three-focused approachto nonalcoholic fatty liver disease. HEPATOLOGY 2011;53:1773.
47. Musso G, Cassader M, Gambino R. Diagnostic accuracy of adipose in-sulin resistance index and visceral adiposity index for liver histologyand cardiovascular risk in NAFLD. HEPATOLOGY 2012. DOI: 10.1002/hep.25677.
942 MUSSO ET AL. HEPATOLOGY, September 2012
Related Documents