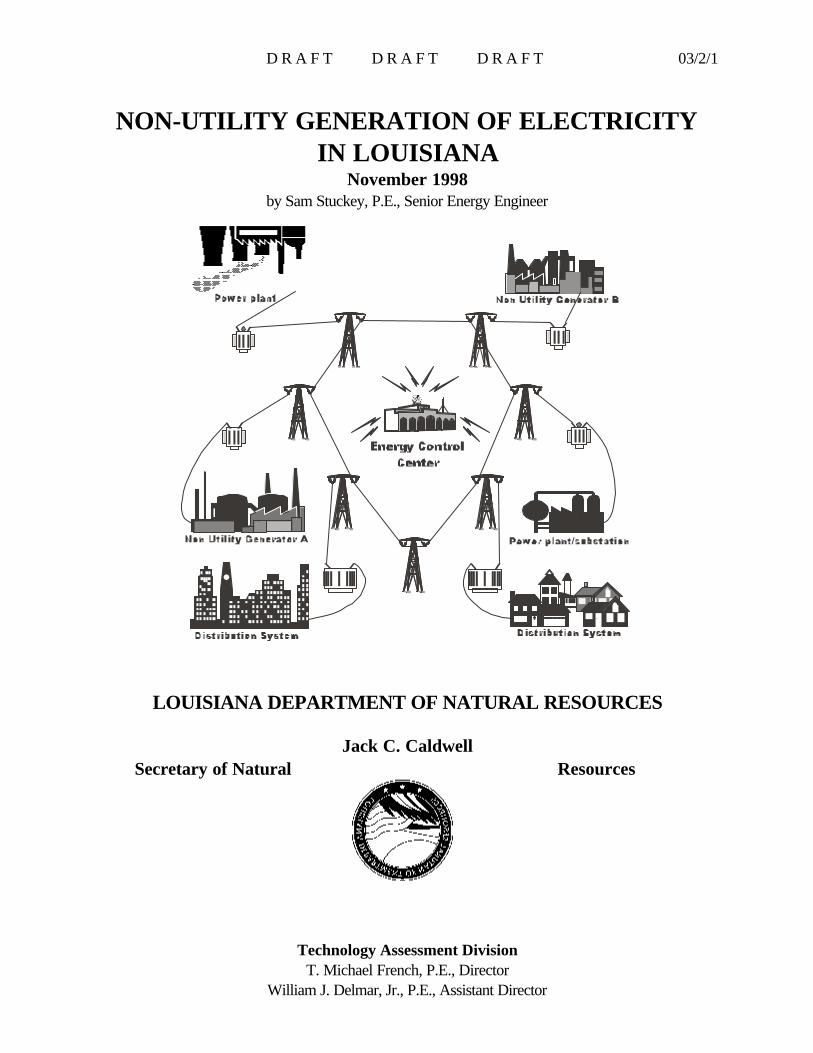
D R A F T D R A F T D R A F T 03/2/1 NON-UTILITY GENERATION OF ELECTRICITY IN LOUISIANA November 1998 by Sam Stuckey, P.E., Senior Energy Engineer LOUISIANA DEPARTMENT OF NATURAL RESOURCES Jack C. Caldwell Secretary of Natural Resources Technology Assessment Division T. Michael French, P.E., Director William J. Delmar, Jr., P.E., Assistant Director

Welcome message from author
This document is posted to help you gain knowledge. Please leave a comment to let me know what you think about it! Share it to your friends and learn new things together.
Transcript
D R A F T D R A F T D R A F T 03/2/1
NON-UTILITY GENERATION OF ELECTRICITYIN LOUISIANA
November 1998by Sam Stuckey, P.E., Senior Energy Engineer
LOUISIANA DEPARTMENT OF NATURAL RESOURCES
Jack C. CaldwellSecretary of Natural Resources
Technology Assessment DivisionT. Michael French, P.E., Director
William J. Delmar, Jr., P.E., Assistant Director
D R A F T D R A F T D R A F T 03/2/1
ii
This public document was published at a total cost of $_____.__. ___ copies of this publicdocument were published in this first printing at a total cost of $_____.__. The total cost of allprintings of this document, including reprints, is $_____.__. This document was published by theDepartment of Natural Resources, P.O. Box 94396, Baton Rouge, LA, 70804-9396, topromulgate the State Energy Conservation Plan developed under authority of P.L. 94-163. Thismaterial was printed in accordance with the standards for printing by State agencies establishedpursuant to R.S. 43:31.
Baton Rouge, Louisiana
The previous report of this series was dated November 30, 1996
This edition of Non-Utility Generation of Electricity in Louisiana is funded 100% ($____.__) withPetroleum Violation Escrow funds as part of the State Energy Conservation Program as approved by theU.S. Department of Energy and Louisiana Department of Natural Resources.

D R A F T D R A F T D R A F T 03/2/1
iii
D R A F T D R A F T D R A F T 03/2/1
iv
TABLE OF CONTENTS
INTRODUCTION . . . . . . . . . . . . . . . . . . . . . . . . . . . . . . . . . . . . . . . . . . . . . . . . . . . . . . . . . . . 1Non Utility Generation in Louisiana - Past and Present . . . . . . . . . . . . . . . . . . . . . . . . . . . . . . . 1Non Utility Generation in Louisiana - The Future . . . . . . . . . . . . . . . . . . . . . . . . . . . . . . . . . . . 2Summary . . . . . . . . . . . . . . . . . . . . . . . . . . . . . . . . . . . . . . . . . . . . . . . . . . . . . . . . . . . . . . . . 2
SECTION I - NON UTILITY GENERATION IN LOUISIANA BEFORE 1997 . . . . . . . . . 4
PART A - NON UTILITY GENERATION THROUGH THE ENDOF THE 1970s . . . . . . . . . . . . . . . . . . . . . . . . . . . . . . . . . . . . . . . . . . . . . . . . . . . . . . . . . . . 4
PART B - NON UTILITY GENERATION FROM PURPA (1978) TO THE PRESENT . . . . . . . . . . . . . . . . . . . . . . . . . . . . . . . . . . . . . . . . . . . . . . . . . . . . . . . 5Problem - A Single Buyer (Monopsony) of NUG Electricity . . . . . . . . . . . . . . . . . . . . . . . . . . . 5Problem - No NUG Access to Transmission . . . . . . . . . . . . . . . . . . . . . . . . . . . . . . . . . . . . . . 5Problem - Low Prices Paid for NUG Electricity in Louisiana . . . . . . . . . . . . . . . . . . . . . . . . . . 6Problem - Difficulties of Standalone NUG Operations . . . . . . . . . . . . . . . . . . . . . . . . . . . . . . . 6
PART C - LOUISIANA ELECTRICITY UTILITY DATA . . . . . . . . . . . . . . . . . . . . . . . . 7Generation of Electricity by Louisiana Electric Utilities . . . . . . . . . . . . . . . . . . . . . . . . . . . . . . . 7Electricity Sales to Ultimate Customers in Louisiana . . . . . . . . . . . . . . . . . . . . . . . . . . . . . . . . 11Sensitivity of Electricity Sales to Electricity Price Changes -
Residential and Commercial Sectors . . . . . . . . . . . . . . . . . . . . . . . . . . . . . . . . . . . . . . . . 14Sensitivity of Electricity Sales to Electricity Price Changes -
Industrial Sector . . . . . . . . . . . . . . . . . . . . . . . . . . . . . . . . . . . . . . . . . . . . . . . . . . . . . . . 14
PART D - LOUISIANA NON UTILITY GENERATOR DATA . . . . . . . . . . . . . . . . . . 17Generator Capacity, Type, and Estimated Generation by
Louisiana NUGs . . . . . . . . . . . . . . . . . . . . . . . . . . . . . . . . . . . . . . . . . . . . . . . . . . . . . . 17Sales of Electricity by Louisiana NUGs to Louisiana Electric Utilities . . . . . . . . . . . . . . . . . . . 25
PART E - A COMPARISON OF ELECTRIC UTILITY AND NUGGENERATING DATA . . . . . . . . . . . . . . . . . . . . . . . . . . . . . . . . . . . . . . . . . . . . . . . . . . . 45Louisiana Electric Utility and NUG Generation Capacity and Electric
Generation . . . . . . . . . . . . . . . . . . . . . . . . . . . . . . . . . . . . . . . . . . . . . . . . . . . . . . . . . . . 45Sales, Transfers, and Consumption of Electricity in Louisiana by
Electric Utilities and Industrial NUGs . . . . . . . . . . . . . . . . . . . . . . . . . . . . . . . . . . . . . . . 45
SECTION II - NON UTILITY GENERATION IN LOUISIANA IN THEFUTURE - REALITIES AND POSSIBILITIES . . . . . . . . . . . . . . . . . . . . . . . . . . . . . . . 48Regulatory Basis for the Introduction of Competition in Electricity Markets . . . . . . . . . . . . . . . 48
D R A F T D R A F T D R A F T 03/2/1
v
Operational Factors Affecting the Effectiveness and Onset Timing ofCompetition in Electricity Markets . . . . . . . . . . . . . . . . . . . . . . . . . . . . . . . . . . . . . . . . . 49
Potential Effects of the New Electricity Market on the Natural Gas Industry . . . . . . . . . . . . . . 49
TABLE OF CONTENTS (cont.)
APPENDIX A - BACKGROUND ON TECHNICAL AND ECONOMICISSUES AFFECTING BOTH THE PAST AND FUTURE OFLOUISIANA NON UTILITY GENERATION . . . . . . . . . . . . . . . . . . . . . . . . . . . . . . . A-1
PART 1 - “PRIME MOVERS,” THE EQUIPMENT DRIVING THEELECTRIC GENERATORS . . . . . . . . . . . . . . . . . . . . . . . . . . . . . . . . . . . . . . . . . . . . . A-1Steam Turbine Generating Systems . . . . . . . . . . . . . . . . . . . . . . . . . . . . . . . . . . . . . . . . . . . A-1Combustion Turbine Generating Systems . . . . . . . . . . . . . . . . . . . . . . . . . . . . . . . . . . . . . . . A-2
PART 2 - COGENERATION . . . . . . . . . . . . . . . . . . . . . . . . . . . . . . . . . . . . . . . . . . . . . A-4
PART 3 - THE CURRENT SYSTEM UNDER WHICH ELECTRIC UTILTIES OPERATE . . . . . . . . . . . . . . . . . . . . . . . . . . . . . . . . . . . . . . . . . . . . . . . . . . . A-5The System in Effect for Regulating and Compensating Electric Utilities . . . . . . . . . . . . . . . . . A-5Effects of the Current Electric Utility Regulatory System on “Competitive”
Electricity Rates . . . . . . . . . . . . . . . . . . . . . . . . . . . . . . . . . . . . . . . . . . . . . . . . . . . . . . A-6
PART 4 - DIVERGENT PATHWAYS BETWEEN ELECTRICITYGENERATORS IN REGULATED VS. COMPETITIVE ENVIRONMENTS . . . . . A-8
APPENDIX B - TABLES: PURPA QUALIFIED FACILITY POWERPURCHASES BY UTILITIES - MONTHLY BY UTILITY AND QF . . . . . . . . . . . . . B-1
CENTRAL LOUISIANA ELECTRIC COMPANY . . . . . . . . . . . . . . . . . . . . . . . . . . . . . B-3ENTERGY GULF STATES, INC. (LOUISIANA QF SUPPLIERS) . . . . . . . . . . . . . . . . . B-4ENTERGY GULF STATES, INC. (TEXAS QF SUPPLIERS) . . . . . . . . . . . . . . . . . . . . . B-14ENTERGY LOUISIANA, INC. . . . . . . . . . . . . . . . . . . . . . . . . . . . . . . . . . . . . . . . . . . . . B-23ENTERGY NEW ORLEANS, INC. . . . . . . . . . . . . . . . . . . . . . . . . . . . . . . . . . . . . . . . . . B-30SOUTHWESTERN ELECTRIC POWER COMPANY . . . . . . . . . . . . . . . . . . . . . . . . . . B-31
APPENDIX C - BIBLIOGRAPHY . . . . . . . . . . . . . . . . . . . . . . . . . . . . . . . . . . . . . . . . . . . . C-1
D R A F T D R A F T D R A F T 03/2/1
vi
LIST OF FIGURES
FIGURE PAGE
1 Comparison of Capacity Use Levels for Different Prime Movers . . . . . . . . . . . . . . . . . . . . . . 10
2 QF Electricity Purchases by Louisiana Electric Utilities - Yearly Data byUtility - Average Price Paid . . . . . . . . . . . . . . . . . . . . . . . . . . . . . . . . . . . . . . . . . . . . . . . . . . 28
3 QF Electricity Purchases by Louisiana Electric Utilities - YearlyQuantity of Power Purchased by QF Groupings . . . . . . . . . . . . . . . . . . . . . . . . . . . . . . . . . . . 29
4 QF Electricity Purchases by Louisiana Electric Utilities - YearlyCost of Power Purchased by QF Groupings . . . . . . . . . . . . . . . . . . . . . . . . . . . . . . . . . . . . . 30
5 QF Electricity Purchases by Louisiana Electric Utilities - YearlyAverage Price Paid by QF Groupings . . . . . . . . . . . . . . . . . . . . . . . . . . . . . . . . . . . . . . . . . . 31
6 Entergy Gulf States, Inc., Average Yearly Price Paid Louisiana QF Suppliers . . . . . . . . . . . . . 35
7 Entergy Gulf States, Inc., Average Yearly Price Paid Texas QF Suppliers . . . . . . . . . . . . . . . 38
8 Entergy Louisiana, Inc., Average Yearly Price Paid QF Suppliers . . . . . . . . . . . . . . . . . . . . . . 40
9 Entergy New Orleans, Inc., Average Yearly Price Paid QF Suppliers . . . . . . . . . . . . . . . . . . . 42
10 Southwestern Electric Power Company - Average Yearly Price Paid QF Suppliers . . . . . . . . 44
D R A F T D R A F T D R A F T 03/2/1
vii
LIST OF TABLESTABLE PAGE
1 Electric Utility Generator Capacity and Electricity Generation inLouisiana by Prime Mover - 1995 . . . . . . . . . . . . . . . . . . . . . . . . . . . . . . . . . . . . . . . . . . . . . . 8
2 Electric Utility Generator Capacity and Electricity Generation inLouisiana by Prime Mover - 1996 . . . . . . . . . . . . . . . . . . . . . . . . . . . . . . . . . . . . . . . . . . . . . . 9
3 Electric Utility Sales of Electricity in Louisiana - 1995 by Consumer Sector . . . . . . . . . . . . . . 12
4 Electric Utility Sales of Electricity in Louisiana - 1996 by Consumer Sector . . . . . . . . . . . . . . 13
5 EEI Generation Data for Louisiana NUGs - 1995Data Grouped by Prime Mover . . . . . . . . . . . . . . . . . . . . . . . . . . . . . . . . . . . . . . . . . . . . . . . 18
6 EEI Generation Data for Louisiana NUGs - 1996Data Grouped by Prime Mover . . . . . . . . . . . . . . . . . . . . . . . . . . . . . . . . . . . . . . . . . . . . . . . 20
7 EEI Generation Data for Louisiana NUGs - 1996Data Arranged by Business/Industry Category . . . . . . . . . . . . . . . . . . . . . . . . . . . . . . . . . . . 22
8 Purchases of Electricity from QFs - All Louisiana Utilities . . . . . . . . . . . . . . . . . . . . . . . . . . . . 27
9 Central Louisiana Electric Company - Yearly Summary - All QF Suppliers . . . . . . . . . . . . . . . 32
10 Entergy Gulf States, Inc., Yearly Summary of all Louisiana QF Suppliers . . . . . . . . . . . . . . . . 33
11 Entergy Gulf States, Inc., Yearly Summary of All Texas QF Suppliers . . . . . . . . . . . . . . . . . . 36
12 Entergy Louisiana, Inc., Yearly Summary of All QF Suppliers . . . . . . . . . . . . . . . . . . . . . . . . 39
13 Entergy New Orleans, Inc., Yearly Summary of All QF Suppliers . . . . . . . . . . . . . . . . . . . . . 41
14 Southwestern Electric Power Company - Yearly Summary ofAll Texas QF Suppliers . . . . . . . . . . . . . . . . . . . . . . . . . . . . . . . . . . . . . . . . . . . . . . . . . . . . . 43
15 Comparison of Electric Utility and Non Utility Generation for the Year 1996 . . . . . . . . . . . . . 46
16 Comparison of Electric Utility and Non Utility Generation and Sales Datafor the Year 1996 . . . . . . . . . . . . . . . . . . . . . . . . . . . . . . . . . . . . . . . . . . . . . . . . . . . . . . . . . 47

D R A F T D R A F T D R A F T 03/2/1
viii

D R A F T D R A F T D R A F T 03/2/1
ix
LIST OF TABLES (cont.)
TABLE PAGE
B.1 Central Louisiana Electric Company (CLECO)Single Supplier - Jeanerette Sugar Mill . . . . . . . . . . . . . . . . . . . . . . . . . . . . . . . . . . . . . . B-3
B.2 Entergy Gulf States, Inc., Louisiana SuppliersTotal - All EGSI Louisiana QF Suppliers . . . . . . . . . . . . . . . . . . . . . . . . . . . . . . . . . . . . B-4
B.3 Entergy Gulf States, Inc., Louisiana SuppliersAgrielectric . . . . . . . . . . . . . . . . . . . . . . . . . . . . . . . . . . . . . . . . . . . . . . . . . . . . . . . . . . B-5
B.4 Entergy Gulf States, Inc., Louisiana SuppliersBASF Corp. (Wyandotte) . . . . . . . . . . . . . . . . . . . . . . . . . . . . . . . . . . . . . . . . . . . . . . . . B-6
B.5 Entergy Gulf States, Inc., Louisiana SuppliersBorden Chemicals (Monochem before 1992) . . . . . . . . . . . . . . . . . . . . . . . . . . . . . . . . . B-7
B.6 Entergy Gulf States, Inc., Louisiana SuppliersDow Chemical . . . . . . . . . . . . . . . . . . . . . . . . . . . . . . . . . . . . . . . . . . . . . . . . . . . . . . . . B-8
B.7 Entergy Gulf States, Inc., Louisiana SuppliersExxon Chemical . . . . . . . . . . . . . . . . . . . . . . . . . . . . . . . . . . . . . . . . . . . . . . . . . . . . . . . B-9
B.8 Entergy Gulf States, Inc., Louisiana SuppliersFormosa Plastics . . . . . . . . . . . . . . . . . . . . . . . . . . . . . . . . . . . . . . . . . . . . . . . . . . . . . B-10
B.9 Entergy Gulf States, Inc., Louisiana SuppliersCrown Paper (was James River Corp. until Oct. 1996) . . . . . . . . . . . . . . . . . . . . . . . . . B-11
B.10 Entergy Gulf States, Inc., Louisiana SuppliersNelson Industrial Steam Co. . . . . . . . . . . . . . . . . . . . . . . . . . . . . . . . . . . . . . . . . . . . . B-12
B.11 Entergy Gulf States, Inc., Louisiana SuppliersVulcan Chemical Co. . . . . . . . . . . . . . . . . . . . . . . . . . . . . . . . . . . . . . . . . . . . . . . . . . . B-13
B.12 Entergy Gulf States, Inc., Texas SuppliersTotal - All EGSI Texas QF Suppliers . . . . . . . . . . . . . . . . . . . . . . . . . . . . . . . . . . . . . . B-14
B.13 Entergy Gulf States, Inc., Texas SuppliersAir Liquide . . . . . . . . . . . . . . . . . . . . . . . . . . . . . . . . . . . . . . . . . . . . . . . . . . . . . . . . . . B-15

D R A F T D R A F T D R A F T 03/2/1
x
B.14 Entergy Gulf States, Inc., Texas SuppliersClark Refining . . . . . . . . . . . . . . . . . . . . . . . . . . . . . . . . . . . . . . . . . . . . . . . . . . . . . . . B-16
D R A F T D R A F T D R A F T 03/2/1
xi
LIST OF TABLES (cont.)
TABLE PAGE
B.15 Entergy Gulf States, Inc., Texas SuppliersCogen Power, L.P. (Destec) . . . . . . . . . . . . . . . . . . . . . . . . . . . . . . . . . . . . . . . . . . . . B-17
B.16 Entergy Gulf States, Inc., Texas SuppliersE. I. Dupont . . . . . . . . . . . . . . . . . . . . . . . . . . . . . . . . . . . . . . . . . . . . . . . . . . . . . . . . . B-18
B.17 Entergy Gulf States, Inc., Texas SuppliersFina Oil and Chemical . . . . . . . . . . . . . . . . . . . . . . . . . . . . . . . . . . . . . . . . . . . . . . . . . B-19
B.18 Entergy Gulf States, Inc., Texas SuppliersHuntsman Corp. (was Texaco Chemical before 1993) . . . . . . . . . . . . . . . . . . . . . . . . . B-20
B.19 Entergy Gulf States, Inc., Texas SuppliersEngineered Carbons (was J. M. Huber 1987-1995) . . . . . . . . . . . . . . . . . . . . . . . . . . . B-21
B.20 Entergy Gulf States, Inc., Texas SuppliersStar Enterprises (was Texaco Refining before mid-1989) . . . . . . . . . . . . . . . . . . . . . . . B-22
B.21 Entergy Louisiana, Inc., Louisiana SuppliersTotals - All ELI QF Suppliers Except Murray Hydro . . . . . . . . . . . . . . . . . . . . . . . . . B-23
B.22 Entergy Louisiana, Inc., Louisiana SuppliersCalciner Industries, Inc. (was Kaiser before 1990) . . . . . . . . . . . . . . . . . . . . . . . . . . . . B-24
B.23 Entergy Louisiana, Inc., Louisiana SuppliersIMC - Agrico (was Freeport McMoran before 1993) . . . . . . . . . . . . . . . . . . . . . . . . . B-25
B.24 Entergy Louisiana, Inc., Louisiana SuppliersB. P. Oil . . . . . . . . . . . . . . . . . . . . . . . . . . . . . . . . . . . . . . . . . . . . . . . . . . . . . . . . . . B-26
B.25 Entergy Louisiana, Inc., Louisiana SuppliersGeorgia Gulf . . . . . . . . . . . . . . . . . . . . . . . . . . . . . . . . . . . . . . . . . . . . . . . . . . . . . . . . B-27
B.26 Entergy Louisiana, Inc., Louisiana SuppliersUnion Carbide . . . . . . . . . . . . . . . . . . . . . . . . . . . . . . . . . . . . . . . . . . . . . . . . . . . . . . . B-28
B.27 Entergy Louisiana, Inc., Louisiana SuppliersMurray Hydroelectric Power Plant . . . . . . . . . . . . . . . . . . . . . . . . . . . . . . . . . . . . . . . . B-29

D R A F T D R A F T D R A F T 03/2/1
xii
B.28 Entergy New Orleans, Inc.Air Products and Chemical, Inc. . . . . . . . . . . . . . . . . . . . . . . . . . . . . . . . . . . . . . . . . . . B-30
D R A F T D R A F T D R A F T 03/2/1
xiii
LIST OF TABLES (cont.)
TABLE PAGE
B.29 Southwestern Electric Power Company (SWEPCO), Texas QF SuppliersAll Texas QF Suppliers . . . . . . . . . . . . . . . . . . . . . . . . . . . . . . . . . . . . . . . . . . . . . . . . B-31
B.30 Southwestern Electric Power Company (SWEPCO), Texas QF SuppliersSnider Industries . . . . . . . . . . . . . . . . . . . . . . . . . . . . . . . . . . . . . . . . . . . . . . . . . . . . . B-32
B.31 Southwestern Electric Power Company (SWEPCO), Texas QF SuppliersDean Lumber . . . . . . . . . . . . . . . . . . . . . . . . . . . . . . . . . . . . . . . . . . . . . . . . . . . . . . . . B-33
D R A F T D R A F T D R A F T 03/2/1
1
INTRODUCTION
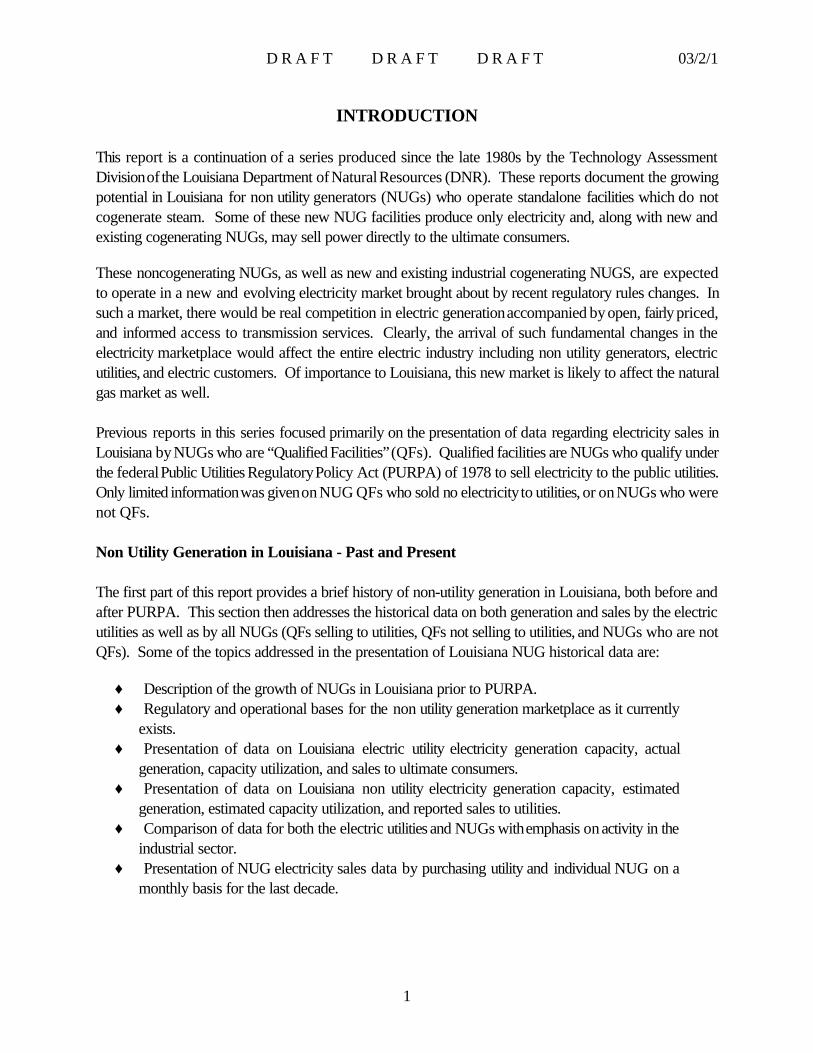
This report is a continuation of a series produced since the late 1980s by the Technology AssessmentDivision of the Louisiana Department of Natural Resources (DNR). These reports document the growingpotential in Louisiana for non utility generators (NUGs) who operate standalone facilities which do notcogenerate steam. Some of these new NUG facilities produce only electricity and, along with new andexisting cogenerating NUGs, may sell power directly to the ultimate consumers.
These noncogenerating NUGs, as well as new and existing industrial cogenerating NUGS, are expectedto operate in a new and evolving electricity market brought about by recent regulatory rules changes. Insuch a market, there would be real competition in electric generation accompanied by open, fairly priced,and informed access to transmission services. Clearly, the arrival of such fundamental changes in theelectricity marketplace would affect the entire electric industry including non utility generators, electricutilities, and electric customers. Of importance to Louisiana, this new market is likely to affect the naturalgas market as well.
Previous reports in this series focused primarily on the presentation of data regarding electricity sales inLouisiana by NUGs who are “Qualified Facilities” (QFs). Qualified facilities are NUGs who qualify underthe federal Public Utilities Regulatory Policy Act (PURPA) of 1978 to sell electricity to the public utilities.Only limited information was given on NUG QFs who sold no electricity to utilities, or on NUGs who werenot QFs.
Non Utility Generation in Louisiana - Past and Present
The first part of this report provides a brief history of non-utility generation in Louisiana, both before andafter PURPA. This section then addresses the historical data on both generation and sales by the electricutilities as well as by all NUGs (QFs selling to utilities, QFs not selling to utilities, and NUGs who are notQFs). Some of the topics addressed in the presentation of Louisiana NUG historical data are:
♦ Description of the growth of NUGs in Louisiana prior to PURPA.♦ Regulatory and operational bases for the non utility generation marketplace as it currently
exists.♦ Presentation of data on Louisiana electric utility electricity generation capacity, actual
generation, capacity utilization, and sales to ultimate consumers.♦ Presentation of data on Louisiana non utility electricity generation capacity, estimated
generation, estimated capacity utilization, and reported sales to utilities.♦ Comparison of data for both the electric utilities and NUGs with emphasis on activity in the
industrial sector.♦ Presentation of NUG electricity sales data by purchasing utility and individual NUG on a
monthly basis for the last decade.
D R A F T D R A F T D R A F T 03/2/1
2
Non Utility Generation in Louisiana - The Future
The next section of this report addresses new and evolving circumstances and issues regarding non-utilityproduction, delivery, and sale of electricity. As a consequence of the Energy Policy Act (EPACT) of 1992and the resulting Federal Energy Regulatory Commission (FERC) final Orders 888 and 889 (April 1996),a new competitive electricity market will evolve and will be different from anything observed in the past.The evolution of this new electricity market will significantly affect the electric utilities, the NUGs, and allelectricity consumers as well as all producers of natural gas (see page 49), both in Louisiana and nationally.
Regarding the new electricity marketplace, the following issues and concepts are presented and discussed:
♦ The factors and circumstances which created an environment in which non utilities couldsuccessfully compete with existing electric utilities.
♦ The regulatory basis for the introduction of competition.♦ The operational bases which, in a realistic sense, may affect both the effectiveness and the
onset timing of such competition.♦ Things difficult to predict about the future of competition in the electricity market.
Summary
In summary, the following can be said of non utility generation in Louisiana:
♦ Because the type of process plant historically locating in Louisiana typically required largeamounts of both electricity and process steam, these plants often chose to meet their ownenergy needs internally through cogeneration. The result has been that, for more than half ofthis century, non utility generation has provided a significant proportion of the electricitygenerated in this state. Of the 76,127 million KWH generated in Louisiana in 1996, nonutility generation accounted for 17,484 million KWH or approximately 23% of totalelectricity produced.
♦ In spite of the intent of the Public Utilities Regulatory Policies Act (PURPA) of 1978 topromote sales of cogenerated electricity by non utility generators, sales of non utilitygenerated power are minuscule in Louisiana compared to generation levels of either thestate’s electric utilities or the state’s non utility generators themselves. NUG 1996 sales ofelectricity generated in Louisiana were 378.2 million KWH. This figure represents 2.17%of estimated NUG generation in the state, 0.64% of electric utility generation in the state, andonly 0.5% of the total electricity generated in Louisiana for that year. Reasons for this lackof NUG sales lie in the PURPA limitation of sales only to the utility serving the NUG and inthe purchase price levels for NUG power required by both PURPA and existing Louisianaelectric utility regulations.
♦ Because of lack of competition, there are two separate systems of electric generation andpricing in Louisiana today. One system, operated by the NUGs, was developed in acompetitive market and produced electricity at an average unit cost of.4.3 cents per KWH
D R A F T D R A F T D R A F T 03/2/1
3
in 1996. The second system, operated by the electric utilities, was developed undergovernmental utility regulation and produced electricity at an average sales price of 6.1 centsper KWH in 1996. The difference in average electricity cost of about 2 cents per KWHmakes clear the capacity of NUGs to compete in any open market for electricity generation.
The federal Energy Policy Act (EPACT) of 1992 and resulting final Orders 888 and 889 by the FederalEnergy Regulatory Commission (FERC) intend the creation of a genuinely competitive market in electricgeneration as well as fair and open access by all generators to transmission. In the absence of absoluteregulatory protection under such competition, the electric utilities are faced with serious adverse financialeffects. They will be forced to abandon inefficient generating facilities. The term now used to describe sucheffects is “stranded cost.” As a result, at all governmental levels, there will undoubtedly be a great deal ofpolitical and regulatory conflict over both the degree of actual competition allowed as well as the timing ofits onset. The utilities will attempt to lock in current regulated prices as well as stretch out the effects ofNUG competition, both of which protect utility “stranded costs.”
The only certain outcome in this process is that the new market for electricity will affect electric utilities,NUGs, electric consumers, and other parties in ways not experienced in the past. Of particular importancein Louisiana is the likelihood that this new market could have substantial effects on the natural gas industryas well as the electric industry. All interested parties participating in the electricity market C the utilities,industrial, residential, and commercial electricity consumers, as well as generation fuel producers (e.g.,natural gas) C would be well served by continuing to update their data and information as this newunregulated electricity market evolves.

D R A F T D R A F T D R A F T 03/2/1
4
SECTION INON UTILITY GENERATION IN LOUISIANA BEFORE 1997
PART A - NON UTILITY GENERATION IN LOUISIANA THROUGH THE END OF THE1970s
In Louisiana, non utility generation (NUG) has operated on a scale which is significant when compared tototal generation levels of the electric utilities for much of this century. This is entirely different from nonutility generation structure in most other states. Process industrial operations in Louisiana were non utilitygenerators (NUGs), meeting their own energy needs through cogeneration (the joint production of bothelectricity and steam), for nearly 50 years prior to the passage of the federal Public Utilities RegulatoryPolicy Act (PURPA) in 1978.
There are two reasons for this early growth of cogeneration in Louisiana:
1. The operation of most production processes in plants typical of the state’s industrial structuresuch as refineries, chemical plants, and paper mills requires both electricity and steam in largequantities. And,
2. Joint production of electricity and steam is more energy efficient than the separate productionof electricity and steam.
A very large base of NUG generating capacity and electric power production grew during this pre-PURPAphase of non utility generation in Louisiana, almost all of which was cogeneration based.
Initially the electrical generation equipment used by the industrial NUGs in Louisiana was of the sametechnology as that used by the electric utilities. Generators were steam turbine driven with the neededsteam being created by steam generators (boilers). In Louisiana, these boilers were fired almost exclusivelyby natural gas. But, in the late 1960s that situation changed due to the introduction of more efficienttechnology. The industrial NUGs began installing generators driven by combustion turbines (literally jetengines) exhausting to waste heat recovery boilers. This system, known as combined cycle combustionturbine (normally shortened to combined cycle) had lower initial costs and used less fuel per unit ofelectricity generated (refer to Appendix A). Combined cycle technology was installed by the industrialNUGs not only to meet new electricity and steam load but also to replace existing, less efficient, steamturbine systems.
Prior to PURPA, all industrial self generated electricity was consumed in manufacturing activities onsite foreach NUG. There were no non utility generation sales of electricity either to the electric utilities or to thirdparties. Neither was there the possibility of an industrial company transmitting electricity outside its ownplantsite even to an adjacent plant due to laws limiting such activity to regulated utilities.
D R A F T D R A F T D R A F T 03/2/1
5
PART B - NON UTILITY GENERATOR OPERATION FROM PURPA (1978) TO THEPRESENT
The Public Utilities Regulatory Policies Act became law as part of a package of energy legislation enactedby the federal government in 1978. PURPA, as the law is known, along with companion legislationchanged the NUG electrical sales situation.
PURPA had as one major purpose, the conservation of energy. Cogeneration was a favored generationmethodology under this law because it is energy efficient. Unfortunately, neither PURPA nor its companionlegislation made any distinction between the efficiency of different generation processes or cogenerationprocesses producing the same split of electricity and steam (e.g., boiler/ steam turbine operation vs.combustion turbine operation; see Appendix A, “ Prime Movers”).
PURPA required the electric utilities to buy power from NUGs meeting certain criteria. NUGs meetingthose criteria were designated as “qualified facilities” (QFs). Cogeneration as a favored generationmethodology, then, became a major criterion for obtaining QF status. As a result, most Louisiana NUGsreceiving qualified facility (QF) status under the 1978 law were existing industrial cogenerators. New QFscoming on line after PURPA were also industrial cogenerators.
PURPA has opened the door to external sales by QF NUGs, but not completely. Louisiana’s large baseof cogenerating industrial NUGs continues to operate on substantially the same basis after PURPA asbefore, consuming most of the electricity they produce. Reasons for this include limitations on potentialconsumers of NUG electricity, a complete lack of NUG access to transmission, low prices available fromelectric utilities to NUGs in Louisiana, and difficulties in operating standalone (no associated steam host orconsumer) cogeneration facilities.
Problem - A Single Buyer (Monopsony) of NUG Electricity
First, under PURPA, sales of electricity are limited to one customer - the electric utility in whose servicearea the QF is located. Third party or ultimate consumer sales by NUGs are not possible under this law.
Problem - No NUG Access to Transmission
Even if third party sales could be made by NUGs, delivery of the electricity is not possible. First, there areregulatory difficulties. In Louisiana, were a NUG to deliver electricity to a third party - even across amutual fence line with that third party, that NUG would become a regulated utility under state law. Thislegal burden has not been acceptable to the NUGs since their primary product is not electricity. InLouisiana, this legal situation produces some unusualresults. Adjacent plants are allowed to move energyin the form of steam across their mutual fence to one another, but are not allowed to move energy in theform of electricity.
D R A F T D R A F T D R A F T 03/2/1
6
Further, transmission of electric power by a NUG over utility lines (wheeling) to any party other than theserving utility, on either a wholesale or retail basis, was and is either legally or operationally impossible inLouisiana. The electric utilities control transmission and are not legally required to transport NUGelectricity.
Also precluded under Louisiana regulations are cases of “self wheeling” — transmission of electricity bya company from one of its own facilities to another of its own facilities, nearby, but non-contiguous. Electricutility lines cannot be used for reasons given in the paragraph above. In addition, the potential “selfwheeling” company is likely to find it impossible to procure right-of-way (create a single site) to build itsown transmission lines. In virtually every case, all possible pathways for transmission betweennon-contiguous sites would require crossing electric utility right-of-way. Historically, the utilities would notvoluntarily allow this crossing and cannot be forced to do so. NUGs lack the power of eminent domain(ability to force sale of private property based on public need).
Problem - Low Prices Paid for NUG Electricity in Louisiana
Low sales to electric utilities by Louisiana QFs were and still are caused by the low price which the utilitiesoffered for such power. PURPA requires that mandated purchases of QF power by the electric utilitiesbe priced at the utility’s avoided cost at the time of the sale. That cost is the incremental cost to the utilityduring that period of time to internally produce one more unit of electricity.
Since the advent of PURPA, Louisiana electric utilities have had a surplus of generating capacity. No newelectric utility units are planned in the near future. This means that electric utility avoided cost in Louisianahas no capital component. That component represents the cost of needed new generation capacity whichcan be avoided by the utility by purchasing power from a QF. For Louisiana QFs, then, price receivedfor electric power is the incremental fuel cost to the utility during each hour of the QF sale to the utility.
Problem - Difficulties of Standalone NUG Operations
A final limitation mitigating against standalone NUG facilities in Louisiana has been the de facto necessityfor such facilities to be cogenerators. For a standalone cogenerating NUG, the coproduction of bothelectricity and steam implies the need to successfully sell both steam and electricity. Accomplishing salesof both is administratively difficult and, if nothing else, is crippled by transport limits on high quality steam.Only one NUG cogeneration operation in Louisiana, Nelson Industrial Steam Company (NISCO),operates as a standalone facility, selling almost all of its electricity and steam production outside of NISCOplant limits. Operation of this facility is, however, a special case. NISCO is jointly owned by Entergy GulfStates, Inc., and three industrial partners.
D R A F T D R A F T D R A F T 03/2/1
7
PART C - LOUISIANA ELECTRIC UTILITY DATA
Data in this report on generator capacity, generation of electricity, consumption of electricity, and pricingof electricity for both the electric utilities and the NUGs in Louisiana came from a number of sources.Among these were: previous editions of this Louisiana Department of Natural Resources report, the EnergyInformation Agency (EIA) of the U.S. Department of Energy (DOE), the Edison Electric Institute (EEI),and the electric utilities serving Louisiana.
Generation of Electricity by Louisiana Electric Utilities
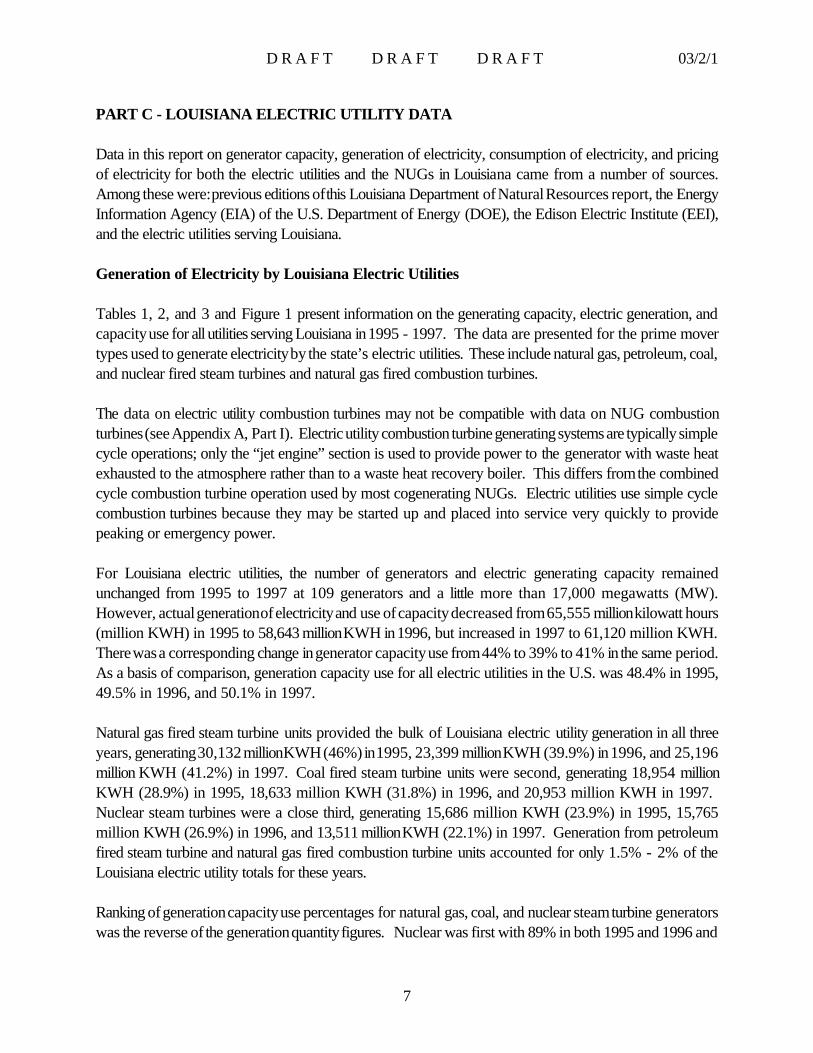
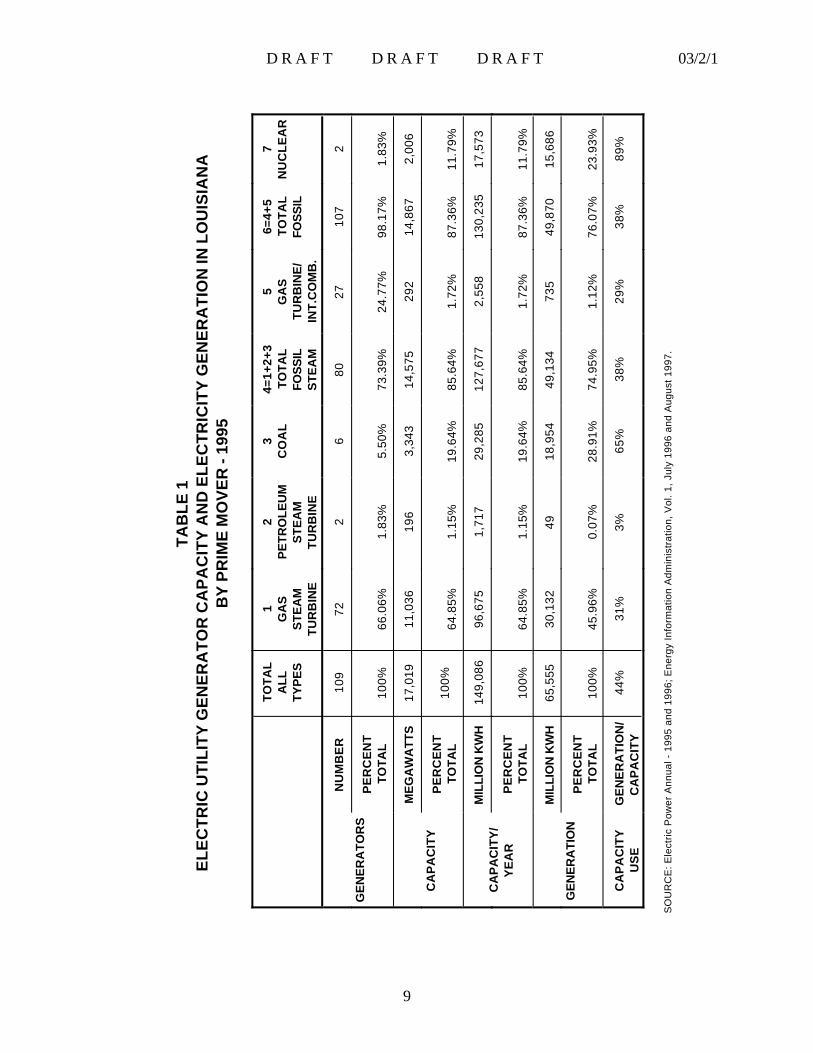
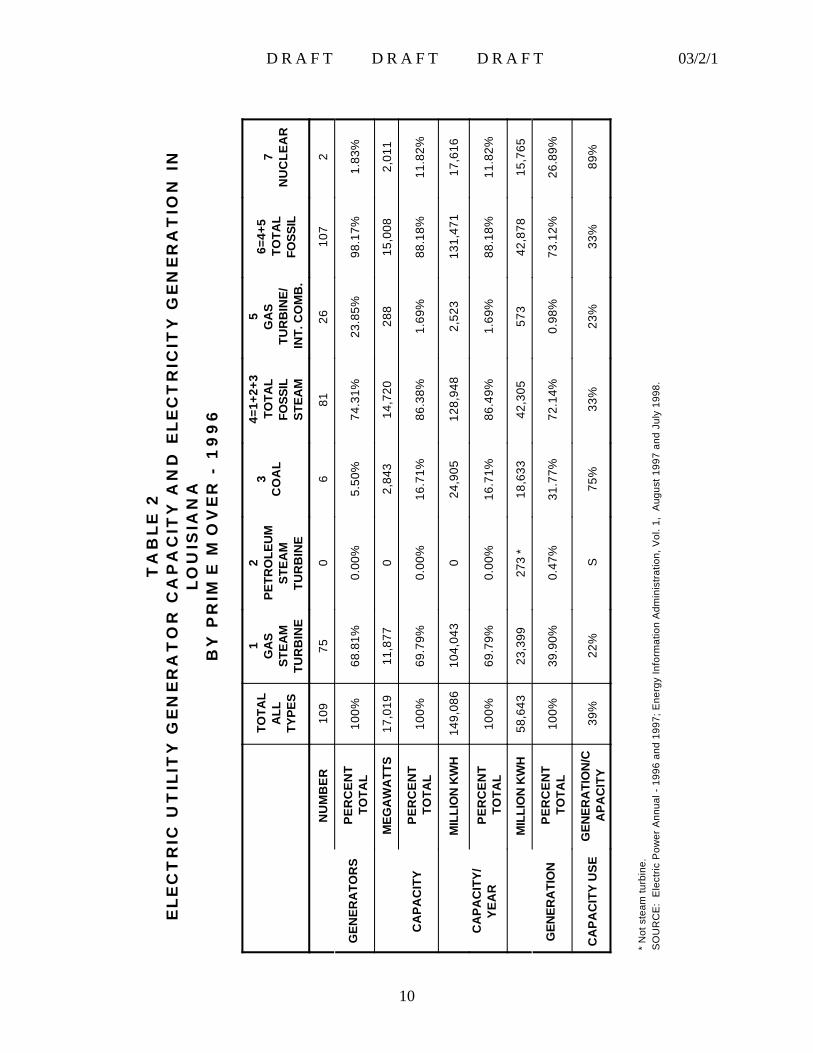
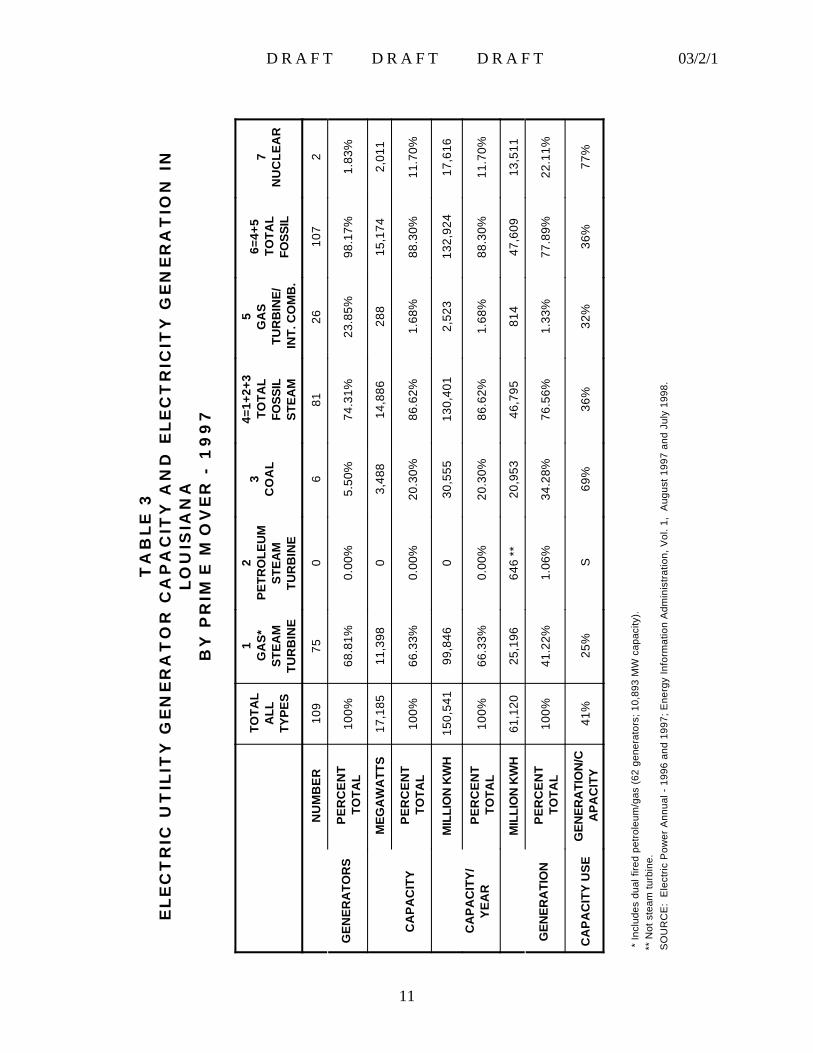
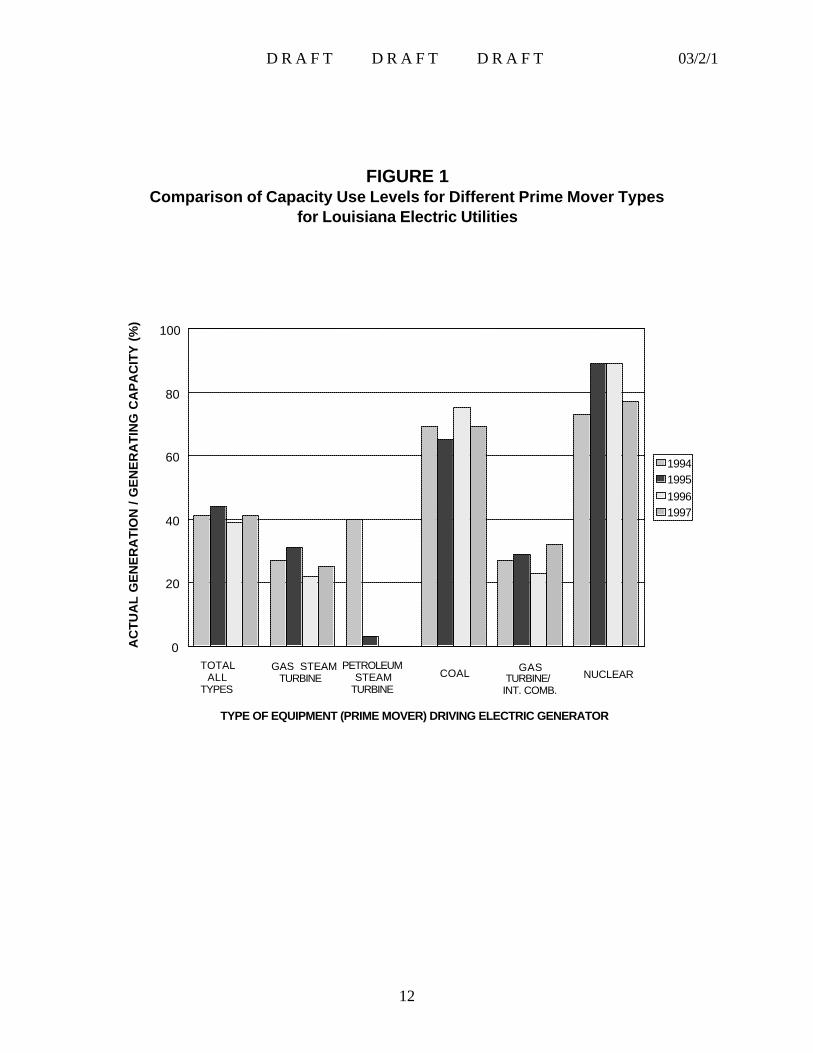
Tables 1, 2, and 3 and Figure 1 present information on the generating capacity, electric generation, andcapacity use for all utilities serving Louisiana in 1995 - 1997. The data are presented for the prime movertypes used to generate electricity by the state’s electric utilities. These include natural gas, petroleum, coal,and nuclear fired steam turbines and natural gas fired combustion turbines.
The data on electric utility combustion turbines may not be compatible with data on NUG combustionturbines (see Appendix A, Part I). Electric utility combustion turbine generating systems are typically simplecycle operations; only the “jet engine” section is used to provide power to the generator with waste heatexhausted to the atmosphere rather than to a waste heat recovery boiler. This differs from the combinedcycle combustion turbine operation used by most cogenerating NUGs. Electric utilities use simple cyclecombustion turbines because they may be started up and placed into service very quickly to providepeaking or emergency power.
For Louisiana electric utilities, the number of generators and electric generating capacity remainedunchanged from 1995 to 1997 at 109 generators and a little more than 17,000 megawatts (MW).However, actual generation of electricity and use of capacity decreased from 65,555 million kilowatt hours(million KWH) in 1995 to 58,643 million KWH in 1996, but increased in 1997 to 61,120 million KWH.There was a corresponding change in generator capacity use from 44% to 39% to 41% in the same period.As a basis of comparison, generation capacity use for all electric utilities in the U.S. was 48.4% in 1995,49.5% in 1996, and 50.1% in 1997.
Natural gas fired steam turbine units provided the bulk of Louisiana electric utility generation in all threeyears, generating 30,132 million KWH (46%) in 1995, 23,399 million KWH (39.9%) in 1996, and 25,196million KWH (41.2%) in 1997. Coal fired steam turbine units were second, generating 18,954 millionKWH (28.9%) in 1995, 18,633 million KWH (31.8%) in 1996, and 20,953 million KWH in 1997. Nuclear steam turbines were a close third, generating 15,686 million KWH (23.9%) in 1995, 15,765million KWH (26.9%) in 1996, and 13,511 million KWH (22.1%) in 1997. Generation from petroleumfired steam turbine and natural gas fired combustion turbine units accounted for only 1.5% - 2% of theLouisiana electric utility totals for these years.
Ranking of generation capacity use percentages for natural gas, coal, and nuclear steam turbine generatorswas the reverse of the generation quantity figures. Nuclear was first with 89% in both 1995 and 1996 and

D R A F T D R A F T D R A F T 03/2/1
8
77% in 1997; coal was second with 65%, 75%, and 69%, respectively; and natural gas was third with31%, 22%, and 25%, respectively. These use levels correspond to the capabilities of unit types to betaken in and out of service and run at less than capacity.
D R A F T D R A F T D R A F T 03/2/1
9
TA
BL
E 1
EL
EC
TR
IC U
TIL
ITY
GE
NE
RA
TO
R C
AP
AC
ITY
AN
D E
LE
CT
RIC
ITY
GE
NE
RA
TIO
N IN
LO
UIS
IAN
AB
Y P
RIM
E M
OV
ER
- 19
95
TO
TA
LA
LLTY
PE
S
1G
AS
ST
EA
MT
UR
BIN
E
2P
ET
RO
LE
UM
ST
EA
MT
UR
BIN
E
3C
OA
L4=
1+2+
3T
OT
AL
FOS
SIL
ST
EA
M
5G
AS
TU
RB
INE
/IN
T.C
OM
B.
6=4+
5T
OT
AL
FOS
SIL
7N
UC
LE
AR
GE
NE
RA
TO
RS
NU
MB
ER
109
722
680
2710
72
PE
RC
EN
TT
OT
AL
100%
66.0
6%1.
83%
5.50
%73
.39%
24.7
7%98
.17%
1.83
%
CA
PA
CIT
Y
ME
GA
WA
TTS
17,0
1911
,036
196
3,34
314
,575
292
14,8
672,
006
PE
RC
EN
TT
OT
AL
100%
64.8
5%1.
15%
19.6
4%85
.64%
1.72
%87
.36%
11.7
9%
CA
PA
CIT
Y/
YE
AR
MIL
LIO
N K
WH
149,
086
96,6
751,
717
29,2
8512
7,67
72,
558
130,
235
17,5
73
PE
RC
EN
TT
OT
AL
100%
64.8
5%1.
15%
19.6
4%85
.64%
1.72
%87
.36%
11.7
9%
GE
NE
RA
TIO
N
MIL
LIO
N K
WH
65,5
5530
,132
4918
,954
49,1
3473
549
,870
15,6
86
PE
RC
EN
TT
OT
AL
100%
45.9
6%0.
07%
28.9
1%74
.95%
1.12
%76
.07%
23.9
3%
CA
PA
CIT
YU
SE
GE
NE
RA
TIO
N/
CA
PA
CIT
Y44
%31
%3%
65%
38%
29%
38%
89%
SO
UR
CE
: Ele
ctric
Pow
er A
nnua
l - 1
995
and
1996
; Ene
rgy
Info
rmat
ion
Adm
inis
trat
ion,
Vol
. 1, J
uly
1996
and
Aug
ust 1
997.
D R A F T D R A F T D R A F T 03/2/1
10
TA
BLE
2E
LE
CT
RIC
UT
ILIT
Y G
EN
ER
AT
OR
CA
PA
CIT
Y A
ND
ELE
CT
RIC
ITY
GE
NE
RA
TIO
N I
NLO
UIS
IAN
AB
Y P
RIM
E M
OV
ER
- 1
99
6
TO
TA
LA
LLTY
PE
S
1G
AS
ST
EA
MT
UR
BIN
E
2P
ET
RO
LE
UM
ST
EA
MT
UR
BIN
E
3C
OA
L
4=1+
2+3
TO
TA
LFO
SS
ILS
TE
AM
5G
AS
TU
RB
INE
/IN
T. C
OM
B.
6=4+
5T
OT
AL
FOS
SIL
7N
UC
LE
AR
GE
NE
RA
TO
RS
NU
MB
ER
109
750
681
2610
72
PE
RC
EN
TT
OT
AL
100%
68.8
1%0.
00%
5.50
%74
.31%
23.8
5%98
.17%
1.83
%
CA
PA
CIT
Y
ME
GA
WA
TTS
17,0
1911
,877
02,
843
14,7
2028
815
,008
2,01
1
PE
RC
EN
TT
OT
AL
100%
69.7
9%0.
00%
16.7
1%86
.38%
1.69
%88
.18%
11.8
2%
CA
PA
CIT
Y/
YE
AR
MIL
LIO
N K
WH
149,
086
104,
043
024
,905
128,
948
2,52
313
1,47
117
,616
PE
RC
EN
TT
OT
AL
100%
69.7
9%0.
00%
16.7
1%86
.49%
1.69
%88
.18%
11.8
2%
GE
NE
RA
TIO
N
MIL
LIO
N K
WH
58,6
4323
,399
273
*18
,633
42,3
0557
342
,878
15,7
65
PE
RC
EN
TT
OT
AL
100%
39.9
0%0.
47%
31.7
7%72
.14%
0.98
%73
.12%
26.8
9%
CA
PA
CIT
Y U
SE
GE
NE
RA
TIO
N/C
AP
AC
ITY
39%
22%
S75
%33
%23
%33
%89
%
* N
ot s
team
turb
ine.
SO
UR
CE
: E
lect
ric P
ower
Ann
ual -
199
6 an
d 19
97; E
nerg
y In
form
atio
n A
dmin
istr
atio
n, V
ol. 1
, A
ugus
t 199
7 an
d Ju
ly 1
998.
D R A F T D R A F T D R A F T 03/2/1
11
TA
BLE
3E
LE
CT
RIC
UT
ILIT
Y G
EN
ER
AT
OR
CA
PA
CIT
Y A
ND
ELE
CT
RIC
ITY
GE
NE
RA
TIO
N I
NLO
UIS
IAN
AB
Y P
RIM
E M
OV
ER
- 1
99
7
TO
TA
LA
LLTY
PE
S
1G
AS
*S
TE
AM
TU
RB
INE
2P
ET
RO
LE
UM
ST
EA
MT
UR
BIN
E
3C
OA
L
4=1+
2+3
TO
TA
LFO
SS
ILS
TE
AM
5G
AS
TU
RB
INE
/IN
T. C
OM
B.
6=4+
5T
OT
AL
FOS
SIL
7N
UC
LE
AR
GE
NE
RA
TO
RS
NU
MB
ER
109
750
681
2610
72
PE
RC
EN
TT
OT
AL
100%
68.8
1%0.
00%
5.50
%74
.31%
23.8
5%98
.17%
1.83
%
CA
PA
CIT
Y
ME
GA
WA
TTS
17,1
8511
,398
03,
488
14,8
8628
815
,174
2,01
1
PE
RC
EN
TT
OT
AL
100%
66.3
3%0.
00%
20.3
0%86
.62%
1.68
%88
.30%
11.7
0%
CA
PA
CIT
Y/
YE
AR
MIL
LIO
N K
WH
150,
541
99,8
460
30,5
5513
0,40
12,
523
132,
924
17,6
16
PE
RC
EN
TT
OT
AL
100%
66.3
3%0.
00%
20.3
0%86
.62%
1.68
%88
.30%
11.7
0%
GE
NE
RA
TIO
N
MIL
LIO
N K
WH
61,1
2025
,196
646
**20
,953
46,7
9581
447
,609
13,5
11
PE
RC
EN
TT
OT
AL
100%
41.2
2%1.
06%
34.2
8%76
.56%
1.33
%77
.89%
22.1
1%
CA
PA
CIT
Y U
SE
GE
NE
RA
TIO
N/C
AP
AC
ITY
41%
25%
S69
%36
%32
%36
%77
%
* In
clud
es d
ual f
ired
petr
oleu
m/g
as (
62 g
ener
ator
s; 1
0,89
3 M
W c
apac
ity).
** N
ot s
team
turb
ine.
SO
UR
CE
: E
lect
ric P
ower
Ann
ual -
199
6 an
d 19
97; E
nerg
y In
form
atio
n A
dmin
istr
atio
n, V
ol. 1
, A
ugus
t 199
7 an
d Ju
ly 1
998.
D R A F T D R A F T D R A F T 03/2/1
12
0
20
40
60
80
100
AC
TU
AL
GE
NE
RA
TIO
N /
GE
NE
RA
TIN
G C
AP
AC
ITY
(%
)
1994199519961997
TOTALALL
TYPES
GAS STEAMTURBINE
PETROLEUMSTEAM
TURBINECOAL GAS
TURBINE/INT. COMB.
NUCLEAR
TYPE OF EQUIPMENT (PRIME MOVER) DRIVING ELECTRIC GENERATOR
FIGURE 1Comparison of Capacity Use Levels for Different Prime Mover Types
for Louisiana Electric Utilities
D R A F T D R A F T D R A F T 03/2/1
13
Nuclear plants require immense effort, both operationally and administratively, in startup and shutdown.With the exception of refueling, which takes place about every 18 months, or an emergency, nuclear plantsare never taken off line. Running any plant at steady output is easier from both an operations and safetystandpoint, and since nuclear fuel is the least expensive per BTU of heat input of any utility boiler fuel, thereis no incentive to run a nuclear plant at less than capacity. For these reasons, the nuclear steam turbine unitscome closer to maximum use than any other prime mover type.
Startup and shutdown of a coal fired unit, although hardly in the same class as a nuclear unit, is, nonetheless,difficult. So, coal fired units tend to be run continuously. Coal is the second least expensive fuel. Inaddition, some coal fired units in Louisiana receive their fuel under “take or pay” contracts which meansthe price for the fuel will be paid whether it is used or not. These two reasons provide incentive to run coalfired units as close to capacity as possible.
Of the three types of prime movers in predominate use by the electric utilities in Louisiana, the natural gasfired boiler and steam turbine units are the easiest to bring on and take off line. These units, then, are themost likely to not be run continuously. In addition, natural gas fuel is generally more expensive per BTUof heat input than coal or nuclear. For these reasons, natural gas fired boilers have only 31%, 22%, and25% capacity use factors in 1995, 1996, and 1997, respectively.
Electricity Sales to Ultimate Customers in Louisiana by Electric Utilities
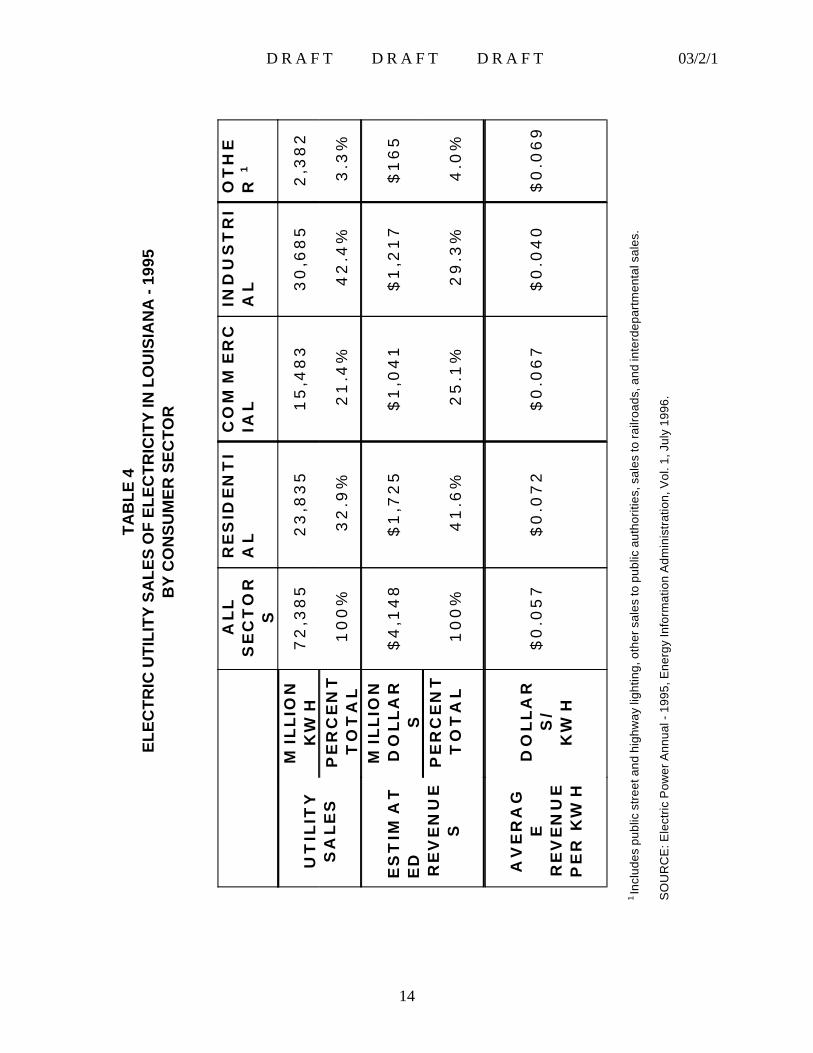
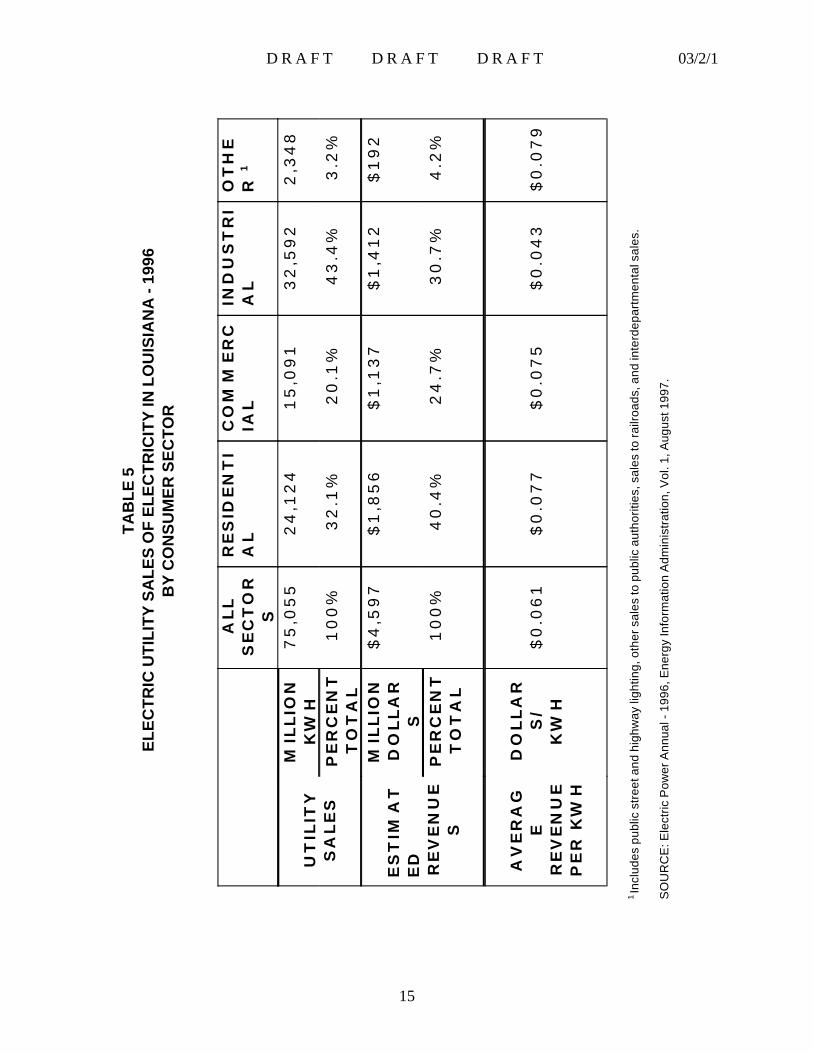
Tables 4, 5, and 6 present information on the sales of electricity in Louisiana by the electric utilities. Salestotaled 72,385 million KWH in 1995, 75,055 million KWH in 1996, and 75,465 million KWH in 1997.These figures represent a 4.2% increase in sales over the period. Total utility revenues from sales increased10.9% from $4.148 billion in 1995 to $4.602 billion in 1997. Average electricity rates for all consumerclasses went up 7% from 5.7 cents per KWH in 1995 to 6.1 cents per KWH in 1997.
Sales of electricity in Louisiana were also higher than the generation of electricity in Louisiana during thesame years. In 1995, sales of electricity in the state topped generation in the state by 10.4%; in 1996, by28%; and in 1997, by 23% This phenomenon is probably caused by both import of electricity by thoseLouisiana serving utilities having generation facilities in the adjacent state of Texas, as well as by purchaseby all Louisiana utilities of electric power from other utilities outside of the state. NUGs in Louisiana andTexas selling power to utilities serving Louisiana (discussed later in this section) can account for only a smallfraction of such purchased power.
D R A F T D R A F T D R A F T 03/2/1
14
TA
BL
E 4
EL
EC
TR
IC U
TIL
ITY
SA
LE
S O
F E
LE
CT
RIC
ITY
IN L
OU
ISIA
NA
- 19
95B
Y C
ON
SU
ME
R S
EC
TO
R
ALL
SE
CT
OR
S
RE
SID
EN
TI
AL
CO
MM
ER
CIA
LIN
DU
ST
RI
AL
OT
HE
R 1
UT
ILIT
YS
ALE
S
MIL
LIO
NK
WH
72
,38
52
3,8
35
15
,48
33
0,6
85
2,3
82
PE
RC
EN
TT
OT
AL
10
0%
32
.9%
21
.4%
42
.4%
3.3
%
ES
TIM
AT
ED
RE
VE
NU
ES
MIL
LIO
ND
OLLA
RS
$4
,14
8$
1,7
25
$1
,04
1$
1,2
17
$1
65
PE
RC
EN
TT
OT
AL
10
0%
41
.6%
25
.1%
29
.3%
4.0
%
AV
ER
AG
ER
EV
EN
UE
PE
R K
WH
DO
LLA
RS
/K
WH
$0
.05
7$
0.0
72
$0
.06
7$
0.0
40
$0
.06
9
1 In
clud
es p
ublic
str
eet a
nd h
ighw
ay li
ghtin
g, o
ther
sal
es to
pub
lic a
utho
ritie
s, s
ales
to ra
ilroa
ds, a
nd in
terd
epar
tmen
tal s
ales
.
SO
UR
CE
: Ele
ctric
Pow
er A
nnua
l - 1
995,
Ene
rgy
Info
rmat
ion
Adm
inis
trat
ion,
Vol
. 1, J
uly
1996
.
D R A F T D R A F T D R A F T 03/2/1
15
TA
BL
E 5
EL
EC
TR
IC U
TIL
ITY
SA
LE
S O
F E
LE
CT
RIC
ITY
IN L
OU
ISIA
NA
- 19
96B
Y C
ON
SU
ME
R S
EC
TO
R
ALL
SE
CT
OR
S
RE
SID
EN
TI
AL
CO
MM
ER
CIA
LIN
DU
ST
RI
AL
OT
HE
R 1
UT
ILIT
YS
ALE
S
MIL
LIO
NK
WH
75
,05
52
4,1
24
15
,09
13
2,5
92
2,3
48
PE
RC
EN
TT
OT
AL
10
0%
32
.1%
20
.1%
43
.4%
3.2
%
ES
TIM
AT
ED
RE
VE
NU
ES
MIL
LIO
ND
OLLA
RS
$4
,59
7$
1,8
56
$1
,13
7$
1,4
12
$1
92
PE
RC
EN
TT
OT
AL
10
0%
40
.4%
24
.7%
30
.7%
4.2
%
AV
ER
AG
ER
EV
EN
UE
PE
R K
WH
DO
LLA
RS
/K
WH
$0
.06
1$
0.0
77
$0
.07
5$
0.0
43
$0
.07
9
1 In
clud
es p
ublic
str
eet a
nd h
ighw
ay li
ghtin
g, o
ther
sal
es to
pub
lic a
utho
ritie
s, s
ales
to ra
ilroa
ds, a
nd in
terd
epar
tmen
tal s
ales
.
SO
UR
CE
: Ele
ctric
Pow
er A
nnua
l - 1
996,
Ene
rgy
Info
rmat
ion
Adm
inis
trat
ion,
Vol
. 1, A
ugus
t 199
7.
D R A F T D R A F T D R A F T 03/2/1
16
TA
BL
E 6
EL
EC
TR
IC U
TIL
ITY
SA
LE
S O
F E
LE
CT
RIC
ITY
IN L
OU
ISIA
NA
- 19
97B
Y C
ON
SU
ME
R S
EC
TO
R
ALL
SE
CT
OR
S
RE
SID
EN
TI
AL
CO
MM
ER
CIA
LIN
DU
ST
RI
AL
OT
HE
R 1
UT
ILIT
YS
ALE
S
MIL
LIO
NK
WH
75
,46
52
4,2
77
16
,21
03
2,4
42
2,5
36
PE
RC
EN
TT
OT
AL
10
0%
32
.2%
21
.5%
43
.0%
3.4
%
ES
TIM
AT
ED
RE
VE
NU
ES
MIL
LIO
ND
OLLA
RS
$4
,60
2$
1,8
46
$1
,14
7$
1,4
39
$1
70
PE
RC
EN
TT
OT
AL
10
0%
40
.1%
24
.9%
31
.3%
3.7%
AV
ER
AG
ER
EV
EN
UE
PE
R K
WH
DO
LLA
RS
/K
WH
$0
.06
1$
0.0
76
$0
.07
1$
0.0
44
$0
.06
7
1 In
clud
es p
ublic
str
eet a
nd h
ighw
ay li
ghtin
g, o
ther
sal
es to
pub
lic a
utho
ritie
s, s
ales
to ra
ilroa
ds, a
nd in
terd
epar
tmen
tal s
ales
.
SO
UR
CE
: Ele
ctric
Pow
er A
nnua
l - 1
997,
Ene
rgy
Info
rmat
ion
Adm
inis
trat
ion,
Vol
. 1, J
uly
1998
.
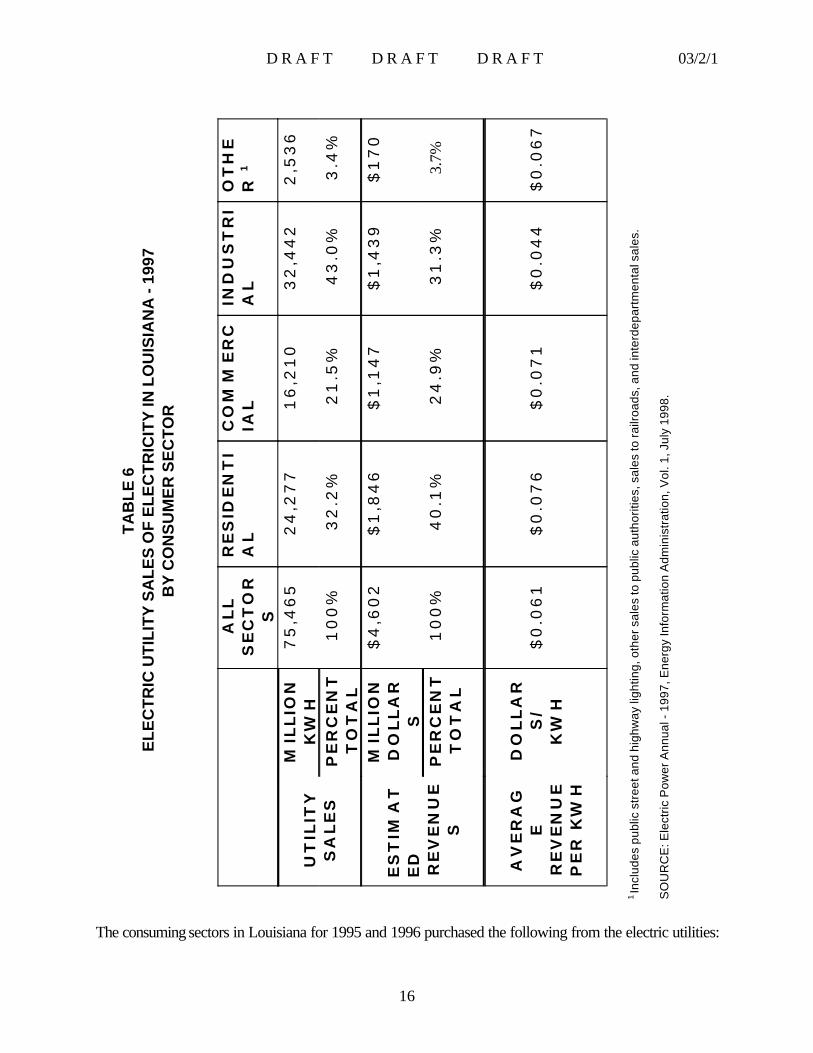
The consuming sectors in Louisiana for 1995 and 1996 purchased the following from the electric utilities:
D R A F T D R A F T D R A F T 03/2/1
17
♦ Residential sector consumption increased 1.2% between 1995 and 1996, but increased only0.6% between 1996 and 1997. Revenues increased 7.6% between 1995 and 1996, butthen fell slightly (0.5%) from 1996 to 1997. As a percentage of total sales, the residentialsector decreased 0.8% between 1995 and 1996, but then increased 0.1% between 1996and 1997. Total revenues from the residential sector decreased from 41.6% in 1995 to40.4% in 1996 to 40.1% in 1997. Average revenue per KWH increased 6.9% to 7.7 centsin 1996, then fell slightly to 7.6 cents in 1997.
♦ In the commercial sector, consumption decreased 2.6% from 1995 to 1996, then increased7.4% between 1996 and 1997. Revenues were up 9.6% from 1995 to 1996, thenincreased more slowly at 0.9% from 1996 to 1997. As a percentage of total sales, thecommercial sector decreased 1.3% between 1995 and 1996, but then increased by 1.4%from 1996 to 1997. However, total revenues from the commercial sector decreased from25.1% in 1995 to 24.7% in 1996, then increased slightly to 24.9% in 1997. Averagerevenue increased 11.9% to 7.5 cents per KWH in 1996, then fell back to 7.1 cents perKWH in 1997 (a 5.6% reduction).
♦ The industrial sector consumption increased 6.2% from 1995 to 1996, but decreased 0.5%from 1996 to 1997. Revenues from this sector increased 16% from 1995 to 1996, thenincreased more slowly at 1.9% from 1996 to 1997. As a percentage of total sales, theindustrial sector increased 1.0% from 1995 to 1996, then decreased 0.4% from 1996 to1997. Total revenues from the industrial sector increased steadily from 29.3% in 1995 to30.7% in 1996 to 31.3% in 1997. Average revenue per KWH also increased from 4.0cents in 1995 to 4.3 cents in 1996 to 4.4 cents in 1997.
Sensitivity of Electricity Sales to Electricity Price Changes - Residential and Commercial Sectors
Many or even all of these changes may be explained by changes in weather patterns, changes in businesspatterns, or changes in industrial production levels. However, the increase in average revenue per KWHfor commercial and residential sectors reverses the situation observed between 1994 to 1995 when unitprices decreased and total revenues also decreased. Under current regulatory circumstances, those in theresidential sector and virtually all of those in the commercial sector have no choice about the source of theirelectricity. Further, the ability, or even willingness, of the entire inventory of residential and commercialconsumers to adjust consumption over the short term is likely limited to only a few percentage points fromone year to the next, as noted in comparing the 1994-1997 data. From 1995 to 1996, even though theresidential sector consumption increased by onlly 1.2%, revenues from this sector increased 7.6%. From1996 to 1997, the rate of increase in consumption by the residential sector was only 0.6%, and bothrevenue and the average cost per KWH were lower than during the 1995-1996 period.
The commercial sector posted a 2.6% decrease in consumption, a 1.3% decrease in percent of total sales,but provided a 9.2% increase in revenue from 1995 to 1996. However, from 1996 to 1997, consumption
D R A F T D R A F T D R A F T 03/2/1
18
increased 7.4% while revenue increased a modest 0.9%, possibly a result of a 5.6% decrease in averagecost per KWH. The generally small variations from one year to the next make it difficult to establish aconsistent trend in reactions to price changes.
Sensitivity of Electricity Sales to Electricity Price Changes - Industrial Sector
Choices of electricity supplier are available in the Louisiana industrial sector. Currently, many industrialconsumers in the state have two choices of electric power supply source: their serving electric utility orthemselves. This additional choice, constituting a degree of competition, has significant effects on theelectricity rates paid by these industrial consumers. The current industrial price of electricity in Louisianais a reflection of the current internal cost to an industrial facility, now on the utility system, to produce itsown electricity by building new internal generating facilities.
If an industrial facility constructs new internal generating facilities, the new industrial NUG will leave theutility system. In addition, its “avoided cost” or the price at which it will purchase electricity externally fallsto the variable price of its generating fuel. Over the last several years this has ranged from 1.5 to 2.0 centsper KWH.
As a result, not only is industrial electric consumption in Louisiana sensitive to price, the effects of price onutility sales revenues are both discontinuous and nonsymmetric. On the price increase side, if utility ratesto an industrial customer exceed, even by a small margin, the cost at which that customer can self-generate,the customer has an economic incentive to do so, probably leaving the utility system - forever. At a pointslightly above to the current price, utility industrial electric sales revenues can react discontinuously to price.With higher prices, sales revenues are not just reduced by some percentage relative to the percentage priceincrease, they are immediately and irrevocably reduced by significant blocks as industrial customerspermanently drop off the system.
Even at the current industrial average rate of 4.4 cents per KWH, Louisiana industrial prices may yet behigh enough to drive some industrials out of the market. In the last half of 1996 the Technology AssessmentDivision in DNR was contacted by at least four engineering or consulting firms requesting data andindicating that they were involved in planning NUG cogeneration facilities for plants in Louisiana. Namesof the plants were not discussed. It is not known whether these facilities are existing industrial NUGsexpanding, non-generators now on a utility’s system, or industrial firms new to Louisiana.
The effects that electricity rate decreases in Louisiana have on the utility’s existing industrial customer base,on the other hand, are not symmetric with the effects of rate increases. Price decreases for the industrialplants who currently buy electricity from the utilities are likely to have sales revenues effects similar thoseexhibited by residential and commercial consumers. Electricity consumption is more likely to be affectedby production requirements than price. A 6% or 7% decrease in price may increase industrial electricityconsumption slightly. However, if the percentage increase in consumption is more than offset by thepercentage price reduction, the net effect will be a decrease in utility electricity sales revenues.
D R A F T D R A F T D R A F T 03/2/1
19
Industrial electricity rate decreases can have effects which are similar to, but the reverse of, the effects ofindustrial rate increases. These effects hold for both the new plants of new industrial entrants into the stateand plant expansions by NUGs who may not be on the utility system. In either case, the decision beingmade by the potential industrial customer is “make or buy.” If the utility can offer rates to the potentialindustrial customer which are below that customer’s cost of self-generating electricity, then sales revenuesmay be increased incrementally and in greater proportion than the percentage rate decrease. This isparticularly true if a special lower rate can be applied on an industrial facility by industrial facility basis ratherthan through a general industrial rate decrease.
The percentage price decrease required to induce non-expanding NUGs to return to the utility systemare too large to reasonably expect utilities to offer. Some Louisiana industrial NUGs are still sellingpower to the electric utilities at prices averaging 1.69 cents per KWH in 1994, 1.77 cents per KWH in1995, and 2.09 cents per KWH in 1996. These values are representative of these NUGs’ “avoidedcost” threshold. Only at rates below these levels would these industrial NUGs purchase power insteadof making it. These NUG threshold price limit levels would represent price decreases of 60% for1994, 55% for 1995, and 51% for 1996 against the industrial rates effective in those respective years.
In summary, under the current regulatory system, Louisiana electric utilities have a dilemma with respectto industrial pricing. The utilities are faced with a narrow band of prices which maximize their industrialrevenue. Above those prices, they lose industrial customers who leave the system, thereby forevercutting their revenues to the utility by an increment of 100%. Below those prices, for existing industrialcustomers, the utilities lose industrial revenue because industrial consumption of electricity does notincrease by the same percentages as the percentage industrial electric price decreases. The onlyelectric rate reduction scenario likely to increase overall income to the utility is the establishment ofspecial industrial electric rates for new facilities which otherwise might become a NUG.

D R A F T D R A F T D R A F T 03/2/1
20
PART D - LOUISIANA NON-UTILITY GENERATOR (NUG) DATA
Data in this report on NUG generator type, capacity, and generation came from the Edison Electric Institute(EEI). Data on NUG sales to and prices from electric utilities came from previous editions of this report,the purchasing electric utilities, and some of the selling NUGs. While every effort was made to assure dataquality, there are some apparent omissions and anomalies in these data. The effects of such omissions andanomalies on the validity of overall data are believed to be inconsequential. Efforts to identify and correctany errors and omissions are ongoing for each edition of this report.
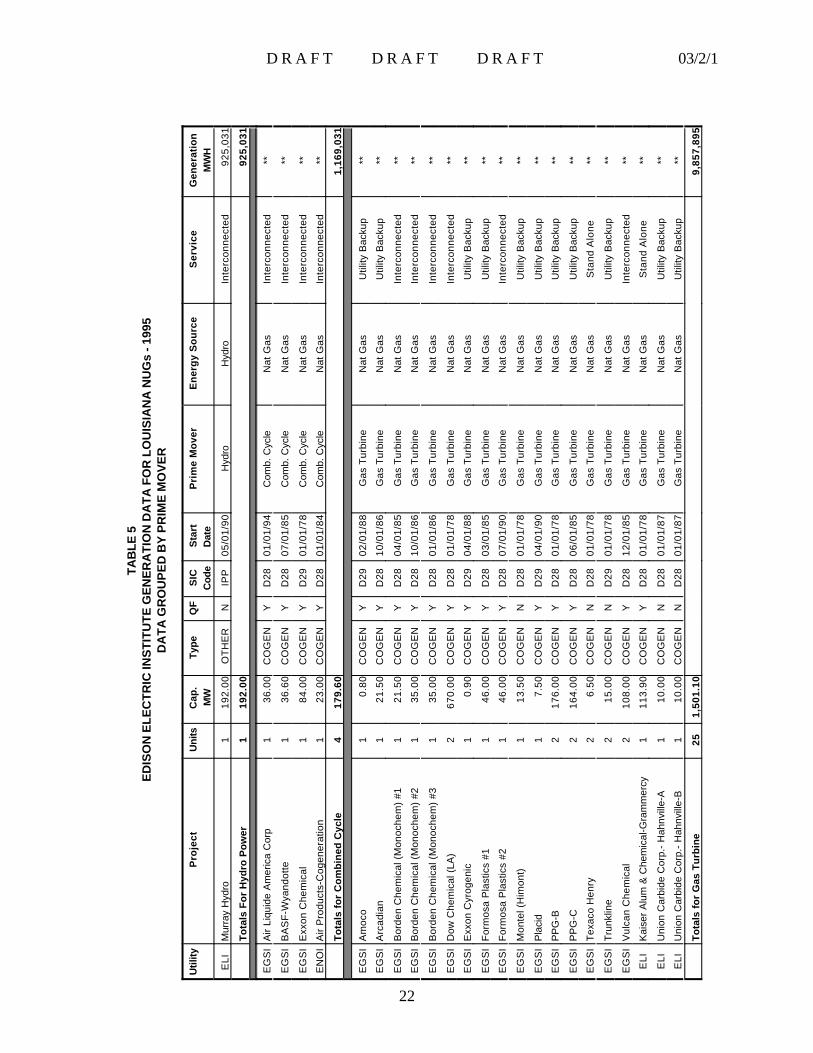
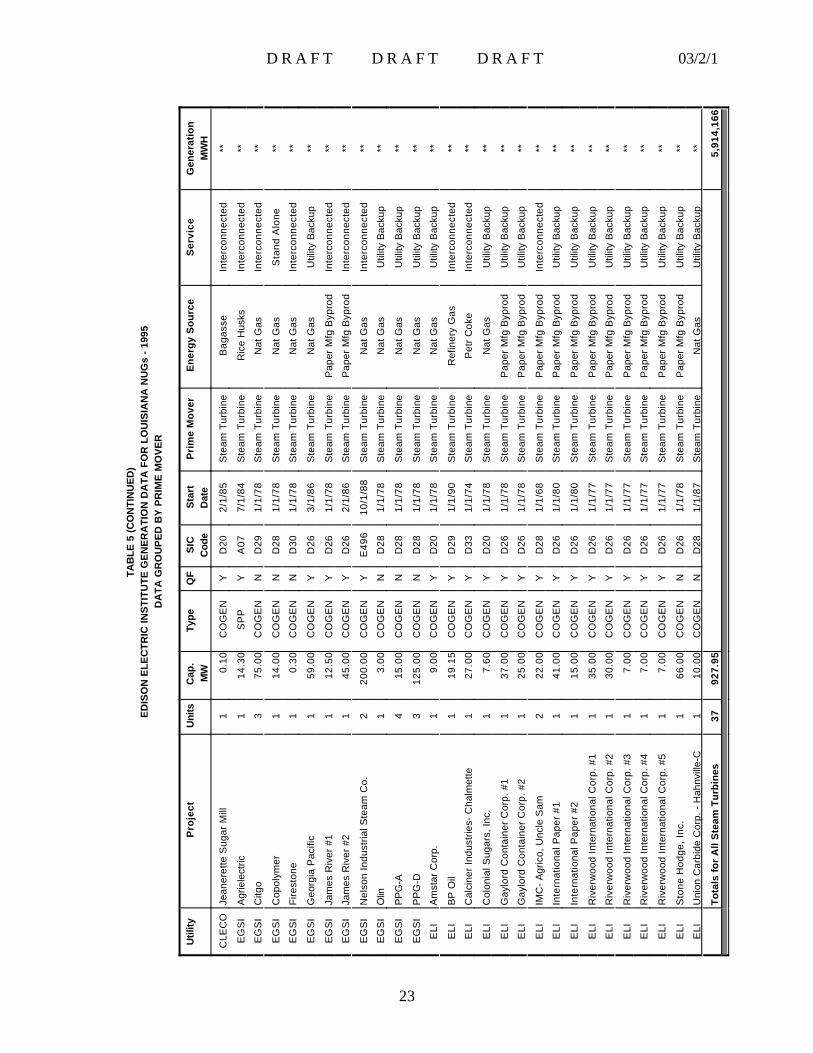
Generator Capacity, Type, and Estimated Generation by Louisiana NUGs Tables 5 and 6 present calendar year 1995 and 1996, respectively, information on NUG generator type,capacity, and fuel as well as estimated generation. Tables 5 and 6 group the data by basic prime movertype; Table 7 groups the 1996 data by industry type. Generation estimates for individual NUGs are notgiven because of confidentiality requirements.
These data from EEI were originally reported to EEI by Louisiana electric utilities. The data represent theassessment and categorization of NUG generating capability by those electric utilities as well as electricutility estimates of generation. It is likely that some Louisiana NUGs who are not QFs do not appear inthese tables. In addition, the generation estimates by the utilities for at least some of the NUGs representsimple percentage factors applied across industry groups. On the whole, however, these are the bestavailable data and are valid for the purposes of this report.
According to electric utility industry estimates for 1996, NUGs operating in Louisiana operated 67generating units having a total capacity of 2800.65 MW or 24,534 million KWH per year. Their estimatedgeneration of electricity was 17,452 million KWH. These figures represent a use factor of 71.1% forLouisiana NUGs.
In Tables 5 - 7, only one NUG in the state, Murray Hydro (an Independent Power Producer [IPP]),operates using non-thermal energy. This NUG uses low head hydropower -- mechanical energy in theform of a 10 to 20 foot elevation difference between the Mississippi and Atchafalaya Rivers -- to drive itselectric generators.
The data for the other 66 NUG generating units indicate a clear preference for combustion turbinetechnology. For purposes of comparison here, those units in the EEI data classified as combined cycle andthose classified as gas turbine are combined into a single category, combustion turbines. This is donebecause none of the reported NUG combustion turbines are of the simple cycle type (exhausting to theatmosphere) as the category “gas turbine” might imply. Combustion turbines are the prime mover for1680.7 MW or 64.4% of the NUG thermally driven generator capacity of 2608.65 MW in Louisiana.Similarly, combustion turbines produce an estimated 10,882.5 million KWH or 65.9% of the estimated16,513.4 million KWH of electricity generated by thermally driven NUG units in the state. Of the NUG

D R A F T D R A F T D R A F T 03/2/1
21
steam turbine driven generators, the majority are driven by fuels not amenable for use in combustionturbines (e.g., paper manufacturing byproducts, petroleum
D R A F T D R A F T D R A F T 03/2/1
22
TAB
LE 5
ED
ISO
N E
LE
CT
RIC
INS
TIT
UT
E G
EN
ER
AT
ION
DA
TA
FO
R L
OU
ISIA
NA
NU
Gs
- 199
5D
AT
A G
RO
UP
ED
BY
PR
IME
MO
VE
R
Util
ityP
roje
ctU
nits
Cap
.M
WTy
peQ
FS
ICC
ode
Sta
rtD
ate
Pri
me
Mo
ver
En
erg
y S
ou
rce
Ser
vice
Gen
erat
ion
MW
H
ELI
M
urra
y H
ydro
119
2.00
OT
HE
RN
IPP
05/0
1/90
Hyd
roH
ydro
Inte
rcon
nect
ed92
5,03
1
To
tals
Fo
r H
ydro
Po
wer
119
2.00
925,
031
EG
SI
Air
Liqu
ide
Am
eric
a C
orp
136
.00
CO
GE
NY
D28
01/0
1/94
Com
b. C
ycle
Nat
Gas
Inte
rcon
nect
ed**
EG
SI
BA
SF
-Wya
ndot
te1
36.6
0C
OG
EN
YD
2807
/01/
85C
omb.
Cyc
leN
at G
asIn
terc
onne
cted
**
EG
SI
Exx
on C
hem
ical
184
.00
CO
GE
NY
D29
01/0
1/78
Com
b. C
ycle
Nat
Gas
Inte
rcon
nect
ed**
EN
OI
Air
Pro
duct
s-C
ogen
erat
ion
123
.00
CO
GE
NY
D28
01/0
1/84
Com
b. C
ycle
Nat
Gas
Inte
rcon
nect
ed**
To
tals
fo
r C
om
bin
ed C
ycle
417
9.60
1,16
9,03
1
EG
SI
Am
oco
10.
80C
OG
EN
YD
2902
/01/
88G
as T
urbi
neN
at G
asU
tility
Bac
kup
**
EG
SI
Arc
adia
n1
21.5
0C
OG
EN
YD
2810
/01/
86G
as T
urbi
neN
at G
asU
tility
Bac
kup
**
EG
SI
Bor
den
Che
mic
al (
Mon
oche
m)
#11
21.5
0C
OG
EN
YD
2804
/01/
85G
as T
urbi
neN
at G
asIn
terc
onne
cted
**
EG
SI
Bor
den
Che
mic
al (
Mon
oche
m)
#21
35.0
0C
OG
EN
YD
2810
/01/
86G
as T
urbi
neN
at G
asIn
terc
onne
cted
**
EG
SI
Bor
den
Che
mic
al (
Mon
oche
m)
#31
35.0
0C
OG
EN
YD
2801
/01/
86G
as T
urbi
neN
at G
asIn
terc
onne
cted
**
EG
SI
Dow
Che
mic
al (
LA)
267
0.00
CO
GE
NY
D28
01/0
1/78
Gas
Tur
bine
Nat
Gas
Inte
rcon
nect
ed**
EG
SI
Exx
on C
yrog
enic
10.
90C
OG
EN
YD
2904
/01/
88G
as T
urbi
neN
at G
asU
tility
Bac
kup
**
EG
SI
For
mos
a P
last
ics
#11
46.0
0C
OG
EN
YD
2803
/01/
85G
as T
urbi
neN
at G
asU
tility
Bac
kup
**
EG
SI
For
mos
a P
last
ics
#21
46.0
0C
OG
EN
YD
2807
/01/
90G
as T
urbi
neN
at G
asIn
terc
onne
cted
**
EG
SI
Mon
tel (
Him
ont)
113
.50
CO
GE
NN
D28
01/0
1/78
Gas
Tur
bine
Nat
Gas
Util
ity B
acku
p**
EG
SI
Pla
cid
17.
50C
OG
EN
YD
2904
/01/
90G
as T
urbi
neN
at G
asU
tility
Bac
kup
**
EG
SI
PP
G-B
217
6.00
CO
GE
NY
D28
01/0
1/78
Gas
Tur
bine
Nat
Gas
Util
ity B
acku
p**
EG
SI
PP
G-C
216
4.00
CO
GE
NY
D28
06/0
1/85
Gas
Tur
bine
Nat
Gas
Util
ity B
acku
p**
EG
SI
Tex
aco
Hen
ry2
6.50
CO
GE
NN
D28
01/0
1/78
Gas
Tur
bine
Nat
Gas
Sta
nd A
lone
**
EG
SI
Tru
nklin
e2
15.0
0C
OG
EN
ND
2901
/01/
78G
as T
urbi
neN
at G
asU
tility
Bac
kup
**
EG
SI
Vul
can
Che
mic
al2
108.
00C
OG
EN
YD
2812
/01/
85G
as T
urbi
neN
at G
asIn
terc
onne
cted
**
ELI
Kai
ser
Alu
m &
Che
mic
al-G
ram
mer
cy1
113.
90C
OG
EN
YD
2801
/01/
78G
as T
urbi
neN
at G
asS
tand
Alo
ne**
ELI
Uni
on C
arbi
de C
orp.
- H
ahnv
ille-
A1
10.0
0C
OG
EN
ND
2801
/01/
87G
as T
urbi
neN
at G
asU
tility
Bac
kup
**
ELI
Uni
on C
arbi
de C
orp.
- H
ahnv
ille-
B1
10.0
0C
OG
EN
ND
2801
/01/
87G
as T
urbi
neN
at G
asU
tility
Bac
kup
**
To
tals
fo
r G
as T
urb
ine
251,
501.
109,
857,
895
D R A F T D R A F T D R A F T 03/2/1
23
TAB
LE 5
(C
ON
TIN
UE
D)
ED
ISO
N E
LE
CT
RIC
INS
TIT
UT
E G
EN
ER
AT
ION
DA
TA
FO
R L
OU
ISIA
NA
NU
Gs
- 19
95D
AT
A G
RO
UP
ED
BY
PR
IME
MO
VE
R
Util
ityP
roje
ctU
nits
Cap
.M
WTy
peQ
FS
ICC
ode
Sta
rtD
ate
Pri
me
Mo
ver
En
erg
y S
ou
rce
Ser
vice
Gen
erat
ion
MW
H
CLE
CO
Jean
eret
te S
ugar
Mill
10.
10C
OG
EN
YD
202/
1/85
Ste
am T
urbi
neB
agas
seIn
terc
onne
cted
**
EG
SI
Agr
iele
ctric
114
.30
SP
PY
A07
7/1/
84S
team
Tur
bine
Ric
e H
usks
Inte
rcon
nect
ed**
EG
SI
Citg
o3
75.0
0C
OG
EN
ND
291/
1/78
Ste
am T
urbi
neN
at G
asIn
terc
onne
cted
**
EG
SI
Cop
olym
er1
14.0
0C
OG
EN
ND
281/
1/78
Ste
am T
urbi
neN
at G
asS
tand
Alo
ne**
EG
SI
Fire
ston
e1
0.30
CO
GE
NN
D30
1/1/
78S
team
Tur
bine
Nat
Gas
Inte
rcon
nect
ed**
EG
SI
Geo
rgia
Pac
ific
159
.00
CO
GE
NY
D26
3/1/
86S
team
Tur
bine
Nat
Gas
Util
ity B
acku
p**
EG
SI
Jam
es R
iver
#1
112
.50
CO
GE
NY
D26
1/1/
78S
team
Tur
bine
Pap
er M
fg B
ypro
dIn
terc
onne
cted
**
EG
SI
Jam
es R
iver
#2
145
.00
CO
GE
NY
D26
2/1/
86S
team
Tur
bine
Pap
er M
fg B
ypro
dIn
terc
onne
cted
**
EG
SI
Nel
son
Indu
stria
l Ste
am C
o.2
200.
00C
OG
EN
YE
496
10/1
/88
Ste
am T
urbi
neN
at G
asIn
terc
onne
cted
**
EG
SI
Olin
13.
00C
OG
EN
ND
281/
1/78
Ste
am T
urbi
neN
at G
asU
tility
Bac
kup
**
EG
SI
PP
G-A
415
.00
CO
GE
NN
D28
1/1/
78S
team
Tur
bine
Nat
Gas
Util
ity B
acku
p**
EG
SI
PP
G-D
312
5.00
CO
GE
NN
D28
1/1/
78S
team
Tur
bine
Nat
Gas
Util
ity B
acku
p**
ELI
Am
star
Cor
p.1
9.00
CO
GE
NY
D20
1/1/
78S
team
Tur
bine
Nat
Gas
Util
ity B
acku
p**
ELI
BP
Oil
119
.15
CO
GE
NY
D29
1/1/
90S
team
Tur
bine
Ref
iner
y G
asIn
terc
onne
cted
**
ELI
Cal
cine
r In
dust
ries-
Cha
lmet
te1
27.0
0C
OG
EN
YD
331/
1/74
Ste
am T
urbi
neP
etr
Cok
eIn
terc
onne
cted
**
ELI
Col
onia
l Sug
ars,
Inc.
17.
60C
OG
EN
YD
201/
1/78
Ste
am T
urbi
neN
at G
asU
tility
Bac
kup
**
ELI
Gay
lord
Con
tain
er C
orp.
#1
137
.00
CO
GE
NY
D26
1/1/
78S
team
Tur
bine
Pap
er M
fg B
ypro
dU
tility
Bac
kup
**
ELI
Gay
lord
Con
tain
er C
orp.
#2
125
.00
CO
GE
NY
D26
1/1/
78S
team
Tur
bine
Pap
er M
fg B
ypro
dU
tility
Bac
kup
**
ELI
IMC
- A
gric
o, U
ncle
Sam
222
.00
CO
GE
NY
D28
1/1/
68S
team
Tur
bine
Pap
er M
fg B
ypro
dIn
terc
onne
cted
**
ELI
Inte
rnat
iona
l Pap
er #
11
41.0
0C
OG
EN
YD
261/
1/80
Ste
am T
urbi
neP
aper
Mfg
Byp
rod
Util
ity B
acku
p**
ELI
Inte
rnat
iona
l Pap
er #
21
15.0
0C
OG
EN
YD
261/
1/80
Ste
am T
urbi
neP
aper
Mfg
Byp
rod
Util
ity B
acku
p**
ELI
Riv
erw
ood
Inte
rnat
iona
l Cor
p. #
11
35.0
0C
OG
EN
YD
261/
1/77
Ste
am T
urbi
neP
aper
Mfg
Byp
rod
Util
ity B
acku
p**
ELI
Riv
erw
ood
Inte
rnat
iona
l Cor
p. #
21
30.0
0C
OG
EN
YD
261/
1/77
Ste
am T
urbi
neP
aper
Mfg
Byp
rod
Util
ity B
acku
p**
ELI
Riv
erw
ood
Inte
rnat
iona
l Cor
p. #
31
7.00
CO
GE
NY
D26
1/1/
77S
team
Tur
bine
Pap
er M
fg B
ypro
dU
tility
Bac
kup
**
ELI
Riv
erw
ood
Inte
rnat
iona
l Cor
p. #
41
7.00
CO
GE
NY
D26
1/1/
77S
team
Tur
bine
Pap
er M
fg B
ypro
dU
tility
Bac
kup
**
ELI
Riv
erw
ood
Inte
rnat
iona
l Cor
p. #
51
7.00
CO
GE
NY
D26
1/1/
77S
team
Tur
bine
Pap
er M
fg B
ypro
dU
tility
Bac
kup
**
ELI
Sto
ne H
odge
, In
c.1
66.0
0C
OG
EN
ND
261/
1/78
Ste
am T
urbi
neP
aper
Mfg
Byp
rod
Util
ity B
acku
p**
ELI
Uni
on C
arbi
de C
orp.
- H
ahnv
ille-
C1
10.0
0C
OG
EN
ND
281/
1/87
Ste
am T
urbi
neN
at G
asU
tility
Bac
kup
**
To
tals
fo
r A
ll S
team
Tu
rbin
es37
927.
955,
914,
166

D R A F T D R A F T D R A F T 03/2/1
24

D R A F T D R A F T D R A F T 03/2/1
25
TAB
LE 6
(C
ON
TIN
UE
D)
ED
ISO
N E
LE
CT
RIC
INS
TIT
UT
E G
EN
ER
AT
ION
DA
TA
FO
R L
OU
ISIA
NA
NU
Gs
- 19
96D
AT
A G
RO
UP
ED
BY
PR
IME
MO
VE
R
Util
ityP
roje
ctU
nits
Cap
.M
WTy
peQ
FS
ICC
ode
Sta
rtD
ate
Pri
me
Mo
ver
En
erg
y S
ou
rce
Ser
vice
Gen
erat
ion
MW
H
CLE
CO
Jean
eret
te S
ugar
Mill
10.
10C
OG
EN
YD
202/
1/85
Ste
am T
urbi
neB
agas
seIn
terc
onne
cted
**
EG
SI
Agr
iele
ctric
114
.30
SP
PY
A07
7/1/
84S
team
Tur
bine
Ric
e H
usks
Inte
rcon
nect
ed**
EG
SI
Citg
o3
75.0
0C
OG
EN
ND
291/
1/78
Ste
am T
urbi
neN
at G
asIn
terc
onne
cted
**
EG
SI
Cop
olym
er1
14.0
0C
OG
EN
ND
281/
1/78
Ste
am T
urbi
neN
at G
asS
tand
Alo
ne**
EG
SI
Fire
ston
e1
0.30
CO
GE
NN
D30
1/1/
78S
team
Tur
bine
Nat
Gas
Inte
rcon
nect
ed**
EG
SI
Geo
rgia
Pac
ific
159
.00
CO
GE
NY
D26
3/1/
86S
team
Tur
bine
Nat
Gas
Util
ity B
acku
p**
EG
SI
Jam
es R
iver
#1
112
.50
CO
GE
NY
D26
1/1/
78S
team
Tur
bine
Pap
er M
fg B
ypro
dIn
terc
onne
cted
**
EG
SI
Jam
es R
iver
#2
145
.00
CO
GE
NY
D26
2/1/
86S
team
Tur
bine
Pap
er M
fg B
ypro
dIn
terc
onne
cted
**
EG
SI
Nel
son
Indu
stria
l Ste
am C
o.2
200.
00C
OG
EN
YE
496
10/1
/88
Ste
am T
urbi
neN
at G
asIn
terc
onne
cted
**
EG
SI
Olin
13.
00C
OG
EN
ND
281/
1/78
Ste
am T
urbi
neN
at G
asU
tility
Bac
kup
**
EG
SI
PP
G-A
415
.00
CO
GE
NN
D28
1/1/
78S
team
Tur
bine
Nat
Gas
Util
ity B
acku
p**
EG
SI
PP
G-D
312
5.00
CO
GE
NN
D28
1/1/
78S
team
Tur
bine
Nat
Gas
Util
ity B
acku
p**
ELI
Am
star
Cor
p.1
9.00
CO
GE
NY
D20
1/1/
78S
team
Tur
bine
Nat
Gas
Util
ity B
acku
p**
ELI
BP
Oil
119
.15
CO
GE
NY
D29
1/1/
90S
team
Tur
bine
Ref
iner
y G
asIn
terc
onne
cted
**
ELI
Cal
cine
r In
dust
ries-
Cha
lmet
te1
27.0
0C
OG
EN
YD
331/
1/74
Ste
am T
urbi
neP
etr
Cok
eIn
terc
onne
cted
**
ELI
Col
onia
l Sug
ars,
Inc.
17.
60C
OG
EN
YD
201/
1/78
Ste
am T
urbi
neN
at G
asU
tility
Bac
kup
**
ELI
Gay
lord
Con
tain
er C
orp.
#1
137
.00
CO
GE
NY
D26
1/1/
78S
team
Tur
bine
Pap
er M
fg B
ypro
dU
tility
Bac
kup
**
ELI
Gay
lord
Con
tain
er C
orp.
#2
125
.00
CO
GE
NY
D26
1/1/
78S
team
Tur
bine
Pap
er M
fg B
ypro
dU
tility
Bac
kup
**
ELI
IMC
- A
gric
o, U
ncle
Sam
222
.00
CO
GE
NY
D28
1/1/
68S
team
Tur
bine
Pap
er M
fg B
ypro
dIn
terc
onne
cted
**
ELI
Inte
rnat
iona
l Pap
er #
11
41.0
0C
OG
EN
YD
261/
1/80
Ste
am T
urbi
neP
aper
Mfg
Byp
rod
Util
ity B
acku
p**
ELI
Inte
rnat
iona
l Pap
er #
21
15.0
0C
OG
EN
YD
261/
1/80
Ste
am T
urbi
neP
aper
Mfg
Byp
rod
Util
ity B
acku
p**
ELI
Riv
erw
ood
Inte
rnat
iona
l Cor
p. #
11
35.0
0C
OG
EN
YD
261/
1/77
Ste
am T
urbi
neP
aper
Mfg
Byp
rod
Util
ity B
acku
p**
ELI
Riv
erw
ood
Inte
rnat
iona
l Cor
p. #
21
30.0
0C
OG
EN
YD
261/
1/77
Ste
am T
urbi
neP
aper
Mfg
Byp
rod
Util
ity B
acku
p**
ELI
Riv
erw
ood
Inte
rnat
iona
l Cor
p. #
31
7.00
CO
GE
NY
D26
1/1/
77S
team
Tur
bine
Pap
er M
fg B
ypro
dU
tility
Bac
kup
**
ELI
Riv
erw
ood
Inte
rnat
iona
l Cor
p. #
41
7.00
CO
GE
NY
D26
1/1/
77S
team
Tur
bine
Pap
er M
fg B
ypro
dU
tility
Bac
kup
**
ELI
Riv
erw
ood
Inte
rnat
iona
l Cor
p. #
51
7.00
CO
GE
NY
D26
1/1/
77S
team
Tur
bine
Pap
er M
fg B
ypro
dU
tility
Bac
kup
**
ELI
Sto
ne H
odge
, In
c.1
66.0
0C
OG
EN
ND
261/
1/78
Ste
am T
urbi
neP
aper
Mfg
Byp
rod
Util
ity B
acku
p**
ELI
Uni
on C
arbi
de C
orp.
- H
ahnv
ille-
C1
10.0
0C
OG
EN
ND
281/
1/87
Ste
am T
urbi
neN
at G
asU
tility
Bac
kup
**
To
tals
fo
r A
ll S
team
Tu
rbin
es37
927.
955,
630,
956
To
tals
- A
ll P
rim
e M
ove
rs67
2800
.65
17,4
51,7
80
** In
divi
dual
dat
a no
t pro
vide
d to
pre
serv
e co
nfid
entia
lity.

D R A F T D R A F T D R A F T 03/2/1
26
coke, bagasse, and rice husks). Within the ranks of the 18 boilers fueled by natural gas, at least 10 of these can beidentified as having been built before 1945.
Table 7 presents a grouping of 1996 Louisiana NUG data by industry group. Only two Louisiana NUGs are notaffiliated with an industrial manufacturing activity: Murray Hydro, an independent power producer (IPP) usinghydropower, and Agrielectric, a small power producer (SPP) burning agricultural waste (rice husks). Data for bothof these plants can be given since both plants sell their entire electric output to utilities and are not subject to theconfidentiality requirements applicable to industrial cogenerators.
According to utility records, Murray Hydro with a generating capacity of 192 MW or 1,682 million KWH per yeargenerated 938.4 million KWH of electricity during 1996 for a capacity use of 55.8%. This facility’s level ofoperation is limited by the fact that it is a “run of the river” type hydro facility. It can only operate successfully duringthose periods of time when the water levels of the Mississippi and Atchafalaya River differ by a sufficient amount.
Similarly, Agrielectric with a generating capacity of 14.3 MW or 125.3 million KWH per year generated 56.42million KWH of electricity for Entergy during 1996, a capacity use of 45%. Although this facility runs throughoutthe year, it is dependent on available agricultural waste for production.
Of the cogenerating industrial NUGs in Louisiana, those operating as part of chemical manufacture had both themajority of generating capacity and electric generation. NUG generating capacity among chemical manufacturersin 1996 was estimated by EEI to be 1846.7 MW or 16,117 million KWH per year. Collectively, these NUGsgenerated an estimated 11,948.4 million KWH of electricity for a 73.9% use factor. These figures representedalmost 66% of Louisiana NUG capacity and 68.5% of Louisiana NUG generation during 1996.
Louisiana NUGs operating in 1996 as part of paper and paper products manufacture placed a distant second interms of both capacity and generation. These cogenerating industrial NUGs had a 1996 capacity of 386.5 MW or3,385.7 million KWH per year and generated 2,239.2 million KWH of electricity during that year, representing a66% use factor. Figures for the paper/paper products NUGs represented 13.8% of NUG capacity and 12.8% ofNUG generation in Louisiana during 1996.
The estimated generating capacity of Louisiana NUGs engaging in refining or petroleum products manufacture was344.45 MW or 3,017.4 million KWH per year in 1996. These NUGs generated an estimated 2,167.6 million KWHof electricity in that year for a capacity use of 71.8%. Compared to Louisiana NUG totals for 1996, this groupingrepresented 12.3% of generating capacity and 12.4% of generation.
The last NUG industry group is engaged in sugar cane milling or sugar refining. In 1996, this NUG industry grouphad an estimated generating capacity of 16.7 MW or 146 million KWH per year. Their estimated generation duringthat year was 101.7 million KWH representing a 69.5% use factor. Sugar industry NUGs had only 0.6% ofstatewide NUG generating capacity and 0.6% of statewide generation during 1996.
Sales of Electricity by Louisiana NUGs to Louisiana Electric Utilities
D R A F T D R A F T D R A F T 03/2/1
27
Table 8, Figures 2 through 5, and Tables 9 through 13 with associated Tables in Appendix B present data onpurchases of NUG power by Louisiana electric utilities. As shown in Table 8, Louisiana NUGs sold a total of 374.2million KWH of electricity to Louisiana utilities in 1996, the last year in which data are complete. These utilities paida total of $8,397,977 for this power for an average unit cost of 2.24 cents per KWH.
Yearly average unit prices paid by each Louisiana electric utility are shown graphically in Figure 2. These prices arestrong indicators of the natural gas prices paid by the various utilities for natural gas over the decade which the dataspan. All utilities except SWEPCO are grouped together rather closely. SWEPCO, however, is universally higherthan any other utility. In 1993, its price paid to NUGs was almost triple the value for the utility having the lowestprice paid cost in the state, New Orleans Public Service, Inc. (NOPSI, now known as Entergy New Orleans, Inc.[ENOI]). The reason for these high prices was that SWEPCO was locked into a high-priced ($5 to $6 per mcf)natural gas supply contract with one of its major suppliers. During that year, the Public Utility Commission of Texas(PUCT), which also regulates SWEPCO, investigated this situation and ordered the electric utility to renegotiateprices on this contract. Renegotiations resulted in the precipitous fall of price paid NUGs from 4.81 to 2.59 centsper KWH.
Figures 3 through 5 present graphic data on yearly totals of electricity purchases from NUGs by Louisiana electricutilities. Sums for all Louisiana NUGs are presented as bars; the total activity for all NUGs, both Louisiana andTexas, is presented as a line graph. As can be seen in Figures 3 and 4, the quantity and total cost of electricitypurchased from Texas NUGs is significant. Data in Figure 5, however, indicates that the yearly average unit pricespaid Louisiana NUGs vs. combined Texas and Louisiana NUGs are almost equal.
Starting with Table 9 through Table 14 and Figure 10, yearly summary data are presented by purchasing utility foreach NUG selling electricity. Table 9 provides data on purchases by CLECO from one NUG supplier.
NUG purchase activity by Entergy Gulf States, Inc. (EGSI), is divided into two sets of tables and figures, one set(Table 10 and Figure 6) for Louisiana NUGs and one set (Table 11 and Figure 7) for Texas NUGs. EGSIpurchases electricity from nine Louisiana NUG suppliers. The data presented in Table 10 provide sums for all ninesuppliers, and also totals with Agrielectric excepted. Agrielectric is a small power producer in Lake Charles burningagricultural waste (rice husks). Because of a special agreement with EGSI approved by the Louisiana Public ServiceCommission, this SPP receives special rates which are roughly 200% of EGSI’s avoided cost. The Agrielectric dataare omitted from Figure 6 (average yearly unit prices for each supplier) in order to focus on standard average yearlyunit prices paid industrial cogenerating QF NUGs. EGSI also purchases electric power from eight industrialcogenerating QF NUGs in Texas. These data are presented and summarized in Table 11. The average yearly unitprices for each of these NUGs are shown graphically in Figure 7. A visual examination of both EGSI figures indicatessimilarities in EGSI’s prices paid NUGs among QFs and between states.
Table 12 presents yearly data on power purchased from three industrial cogenerating QF NUGs by EntergyLouisiana, Inc. (ELI). Figure 8 shows graphically ELI’s yearly average unit price paid each of these suppliers. Withthe exception of the first year’s (1985) data, these data cluster by year among the suppliers over the twelve yearsof data. The two “new” NUGs added in 1997 are somewhat more expensive than the ELI group average.
D R A F T D R A F T D R A F T 03/2/1
28
ENOI yearly power purchase activity with one industrial cogenerating QF NUG is presented in Table 13. Similarly,the yearly average unit price paid for such power from that supplier is shown graphically in Figure 9. These averageunit prices lie within the price range paid by all other Louisiana electric utilities except SWEPCO.
Data on SWEPCO power purchasing activities with its two Texas industrial cogenerating QF NUGs is shown inTable 14. Yearly average unit prices paid by this utility to its NUG suppliers are shown graphically in Figure 10.As mentioned above, SWEPCO prices paid for power from these suppliers, a proxy for SWEPCO’s weightedaverage cost of gas, are substantially higher than those of any other Louisiana electric utility in every year until 1994.The 1994 and subsequent unit prices, while still higher than those of every other Louisiana utility, are percentage wisemuch closer.
Disaggregate monthly data for each NUG supplying a Louisiana electric utility from 1990 to the present are shownin tables located in Appendix B. These 31 tables cover all individual NUGs selling to Louisiana and include summarytables for each electric utility having more than one NUG supplier. Data for the Entergy utilities cover the period fromJanuary 1990 through October or November 1997. Data for CLECO and SWEPCO cover the period fromJanuary 1990 through December 1996.

D R A F T D R A F T D R A F T 03/2/1
29
TABLE 8PURCHASES OF ELECTRICITY FROM QFs - ALL LOUISIANA UTILITIES
YEARLY POWER PURCHASES (KWH), COST ($), AND AVERAGE COST (CENTS/KWH)PURCHASES FROM ALL QF SUPPLIERS (LA & TX)
YEAR CLECOENTERGYGSI - LA
ENTERGYLOUISIANA
ENTERGYNOI
TOTALS-LAQFs ONLY
SWEPCOENTERGYGSI - TX
TOTALSALL QFs
POWER PURCHASED (KWH)1985 16,000 153,401,456 99,420,200 3,078,172 255,915,828 7570629 27,805,102 291,291,5591986 106,000 374,503,084 91,280,900 3,370,000 469,259,984 10,331,263 50,970,958 530,562,2051987 238,000 425,681,860 105,808,050 3,079,000 534,806,910 11,504,501 86,080,106 632,391,5171988 196,000 274,373,997 97,262,077 1,772,000 373,604,074 15,332,465 126,948,281 515,884,8201989 156,000 262,212,860 96,469,848 461,000 359,299,708 9,887,053 100,117,683 469,304,4441990 73,000 303,991,026 144,734,454 147,000 448,945,480 8,662,149 71,422,665 529,030,2941991 20,530 256,238,617 147,313,535 236,000 403,808,682 2,597,814 36,089,776 442,496,2721992 1,450 244,130,416 140,037,201 496,000 384,665,067 9,270,742 127,600,698 521,536,5971993 114,940 185,468,409 143,748,186 58,000 329,389,535 10,844,644 201,238,987 541,473,1661994 437,400 129,519,067 144,122,869 369,000 274,448,336 8,871,238 229,113,009 512,432,5831995 273,140 172,713,494 140,523,451 346000 313,582,945 5,367,123 110,239,536 423,822,4811996 212,165 210,172,870 162,564,380 1,246,000 374,195,415 4,036,543 83,440,798 461,672,756
1997 * 145,822,524 288,916,826 1,068,000 71,490,759
TOTALS 1,844,62 3,138,229,680 1,802,201,97 15,726,17 4,521,921,964 104,276,164 1,322,558,358 5,871,898,694
COST OF PURCHASED POWER (DOLLARS)1985 $440 $4,073,527 $3,187,118 $89,240 $7,350,325 $287,524 $716,836 $8,354,6851986 $2,430 $6,297,966 $1,486,293 $53,456 $7,840,145 $331,817 $793,721 $8,985,6831987 $4,284 $6,610,403 $1,694,835 $47,946 $8,357,468 $310,476 $1,309,159 $9,977,1031988 $3,548 $4,803,258 $1,605,915 $29,332 $6,442,053 $487,018 $2,257,046 $9,186,1171989 $2,918 $4,624,988 $1,663,094 $7,952 $6,298,952 $297,882 $1,722,246 $8,319,0801990 $1,482 $5,433,674 $2,404,978 $2,733 $7,842,867 $296,885 $1,254,496 $9,394,2481991 $455 $3,806,975 $2,210,781 $3,825 $6,022,036 $77,380 $596,849 $6,696,2651992 $33 $4,353,919 $2,057,190 $6,680 $6,417,822 $400,640 $2,492,401 $9,310,8631993 $2,506 $3,763,697 $2,563,930 $837 $6,330,970 $521,765 $4,011,091 $10,863,8261994 $9,589 $2,123,488 $2,704,604 $5,268 $4,842,949 $229,458 $3,612,974 $8,685,3811995 $5,946 $3,112,888 $2,532,286 $7,024 $5,652,198 $95,463 $1,841,669 $7,493,8671996 $4619 $5,236,852 $3,131,023 $25,483 $8,397,977 $106,768 $1,669,739 $10,174,484
1997 * $3,922,245 $6,290,765 $24,126 $1,539,756
TOTALS $38,250 $58,163,880 $33,532,812 $303,902 $81,795,762 $3,443,076 $23,817,983 $107,421,602
AVERAGE COST OF POWER (CENTS/KWH)1985 2.75 2.66 3.21 2.90 2.87 3.80 2.58 2.871986 2.29 1.68 1.63 1.59 1.67 3.21 1.56 1.691987 1.80 1.55 1.60 1.56 1.56 2.70 1.52 1.581988 1.81 1.75 1.65 1.66 1.72 3.18 1.78 1.781989 1.87 1.76 1.72 1.72 1.75 3.01 1.72 1.771990 2.03 1.79 1.66 1.86 1.75 3.43 1.76 1.781991 2.22 1.49 1.50 1.62 1.49 2.98 1.65 1.511992 2.28 1.78 1.47 1.35 1.67 4.32 1.95 1.791993 2.18 2.03 1.78 1.44 1.92 4.81 1.99 2.011994 2.19 1.64 1.88 1.43 1.76 2.59 1.58 1.691995 2.18 1.80 1.80 2.03 1.80 1.78 1.67 1.771996 2.18 2.49 1.93 2.05 2.24 2.65 2.00 2.20
1997 * 2.69 2.18 2.26 2.15
OVERALLAVERAGE
2.07 1.85 1.86 1.93 1.81 3.30 1.80 1.83

D R A F T D R A F T D R A F T 03/2/1
30
* EGSI-LA and EGSI-TX data for January through October; ENOI data for January through November.

D R A F T D R A F T D R A F T 03/2/1
31

D R A F T D R A F T D R A F T 03/2/1
32
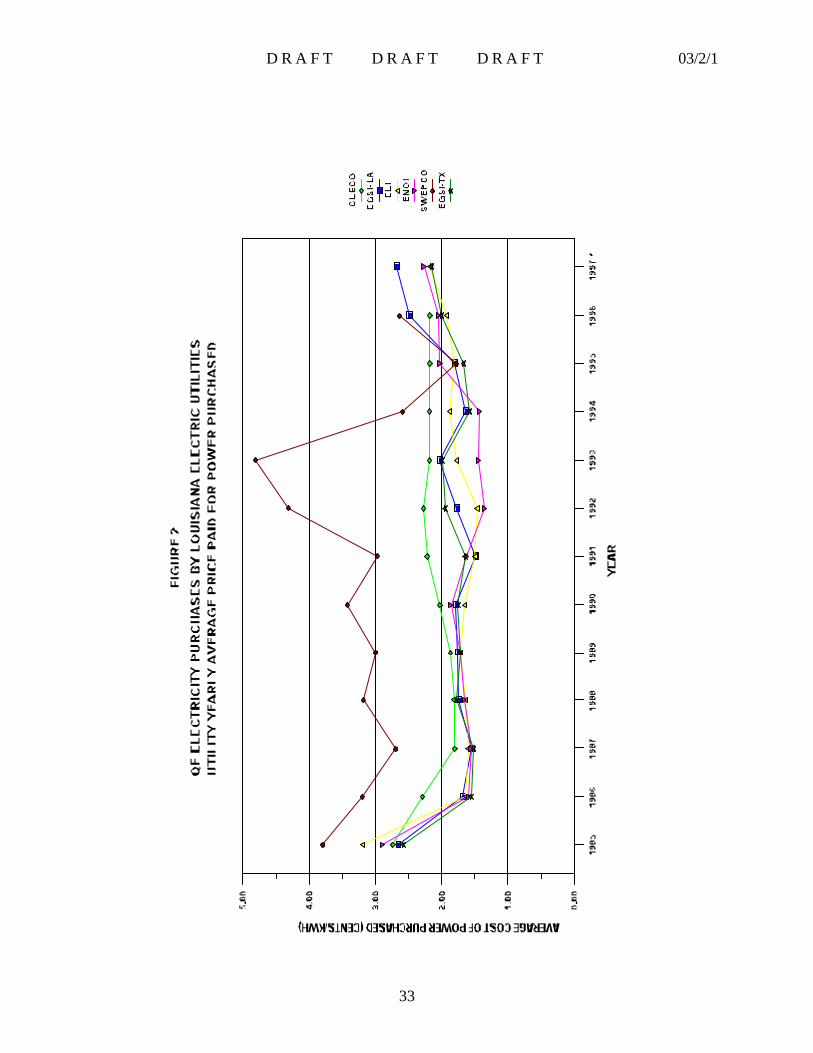
D R A F T D R A F T D R A F T 03/2/1
33
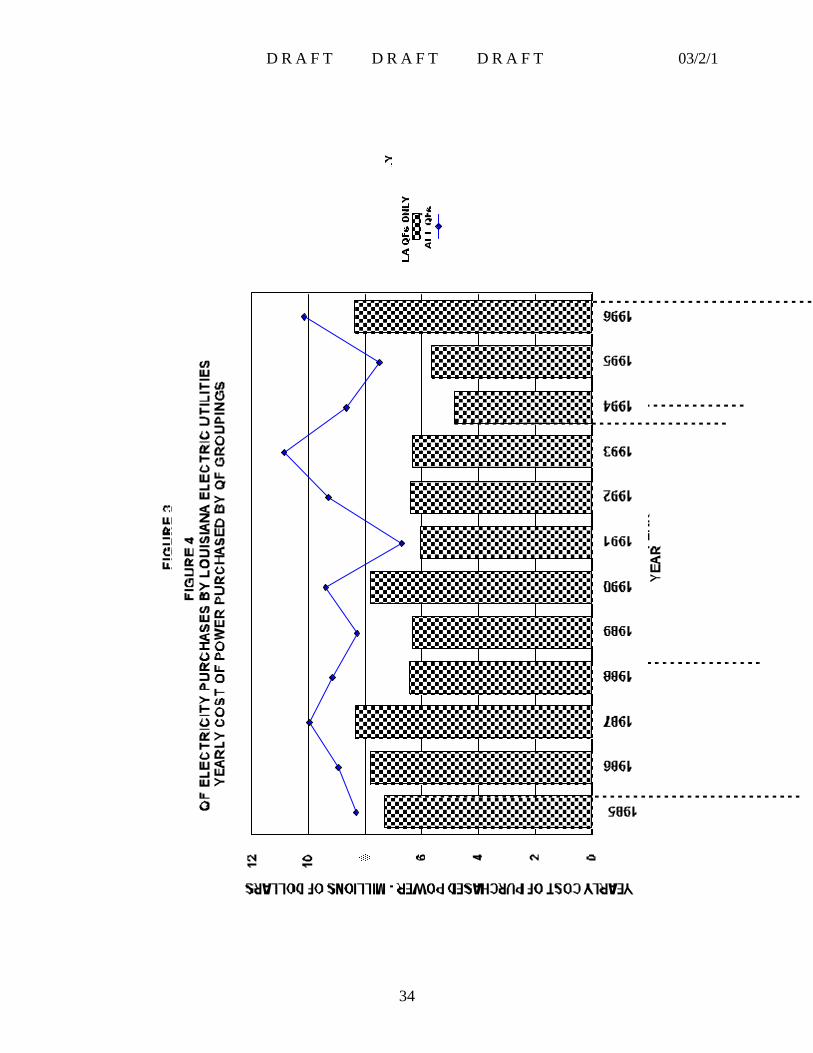
D R A F T D R A F T D R A F T 03/2/1
34

D R A F T D R A F T D R A F T 03/2/1
35
TABLE9CE
NTRALLOUISIANA
ELE
CTRICCOM
PANY(CLECO)PUR
PAQFP
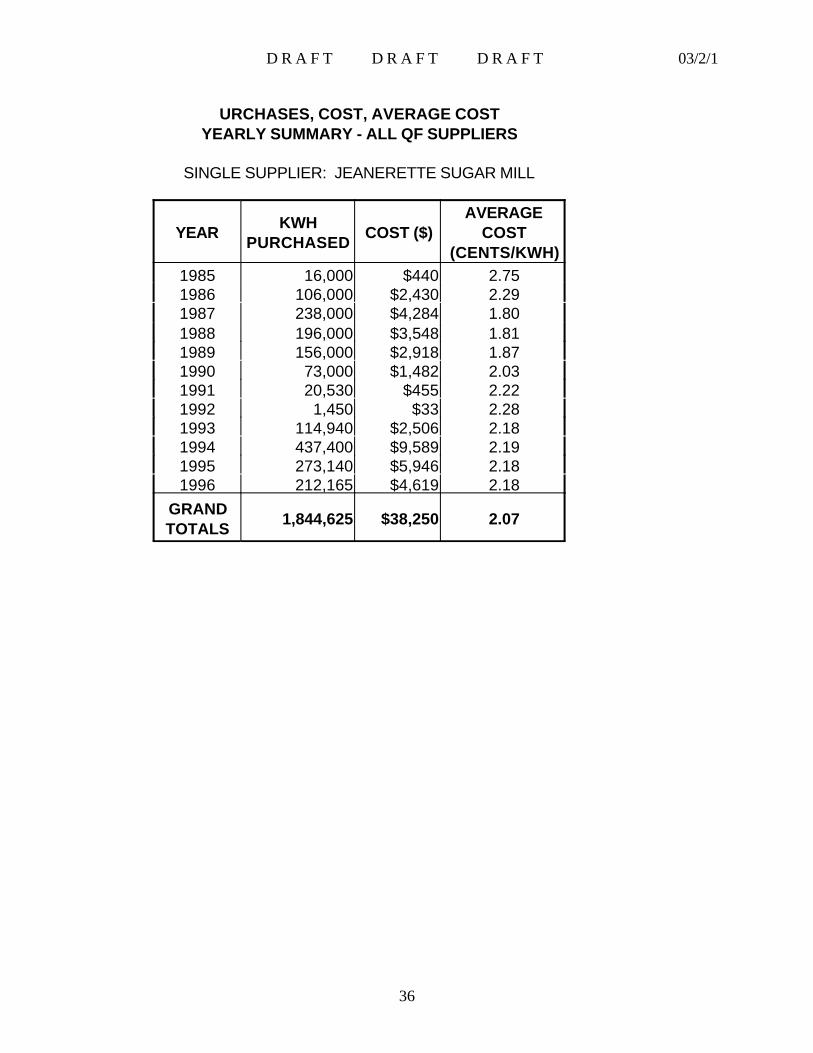
D R A F T D R A F T D R A F T 03/2/1
36
URCHASES, COST, AVERAGE COSTYEARLY SUMMARY - ALL QF SUPPLIERS
SINGLE SUPPLIER: JEANERETTE SUGAR MILL
YEARKWH
PURCHASEDCOST ($)
AVERAGECOST
(CENTS/KWH)1985 16,000 $440 2.751986 106,000 $2,430 2.291987 238,000 $4,284 1.801988 196,000 $3,548 1.811989 156,000 $2,918 1.871990 73,000 $1,482 2.031991 20,530 $455 2.221992 1,450 $33 2.281993 114,940 $2,506 2.181994 437,400 $9,589 2.191995 273,140 $5,946 2.181996 212,165 $4,619 2.18
GRANDTOTALS
1,844,625 $38,250 2.07
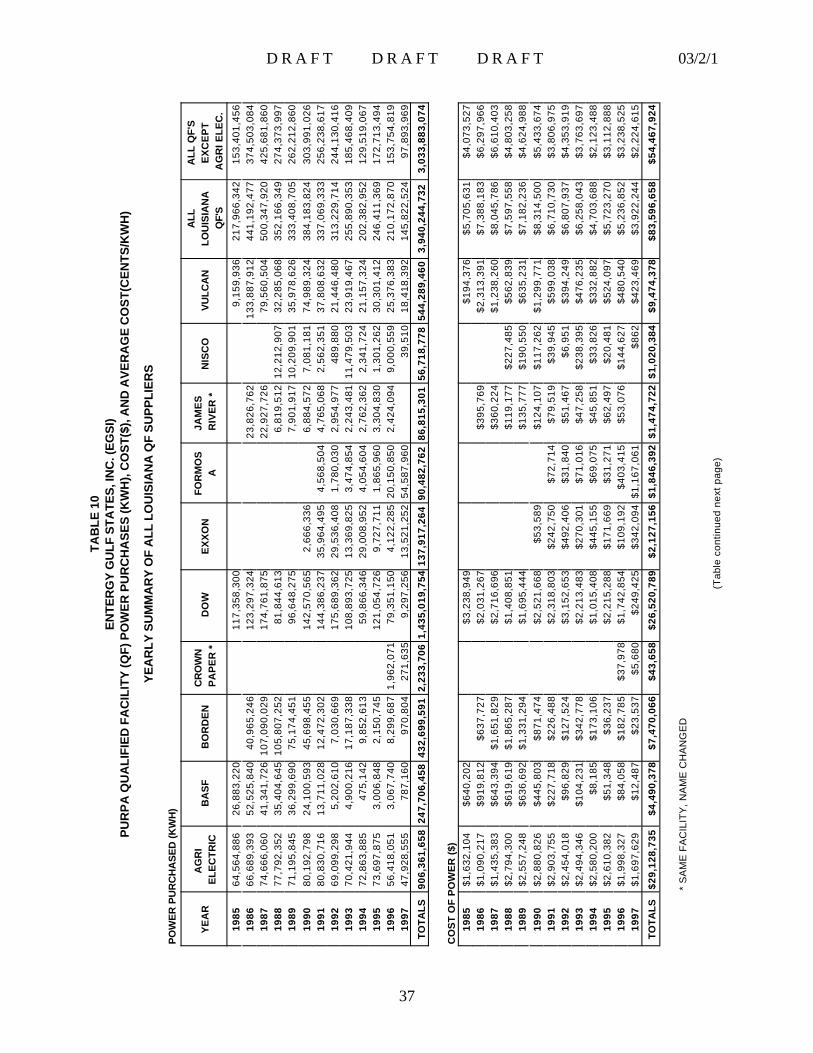
D R A F T D R A F T D R A F T 03/2/1
37
TA
BL
E 1
0E
NTE
RG
Y G
ULF
STA
TES
, IN
C. (
EG
SI)
PU
RP
A Q
UA
LIF
IED
FA
CIL
ITY
(QF
) PO
WE
R P
UR
CH
AS
ES
(KW
H),
CO
ST
($),
AN
D A
VE
RA
GE
CO
ST
(CE
NT
S/K
WH
)
YE
AR
LY
SU
MM
AR
Y O
F A
LL
LO
UIS
IAN
A Q
F S
UP
PL
IER
S
PO
WE
R P
UR
CH
AS
ED
(K
WH
)
YE
AR
AG
RI
EL
EC
TR
ICB
AS
FB
OR
DE
NC
RO
WN
PA
PE
R *
DO
WE
XX
ON
FO
RM
OS
AJA
ME
S R
IVE
R *
NIS
CO
VU
LCA
NA
LLL
OU
ISIA
NA
QF'
S
ALL
QF'
S
EX
CE
PT
A
GR
I EL
EC
.
1985
64,5
64,8
8626
,883
,220
117,
358,
300
9,15
9,93
621
7,96
6,34
215
3,40
1,45
619
8666
,689
,393
52,5
25,8
4040
,965
,246
123,
297,
324
23,8
26,7
6213
3,88
7,91
244
1,19
2,47
737
4,50
3,08
419
8774
,666
,060
41,3
41,7
2610
7,09
0,02
917
4,76
1,87
522
,927
,726
79,5
60,5
0450
0,34
7,92
042
5,68
1,86
019
8877
,792
,352
35,4
04,6
4510
5,80
7,25
281
,844
,613
6,81
9,51
212
,212
,907
32,2
85,0
6835
2,16
6,34
927
4,37
3,99
719
8971
,195
,845
36,2
99,6
9075
,174
,451
96,6
48,2
757,
901,
917
10,2
09,9
0135
,978
,626
333,
408,
705
262,
212,
860
1990
80,1
92,7
9824
,100
,593
45,6
98,4
5514
2,57
0,56
52,
666,
336
6,88
4,57
27,
081,
181
74,9
89,3
2438
4,18
3,82
430
3,99
1,02
619
9180
,830
,716
13,7
11,0
2812
,472
,302
144,
386,
237
35,9
64,4
954,
568,
504
4,76
5,06
82,
562,
351
37,8
08,6
3233
7,06
9,33
325
6,23
8,61
719
9269
,099
,298
5,20
2,61
07,
030,
669
175,
689,
362
29,5
36,4
081,
780,
030
2,95
4,97
748
9,88
021
,446
,480
313,
229,
714
244,
130,
416
1993
70,4
21,9
444,
900,
216
17,1
87,3
3810
8,89
3,72
513
,369
,825
3,47
4,85
42,
243,
481
11,4
79,5
0323
,919
,467
255,
890,
353
185,
468,
409
1994
72,8
63,8
8547
5,14
29,
852,
613
59,8
66,3
4629
,008
,952
4,05
4,60
42,
762,
362
2,34
1,72
421
,157
,324
202,
382,
952
129,
519,
067
1995
73,6
97,8
753,
006,
848
2,15
0,74
512
1,05
4,72
69,
727,
711
1,86
5,96
03,
304,
830
1,30
1,26
230
,301
,412
246,
411,
369
172,
713,
494
1996
56,4
18,0
513,
067,
740
8,29
9,68
71,
962,
071
79,3
51,1
504,
122,
285
20,1
50,8
502,
424,
094
9,00
0,55
925
,376
,383
210,
172,
870
153,
754,
819
1997
47,9
28,5
5578
7,16
097
0,80
427
1,63
59,
297,
256
13,5
21,2
5254
,587
,960
39,5
1018
,418
,392
145,
822,
524
97,8
93,9
69
TO
TA
LS
906,
361,
658
247,
706,
458
432,
699,
591
2,23
3,70
61,
435,
019,
754
137,
917,
264
90,4
82,7
6286
,815
,301
56,7
18,7
7854
4,28
9,46
03,
940,
244,
732
3,03
3,88
3,07
4
CO
ST
OF
PO
WE
R (
$)19
85$1
,632
,104
$640
,202
$3,2
38,9
49$1
94,3
76$5
,705
,631
$4,0
73,5
2719
86$1
,090
,217
$919
,812
$637
,727
$2,0
31,2
67$3
95,7
69$2
,313
,391
$7,3
88,1
83$6
,297
,966
1987
$1,4
35,3
83$6
43,3
94$1
,651
,829
$2,7
16,6
96$3
60,2
24$1
,238
,260
$8,0
45,7
86$6
,610
,403
1988
$2,7
94,3
00$6
19,6
19$1
,865
,287
$1,4
08,8
51$1
19,1
77$2
27,4
85$5
62,8
39$7
,597
,558
$4,8
03,2
5819
89$2
,557
,248
$636
,692
$1,3
31,2
94$1
,695
,444
$135
,777
$190
,550
$635
,231
$7,1
82,2
36$4
,624
,988
1990
$2,8
80,8
26$4
45,8
03$8
71,4
74$2
,521
,668
$53,
589
$124
,107
$117
,262
$1,2
99,7
71$8
,314
,500
$5,4
33,6
7419
91$2
,903
,755
$227
,718
$226
,488
$2,3
18,8
03$2
42,7
50$7
2,71
4$7
9,51
9$3
9,94
5$5
99,0
38$6
,710
,730
$3,8
06,9
7519
92$2
,454
,018
$96,
829
$127
,524
$3,1
52,6
53$4
92,4
06$3
1,84
0$5
1,46
7$6
,951
$394
,249
$6,8
07,9
37$4
,353
,919
1993
$2,4
94,3
46$1
04,2
31$3
42,7
78$2
,213
,483
$270
,301
$71,
016
$47,
258
$238
,395
$476
,235
$6,2
58,0
43$3
,763
,697
1994
$2,5
80,2
00$8
,185
$173
,106
$1,0
15,4
08$4
45,1
55$6
9,07
5$4
5,85
1$3
3,82
6$3
32,8
82$4
,703
,688
$2,1
23,4
8819
95$2
,610
,382
$51,
348
$36,
237
$2,2
15,2
88$1
71,6
69$3
1,27
1$6
2,49
7$2
0,48
1$5
24,0
97$5
,723
,270
$3,1
12,8
8819
96$1
,998
,327
$84,
058
$182
,785
$37,
978
$1,7
42,8
54$1
09,1
92$4
03,4
15$5
3,07
6$1
44,6
27$4
80,5
40$5
,236
,852
$3,2
38,5
2519
97$1
,697
,629
$12,
487
$23,
537
$5,6
80$2
49,4
25$3
42,0
94$1
,167
,061
$862
$423
,469
$3,9
22,2
44$2
,224
,615
TO
TA
LS
$29,
128,
735
$4,4
90,3
78$7
,470
,066
$43,
658
$26,
520,
789
$2,1
27,1
56$1
,846
,392
$1,4
74,7
22$1
,020
,384
$9,4
74,3
78$8
3,59
6,65
8$5
4,46
7,92
4
* S
AM
E F
AC
ILIT
Y, N
AM
E C
HA
NG
ED
(Tab
le c
ontin
ued
next
pag
e)
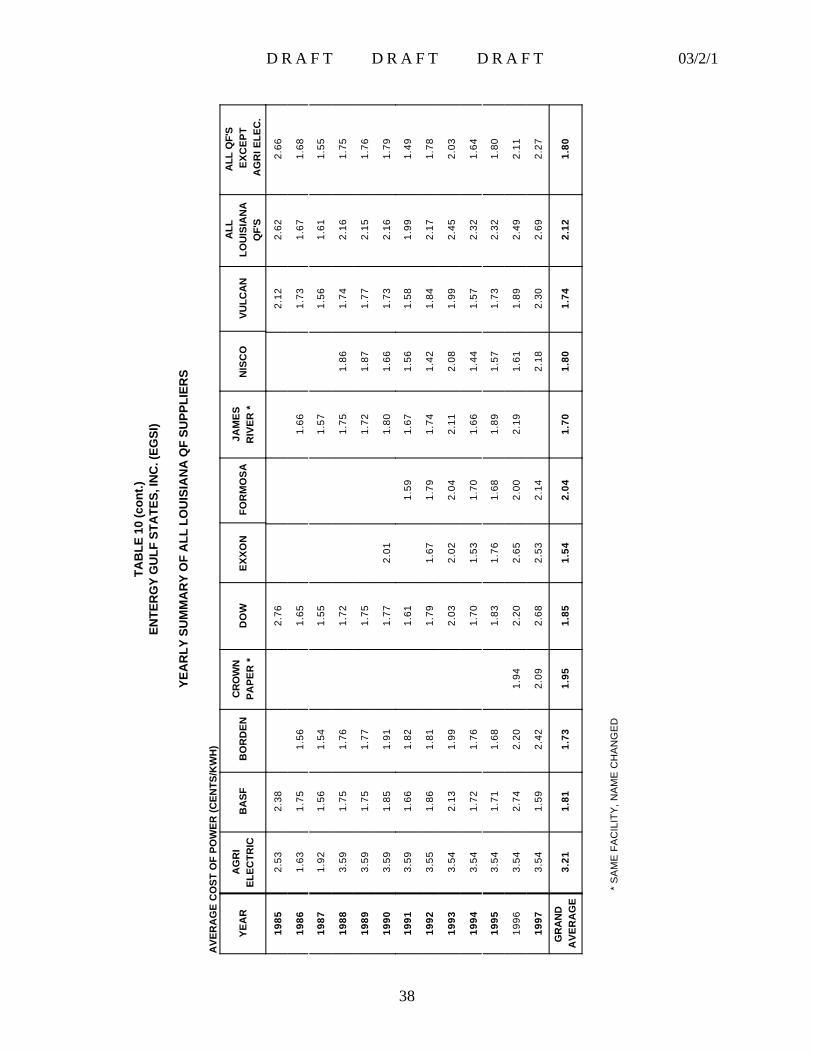
D R A F T D R A F T D R A F T 03/2/1
38
TA
BL
E 1
0 (c
on
t.)
EN
TER
GY
GU
LF S
TATE
S, I
NC
. (E
GS
I)
YE
AR
LY
SU
MM
AR
Y O
F A
LL
LO
UIS
IAN
A Q
F S
UP
PL
IER
S
AV
ER
AG
E C
OS
T O
F P
OW
ER
(C
EN
TS
/KW
H)
YE
AR
AG
RI
EL
EC
TR
ICB
AS
FB
OR
DE
NC
RO
WN
PA
PE
R *
DO
WE
XX
ON
FO
RM
OS
AJA
ME
SR
IVE
R *
NIS
CO
VU
LCA
NA
LLL
OU
ISIA
NA
QF'
S
ALL
QF'
S E
XC
EP
T A
GR
I EL
EC
.
1985
2.53
2.38
2.76
2.12
2.62
2.66
1986
1.63
1.75
1.56
1.65
1.66
1.73
1.67
1.68
1987
1.92
1.56
1.54
1.55
1.57
1.56
1.61
1.55
1988
3.59
1.75
1.76
1.72
1.75
1.86
1.74
2.16
1.75
1989
3.59
1.75
1.77
1.75
1.72
1.87
1.77
2.15
1.76
1990
3.59
1.85
1.91
1.77
2.01
1.80
1.66
1.73
2.16
1.79
1991
3.59
1.66
1.82
1.61
1.59
1.67
1.56
1.58
1.99
1.49
1992
3.55
1.86
1.81
1.79
1.67
1.79
1.74
1.42
1.84
2.17
1.78
1993
3.54
2.13
1.99
2.03
2.02
2.04
2.11
2.08
1.99
2.45
2.03
1994
3.54
1.72
1.76
1.70
1.53
1.70
1.66
1.44
1.57
2.32
1.64
1995
3.54
1.71
1.68
1.83
1.76
1.68
1.89
1.57
1.73
2.32
1.80
1996
3.54
2.74
2.20
1.94
2.20
2.65
2.00
2.19
1.61
1.89
2.49
2.11
1997
3.54
1.59
2.42
2.09
2.68
2.53
2.14
2.18
2.30
2.69
2.27
GR
AN
D
AV
ER
AG
E3.
211.
811.
731.
951.
851.
542.
041.
701.
801.
742.
121.
80
* S
AM
E F
AC
ILIT
Y, N
AM
E C
HA
NG
ED
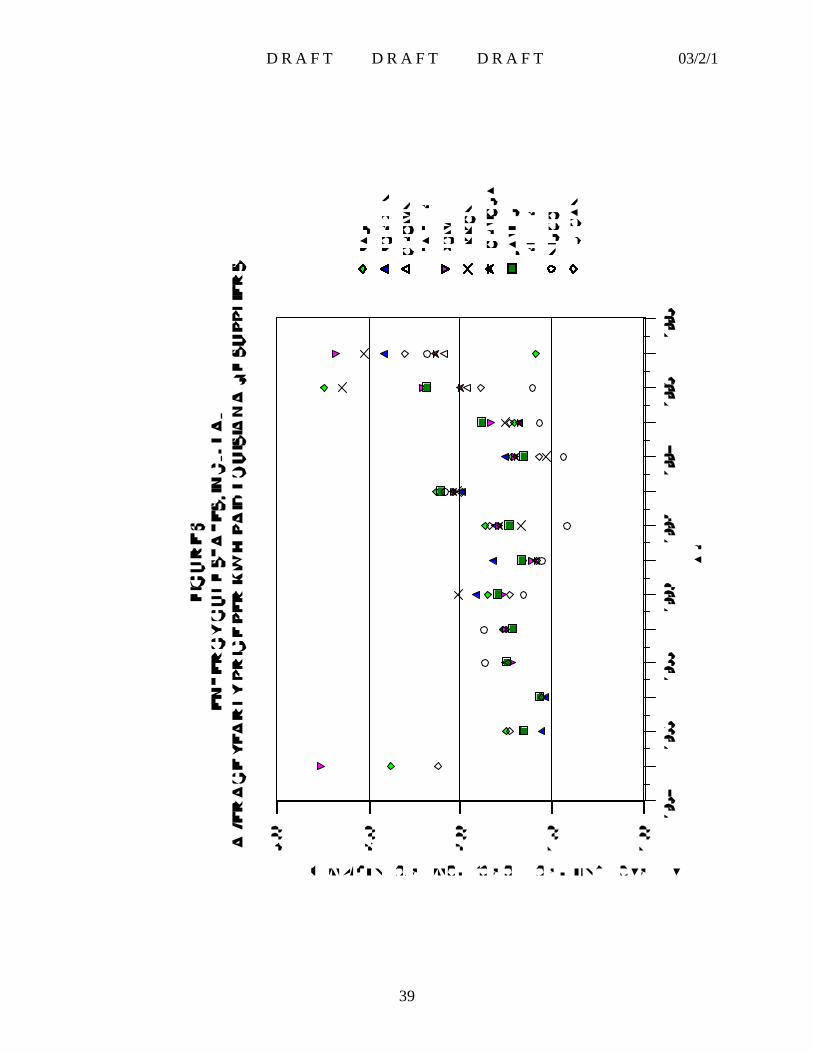
D R A F T D R A F T D R A F T 03/2/1
39
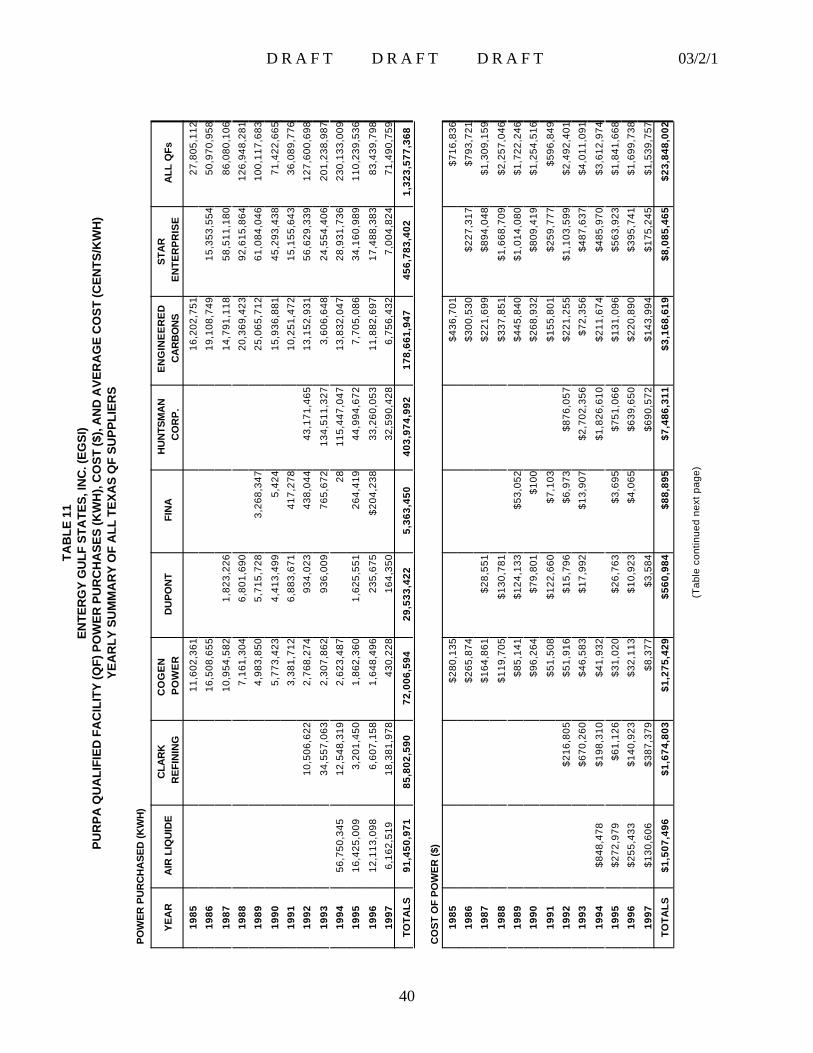
D R A F T D R A F T D R A F T 03/2/1
40
TA
BL
E 1
1E
NTE
RG
Y G
ULF
STA
TES
, IN
C. (
EG
SI)
PU
RP
A Q
UA
LIF
IED
FA
CIL
ITY
(QF
) PO
WE
R P
UR
CH
AS
ES
(KW
H),
CO
ST
($),
AN
D A
VE
RA
GE
CO
ST
(CE
NT
S/K
WH
)Y
EA
RL
Y S
UM
MA
RY
OF
AL
L T
EX
AS
QF
SU
PP
LIE
RS
PO
WE
R P
UR
CH
AS
ED
(K
WH
)
YE
AR
AIR
LIQ
UID
EC
LAR
K R
EF
ININ
GC
OG
EN
PO
WE
RD
UP
ON
TFI
NA
HU
NTS
MA
N C
OR
P.
EN
GIN
EE
RE
D C
AR
BO
NS
STA
R
EN
TE
RP
RIS
EA
LL Q
Fs
1985
11,6
02,3
6116
,202
,751
27,8
05,1
12
1986
16,5
08,6
5519
,108
,749
15,3
53,5
5450
,970
,958
1987
10,9
54,5
821,
823,
226
14,7
91,1
1858
,511
,180
86,0
80,1
06
1988
7,16
1,30
46,
801,
690
20,3
69,4
2392
,615
,864
126,
948,
281
1989
4,98
3,85
05,
715,
728
3,26
8,34
725
,065
,712
61,0
84,0
4610
0,11
7,68
3
1990
5,77
3,42
34,
413,
499
5,42
415
,936
,881
45,2
93,4
3871
,422
,665
1991
3,38
1,71
26,
883,
671
417,
278
10,2
51,4
7215
,155
,643
36,0
89,7
76
1992
10,5
06,6
222,
768,
274
934,
023
438,
044
43,1
71,4
6513
,152
,931
56,6
29,3
3912
7,60
0,69
8
1993
34,5
57,0
632,
307,
862
936,
009
765,
672
134,
511,
327
3,60
6,64
824
,554
,406
201,
238,
987
1994
56,7
50,3
4512
,548
,319
2,62
3,48
728
115,
447,
047
13,8
32,0
4728
,931
,736
230,
133,
009
1995
16,4
25,0
093,
201,
450
1,86
2,36
01,
625,
551
264,
419
44,9
94,6
727,
705,
086
34,1
60,9
8911
0,23
9,53
6
1996
12,1
13,0
986,
607,
158
1,64
8,49
623
5,67
5$2
04,2
3833
,260
,053
11,8
82,6
9717
,488
,383
83,4
39,7
98
1997
6,16
2,51
918
,381
,978
430,
228
164,
350
32,5
90,4
286,
756,
432
7,00
4,82
471
,490
,759
TO
TA
LS
91,4
50,9
7185
,802
,590
72,0
06,5
9429
,533
,422
5,36
3,45
040
3,97
4,99
217
8,66
1,94
745
6,78
3,40
21,
323,
577,
368
CO
ST
OF
PO
WE
R (
$)
1985
$280
,135
$436
,701
$716
,836
1986
$265
,874
$300
,530
$227
,317
$793
,721
1987
$164
,861
$28,
551
$221
,699
$894
,048
$1,3
09,1
59
1988
$119
,705
$130
,781
$337
,851
$1,6
68,7
09$2
,257
,046
1989
$85,
141
$124
,133
$53,
052
$445
,840
$1,0
14,0
80$1
,722
,246
1990
$96,
264
$79,
801
$100
$268
,932
$809
,419
$1,2
54,5
16
1991
$51,
508
$122
,660
$7,1
03$1
55,8
01$2
59,7
77$5
96,8
49
1992
$216
,805
$51,
916
$15,
796
$6,9
73$8
76,0
57$2
21,2
55$1
,103
,599
$2,4
92,4
01
1993
$670
,260
$46,
583
$17,
992
$13,
907
$2,7
02,3
56$7
2,35
6$4
87,6
37$4
,011
,091
1994
$848
,478
$198
,310
$41,
932
$1,8
26,6
10$2
11,6
74$4
85,9
70$3
,612
,974
1995
$272
,979
$61,
126
$31,
020
$26,
763
$3,6
95$7
51,0
66$1
31,0
96$5
63,9
23$1
,841
,668
1996
$255
,433
$140
,923
$32,
113
$10,
923
$4,0
65$6
39,6
50$2
20,8
90$3
95,7
41$1
,699
,738
1997
$130
,606
$387
,379
$8,3
77$3
,584
$690
,572
$143
,994
$175
,245
$1,5
39,7
57
TO
TA
LS
$1,5
07,4
96$1
,674
,803
$1,2
75,4
29$5
60,9
84$8
8,89
5$7
,486
,311
$3,1
68,6
19$8
,085
,465
$23,
848,
002
(Tab
le c
ontin
ued
next
pag
e)
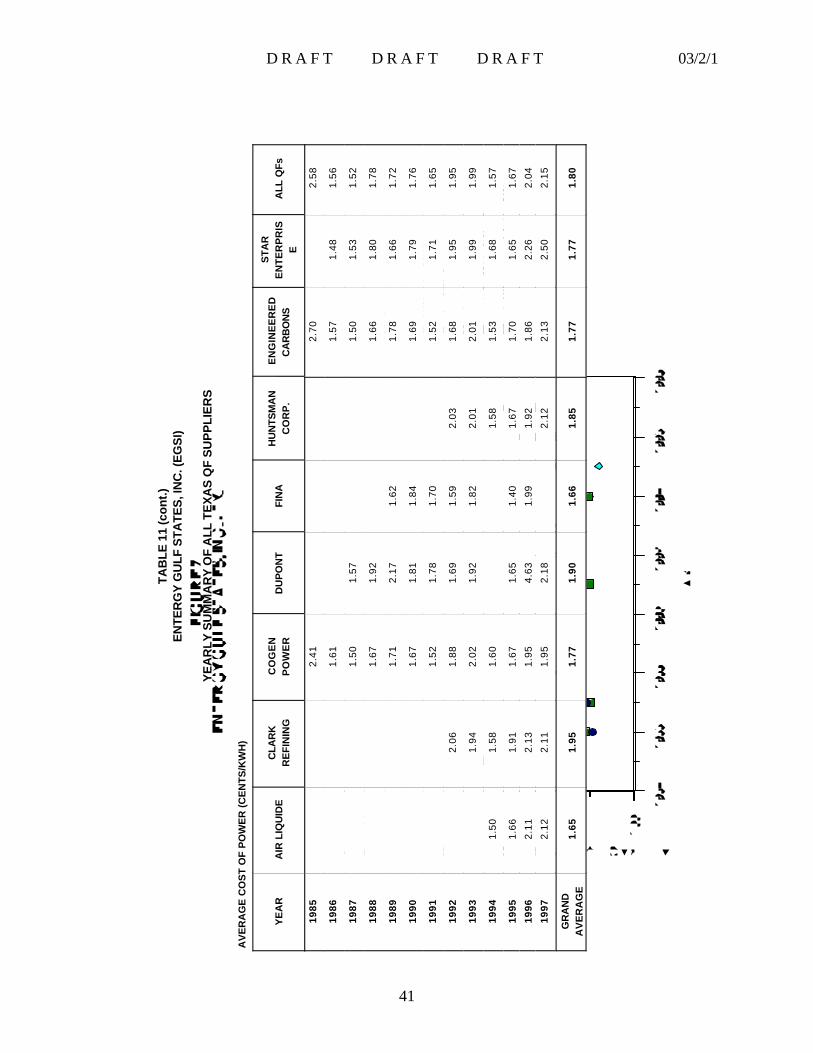
D R A F T D R A F T D R A F T 03/2/1
41
TA
BL
E 1
1 (c
on
t.)
EN
TER
GY
GU
LF S
TATE
S, I
NC
. (E
GS
I)
YE
AR
LY
SU
MM
AR
Y O
F A
LL
TE
XA
S Q
F S
UP
PL
IER
S
AV
ER
AG
E C
OS
T O
F P
OW
ER
(C
EN
TS
/KW
H)
YE
AR
AIR
LIQ
UID
EC
LAR
KR
EF
ININ
GC
OG
EN
PO
WE
RD
UP
ON
TFI
NA
HU
NTS
MA
NC
OR
P.
EN
GIN
EE
RE
DC
AR
BO
NS
STA
RE
NT
ER
PR
ISE
ALL
QFs
1985
2.41
2.70
2.58
1986
1.61
1.57
1.48
1.56
1987
1.50
1.57
1.50
1.53
1.52
1988
1.67
1.92
1.66
1.80
1.78
1989
1.71
2.17
1.62
1.78
1.66
1.72
1990
1.67
1.81
1.84
1.69
1.79
1.76
1991
1.52
1.78
1.70
1.52
1.71
1.65
1992
2.06
1.88
1.69
1.59
2.03
1.68
1.95
1.95
1993
1.94
2.02
1.92
1.82
2.01
2.01
1.99
1.99
1994
1.50
1.58
1.60
1.58
1.53
1.68
1.57
1995
1.66
1.91
1.67
1.65
1.40
1.67
1.70
1.65
1.67
1996
2.11
2.13
1.95
4.63
1.99
1.92
1.86
2.26
2.04
1997
2.12
2.11
1.95
2.18
2.12
2.13
2.50
2.15
GR
AN
DA
VE
RA
GE
1.65
1.95
1.77
1.90
1.66
1.85
1.77
1.77
1.80
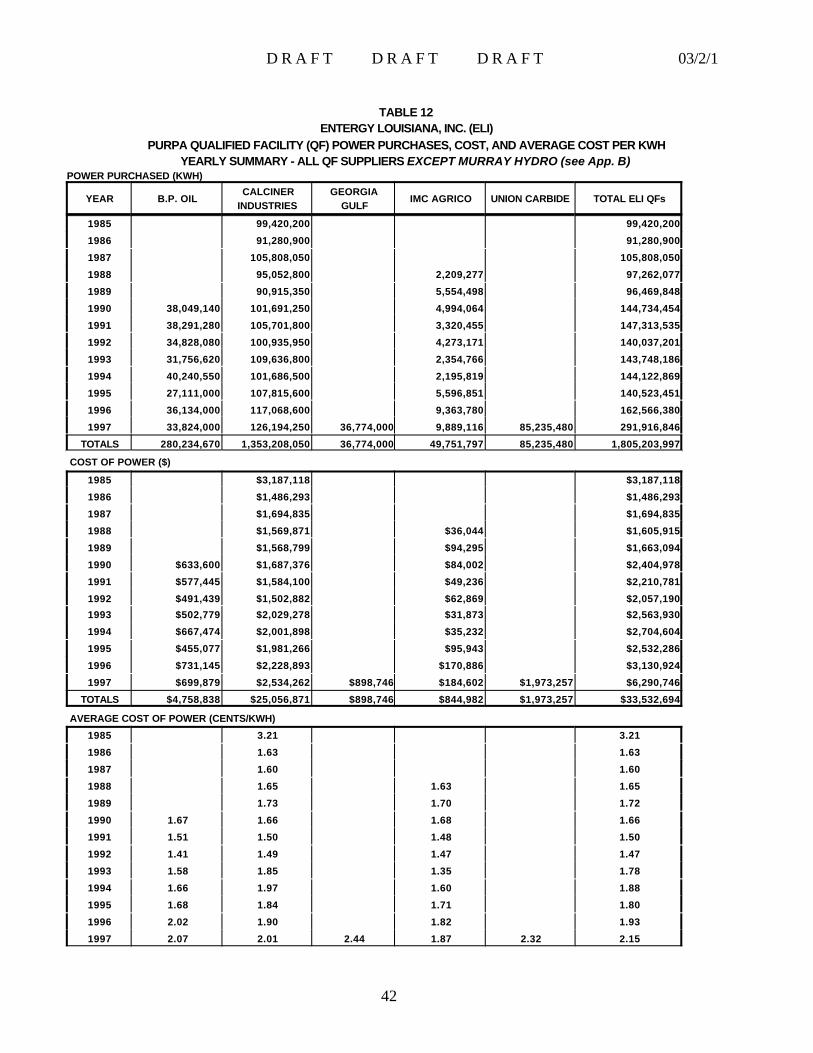
D R A F T D R A F T D R A F T 03/2/1
42
TABLE 12ENTERGY LOUISIANA, INC. (ELI)
PURPA QUALIFIED FACILITY (QF) POWER PURCHASES, COST, AND AVERAGE COST PER KWHYEARLY SUMMARY - ALL QF SUPPLIERS EXCEPT MURRAY HYDRO (see App. B)
POWER PURCHASED (KWH)
YEAR B.P. OILCALCINER
INDUSTRIESGEORGIA
GULFIMC AGRICO UNION CARBIDE TOTAL ELI QFs
1985 99,420,200 99,420,200
1986 91,280,900 91,280,900
1987 105,808,050 105,808,050
1988 95,052,800 2,209,277 97,262,077
1989 90,915,350 5,554,498 96,469,848
1990 38,049,140 101,691,250 4,994,064 144,734,454
1991 38,291,280 105,701,800 3,320,455 147,313,535
1992 34,828,080 100,935,950 4,273,171 140,037,201
1993 31,756,620 109,636,800 2,354,766 143,748,186
1994 40,240,550 101,686,500 2,195,819 144,122,869
1995 27,111,000 107,815,600 5,596,851 140,523,451
1996 36,134,000 117,068,600 9,363,780 162,566,380
1997 33,824,000 126,194,250 36,774,000 9,889,116 85,235,480 291,916,846
TOTALS 280,234,670 1,353,208,050 36,774,000 49,751,797 85,235,480 1,805,203,997
COST OF POWER ($)
1985 $3,187,118 $3,187,118
1986 $1,486,293 $1,486,293
1987 $1,694,835 $1,694,835
1988 $1,569,871 $36,044 $1,605,915
1989 $1,568,799 $94,295 $1,663,094
1990 $633,600 $1,687,376 $84,002 $2,404,978
1991 $577,445 $1,584,100 $49,236 $2,210,781
1992 $491,439 $1,502,882 $62,869 $2,057,190
1993 $502,779 $2,029,278 $31,873 $2,563,930
1994 $667,474 $2,001,898 $35,232 $2,704,604
1995 $455,077 $1,981,266 $95,943 $2,532,286
1996 $731,145 $2,228,893 $170,886 $3,130,924
1997 $699,879 $2,534,262 $898,746 $184,602 $1,973,257 $6,290,746
TOTALS $4,758,838 $25,056,871 $898,746 $844,982 $1,973,257 $33,532,694
AVERAGE COST OF POWER (CENTS/KWH)
1985 3.21 3.21
1986 1.63 1.63
1987 1.60 1.60
1988 1.65 1.63 1.65
1989 1.73 1.70 1.72
1990 1.67 1.66 1.68 1.66
1991 1.51 1.50 1.48 1.50
1992 1.41 1.49 1.47 1.47
1993 1.58 1.85 1.35 1.78
1994 1.66 1.97 1.60 1.88
1995 1.68 1.84 1.71 1.80
1996 2.02 1.90 1.82 1.93
1997 2.07 2.01 2.44 1.87 2.32 2.15
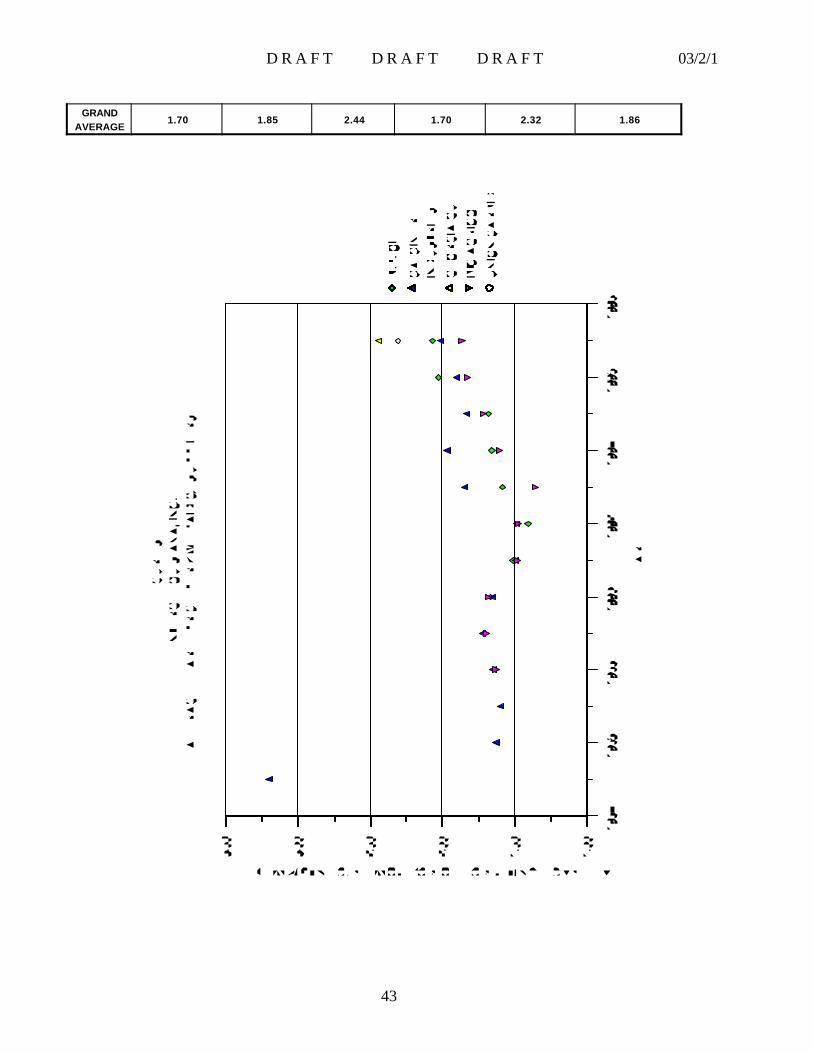
D R A F T D R A F T D R A F T 03/2/1
43
GRANDAVERAGE
1.70 1.85 2.44 1.70 2.32 1.86
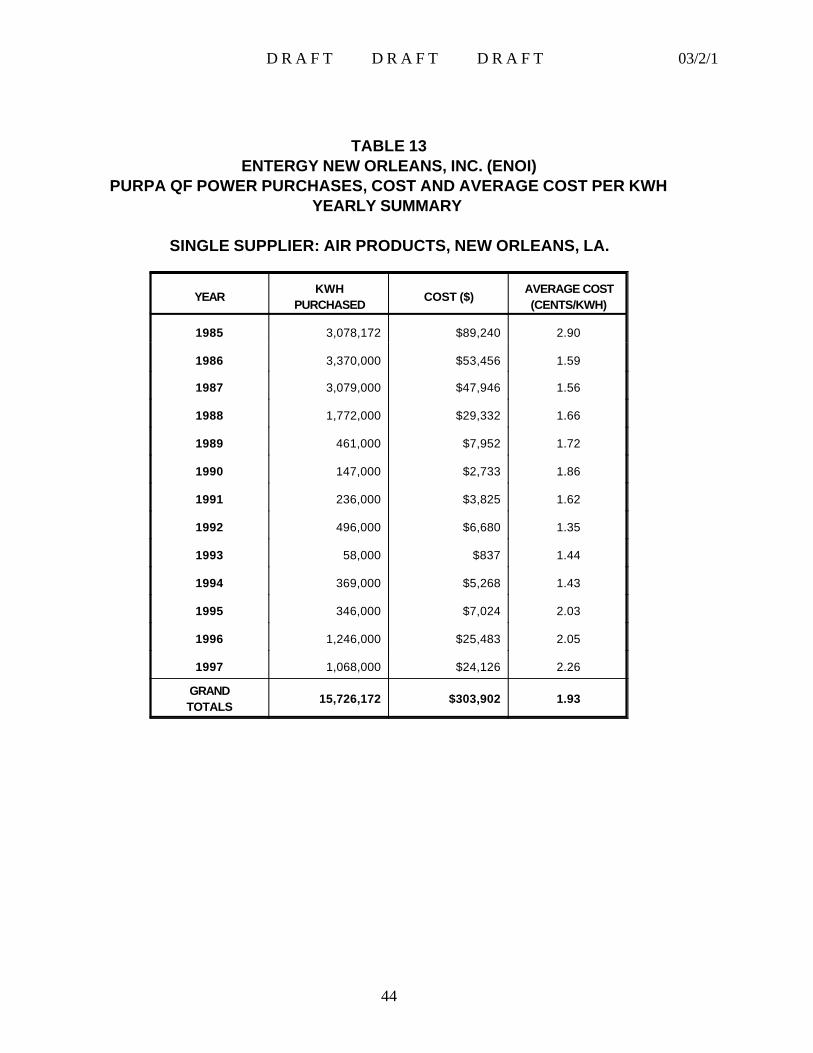
D R A F T D R A F T D R A F T 03/2/1
44
TABLE 13ENTERGY NEW ORLEANS, INC. (ENOI)
PURPA QF POWER PURCHASES, COST AND AVERAGE COST PER KWHYEARLY SUMMARY
SINGLE SUPPLIER: AIR PRODUCTS, NEW ORLEANS, LA.
YEARKWH
PURCHASEDCOST ($)
AVERAGE COST(CENTS/KWH)
1985 3,078,172 $89,240 2.90
1986 3,370,000 $53,456 1.59
1987 3,079,000 $47,946 1.56
1988 1,772,000 $29,332 1.66
1989 461,000 $7,952 1.72
1990 147,000 $2,733 1.86
1991 236,000 $3,825 1.62
1992 496,000 $6,680 1.35
1993 58,000 $837 1.44
1994 369,000 $5,268 1.43
1995 346,000 $7,024 2.03
1996 1,246,000 $25,483 2.05
1997 1,068,000 $24,126 2.26
GRANDTOTALS
15,726,172 $303,902 1.93
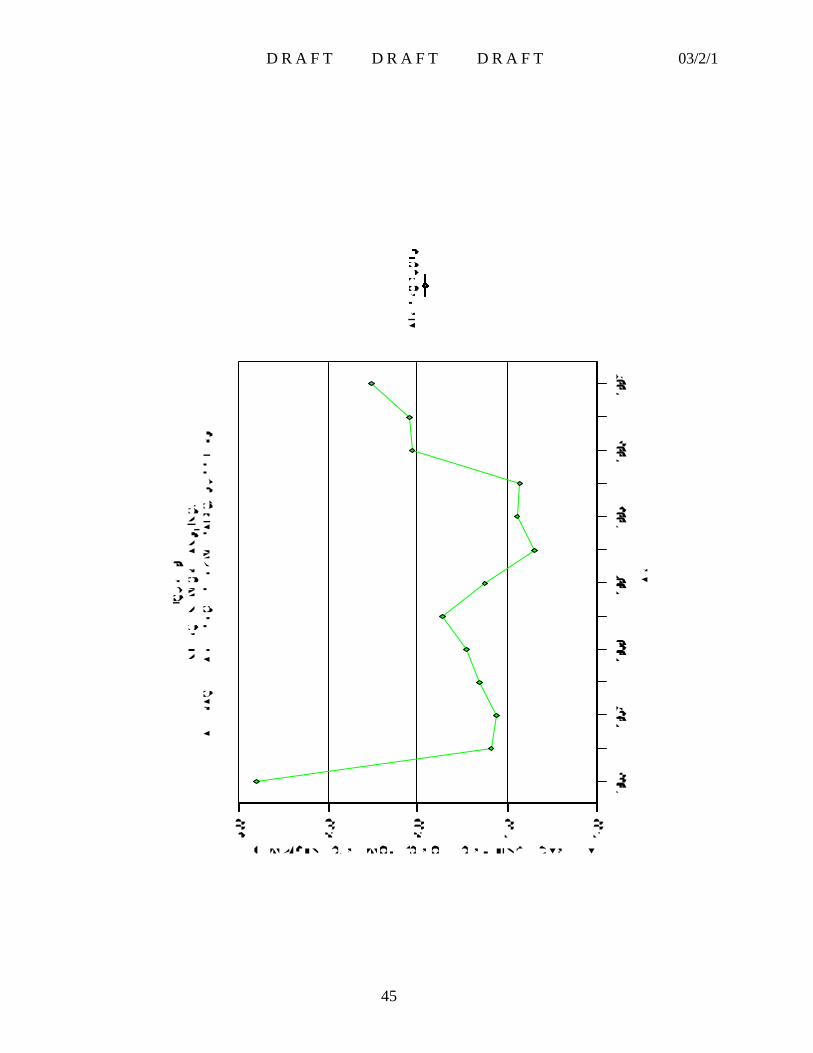
D R A F T D R A F T D R A F T 03/2/1
45
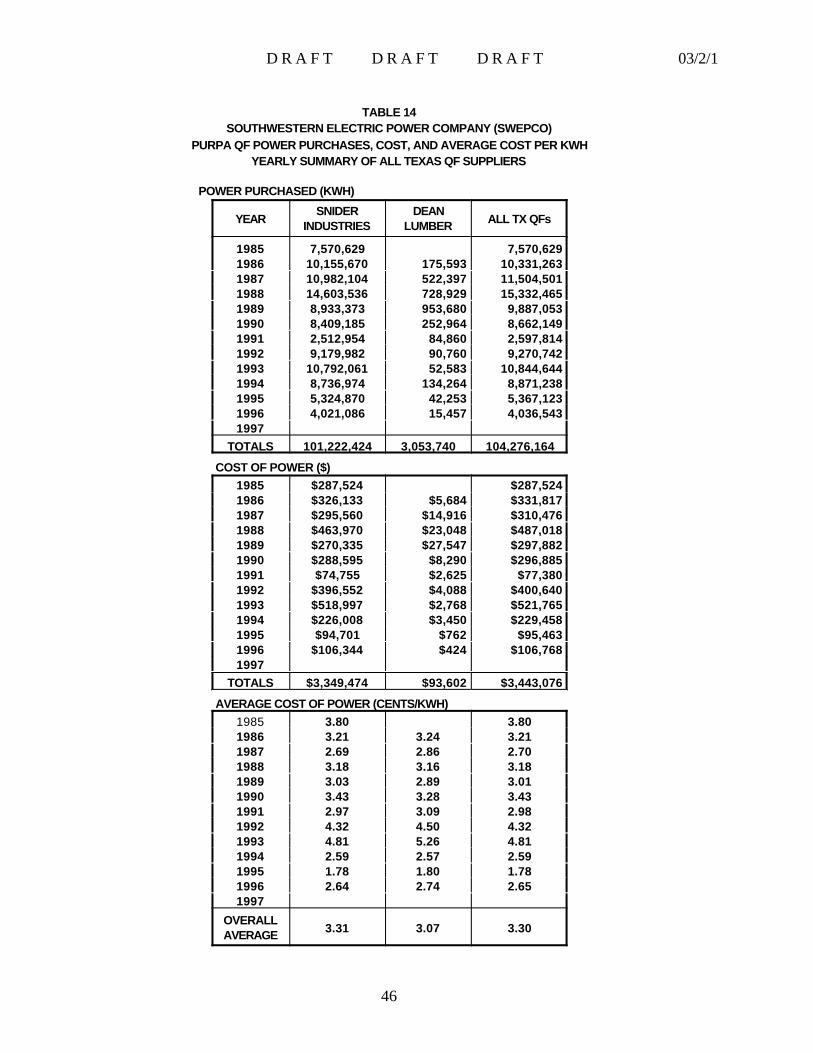
D R A F T D R A F T D R A F T 03/2/1
46
TABLE 14SOUTHWESTERN ELECTRIC POWER COMPANY (SWEPCO)
PURPA QF POWER PURCHASES, COST, AND AVERAGE COST PER KWHYEARLY SUMMARY OF ALL TEXAS QF SUPPLIERS
POWER PURCHASED (KWH)
YEARSNIDER
INDUSTRIESDEAN
LUMBER ALL TX QFs
1985 7,570,629 7,570,6291986 10,155,670 175,593 10,331,2631987 10,982,104 522,397 11,504,5011988 14,603,536 728,929 15,332,4651989 8,933,373 953,680 9,887,0531990 8,409,185 252,964 8,662,1491991 2,512,954 84,860 2,597,8141992 9,179,982 90,760 9,270,7421993 10,792,061 52,583 10,844,6441994 8,736,974 134,264 8,871,2381995 5,324,870 42,253 5,367,1231996 4,021,086 15,457 4,036,5431997
TOTALS 101,222,424 3,053,740 104,276,164
COST OF POWER ($) 1985 $287,524 $287,5241986 $326,133 $5,684 $331,8171987 $295,560 $14,916 $310,4761988 $463,970 $23,048 $487,0181989 $270,335 $27,547 $297,8821990 $288,595 $8,290 $296,8851991 $74,755 $2,625 $77,3801992 $396,552 $4,088 $400,6401993 $518,997 $2,768 $521,7651994 $226,008 $3,450 $229,4581995 $94,701 $762 $95,4631996 $106,344 $424 $106,7681997
TOTALS $3,349,474 $93,602 $3,443,076
AVERAGE COST OF POWER (CENTS/KWH)1985 3.80 3.801986 3.21 3.24 3.211987 2.69 2.86 2.701988 3.18 3.16 3.181989 3.03 2.89 3.011990 3.43 3.28 3.431991 2.97 3.09 2.981992 4.32 4.50 4.321993 4.81 5.26 4.811994 2.59 2.57 2.591995 1.78 1.80 1.781996 2.64 2.74 2.651997
OVERALLAVERAGE 3.31 3.07 3.30

D R A F T D R A F T D R A F T 03/2/1
47
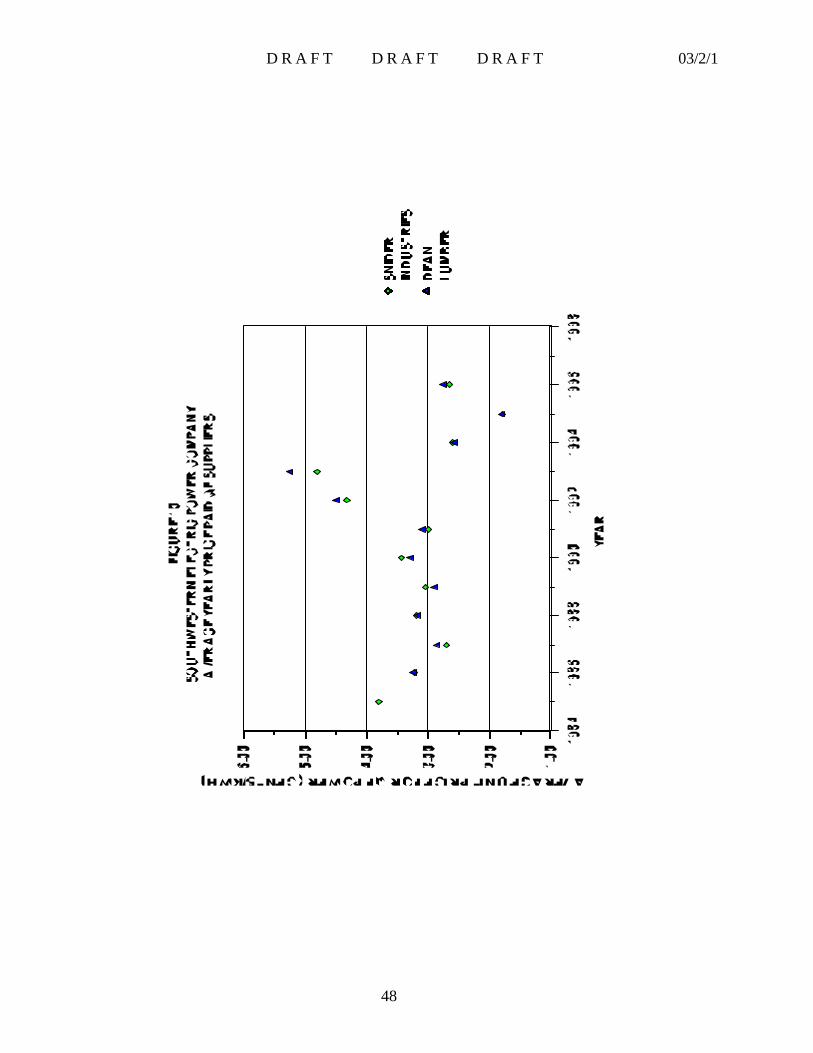
D R A F T D R A F T D R A F T 03/2/1
48
D R A F T D R A F T D R A F T 03/2/1
49
PART E - A COMPARISON OF ELECTRIC UTILITY AND NUG GENERATING DATA
Louisiana Electric Utility and NUG Generation Capacity and Electric Generation
Table 15 presents 1996 data on generating capacity, electric generation, and capacity use for Louisiana electricutilities and Louisiana NUGs. As discussed previously in this report, the NUGs in Louisiana, primarily industrialcogenerators, have historically generated a substantial fraction of total power generated in the state. In 1996,the number of generating units in Louisiana was 176. The electric utilities operated 109 (61.9%) of these unitswhile the NUGs operated 67 units (38.1%). Generating capacity in the state totaled 19,820 MW or 173,623million KWH per year. Of this capacity the electric utilities held 17,019 MW or 149,086 million KWH peryear (85.9%) while the NUGs held 2,801 MW or 24,537 million KWH per year (14.1%). Estimated totalgeneration of electricity totaled 76,127 million KWH in 1996 for a capacity use level of 43.8%. In that year,Louisiana electric utilities generated 58,643 million KWH (77%) for a capacity use percentage of 39.3%.During the same period Louisiana NUGs generated 17,484 million KWH (23%) using 71.3% of possiblecapacity.
Sales, Transfers, and Consumption of Electricity in Louisiana by Electric Utilities and IndustrialNUGs
Data comparing 1996 sales, transfers, and consumption of electricity by electric utilities and NUGs in Louisianaare presented in Table 16. As stated above, reported electric utility generation was 77% of an estimated76,127 million KWH state total while EEI estimated that NUG generation produced the remaining 23%.Electric utility delivery of electricity to ultimate consumers totaled 75,055 million KWH or 81.4% of totalLouisiana consumption, 92,165 million KWH. After adjusting utility and NUG generation figures by 374.2million KWH (0.4% of total consumption) representing sales from NUGs to utilities, the utilities made estimatedcombined out of state purchases and transfers from Louisiana utility generating facilities in Texas of 16,037.8million KWH (17.4% of total state consumption). Net internal 1996 consumption of self-generated electricpower by industrial NUGs in Louisiana was 17,110.2 million KWH (18.6% of total state consumption). Thisinternally generated industrial consumption figure combined with the 32,592 million KWH (35.4% of total stateconsumption) delivered to industrials by Louisiana electric utilities implies that 1996 industrial consumption ofelectricity was over half (54%) of total electricity consumed in the state. Of this total 1996 Louisiana industrialconsumption of electricity, the electric utility - NUG split was 65.6% - 34.4%.

D R A F T D R A F T D R A F T 03/2/1
50
TA
BL
E 1
5C
OM
PA
RIS
ON
OF
EL
EC
TR
IC U
TIL
ITY
AN
D N
ON
UT
ILIT
Y G
EN
ER
AT
OR
DA
TA
GE
NE
RA
TIO
N F
OR
TH
E Y
EA
R 1
996
GE
NE
RA
TIN
G U
NIT
SC
AP
AC
ITY
IN M
W
MA
X Y
EA
RL
YC
AP
AC
ITY
IN M
WH
AC
TU
AL
/ E
ST
IMA
TE
DG
EN
ER
ATI
ON
IN M
WH
PE
RC
EN
TU
SE
OF
CA
PA
CIT
YN
UM
BE
R%
ST
AT
E T
OT
AL
AM
OU
NT
% S
TA
TE
TO
TA
LA
MO
UN
T%
ST
AT
ET
OT
AL
AM
OU
NT
% S
TA
TE
TO
TA
L
LO
UIS
IAN
AN
ON
UTI
LITY
GE
NE
RA
TO
RS
6738
.1%
2,80
114
.1%
24,5
36,7
6014
.1%
17,4
84,3
9223
.0%
71.3
%
LO
UIS
IAN
AE
LEC
TRIC
UTI
LITI
ES
109
61.9
%17
,019
85.9
%14
9,08
6,44
085
.9%
58,6
43,0
0077
.0%
39.3
%
TO
TA
L17
610
0%19
,820
100%
173,
623,
200
100%
76,1
27,3
9210
0%43
.8%
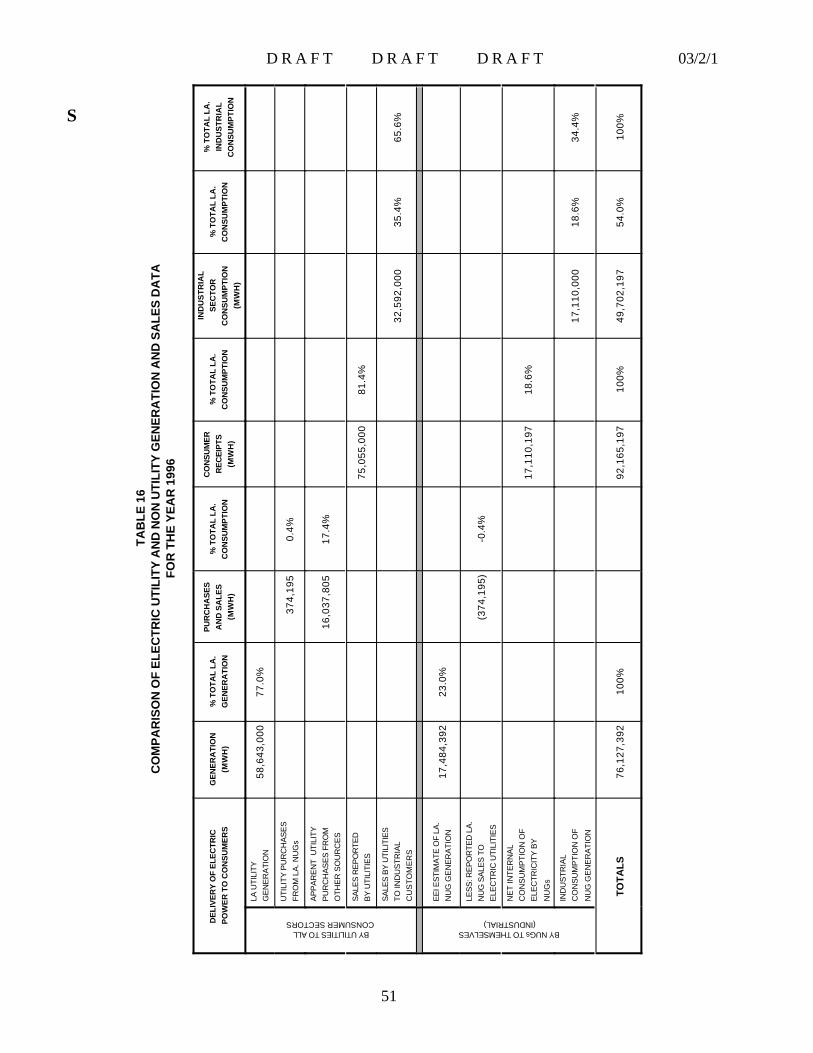
D R A F T D R A F T D R A F T 03/2/1
51
ST
AB
LE
16
CO
MP
AR
ISO
N O
F E
LE
CT
RIC
UT
ILIT
Y A
ND
NO
N U
TIL
ITY
GE
NE
RA
TIO
N A
ND
SA
LE
S D
AT
AF
OR
TH
E Y
EA
R 1
996
DE
LIV
ER
Y O
F E
LEC
TRIC
PO
WE
R T
O C
ON
SU
ME
RS
GE
NE
RA
TIO
N(M
WH
)%
TO
TA
L L
A.
GE
NE
RA
TIO
N
PU
RC
HA
SE
SA
ND
SA
LE
S(M
WH
)
% T
OT
AL
LA
.C
ON
SU
MP
TIO
N
CO
NS
UM
ER
RE
CE
IPTS
(MW
H)
% T
OT
AL
LA
.C
ON
SU
MP
TIO
N
IND
US
TR
IAL
SE
CTO
RC
ON
SU
MP
TIO
N(M
WH
)
% T
OT
AL
LA
.C
ON
SU
MP
TIO
N
% T
OT
AL
LA
.IN
DU
ST
RIA
LC
ON
SU
MP
TIO
N
BY UTILITIES TO ALLCONSUMER SECTORS
LA U
TILI
TYG
EN
ER
ATI
ON
58,6
43,0
0077
.0%
UTI
LITY
PU
RC
HA
SE
SF
RO
M L
A. N
UG
s37
4,19
50.
4%
AP
PA
RE
NT
UTI
LITY
PU
RC
HA
SE
S F
RO
MO
THE
R S
OU
RC
ES
16,0
37,8
0517
.4%
SA
LES
RE
PO
RTE
DB
Y U
TILI
TIE
S75
,055
,000
81.4
%
SA
LES
BY
UTI
LITI
ES
TO IN
DU
STR
IAL
CU
ST
OM
ER
S32
,592
,000
35.4
%65
.6%
BY NUGs TO THEMSELVES(INDUSTRIAL)
EE
I ES
TIM
ATE
OF
LA.
NU
G G
EN
ER
ATI
ON
17,4
84,3
9223
.0%
LES
S: R
EP
OR
TED
LA
.N
UG
SA
LES
TO
ELE
CTR
IC U
TILI
TIE
S(3
74,1
95)
-0.4
%
NE
T IN
TER
NA
LC
ON
SU
MP
TIO
N O
FE
LEC
TRIC
ITY
BY
NU
Gs
17,1
10,1
9718
.6%
IND
US
TRIA
LC
ON
SU
MP
TIO
N O
F
NU
G G
EN
ER
ATI
ON
17,1
10,0
0018
.6%
34.4
%
TO
TA
LS
76,1
27,3
9210
0%92
,165
,197
100%
49,7
02,1
9754
.0%
100%
D R A F T D R A F T D R A F T 03/2/1
52
ECTION II - LOUISIANA NON UTILITY GENERATION IN THE FUTURE- REALITIES AND POSSIBILITIES
Today, in Louisiana, there are two parallel systems of electric generation. One system, representing one fifthof the state’s generation, is owned and operated by industrial NUGs. The other system, representing four fifthsof the state’s generation, is owned and operated by the regulated electric utilities. The industrial NUG system,which grew in a competitive environment, can produce electricity at 2 to 3 cents per KWH. The electric utilitysystem, which grew limited by a regulatory environment, produces electricity at an average of 6.1 cents perKWH. Similar situations exist in other states. Reasons for how and why these systems exist simultaneouslyare discussed in Appendix A.
These price data suggest that electricity prices for all consumers could be reduced by the introduction ofcompetition into the electricity market. This concept has created a move to deregulate the electrical generationsystem and provide all future electricity generators, NUG or utility, with equal access to electric transmissionsystem.
Reaping the benefits of such comptetion, however, will not be without cost. Non utility generators using newer,more efficient generation technology have the capacity in a competitive generation market to capture substantialmarket share from the utilities. The resulting financial risk to the electric utilities is now well recognized. Theterminology used to describe this risk is “stranded cost.” This term represents the value of utility investedcapital at risk of being lost as a result of competition or in other terms, non-competitive capital. Suggested totalvalues for this capital at risk across the U.S. often exceed $200 billion.
The Regulatory Basis for the Introduction of Competition in Electricity Markets
The federal Energy Policy Act (EPACT) of 1992 has as its intent, not only the conservation of energy, but alsothe encouragement of competition in the marketplace for electricity. In response to EPACT, on April 24,1996, the Federal Energy Regulatory Commission (FERC) issued final rules, Orders No. 888 and 889,designed to promote real competition in the generation and sale of electricity.
The first order, Rule 888, orders the electric utility owners of the electric transmission grid to providenon-discriminatory open access to others. This is intended to make the same transmission services availableto electric utilities available to NUGs as well. The second order, Rule 889, mandates the creation of a real-timeinformation system to assure that transmission owners or their affiliates do not have an unfair competitiveadvantage in using transmission to sell electric power. The overall effect of these Rules is intended to be the“unbundling” or separation of electric power generation and transmission and the potential creation of genuinecompetition in the generation sector of the electricity industry.
Operational Factors Affecting the Effectiveness and Onset Timing of Competition in ElectricityMarkets

D R A F T D R A F T D R A F T 03/2/1
53
This deregulation of electric generation and open access to transmission will have significant effects on theelectric utilities, the NUGs, all electricity consumers, and the natural gas industry as well. NUG ability tocompete with significant success seems assured. They have the ability to introduce new generation technologywhich is more efficient, less capital costly, and more environmentally friendly than the vast majority of theelectric utility generation capacity inventory.
However, the degree to which such competition is invariably effective in an operational sense is based on akaleidoscope of factors, most of which are still controlled by governmental and regulatory processes. Theequally critical factor of time to actual institution of real competition is similarly controlled. Some (but certainlynot all) major factors affecting the degree and timing of real electricity market competition are: ♦ FERC’s Rule 888 explicitly includes decision making by the state electric regulatory commissions.
This is certainly appropriate. However, it will almost certainly create a system which, operationally, willvary from state to state, thus being more fragmented, less simple, and, in some cases, more protectionistof the status quo.
♦ The electric utilities are faced with the loss of income on investment, known as “stranded cost,”amounting to $200 billion dollars or more. These utilities have millions of stockholders. Electric utilitystock occupies a prominent position in the portfolio of almost every pension fund in the nation. Thispresents a powerful political constituency favoring and lobbying for a “go slow and limit utility economiceffects” process in any transition to competition.
♦ Other interest groups who are financially dependent on the operation of electric utilities under the“status quo” will add further weight to the pressure and lobbying described above. This includes producersof fuels which may be adversely affected as well as legislative and regulatory delegations from energyproducing states in which such fuels are produced.
Even if all other factors, technical or economic, are excluded from consideration, those listed above are likelyto present a formidable obstacle to quick or one-sided decisions regarding competition in the electricity market.Many hybrid systems of operation have been proposed. The final degree to which competition will exist is notand cannot be known at this time. Predicting the timing of the onset of any competition is equally difficult.
In the competitive circumstances in which new NUGs would enter such an electricity market, degree ofcompetition and timing of onset are critical financial factors. Any NUG attempting early entry into such amarket takes a serious risk. Failure to accurately predict either the competitive situation or the moment of itsarrival could create fatal financial consequences.
Potential Effects of the New Electricity Market on the Natural Gas Industry
Combined cycle generation is the likely tool of any NUG entering the proposed new competitive electricitymarket. Natural gas is the fuel of choice for such generating plants. It is important, then, to understand whichelectric utility plants are at risk from combined cycle operations and how they are fueled.
D R A F T D R A F T D R A F T 03/2/1
54
To place this in perspective, the replacement values for various utility steam turbine fuels are considered interms of natural gas potentially burned in combined cycle operations at 6.25 ft3 per KWH of electricitygenerated. The resulting values are an upper limit since they assume full and unlimited competition. Thefollowing values are calculated with 1996 data:
• Nuclear generation in Louisiana was 15.765 billion KWH. If replaced by combined cycle generation,this represents a potential increase in natural gas consumption of 98.5 billion ft3 per year.
• Coal fired generation in Louisiana was 18.633 billion KWH. If replaced by combined cyclegeneration, this represents a potential increase in natural gas consumption of 116.5 billion ft3 per year.
• Natural gas fired steam turbine generation in Louisiana was 23.399 billion KWH and used 244.8billion ft3 of natural gas. If replaced by combined cycle generation, this represents a potential loss innatural gas consumption of 98.6 billion ft3 per year because of the higher thermal efficiency of combinedcycle plants (see discussion in Appendix A, Part I).
• Nuclear generation in the U.S. was 674.7 billion KWH. If 20% can be replaced by combined cyclegeneration, this represents a potential increase in natural gas consumption of 843.4 billion ft3 per year.
• Coal fired generation in the U.S. was 1,737.5 billion KWH. If 20% can be replaced by combinedcycle generation, this represents a potential increase in natural gas consumption of 2,171.9 billion ft3 peryear.
• Natural gas fired steam turbine generation in the U.S. was 218.8 billion KWH and used 2,282.2 billionft3 of natural gas. If completely replaced by combined cycle generation, this represents a potential decreasein natural gas consumption of 914.7 billion ft3 due to the higher thermal efficiency of combined cyclegeneration.
The threshold limit which will be used for comparing combined cycle operations with electric utility units is thetotal cost to install and operate such a plant as well as an amount needed for profit. Under total competition,successful competition against an electric utility plant means that that plant is shut down. The threshold numberagainst which electric utility plants may be measured is the sum of total operations and maintenance (O&M)costs plus any percentage of “fixed overhead” which disappear with the closing of the plant. Any electric utilityplant for which this number is significantly above the threshold number for a nearby combined cycle plant is atrisk.
An important key to measuring potential effects of natural gas fired combined cycle plants against electric utilityplants is having threshold numbers calculated for both. Such data are not yet available.
D R A F T D R A F T D R A F T 03/2/1
A-1
APPENDIX ABACKGROUND ON TECHNICAL AND ECONOMIC ISSUES AFFECTING BOTH THE
PAST AND FUTURE OF LOUISIANA NON UTILITY GENERATORS
PART 1 - “PRIME MOVERS,” THE EQUIPMENT DRIVING THE ELECTRIC GENERATORS
All practical processes in commercial use today for generating electricity have as their final stage the need formechanical energy to rotate the moveable part of an electric generator --- a machine is needed to drive thegenerating machine. Other than hydroelectric power which uses the mechanical energy of falling water to turnthe generator, the “front end” of all commercial generation processes is some type of system converting thermal(heat) energy into the necessary mechanical energy at the generator. The device that drives the generator (ora device that converts energy to electricity directly) is known as the “prime mover.”
Focusing on systems which convert thermal or heat energy, there are two different pathways: the boiler -steam turbine system and the combustion turbine system. A hybrid system known as combined cyclecombustion turbine is included with combustion turbines in this discussion.
Steam Turbine Generating Systems
The boiler - steam turbine system is the older of the two, having been invented in the nineteenth century. In theinitial part of this process, a heat source is used to increase the thermal energy level of water by converting highpressure water at a lower temperature to steam at a higher temperature. Typical heat sources may be fuel (e.g.,natural gas, petroleum products, coal, biomass, etc.) burned in a boiler, a nuclear reactor, or direct heat(geothermal, heat producing industrial processes, etc.)
This high energy (high temperature and pressure) steam is then passed through a (steam) turbine extractingenergy and producing lower energy steam (lower pressure and temperature). The resulting expansion andcooling of the high energy steam rotates the turbine converting what was originally thermal energy into thenecessary mechanical energy to drive a generator.
The overall energy efficiency (heat rate) of the steam turbine generation (or any other) process is expressedas useful energy output divided by energy input. For steam turbine generating systems in the U.S., efficiencyis measured as British Thermal Units (BTU) of the net electrical energy out divided by BTU of the heat sourcein. The average heat rate in 1997 for electric utilities in Louisiana for natural gas fired steam turbine generationwas 11,045 BTU heat input per KWH electricity output. During the same year, the average heat rate for coalfired steam turbine generation was 10,652 BTU per KWH. One KWH of electricity equals 3413 BTU.Louisiana gas fired steam generation operated at an overall efficiency of 30.9% in 1997; coal fired steamgeneration operated at an efficiency of 32.0%.
D R A F T D R A F T D R A F T 03/2/1
A-2
Capital costs, operating and maintenance (O&M) costs, and emissions of pollutants are dependent on the typeof heat source used to create steam. Capital costs may vary from $1,000 to over $3,000 per kilowatt (KW)of generating capacity.
Combustion Turbine Generating Systems Combustion turbine systems are the second basic method for providing mechanical energy to electricgenerators. These highly efficient systems evolved in the latter half of the twentieth century and were initiallybased on aircraft jet engines. Energy input into combustion turbines is thermal, typically coming fromcombustion of a gaseous or liquid fossil fuel (e.g., natural gas, coal gasses, petroleum distillates, etc.). Researchhas been conducted into the use of pulverized solid fuels (e.g., coal, petroleum coke, etc.) but, to date, hasproduced few practical results.
In combustion turbine systems, air compressed by an axial compressor (front section) is mixed with fuel andburned in a combustion chamber (middle section). The resulting hot gasses then expand and cool whilepassing through a turbine in the rear section. What was initially thermal energy is converted to mechanicalenergy rotating the turbine. The rotating rear turbine not only runs the axial compressor in the front section butalso provides efficient mechanical (rotational) energy which can be directed to the electric generator. Theexhaust from a combustion turbine can range in temperature between 600 and 1000 degrees Fahrenheit andcontains substantial thermal energy. What is and is not done with this exhaust energy source determines howthe combustion turbine system is used. There are two general types of combustion turbine generating systemsin commercial use today: the simple cycle and the combined cycle.
A simple cycle combustion turbine system is one in which the exhaust from the gas turbine is vented to theatmosphere and its energy lost. Such a system is not particularly efficient (Louisiana utilities, 1997: 12,834BTU per KWH or 26.6% efficiency). They are, however, inexpensive to purchase, are compact, and aresimple to operate. Further, simple cycle combustion turbines can be started up and placed in service morerapidly than any system involving a steam turbine. Simple cycle systems are used by the electric utilities as asource of peaking, backup, or emergency power. Conversely, NUGs do not use simple cycle because theyare fuel inefficient and produce no steam. NUGs are seldom faced with the problem of peaking power.
Typical NUGs in Louisiana operating in industrial electrical generation settings capture the energy content ofthe hot exhaust gasses of the gas turbine. This exhaust stream is directed through a waste heat boiler toproduce steam. The resulting steam may be used in process units for heating, in a steam turbine for generatingelectricity, or both (see Cogeneration, below).
A combustion turbine driving an electric generator and exhausting to a waste heat boiler - steam turbine electricgenerator arrangement is known as a “combined cycle combustion turbine” system (usually shortened tocombined cycle). Such systems have exceptional energy efficiencies. Some large scale combined cyclegeneration systems now require only 6500 BTU energy input per KWH of electricity output. This equates toan efficiency of more than 52%. This is double the efficiency of steam turbine electrical generation systems or,in other terms, half the fuel per unit of electricity.

D R A F T D R A F T D R A F T 03/2/1
A-3
Capital costs, O&M costs, and emissions of pollutants for combined cycle generation of electricity are lowrelative to the same costs for boiler - steam turbine prime movers. Capital costs are typically less than $1,000per KW of generating capacity.
D R A F T D R A F T D R A F T 03/2/1
A-4
PART 2 - COGENERATION Cogeneration, by definition, requires the production and use of steam or hot water in addition to the generationof electricity. This system is efficient because the thermal energy of the steam or hot water taken off thegenerating system can be used down to lower temperatures than would be possible in the generation process.
Some confusion has developed between the terms “cogeneration” and “combined cycle.” The termcogeneration is not specific to either combined cycle combustion turbine generation or steam turbine generation.Either type of prime mover can be used to “cogenerate.” Many of the NUGs that were in operation inLouisiana before the 1970s cogenerated using steam turbine generation which also produced process steam.
Combined cycle combustion turbine generation can be thought of as special case of cogeneration. In thissystem the co-production of steam in a waste heat recovery boiler is also used to generate electricity.
D R A F T D R A F T D R A F T 03/2/1
A-5
PART 3 - THE CURRENT SYSTEM UNDER WHICH ELECTRIC UTILITIES OPERATE
This part provides information intended for understanding the current system under which electric utilitiesoperate. Such an understanding is essential in resolving an entire spectrum of issues in making the newunregulated, competitive market for electricity work.
The System in Effect for Regulating and Compensating Electric Utilities
Starting in the 1930s, during the Great Depression, electric utilities started becoming regulated. Electric utilityoperations were thought to be “natural monopolies” in both generation and transmission activities by economistsof the day. Natural monopoly is a term describing the situation in which consumers are better off being servedby one business entity (a monopoly) than by more than one. Having more than one set of power lines andmore than one set of generating plants was thought to be redundant and more expensive than having just one.So having electric utilities with only one set of facilities in a service area was believed to allow for lowerelectricity prices to the consumers.
Such lower prices would occur if, of course, the monopoly owner of the single set of facilities was regulatedin such a way that monopoly prices could not be charged. But, this immediately raised the question of whatprices should be charged. Since there was no competition, there were no competitive prices against which tojudge electricity prices. It was decided that prices charged by regulated utilities should be limited to providea “fair” return on investments. Further, a fair return was allowed only on those investments which were “usedand useful.”
Another problem with respect to “fair” pricing also occurred. To promote the highest level of economicdevelopment in as many areas as possible in the nation, electric utility regulation from the 1930s until the presenteither strongly encouraged or required regulated electric utilities to serve virtually all customers in their servicearea. This requirement held even in many areas where a company operating on a truly competitive basis wouldhave found constructing and operating electric systems not profitable. The “fair return” on investments, again,served to protect regulated electric utilities from financial harm in return for serving such “unprofitable” areas.
Regulatory bodies were created at both the state and federal levels to make decisions under this systemregarding utility operations and the pricing of electricity to the consumer. A system by which electricity pricesare established was set in place and operates today. Under the currently operative system, electricity pricesor electric rates have long been established using the following general procedure:
♦ The electric utilities estimate, for a year period in the future, their electricity sales and their expenses basedboth on historical data as well as on “known and measurable” factors which are expected to exist in thatfuture year.
♦ The utility then forecasts a level of capital to be in service during this forward year period based both onexisting facilities in service and on new facilities expected to be brought into service.
♦ The utility then proposes a rate of return on this capital in service which is believed to be fair to both theutility and its customers.
D R A F T D R A F T D R A F T 03/2/1
A-6
♦ The dollar amount of forecast capital in service multiplied by the proposed rate of return on capital plusforecast expenses are then added together to determine a total revenue level needed for electric utilityoperations during that future year. In other words, a specific dollar quantity of required revenue isdetermined by two forecasts and a proposed rate of return.
♦ This specific dollar quantity is then divided by the forecast quantity of electricity (KWH) to be deliveredto the utility’s customers. This establishes an average unit electric rate in cents per KWH which willproduce the utility’s needed revenue stream in the future year.
♦ Adjustments are then made for customer classes such as residential, commercial, and industrial.♦ These forecast expenses, capital in service, electricity sales and proposed rate of return along with all
supporting documentation are then presented to the state regulatory body as part of a “rate case.” The ratecase is assigned a docket number and the utility submissions along with all analyses, new proposals,proposed revisions, etc. by regulatory body staff, electric customer groups, and other affected partiesbecome part of a legal process presented in hearings held before commissioners of the state regulatorybody.
♦ After these hearings are completed, the commissioners of the state regulatory body decide upon rateswhich are “fair and equitable” to the utility and its customers. Then the terms and conditions of these ratesare published as “electric tariffs.”
♦ The electricity rates established by this process are in effect until new rates are established in a new ratecase before the utility regulatory body. As a result, rates are typically in effect for periods of three or moreyears.
Effects of the Current Electric Utility Regulatory System on “Competitive” Electricity Rates
This system under which regulated electric utilities operate worked very well from the 1930s through the 1960s. During that period capital costs for differing electric generating technologies did not exist. Steam turbinegeneration was the only alternative available. Wide swings in operating costs did not occur. Price andavailability of all fuels was constant.
After about 1970, however, both the capital cost and operating expense environment changed. There werealternatives in generation technology, steam turbine or combustion turbine, with differing capital and operatingcosts. At that time there also began a series of great swings in both the real and perceived prices andavailability of fuels. Under such conditions of change, components of the regulatory system have had some veryspecific consequences on the way in which electric utilities operated and on where their focus has been placed.Some of these are:
♦ The current system forces the utilities to focus on invested capital which is usefully in service. Under thesystem, such capital is their sole source of income. There are two immediate consequences of thiscircumstance:
First, there is a powerful tendency to pursue strategies which are capital intensive. Given that anyargument can be made in favor of lower operating costs for a generating technology with higherinitial costs, that technology will be preferred over a generating technology which has lower initial

D R A F T D R A F T D R A F T 03/2/1
A-7
costs. Further, should the passing of time show such a capital decision to be poor, more problemsarise because of a second consequence.
For regulated electric utilities, once a capital decision is put in place, it tends to be irrevocable.Once a generating plant is in service, there is no way under the current regulatory system that theutility can replace it with newer, more efficient technology. Invested capital or sunk costs areeverything; removing an operative plant from service irreplaceably reduces the sole basis on whichthe utility earns net income. This is precisely the reverse of the situation facing competitiveindustry. There, “sunk costs don’t count.” With revenues based on product cost not on capitalinvested, competitive industry replaces technologically inefficient plant and equipment on animmediate basis.
♦ The current system removes focus from operating expenses since their level is irrelevant to net income. Theimmediate consequence of this is a tendency for such expenses to exceed levels considered normal incompetitive industry. Further, once the expenses are “locked in,” they are difficult to reduce. The exampleof SWEPCO shown in the “Sales of Electricity to Utilities by NUGs” part in the body of this reportillustrates this situation.
SWEPCO negotiated a natural gas supply contract with a supplier of natural gas prior to 1985. Thiscontract had a significant effect on SWEPCO’s weighted average cost of gas (WACOG). Whether ornot the initial pricing of natural gas under this contract was “high” is not known. The terms of the contract,however, caused SWEPCO’s WACOG to be significantly higher than that of other electric utilities inLouisiana from 1985 through 1993. No renegotiation of the contract occurred until regulatory interventionin 1993. Lower gas prices were reached after this process.
♦ The current system produces electric rates which are not only based on forecasts but are relatively longlasting. Consequences of this circumstance are electricity rates which are slow to react to economicchanges. Because of this inability of prices to react to such changes, at any given point in time, electricityrates are likely to be more or less favorable to either consumers or utilities than was intended by regulators.
D R A F T D R A F T D R A F T 03/2/1
A-8
PART 4 - DIVERGENT PATHWAYS BETWEEN ELECTRICITY GENERATORS INREGULATED VS. COMPETITIVE ENVIRONMENTS Until the late 1960s, parties wishing to generate electricity had, essentially, one basic technology as a choice -a steam turbine driven generator. The only differentiating choices lay in the thermal sources (i.e., fuels) bywhich the steam was generated. In fact, the electric utilities, during the latter two decades of this period,actually became more competitive because their larger boiler/steam turbine systems had economy of scaleadvantages over the smaller systems of potential NUGs.
With the successful development of combustion turbine systems for driving electric generators, however, thegeneration prime mover pathways of competitive industry and non-competitive electric utilities diverged.Competitive industry took note of the overwhelming fuel efficiencies of combustion turbine based prime moversas well as the low capital cost of such systems. In spite of looming natural gas supply shortages, industrialNUGs chose combustion turbine based generation wherever possible to minimize the cost of electricityimbedded in their product cost. The key here is reliable low cost electricity. Only in low cost electricity couldthese industrial NUGs remain competitive marketing the products they manufactured. High fuel efficiency andlow capital costs were apparent and persuasive arguments in these firms making correct decisions to usecombustion turbine technology.
For the electric utilities, however, choices were made according to different criteria. Neither at that time noreven today, do electric utilities make money by producing least expensive electricity. They make money byinvesting capital. This is a direct consequence of the regulatory system, discussed above, by which theseutilities are compensated.
Having higher capital costs, steam turbine driven generation was favored in the system under which electricutilities operated. If there were concerns over the availability of natural gas at reasonable rates, even in regionssuch as Louisiana which traditionally used natural gas fired boilers, such problems could be circumvented bythe use of coal fired boilers or nuclear reactors. As even greater incentive, coal fired boiler/steam turbinesystems allowed greater investment in capital than did natural gas based systems and nuclear reactor systemsallowed even greater investment opportunities than did coal fired systems. Long before the advent of the legallimitations initiated in 1978 by PURPA and the Powerplant and Industrial Fuel Use Act, industrial NUGs inLouisiana took one generation path and the electric utilities driven by regulatory law and incentives tookanother.
Adherence to these respective pathways was cemented in place in 1978 by the effects of legislation designedto “fix” the so-called energy crises. The Powerplant and Industrial Fuel Use Act (FUA) of that year forbadeuse of natural gas as a boiler fuel by 1990. Before 1978, the electric utilities had increasingly pursued the coalor nuclear steam turbine routes to powering generation as a result of powerful regulatory incentives. After1978, those incentives became legal requirements.
The FUA, together with the Public Utilities Regulatory Policies Act (PURPA) of 1978, also set incentives,based in law, for the cogenerating industrial NUGs in Louisiana to continue the combined cycle route toward
D R A F T D R A F T D R A F T 03/2/1
A-9
generating electricity. Incentives that had existed before 1978 still existed. These NUGs were cogeneratorsand combined cycle was the most efficient way to cogenerate. These incentives continued to exist because,under the FUA, cogenerators were exempt from the ban on using natural gas. Under PURPA, there wereadditional incentives in the form of potential sales to electric utilities. PURPA mandated that the electric utilitiesbuy electricity from cogenerators at the utilities’ avoided cost.
This divergence continued even after the repeal of FUA limitations on use of natural gas by the utilities. InLouisiana, new electric capacity was not needed. Any construction of combined cycle facilities by electricutilities would, therefore, replace existing investment. Under existing utility regulation, the utilities lacked theeconomic and financial capacity to replace operating investment. So no utility transition to combined cyclegeneration was possible.
The net result of this divergence of generation methodology by NUGs in a competitive environment and electricutilities in a regulated environment has been the creation of two distinct systems of generation in Louisiana. Theone created in a competitive environment by the industrial NUGs is based on combined cycle generationtechnology. This system produced electricity at 4.3 cents per KWH, the 1996 average industrial electricityrate in Louisiana. The other system created under regulatory constraints by the electric utilities is based onsteam turbine technology. That system produced electricity at an average rate of 7.5 cents per KWH in 1996(see Table 4).

D R A F T D R A F T D R A F T 03/2/1
D R A F T D R A F T D R A F T 03/2/1
B-1
APPENDIX B - TABLESPURPA QUALIFIED FACILITY (QF) POWER PURCHASES BY UTILITIES
POWER PURCHASED, COST, AND AVERAGE COST
MONTHLY BY UTILITY AND QFFOR 1990 - 1997
NOTE: Data for 1985 - 1989 can be found in the November 1996 edition of this report, or bycontacting the Technology Assessment Division at 504-342-2122.

D R A F T D R A F T D R A F T 03/2/1
Related Documents