1 NSAIDs inhibit vascular smooth muscle cell proliferation by enabling the Ca 2+ -dependent inactivation of CRAC/Orai channels normally prevented by mitochondria Eva Muñoz 1 , Ruth A. Valero 1 , Ariel Quintana 2,3 , Markus Hoth 2 , Lucía Núñez 1 and Carlos Villalobos 1,4 From the 1 Institute of Molecular Biology and Genetics (IBGM), University of Valladolid and Spanish Research Council (CSIC), 47003 Valladolid, Spain. 2 Department of Biophysics, University of Saarland, 66421 Homburg, Germany. *This work was supported by grants SAN191/VA1806, CSI12A08 from Junta de Castilla y León, Spain, BFU2009-0867 from Ministerio de Ciencia e Innovación, Spain and PI07/0766 from Instituto de Salud Carlos III, Spain and the Deutsche Forschungsgemeinschaft (Grant A3 in the Sonderforschungsbereich 530). 3 Present address Harvard Public School of Medicine. Boston, MA 02115. USA 4 To whom correspondence should be addressed: Fax: 34 983 184800; E-mail: [email protected] Abnormal vascular smooth muscle cell (VSMC) 5 proliferation contributes to occlusive and proliferative disorders of the vessel wall. Salicylate and other non-steroidal anti- inflammatory drugs (NSAIDs) inhibit VSMC proliferation by an unknown mechanism unrelated to anti-inflammatory activity. In search for this mechanism, we have studied the effects of salicylate and other NSAIDs on subcellular Ca 2+ homeostasis and Ca 2+ -dependent cell proliferation in rat aortic A10 cells, a model of neointimal VSMC. We found that A10 cells displayed both store-operated Ca 2+ entry (SOCE) and voltage-operated Ca 2+ entry (VOCE) being the former more important quantitatively than the latter. Inhibition of SOCE by specific Ca 2+ released-activated Ca 2+ (CRAC/Orai) channels antagonists prevented A10 cell proliferation. Salicylate and other NSAIDs including ibuprofen, indomethacin and sulindac inhibited SOCE and thereby Ca 2+ -dependent, A10 cell proliferation. SOCE, but not VOCE, induced mitochondrial Ca 2+ uptake in A10 cells and mitochondrial depolarization prevented SOCE, thus suggesting that mitochondrial Ca 2+ uptake controls SOCE (but not VOCE) in A10 cells. NSAIDs depolarized mitochondria and prevented mitochondrial Ca 2+ uptake suggesting that they favor the Ca 2+ -dependent inactivation of CRAC/Orai channels. NSAIDs also inhibited SOCE in rat basophilic leukemia (RBL) cells where mitochondrial control of CRAC/Orai is well established. NSAIDs accelerate slow inactivation of CRAC currents in RBL cells under weak Ca 2+ buffering conditions but not in strong Ca 2+ buffer, thus excluding that NSAIDs inhibit SOCE directly. Taken together, our results indicate that NSAIDs inhibit VSMC proliferation by facilitating the Ca 2+ -dependent inactivation of CRAC/Orai channels that normally is prevented by mitochondria clearing of entering Ca 2+ . Increased VSMC proliferation, a process controlled by Ca 2+ channel switching, is a key event in the development of atherosclerosis, restenosis and other occlusive and proliferative disorders of the vasculature (1,2). Salicylate, the major aspirin metabolite, and other NSAIDs may induce direct, platelet-independent effects on the vascular wall (3-5). For example, salicylate effectively inhibits VSMC proliferation and DNA synthesis in vivo and in vitro without inducing cellular toxicity or apoptosis (4). 5 The abbreviations used are: VSMC, vascular smooth mucle cells; NSAIDs, non-steroidal anti-inflammatory drugs; SOCE, store-operated Ca 2+ entry; VOCE, voltage-operated Ca 2+ entry; CRAC, Ca 2+ -release activated current; RBL, rat basophilic leukemia; 2-APB, 2-aminoethoxydiphenyl borate; [Ca 2+ ]cyt, cytosolic Ca 2+ concentration; [Ca 2+ ]mit, mitochondrial Ca 2+ concentration. http://www.jbc.org/cgi/doi/10.1074/jbc.M110.198952 The latest version is at JBC Papers in Press. Published on March 14, 2011 as Manuscript M110.198952 Copyright 2011 by The American Society for Biochemistry and Molecular Biology, Inc. by guest, on February 21, 2013 www.jbc.org Downloaded from

Welcome message from author
This document is posted to help you gain knowledge. Please leave a comment to let me know what you think about it! Share it to your friends and learn new things together.
Transcript
1
NSAIDs inhibit vascular smooth muscle cell proliferation by
enabling the Ca2+
-dependent inactivation of CRAC/Orai
channels normally prevented by mitochondria
Eva Muñoz1, Ruth A. Valero
1, Ariel Quintana
2,3, Markus Hoth
2, Lucía Núñez
1 and
Carlos Villalobos1,4
From the 1Institute of Molecular Biology and Genetics (IBGM), University of Valladolid and
Spanish Research Council (CSIC), 47003 Valladolid, Spain. 2Department of Biophysics, University
of Saarland, 66421 Homburg, Germany.
*This work was supported by grants SAN191/VA1806, CSI12A08 from Junta de Castilla y León,
Spain, BFU2009-0867 from Ministerio de Ciencia e Innovación, Spain and PI07/0766 from
Instituto de Salud Carlos III, Spain and the Deutsche Forschungsgemeinschaft (Grant A3 in the
Sonderforschungsbereich 530). 3Present address Harvard Public School of Medicine. Boston, MA 02115. USA
4To whom correspondence should be addressed: Fax: 34 983 184800; E-mail: [email protected]
Abnormal vascular smooth muscle cell (VSMC)5
proliferation contributes to occlusive and
proliferative disorders of the vessel wall.
Salicylate and other non-steroidal anti-
inflammatory drugs (NSAIDs) inhibit VSMC
proliferation by an unknown mechanism
unrelated to anti-inflammatory activity. In search
for this mechanism, we have studied the effects
of salicylate and other NSAIDs on subcellular
Ca2+
homeostasis and Ca2+
-dependent cell
proliferation in rat aortic A10 cells, a model of
neointimal VSMC. We found that A10 cells
displayed both store-operated Ca2+
entry (SOCE)
and voltage-operated Ca2+
entry (VOCE) being
the former more important quantitatively than
the latter. Inhibition of SOCE by specific Ca2+
released-activated Ca2+
(CRAC/Orai) channels
antagonists prevented A10 cell proliferation.
Salicylate and other NSAIDs including
ibuprofen, indomethacin and sulindac inhibited
SOCE and thereby Ca2+
-dependent, A10 cell
proliferation. SOCE, but not VOCE, induced
mitochondrial Ca2+
uptake in A10 cells and
mitochondrial depolarization prevented SOCE,
thus suggesting that mitochondrial Ca2+
uptake
controls SOCE (but not VOCE) in A10 cells.
NSAIDs depolarized mitochondria and
prevented mitochondrial Ca2+
uptake suggesting
that they favor the Ca2+
-dependent inactivation
of CRAC/Orai channels. NSAIDs also inhibited
SOCE in rat basophilic leukemia (RBL) cells
where mitochondrial control of CRAC/Orai is
well established. NSAIDs accelerate slow
inactivation of CRAC currents in RBL cells
under weak Ca2+
buffering conditions but not in
strong Ca2+
buffer, thus excluding that NSAIDs
inhibit SOCE directly. Taken together, our
results indicate that NSAIDs inhibit VSMC
proliferation by facilitating the Ca2+
-dependent
inactivation of CRAC/Orai channels that
normally is prevented by mitochondria clearing
of entering Ca2+
.
Increased VSMC proliferation, a process
controlled by Ca2+
channel switching, is a key
event in the development of atherosclerosis,
restenosis and other occlusive and proliferative
disorders of the vasculature (1,2). Salicylate, the
major aspirin metabolite, and other NSAIDs may
induce direct, platelet-independent effects on the
vascular wall (3-5). For example, salicylate
effectively inhibits VSMC proliferation and
DNA synthesis in vivo and in vitro without
inducing cellular toxicity or apoptosis (4).
5The abbreviations used are: VSMC, vascular smooth mucle
cells; NSAIDs, non-steroidal anti-inflammatory drugs; SOCE,
store-operated Ca2+ entry; VOCE, voltage-operated Ca2+ entry;
CRAC, Ca2+-release activated current; RBL, rat basophilic
leukemia; 2-APB, 2-aminoethoxydiphenyl borate; [Ca2+]cyt, cytosolic Ca2+ concentration; [Ca2+]mit, mitochondrial Ca2+
concentration.
http://www.jbc.org/cgi/doi/10.1074/jbc.M110.198952The latest version is at JBC Papers in Press. Published on March 14, 2011 as Manuscript M110.198952
Copyright 2011 by The American Society for Biochemistry and Molecular Biology, Inc.
by guest, on February 21, 2013
ww
w.jbc.org
Dow
nloaded from
2
A series of NSAIDs including aspirin, ibuprofen,
indomethacin and sulindac induce a dose-
dependent inhibition of proliferation in A10 cells
(6,7), a VSMC cell line derived from embryonic
rat aorta. The effects of NSAIDs occur in the
absence of cytotoxicity and are independent of
cyclooxygenase (7). Aspirin treatment also
inhibits neointimal proliferation in dogs fed with
a cholesterol-enriched diet (8) and prevents the
development of atherosclerosis in rabbits (9).
Therefore, NSAIDs inhibit VSMC proliferation
and show salutary effects in the treatment of
vascular proliferative disorders by a yet
unknown mechanism of action unrelated to anti-
inflammatory activity.
Intracellular Ca2+
is a major trigger for
vasoconstriction and a stimulus for VSMC
proliferation (1,2,10). Several Ca2+
channels
participate in regulating intracellular Ca2+
including voltage-operated and store-operated
Ca2+
channels (10,11). SOCE is activated after
the emptying of intracellular Ca2+
stores by
physiological stimuli and is involved in cell
proliferation in several cell types including T
cells (12,13). In these cells, SOCE requires not
only the activating signal from the empty store
but also the close proximity of functional
mitochondria acting as Ca2+
sinks to prevent the
strong Ca2+
-dependent inactivation of SOC
channels (14-18). It is unknown whether
mitochondria control SOCE in VSMCs or not.
Recently, two important proteins involved in
SOCE have been discovered: Stim1, a sensor of
the Ca2+
content of the store (19), and Orai1, a
plasma membrane store-operated Ca2+
channel
(20). Both proteins have been recently involved
in SOCE in VSMCs (21-25) although other
proteins, including members of the TRPC family
of cation channels, might be involved in SOCE
as well (26-28). SOCE and the novel proteins
Stim1 and Orai1 may be involved in VSMC
proliferation in vitro and in vivo. Knock down of
Stim1 decreases SOCE, inhibits cAMP response
element binding protein (CREB) transcription
factor activation and prevents human coronary
artery VSMC proliferation (25,29).
Ca2+
handling is altered when arterial myocytes
progress from a contractile to a proliferative
phenotype. In the proliferative phenotype, the
cells show increased SOCE and Stim and Orai
proteins are up-regulated (30). Furthermore,
proliferating arterial myocytes have up-regulated
Stim1 and its knockdown prevents nuclear factor
of activated T cell -dependent transcription
activity and growth-factor induced proliferation
(31). Stim1 knock down also prevents neointima
formation and restenosis in animal models of
injured carotid artery (31,32). Rat aortic VSMCs
display a SOC quite similar to the classic Ca2+
release-activated Ca2+
current (Icrac, 33) and the
knockdown of either Stim1 or Orai1 (but not
Orai2, Orai3, TRPC1,4 or 6) inhibits SOCE,
Icrac and VSMC proliferation and migration
(29). Thus, Orai1 and Stim1-dependent SOCE
may play an important role in VSMC
proliferation. It is not surprising, therefore, that
these proteins have been proposed as candidate
targets for proliferative disorders of the vascular
wall (31,32).
We have investigated whether salicylate and
other NSAIDs might prevent VSMC
proliferation acting on signals controlling SOCE
activity. First, we have characterized SOCE and
its contribution to cell proliferation in A10 rat
aortic cells, a model of neointimal VSMCs (34).
Second, we have asked whether NSAIDs prevent
A10 cell proliferation acting on SOCE. Finally,
the possible mechanism of SOCE inhibition was
investigated.
EXPERIMENTAL PROCEDURES
Materials-Fura2/AM, TMRM and
coelenterazines are from Invitrogen (Carlsbad,
CA). LaCl3, N-(4-[3,5-bis(trifluoromethyl)-1H-
pyrazol-1-yl]phenyl)-4-methyl-1,2,3-thiadiazole-
5- carboxamide (BTP2) and 2-
aminoethoxydiphenyl borate (2-APB) are from
Calbiochem (San Diego, CA). Thapsigargin and
Nifedipine are from Alomone Labs (Jerusalem,
Israel). Media and sera are from Lonza (Basel,
Switzerland). Other chemicals are from Sigma-
Aldrich (St. Louis, MO) or Merck (Whitehouse
Station, NJ). Mitochondria-targeted GFP-
aequorin and A10 cells were kindly donated by
Profs. Philippe Brulet (CNRS, Paris, France) and
Santiago Lamas (CSIC, Madrid, Spain),
respectively.
by guest, on February 21, 2013
ww
w.jbc.org
Dow
nloaded from
3
Cell Culture-A10 cells were cultured in
Dulbecco´s Modified Eagle´s medium (DMEM)
supplemented with glutamine and antibiotics.
RBL-2H3 cells were cultured in MEM Alpha
Medium (Invitrogen, 22561-021) supplemented
with 15% fetal bovine serum (Invitrogen, 10270-
106), 1% Glutamax (Invitrogen, 35050-038) and
1% PenStrep (Invitrogen, 15140-122), which
contains 10.000 units/ml penicillin and 10.000
µg/ml streptomycin. Cells were continuously
maintained in log-phase growth at 37 °C with
5% CO2. Cells were prepared at a concentration
of 3000 cells/well 24–48 h before patch-clamp
and imaging experiments.
Store-operated and voltage-operated Ca2+
entry-SOCE was monitored as reported earlier
(35) by imaging the rise in cytosolic Ca2+
concentration ([Ca2+
]cyt) that follows Ca2+
addition to cells with depleted Ca2+
stores.
VOCE was measured by imaging the rise in
[Ca2+
]cyt induced by depolarization with high K+
(75 mM) instead of Na+. A10 cells were plated at
about 17x104 cells/ml (10x10
3 cells/60µl) on 12
mm glass coverslips coated with 0.01 mg/ml
poly-L-lysine. After 24 h, cells were loaded with
4 M fura2/AM for 1 h at room temperature,
incubated with thapsigargin (1 M) for 10 min in
Ca2+
-free medium containing (in mM) NaCl,
145; KCl, 5; MgCl2, 1; EGTA, 0.5; glucose, 10;
HEPES/NaOH, 10 (pH, 7.42) and placed on the
stage of an inverted microscope (Zeiss Axiovert
S100 TV). Subsequently, cells were perfused
with pre-warmed (37 ºC) Ca2+
-free medium and
illuminated alternately at 340 and 380 nm before
test solutions. Light emitted at longer
wavelength than 520 nm was recorded with a
Hamamatsu OrcaER digital camera through a
40x oil lens (NA 1.3). Pixel-by-pixel ratios of
consecutive frames were captured and analyzed
using the Aquacosmos software .
Electrophysiology-Patch-clamp experiments
were performed in the tight-seal whole cell
configuration at 21-25 °C. Membrane currents
were acquired with an EPC-9 patch-clamp
amplifier (HEKA). Voltage ramps of 200 ms
duration spanning a range of – 150 to + 100 mV
were delivered from a holding potential of 0 mV
at a rate of 0.5 Hz over a period of 400 s. All
voltage were corrected for a liquid junction
potential of –12 mV between internal and bath
solutions. Currents were filtered at 2.9 kHz and
digitalized at a sampling rate of 10 kHz. To
display the current recordings, currents were
digitally filtered offline at 1 kHz. Pipette and cell
capacitance were electronically cancelled before
each voltage ramp. Current amplitudes at – 130
mV from individual voltage ramp current were
used to depict the temporal development of
currents and analyze current inactivation.
Statistical errors of averaged data are given as
means ± S.E.M analyzing n cells. Standard
external solution was as follows (in mM): 120
NaCl, 2 MgCl2, 10 CaCl2, 10 TEA-Cl, 10 Hepes,
10 glucose, pH 7.2 with NaOH, 300 mosmol l-1
.
Ibuprofen, indomethacin and salicylate were
added to the external solution at a final
concentration of 10 and 100 μM. Cells were pre-
incubated with each compound for 5 min before
patching them. The standard pipette solution for
whole-cell patch-clamp recordings contained (in
mM): 0.05 InsP3, 5x10⁻⁸
TG, 120 Cs-glutamate,
8 NaCl, 10 Cs-BAPTA, 3 MgCl2, 4 CaCl2, 10
HEPES, pH 7.2 with CsOH, 300 mosmol l-1
(resulting in 150 nM free Ca2+
as calculated with
WebMaxC (http://www.stanford.edu/~cpatton
/webmaxc/webmaxcS.htm). To weakly buffer
Ca2+
in the pipette, the following solution was
used (in mM): 1.2 EGTA, 0.05 InsP3, 5x10⁻⁸
TG,
145 Cs-Aspartate, 3 MgCl2, 8 NaCl, Cs-HEPES,
pH 7.2 with CsOH, 280 mosmol l-1
. The
mitochondrial cocktail to preserve mitochondrial
respiration contained (in mM): 5 Mg-ATP, 0.5
Tris-GTP, 2.5 malic acid, 2.5 Na+-pyruvate, 1
NaH2PO4. The mitochondrial cocktail was added
to the weak Ca2+
buffer solution just before
starting the experiment. Data were analyzed
using Igor Pro (Wavemetrics), Pulse (HEKA),
FitMaster (HEKA) and Microsoft Excel
(Microsoft). All values are given as mean ± SEM
(number of cells). 3 or more independent
experiments were performed for each
experimental condition. In case, data points were
normally distributed, an unpaired two-sided
student t-test was used. If normal distribution
could not be confirmed, a non-parameterized test
(Mann-Whitney) was carried out. P-values are
stated in the figure legends.
RT-PCR-Total RNA was extracted from A10
cells using Trizol Reagent (Invitrogen, Carlsbad,
CA). cDNA was made from 2 µg of RNA by
high capacity cDNA Reverse Transcription Kit
(Applied Biosystems, Foster City, CA). The
by guest, on February 21, 2013
ww
w.jbc.org
Dow
nloaded from
4
sense and antisense primers targeting Stim1 and
Orai1 were designed using PRIMER 3 software.
PCR was performed by using the following
primers: for rat Stim1 sense: 5’-TAA CTG GAC
CGT GGA TGA GG-3’, antisense: 3’-GTC CAC
TAA CAC CGC TCA G-5’. For rat Orai1, sense:
5’-TGG TAG CGA TGG TGG AAG TC-3’ and
antisense 3’-TGC CTC AAC TCC AAC ACC
TG-5’. Primers were synthesized by VWR
International Eurolab (Barcelona, Spain).
Amplification started with initial denaturation at
94 ºC for 3 min, then 25–30 cycles with
denaturation at 94 ºC for 60 s, annealing at 60 ºC
for 1 min, and extension at 72 ºC for 30 s and
followed by a final extension at 72 ºC for 10
min. Gel electrophoresis was used to identify the
PCR products in a 1% agarose gel using
ethidium bromide staining.
Cell proliferation-Cells were cultured in
DMEM containing 10% fetal bovine serum and
antibiotics. Cells were plated in wells at about
10x103 in 3 ml and incubated with test solutions
for 15 days. Cell number was determined at day
1 and at day 15 using a hemocytometer. Cell
death was estimated using trypan blue staining.
Mitochondrial potential-A10 cells were
loaded with the mitochondrial potential probe
tetramethyl rhodamine methyl ester (TMRM,
100 nM) for 30 min at room temperature, placed
on the perfusion chamber of a Zeiss Axiovert
S100 TV inverted microscope and superfused
continuously with prewarmed (37 ºC) standard
medium. Fluorescence images were taken at 10 s
intervals with a Hamamatsu OrcaER camera. At
the end of the recording, the mitochondrial
uncoupler carbonyl cyanide-p-
trifluoromethoxyphenylhydrazone (FCCP, 10
M) was perfused for 5 min to collapse
mitochondrial potential (Δ ). The fluorescence
image of TMRM after collapse of Δ was used
as background fluorescence in conditions of total
uncoupling. Fluorescence recordings from
individual cells were expressed as the percent
value of the value just before treatment and
averaged as previously reported (36).
Bioluminescence imaging of mitochondrial
Ca2+
-A10 cells were nucleofected (Amaxa) with
a plasmid containing mitochondria-targeted,
GFP-aequorin. 24 h later, cells were incubated in
standard medium (see above) containing 4 M of
coelenterazine h or n for 2 h at room
temperature. Then, the coverslips were placed in
the stage of inverted microscope (Zeiss Axiovert
S100 TV) equipped with a bottom-port attached,
Hamamatsu VIM photon counting camera
handled with an Argus 20 image and the
Aquacosmos Software. Cells were perfused
continuously with warm (37 ºC), standard
medium and subjected to photon counting
imaging at 10 s intervals. For experiments in
intact cells, cells were perfused with standard
medium. The effects of SOCE on [Ca2+
]mit were
imaged after presentation of 1 mM extracellular
Ca2+
to cells previously treated with thapsigargin
in Ca2+
-free medium. The effects of VOCE on
[Ca2+
]mit were imaged after depolarization with
high K+ medium. For experiments in permeated
cells, A10 cells were permeated with digitonin
20 M in “intracellular” medium (130 mM KCl,
10 mM NaCl, 1 mM MgCl2, 1 mM K3PO4, 0,2
mM EGTA, 1 mM ATP, 20 M ADP, 2 mM
succinate, 20 mM HEPES/KOH, pH, 6.8). Then,
the cells were incubated with the same medium
containing 200 nM Ca2+
(buffered with EGTA)
with or without NSAIDs for 5 min. Finally,
perfusion was switched to “intracellular”
medium containing 10 M Ca2+
(with or without
NSAIDs) for 1 minute. Photonic emissions were
converted to mitochondrial Ca2+
concentration
([Ca2+
]mit) values as detailed elsewhere (37,38).
Cell ATP levels-Cells were seeded in 6-well
plates and cultured in medium containing either
vehicle or different NSAIDs. After 3 days, cells
were washed twice with phosphate buffered
saline (PBS) at 37 ºC and 1 ml of boiling 20 mM
Tris, pH 7.75, 4 mM EDTA solution was added.
After 2 min, samples were centrifuged for 5 min
at 10000 g. ATP was measured later from the
supernatant by the luciferin-luciferase assay
using a Cairn luminometer (Cairn Research,
Kent, UK).
Statistics- When only 2 means were
compared, student’s t test was used. For more
than 2 groups, statistical significance of the data
was assessed by ANOVA and compared using
Bonferroni’s multiple comparison tests.
Differences were considered significant at p <
0.05.
by guest, on February 21, 2013
ww
w.jbc.org
Dow
nloaded from
5
RESULTS
We have characterized SOCE in A10 rat aorta
VSMCs. Fluorescence imaging experiments
show that cells with intact Ca2+
stores (Fig. 1A)
undergo no change in [Ca2+
]cyt when extracellular
Ca2+
is added. However, cells with depleted
stores displayed large increases in [Ca2+
]cyt after
addition of extracellular Ca2+
revealing SOCE. A
second pulse induced a similar rise in [Ca2+
]cyt
(Fig. 1B). Plasma membrane depolarization with
medium containing high K+ concentration
increases also [Ca2+
]cyt revealing VOCE (Fig.
1C). Interestingly, the relative abundance of cells
showing Ca2+
entry and the size of the rise in
[Ca2+
]cyt were larger for SOCE than for VOCE
(Fig. 1D).
To characterize SOCE further in A10 cells and
its role in cell proliferation, we investigated
expression of Orai1 and Stim1, recently involved
in SOCE in other cell types including VSMC
(22-25). Supplementary Fig. 1 shows that A10
cells expressed both Stim1 and Orai1 mRNAs as
determined by RT-PCR. Second, the effects of a
series of antagonists on SOCE and VOCE were
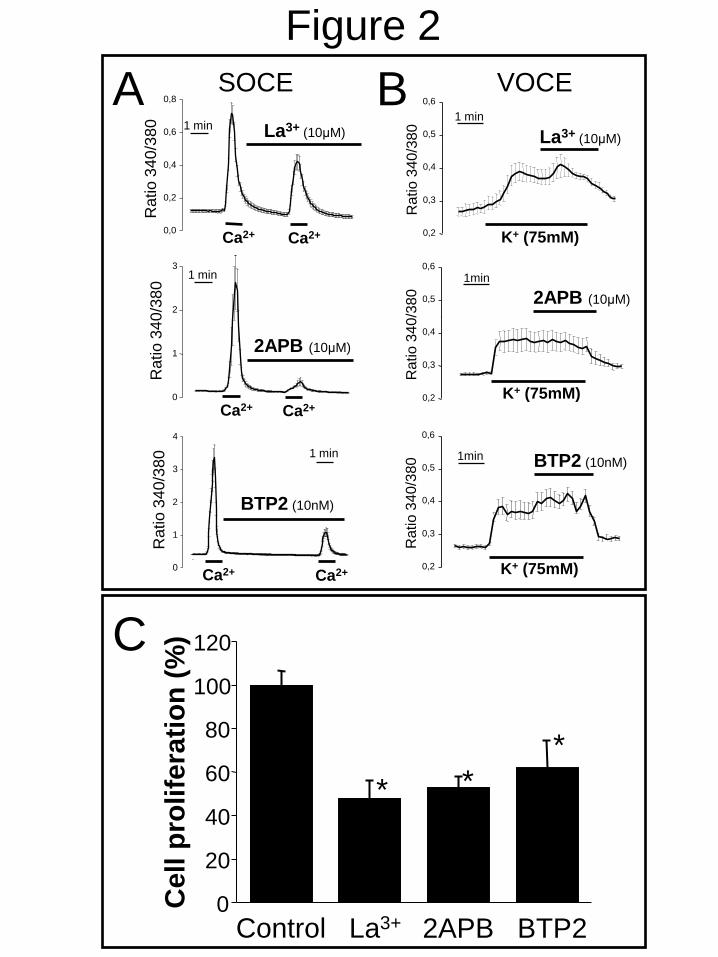
tested in A10 cells. Fig. 2A shows that classic
SOCE antagonists including LaCl3 (La3+
) and 2-
APB inhibited SOCE. BTP2, a novel Icrac
antagonist (39), inhibited also SOCE but at a
much lower concentration (Fig. 2A). SOCE
antagonists did not inhibit VOCE in A10 cells
(Fig. 2B) and dihidropyridines that block VOCE
did not inhibit SOCE (Supplementary Fig. 2).
Third, we studied the effects of SOCE
antagonists on A10 cell proliferation. La3+
, 2-
APB and BTP2 inhibited A10 cell proliferation
at the same concentrations that prevent SOCE
(Fig. 2C) consistently with a role for SOCE in
A10 cell proliferation.
As reported above salicylate and other NSAIDs
show salutary effects in the vascular wall and
prevent VSMC proliferation by a yet unknown
mechanism unrelated to anti-inflammatory
activity (3-9). Fig. 3 shows that salicylate
inhibits A10 cell proliferation in a dose-
dependent manner. Other NSAIDs including
ibuprofen, sulindac and indomethacin inhibited
also A10 cell proliferation at therapeutic
concentrations. R-flurbiprofen, an optic
enantiomer lacking anti-inflammatory activity,
inhibits also A10 cell proliferation in a dose-
dependent manner. In search for the anti-
proliferative mechanism we have investigated
the effects of NSAIDs on SOCE in A10 cells.
Salicylate, ibuprofen, indomethacin and sulindac
inhibited SOCE significantly in A10 cells (Fig.
4). Similar results were obtained with R-
flurbiprofen (Supplementary Fig. 3). Inhibition
of SOCE by salicylate is also observed even
when salicylate is added after the rise in [Ca2+
]cyt
induced by Ca2+
pulse in store-depleted cells
(Fig. 5A). NSAIDs could inhibit A10 cell
proliferation acting also on VOCE. However,
none of the NSAIDs tested inhibited VOCE in
A10 cells (Fig. 5B-F). Interestingly, addition of
NSAIDs during the depolarizing pulse promoted
rather an small rise in [Ca2+
]cyt. Thus, NSAIDs
inhibit Ca2+
-dependent cell proliferation in A10
cells acting on SOCE but not on VOCE.
Consistently with the role of Ca2+
entry in
proliferation, chelating extracellular Ca2+
also
largely inhibited A10 cell proliferation whereas
the aequimolar addition of excess Ca2+
did not
inhibit proliferation, indicating that EGTA had
no toxic effects (Supplementary Fig. 4). In
addition, NSAID (indomethacin) inhibited Ca2+
-
dependent proliferation but had no further effect
in the absence of extracellular Ca2+
(Supplementary Fig. 4).
NSAIDs may inhibit SOCE acting directly on
CRAC channels or modulating a SOCE
regulatory mechanism. To address this issue we
have investigated the effects of NSAIDs on Icrac
in RBL cells. We used RBL cells because of two
reasons. First, Icrac is large and well
characterized in these cells (15). Second, a
strong mechanism of regulation of Icrac and
SOCE by mitochondria in RBL cells is also well
characterized (15,16). Consistently, we found
that RBL cells displayed a robust SOCE that was
nearly abolished by mitochondrial uncoupling
(Supplementary Fig. 5). We tested the effects of
salicylate, ibuprofen, indomethacin and sulindac
on SOCE in RBL cells. We found that all tested
NSAIDs inhibited SOCE in RBL cells just as
they did in A10 cells (Supplementary Fig. 5).
Next we tested the effects of NSAIDs on
CRAC/ORAI channel activity in RBL cells
directly using the whole cell patch-clamp
by guest, on February 21, 2013
ww
w.jbc.org
Dow
nloaded from

6
configuration. Fig. 6 shows the typical inward
rectifying I-V relationship for ICRAC at 2, 100 and
400 sec after starting recording in control cells.
Neither salicylate, ibuprofen nor indomethacin
inhibited Icrac in RBL cells studied under
conditions of strong Ca2+
buffering (10 mM
BAPTA). Under this condition the inflowing
Ca2+
is rapidly buffered by the Ca2+
chelator and
thereby reducing the Ca2+
dependent channel
inactivation efficiently (Fig. 6B,C). The
statistical analysis shows that in these conditions
NSAIDs have no direct effects on CRAC/ORAI
channel activity (Fig. 6D). However, under weak
Ca2+
buffering condition (1.2 mM EGTA),
mitochondrial Ca2+
uptake has been reported to
be essential for reducing the accumulation of
incoming Ca2+
close to sites that govern Ca2+
dependent CRAC channel inactivation (14-16).
Indeed, mitochondrial depolarization induces
significantly inhibition of Icrac (13-16). In order
to keep the capability of mitochondria to take up
Ca2+
during ICRAC recording, a cocktail of several
compounds was supplied to the pipette solution
(see Experimental Procedures). This
mitochondrial cocktail help to maintain the
mitochondrial potential (Δ ) and the subsequent
long-lasting activity of CRAC/ORAI channel
activity. Fig 6E shows the time-course of ICRAC
in weak Ca2+
buffer in the presence of
mitochondrial cocktail. However, in presence of
protonophore CCCP or specific mitochondrial
uniporter blockers ruthenium red or ruthenium
360, the long-lasting ICRAC in cells dialyzed with
cocktail was significantly reduced (Fig. 6E). The
same is true for indomethacin, salicylate and
ibuprofen treated cells (Fig. 6F). Thus, only
under weak Ca2+
buffering condition CRAC is
significantly prevented by the uncoupler CCCP,
ruthenium derivatives and NSAIDs (Fig. 6G).
The above observations provide important clues
regarding the mechanism of inhibition of SOCE
by NSAIDs. They suggest that NSAIDs promote
the Ca2+
-dependent inactivation of CRAC
channels by preventing the ability of
mitochondria to take up Ca2+
. To test this
possibility we have investigated whether
mitochondria controls SOCE in A10 cells just as
they do in Jurkat T and RBL cells (13-16). In the
first place we studied whether Ca2+
entry induced
by SOCE induces mitochondrial Ca2+
uptake.
For this end, A10 cells were transfected with
mitochondria-targeted aequorin and subjected to
bioluminescence imaging for monitoring of
mitochondrial Ca2+
concentration ([Ca2+
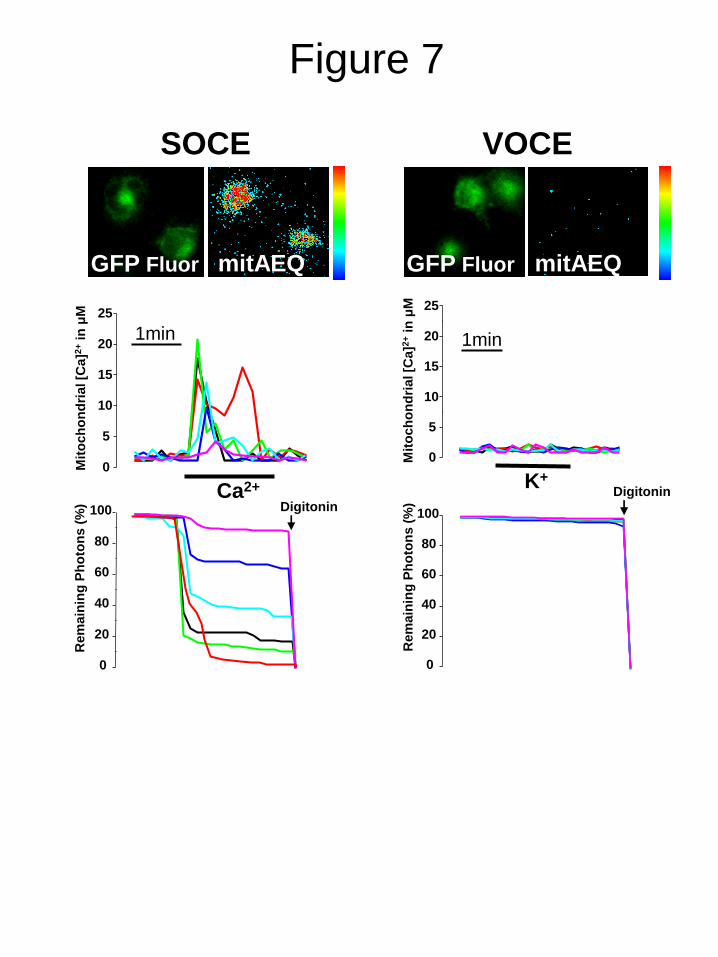
]mit). Fig.
7A shows that Ca2+
pulses to cells with depleted
stores induced a rise in [Ca2+
]mit indicating that
mitochondria are sensitive to rises in [Ca2+
]cyt
induced by SOCE. However, depolarization with
high K+ failed to increase [Ca
2+]mit in any of the
A10 cells tested (Fig. 7B). These data suggest,
but do not proof, that mitochondria are not
sensitive to [Ca2+
]cyt rises induced by VOCE in
A10 cells. This effect is probably due to the low
rise in [Ca2+
]cyt induced by VOCE (Fig. 1). Next
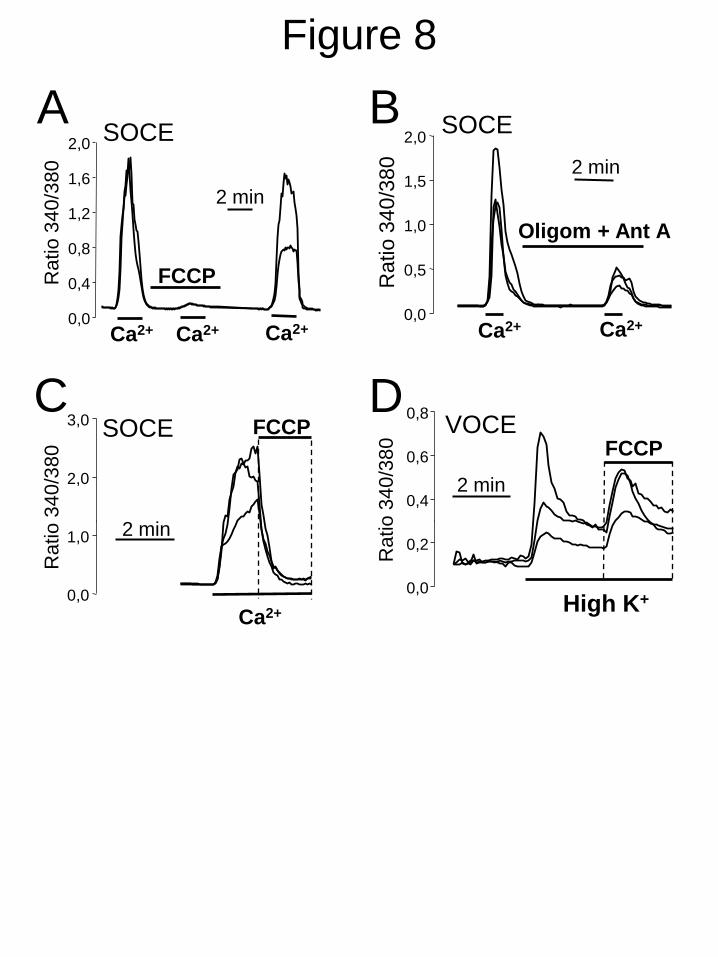
we investigated the effects of mitochondrial
depolarization on SOCE. Fig. 8A shows that Δ
collapse induced by FCCP (+ oligomycin)
inhibits SOCE in a reversible manner in A10
cells. Similar results were obtained with
Antimycin A (+ oligomycin) to depolarize
mitochondria (Fig. 8B). Salicylate did not
increase the effect of FCCP on SOCE further
(Supplementary Fig. 6) indicating that both
FCCP and NSAID act by the same mechanism.
FCCP also decreased SOCE when presented
after Ca2+
re-addition (Fig. 8C). Interestingly,
addition of FCCP after depolarization with high
K+ induced an small rise in [Ca
2+]cyt, a behavior
resembling the effects of NSAIDs (Fig. 5). Thus,
mitochondrial uncoupling or depolarization
inhibits SOCE but not VOCE in A10 cells.
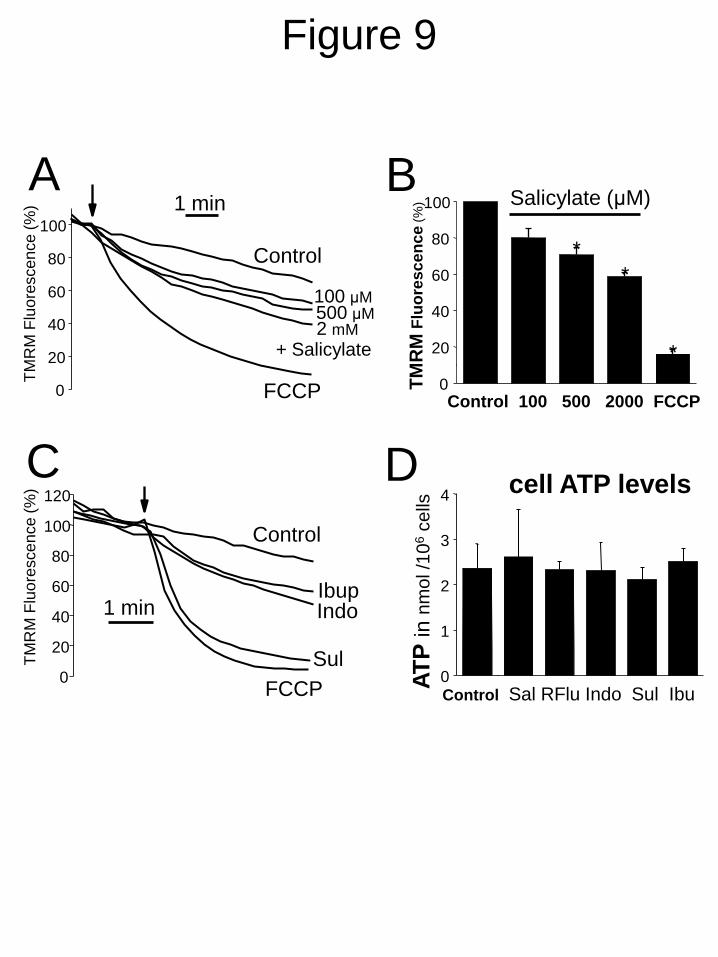
To support further the view that NSAIDs inhibit
SOCE acting on a mitochondria-dependent
regulatory mechanism we tested the effects of
NSAIDs on Δ . Fig. 9A,B shows that salicylate
decreases Δ in A10 cells in a dose-dependent
manner. Similar results were obtained with
ibuprofen, sulindac and indomethacin at the
same concentrations that inhibit SOCE and cell
proliferation (Fig. 9C). To exclude any possible
metabolic influence we studied the effects of
NSAIDs on cell ATP levels in A10 cells. Fig. 9D
shows that treatment with NSAIDs did not affect
significantly the cell ATP levels. Since Δ is the
driving force for mitochondrial Ca2+
uptake, we
investigated next whether changes in Δ induced
by NSAIDs were sufficient to inhibit
mitochondrial Ca2+
uptake. For this end, A10
cells were transfected with an aequorin plasmid
fused to the GFP and targeted to mitochondria
by guest, on February 21, 2013
ww
w.jbc.org
Dow
nloaded from

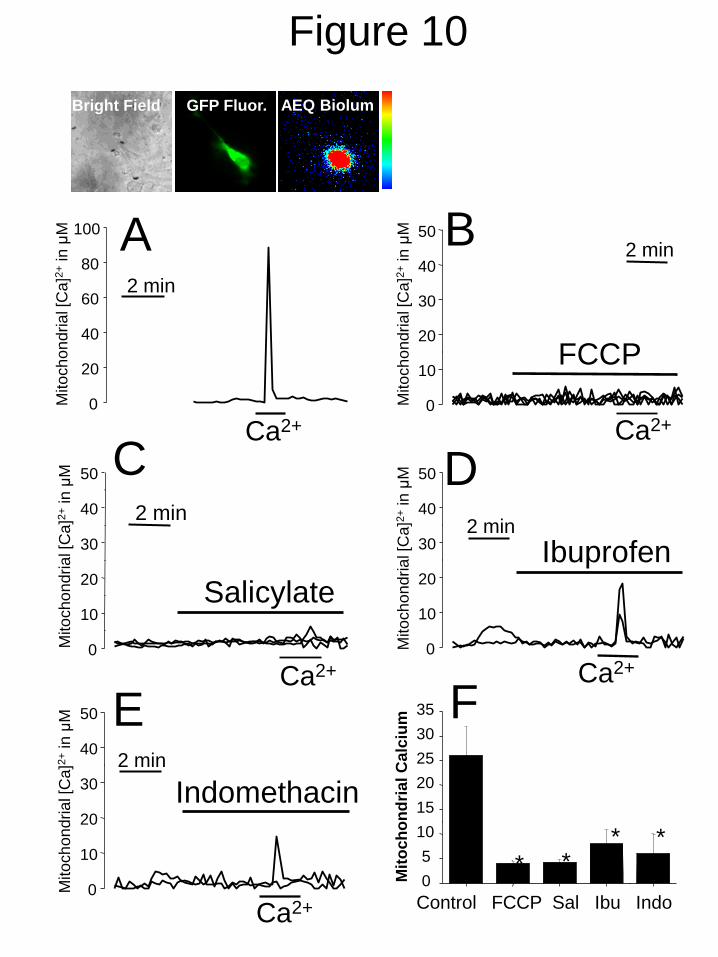
7
(37). After 24 h, cells were incubated with
coelenterazin n and subjected to photon-counting
imaging for monitoring mitochondrial Ca2+
([Ca2+
]mit) in individual A10 VSMCs.
Transfected cells were selected by their GFP
fluorescence (Fig. 10) where increases in
mitochondrial Ca2+
([Ca2+
]mit) promote the
release of photonic emissions. Transfected A10
cells were permeated with low concentrations of
digitonin (34) and then stimulated with internal
medium containing 10 µM Ca2+
to evoke a rise
in [Ca2+
]mit (Fig. 10A), which was prevented by
FCCP (Fig. 10B). NSAIDs including salicylate
at 500 µM (Fig. 10C), 100 µM of ibuprofen (Fig.
10D) and indomethacin (Fig. 10E) also inhibited
the rise in [Ca2+
]mit in permeated A10 cells in a
significant manner (Fig. 10F).
DISCUSSION
We show that NSAIDs inhibit proliferation of rat
aortic A10 cells, a model of neointimal VSMC
and that this effect is mediated by inhibition of
SOCE, an important Ca2+
entry pathway
involved in cell proliferation. We also show that
NSAIDs do not inhibit SOCE directly acting on
CRAC channels but target an important
regulatory mechanism of SOCE by
mitochondria. The results confirm the
importance of SOCE in VSMC proliferation and
provide an action mechanism for the
antiproliferative and salutary effects of NSAIDs
in the vasculature. In support of this view we
demonstrated first that A10 cells display both
SOCE and VOCE, being the former
quantitatively larger than the latter, consistently
with a proliferative VSMC phenotype (1,2).
Interestingly SOCE activation in VSMC favors
inmediate-early gene expression and growth
whereas VOCE promotes rather VSMC
differentiation (40). SOCE in A10 cells
resembles the one best characterized in T and
RBL cells in the following aspects: i) It is
prevented by classic SOCE antagonists La3+
and
2-APB and the novel antagonist BTP2, ii) A10
cells express Orai1 and Stim1 recently involved
in CRAC in other cell types including VSMCs,
iii) SOCE is important in A10 cell proliferation
just as in T cell clonal expansion (13), and iv)
SOCE is tightly modulated by mitochondria
since inhibition of mitochondrial Ca2+
uptake
prevents this pathway. Thus, SOCE in A10
VSMCs is regulated by mitochondria and
involved in cell proliferation.
Our data agree with recent reports indicating that
SOCE and novel proteins Stim1 and Orai1 are
critical in VSMC proliferation. For example,
proliferating VSMCs show increased SOCE and
up-regulated Stim and Orai proteins (30), and
their knockdown decreases SOCE and cell
proliferation in coronary artery VSMC (25) and
in rat aortic VSMC (29). Orai and Stim knock
down prevents restenosis in rat injured carotid
artery (32). Increased SOCE is also involved in
vascular pathology. For example, SOCE
mediates pulmonary vascular remodeling in
patients with hypoxia-mediated pulmonary
hypertension (42). Therefore, targeting SOCE
may contribute to prevent VSMC proliferation in
occlusive and proliferative disorders of the
vessel wall.
As stated above, NSAIDs inhibit VSMC
proliferation and DNA synthesis in vivo and in
vitro without cellular toxicity and independently
of cyclooxygenase (4,6,7). Consistently, our
results show that NSAIDs diminish A10 cell
proliferation at roughly the same concentrations
that inhibit SOCE. The little disconnect between
both parameters in some cases could be related
to the facts that acute and chronic effects of
NSAIDs could not be entirely similar and that a
little component of A10 cell proliferation is
independent of Ca2+
entry. The effects of
NSAIDs cannot be explained by cell death, anti-
inflammatory activity or VOCE inhibition since
cell viability was not decreased, structural
analogues lacking anti-inflammatory activity (R-
flurbiprofen) mimicked inhibition and NSAIDs
did not prevent VOCE. Therefore, SOCE
inhibition underlies the antiproliferative effects
of NSAIDs in VSMCs.
NSAIDs may inhibit SOCE acting directly on
channels or, alternatively, by targeting a
regulatory mechanism. Our results favor this
latter option for several reasons. First, NSAIDs
do not inhibit CRAC directly. This conclusion is
based in our studies with RBL cells. NSAIDs
inhibit SOCE in RBL cells but do not prevent
Icrac in strong Ca2+
buffer. However, in weak
by guest, on February 21, 2013
ww
w.jbc.org
Dow
nloaded from

8
Ca2+
buffer, where mitochondrial Ca2+
uptake is
essential for sustaining CRAC/ORAI channels,
NSAIDs significantly reduced Icrac. Second,
SOCE (but not VOCE) promotes mitochondrial
Ca2+
uptake in A10 cells. Third, SOCE (but not
VOCE) is largely inhibited when mitochondrial
Ca2+
uptake is impaired by mitochondrial
depolarization with protonophores. These
compounds are not selective to mitochondria and
they may collapse the proton gradient in any
acidic organelle. As some of these acidic
organelles have been reported to act as agonist-
sensitive Ca2+
stores, protonophores effects
should be regarded with caution. Finally,
NSAIDs depolarize mitochondria and impair
mitochondrial Ca2+
uptake in A10 cells, an action
consistent with previous reports on the effects of
salicylate and NSAIDs as mitochondrial
uncoupler in both isolated mitochondria and
intact cells (35,41). Interestingly, NSAIDs added
after VOCE produce the same effects than
FCCP. It has been reported that mitochondria
may regulate CRAC channels by production of
ATP which supposedly acts as a calcium buffer
(43). However, the finding that ruthenium red
blocks CRAC confirms that mitochondrial Ca2+
buffering is an important factor. Moreover, ATP
levels do not change upon exposure to NSAIDs.
Taken together, our results suggest that NSAIDs
prevent mitochondrial Ca2+
uptake, thus
facilitating the Ca2+
-dependent inactivation of
SOC channels rather than inhibiting SOC
channels directly. As SOCE is clearly involved
in VSMC proliferation, this mechanism may
underlie the antiproliferative and salutary effects
of NSAIDS on proliferative disorders of the
vascular wall.
REFERENCES
1. Beech, D.J. (2007) Biochem. Soc. Trans. 35, 890-894
2. House, S.J., Potier, M., Bisaillon, J., Singer, H.A., and Trebak, M. (2008) Pflugers Arch. 456,
769-785
3. Khan, Q., and Mehta, J.L. (2005) J. Atheroscler. Thromb. 12, 185-190
4. Marra, D.E., Simoncini, T., and Liao, J.K. (2000) Circulation 102, 2124-2130
5. Marra, D.E., and Liao, J.K. (2001) Trends Cardiovasc. Med. 11, 339-344
6. Brooks, G., Yu, X.M., Wang, Y., Crabbe, M.J., Shattock, M.J., and Harper JV. (2003) J. Pharm.
Pharmacol. 55, 519-526
7. Weber, A., Yildirim, H., and Schrör, K. (2000) Eur. J. Pharmacol. 389, 67-69
8. Anderson, H.V., McNatt, J., Clubb, F.J., Herman, M., Maffrand, J.P., DeClerck, F., Ahn, C.,
Buja, L.M., and Willerson, J.T. (2001) Circulation 104, 2331-2337
9. Gu, Q., Chen, J.L., and Ruan, Y.M. (2005) Zhongguo Yi Xue Ke Xue Yuan Xue Bao 27, 87-91
10. Guibert, C., Ducret, T., and Savineau, J.P. (2008) Prog. Biophys. Mol. Biol. 98, 10-23
11. Sonkusare, S., Palade, P.T., Marsh, J.D., Telemaque, S., Pesic, A., and Rusch, N.J. (2006)
Vascul. Pharmacol. 44, 131-142
12. Parekh, A.B, Putney, J.W. Jr. (2005) Physiol. Rev. 85, 757-810.
13. Schwarz, E.C., Kummerow, C., Wenning, A.S., Wagner, K., Sappok, A., Waggershauser, K.,
Griesemer, D., Strauss, B., Wolfs, M.J., Quintana, A., and Hoth, M. (2007) Eur J Immunol 37,
2723-2733.
14. Hoth, M., Fanger, C.M., and Lewis, R.S. (1997) J. Cell. Biol. 137, 633-648
15. Hoth, M., Button, D.C., and Lewis, R.S. (2000) Proc. Natl. Acad. Sci. U.S.A. 97, 10607-10612
16. Gilabert, J.A., and Parekh, A.B. (2000) EMBO J. 19, 6401-6407.
17. Glitsch, M.D., Bakowski, D., and Parekh, A.B. (2002) EMBO J. 21, 6744-6754
18. Quintana, A., Schwindling, C., Wenning, A.S., Becherer, U., Rettig, J., Schwarz, E.C., and
Hoth, M. (2007) Proc. Natl. Acad. Sci. U.S.A. 104, 14418-14423.
19. Liou, J., Kim, M.L., Heo, W.D., Jones, J.T., Myers, J.W., Ferrell, J.E. Jr, and Meyer, T. (2005)
Curr. Biol. 15, 1235-1241
20. Feske S, Gwack Y, Prakriya M, Srikanth S, Puppel SH, Tanasa B, Hogan PG, Lewis RS, Daly
M, Rao A (2006) Nature 441, 179-185.
by guest, on February 21, 2013
ww
w.jbc.org
Dow
nloaded from

9
21. Luik, R.M., Wang, B., Prakriya, M., and Wu, M.M., and Lewis, R.S. (2008) Nature 454, 538-
542
22. Li, J., Sukumar, P., Milligan, C.J., Kumar, B., Ma, Z.Y., Munsch, C.M., Jiang, L.H., Porter,
K.E., and Beech, D.J. (2008) Circ. Res. 103, 97-104
23. Wang, Y., Deng, X., Hewavitharana, T., Soboloff, J., and Gill, D.L. (2008) Clin. Exp.
Pharmacol. Physiol. 35, 1127-1133
24. Peel, S.E., Liu, B., and Hall, I.P. (2008) Am. J. Respir. Cell. Mol. Biol. 38, 744-749
25. Takahashi, Y., Watanabe, H., Murakami, M., Ono, K., Munehisa, Y., Koyama, T., Nobori, K.,
Iijima, T., and Ito, H. (2007) Biochem. Biophys. Res. Commun. 361, 934-940
26. Ng, L.C., McCormack, M.D., Airey, J.A., Singer, C.A., Keller, P.S., Shen, X.M., and Hume,
J.R. (2009) J. Physiol. 587, 2429-2442
27. Dietrich, A., Kalwa, H., Storch, U., Mederos y Schnitzler, M., Salanova, B., Pinkenburg, O.,
Dubrovska, G., Essin, K., Gollasch, M., Birnbaumer, L., and Gudermann, T. (2007) Pflugers
Arch. 455, 465-477
28. DeHaven, W.I., Jones, B.F., Petranka, J.G., Smyth, J.T., Tomita, T., Bird, G.S., and Putney, J.W.
Jr. (2009) J. Physiol. 587, 2275-2298
29. Potier, M., González, J.C., Motiani, R.K., Abdullaev, I.F., Bisaillon, J.M., Singer, H.A., and
Trebak, M. (2009) FASEB J 23, 2425-243
30. Berra-Romani, R., Mazzocco-Spezzia, A., Pulina, M.V., and Golovina, V.A. (2008) Am. J.
Physiol. Cell. Physiol. 295, C779-C790
31. Aubart, F.C., Sassi, Y., Coulombe, A., Mougenot, N., Vrignaud, C., Leprince, P., Lechat, P.,
Lompré, A.M., and Hulot, J.S. (2009) Mol. Ther. 17, 455-462
32. Guo, R.W., Wang, H., Gao, P., Li, M.Q., Zeng, C.Y., Yu, Y., Chen, J.F., Song, M.B., Shi, Y.K.,
and Huang, L. (2009) Cardiovasc. Res. 81, 660-668
33. Hoth, M., and Penner, R. (1992) Nature 355, 353-356
34. Rao, R.S., Miano, J.M., Olson, E.N., and Seidel, C.L. (1997) Cardiovasc. Res. 36, 118-126
35. Núñez, L., Valero, R.A., Senovilla, L., Sanz-Blasco, S., García-Sancho, J., and Villalobos, C.
(2006) J. Physiol. 571, 57-73
36. Valero, R.A., Senovilla, L., Núñez, L., and Villalobos, C. (2008) Cell Calcium 44, 259-269
37. Villalobos, C., Núñez, L., Montero, M., García, A.G., Alonso, M.T., Chamero, P., Alvarez, J.,
and García-Sancho, J. (2002) FASEB J. 16, 343-353
38. Villalobos, C., Alonso, M.T., and García-Sancho J (2009) Bioluminescence imaging of calcium
oscillations inside intracellular organelles. Methods Mol. Biol. 574, 203-221
39. Zitt, C., Strauss, B., Schwarz, E.C., Spaeth, N., Rast, G., Hatzelmann, A., and Hoth, M. (2004)
Potent inhibition of Ca2+
release-activated Ca2+
channels and T-lymphocyte activation by the
pyrazole derivative BTP2. J. Biol. Chem. 279, 12427-12437
40. Ren, J., Albinsson, S., Hellstrand, P. (2010) J. Biol. Chem. 285, 31829-31839
41. Gutknecht, J. (1990) J. Membr. Biol. 115, 253-260
42. Fantozzi, I., Zhang, S., Platoshyn, O., Remillard, C.V., Cowling, R.T., and Yuan, J.X. (2003)
Am. J. Physiol. Lung. Cell. Mol. Physiol. 285, 1233-1245.
43. Montalvo, G.B., Artalejo, A.R., and Gilabert, J.A. (2006) ATP from subplasmalemmal
mitochondria controls Ca2+
-dependent inactivation of CRAC channels. J. Biol. Chem. 281,
35616-35623.
by guest, on February 21, 2013
ww
w.jbc.org
Dow
nloaded from

10
FIGURE LEGENDS
FIGURE 1. A10 cells show SOCE and VOCE. A10 cells were loaded with fura2/AM and
subjected to fluorescence imaging of cytosolic Ca2+
. A. In intact cells addition of extracellular Ca2+
does not change the ratio of fluorescences excited at 340 and 380 nm (Ratio 340/380) reflecting
[Ca2+
]cyt. B. In thapsigargin-treated cells, re-addition of Ca2+
increased this ratio in all cells (n=5
experiments) reflecting SOCE. A further Ca2+
pulse evoked the same response. Pictures on top
show representative ratio images (from 0 to 1) coded in pseudocolor. C. Depolarization with
medium containing high concentration (75 mM) of K+ (in exchange for Na
+) induced a lower
increase in the ratio in a fraction of cells revealing VOCE (n=3 experiments). D. Top bars show the
size of rise in Ratio induced by SOCE and VOCE in responsive cells. Bottom bars show percent of
cells showing SOCE and VOCE respectively (mean ± SEM, *p < 0.05).
FIGURE 2. SOCE antagonists inhibit A10 cell proliferation. A. SOCE measurements were
carried out as in Fig. 1. Panels show representative experiments for each antagonist tested. Average
(mean ± SEM) recordings of all cells in the same fields (n=7-9 cells) are shown (n=3). B. Effects of
antagonists on VOCE were investigated as in Fig. 1. Antagonists were added at indicated
concentrations after depolarization (n=3). C. A10 cells were cultured for 15 days in vitro (DIV) and
effects of antagonists on cell proliferation were tested. La3+
and 2APB were used at 10 µM and
BTP2 at 10 nM (*p<0.05 vs. control, n=3). Antagonists had no effect on cell viability (not shown).
FIGURE 3. NSAIDs inhibit A10 cell proliferation. A. Dose-dependent effects of salicylate (100-
2000 µM) on A10 cell proliferation. B. Effects of different NSAIDs including ibuprofen, sulindac
and indomethacin, all tested at 100 M, on A10 cell proliferation. C, Dose-dependent effects of R-
flurbiprofen (1-100 M) on A10 cell proliferation. *p<0.05 vs. control (n=3).
FIGURE 4. NSAIDs inhibit SOCE in A10 cells. SOCE was measured in A10 cells as in Fig. 1. A.
Ca2+
recordings are mean ± SEM (n=9,9,18 cells, respectively) and representative of n=3. B. Bars
show the dose-dependent effects of salicylate on SOCE (mean ± SEM values, n=3). C. Bars show
the effects of ibuprofen, indomethacin and sulindac, all tested at 100 M, on SOCE. *p<0.05.
FIGURE 5. NSAIDs do not inhibit VOCE in A10 cells. SOCE was measured in A10 cells as in
Fig. 1. Panels show Ca2+
recordings of individual cells in experiments representative of at least 3
similar ones. A. Salicylate (500 M) decreases [Ca2+
]cyt after the Ca2+
re-addition to thapsigargin-
treated cells. B-F. Effects of NSAIDs on VOCE were tested by recording the effect of NSAIDs
perfused after depolarization with high K+ medium. Neither 500 µM salicylate (B), 100 µM
sulindac (C), 100 µM indomethacin (D) or 100 µM ibuprofen decreased [Ca2+
]cyt when perfused
during depolarization. F. shows mean ± SEM values of the levels of [Ca2+
]cyt before (control) and
after NSAID treatment (p > 0.05, n=3).
FIGURE 6. NSAIDs accelerate slow inactivation of CRAC currents in RBL cells under weak
Ca2+
buffering conditions. A. Average current-voltage (I/V) relationship of CRAC currents from
RBL-2H3 cells patched with the the strong buffer solution (10 mM BAPTA) at 2 (black trace), 100
(red trace) and 400 (blue trace) seconds after establishing the whole-cell configuration and current
kinetics in control cells (B, n = 16), and in cells exposed (C) to ibuprofen ( n = 7), salicylate (n =
11), indomethacin (n = 6), all tested at 10-100 µM. D. Average CRAC currents obtained from cells
as shown in panels B and C, respectively. Currents sizes were extracted at – 130 (black trace) and +
80 (red trace) mV, normalized to the cell size, averaged and plotted versus time. Currents were
leak-corrected by subtracting averages of the currents from first three voltage ramps before CRAC
channel activation. E. CRAC currents were studied in control cells with the weakly-buffering
solution (1.2 mM EGTA) and the mitochondrial cocktail (see Procedures) only that cells were pre-
by guest, on February 21, 2013
ww
w.jbc.org
Dow
nloaded from
11
incubated with CCCP for 5 min in order to disrupt mitochondrial Ca2+
uptake. F. Same conditions
as in E only that cells were pre-incubated with indomethacin (red trace), salicylate (black trace) or
ibuprofen (blue trace). G. Statistical analysis of CRAC currents six minutes after establishing the
whole cell configuration as a fraction of the maximal current for the control conditions and for
experiments in the presence of R360 + RR. Levels of significance are indicated in the figures (*p <
0.05, **p < 0.01, ***p < 0.001). Errors bars indicate S.E.M.
FIGURE 7. SOCE, but not VOCE, induces mitochondrial Ca2+
uptake in A10 cells. A10 cells
were transfected with GFP-aequorin targeted to mitochondria, loaded with coelenteracin and
subjected to bioluminescence imaging of mitochondrial [Ca2+
] in single cells. Left (SOCE), A10
cells were treated with thapsigargin 1 µM for 10 min in Ca2+
-free medium to deplete intracellular
Ca2+
stores, perfused with extracellular Ca2+
containing medium to induce SOCE and the effects on
photonic emissions reflecting mitochondrial Ca2+
uptake were imaged. Pictures on top show a
typical fluorescence image of transfected cells (left) and the accumulated photonic emissions during
SOCE. Top traces show calculated [Ca2+
]mit values in individual cells. Bottom traces reflect % of
remaining photonic emissions. Right (VOCE), cells were perfused with high K+ containing medium
to induce VOCE and the effects on photonic emissions reflecting mitochondrial Ca2+
uptake were
imaged. Top pictures are representative fluorescence and bioluminescence images. Traces show
[Ca2+
]mit recordings in individual cells and % remaining counts. Data are representative of at least 3
independent experiments of each kind. Pseudocolor scale goes from 0 to 10 photons per pixel.
FIGURE 8. Mitochondrial depolarization inhibits SOCE but not VOCE in A10 cells. SOCE
was estimated in A10 cells as shown in Fig. 1. A. FCCP 10 M (added in the presence of
oligomycin 0,12 M) inhibits SOCE in a reversible manner. B. Mitochondrial depolarization with
antimycin A (0,5 µg/ml) + oligomycin (0,12 µM) inhibits also SOCE in A10 cells. C. FCCP (10
M) added during SOCE decreases [Ca2+
]cyt . D. FCCP added after depolarization with high K+ did
not decrease [Ca2+
]cyt but rather increased it. All data are single-cell recordings representative of 8-
17 cells studied in at least 3 independent experiments for each panel.
FIGURE 9. NSAIDs depolarize mitochondria in A10 cells. The effects of NSAIDs on
mitochondrial potential were tested by fluorescence microscopy of cells loaded with TMRM. A,
effects of vehicle, salicylate (100-2000 µM) or FCCP (10 M) on TMRM fluorescence normalized
to the value before addition of treatment and averaged (arrow). B, Mean ± SEM values of 3
independent experiments are shown (*p < 0.05). C. Effects of vehicle (control), FCCP (10 M),
ibuprofen, indomethacin and sulindac (all tested at 100 M) on TMRM fluorescence normalized to
the value before addition of treatment (arrow). Representative of n = 3 experiments. D. Effects of
NSAIDs including salicylate, R-flurbiprofen, indomethacin, sulindac Sulphide and ibuprofen on
ATP levels in A10 cell. All NSAIDs were tested at 100 µM except salicylate which was tested at
500 µM. None of the treatments changed cell ATP levels in A10 cells (n=3, p > 0.05).
FIGURE 10. NSAIDs inhibit mitochondrial Ca2+
uptake in permeated A10 cells. A10 cells were
transfected with GFP-aequorin targeted to mitochondria and subjected to bioluminescence counting
imaging to estimate mitochondrial Ca2+
uptake in permeated, single cells. Pictures show a typical
bright field image, the GFP fluorescence image, (GFP fluor.), and photonic emissions released after
a Ca2+
pulse (AEQ Biolum). Cells were permeated with low concentrations of digitonin in internal
medium. Perfusion with internal medium containing 10 M Ca2+
induced a large rise in [Ca2+
]mit
(A). FCCP 10 M abolished the rise in [Ca2+
]mit induced by 10 M Ca2+
. (B). Salicylate (C, 500
M), ibuprofen (D, 100 M) and indomethacin (E, 100 M) also inhibited [Ca2+
]mit rises induced by
10 M Ca2+
. Traces are recordings representative of 4-7 cells studied in at least 3 independent
experiments. Bars show mean ± SEM values of [Ca2+
]mit increases (n=3, *p < 0.05).
by guest, on February 21, 2013
ww
w.jbc.org
Dow
nloaded from

+ CalciumNo Calcium
No thapsigargin
A
No Calcium + Calcium
B
+ Calcium
Figure 1
+ Calcium
C
0,1
0,2
0,3
0,4
0,5
0,6
0,7
K+
2 min
D
0,1
0,2
0,3
0,4
0,5
0,6
0,7
Ca2+
2 min
Ratio
34
0/3
80
0,1
0,2
0,3
0,4
0,5
0,6
0,7
Ra
tio
34
0/3
80 2 min
K+
Ratio
34
0/3
80
SOCE VOCE0.0
0.2
0.4
0.6
0.8
1.0
ΔR
atio
340
/38
0
0
20
40
60
80
100
% o
f re
sp
on
siv
e c
ells
SOCE VOCE
Control + high K+
Ca2+ Ca2+ Ca2+
*
*
After thapsigargin
SOCE
VOCE
1000
0
1
0
1000
0
1
0
1000
0
1
0
by guest, on February 21, 2013
ww
w.jbc.org
Dow
nloaded from
A SOCE
C
Figure 2
VOCEB
0,0
0,2
0,4
0,6
0,8
1 min La3+ (10μM)
Ratio 3
40
/38
0
Ca2+ Ca2+
0
1
2
3
2APB (10μM)
Ratio 3
40
/38
0
1 min
Ca2+ Ca2+
0
1
2
3
4
Ratio 3
40
/38
0
BTP2 (10nM)
1 min
Ca2+ Ca2+
K+ (75mM)0,2
0,3
0,4
0,5
0,6
Ra
tio 3
40
/38
0
La3+ (10μM)
1 min
1min
0,2
0,3
0,4
0,5
0,6
Ra
tio 3
40
/38
0 2APB (10μM)
K+ (75mM)
1min
0,2
0,3
0,4
0,5
0,6
Ra
tio
34
0/3
80 BTP2 (10nM)
K+ (75mM)
0
20
40
60
80
100
120
*
*
Cell
pro
life
rati
on
(%
)
Control La3+ 2APB BTP2
*
by guest, on February 21, 2013
ww
w.jbc.org
Dow
nloaded from
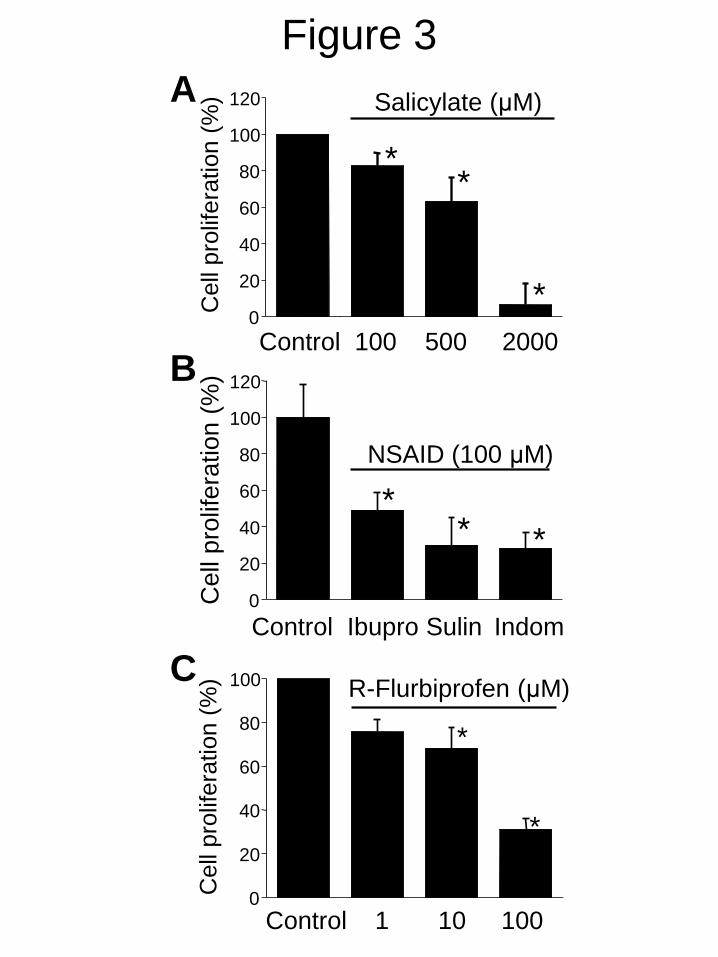
Figure 3
A
B
C
0
20
40
60
80
100
120
*
*C
ell
pro
life
ration (
%)
Control 100 500 2000
Salicylate (μM)
0
20
40
60
80
100
120
**
Ce
ll p
rolif
era
tio
n (
%)
Control Ibupro Sulin Indom
NSAID (100 μM)
*
0
20
40
60
80
100
*
Cell
pro
life
ration (
%) R-Flurbiprofen (μM)
Control 1 10 100
*
*
by guest, on February 21, 2013
ww
w.jbc.org
Dow
nloaded from
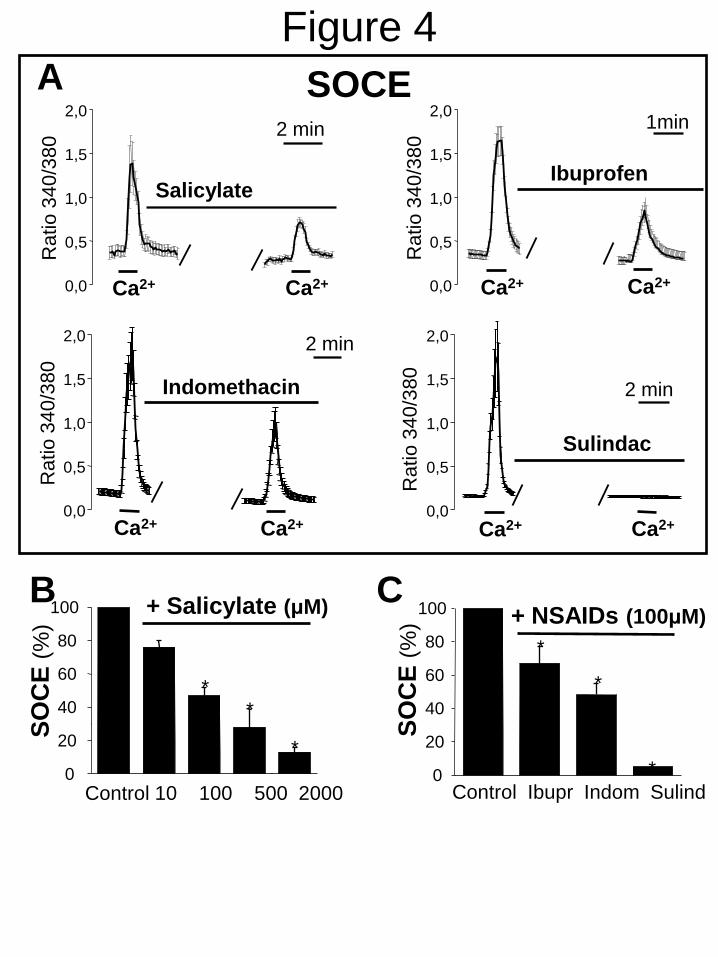
Figure 4A
B C
0,0
0,5
1,0
1,5
2,0
Ra
tio
34
0/3
80
Ca2+
Salicylate
2 min 1min
Ibuprofen
Sulindac
2 minIndomethacin
2 min
0
20
40
60
80
100
*
*
SO
CE
(%
) + NSAIDs (100μM)
Control Ibupr Indom Sulind
*
0
20
40
60
80
100
*
*
SO
CE
(%
)
Control 10 100 500 2000
+ Salicylate (μM)
*
Ca2+ Ca2+ Ca2+
Ca2+ Ca2+ Ca2+ Ca2+0,0
0,5
1,0
1,5
2,0
Ratio
34
0/3
80
0,0
0,5
1,0
1,5
2,0
Ra
tio
34
0/3
80
0,0
0,5
1,0
1,5
2,0
Ratio
34
0/3
80
SOCE
by guest, on February 21, 2013
ww
w.jbc.org
Dow
nloaded from
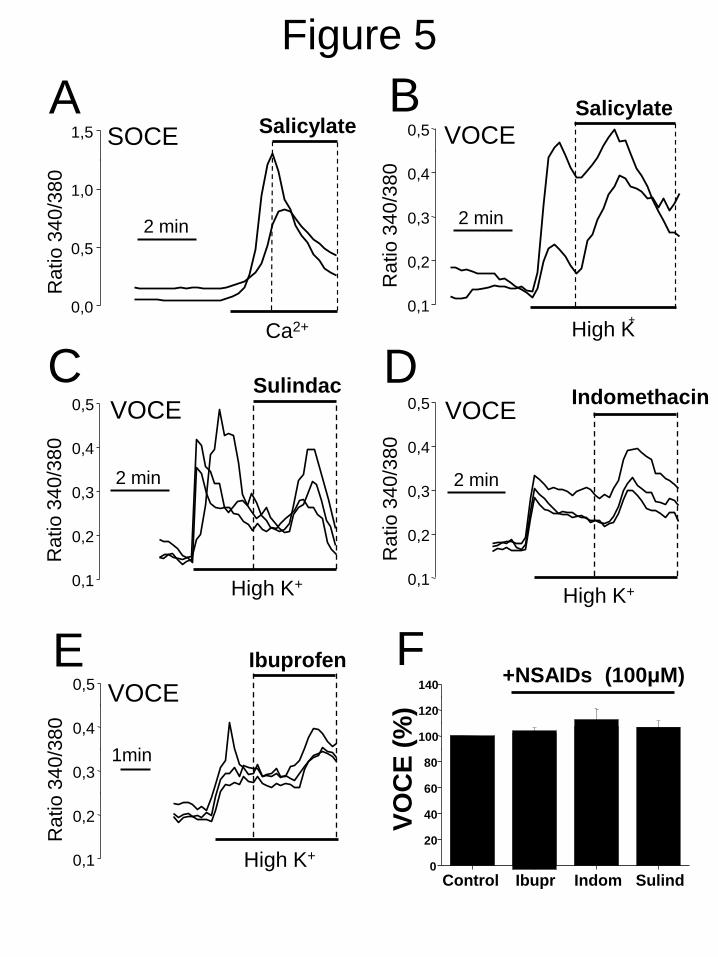
Figure 5
A
0,0
0,5
1,0
1,5
Ra
tio
34
0/3
80
Salicylate
2 min
Ca2+
SOCE
B
0,1
0,2
0,3
0,4
0,5
Ra
tio
34
0/3
80
2 min
High K+
Salicylate
VOCE
CSulindac
0,1
0,2
0,3
0,4
0,5
Ra
tio
34
0/3
80
2 min
VOCE
High K+
DIndomethacin
0,1
0,2
0,3
0,4
0,5R
atio
34
0/3
80
VOCE
2 min
High K+
E Ibuprofen
1min
VOCE
0,1
0,2
0,3
0,4
0,5
Ra
tio
34
0/3
80
High K+
F
Control Ibupr Indom Sulind0
20
40
60
80
100
120
140
VO
CE
(%
)
+NSAIDs (100μM)
by guest, on February 21, 2013
ww
w.jbc.org
Dow
nloaded from
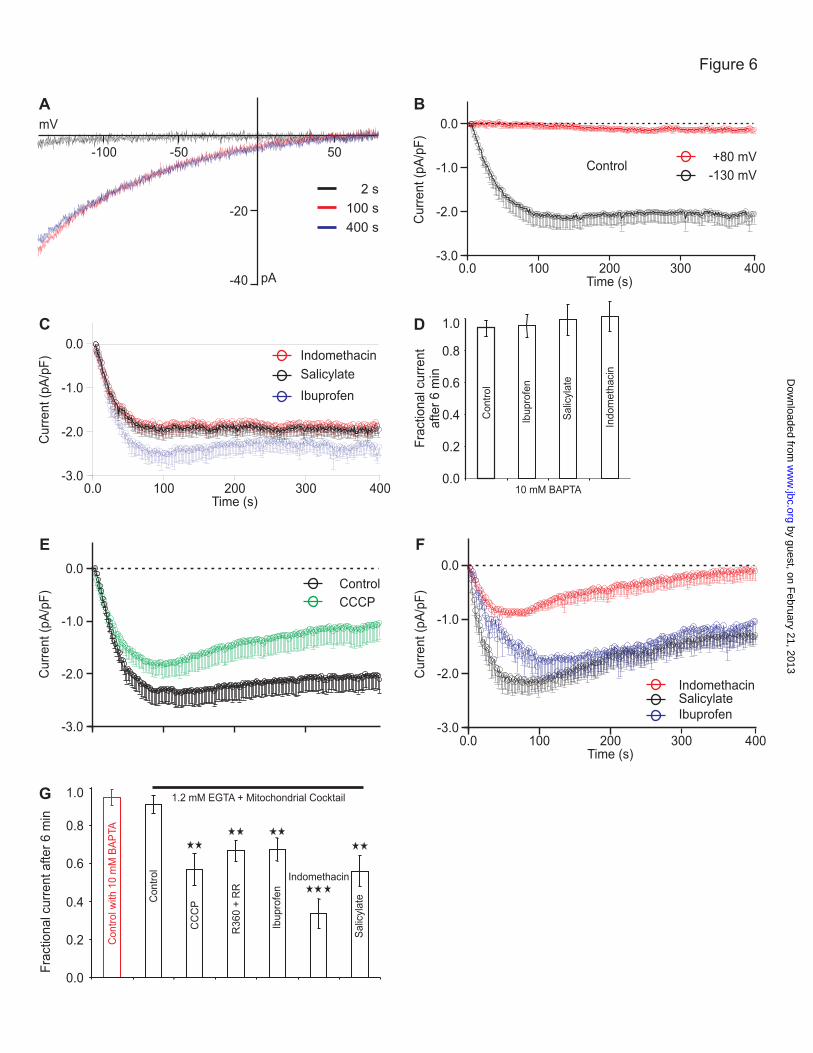
Figure 6
-40
-20
mV
pA
-50 50-100
2 s
100 s
400 s
A
Control
B
0.0
-1.0
-2.0
-3.00.0 100 200 300
Time (s)
Curr
ent(p
A/p
F)
+80 mV
-130 mV
400
Fra
ctionalcurr
ent
after
6m
in
D
0.0
0.2
0.4
0.6
0.8
1.0
Contr
ol
10 mM BAPTA
Ibupro
fen
Sa
licyla
te
Ind
om
eth
acin
0.0
-1.0
-2.0
-3.00.0 100 200 300
Time (s)400
C
Curr
ent(p
A/p
F)
Ibuprofen
Indomethacin
Salicylate
Fra
ctionalcurr
entafter
6m
in
G
0.0
0.2
0.4
0.6
0.8
1.0
Co
ntr
olw
ith
10
mM
BA
PTA
Co
ntr
ol
1.2 mM EGTA + Mitochondrial Cocktail
CC
CP
R3
60
+R
R
Ibu
pro
fen
Indomethacin
Sa
licyla
te
F
Curr
ent(p
A/p
F)
0.0
-1.0
-2.0
-3.00.0 100 200 300
Time (s)
SalicylateIndomethacin
Ibuprofen
400
E
Curr
ent(p
A/p
F)
CCCP
Control0.0
-1.0
-2.0
-3.0
by guest, on February 21, 2013
ww
w.jbc.org
Dow
nloaded from
SOCE VOCE
Figure 7
0
20
40
60
80
100
Rem
ain
ing
Ph
oto
ns (
%)
0
5
10
15
20
25
Mit
och
on
dri
al [C
a]2
+in
μM
1min
Ca2+
0
5
10
15
20
25
K+
1min
0
20
40
60
80
100
mitAEQ mitAEQGFP FluorGFP Fluor
Digitonin
Mit
och
on
dri
al [C
a]2
+in
μM
Rem
ain
ing
Ph
oto
ns (
%)
Digitonin
by guest, on February 21, 2013
ww
w.jbc.org
Dow
nloaded from
A B
C D
Figure 8
0,0
1,0
2,0
3,0 FCCP
2 min
Ra
tio
34
0/3
80
SOCE
0,0
0,2
0,4
0,6
0,8
Ratio
34
0/3
80
2 min
FCCP
High K+
VOCE
0,0
0,4
0,8
1,2
1,6
2,0
Ra
tio
34
0/3
80
Ca2+
2 min
FCCP
0,0
0,5
1,0
1,5
2,0
Ratio 3
40/3
80
Oligom + Ant A
2 min
SOCE SOCE
Ca2+ Ca2+ Ca2+ Ca2+
Ca2+
by guest, on February 21, 2013
ww
w.jbc.org
Dow
nloaded from
A B
C D
0
1
2
3
4
AT
Pin
nm
ol /1
06
ce
lls
Control Sal RFlu Indo Sul Ibu
cell ATP levels
0
20
40
60
80
100
120
FCCP
Sul
Indo
Control
Ibup
TM
RM
Flu
ore
sce
nce
(%
)
1 min
0
20
40
60
80
100
Control
100 μM
TM
RM
Flu
ore
sce
nce
(%
)
FCCP
2 mM500 μM
1 min
0
20
40
60
80
100
*
*
TM
RM
Flu
ore
sc
en
ce
(%) Salicylate (μM)
Control 100 500 2000 FCCP
*
+ Salicylate
Figure 9
by guest, on February 21, 2013
ww
w.jbc.org
Dow
nloaded from
A B
C D
E
Bright Field GFP Fluor. AEQ Biolum
Figure 10
0
20
40
60
80
100
Ca2+
Mito
ch
on
dria
l [C
a]2
+in
μM
2 min
0
10
20
30
40
50
2 min
FCCP
Mito
ch
on
dria
l [C
a]2
+in
μM
Ca2+
0
10
20
30
40
50
Ibuprofen2 min
Mito
ch
on
dria
l [C
a]2
+in
μM
Ca2+0
10
20
30
40
50
Salicylate
2 min
Mito
ch
on
dria
l [C
a]2
+in
μM
Ca2+
0
10
20
30
40
50
Indomethacin2 min
Mito
ch
on
dria
l [C
a]2
+in
μM
Ca2+
F
0
5
10
15
20
25
30
35
Control FCCP Sal Ibu Indo
* ** *
Mit
och
on
dri
al
Calc
ium
by guest, on February 21, 2013
ww
w.jbc.org
Dow
nloaded from
Related Documents