Recommended Citation: Barrett ML, Bailey MK, Owens PL. Non-maternal and Non-neonatal Inpatient Stays in the United States Involving Malnutrition, 2016. ONLINE. August 30, 2018. U.S. Agency for Healthcare Research and Quality. Available: www.hcup- us.ahrq.gov/reports.jsp. NON-MATERNAL AND NON-NEONATAL INPATIENT STAYS IN THE UNITED STATES INVOLVING MALNUTRITION 2016

Welcome message from author
This document is posted to help you gain knowledge. Please leave a comment to let me know what you think about it! Share it to your friends and learn new things together.
Transcript

Recommended Citation: Barrett ML, Bailey MK, Owens PL. Non-maternal and Non-neonatal Inpatient Stays in the United States Involving Malnutrition, 2016. ONLINE. August 30, 2018. U.S. Agency for Healthcare Research and Quality. Available: www.hcup-us.ahrq.gov/reports.jsp.
NON-MATERNAL AND NON-NEONATAL INPATIENT STAYS IN THE UNITED STATES INVOLVING MALNUTRITION
2016

HCUP (08/30/2018) Malnutrition Hospitalizations 2016
Table of Contents
Introduction ................................................................................................................................ 1
Results ....................................................................................................................................... 3
Overall ................................................................................................................................... 3
All Malnutrition-Related Inpatient Stays .............................................................................. 3
Readmissions for Malnutrition-Related Inpatient Stays ....................................................... 4
Patient Characteristics ........................................................................................................... 5
All Malnutrition-Related Inpatient Stays .............................................................................. 5
Readmissions for Malnutrition-Related Inpatient Stays ....................................................... 8
Outcomes Related to Malnutrition .........................................................................................11
All Malnutrition-Related Inpatient Stays .............................................................................11
Readmissions for Malnutrition-Related Inpatient Stays ......................................................15
Most Common Principal Diagnoses ......................................................................................16
All Malnutrition-Related Inpatient Stays .............................................................................16
Readmissions for Malnutrition-Related Inpatient Stays ......................................................18
Appendix A: HCUP Partners .....................................................................................................20
HCUP Partners in the 2016 National Inpatient Sample .........................................................20
HCUP Partners in the 2016 Nationwide Readmissions Database .........................................22
Appendix B: Methods ................................................................................................................23
Definitions .............................................................................................................................23
Diagnoses, ICD-10-CM, Clinical Classifications Software (CCS), and Major Diagnostic Categories (MDCs) ............................................................................................................23
Non-maternal and non-neonatal inpatient stays related to malnutrition ..............................23
Unit of analysis ..................................................................................................................25
Readmissions ....................................................................................................................25
Admission source and discharge status ............................................................................25
Hospital costs ....................................................................................................................25
Expected payer .................................................................................................................26
Location of patient’s residence ..........................................................................................26
Median community-level income .......................................................................................26
About HCUP .........................................................................................................................26
About the NIS ....................................................................................................................27
About the NRD ..................................................................................................................27
HCUP (08/30/18) 1 Malnutrition Hosptializations
INTRODUCTION
Recent estimates indicate that 7 percent of non-maternal and non-neonatal inpatient stays in the United States are for patients with malnutrition (undernutrition).1 Adult hospitalizations with a diagnosis of malnutrition have a longer length of stay, higher costs, more comorbidities, and 5 times the likelihood of death, compared with other adult inpatient stays.2 Additionally, malnutrition may also contribute to posthospital syndrome, described as “an acquired, transient period of vulnerability” following hospitalization,3 which may dramatically increase risk of readmission.4,5
Undernutrition is a form of malnutrition characterized by a lack of adequate calories, protein, or other nutrients needed for tissue maintenance and repair.6 There are many causes of malnutrition.7,8 Some cases involve chronic starvation related to conditions such as anorexia nervosa. In other instances, malnutrition may be a consequence of an acute or chronic illness or injury, such as burns or cancer. Evidence suggests that early nutritional intervention may reduce complication rates, mortality, and resource use associated with malnutrition. However, many cases of malnutrition are unrecognized and untreated.9 Clinical definitions of malnutrition and the set of diagnostic codes used to identify malnutrition in hospital administrative data have varied.10 Standardizing definitions and treatment protocols for malnutrition is complicated by the fact that its etiology is heterogeneous. Using a consistent set of diagnostic criteria and understanding the diseases that are associated with malnutrition are important for recognizing and treating malnutrition, as well as tracking its incidence, prevalence, and outcomes.11
This report, funded by the Agency for Healthcare Research and Quality (AHRQ), is a follow-up to the 2013 national estimates of inpatient stays for malnutrition published in previous
1 Weiss AJ, Fingar KR, Barrett ML, Elixhauser A, Steiner CA, Guenter P, et al. Characteristics of Hospital Stays Involving Malnutrition, 2013. HCUP Statistical Brief #210. September 2016. Agency for Healthcare Research and Quality, Rockville, MD. http://www.hcup-us.ahrq.gov/reports/statbriefs/sb210-Malnutrition-Hospital-Stays-
2013.pdf. Accessed August 15, 2018. 2 Ibid. 3 Krumholz HM. Post-hospital syndrome—an acquired, transient condition of generalized risk. New England Journal of Medicine. 2013;368(2):100–2. 4 Suaer A. Luo M. Role of Malnutrition in Increasing Risk of Hospital Readmissions. Abbot Nutrition Health Institute. December 2015. http://static.abbottnutrition.com/cms-prod/anhi.org/img/Role-Of-Malnutrition-In-Increasing-Risk-Of-
Hospital-Readmissions-article.pdf. Accessed September 13, 2016. 5 Guenter P, Jensen G, Patel V, Miller S, Mogensen KM, Malone A, et al. Addressing disease-related malnutrition in hospitalized patients: a call for a national goal. Joint Commission Journal on Quality and Patient Safety. 2015;41(10):469–73. 6 White JV, Guenter P, Jensen G, Malone A, Schofield M, Academy Malnutrition Work Group, et al. Consensus statement: Academy of Nutrition and Dietetics and American Society for Parenteral and Enteral Nutrition: characteristics recommended for the identification and documentation of adult malnutrition (undernutrition). Journal of Parenteral and Enteral Nutrition. 2012:36(3):275–83. 7 Lean M, Wiseman M. Malnutrition in hospitals. BMJ. 2008;336(7639):290. 8 White et al., 2012. Op. cit. 9 Tappenden KA, Quatrara B, Parkhurst ML, Malone AM, Fanjiang G, Ziegler TR. Critical role of nutrition in improving quality of care: an interdisciplinary call to action to address adult hospital malnutrition. Journal of the Academy of Nutrition and Dietetics. 2013;113(9):1219–37. 10 White et al., 2012. Op. cit. 11 Ibid.
HCUP (08/30/18) 2 Malnutrition Hosptializations
Healthcare Cost and Utilization Project (HCUP) Statistical Briefs12,13. The report presents national estimates on the characteristics of inpatient stays in the United States involving malnutrition in 2016. Malnutrition is identified using a broad set of diagnostic codes that included the following six categories:
• Postsurgical nonabsorption
• Nutritional neglect
• Cachexia
• Protein-calorie malnutrition
• Weight loss or failure to thrive
• Underweight.
Statistics are presented on the frequency of occurrence for these six types of malnutrition, as well as for patient characteristics, admission and discharge characteristics, and outcomes for malnutrition-related stays, including costs, in-hospital mortality, and average length of stay (LOS). Additionally, the most common principal diagnoses are presented for the different types of malnutrition-related stays. Each section presents information first for all malnutrition-related inpatient stays and then for all-cause 30-day rates of readmissions following an initial inpatient hospital stay (i.e., the index stay) for patients with malnutrition in 2016.
This report uses the HCUP National Inpatient Sample (NIS) to report on non-maternal and non-neonatal inpatient stays related to malnutrition and uses the HCUP Nationwide Readmission Database (NRD) to examine readmission rates for these patients. Supplemental data sources included population denominator data derived from demographic data provided by Claritas14, a vendor that compiles and adds value to the U.S. Bureau of Census data. Claritas uses intra-census methods to estimate household and demographic statistics by ZIP Code.
HCUP includes the largest collection of longitudinal hospital care data in the United States, with all-payer, encounter-level information beginning in 1988. The HCUP NIS is the largest all-payer inpatient care database in the United States, containing data on more than seven million inpatient stays. The HCUP NRD is a unique and powerful database designed to support various types of analyses of national readmission rates for all payers and the uninsured. The list of Partner organizations that contribute to the HCUP NIS and NRD is available in Appendix I.
For this report, non-maternal and non-neonatal inpatient stays related to malnutrition were identified by International Classification of Diseases, Tenth Revision, Clinical Modification (ICD-10-CM) diagnosis codes. The United States transitioned to the ICD-10-CM scheme for diagnostic coding on billing records on October 1, 2015. A full list of the ICD-10-CM diagnosis codes used as well as additional information on the methods are detailed in Appendix II.
12Weiss et al., 2016. Op cit. 13 Fingar KR, Weiss AJ, Barrett ML, Elixhauser A, Steiner CA, Guenter P, et al. All-Cause Readmissions Following Hospital Stays for Patients With Malnutrition, 2013. HCUP Statistical Brief #218. December 2016. Agency for Healthcare Research and Quality, Rockville, MD. http://www.hcup-us.ahrq.gov/reports/statbriefs/sb218-Malnutrition-Readmissions-2013.pdf. Accessed August 15, 2018. 14 Claritas. Claritas Demographic Profile by ZIP Code. https://claritas360.claritas.com/mybestsegments/.

HCUP (08/30/18) 3 Malnutrition Hosptializations
RESULTS
Overall
All Malnutrition-Related Inpatient Stays In 2016, there were 2.2 million non-maternal and non-neonatal inpatient stays related to malnutrition, representing 8 percent of the 27.6 million total non-maternal and non-neonatal stays (data not shown). The most common type of malnutrition was protein-calorie malnutrition with approximately 1.45 million malnutrition-related stays (66.6 percent).
Weight loss or failure to thrive was the next most common type of malnutrition, at 18.3 percent of all malnutrition-related inpatient stays (Figure 1). The remaining four malnutrition types combined constituted about 15 percent of all malnutrition-related inpatient stays: cachexia (8.1 percent), underweight (5.4 percent), postsurgical non-absorption (1.4 percent), and nutritional neglect (less than 1 percent).
Figure 1. Types of malnutrition among non-maternal and non-neonatal inpatient stays, 2016
Source: Agency for Healthcare Research and Quality (AHRQ), Center for Delivery, Organization, and Markets (CDOM), Healthcare Cost and Utilization Project (HCUP), National Inpatient Sample (NIS), 2016
HCUP (08/30/18) 4 Malnutrition Hosptializations
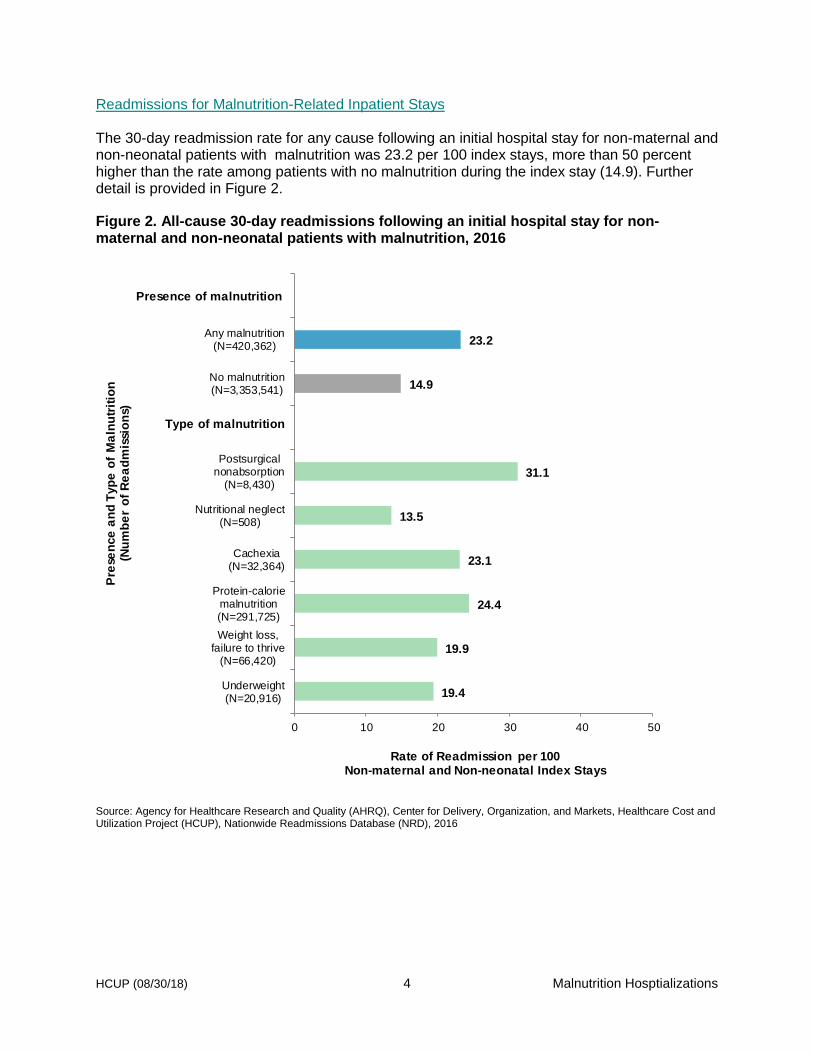
Readmissions for Malnutrition-Related Inpatient Stays The 30-day readmission rate for any cause following an initial hospital stay for non-maternal and non-neonatal patients with malnutrition was 23.2 per 100 index stays, more than 50 percent higher than the rate among patients with no malnutrition during the index stay (14.9). Further detail is provided in Figure 2.
Figure 2. All-cause 30-day readmissions following an initial hospital stay for non-maternal and non-neonatal patients with malnutrition, 2016
Source: Agency for Healthcare Research and Quality (AHRQ), Center for Delivery, Organization, and Markets, Healthcare Cost and Utilization Project (HCUP), Nationwide Readmissions Database (NRD), 2016
19.4
19.9
24.4
23.1
13.5
31.1
14.9
23.2
0 10 20 30 40 50
Underweight(N=20,916)
Weight loss,failure to thrive
(N=66,420)
Protein-caloriemalnutrition(N=291,725)
Cachexia(N=32,364)
Nutritional neglect(N=508)
Postsurgicalnonabsorption
(N=8,430)
No malnutrition(N=3,353,541)
Any malnutrition(N=420,362)
Rate of Readmission per 100 Non-maternal and Non-neonatal Index Stays
Pre
sen
ce
an
d T
yp
e o
f M
aln
utr
itio
n(N
um
be
r o
f R
ea
dm
issi
on
s)
Presence of malnutrition
Type of malnutrition

HCUP (08/30/18) 5 Malnutrition Hosptializations
Patient Characteristics
All Malnutrition-Related Inpatient Stays Table 1 shows that the mean patient age among non-maternal and non-neonatal inpatient stays related to malnutrition was highest for cachexia (68.4 years), protein-calorie malnutrition (66.0 years), and underweight (64.8 years). Mean patient age was approximately 20 years younger for malnutrition-related inpatient stays involving postsurgical non-absorption (46.0 years) and nutritional neglect (43.7 years).
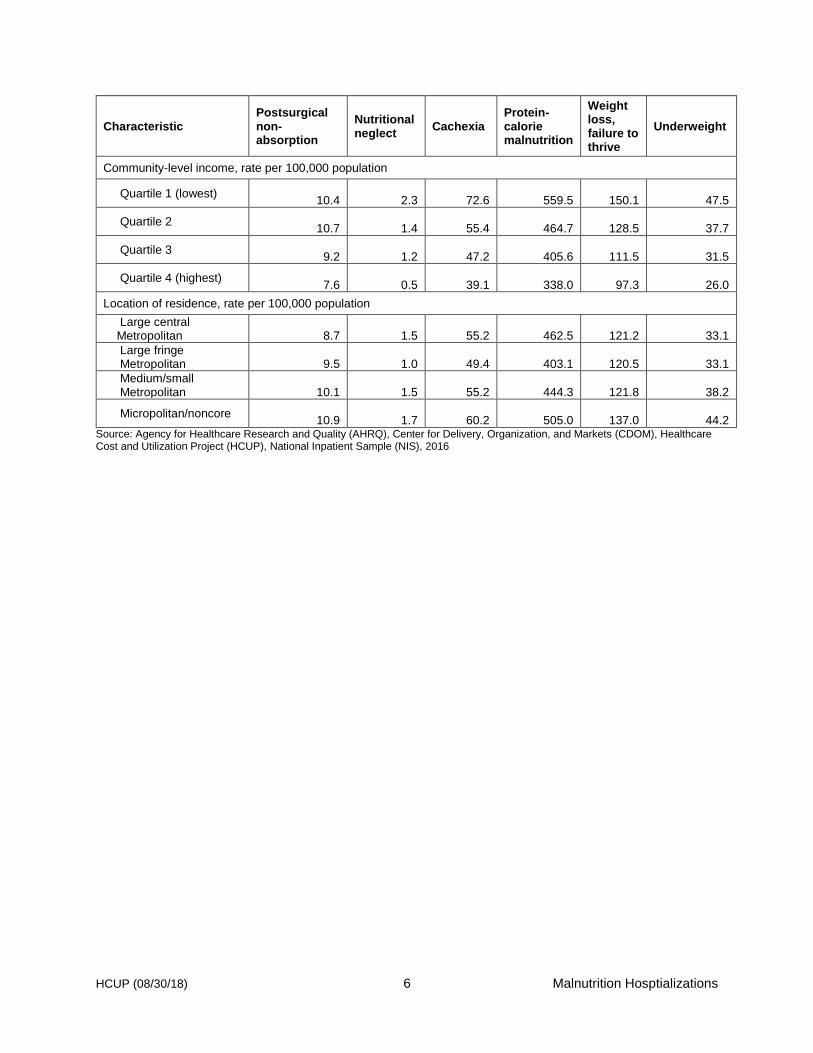
Across all six types of malnutrition-related inpatient stays, the rate of hospitalization was generally highest in low-income communities and decreased progressively with increases in median community income level. Focusing on the most common type of malnutrition (protein-calorie malnutrition), there were 559 inpatient stays per 100,000 population in the lowest-median income communities (quartile 1) compared with 338 stays per 100,000 in the highest-median income communities (quartile 4).
Table 1. Characteristics by malnutrition type among non-maternal and non-neonatal inpatient stays related to malnutrition, 2016
Characteristic Postsurgical non-absorption
Nutritional neglect
Cachexia Protein-calorie malnutrition
Weight loss, failure to thrive
Underweight
Total number
31,100
4,460
177,640
1,454,045
400,075
117,280
Rate per 100,000 population
9.6
1.4
55.1
451.0
124.1
36.4
Age, mean 46.0 43.7 68.4 66.0 58.6 64.8
Age, rate per 100,000 population
< 18
8.5
2.6
1.6
41.4
91.9
3.0
18–39
4.2
0.1
9.7
106.8
22.4
15.5
40–64
11.8
0.5
54.2
436.8
82.0
30.8
65–84
17.8
3.1
180.2
1,487.1
354.1
105.6
85+
12.6
9.5
547.1
3,753.7
1,186.8
374.0
Sex, rate per 100,000 population
Male
7.2
1.2
57.1
444.1
124.9
27.9
Female
12.0
1.6
53.0
456.9
123.0
44.5
Race/ethnicity, rate per 100,000 population
White
10.4
1.1
57.1
486.7
129.3
41.4
Black
10.7
2.8
84.5
556.7
155.8
45.4
Hispanic
4.8
0.8
23.9
207.9
63.7
11.5
Other
4.4
1.1
40.5
316.9
86.4
24.3
HCUP (08/30/18) 6 Malnutrition Hosptializations
Characteristic Postsurgical non-absorption
Nutritional neglect
Cachexia Protein-calorie malnutrition
Weight loss, failure to thrive
Underweight
Community-level income, rate per 100,000 population
Quartile 1 (lowest)
10.4
2.3
72.6
559.5
150.1
47.5
Quartile 2
10.7
1.4
55.4
464.7
128.5
37.7
Quartile 3
9.2
1.2
47.2
405.6
111.5
31.5
Quartile 4 (highest)
7.6
0.5
39.1
338.0
97.3
26.0
Location of residence, rate per 100,000 population
Large central Metropolitan
8.7
1.5
55.2
462.5
121.2
33.1
Large fringe Metropolitan
9.5
1.0
49.4
403.1
120.5
33.1
Medium/small Metropolitan
10.1
1.5
55.2
444.3
121.8
38.2
Micropolitan/noncore
10.9
1.7
60.2
505.0
137.0
44.2 Source: Agency for Healthcare Research and Quality (AHRQ), Center for Delivery, Organization, and Markets (CDOM), Healthcare Cost and Utilization Project (HCUP), National Inpatient Sample (NIS), 2016

HCUP (08/30/18) 7 Malnutrition Hosptializations
Figure 3 shows the expected payer distribution by type of malnutrition among non-maternal and non-neonatal stays related to malnutrition. For reference, the expected payer distribution of all 2016 non-maternal, non-neonatal stays is also provided.
Compared with all non-maternal, non-neonatal inpatient stays in 2016, a higher proportion of stays involving postsurgical non-absorption and nutritional neglect had an expected primary payer of Medicaid (26.0 and 42.2 percent, respectively, vs. 16.8 percent for all stays). Among the other four types of malnutrition-related inpatient stays, between 56.3 and 66.0 percent of stays had an expected primary payer of Medicare compared with only half of all non-maternal, non-neonatal stays (50.9 percent).
Figure 3. Distribution of expected payer by malnutrition type among non-maternal and non-neonatal inpatient stays related to malnutrition, 2016
Source: Agency for Healthcare Research and Quality (AHRQ), Center for Delivery, Organization, and Markets (CDOM), Healthcare Cost and Utilization Project (HCUP), National Inpatient Sample (NIS), 2016
HCUP (08/30/18) 8 Malnutrition Hosptializations
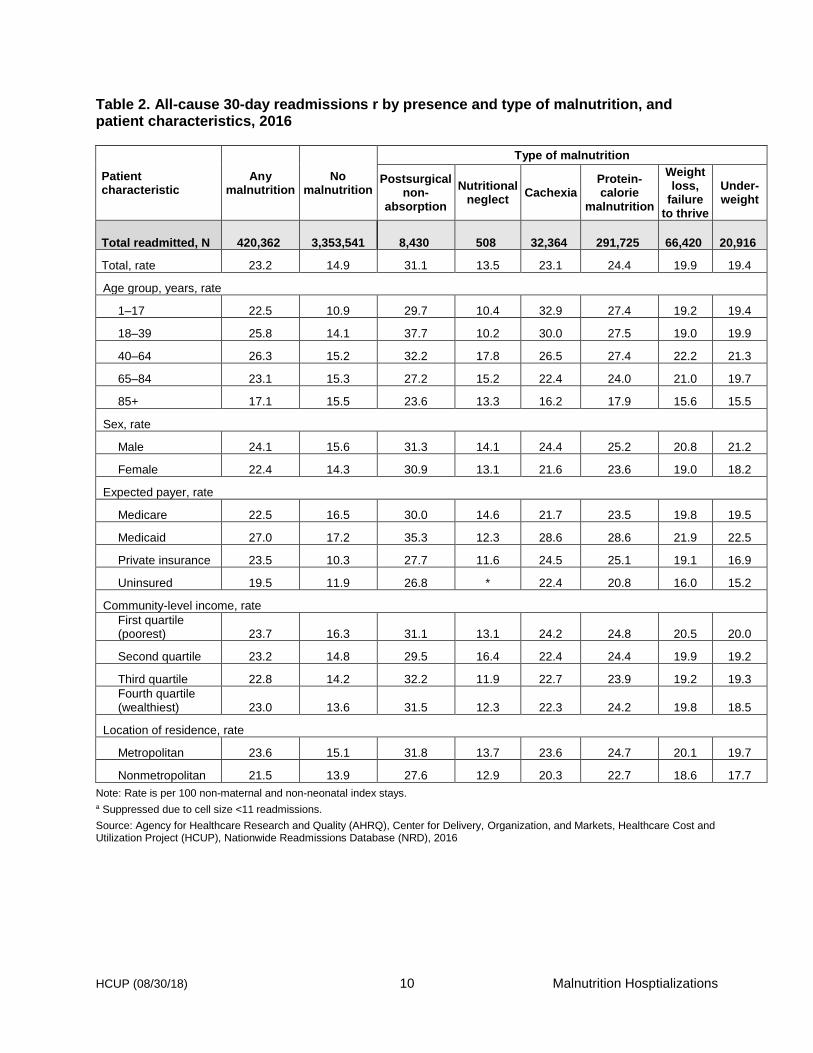
Readmissions for Malnutrition-Related Inpatient Stays Whereas the readmission rate among index stays without malnutrition increased with age (Figure 4), the readmission rate among non-maternal and non-neonatal index stays for patients with any type of malnutrition was highest among adults aged 40–64 (26.3 per 100 index stays) and 18–39 years (25.8) and lowest among older adults aged 85+ years (17.1).
Among malnutrition-related index stays with an expected payer of Medicare, over a quarter of stays were followed by a 30-day readmission for any cause (27.0 per index stays). In comparison, the rate was 23.5 for stays with an expected payer of private insurance, 22.5 for stays with Medicare, and 19.5 for uninsured index stays with malnutrition.
In each payer category, the readmission rate was higher for malnutrition-related index stays than for those without malnutrition, particularly among stays for patients with private insurance (23.0 per 100 index stays involving malnutrition vs. 10.3 per 100 index stays without malnutrition).
Compared to index stays without malnutrition, the readmission rate among malnutrition-related index stays was similar across all four median community income levels (approximately 23–24 readmissions per 100 index stays). In each income quartile, the readmission rate was higher with malnutrition-related index stays than for those without malnutrition.
Further detail on the characteristics of readmissions involving malnutrition in 2016 is provided in Figure 4 and Table 2.

HCUP (08/30/18) 9 Malnutrition Hosptializations
Figure 4. All-cause 30-day readmissions among non-maternal and non-neonatal inpatient stays related to malnutrition versus those without malnutrition, by patient characteristics, 2016
Source: Agency for Healthcare Research and Quality (AHRQ), Center for Delivery, Organization, and Markets, Healthcare Cost and Utilization Project (HCUP), Nationwide Readmissions Database (NRD), 2016
HCUP (08/30/18) 10 Malnutrition Hosptializations
Table 2. All-cause 30-day readmissions r by presence and type of malnutrition, and patient characteristics, 2016
Patient characteristic
Any malnutrition
No malnutrition
Type of malnutrition
Postsurgical non-
absorption
Nutritional neglect
Cachexia Protein- calorie
malnutrition
Weight loss,
failure to thrive
Under-weight
Total readmitted, N 420,362 3,353,541 8,430 508 32,364 291,725 66,420 20,916
Total, rate 23.2 14.9 31.1 13.5 23.1 24.4 19.9 19.4
Age group, years, rate
1–17 22.5 10.9 29.7 10.4 32.9 27.4 19.2 19.4
18–39 25.8 14.1 37.7 10.2 30.0 27.5 19.0 19.9
40–64 26.3 15.2 32.2 17.8 26.5 27.4 22.2 21.3
65–84 23.1 15.3 27.2 15.2 22.4 24.0 21.0 19.7
85+ 17.1 15.5 23.6 13.3 16.2 17.9 15.6 15.5
Sex, rate
Male 24.1 15.6 31.3 14.1 24.4 25.2 20.8 21.2
Female 22.4 14.3 30.9 13.1 21.6 23.6 19.0 18.2
Expected payer, rate
Medicare 22.5 16.5 30.0 14.6 21.7 23.5 19.8 19.5
Medicaid 27.0 17.2 35.3 12.3 28.6 28.6 21.9 22.5
Private insurance 23.5 10.3 27.7 11.6 24.5 25.1 19.1 16.9
Uninsured 19.5 11.9 26.8 * 22.4 20.8 16.0 15.2
Community-level income, rate
First quartile (poorest) 23.7 16.3 31.1 13.1 24.2 24.8 20.5 20.0
Second quartile 23.2 14.8 29.5 16.4 22.4 24.4 19.9 19.2
Third quartile 22.8 14.2 32.2 11.9 22.7 23.9 19.2 19.3
Fourth quartile (wealthiest) 23.0 13.6 31.5 12.3 22.3 24.2 19.8 18.5
Location of residence, rate
Metropolitan 23.6 15.1 31.8 13.7 23.6 24.7 20.1 19.7
Nonmetropolitan 21.5 13.9 27.6 12.9 20.3 22.7 18.6 17.7
Note: Rate is per 100 non-maternal and non-neonatal index stays. a Suppressed due to cell size <11 readmissions.
Source: Agency for Healthcare Research and Quality (AHRQ), Center for Delivery, Organization, and Markets, Healthcare Cost and Utilization Project (HCUP), Nationwide Readmissions Database (NRD), 2016

HCUP (08/30/18) 11 Malnutrition Hosptializations
Outcomes Related to Malnutrition
All Malnutrition-Related Inpatient Stays In 2016, the aggregate cost of all non-maternal and non-neonatal inpatient stays was $389.1 billion (data not shown). Non-maternal and non-neonatal inpatient stays related to malnutrition accounted for nearly $49 billion (Table 3), or 12.6 percent of these aggregate hospital costs. In contrast, as described earlier, malnutrition-related inpatient stays constituted only 8.1 percent of all non-maternal and non-neonatal inpatient stays in 2016.
Table 3. Admission and discharge characteristics and outcomes by malnutrition type for non-maternal and non-neonatal inpatient stays related to malnutrition, 2016
Characteristic or outcome
Postsurgical non-
absorption
Nutritional neglect
Cachexia Protein-calorie
malnutrition
Weight loss, failure to
thrive Underweight
Total number
31,100
4,460
177,640
1,454,045
400,075
117,280
Admissions
Malnutrition present on admission, %
93.4
87.8
96.0
91.9
94.3 *
Malnutrition as secondary diagnosis only, % 93.4 81.4 99.9 99.3 96.8 100.0
Elective admission, % 12.5 7.0 6.7 10.4 11.5 11.4
ED services, % 66.0 70.9 79.1 70.6 69.1 73.6
Discharge status, %
Routine Discharge 52.9 44.6 29.7 31.1 46.5 48.4
Transfer to another acute care hospital 2.9 3.4 2.4 2.8 2.5 2.3
Transfer to another facility 13.4 36.7 32.4 36.0 28.0 26.0
Home health Care 27.6 12.2 22.7 21.3 17.2 18.1
Against medical advice 0.8 0.3 1.5 1.0 0.9 1.4
Died during hospital stay 2.2 2.6 11.2 7.6 4.8 3.6
Outcomes
Length of stay, mean days 9.8 11.2 7.5 10.1 6.9 6.2
Hospital costs, mean $ 26,146 19,426 17,614 25,535 16,707 13,485
Aggregate hospital costs, mean, millions $ 813,130,482 86,642,135 3,128,867,307 37,129,434,545 6,684,082,320 1,581,548,865
* Because two frequent codes in the underweight malnutrition type (Z681 and Z6851) are exempt from present-on-admission reporting, this information is not reported. Source: Agency for Healthcare Research and Quality (AHRQ), Center for Delivery, Organization, and Markets (CDOM), Healthcare Cost and Utilization Project (HCUP), National Inpatient Sample (NIS), 2016

HCUP (08/30/18) 12 Malnutrition Hosptializations
Malnutrition-related inpatient stays for all six types of malnutrition except underweight cost more than all non-maternal, non-neonatal inpatient stays in 2016 ($13,900), ranging from 17 percent times more costly for weight loss or failure to thrive diagnoses to twice as costly for protein-calorie malnutrition (Figure 5).
Figure 5. Average hospital costs by malnutrition type, 2016
Source: Agency for Healthcare Research and Quality (AHRQ), Center for Delivery, Organization, and Markets (CDOM), Healthcare Cost and Utilization Project (HCUP), National Inpatient Sample (NIS), 2016

HCUP (08/30/18) 13 Malnutrition Hosptializations
Malnutrition-related inpatient stays for all six types of malnutrition except postsurgical non-absorption had a substantially higher proportion of in-hospital deaths (Figure 6) compared with all non-maternal, non-neonatal inpatient stays in 2016 (2.4 percent). For malnutrition-related stays, the in-hospital deaths ranged from 3.6 percent for underweight diagnoses to 11.2 percent for cachexia.
Figure 6. Percentage of non-maternal and non-neonatal stays that resulted in in-hospital death by malnutrition type, 2016
Source: Agency for Healthcare Research and Quality (AHRQ), Center for Delivery, Organization, and Markets (CDOM), Healthcare Cost and Utilization Project (HCUP), National Inpatient Sample (NIS), 2016

HCUP (08/30/18) 14 Malnutrition Hosptializations
Compared with the average length of all non-maternal, non-neonatal inpatient stays (5.0 days), malnutrition-related inpatient stays for all six types of malnutrition (Figure 7) were longer on average, ranging from 1.2 days longer for underweight diagnoses (6.2 days) to more than twice as long for protein-calorie malnutrition (11.2 days).
Figure 7. Average length of by malnutrition type among non-maternal and non-neonatal inpatient stays related to malnutrition, 2016
Source: Agency for Healthcare Research and Quality (AHRQ), Center for Delivery, Organization, and Markets (CDOM), Healthcare Cost and Utilization Project (HCUP), National Inpatient Sample (NIS), 2016
HCUP (08/30/18) 15 Malnutrition Hosptializations
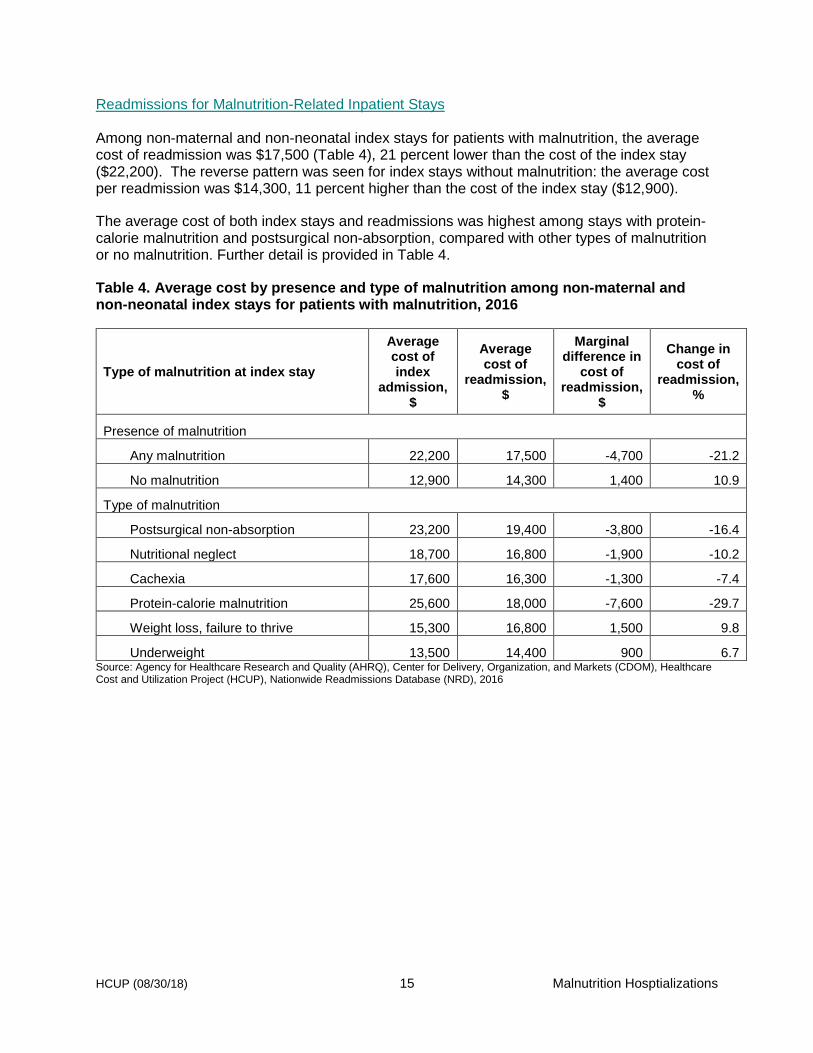
Readmissions for Malnutrition-Related Inpatient Stays Among non-maternal and non-neonatal index stays for patients with malnutrition, the average cost of readmission was $17,500 (Table 4), 21 percent lower than the cost of the index stay ($22,200). The reverse pattern was seen for index stays without malnutrition: the average cost per readmission was $14,300, 11 percent higher than the cost of the index stay ($12,900).
The average cost of both index stays and readmissions was highest among stays with protein-calorie malnutrition and postsurgical non-absorption, compared with other types of malnutrition or no malnutrition. Further detail is provided in Table 4.
Table 4. Average cost by presence and type of malnutrition among non-maternal and non-neonatal index stays for patients with malnutrition, 2016
Type of malnutrition at index stay
Average cost of index
admission, $
Average cost of
readmission, $
Marginal difference in
cost of readmission,
$
Change in cost of
readmission, %
Presence of malnutrition
Any malnutrition 22,200 17,500 -4,700 -21.2
No malnutrition 12,900 14,300 1,400 10.9
Type of malnutrition
Postsurgical non-absorption 23,200 19,400 -3,800 -16.4
Nutritional neglect 18,700 16,800 -1,900 -10.2
Cachexia 17,600 16,300 -1,300 -7.4
Protein-calorie malnutrition 25,600 18,000 -7,600 -29.7
Weight loss, failure to thrive 15,300 16,800 1,500 9.8
Underweight 13,500 14,400 900 6.7 Source: Agency for Healthcare Research and Quality (AHRQ), Center for Delivery, Organization, and Markets (CDOM), Healthcare Cost and Utilization Project (HCUP), Nationwide Readmissions Database (NRD), 2016
HCUP (08/30/18) 16 Malnutrition Hosptializations
Most Common Principal Diagnoses
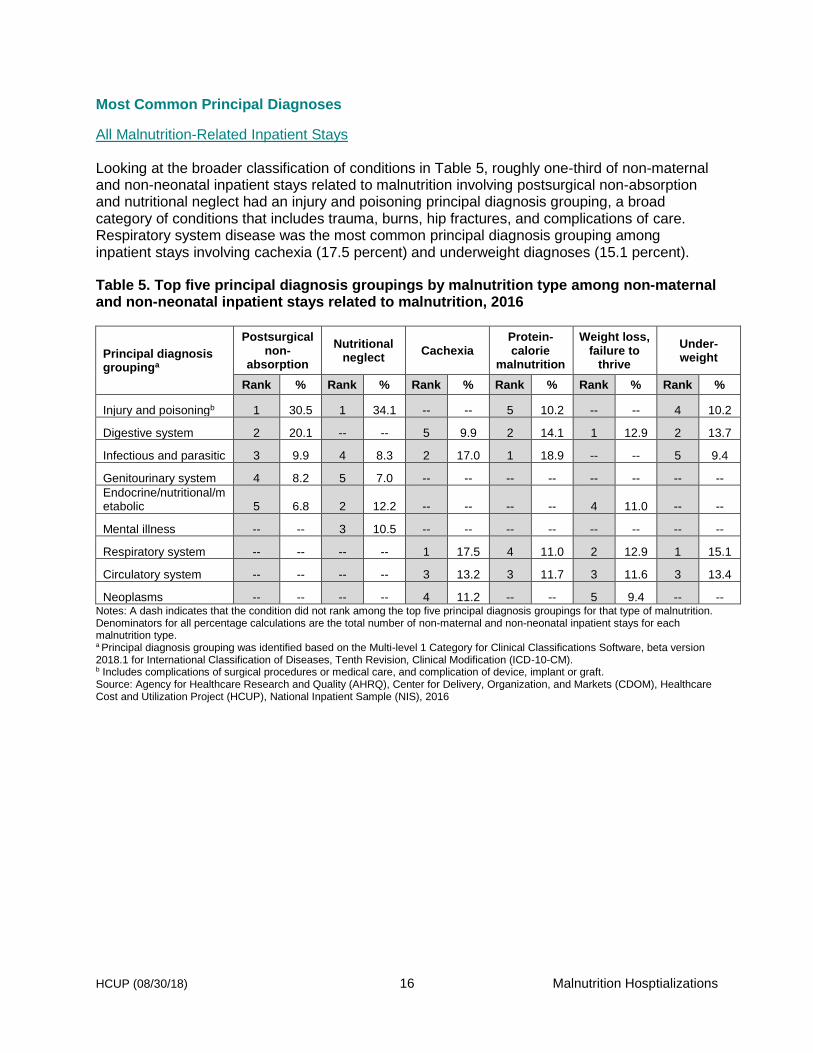
All Malnutrition-Related Inpatient Stays Looking at the broader classification of conditions in Table 5, roughly one-third of non-maternal and non-neonatal inpatient stays related to malnutrition involving postsurgical non-absorption and nutritional neglect had an injury and poisoning principal diagnosis grouping, a broad category of conditions that includes trauma, burns, hip fractures, and complications of care. Respiratory system disease was the most common principal diagnosis grouping among inpatient stays involving cachexia (17.5 percent) and underweight diagnoses (15.1 percent).
Table 5. Top five principal diagnosis groupings by malnutrition type among non-maternal and non-neonatal inpatient stays related to malnutrition, 2016
Principal diagnosis groupinga
Postsurgical non-
absorption
Nutritional neglect
Cachexia Protein- calorie
malnutrition
Weight loss, failure to
thrive
Under-weight
Rank % Rank % Rank % Rank % Rank % Rank %
Injury and poisoningb 1 30.5 1 34.1 -- -- 5 10.2 -- -- 4 10.2
Digestive system 2 20.1 -- -- 5 9.9 2 14.1 1 12.9 2 13.7
Infectious and parasitic 3 9.9 4 8.3 2 17.0 1 18.9 -- -- 5 9.4
Genitourinary system 4 8.2 5 7.0 -- -- -- -- -- -- -- --
Endocrine/nutritional/metabolic 5 6.8 2 12.2 -- -- -- -- 4 11.0 -- --
Mental illness -- -- 3 10.5 -- -- -- -- -- -- -- --
Respiratory system -- -- -- -- 1 17.5 4 11.0 2 12.9 1 15.1
Circulatory system -- -- -- -- 3 13.2 3 11.7 3 11.6 3 13.4
Neoplasms -- -- -- -- 4 11.2 -- -- 5 9.4 -- -- Notes: A dash indicates that the condition did not rank among the top five principal diagnosis groupings for that type of malnutrition. Denominators for all percentage calculations are the total number of non-maternal and non-neonatal inpatient stays for each malnutrition type. a Principal diagnosis grouping was identified based on the Multi-level 1 Category for Clinical Classifications Software, beta version 2018.1 for International Classification of Diseases, Tenth Revision, Clinical Modification (ICD-10-CM). b Includes complications of surgical procedures or medical care, and complication of device, implant or graft. Source: Agency for Healthcare Research and Quality (AHRQ), Center for Delivery, Organization, and Markets (CDOM), Healthcare Cost and Utilization Project (HCUP), National Inpatient Sample (NIS), 2016
HCUP (08/30/18) 17 Malnutrition Hosptializations
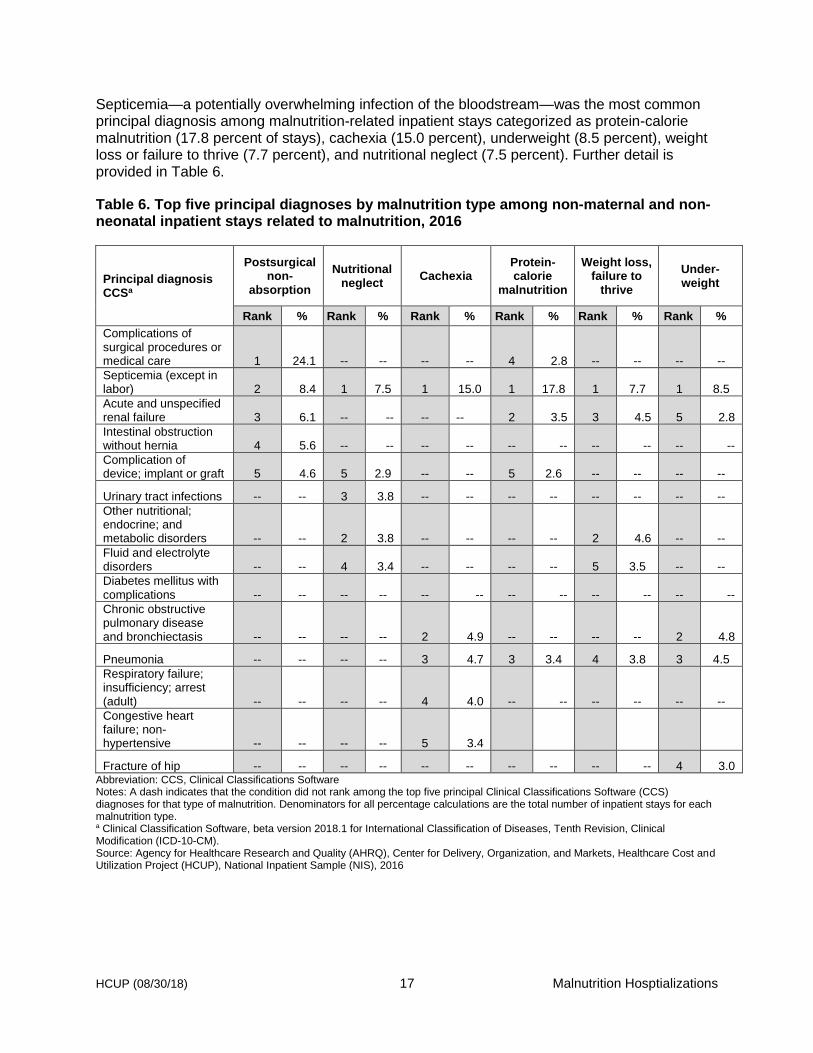
Septicemia—a potentially overwhelming infection of the bloodstream—was the most common principal diagnosis among malnutrition-related inpatient stays categorized as protein-calorie malnutrition (17.8 percent of stays), cachexia (15.0 percent), underweight (8.5 percent), weight loss or failure to thrive (7.7 percent), and nutritional neglect (7.5 percent). Further detail is provided in Table 6.
Table 6. Top five principal diagnoses by malnutrition type among non-maternal and non-neonatal inpatient stays related to malnutrition, 2016
Principal diagnosis CCSa
Postsurgical non-
absorption
Nutritional neglect
Cachexia Protein- calorie
malnutrition
Weight loss, failure to
thrive
Under-weight
Rank % Rank % Rank % Rank % Rank % Rank %
Complications of surgical procedures or medical care 1 24.1 -- -- -- -- 4 2.8 -- -- -- --
Septicemia (except in labor) 2 8.4 1 7.5 1 15.0 1 17.8 1 7.7 1 8.5
Acute and unspecified renal failure 3 6.1 -- -- -- -- 2 3.5 3 4.5 5 2.8
Intestinal obstruction without hernia 4 5.6 -- -- -- -- -- -- -- -- -- --
Complication of device; implant or graft 5 4.6 5 2.9 -- -- 5 2.6 -- -- -- --
Urinary tract infections -- -- 3 3.8 -- -- -- -- -- -- -- --
Other nutritional; endocrine; and metabolic disorders -- -- 2 3.8 -- -- -- -- 2 4.6 -- --
Fluid and electrolyte disorders -- -- 4 3.4 -- -- -- -- 5 3.5 -- --
Diabetes mellitus with complications -- -- -- -- -- -- -- -- -- -- -- --
Chronic obstructive pulmonary disease and bronchiectasis -- -- -- -- 2 4.9 -- -- -- -- 2 4.8
Pneumonia -- -- -- -- 3 4.7 3 3.4 4 3.8 3 4.5
Respiratory failure; insufficiency; arrest (adult) -- -- -- -- 4 4.0 -- -- -- -- -- --
Congestive heart failure; non-hypertensive -- -- -- -- 5 3.4
Fracture of hip -- -- -- -- -- -- -- -- -- -- 4 3.0 Abbreviation: CCS, Clinical Classifications Software Notes: A dash indicates that the condition did not rank among the top five principal Clinical Classifications Software (CCS) diagnoses for that type of malnutrition. Denominators for all percentage calculations are the total number of inpatient stays for each malnutrition type. a Clinical Classification Software, beta version 2018.1 for International Classification of Diseases, Tenth Revision, Clinical Modification (ICD-10-CM). Source: Agency for Healthcare Research and Quality (AHRQ), Center for Delivery, Organization, and Markets, Healthcare Cost and Utilization Project (HCUP), National Inpatient Sample (NIS), 2016
HCUP (08/30/18) 18 Malnutrition Hosptializations
Readmissions for Malnutrition-Related Inpatient Stays
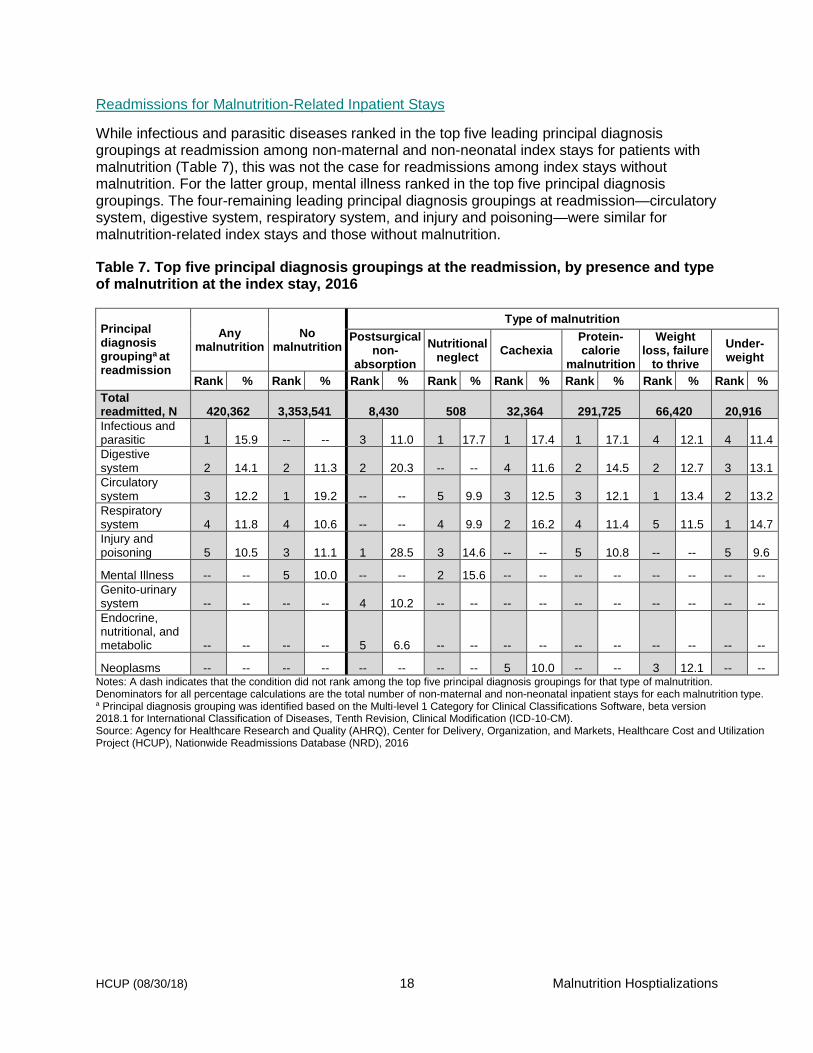
While infectious and parasitic diseases ranked in the top five leading principal diagnosis groupings at readmission among non-maternal and non-neonatal index stays for patients with malnutrition (Table 7), this was not the case for readmissions among index stays without malnutrition. For the latter group, mental illness ranked in the top five principal diagnosis groupings. The four-remaining leading principal diagnosis groupings at readmission—circulatory system, digestive system, respiratory system, and injury and poisoning—were similar for malnutrition-related index stays and those without malnutrition.
Table 7. Top five principal diagnosis groupings at the readmission, by presence and type of malnutrition at the index stay, 2016
Principal diagnosis groupinga at readmission
Any malnutrition
No malnutrition
Type of malnutrition
Postsurgical non-
absorption
Nutritional neglect
Cachexia Protein- calorie
malnutrition
Weight loss, failure
to thrive
Under-weight
Rank % Rank % Rank % Rank % Rank % Rank % Rank % Rank %
Total readmitted, N 420,362 3,353,541 8,430 508 32,364 291,725 66,420 20,916
Infectious and parasitic 1 15.9 -- -- 3 11.0 1 17.7 1 17.4 1 17.1 4 12.1 4 11.4
Digestive system 2 14.1 2 11.3 2 20.3 -- -- 4 11.6 2 14.5 2 12.7 3 13.1
Circulatory system 3 12.2 1 19.2 -- -- 5 9.9 3 12.5 3 12.1 1 13.4 2 13.2
Respiratory system 4 11.8 4 10.6 -- -- 4 9.9 2 16.2 4 11.4 5 11.5 1 14.7
Injury and poisoning 5 10.5 3 11.1 1 28.5 3 14.6 -- -- 5 10.8 -- -- 5 9.6
Mental Illness -- -- 5 10.0 -- -- 2 15.6 -- -- -- -- -- -- -- --
Genito-urinary system -- -- -- -- 4 10.2 -- -- -- -- -- -- -- -- -- --
Endocrine, nutritional, and metabolic -- -- -- -- 5 6.6 -- -- -- -- -- -- -- -- -- --
Neoplasms -- -- -- -- -- -- -- -- 5 10.0 -- -- 3 12.1 -- -- Notes: A dash indicates that the condition did not rank among the top five principal diagnosis groupings for that type of malnutrition. Denominators for all percentage calculations are the total number of non-maternal and non-neonatal inpatient stays for each malnutrition type. a Principal diagnosis grouping was identified based on the Multi-level 1 Category for Clinical Classifications Software, beta version 2018.1 for International Classification of Diseases, Tenth Revision, Clinical Modification (ICD-10-CM). Source: Agency for Healthcare Research and Quality (AHRQ), Center for Delivery, Organization, and Markets, Healthcare Cost and Utilization Project (HCUP), Nationwide Readmissions Database (NRD), 2016
HCUP (08/30/18) 19 Malnutrition Hosptializations
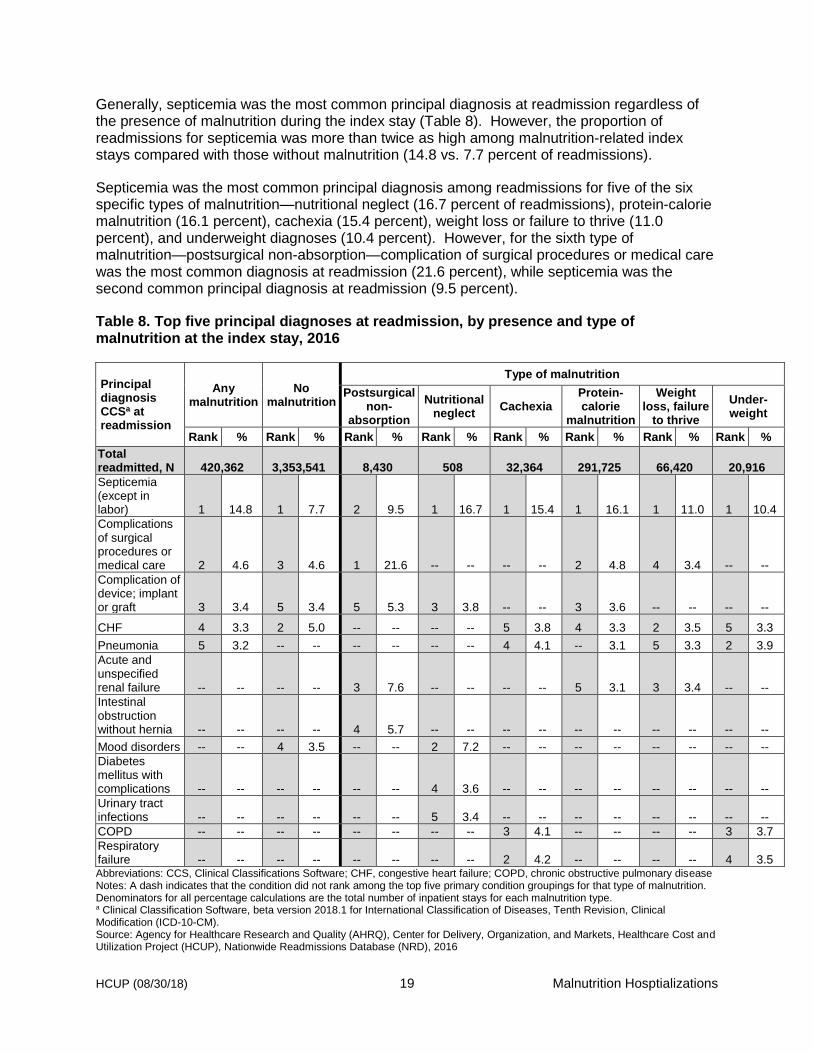
Generally, septicemia was the most common principal diagnosis at readmission regardless of the presence of malnutrition during the index stay (Table 8). However, the proportion of readmissions for septicemia was more than twice as high among malnutrition-related index stays compared with those without malnutrition (14.8 vs. 7.7 percent of readmissions).
Septicemia was the most common principal diagnosis among readmissions for five of the six specific types of malnutrition—nutritional neglect (16.7 percent of readmissions), protein-calorie malnutrition (16.1 percent), cachexia (15.4 percent), weight loss or failure to thrive (11.0 percent), and underweight diagnoses (10.4 percent). However, for the sixth type of malnutrition—postsurgical non-absorption—complication of surgical procedures or medical care was the most common diagnosis at readmission (21.6 percent), while septicemia was the second common principal diagnosis at readmission (9.5 percent).
Table 8. Top five principal diagnoses at readmission, by presence and type of malnutrition at the index stay, 2016
Principal diagnosis CCSa at readmission
Any malnutrition
No malnutrition
Type of malnutrition
Postsurgical non-
absorption
Nutritional neglect
Cachexia Protein- calorie
malnutrition
Weight loss, failure
to thrive
Under-weight
Rank % Rank % Rank % Rank % Rank % Rank % Rank % Rank %
Total readmitted, N 420,362 3,353,541 8,430 508 32,364 291,725 66,420 20,916
Septicemia (except in labor) 1 14.8 1 7.7 2 9.5 1 16.7 1 15.4 1 16.1 1 11.0 1 10.4
Complications of surgical procedures or medical care 2 4.6 3 4.6 1 21.6 -- -- -- -- 2 4.8 4 3.4 -- --
Complication of device; implant or graft 3 3.4 5 3.4 5 5.3 3 3.8 -- -- 3 3.6 -- -- -- --
CHF 4 3.3 2 5.0 -- -- -- -- 5 3.8 4 3.3 2 3.5 5 3.3
Pneumonia 5 3.2 -- -- -- -- -- -- 4 4.1 -- 3.1 5 3.3 2 3.9
Acute and unspecified renal failure -- -- -- -- 3 7.6 -- -- -- -- 5 3.1 3 3.4 -- --
Intestinal obstruction without hernia -- -- -- -- 4 5.7 -- -- -- -- -- -- -- -- -- --
Mood disorders -- -- 4 3.5 -- -- 2 7.2 -- -- -- -- -- -- -- --
Diabetes mellitus with complications -- -- -- -- -- -- 4 3.6 -- -- -- -- -- -- -- --
Urinary tract infections -- -- -- -- -- -- 5 3.4 -- -- -- -- -- -- -- --
COPD -- -- -- -- -- -- -- -- 3 4.1 -- -- -- -- 3 3.7
Respiratory failure -- -- -- -- -- -- -- -- 2 4.2 -- -- -- -- 4 3.5 Abbreviations: CCS, Clinical Classifications Software; CHF, congestive heart failure; COPD, chronic obstructive pulmonary disease Notes: A dash indicates that the condition did not rank among the top five primary condition groupings for that type of malnutrition. Denominators for all percentage calculations are the total number of inpatient stays for each malnutrition type. a Clinical Classification Software, beta version 2018.1 for International Classification of Diseases, Tenth Revision, Clinical Modification (ICD-10-CM). Source: Agency for Healthcare Research and Quality (AHRQ), Center for Delivery, Organization, and Markets, Healthcare Cost and Utilization Project (HCUP), Nationwide Readmissions Database (NRD), 2016

HCUP (08/30/18) 20 Malnutrition Hosptializations
APPENDIX A: HCUP PARTNERS
HCUP Partners in the 2016 National Inpatient Sample
State Data Organization
AK Alaska Department of Health and Social Services
AR Arkansas Department of Health
AZ Arizona Department of Health Services
CA California Office of Statewide Health Planning & Development
CO Colorado Hospital Association
CT Connecticut Hospital Association
DC District of Columbia Hospital Association
FL Florida Agency for Health Care Administration
GA Georgia Hospital Association
HI Hawaii Health Information Corporation
IA Iowa Hospital Association
IL Illinois Department of Public Health
IN Indiana Hospital Association
KS Kansas Hospital Association
KY Kentucky Cabinet for Health and Family Services
LA Louisiana Department of Health
MA Massachusetts Center for Health Information and Analysis
MD Maryland Health Services Cost Review Commission
ME Maine Health Data Organization
MI Michigan Health & Hospital Association
MN Minnesota Hospital Association
MO Missouri Hospital Industry Data Institute
MS Mississippi Department of Health

HCUP (08/30/18) 21 Malnutrition Hosptializations
State Data Organization
MT Montana Hospital Association
NC North Carolina Department of Health and Human Services
ND North Dakota (data provided by the Minnesota Hospital Association)
NE Nebraska Hospital Association
NJ New Jersey Department of Health
NM New Mexico Department of Health
NV Nevada Department of Health & Human Services
NY New York State Department of Health
OH Ohio Hospital Association
OK Oklahoma State Department of Health
OR Oregon Association of Hospitals and Health Systems
PA Pennsylvania Health Care Cost Containment Council
RI Rhode Island Department of Health
SC South Carolina Revenue and Fiscal Affairs Office
SD South Dakota Association of Healthcare Organizations
TN Tennessee Hospital Association
TX Texas Department of State Health Services
UT Utah Department of Health
VT Vermont Association of Hospitals and Health Systems
VA Virginia Health Information
WA Washington State Department of Health
WI Wisconsin Department of Health Services
WV West Virginia Health Care Authority
WY Wyoming Hospital Association

HCUP (08/30/18) 22 Malnutrition Hosptializations
HCUP Partners in the 2016 Nationwide Readmissions Database
State HCUP Data Source
Alaska Alaska Department of Health and Social Services
Arkansas Arkansas Department of Health
California California Office of Statewide Health Planning and Development
Florida Florida Agency for Health Care Administration
Georgia Georgia Hospital Association
Hawaii Hawaii Health Information Corporation
Iowa Iowa Hospital Association
Louisiana Louisiana Department of Health
Maryland Maryland Health Services Cost Review Commission
Massachusetts Massachusetts Center for Health Information and Analysis
Mississippi Mississippi Department of Health
Missouri Missouri Hospital Industry Data Institute
Nebraska Nebraska Hospital Association
Nevada Nevada Department of Health and Human Services
New Mexico New Mexico Department of Health
New York New York State Department of Health
Oregon Oregon Association of Hospitals and Health Systems
Pennsylvania Pennsylvania Health Care Cost Containment Council
South Carolina South Carolina Revenue and Fiscal Affairs Office
South Dakota South Dakota Association of Healthcare Organizations
Tennessee Tennessee Hospital Association
Utah Utah Department of Health
Vermont Vermont Association of Hospitals and Health Systems
Virginia Virginia Health Information
Washington Washington State Department of Health
Wisconsin Wisconsin Department of Health Services
Wyoming Wyoming Hospital Association
HCUP (08/30/18) 23 Malnutrition Hospitalizations
APPENDIX B: METHODS
This section describes the methods employed to calculate statistics for non-maternal and non-neonatal inpatient stays related to malnutrition using the 2016 HCUP NIS and NRD.
Definitions
Diagnoses, ICD-10-CM, Clinical Classifications Software (CCS), and Major Diagnostic Categories (MDCs) The principal diagnosis is that condition established after study to be chiefly responsible for the patient's admission to the hospital. ICD-10-CM is the International Classification of Diseases, Tenth Revision, Clinical Modification, which assigns numeric codes to diagnoses. There are over 70,000 ICD-10-CM diagnosis codes. CCS categorizes ICD-10-CM diagnosis codes into a manageable number of clinically meaningful categories15. This clinical grouper makes it easier to quickly understand patterns of diagnoses. CCS categories identified as Other typically are not reported; these categories include miscellaneous, otherwise unclassifiable diagnoses that may be difficult to interpret as a group. MDCs assign ICD-10-CM principal diagnosis codes to one of 25 general diagnosis categories
Non-maternal and non-neonatal inpatient stays related to malnutrition
Maternal and neonatal discharges, identified by Major Diagnostic Category (MDC) 14 (Pregnancy, Childbirth & the Puerperium) and MDC 15 (Newborns and Other Neonates with Conditions Originating in the Perinatal Period), were excluded from the analysis.
The six types of malnutrition were defined using the ICD-10-CM diagnosis codes listed in Table B.1. Each non-maternal and non-neonatal inpatient stay involving malnutrition was categorized into only one malnutrition type based on the following hierarchy:
1. Postsurgical non-absorption or nutritional neglect
2. Cachexia or protein-calorie malnutrition
3. Weight loss/failure to thrive or underweight
If a single inpatient record included multiple diagnosis codes indicating different types of malnutrition (e.g., nutritional neglect and underweight), the record was classified into the higher-ranked type of malnutrition (in this example, nutritional neglect). If both types of malnutrition at the same hierarchy level appeared on a discharge record (e.g., both postsurgical non-absorption and nutritional neglect), then the record was classified into the malnutrition type that appeared first on the record.
15 Agency for Healthcare Research and Quality. HCUP Clinical Classifications Software (CCS). Healthcare Cost and Utilization Project (HCUP). Rockville, MD: Agency for Healthcare Research and Quality. Updated October 2017. https://www.hcup-us.ahrq.gov/toolssoftware/ccs10/ccs10.jsp.

HCUP (08/30/18) 24 Malnutrition Hospitalizations
Table B.1. ICD-10-CM diagnosis codes used to identify the six types of malnutrition
Any mention of postsurgical non-absorption
K912: Postsurgical malabsorption, not elsewhere classified
Any mention of nutritional neglect
T7401XA: Adult neglect or abandonment, confirmed, initial encounter
T7401XD: Adult neglect or abandonment, confirmed, subsequent encounter
T7401XS: Adult neglect or abandonment, confirmed, sequela
T7402XA: Child neglect or abandonment, confirmed, initial encounter
T7402XD: Child neglect or abandonment, confirmed, subsequent encounter
T7402XS: Child neglect or abandonment, confirmed, sequela
T7601XA: Adult neglect or abandonment, suspected, initial encounter
T7601XD: Adult neglect or abandonment, suspected, subsequent encounter
T7601XS: Adult neglect or abandonment, suspected, sequela
T7602XA: Child neglect or abandonment, suspected, initial encounter
T7602XD: Child neglect or abandonment, suspected, subsequent encounter
T7602XS: Child neglect or abandonment, suspected, sequela
Any mention of cachexia
R64: Cachexia
Any mention of malnutrition
E40: Kwashiorkor
E41: Nutritional marasmus
E43: Unspecified severe protein-calorie malnutrition
E440: Moderate protein-calorie malnutrition
E441: Mild protein-calorie malnutrition
E45: Retarded development following protein-calorie malnutrition
E46: Unspecified protein-calorie malnutrition
Any mention of weight loss
R6251: Failure to thrive (child)
R627: Adult failure to thrive
R633: Feeding difficulties
R634: Abnormal weight loss
Any mention of underweight
R636: Underweight
Z681: Body mass index (BMI) 19 or less, adult
Z6851: Body mass index (BMI) pediatric, less than 5th percentile for age

HCUP (08/30/18) 25 Malnutrition Hospitalizations
Unit of analysis For malnutrition-related inpatient stays, the unit of analysis is the hospital discharge (i.e., the hospital stay), not a person or patient. This means that a person who is admitted to the hospital multiple times in 1 year will be counted each time as a separate discharge from the hospital.
For information related to readmissions, the unit of analysis is the index stay, not a person or patient. Every non-maternal and non-neonatal inpatient stay with a diagnosis of malnutrition is considered as a separate index stay. Thus, a single patient can be counted multiple times during the course of the January through November observation period. In addition, index stays do not require a prior “clean period” with no hospitalizations; that is, an inpatient stay may be a readmission for a prior index stay and also the index stay for a subsequent readmission. Inpatient stays were disqualified from the analysis as index stays if they could not be followed for 30 days for one of the following reasons: (1) the patient died in the hospital, (2) information on length of stay was missing, or (3) the patient was discharged in December.
Readmissions Readmissions could be for any cause; thus, malnutrition may or may not have been recorded at the time of readmission. Thirty-day readmission rates are presented for the six types of malnutrition and across patient characteristics. The 30-day readmission rate is defined as the number of index stays for each condition for which there was at least one subsequent hospital admission within 30 days, divided by the total number of index stays from January through November of the same year. That is, when patients are discharged from the hospital, they are followed for 30 days in the data. If any readmission to the same or different hospital occurs during this time period, the admission is counted as having a readmission. No more than one readmission is counted within the 30-day period, because the outcome measure assessed is “percentage of admissions that are readmitted.” If a patient was transferred to a different hospital on the same day or was transferred within the same hospital, the two events were considered a single stay and the second event was not counted as a readmission; that is, transfers were not counted as a readmission. In the case of admissions for which there was more than one readmission in the 30-day period, the data presented in this report reflect the characteristics and costs of the first readmission. Admission source and discharge status Admission source (also known as the patient's point of origin) indicates where the patient was located prior to admission to the hospital. Emergency admission indicates that the patient was admitted to the hospital through the emergency department. Admission from another hospital indicates that the patient was admitted to this hospital from another short-term, acute-care hospital. This usually signifies that the patient required the transfer in order to obtain more specialized services that the originating hospital could not provide. Admission from a long-term care facility indicates that the patient was admitted from a long-term facility such as a nursing home. Discharge status reflects the disposition of the patient at discharge from the hospital and includes the following six categories: routine (to home); transfer to another short-term hospital; other transfers (including skilled nursing facility, intermediate care, and another type of facility such as a nursing home); home health care; against medical advice (AMA); or died in the hospital.
Hospital costs
Total hospital charges were converted to costs using HCUP Cost-to-Charge Ratios based on hospital accounting reports from the Centers for Medicare & Medicaid Services (CMS).16 Costs reflect the actual expenses incurred in the production of hospital services, such as wages, supplies, and utility costs; charges
16 Agency for Healthcare Research and Quality. HCUP Cost-to-Charge Ratio (CCR) Files. Healthcare Cost and Utilization Project (HCUP). 2001–2016. Rockville, MD: Agency for Healthcare Research and Quality. Updated August 2018. http://www.hcup-us.ahrq.gov/db/state/costtocharge.jsp. Accessed August 16, 2018.

HCUP (08/30/18) 26 Malnutrition Hospitalizations
represent the amount a hospital billed for the case. For each hospital, a hospital-wide cost-to-charge ratio is used. Hospital charges reflect the amount the hospital billed for the entire inpatient stay and do not include professional (physician) fees. For the purposes of this report, mean costs are reported to the nearest hundred.
Expected payer Payer is the expected payer for the hospital stay. To make coding uniform across all HCUP data sources, payer combines detailed categories into general groups:
• Medicare: includes patients covered by fee-for-service and managed care Medicare • Medicaid: includes patients covered by fee-for-service and managed care Medicaid • Private Insurance: includes Blue Cross, commercial carriers, and private health maintenance
organizations (HMOs) and preferred provider organizations (PPOs) • Uninsured: includes an insurance status of self-pay and no charge • Other: includes Workers' Compensation, TRICARE/CHAMPUS, CHAMPVA, Title V, and other
government programs.
For this report, when more than one payer is listed for a hospital discharge, the first-listed payer is used.
Location of patient’s residence
Place of residence is based on the urban-rural classification scheme for U.S. counties developed by the National Center for Health Statistics (NCHS):
• Large Central Metropolitan: Central counties of metropolitan areas with 1 million or more residents • Large Fringe Metropolitan: Fringe counties of counties of metropolitan areas with 1 million or more
residents • Medium Metropolitan: Counties in metropolitan areas of 250,000-999,999 residents • Small Metropolitan: Counties in metropolitan areas of 50,000-249,999 residents • Micropolitan: Nonmetropolitan counties areas of 10,000 or more residents • Noncore: Nonmetropolitan and nonmicropolitan counties
Median community-level income Median community-level income is the median household income of the patient's ZIP Code of residence. Income levels are separated into population-based quartiles with cut-offs determined using ZIP Code demographic data obtained from Claritas.17 The income quartile is missing for patients who are homeless or foreign. About HCUP
The Healthcare Cost and Utilization Project (HCUP, pronounced "H-Cup") is a family of health care databases and related software tools and products developed through a Federal-State-Industry partnership and sponsored by the Agency for Healthcare Research and Quality (AHRQ). HCUP databases bring together the data collection efforts of State data organizations, hospital associations, and private data organizations (HCUP Partners) and the Federal government to create a national information resource of encounter-level health care data. HCUP includes the largest collection of longitudinal hospital care data in the United States, with all-payer, encounter-level information beginning in 1988. These databases enable research on a broad range of health policy issues, including cost and quality of health services, medical practice patterns, access to health care programs, and outcomes of treatments at the national, State, and local market levels. For more information about HCUP, visit www.hcup-us.ahrq.gov/.
17 Claritas. Claritas Demographic Profile by ZIP Code. https://claritas360.claritas.com/mybestsegments/

HCUP (08/30/18) 27 Malnutrition Hospitalizations
About the NIS The HCUP National Inpatient Sample (NIS) is a nationwide database of hospital inpatient stays. The NIS is nationally representative of all community hospitals (i.e., short-term, non-Federal, nonrehabilitation hospitals). The NIS includes all payers. It is drawn from a sampling frame that contains hospitals comprising more than 95 percent of all discharges in the United States. The vast size of the NIS allows the study of topics at the national and regional levels for specific subgroups of patients. In addition, NIS data are standardized across years to facilitate ease of use. Over time, the sampling frame for the NIS has changed; thus, the number of States contributing to the NIS varies from year to year. The NIS is intended for national estimates only; no State-level estimates can be produced. The 2012 NIS was redesigned to optimize national estimates. The redesign incorporates two critical changes:
• Revisions to the sample design—starting with 2012, the NIS is now a sample of discharge records from all HCUP-participating hospitals, rather than a sample of hospitals from which all discharges were retained (as is the case for NIS years before 2012).
• Revisions to how hospitals are defined—the NIS now uses the definition of hospitals and discharges supplied by the statewide data organizations that contribute to HCUP, rather than the definitions used by the American Hospital Association (AHA) Annual Survey of Hospitals.
For more information about the NIS, visit www.hcup-us.ahrq.gov/nisoverview.jsp.
About the NRD The HCUP Nationwide Readmissions Database (NRD) is a calendar-year, discharge-level database constructed from the HCUP State Inpatient Databases (SID) with verified patient linkage numbers that can be used to track a person across hospitals within a State. The NRD is designed to support various types of analyses of national readmission rates. The database includes discharges for patients with and without repeat hospital visits in a year and those who have died in the hospital. Repeat stays may or may not be related. The criteria to determine the relationship between hospital admissions are left to the analyst using the NRD. The NRD was constructed as a sample of convenience consisting of 100 percent of the eligible discharges. Discharge weights for national estimates are developed using the target universe of community hospitals (excluding rehabilitation and long-term acute care hospitals) in the United States. Over time, the sampling frame for the NRD will change; thus, the number of States contributing to the NRD will vary from year to year. The NRD is intended for national estimates only; no regional, State-, or hospital-specific estimates can be produced.
For more information about the NRD, visit www.hcup-us.ahrq.gov/nrdoverview.jsp.
Related Documents