Non-linear models for the prediction of specified design strengths of concretes development profile M. Aminul Haque * , Md. Rasel-Ul-Alam Department of Civil Engineering, Leading University, Sylhet-3100, Bangladesh Received 12 August 2015; revised 4 February 2016; accepted 18 April 2016 KEYWORDS Compressive strength; Strength prediction; Model correlation; Model validation Abstract Different concrete structures are designed according to their concrete strength require- ments. Consequently, concrete strength is one of the prime properties of concrete structures. In this study, compressive strength behavioral pattern of seven design strength concretes 21 MPa, 24 MPa, 28 MPa, 31 MPa, 35 MPa, 38 MPa and 42 MPa at curing ages of 3, 7, 14, 21, 28, 56, 90 and 180 days was examined. In order to evaluate the long term effects on compressive strength of target design concretes, 360 cylindrical samples were cast. On the basis of the existing experimental tested strength data, a polynomial equation based model having 2 degrees with fractional power of 0.5 degree interval of each term was found to have acceptable correlation for describing the compres- sive strength gaining profile with the tested concrete ages. Correlation of proposed model was jus- tified against the statistical point of view for examining the best fit profile with the observations. Apart from the correlation approach, the accuracy of the proposed model was validated with cor- responding experimental observations of target design concretes followed by the model parameters estimation with 95% confidence interval. From the predicted results, the study revealed that pro- posed polynomial equation based model possessed strong potential for predicting 3, 7, 14, 21, 28, 56, 90 and 180 days compressive strength of design concretes with high accuracy and trivial error rates. Ó 2016 Housing and Building National Research Center. Production and hosting by Elsevier B.V. This is an open access article under the CC BY-NC-ND license (http://creativecommons.org/licenses/by-nc-nd/ 4.0/). Introduction Compressive strength is the design property of concrete. An overall view of concrete quality is reflected by the concrete strength [1]. In addition, compressive strength is a structural engineering performance measure, employed for designing concrete structures [2]. In practice, design engineers use differ- ent specified concrete strengths to design the structural compo- nents. For instance, minimum compressive strengths (severe exposure) of concrete for interior slabs, foundations walls * Corresponding author. E-mail addresses: [email protected], [email protected] (M.A. Haque). Peer review under responsibility of Housing and Building National Research Center. Production and hosting by Elsevier HBRC Journal (2016) xxx, xxx–xxx Housing and Building National Research Center HBRC Journal http://ees.elsevier.com/hbrcj http://dx.doi.org/10.1016/j.hbrcj.2016.04.004 1687-4048 Ó 2016 Housing and Building National Research Center. Production and hosting by Elsevier B.V. This is an open access article under the CC BY-NC-ND license (http://creativecommons.org/licenses/by-nc-nd/4.0/). Please cite this article in press as: M.A. Haque, M. Rasel-Ul-Alam, Non-linear models for the prediction of specified design strengths of concretes development profile, HBRC Journal (2016), http://dx.doi.org/10.1016/j.hbrcj.2016.04.004 brought to you by CORE View metadata, citation and similar papers at core.ac.uk provided by Elsevier - Publisher Connector

Welcome message from author
This document is posted to help you gain knowledge. Please leave a comment to let me know what you think about it! Share it to your friends and learn new things together.
Transcript
HBRC Journal (2016) xxx, xxx–xxx
brought to you by COREView metadata, citation and similar papers at core.ac.uk
provided by Elsevier - Publisher Connector
Housing and Building National Research Center
HBRC Journal
http://ees.elsevier.com/hbrcj
Non-linear models for the prediction of specified
design strengths of concretes development profile
* Corresponding author.
E-mail addresses: [email protected], [email protected]
(M.A. Haque).
Peer review under responsibility of Housing and Building National
Research Center.
Production and hosting by Elsevier
http://dx.doi.org/10.1016/j.hbrcj.2016.04.0041687-4048 � 2016 Housing and Building National Research Center. Production and hosting by Elsevier B.V.This is an open access article under the CC BY-NC-ND license (http://creativecommons.org/licenses/by-nc-nd/4.0/).
Please cite this article in press as: M.A. Haque, M. Rasel-Ul-Alam, Non-linear models for the prediction of specified design strengths of concretes developmentHBRC Journal (2016), http://dx.doi.org/10.1016/j.hbrcj.2016.04.004
M. Aminul Haque *, Md. Rasel-Ul-Alam
Department of Civil Engineering, Leading University, Sylhet-3100, Bangladesh
Received 12 August 2015; revised 4 February 2016; accepted 18 April 2016
KEYWORDS
Compressive strength;
Strength prediction;
Model correlation;
Model validation
Abstract Different concrete structures are designed according to their concrete strength require-
ments. Consequently, concrete strength is one of the prime properties of concrete structures. In this
study, compressive strength behavioral pattern of seven design strength concretes 21 MPa, 24 MPa,
28 MPa, 31 MPa, 35 MPa, 38 MPa and 42 MPa at curing ages of 3, 7, 14, 21, 28, 56, 90 and
180 days was examined. In order to evaluate the long term effects on compressive strength of target
design concretes, 360 cylindrical samples were cast. On the basis of the existing experimental tested
strength data, a polynomial equation based model having 2 degrees with fractional power of 0.5
degree interval of each term was found to have acceptable correlation for describing the compres-
sive strength gaining profile with the tested concrete ages. Correlation of proposed model was jus-
tified against the statistical point of view for examining the best fit profile with the observations.
Apart from the correlation approach, the accuracy of the proposed model was validated with cor-
responding experimental observations of target design concretes followed by the model parameters
estimation with 95% confidence interval. From the predicted results, the study revealed that pro-
posed polynomial equation based model possessed strong potential for predicting 3, 7, 14, 21,
28, 56, 90 and 180 days compressive strength of design concretes with high accuracy and trivial
error rates.� 2016 Housing and Building National Research Center. Production and hosting by Elsevier B.V. This is
an open access article under the CC BY-NC-ND license (http://creativecommons.org/licenses/by-nc-nd/
4.0/).
Introduction
Compressive strength is the design property of concrete. An
overall view of concrete quality is reflected by the concretestrength [1]. In addition, compressive strength is a structuralengineering performance measure, employed for designing
concrete structures [2]. In practice, design engineers use differ-ent specified concrete strengths to design the structural compo-nents. For instance, minimum compressive strengths (severeexposure) of concrete for interior slabs, foundations walls
profile,
Nomenclature
ðf0cÞ compressive strength of concrete (MPa)
Ec, ME modulus of elasticity of concrete (MPa)fr, MR modulus of rupture of concrete (MPa)k modification factor for type of concretefsp, STS splitting tensile strength of concrete (MPa)
P maximum applied load on concrete (N)l length of the concrete sample (mm)d diameter of the concrete sample (mm)
MS weight of specimen at fully saturated conditiona & b model constant parameter
t curing age of concrete (day)
R2 (R-squared) coefficient of determinationRMSE root mean square errorNSE Nash-Sutcliffe efficiencyCMO correlated model option
OPC ordinary Portland cementSD standard deviationASTM American Society for Testing and Materials
MD weight of oven dried specimenACI American Concrete Institute
2 M.A. Haque, Md. Rasel-Ul-Alam
and garage floor slabs are 17 MPa, 21 MPa and 24 MParespectively [3].
Rashid and Mansur [4] provided data that concrete of com-pressive strength of 30 MPa was regarded as high strength inthe 1950s. Gradually, concretes of compressive strength of
40–50 MPa in the 1960s, 60 MPa in the 1970s, and 100 MPaand beyond in the 1980s have evolved and were used in struc-tures. Moreover, PCA [5] classified compressive strength of
concrete as normal, high, very high and ultra-high strengthof ranges from <50 MPa, 50–100 MPa, 100–150 MPa and>150 MPa respectively.
Dead loads and size of structural members can be reduced
using the specified design high strength concrete than the nor-mal strength concrete. Also, not only stronger but also light-weight durable structure can be designed with increasing the
high strength concrete application that also minimizes the costof the structures [5].
A numerous empirical equations have been used to predict
the physical properties and compressive strength of concrete todesign structural members. Therefore, prediction of concretestrength has been considered as an active area of researchand a considerable number of studies have been carried out.
Many attempts have been made to obtain a suitable mathe-matical Model which is capable of predicting concrete strengthat various ages with acceptable high accuracy [6,7]. Addition-
ally, early age strength prediction is very useful in reducingconstruction cost and ensuring safety of construction works.Furthermore, early age strength prediction has several practi-
cal applications [8]. Besides, a rapid and reliable concretestrength prediction would be of great significance [7] for theoverall construction processes.
In this research, the findings were divided into three sec-tions, physical properties of concrete constituent materials, dif-ferent behavioral pattern of specified strength concrete, andthe third approach was to develop a suitable high accuracy
mathematical Model for predicting the compressive strengthdevelopment profile of specified design concrete strength for21 MPa, 24 MPa, 28 MPa, 31 MPa, 35 MPa, 38 MPa and
Table 1 Physical properties of aggregates.
Properties UW (g/cm3) SG
CA 1.48 ± 0.12 2.75 ± 0
FM 1.54 ± 0.1 2.6 ± 0
Please cite this article in press as: M.A. Haque, M. Rasel-Ul-Alam, Non-linear modelsHBRC Journal (2016), http://dx.doi.org/10.1016/j.hbrcj.2016.04.004
42 MPa on the basis of curing age. ACI mix design procedurewas applied for all design strength concrete. All tests were con-
ducted in the laboratory of the Department of Civil Engineer-ing, Leading University, Sylhet, Bangladesh.
In this study, some non-linear models such as power equa-
tion, exponential equation, logarithmic equation and polyno-mial equation based model were applied to observe the bestcorrelated model profile for 21 MPa, 24 MPa, 28 MPa,
31 MPa, 35 MPa, 38 MPa and 42 MPa strength developmentwith curing age. The correlated model equations for eachtested design strength concrete may be potential of use forobserving the strength gaining pattern with the age of struc-
tures. The accuracy of the concrete strength predicted modelswas justified through statistic evaluation followed by valida-tion and checking the 95% confidence level of the estimated
model parameters.
Materials and experimental program
Physical properties of concrete materials
Coarse aggregate (CA)
Conventional CA was collected from the local stone crusher
areas. The higher and lower sizes of CA were 19 mm and12 mm. The unit weight (UW), specific gravity (SG), waterabsorption percentage (WA %) and water content of coarseaggregates were determined according to the ASTM standard
methods [9–11] respectively. A summary of test results is pre-sented in Table 1.
Fine aggregate (FA)
In the study, FA was collected from locally available naturalvalley sand collecting areas. Physical parameters of FA suchas unit weight, specific gravity, water absorption percentage
and fineness modulus (FM) were determined using the ASTMstandard methods [9,12–14] respectively. These parameterswere analyzed to compare the effect of sand on concrete prop-
WA (%) FM
.08 1.5 ± 0.05 –
.15 1.21 ± 0.06 2.45 ± 0.12
for the prediction of specified design strengths of concretes development profile,
Table 3 Concrete mixes of seven different specified compres-
sive strengths.
Design strength of
concrete (MPa)
Mixing proportion
(OPC:FA:CA)
W/C
ratio
Slump (cm)
21 1:2.52:3.40 0.59 7.3152 ± 0.45
24 1:2.20:3.10 0.535 6.35 ± 0.35
28 1:1.89:2.77 0.48 5.6642 ± 0.25
31 1:1.55:2.53 0.44 5.3848 ± 0.32
35 1:1.33:2.30 0.4 4.9276 ± 0.42
38 1:1.11:2.07 0.36 4.191 ± 0.28
42 1:0.90:1.84 0.32 3.429 ± 0.22
Non-linear models for the prediction of design strengths 3
erties. Each test was performed 3 times for confirming thereproducibility of experimental data [15]. Test results of FAare presented in Table 1.
Binding materials
In this research, only OPC was used as a binding material.OPC was purchased commercially from locally available
cement factory. Some crucial physical properties of OPC suchas normal fineness, consistency, initial setting time, final settingtime and specific gravity were determined using the ASTM
standard methods [16–19] respectively. To check the compres-sive strength of cement mortar, test was conducted using themethod adopted by ASTM [18] at 3 and 7 days curing ages.
Cement used for concrete samples, was type-I and 52.5 grade.A summary of the test results is shown in Table 2.
Design of concrete mixes
The concrete mixes were designed based on the nominal 28-day compressive strength of 21 MPa, 24 MPa, 28 MPa,31 MPa, 35 MPa, 38 MPa and 42 MPa, following the ACI
mix design procedure. Accordingly, the mixed proportions oftested design strengths are shown in Table 3.
Preparation of concrete samples
The concrete specimens were compacted, vibrated and moldedin a cylindrical mold of dimensions 6 in. (150 mm) dia. � 12 in.
(300 mm) height [20]. After 24 h of casting, cylindrical sampleswere demolded and cured in distilled water under the averagehumidity of 94% ± 1% at 250 ± 2 �C in the laboratory room.
pH of curing water was 7.0 using distilled water. ASTM stan-dards were applied regarding sampling, curing and testing [21].
Concrete properties
A total number of 360 concrete specimens were tested to deter-mine concrete properties including compressive strength, mod-ulus of elasticity, modulus of rupture and splitting tensile
strength of specified compressive strengths ranging from21 MPa to 42 MPa (3000–6000 psi). The variable investigatedin this study was only curing age.
Workability test
Concrete workability was measured in terms of slump valuesfollowing the method adopted by ASTM standard method
Table 2 Characteristics of OPC.
SL No. Characteristics Experi
(Avera
01 Fineness (%) 96.2 ±
02 Consistency (%) 26.2 ±
03 Initial setting time (min.) 126 ±
04 Final setting time (min.) 251 ±
05 Specific gravity 3.06 ±
06 Compressive strength (MPa)
3 days 1.43 ±
7 days 21 ±
28 days 37.2 ±
Please cite this article in press as: M.A. Haque, M. Rasel-Ul-Alam, Non-linear modelsHBRC Journal (2016), http://dx.doi.org/10.1016/j.hbrcj.2016.04.004
[22]. Slump test was performed three times on each mix forconfirming the accuracy of the results. A summary of slumptest results is shown in Table 3.
Water absorption test
The water absorption was measured in order to evaluatewhether there was an increase in the concrete structure’s pore
space as a result of constituents mixing and compactness.Water absorption of all samples was determined at ages 3, 7,14, 21, 28, 56, 90 and 180. Concrete samples were kept in fully
immersion condition until testing age. Water absorption afterimmersion was calculated using the following equation [23]:
% Water absorption ðWÞ ¼ ½ðMS �MDÞ=MD� � 100 ð1ÞWater absorption is expressed in percentage and the water
uptake relative to the dry mass. Test results are represented inTable 4.
Compressive strength
Compressive strength ðf0cÞ of studied specified design concretesamples (21 MPa, 24 MPa, 28 MPa, 31 MPa, 35 MPa,38 MPa and 42 MPa) samples was tested at concrete ages of
3, 7, 14, 21, 28, 56, 90 and 180 days and was moist cured untilthe time of testing. The samples were taken out of waterapproximately 24 h before testing and were kept in the air
dry condition in the laboratory [24]. Concrete samples weretested according to ASTM [25].
Modulus of elasticity
The modulus of elasticity is a measure of stiffness which can bedetermined from the compressive strength test of concretecylindrical samples. In this study, modulus of elasticity was
mented values ASTM standard
ge ± SD)
1.2 Not less than 90%
1.5 22–30% by cement weight
6 Not less than 45 min.
13 Not more than 375 min.
0.03 IS-2720 (3.15)
1.2 Minimum 12.0 MPa (ASTM standard)
1.65 Minimum 19.0 MPa (ASTM standard)
2.03 Minimum 28.0 MPa (ASTM standard)
for the prediction of specified design strengths of concretes development profile,
Table 4 Water absorption (%) results of all target design concretes strengths samples.
Design strength of concrete (MPa) 21 24 28 31 35 38 42
3 day 5.7 ± 1.9 4.5 ± 1.5 4.1 ± 1.36 3.65 ± 1.21 2.95 ± 0.98 1.98 ± 0.66 1.34 ± 0.44
7 day 6.6 ± 0.94 5.43 ± 0.77 5.15 ± 0.73 4.12 ± 0.58 3.35 ± 0.47 2.45 ± 0.35 1.76 ± 0.25
14 day 7.12 ± 0.50 5.85 ± 0.41 5.56 ± 0.39 4.42 ± 0.31 3.67 ± 0.26 2.63 ± 0.18 1.93 ± 0.13
21 day 7.39 ± 0.35 6.08 ± 0.28 5.71 ± 0.27 4.63 ± 0.22 3.95 ± 0.18 2.78 ± 0.13 2.03 ± 0.09
28 day 7.51 ± 0.26 6.21 ± 0.22 5.86 ± 0.20 4.8 ± 0.17 4.1 ± 0.14 2.89 ± 0.10 2.19 ± 0.07
56 day 7.68 ± 0.13 6.35 ± 0.11 6.02 ± 0.10 4.97 ± 0.08 4.21 ± 0.07 2.97 ± 0.05 2.28 ± 0.04
90 day 7.79 ± 0.08 6.45 ± 0.07 6.13 ± 0.06 5.12 ± 0.05 4.34 ± 0.04 3.08 ± 0.03 2.34 ± 0.02
180 day 7.86 ± 0.04 6.49 ± 0.03 6.23 ± 0.03 5.19 ± 0.02 4.43 ± 0.02 3.13 ± 0.01 2.4 ± 0.02
4 M.A. Haque, Md. Rasel-Ul-Alam
calculated using the ACI provided formula considering thesecant modulus [26]:
Ec ¼ 57; 000ffiffiffiffif 0c
qðpsiÞ ¼ 4700
ffiffiffiffif 0c
qðMPaÞ ð2Þ
The Eq. (2) can be used for concretes with strength up to6000 psi (42 MPa).
Modulus of rupture
Modulus of rupture is a measure of concrete strength beforerupture. It is also referred to as bending strength. In this study,
modulus of rupture was calculated according to ACI Codeequation [26]:
fr ¼ 7:5kffiffiffiffif 0c
qðpsiÞ ¼ 0:62k
ffiffiffiffif 0c
qðMPaÞ ð3Þ
where k is a modification factor that bears the values of 1.0,0.85 and 0.75 for normal-weight, sand-lightweight and all-lightweight concrete respectively.
Splitting tensile strength
Generally, splitting tensile strength is used in the design ofstructural concrete members to assess the shear resistance pro-
vided by concrete materials. Splitting tensile strength of speci-fied concrete strength was calculated using the standardmethod given by ASTM [27]:
fsp ¼2P
pldð4Þ
Concrete strength prediction models
Concrete compressive strength is influenced by many factors
including water/cement ratio, cement content and properties,aggregate type and its properties, etc. [8]. This study introducessimple mathematical model that can help to predict the rate of
compressive strength gain for different design concretestrengths at different ages. For better understanding the devel-opment pattern of some specified design concrete compressive
strengths such as 21 MPa, 24 MPa, 28 MPa, 31 MPa, 35 MPa,38 MPa and 42 MPa with curing ages, the four non-linear well-known empirical equation based models were used. Manyresearchers also used these models as only one independent
variable (curing age) type model equation. The mathematicalfeatures of the models were described below.
Polynomial equation based model
Plecas [28] adopted the polynomial equation based model up toits fourth terms with fraction power values to observe the better
Please cite this article in press as: M.A. Haque, M. Rasel-Ul-Alam, Non-linear modelsHBRC Journal (2016), http://dx.doi.org/10.1016/j.hbrcj.2016.04.004
leaching behavior of 137Cs from radioactive waste formation.In this study, this model equation was adopted to predict the
compressive strength of specified design concrete strength:
f0c ¼ a1 þ a2t1=2 þ a3t
1 þ a4t3=2 ½model 01� ð5Þ
Logarithmic equation based model
Abd elaty [8], Ukpata et al. Yeh [29] and Yeh [30] applied thelogarithmic equation based model to predict the compressivestrength of concrete in different conditions. The model equa-
tion is expressed below:
f0c ¼ aþ b lnðtÞ ½model 02� ð6Þ
Power equation based model
Resheidat and Madanat [21] and Yeh [30] adopted the powerequation based model to predict the compressive strength
where the dependent variable was compressive strength ðf0cÞand curing age (t) is an independent variable. The model equa-tion is expressed below:
f0c ¼ atb ½model 03� ð7Þ
Exponential equation based model
As the concrete strength development pattern is non-linear,exponential equation based model can be used to predict thestrength of different curing ages where the curing time (t,
day) is only an independent variable parameter. The modelequation is expressed below:
f0c ¼ aebt ½model 04� ð8Þ
Model evaluation
The adopted four non-linear models were compared to exper-imental generated data from laboratory tests followed by thejustification of the accuracy using statistical parameters such
as R2, RMSE and NSE. In general, the values of R2 range from0 to 1, with higher values indicating less error variance. How-ever typically the values of R2 greater than 0.5 are considered
acceptable [31–34]. RMSE values approaching toward 0 andNSE values being 1 indicate the best fit of the model profilewith the observations [31].
Model extension
In the current study, polynomial equation based model wasextended in different longer terms with 0.5 and 0.25 degree
for the prediction of specified design strengths of concretes development profile,
Non-linear models for the prediction of design strengths 5
intervals as trial basis using the least squares procedure fordemonstrating the best fit model of compressive strength devel-opment profile in a better way with high accuracy. The current
research adopted the following model options as trial basis towell correlate the proposed model for demonstrating the spec-ified design concrete strength development with concrete ages:
f0c ¼ a1 þ a2tþ a3t2 ½29� ½CMO1� ð9Þ
f0c ¼ a1 þ a2t1=2 þ a3tþ a4t
3=2 ½28� ½CMO2� ð10Þ
f0c ¼ a1 þ a2t1=2 þ a3tþ a4t
3=2 þ a5t2 ½35� ½CMO3� ð11Þ
f0c ¼ a1 þ a2t1=4 þ a3t
1=2 þ a4t3=4 þ a5tþ a6t
5=4 þ a7t3=2 ½CMO4�
ð12Þ
Results and discussion
Characteristics of design strengths
Cement based materials develop strength with continuedhydration. The rate of gain of strength is faster at start and
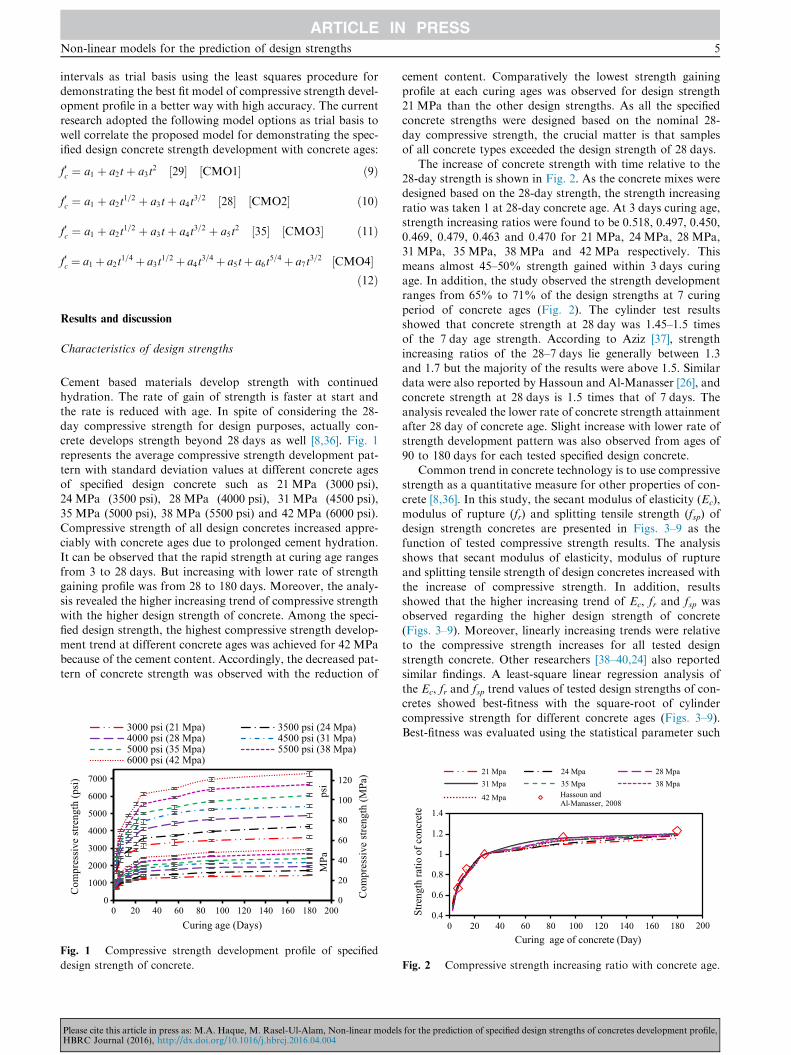
the rate is reduced with age. In spite of considering the 28-day compressive strength for design purposes, actually con-crete develops strength beyond 28 days as well [8,36]. Fig. 1
represents the average compressive strength development pat-tern with standard deviation values at different concrete agesof specified design concrete such as 21 MPa (3000 psi),24 MPa (3500 psi), 28 MPa (4000 psi), 31 MPa (4500 psi),
35 MPa (5000 psi), 38 MPa (5500 psi) and 42 MPa (6000 psi).Compressive strength of all design concretes increased appre-ciably with concrete ages due to prolonged cement hydration.
It can be observed that the rapid strength at curing age rangesfrom 3 to 28 days. But increasing with lower rate of strengthgaining profile was from 28 to 180 days. Moreover, the analy-
sis revealed the higher increasing trend of compressive strengthwith the higher design strength of concrete. Among the speci-fied design strength, the highest compressive strength develop-
ment trend at different concrete ages was achieved for 42 MPabecause of the cement content. Accordingly, the decreased pat-tern of concrete strength was observed with the reduction of
0
20
40
60
80
100
120
0
1000
2000
3000
4000
5000
6000
7000
0 20 40 60 80 100 120 140 160 180 200Curing age (Days)
Com
pres
sive
stre
ngth
(MPa
)
Com
pres
sive
stre
ngth
(psi
)
MPa
psi
3000 psi (21 Mpa) 3500 psi (24 Mpa)4000 psi (28 Mpa) 4500 psi (31 Mpa)5000 psi (35 Mpa) 5500 psi (38 Mpa)6000 psi (42 Mpa)
Fig. 1 Compressive strength development profile of specified
design strength of concrete.
Please cite this article in press as: M.A. Haque, M. Rasel-Ul-Alam, Non-linear modelsHBRC Journal (2016), http://dx.doi.org/10.1016/j.hbrcj.2016.04.004
cement content. Comparatively the lowest strength gainingprofile at each curing ages was observed for design strength21 MPa than the other design strengths. As all the specified
concrete strengths were designed based on the nominal 28-day compressive strength, the crucial matter is that samplesof all concrete types exceeded the design strength of 28 days.
The increase of concrete strength with time relative to the28-day strength is shown in Fig. 2. As the concrete mixes weredesigned based on the 28-day strength, the strength increasing
ratio was taken 1 at 28-day concrete age. At 3 days curing age,strength increasing ratios were found to be 0.518, 0.497, 0.450,0.469, 0.479, 0.463 and 0.470 for 21 MPa, 24 MPa, 28 MPa,31 MPa, 35 MPa, 38 MPa and 42 MPa respectively. This
means almost 45–50% strength gained within 3 days curingage. In addition, the study observed the strength developmentranges from 65% to 71% of the design strengths at 7 curing
period of concrete ages (Fig. 2). The cylinder test resultsshowed that concrete strength at 28 day was 1.45–1.5 timesof the 7 day age strength. According to Aziz [37], strength
increasing ratios of the 28–7 days lie generally between 1.3and 1.7 but the majority of the results were above 1.5. Similardata were also reported by Hassoun and Al-Manasser [26], and
concrete strength at 28 days is 1.5 times that of 7 days. Theanalysis revealed the lower rate of concrete strength attainmentafter 28 day of concrete age. Slight increase with lower rate ofstrength development pattern was also observed from ages of
90 to 180 days for each tested specified design concrete.Common trend in concrete technology is to use compressive
strength as a quantitative measure for other properties of con-
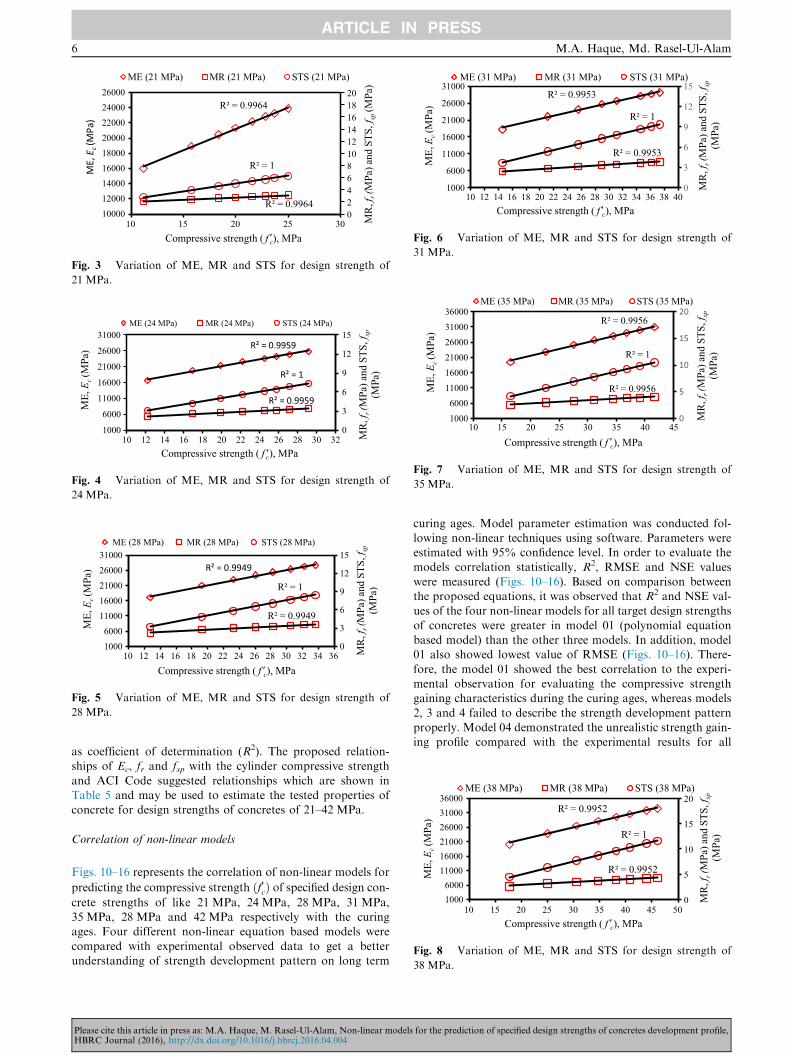
crete [8,36]. In this study, the secant modulus of elasticity (Ec),modulus of rupture (fr) and splitting tensile strength (fsp) ofdesign strength concretes are presented in Figs. 3–9 as the
function of tested compressive strength results. The analysisshows that secant modulus of elasticity, modulus of ruptureand splitting tensile strength of design concretes increased with
the increase of compressive strength. In addition, resultsshowed that the higher increasing trend of Ec, fr and fsp wasobserved regarding the higher design strength of concrete(Figs. 3–9). Moreover, linearly increasing trends were relative
to the compressive strength increases for all tested designstrength concrete. Other researchers [38–40,24] also reportedsimilar findings. A least-square linear regression analysis of
the Ec, fr and fsp trend values of tested design strengths of con-cretes showed best-fitness with the square-root of cylindercompressive strength for different concrete ages (Figs. 3–9).
Best-fitness was evaluated using the statistical parameter such
0.4
0.6
0.8
1
1.2
1.4
0 20 40 60 80 100 120 140 160 180 200
Stre
ngth
ratio
of c
oncr
ete
Curing age of concrete (Day)
21 Mpa 24 Mpa 28 Mpa31 Mpa 35 Mpa 38 Mpa
42 Mpa Hassoun and Al-Manasser, 2008
Fig. 2 Compressive strength increasing ratio with concrete age.
for the prediction of specified design strengths of concretes development profile,
R² = 0.9964
R² = 0.9964
R² = 1
02468101214161820
100001200014000160001800020000220002400026000
10 15 20 25 30 MR
, fr (
MPa
) and
STS
, fsp
(MPa
)
ME,
Ec (
MPa
)ME (21 MPa) MR (21 MPa) STS (21 MPa)
Compressive strength ( f c), MPa'
Fig. 3 Variation of ME, MR and STS for design strength of
21 MPa.
R² = 0.9959
R² = 0.9959
R² = 1
0
3
6
9
12
15
1000
6000
11000
16000
21000
26000
31000
10 12 14 16 18 20 22 24 26 28 30 32 MR
, fr (
MPa
) and
STS
, fsp
(M
Pa)
ME,
Ec (M
Pa)
ME (24 MPa) MR (24 MPa) STS (24 MPa)
Compressive strength ( f c), MPa'
Fig. 4 Variation of ME, MR and STS for design strength of
24 MPa.
R² = 0.9949
R² = 0.9949
R² = 1
0
3
6
9
12
15
10006000
1100016000210002600031000
10 12 14 16 18 20 22 24 26 28 30 32 34 36 MR
, fr (
MPa
) and
STS
, fsp
(M
Pa)
ME,
Ec (M
Pa)
ME (28 MPa) MR (28 MPa) STS (28 MPa)
Compressive strength ( f c), MPa'
Fig. 5 Variation of ME, MR and STS for design strength of
28 MPa.
R² = 0.9953
R² = 0.9953
R² = 1
0
3
6
9
12
15
1000
6000
11000
16000
21000
26000
31000
10 12 14 16 18 20 22 24 26 28 30 32 34 36 38 40
MR
, fr (
MPa
) and
STS
, fsp
(M
Pa)
ME,
Ec (M
Pa)
ME (31 MPa) MR (31 MPa) STS (31 MPa)
Compressive strength ( f c), MPa'
Fig. 6 Variation of ME, MR and STS for design strength of
31 MPa.
R² = 0.9956
R² = 0.9956
R² = 1
0
5
10
15
20
10006000
110001600021000260003100036000
10 15 20 25 30 35 40 45
MR
, fr (
MPa
) and
STS
, fsp
(M
Pa)
ME,
Ec (M
Pa)
ME (35 MPa) MR (35 MPa) STS (35 MPa)
Compressive strength ( f c), MPa'
Fig. 7 Variation of ME, MR and STS for design strength of
35 MPa.
R² = 0.9952
R² = 0.9952
R² = 1
0
5
10
15
20
10006000
110001600021000260003100036000
10 15 20 25 30 35 40 45 50
MR
, fr (
MPa
) and
STS
, fsp
(M
Pa)
ME,
Ec (M
Pa)
ME (38 MPa) MR (38 MPa) STS (38 MPa)
Compressive strength ( f c), MPa'
Fig. 8 Variation of ME, MR and STS for design strength of
38 MPa.
6 M.A. Haque, Md. Rasel-Ul-Alam
as coefficient of determination (R2). The proposed relation-ships of Ec, fr and fsp with the cylinder compressive strength
and ACI Code suggested relationships which are shown inTable 5 and may be used to estimate the tested properties ofconcrete for design strengths of concretes of 21–42 MPa.
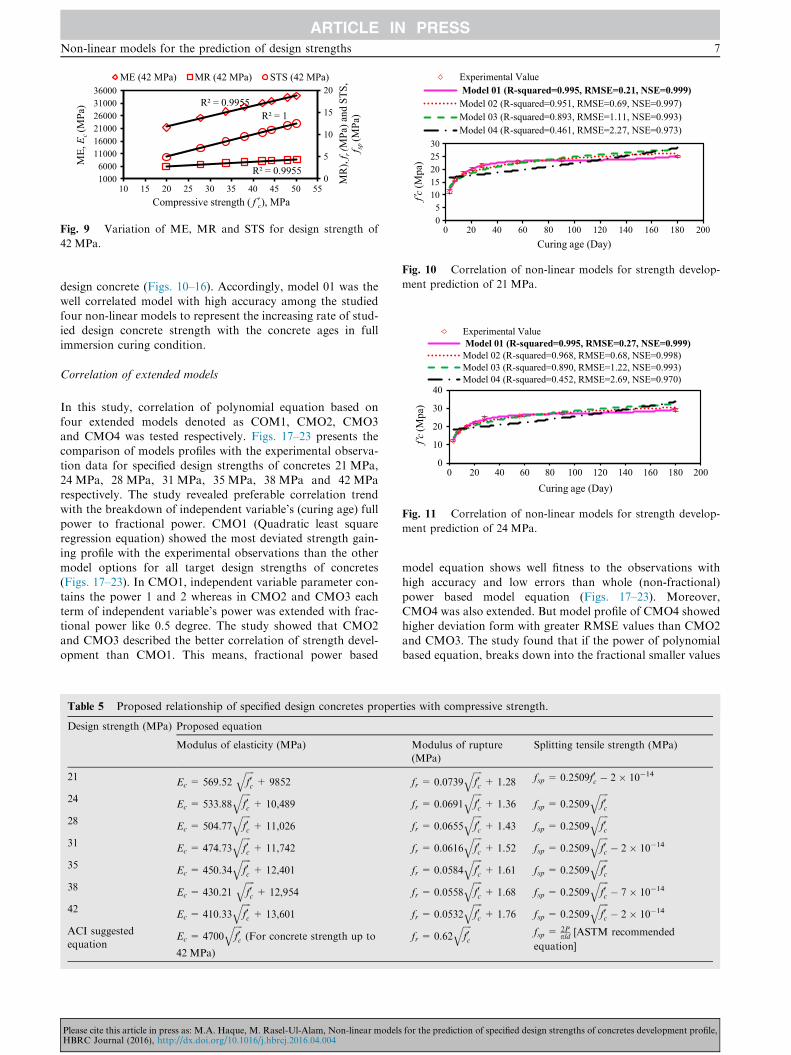
Correlation of non-linear models
Figs. 10–16 represents the correlation of non-linear models for
predicting the compressive strength ðf0cÞ of specified design con-
crete strengths of like 21 MPa, 24 MPa, 28 MPa, 31 MPa,35 MPa, 28 MPa and 42 MPa respectively with the curingages. Four different non-linear equation based models were
compared with experimental observed data to get a betterunderstanding of strength development pattern on long term
Please cite this article in press as: M.A. Haque, M. Rasel-Ul-Alam, Non-linear modelsHBRC Journal (2016), http://dx.doi.org/10.1016/j.hbrcj.2016.04.004
curing ages. Model parameter estimation was conducted fol-lowing non-linear techniques using software. Parameters wereestimated with 95% confidence level. In order to evaluate themodels correlation statistically, R2, RMSE and NSE values
were measured (Figs. 10–16). Based on comparison betweenthe proposed equations, it was observed that R2 and NSE val-ues of the four non-linear models for all target design strengths
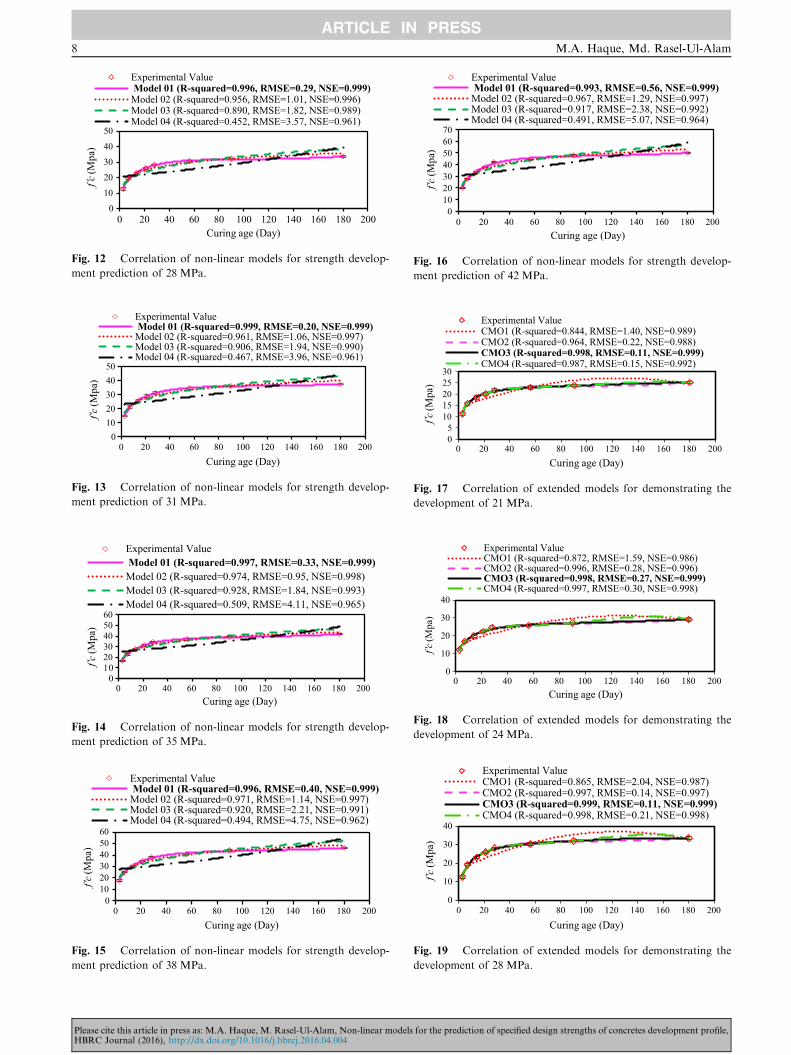
of concretes were greater in model 01 (polynomial equationbased model) than the other three models. In addition, model01 also showed lowest value of RMSE (Figs. 10–16). There-
fore, the model 01 showed the best correlation to the experi-mental observation for evaluating the compressive strengthgaining characteristics during the curing ages, whereas models
2, 3 and 4 failed to describe the strength development patternproperly. Model 04 demonstrated the unrealistic strength gain-ing profile compared with the experimental results for all
for the prediction of specified design strengths of concretes development profile,
05
1015202530
0 20 40 60 80 100 120 140 160 180 200Curing age (Day)
Experimental Value Model 01 (R-squared=0.995, RMSE=0.21, NSE=0.999)Model 02 (R-squared=0.951, RMSE=0.69, NSE=0.997)Model 03 (R-squared=0.893, RMSE=1.11, NSE=0.993)Model 04 (R-squared=0.461, RMSE=2.27, NSE=0.973)
f c(M
pa)
'
Fig. 10 Correlation of non-linear models for strength develop-
ment prediction of 21 MPa.
0
10
20
30
40
0 20 40 60 80 100 120 140 160 180 200
f c(M
pa)
Curing age (Day)
Experimental Value Model 01 (R-squared=0.995, RMSE=0.27, NSE=0.999)Model 02 (R-squared=0.968, RMSE=0.68, NSE=0.998)Model 03 (R-squared=0.890, RMSE=1.22, NSE=0.993)Model 04 (R-squared=0.452, RMSE=2.69, NSE=0.970)
'
Fig. 11 Correlation of non-linear models for strength develop-
ment prediction of 24 MPa.
R² = 0.9955
R² = 0.9955
R² = 1
0
5
10
15
20
10006000
110001600021000260003100036000
10 15 20 25 30 35 40 45 50 55
MR
), f r
( MPa
) and
STS
, f sp
(MPa
)
ME,
Ec (M
Pa)
ME (42 MPa) MR (42 MPa) STS (42 MPa)
Compressive strength ( f c), MPa'
Fig. 9 Variation of ME, MR and STS for design strength of
42 MPa.
Non-linear models for the prediction of design strengths 7
design concrete (Figs. 10–16). Accordingly, model 01 was the
well correlated model with high accuracy among the studiedfour non-linear models to represent the increasing rate of stud-ied design concrete strength with the concrete ages in full
immersion curing condition.
Correlation of extended models
In this study, correlation of polynomial equation based on
four extended models denoted as COM1, CMO2, CMO3and CMO4 was tested respectively. Figs. 17–23 presents thecomparison of models profiles with the experimental observa-
tion data for specified design strengths of concretes 21 MPa,24 MPa, 28 MPa, 31 MPa, 35 MPa, 38 MPa and 42 MParespectively. The study revealed preferable correlation trend
with the breakdown of independent variable’s (curing age) fullpower to fractional power. CMO1 (Quadratic least squareregression equation) showed the most deviated strength gain-
ing profile with the experimental observations than the othermodel options for all target design strengths of concretes(Figs. 17–23). In CMO1, independent variable parameter con-tains the power 1 and 2 whereas in CMO2 and CMO3 each
term of independent variable’s power was extended with frac-tional power like 0.5 degree. The study showed that CMO2and CMO3 described the better correlation of strength devel-
opment than CMO1. This means, fractional power based
Table 5 Proposed relationship of specified design concretes proper
Design strength (MPa) Proposed equation
Modulus of elasticity (MPa)
21Ec = 569.52
ffiffiffiffif0c
q+ 9852
24Ec = 533.88
ffiffiffiffif0c
q+ 10,489
28Ec = 504.77
ffiffiffiffif0c
q+ 11,026
31Ec = 474.73
ffiffiffiffif0c
q+ 11,742
35Ec = 450.34
ffiffiffiffif0c
q+ 12,401
38Ec = 430.21
ffiffiffiffif0c
q+ 12,954
42Ec = 410.33
ffiffiffiffif0c
q+ 13,601
ACI suggested
equationEc = 4700
ffiffiffiffif0c
q(For concrete strength up to
42 MPa)
Please cite this article in press as: M.A. Haque, M. Rasel-Ul-Alam, Non-linear modelsHBRC Journal (2016), http://dx.doi.org/10.1016/j.hbrcj.2016.04.004
model equation shows well fitness to the observations with
high accuracy and low errors than whole (non-fractional)power based model equation (Figs. 17–23). Moreover,CMO4 was also extended. But model profile of CMO4 showedhigher deviation form with greater RMSE values than CMO2
and CMO3. The study found that if the power of polynomialbased equation, breaks down into the fractional smaller values
ties with compressive strength.
Modulus of rupture
(MPa)
Splitting tensile strength (MPa)
fr = 0.0739ffiffiffiffif0c
q+ 1.28 fsp = 0.2509f0c � 2 � 10�14
fr = 0.0691ffiffiffiffif0c
q+ 1.36 fsp = 0.2509
ffiffiffiffif0c
q
fr = 0.0655ffiffiffiffif0c
q+ 1.43 fsp = 0.2509
ffiffiffiffif0c
q
fr = 0.0616ffiffiffiffif0c
q+ 1.52 fsp = 0.2509
ffiffiffiffif0c
q� 2 � 10�14
fr = 0.0584ffiffiffiffif0c
q+ 1.61 fsp = 0.2509
ffiffiffiffif0c
q
fr = 0.0558ffiffiffiffif0c
q+ 1.68 fsp = 0.2509
ffiffiffiffif0c
q� 7 � 10�14
fr = 0.0532ffiffiffiffif0c
q+ 1.76 fsp = 0.2509
ffiffiffiffif0c
q� 2 � 10�14
fr = 0.62ffiffiffiffif0c
qfsp =
2Ppld [ASTM recommended
equation]
for the prediction of specified design strengths of concretes development profile,
01020304050
0 20 40 60 80 100 120 140 160 180 200Curing age (Day)
Experimental Value Model 01 (R-squared=0.999, RMSE=0.20, NSE=0.999)Model 02 (R-squared=0.961, RMSE=1.06, NSE=0.997)Model 03 (R-squared=0.906, RMSE=1.94, NSE=0.990)Model 04 (R-squared=0.467, RMSE=3.96, NSE=0.961)
f c(M
pa)
'
Fig. 13 Correlation of non-linear models for strength develop-
ment prediction of 31 MPa.
0
2030405060
10
0 20 40 60 80 100 120 140 160 180 200
f c(M
pa)
Curing age (Day)
Experimental Value Model 01 (R-squared=0.997, RMSE=0.33, NSE=0.999)Model 02 (R-squared=0.974, RMSE=0.95, NSE=0.998)Model 03 (R-squared=0.928, RMSE=1.84, NSE=0.993)Model 04 (R-squared=0.509, RMSE=4.11, NSE=0.965)
'
Fig. 14 Correlation of non-linear models for strength develop-
ment prediction of 35 MPa.
0102030405060
0 20 40 60 80 100 120 140 160 180 200Curing age (Day)
Experimental Value Model 01 (R-squared=0.996, RMSE=0.40, NSE=0.999)Model 02 (R-squared=0.971, RMSE=1.14, NSE=0.997)Model 03 (R-squared=0.920, RMSE=2.21, NSE=0.991)Model 04 (R-squared=0.494, RMSE=4.75, NSE=0.962)
f c(M
pa)
'
Fig. 15 Correlation of non-linear models for strength develop-
ment prediction of 38 MPa.
0
10
20
30
40
50
0 20 40 60 80 100 120 140 160 180 200Curing age (Day)
Experimental Value Model 01 (R-squared=0.996, RMSE=0.29, NSE=0.999)Model 02 (R-squared=0.956, RMSE=1.01, NSE=0.996)Model 03 (R-squared=0.890, RMSE=1.82, NSE=0.989)Model 04 (R-squared=0.452, RMSE=3.57, NSE=0.961)
f c(M
pa)
'
Fig. 12 Correlation of non-linear models for strength develop-
ment prediction of 28 MPa.
010203040506070
0 20 40 60 80 100 120 140 160 180 200
f c(M
pa)
'
Curing age (Day)
Experimental Value Model 01 (R-squared=0.993, RMSE=0.56, NSE=0.999)Model 02 (R-squared=0.967, RMSE=1.29, NSE=0.997)Model 03 (R-squared=0.917, RMSE=2.38, NSE=0.992)Model 04 (R-squared=0.491, RMSE=5.07, NSE=0.964)
Fig. 16 Correlation of non-linear models for strength develop-
ment prediction of 42 MPa.
05
1015202530
0 20 40 60 80 100 120 140 160 180 200Curing age (Day)
Experimental ValueCMO1 (R-squared=0.844, RMSE=1.40, NSE=0.989)CMO2 (R-squared=0.964, RMSE=0.22, NSE=0.988)CMO3 (R-squared=0.998, RMSE=0.11, NSE=0.999)CMO4 (R-squared=0.987, RMSE=0.15, NSE=0.992)
f c(M
pa)
'
Fig. 17 Correlation of extended models for demonstrating the
development of 21 MPa.
0
10
20
30
40
0 20 40 60 80 100 120 140 160 180 200Curing age (Day)
Experimental ValueCMO1 (R-squared=0.872, RMSE=1.59, NSE=0.986)CMO2 (R-squared=0.996, RMSE=0.28, NSE=0.996)CMO3 (R-squared=0.998, RMSE=0.27, NSE=0.999)CMO4 (R-squared=0.997, RMSE=0.30, NSE=0.998)
f c(M
pa)
'
Fig. 18 Correlation of extended models for demonstrating the
development of 24 MPa.
0
10
20
30
40
0 20 40 60 80 100 120 140 160 180 200
Curing age (Day)
f c(M
pa)
'
Experimental ValueCMO1 (R-squared=0.865, RMSE=2.04, NSE=0.987)CMO2 (R-squared=0.997, RMSE=0.14, NSE=0.997)CMO3 (R-squared=0.999, RMSE=0.11, NSE=0.999)CMO4 (R-squared=0.998, RMSE=0.21, NSE=0.998)
Fig. 19 Correlation of extended models for demonstrating the
development of 28 MPa.
8 M.A. Haque, Md. Rasel-Ul-Alam
Please cite this article in press as: M.A. Haque, M. Rasel-Ul-Alam, Non-linear models for the prediction of specified design strengths of concretes development profile,HBRC Journal (2016), http://dx.doi.org/10.1016/j.hbrcj.2016.04.004

01020304050
0 20 40 60 80 100 120 140 160 180 200
f c(M
pa)
'
Curing age (Day)
Experimental ValueCMO1 (R-squared=0.879, RMSE=2.08, NSE=0.989)CMO2 (R-squared=0.996, RMSE=0.34, NSE=0.997)CMO3 (R-squared=0.999, RMSE=0.22, NSE=0.999)CMO4 (R-squared=0.998, RMSE=0.27, NSE=0.998)
Fig. 20 Correlation of extended models for demonstrating the
development of 31 MPa.
01020304050
0 20 40 60 80 100 120 140 160 180 200Curing age (Day)
Experimental ValueCMO1 (R-squared=0.890, RMSE=2.25, NSE=0.989)CMO2 (R-squared=0.998, RMSE=0.32, NSE=0.999)CMO3 (R-squared=0.998, RMSE=0.28, NSE=0.999)CMO4 (R-squared=0.999, RMSE=0.40, NSE=0.999)
f c(M
pa)
'
Fig. 21 Correlation of extended models for demonstrating the
development of 35 MPa.
0
10
20
30
40
50
60
0 20 40 60 80 100 120 140 160 180 200Curing age (Day)
Experimental ValueCMO1 (R-squared=0.890, RMSE=2.57, NSE=0.989)CMO2 (R-squared=0.998, RMSE=0.27, NSE=0.998)CMO3 (R-squared=0.999, RMSE=0.18, NSE=0.999)CMO4 (R-squared=0.998, RMSE=0.40, NSE=0.998)
f c(M
pa)
'
Fig. 22 Correlation of extended models for demonstrating the
development of 38 MPa.
010203040506070
0 20 40 60 80 100 120 140 160 180 200Curing age (Day)
Experimental ValueCMO1 (RSQD=0.892, RMSE=2.80, NSE=0.989)CMO2 (RSQD=0.996, RMSE=0.50, NSE=0.998)CMO3 (RSQD=0.998, RMSE=0.47, NSE=0.999)CMO4 (RSQD=0.999, RMSE=0.69, NSE=0.999)
f c(M
pa)
'
Fig. 23 Correlation of extended models for demonstrating the
development of 42 MPa.
Non-linear models for the prediction of design strengths 9
arbitrarily, models may not be well correlated with the obser-vations. Although, the extended terms of polynomial equation
based regression model’s power increase, with the smaller frac-tional values, it was found to be well correlated with the obser-vation points but deviated from the profile path with high
error values. Table 4 shows the comparison of extended mod-els options with respect to the statistical parameters such as R2,RMSE and NSE to check the best fitness to their experimental
observation data.Based on the statistical analysis results of three parameters
(Table 6), CMO3 showed the best correlation to the experi-
mental observation data than CMO1, CMO2 and CMO4 forall target design strengths of concretes (Figs. 17–23), and thisindicates that the most appropriate model option is CMO3for experimental data interpretation of compressive strength
development profile with curing ages.The parameter estimation outcome of the proposed corre-
lated well correlated model equation (CMO3) for all target
design concrete strengths is represented in Table 7. Parameterswere estimated with their 95% confidence level.
Validation of the proposed strength prediction model
In the current study, the proposed model was validated for theprediction of target design concretes strengths development
profile with concrete ages using the 2nd observation strengthsdata of same seven mixes and samples which were againobtained from the laboratory following the procedure of initialcompressive strength tests. Figs. 24–30 show the validation
graph of the proposed model (CMO3) with the experimental
Please cite this article in press as: M.A. Haque, M. Rasel-Ul-Alam, Non-linear modelsHBRC Journal (2016), http://dx.doi.org/10.1016/j.hbrcj.2016.04.004
observations (2nd observation) corresponding to the designconcretes strengths: 21 MPa, 24 MPa, 28 MPa, 31 MPa,
35 MPa, 28 MPa and 42 MPa respectively. The accuracy ofthe CMO3 was justified through statistical analyses (i. e. R2,RMSE and NSE). The R2, RMSE and NSE statistical valueswhich were calculated for comparing experimental data with
CMO3 results are shown in Figs. 24–30. The R2 and NSE val-ues of CMO3 with respect to the experimental compressivestrength data for target design concretes strengths were found
to be close to 1, indicating the validity of the proposed model.Furthermore, the calculated RMSE values of CMO3 fitness tothe observation patterns were found to be quite reasonable.
The study revealed that the predicted strengths results usingCMO3 are quite similar to the experimental results. Conse-quently, compressive strength values of the tested design con-cretes’ strengths can be predicted using CMO3 without
conducting experiments in a quite short period of time withtrivial error rates. Also, the experiments cost can be saved byusing CMO3 predicted results for the tested design concretes’
strengths at different concrete ages without any further testing.All results of target design concretes obtained from experi-
mental observations and CMO3 predicted values for 3, 7, 14,
21, 28, 56, 90 and 180 curing ages are plotted in Figs. 31–37respectively. On these figures 1:1 line indicates the visual com-parison results between the test results and predicted values.
Comparing the experimental compressive strength results withthose obtained from CMO3 model it can be seen that they areobviously similar. This shows that the experimental resultsare in harmony with the CMO3 Model results and very close
for the prediction of specified design strengths of concretes development profile,

Table 6 Evaluation of statistical parameters among the extended models for checking the best correlation.
Design strength of
concrete (MPa)
R2 (R-squared) RMSE NSE
21 CMO3> CMO4> CMO2> CMO1 CMO1> CMO4> CMO2> CMO3 CMO3> CMO4> CMO2> CMO1
24 CMO3> CMO4> CMO2> CMO1 CMO1> CMO2> CMO4> CMO3 CMO3> CMO4> CMO2> CMO1
28 CMO3> CMO4> CMO2> CMO1 CMO1> CMO4> CMO2> CMO3 CMO3> CMO4> CMO2> CMO1
31 CMO3> CMO4> CMO2> CMO1 CMO1> CMO2> CMO4> CMO3 CMO3> CMO4> CMO2> CMO1
35 CMO4> CMO3> CMO2> CMO1 CMO1> CMO4> CMO2> CMO3 CMO4= CMO3= CMO2> CMO1
38 CMO3> CMO4= CMO2> CMO1 CMO1> CMO4> CMO2> CMO3 CMO3> CMO4= CMO2> CMO1
42 CMO4> CMO3> CMO2> CMO1 CMO1> CMO4> CMO2> CMO3 CMO4= CMO3> CMO2> CMO1
Table 7 Estimated parameters of proposed well correlated model equations (CMO3).
Model parameter Design strengths of concretes
21 MPa 24 MPa 28 MPa 31 MPa 35 MPa 38 MPa 42 MPa
a1 �0.416 0.903 �3.428 �1.846 1.886 �0.188 2.866
a2 8.867 8.296 12.259 12.646 10.120 12.664 12.044
a3 �1.322 �1.020 �1.743 �1.783 �0.948 �1.401 �1.151
a4 0.091 0.057 0.118 0.124 0.031 0.070 0.043
a5 �2.36 � 10�3 �1.11 � 10�3 �3.05 � 10�3 �3.4 � 10�3 1.34 � 10�5 �1.3 � 10�3 �3.37 � 10�4
05
1015202530
0 20 40 60 80 100 120 140 160 180 200
f c(M
pa)
'
Curing age (Day)
R2 =0.986RMSE= 0.55NSE= 0.998
Experimental observation (For validation)Proposed Model profile
Fig. 24 Validation of CMO3 for development of 21 MPa with
concrete ages.
05
101520253035
0 20 40 60 80 100 120 140 160 180 200Curing age (Day)
R2 =0.993RMSE= 0.37NSE= 0.999
Experimental observation (For validation)Proposed Model profile
f c(M
pa)
'
Fig. 25 Validation of CMO3 for development of 24 MPa with
concrete ages.
05
10152025303540
0 20 40 60 80 100 120 140 160 180 200
f c (M
pa)
'
Curing age (Day)
R2 =0.993RMSE= 0.54NSE= 0.999
Experimental observation (For validation)
Proposed Model profile
Fig. 26 Validation of CMO3 for development of 28 MPa with
concrete ages.
0
10
20
30
40
0 20 40 60 80 100 120 140 160 180 200
f c(M
pa)
'
Curing age (Day)
R2 =0.982RMSE= 0.69NSE= 0.998
Experimental observation (For validation)Proposed Model profile
Fig. 27 Validation of CMO3 for development of 31 MPa with
concrete ages.
10 M.A. Haque, Md. Rasel-Ul-Alam
values to each other with insignificant difference. The equationof linear least square fit line and the R2 values is given inFigs. 31–37 for the observed and CMO3 model predicted values.
The error percentage (%) of the proposed model (CMO3)and validation data (2nd observation) when compared with
Please cite this article in press as: M.A. Haque, M. Rasel-Ul-Alam, Non-linear modelsHBRC Journal (2016), http://dx.doi.org/10.1016/j.hbrcj.2016.04.004
experimental data (1st observation) are represented in Table 8.As it can be seen in the calculated error results, the experimental
for the prediction of specified design strengths of concretes development profile,

0
10
20
30
40
50
0 20 40 60 80 100 120 140 160 180 200
f c(M
pa)
'
Curing age (Day)
R2 =0.991RMSE= 0.65NSE= 0.999
Experimental observation (For validation)
Proposed Model profile
Fig. 28 Validation of CMO3 for development of 35 MPa with
concrete ages.
0102030405060
0 20 40 60 80 100 120 140 160 180 200Curing age (Day)
R2 =0.992RMSE= 0.61NSE= 0.999
Experimental observation (For validation)Proposed Model profile
f c(M
pa)
'
Fig. 29 Validation of CMO3 for development of 38 MPa with
concrete ages.
0
10
20
30
40
50
60
0 20 40 60 80 100 120 140 160 180 200Curing age (Day)
R2 =0.987RMSE= 0.79NSE= 0.999
Experimental observation (For validation)
Proposed Model profile
f c(M
pa)
'
Fig. 30 Validation of CMO3 for development of 42 MPa with
concrete ages.
y = 0.989x + 0.2303R² = 0.9971
10
15
20
25
30
10 15 20 25 30
Pred
icte
d st
reng
th (M
Pa)
Observed strength (MPa)
Fig. 31 Correlation between the observed and model predicted
CS for design concrete 21 MPa.
y = 0.9817x + 0.4377R² = 0.9951
10
15
20
25
30
35
10 12 14 16 18 20 22 24 26 28 30 32
Pred
icte
d st
reng
th (M
Pa)
Observed strength (MPa)
Fig. 32 Correlation between the observed and model predicted
CS for design concrete 24 MPa.
y = 0.987x + 0.3557R² = 0.9978
10
15
20
25
30
35
10 12 14 16 18 20 22 24 26 28 30 32 34 36Pr
edic
ted
stre
ngth
(MPa
)Observed strength (MPa)
Fig. 33 Correlation between the observed and model predicted
CS for design concrete 28 MPa.
y = 0.9674x + 1.1166R² = 0.9985
10
15
20
25
30
35
40
10 12 14 16 18 20 22 24 26 28 30 32 34 36 38 40
Pred
icte
d st
reng
th (M
Pa)
Observed strength (MPa)
Fig. 34 Correlation between the observed and model predicted
CS for design concrete 31 MPa.
y = 0.9904x + 0.3176R² = 0.9966
10
15
20
25
30
35
40
45
10 12 14 16 18 20 22 24 26 28 30 32 34 36 38 40 42 44
Pred
icte
d st
reng
th (M
Pa)
Observed strength (MPa)
Fig. 35 Correlation between the observed and model predicted
CS for design concrete 35 MPa.
Non-linear models for the prediction of design strengths 11
Please cite this article in press as: M.A. Haque, M. Rasel-Ul-Alam, Non-linear models for the prediction of specified design strengths of concretes development profile,HBRC Journal (2016), http://dx.doi.org/10.1016/j.hbrcj.2016.04.004

y = 0.9924x + 0.2401R² = 0.9966
101520253035404550
10 12 14 16 18 20 22 24 26 28 30 32 34 36 38 40 42 44 46 48
Pred
icte
d st
reng
th (M
Pa)
Observed strength (MPa)
Fig. 36 Correlation between the observed and model predicted
CS for design concrete 38 MPa.
Table
8Errorcalculation(%
)ofproposedmodel
predictedandvalidationdata
(2ndobservation)withrespectto
theexperim
entalresults(1st
observation).
Curing
days
21MPa
24MPa
28MPa
31MPa
35MPa
38MPa
42MPa
Proposed
model
Observation
forvalidation
Proposed
model
Observation
forvalidation
Proposed
model
Observation
forvalidation
Proposed
model
Observation
forvalidation
Proposed
model
Observation
forvalidation
Proposed
model
Observation
forvalidation
Proposed
model
Observation
forvalidation
32.30
�5.67
2.51
7.68
3.42
�7.66
4.78
�6.78
1.16
5.81
1.26
�7.50
3.44
9.08
7�2
.25
�6.18
�1.34
1.02
�2.24
1.28
0.51
5.19
�0.63
2.66
�0.83
1.24
�1.20
�5.96
14
1.37
5.68
2.47
6.69
1.80
2.83
3.28
5.01
1.93
3.78
1.46
3.85
0.96
�0.82
21
1.29
�0.41
0.98
2.15
0.39
�0.44
0.53
2.43
0.45
1.67
�0.19
�3.21
�0.46
�3.41
28
�1.56
�3.75
�3.14
�5.30
�1.70
�3.16
�0.82
0.20
-2.88
2.30
�2.91
�1.10
�3.86
�0.59
56
0.07
0.55
1.28
0.35
0.48
4.15
�0.63
�2.19
1.64
2.35
1.98
3.18
2.91
1.71
90
0.05
�1.71
�0.38
0.32
�0.08
1.65
0.38
�1.55
�0.55
�0.25
�0.68
�2.52
�1.01
0.21
180
�0.02
�1.70
0.01
2.31
0.01
1.40
�0.02
�0.96
0.02
�2.97
0.04
�0.54
0.07
�1.58
y = 0.9821x + 0.6412R² = 0.9932
10
20
30
40
50
60
10 13 16 19 22 25 28 31 34 37 40 43 46 49 52 55
Pred
icte
d st
reng
th (M
Pa)
Observed strength (MPa)
Fig. 37 Correlation between the observed and model predicted
CS for design concrete 42 MPa.
12 M.A. Haque, Md. Rasel-Ul-Alam
compressive strength results do not vary significantly ascompared to the obtained predicted data using CMO3 model.
There is little difference between the experimental and pre-dicted results. Using the CMO3 Model, average error wasfound to be 0.156%, 0.299%, 0.26%, 1.01%, 0.14%, 0.016%
and 0.106% for 21 MPa, 24 MPa, 28 MPa, 31 MPa, 35 MPa,38 MPa and 42 MPa respectively in the tested concrete ages.In the experimental validation observations average error
was found to be �1.65%, 1.91%, 0.01%, 0.169%, 1.919%,�0.825% and �0.17% for the all target design strengths con-cretes respectively. Table 6 shows that the error in differencebetween the model predicted values and the experimental
results is less than 10%.
Conclusions
The main goal of this study was to characterize the compres-sive strength behavioral pattern of different specified designconcretes strengths: 21 MPa, 24 MPa, 28 MPa, 31 MPa,
35 MPa, 38 MPa and 42 MPa with the increase of curing agesto predict the compressive strength development rate withoutperforming experimental studies. Properties such as modulus
of elasticity, modulus of rupture and splitting tensile strengthof target design concretes were measured with respect to thecompressive strengths to estimate mathematical expressions.
In order to predict the long term effects on compressivestrength of design concretes, four non-linear models wereused along with their parameter estimation on the basis ofcompressive strength. The results of the analyses showed that
polynomial equation describes strength development profilemore accurately than the other three non-linear models. The
Please cite this article in press as: M.A. Haque, M. Rasel-Ul-Alam, Non-linear models for the prediction of specified design strengths of concretes development profile,HBRC Journal (2016), http://dx.doi.org/10.1016/j.hbrcj.2016.04.004
Non-linear models for the prediction of design strengths 13
polynomial equation was also extended further to, four differ-ent longer terms to achieve better correlation results using theleast squares procedure. It is found that strength gaining rate
of concretes follows the polynomial equation having2-degrees with fractional power like 0.5 degree interval foreach term regarding the scope of works. The values were very
closer to the experimental data obtained from proposedpolynomial equation based model. The model was justifiedusing statistical parameters such as R2, RMSE and NSE along
with the validation of the model profile with experimentalobservation and found to be satisfactory with trivial errordifference for demonstrating the compressive strength develop-ment phenomena. As a result, compressive strength values of
target design concretes strengths can be predicted using theproposed model profile.
Conflict of interest
The authors state that there is no conflict of interest.
References
[1] M.M. Hasan, A. Kabir, Prediction of compressive strength of
concrete from early age test result, 4th Annual Paper Meet and
1st Civil Engineering Congress, December 22–24, Dhaka,
Bangladesh, 2011.
[2] S.E.F. Chidiac, Moutassem, F. Mahmoodzadeh, Compressive
strength model for concrete, Mag. Concr. Res. 65 (9) (2013)
557–572.
[3] IBC, International Building Code, Section 1904, 2006, p. 374.
Available at online: <ftp://law.resource.org/pub/us/code/ibr/
icc.ibc.2006.pdf> (accessed on 28th April, 2015).
[4] M.A. Rashid, M.A. Mansur, Considerations in producing high
strength concrete, J. Civ. Eng. (IEB) 37 (1) (2009) 53–63.
[5] PCA, Concrete Technology Today, vol. 15, issue no. 1, 1994.
Available online: <http://cement.org/tech/pdfs/PL941Hirise.
pdf> (accessed on 29th April, 2015).
[6] M.F.M. Zain, M.A. Suhad, K. Sopian, M. Jamil, A.I. Che-Ani,
Mathematical regression model for the prediction of concrete
strength. Mathematical methods, computational techniques,
non-linear systems, intelligent systems, 2008, pp. 396–402.
[7] G.F. Kheder, Al-Gabban, M.A. Suhad, Mathematical model
for the prediction of cement compressive strength at the ages of
7 and 28 days within 24 hour, Mater. Struct. 36 (10) (2003) 693–
701.
[8] M.A.A. Abd elaty, Compressive strength prediction of Portland
cement concrete with age using a new model, HBRC J. 10 (2)
(2014) 145–155.
[9] ASTM C29/C29M-09, Standard Test Method for Bulk Density
(Unit Weight) and Voids in Aggregate, ASTM International,
West Conshohocken, PA, 2009.
[10] ASTM C127-15, Standard Test Method for Relative Density
(Specific Gravity) and Absorption of Coarse Aggregate, ASTM
International, West Conshohocken, PA, 2015.
[11] ASTM C566-13, Standard Test Method for Total Evaporable
Moisture Content of Aggregate by Drying, ASTM
International, West Conshohocken, PA, 2013.
[12] ASTM C128-15, Standard Test Method for Relative Density
(Specific Gravity) and Absorption of Fine Aggregate, ASTM
International, West Conshohocken, PA, 2015.
[13] ASTM D2216-10, Standard Test Methods for Laboratory
Determination of Water (Moisture) Content of Soil and Rock
by Mass, ASTM International, West Conshohocken, PA, 2010.
Please cite this article in press as: M.A. Haque, M. Rasel-Ul-Alam, Non-linear modelsHBRC Journal (2016), http://dx.doi.org/10.1016/j.hbrcj.2016.04.004
[14] ASTM C136/C136M-14, Standard Test Method for Sieve
Analysis of Fine and Coarse Aggregates, ASTM International,
West Conshohocken, PA, 2014.
[15] M.A. Haque, M.A. Hoque, S. Sah, M. Hadiuzzaman,
Immobilization of heavy metals from paving block constructed
with cement and sand-solid waste matrix, Asian J. Appl. Sci. 7
(3) (2014) 150–157.
[16] ASTM C184-94, Standard Test Method for Cement Fineness
Test, 2014.
[17] ASTM C187/C187-11e1, Standard Test Method for Amount of
Water Required for Normal Consistency of Hydraulic Cement
Paste, ASTM International, West Conshohocken, PA, 2011.
[18] ASTM C150/C150M-12, Standard Specification for Portland
Cement, ASTM International, West Conshohocken, PA, 2012.
[19] IS: 2720 (Part 3-1980), Determination of specific gravity cement.
[20] S. Rizkalla, P. Zia, A. Paul, A. Mirmiran, H. Russell, R. Mast,
Proposal for concrete compressive strength up to 18 ksi
(124 MPa) for bridge design, J. Transp. Res. Board 2131
(2009) 59–67.
[21] M.R. Resheidat, O.N. Madanat, Accelerated strength and
testing of concrete in Jordan, Mater. Struct. 25 (2) (1992) 79–83.
[22] ASTM C143/C143M-10a, Standard Test Method for Slump of
Hydraulic-Cement Concrete, ASTM International, West
Conshohocken, PA, 2010.
[23] G.D. Schutter, K. Audenaert, Evaluation of water absorption of
concrete as a measure for resistance against carbonation and
chloride migration, Mater. Struct. 37 (9) (2004) 591–596.
[24] M.A. Rashid, M.A. Salam, S.K. Shill, M.K. Hasan, Effect of
replacing natural coarse aggregate by brick aggregate on the
properties of concrete, DUET J. 1 (3) (2012) 17–22.
[25] ASTM C39/C39M-15a, Standard Test Method for Compressive
Strength of Cylindrical Concrete Specimens, ASTM
International, West Conshohocken, PA, 2015.
[26] M.N. Hassoun, A. Al-Manasser, Structural Concrete, Theory
and design, fourth ed., John Wiley & Sons, Inc, 2008, pp. 16.
[27] ASTM C496/C496M-11, Standard Test Method for Splitting
Tensile Strength of Cylindrical Concrete Specimens, ASTM
International, West Conshohocken, PA, 2004.
[28] I.B. Plecas, Comparison of mathematical interpretation in
radioactive waste leaching studies, J. Radioanal. Nucl. Chem.
258 (2003) 435–437.
[29] L.O. Ukpata, M.E. Ephraim, G.A. Akeke, Compressive
strength of concrete using lateritic sand and quarry dust as
fine aggregate, ARPN J. Eng. Appl. Sci. 7 (1) (2012) 81–91.
[30] I.C. Yeh, Generalization of strength versus water–cementitious
ratio relationship to age, Cem. Concr. Res. 36 (10) (2006) 1865–
1873.
[31] D.N. Moriasi, J.G. Arnold, M.W.V. Liew, R.L. Bingner, R.D.
Harmel, T.L. Veith, Model evaluation guidelines for systematic
quantification of accuracy in watershed simulations, Am. Soc.
Agric. Biol. Eng. 50 (3) (2007) 885–900.
[32] M.N. Islam, An Introduction to Statistics and Probability, third
ed., Book World, 2004.
[33] C. Santhi, J.G. Arnold, J.R. Williams, W.A. Dugas, L.
Srinivasan, M. Hauck, Validation of the SWAT model on a
large river basin with point and nonpoint sources, J. Am. Water
Resour. Assoc. 37 (5) (2001) 1169–1188.
[34] A.W. Alansi, M.S.M. Amin, G. Abdul, H.Z.M. Shafri, W.
Aimrun, Validation of SWAT Model for stream flow simulation
and forecasting in Upper Bernam humid tropical river basin,
Malaysia, Hydrol. Earth Syst. Sci. Discuss. 6 (2009) 7581–7609.
[35] I. Plecas, S. Dimovic, Immobilization of industrial waste in
cement–bentonite clay matrix, Bull. Mater. Sci. 27 (2) (2004)
175–178.
[36] M.S. Shetty, Concrete Technology Theory and Practice, S.
Chand & Company Ltd., New Delhi, 2006.
[37] M.A. Aziz, A Textbook of Engineering Materials, revised ed.,
Kazi Mahfuzur Rahman, 1995.
for the prediction of specified design strengths of concretes development profile,
14 M.A. Haque, Md. Rasel-Ul-Alam
[38] A.A. Akhtaruzzaman, A. Hasnat, Properties of concrete using
crushed brick as aggregate, Concr. Int. 5 (2) (1983) 58–63.
[39] M.A. Mansur, T.H. Wee, L.S. Cheran, Crushed bricks as coarse
aggregate for concrete, ACI Mater. J. 96 (4) (1999) 478–484.
Please cite this article in press as: M.A. Haque, M. Rasel-Ul-Alam, Non-linear modelsHBRC Journal (2016), http://dx.doi.org/10.1016/j.hbrcj.2016.04.004
[40] M.A. Rashid, T. Hossain, M.A. Islam, Properties of higher
strength concrete made with crushed brick as coarse aggregate,
J. Civ. Eng. (IEB) 37 (1) (2009) 43–52.
for the prediction of specified design strengths of concretes development profile,
Related Documents