Karen Brastad Evensen Non-invasive monitoring of the intracranial pressure waveform Thesis submitted for the degree of Philosophiae Doctor Department of Informatics The Faculty of Mathematics and Natural Sciences 2020

Welcome message from author
This document is posted to help you gain knowledge. Please leave a comment to let me know what you think about it! Share it to your friends and learn new things together.
Transcript

Karen Brastad Evensen
Non-invasive monitoring of theintracranial pressure waveform
Thesis submitted for the degree of Philosophiae Doctor
Department of InformaticsThe Faculty of Mathematics and Natural Sciences
2020

© Karen Brastad Evensen, 2020 Series of dissertations submitted to the Faculty of Mathematics and Natural Sciences, University of Oslo No. 2345 ISSN 1501-7710 All rights reserved. No part of this publication may be reproduced or transmitted, in any form or by any means, without permission. Cover: Hanne Baadsgaard Utigard. Print production: Reprosentralen, University of Oslo.

PrefaceThis thesis has been submitted to the Faculty of Mathematics and NaturalSciences at the University of Oslo in partial fulfillment of the requirements forthe degree of Philosophiae Doctor (Ph.D.). The work was carried out as atranslational project between the Digital Signal Processing and Image Analysisresearch group at the Department of Informatics, University of Oslo, and theNeurovascular-Hydrocephalus Research Group at the Department of Neuro-surgery, Oslo University Hospital – Rikshospitalet, Oslo, Norway. The projectperiod also included a research stay at the Integrative Neuromonitoring andCritical Care Informatics Group (INCCI) at MIT, Cambridge, MA, performingresearch on the morphology of ICP waves. Professor Per Kristian Eide has beenthe main supervisor on this project, and Professor Sverre Holm and Dr FabricePrieur have been co-supervisors. The project was funded in its entirety by HealthSouth-East Norway.
Acknowledgments
First, I would like to thank and acknowledge Doctor of medicine, ProfessorPer Kristian Eide, who for the past years, has been a patient and attentivementor and advisor. Thank you for your devotion and guidance, and for makingsure that the physical insights developed were always relevant and well thoughtout. My warmest thanks also go to my co-supervisor, Sverre Holm, for fruitfuldiscussions and technical guidance, and to Fabrice Prieur for his help in theearliest days of my PhD journey. I also wish to thank Professor Thomas Heldt,who enabled my stay at the INCCI group at MIT and Professor George Verghesefor the positive collaboration afterwards. I learned a lot from you both.
I am also deeply grateful for the friends I’ve made here at UiO, and atMIT. Thank you for the clarifying discussions, interesting lunches, long coffeebreaks and occasional emotional relief. A special thanks also goes to my parents,Kjellfrid and Jan, for your continuous care and encouragement. Last and mostimportantly, thank you, Thomas. There are no words that can possibly describehow appreciative I am of your unfailing support.
Karen Brastad EvensenTrondheim, June 2020
i


AbstractInvasive monitoring of intracranial pressure (ICP) plays an essential role indiagnostics and surveillance of patients with brain injury and brain disease.While monitoring of mean ICP is a cornerstone of cerebrovascular monitoringworldwide, an increasing body of research highlights the added clinical benefit ofalso considering the cardiac-induced pressure variations in the ICP signal, namelythe pulsatile ICP. Numerous studies have shown that patient management basedon the Mean Wave Amplitude (MWA) of the pulsatile ICP has improved theoutcome for patients with different pathologies compared to mean ICP patientmanagement alone. Current measurement modalities of mean and pulsatileICP are all invasive with associated risks of intracranial bleeds and infections.The primary aim of the research upon which this thesis is based was, therefore,to estimate the MWA parameter non-invasively in order to safely provide theclinicians with added information about the intracranial condition. Non-invasiveMWA estimation has been performed in two different studies using two differentphysiological time-series as input. The first study utilizes the central aortic bloodpressure waveforms and a statistical model to estimate pulsatile ICP. The secondstudy uses the same methodology, but the pressure oscillations measured in theouter ear are used as the input signal. The studies both gave reasonably goodvisual estimates of the ICP morphology, but not to the extent where the MWAparameter could be extracted with the necessary clinical confidence. The latterstudy also revealed that the cochlear aqueduct is dispersive for high frequenciesand therefore can only be expected to reproduce the lowest frequency componentsof the ICP morphology well. The majority of patients studied for this thesissuffer from iNPH, which is a neurodegenerative dementia illness combined withCSF circulatory failure, that is currently not sufficiently understood. To shedlight on this disorder, the MWA parameter’s dependence on hemodynamic eventswas explored in a third study, revealing that the consistently elevated MWA thatis reported in iNPH patients is due to intracranial conditions, not cardiovascularevents.
iii


List of Papers
Paper I
Evensen, K. B., O’Rourke, M., Holm, S., Prieur, F. and Eide, P.K. ‘Non-invasiveEstimation of the Intracranial Pressure Waveform from the Central Aortic BloodPressure Waveform in Idiopathic Normal Pressure Hydrocephalus Patients’.In: Scientific reports 8 (2018), pp. 1–11. DOI: 0.1038/s41598-018-23142-7.
Paper II
Evensen, K. B., Paulat,K., Holm, S., Prieur, F. and Eide, P.K. ‘Utility of theTympanic Membrane Pressure Waveform for Non-invasive Estimation of TheIntracranial Pressure Waveform’.In: Scientific reports 8 (2018), pp. 1–11. DOI: 10.1038/s41598-018-34083-6.
Paper III
Evensen, K. B. and Eide, P.K. ‘Mechanisms behind altered pulsatile intracranialpressure in idiopathic normal pressure hydrocephalus: Role of vascular pulsatilityand systemic hemodynamic variables’.In: Acta Neurochirurgica (2020). DOI: 10.1007/s00701-020-04423-5.
The published papers are reprinted with permission from the publishers.All rights reserved.
v


Contents
1 Introduction 11.1 Motivation . . . . . . . . . . . . . . . . . . . . . . . . . . . 11.2 Research aims . . . . . . . . . . . . . . . . . . . . . . . . . 31.3 Thesis outline . . . . . . . . . . . . . . . . . . . . . . . . . 4
2 Background 52.1 Physiology . . . . . . . . . . . . . . . . . . . . . . . . . . . 5
2.1.1 Cerebrovascular physiology . . . . . . . . . . . . 52.1.2 Intracranial compliance . . . . . . . . . . . . . . 8
2.2 Pathophysiology . . . . . . . . . . . . . . . . . . . . . . . . 112.2.1 Chronic disorders . . . . . . . . . . . . . . . . . . 112.2.2 Critical disorders . . . . . . . . . . . . . . . . . . 12
2.3 Continuous physiological monitoring . . . . . . . . . . . . . 142.3.1 Invasive ICP monitoring . . . . . . . . . . . . . . 142.3.2 Non-invasive ICP monitoring . . . . . . . . . . . 172.3.3 Blood pressure monitoring . . . . . . . . . . . . . 222.3.4 Additional hemodynamic variables . . . . . . . . 232.3.5 Tympanic membrane monitoring . . . . . . . . . 24
2.4 Improving the utility of ICP Monitoring . . . . . . . . . . 252.4.1 Intracranial compliance monitoring . . . . . . . . 252.4.2 Intracranial autoregulation . . . . . . . . . . . . 29
2.5 Modeling approaches . . . . . . . . . . . . . . . . . . . . . 312.5.1 Statistical models . . . . . . . . . . . . . . . . . . 312.5.2 Physiological models . . . . . . . . . . . . . . . . 34
3 Summary of presented work 37
4 Discussion 41
5 Conclusion 45
6 Future prospects 47
Bibliography 49
Papers 62
I Non-invasive Estimation of the Intracranial Pressure Wave-form from the Central Arterial Blood Pressure Waveformin Idiopathic Normal Pressure Hydrocephalus Patients 63
vii

Contents
II Utility of the Tympanic Membrane Pressure Waveformfor Non-invasive Estimation of The Intracranial PressureWaveform 77
III Mechanisms behind altered pulsatile intracranial pressurein idiopathic normal pressure hydrocephalus: Role of vas-cular pulsatility and systemic hemodynamic variables 91
Appendices 105
A Acronyms 107
viii

List of Figures
2.1 Illustrates the intracranial compartment, brain tissue, CSF space,part of the cerebrovascular network, and the traditional, incom-plete circulation path of the CSF (black arrows). In additionto what is shown on this illustration, the process of productionand re-absorption of CSF has been expanded on in recent years(Jessen et al. 2015; Kapoor et al. 2008; Orešković, Radoš, andKlarica 2017) and paravascular CSF transport has been proven.This figure is adapted, with permission, from (Lyons and Meyer1990). . . . . . . . . . . . . . . . . . . . . . . . . . . . . . . . . . 6
2.2 The pathway allowing pressure transfer from the subarachnoidspace to the inner ear, called the cochlear aqueduct, is illustratedin red. The ICP waves propagate through the cochlea and ossiclesand excite the tympanic membrane to the left. . . . . . . . . . . 7
2.3 Examples of the intracranial compartment volumes in a healthysubject (left), initial stages of disease where the buffering mecha-nisms are intact (middle) and a case of severe disease where anadded extra mass, for example, extravascular blood or additionalCSF, has caused buffering mechanisms to fail, the ICP to rise,and the parenchyma to change its shape (right). . . . . . . . . . 8
2.4 Illustrates the nature of the intracranial pressure-volume relation-ship. To the left the ICP stays relatively constant with addedvolume and the ICP wave amplitude is small. To the right, theICP increases almost exponentially as the volume is added as theintracranial self-regulatory system loses its ability to compensatefor added volume. To the right the ICP wave amplitude alsoincreases. The figure is adapted, with permission, from (Avezaat,Van Eijndhoven, and Wyper 1979). . . . . . . . . . . . . . . . . 9
2.5 Possible sites for sensor placement when performing invasive ICPmonitoring. The intraventricular probe is advanced directly intoventricular space and the parenchymal probe in the parenchyma.In the figure, this probe is placed on the right side. The Intra-parenchymal probe is placed on the left side of the figure and isadvanced approximately 2 cm into the parenchyma. The figure isadapted, with permission, from (Lyons and Meyer 1990). . . . . 15
2.6 A typical ICP single wave with the three peaks. . . . . . . . . . 25
ix
List of Figures
2.7 The black line shows the pulsatile ICP waveform for an iNPHpatient. The dotted gray line illustrates the respiratory signalwhere the peaks are inspiration and the minima expiration. Thissignal is found from interpolation between the peaks and onsetsof the ICP waveform and has not been directly measured. Theinterpolated signal has a frequency of around 0.2 Hz. . . . . . . 26
2.8 Frequency spectrum of the invasively detected ICP signal shownin Figure 2.7. The respiratory signal 0.20 Hz (orange), heart rate1.29 Hz (blue) and harmonics (red and green). . . . . . . . . . . 26
2.9 Lundberg A waves. These plateau waves can occur in the case ofvery high ICP and are a clear indicator of a medical emergency. 27
2.10 A common problem in intensive care monitoring, where the rapidchange in mean ICP is of an unphysiological nautre, while theMWA metric remains constant. . . . . . . . . . . . . . . . . . . . 29
2.11 Illustrates the concept behind black box models or statisticalmodels. The figure is adapted from (Evensen et al. 2018a) and islicensed under a Creative Commons Attribution 4.0 InternationalPublic License. n . . . . . . . . . . . . . . . . . . . . . . . . . . 31
x

Chapter 1
Introduction
1.1 Motivation
Systematic monitoring of intracranial pressure (ICP) is a staple in neurosurgicalpractice and has, since its introduction by Janny and Lundberg (Guilluame andJanny 1951; Lundberg 1960), greatly contributed to clinical insight and patientcare (Le Roux et al. 2014). ICP is the pressure within the skull relative to areference pressure and can be affected by various diseases of the central nervoussystem (CNS). Increased ICP can occur as a consequence of cerebrospinal fluid(CSF) circulation disorders, intracranial mass lesions or more diffuse intracranialpathological processes. In the case of, for example, traumatic brain injury (TBI),the increase may be acute, while in the case of normal pressure hydrocephalus(NPH) the increase can be subtle and chronic. Elevated ICP may cause reductionin cerebral blood flow (CBF), and in extreme situations even brain ischemia orbrain herniation and death. ICP elevation is, therefore, a potential marker ofprimary brain injury and can be an indicator of a medical emergency (Greenberg2016).
Around the mean ICP level, there are systematic pressure fluctuations dueto cardiac activity. In the cardiovascular system, the heart functions as a pumpthat drives blood flow directly into the central aorta before it is redistributedacross the arterial tree and into the cranial cavity. As a result, the volume ofblood entering the brain varies with the cardiac cycle. Each heartbeat producesa flow-peak during systole and a flow-low during diastole, which causes pressurepulsations that can be measured as pulsations in the ICP readings. In thefollowing, the pressure pulsations due to cardiac activity will be referred to aspulsatile ICP.
The flow and pressure dynamics that decide mean and pulsatile ICP arecomplex and depend on the volume of the intracranial constituents and theintracranial compliance (ICC), which embodies the elastic properties of theintracranial constituents as well as the craniospinal system’s ability to displaceCSF and control CBF to manage the brain’s oxygen supply. These embeddedbuffering mechanisms, however, have limited capacity, and similar levels of meanICP could, therefore, correspond to different ICC values, which would indicatedifferent patient states. For example, in the case of high ICC, a moderateintracranial bleed would lead to a slight increase in mean and pulsatile ICP.In the case of low ICC, a similar bleed could trigger a rapid ICP increaseand a subsequent acute medical situation where surgical intervention wouldbe necessary (Eide 2016). Including ICC to mean ICP in a neurosurgeon’sdecision-making process could, therefore, significantly improve patient care andclinical outcome.
1

1. Introduction
The concept of ICC was initially proposed by Marmarou, with more, whoestablished methods to measure the ICP response when adding volume to aballoon inserted into the intracranial compartment (Löfgren, Essen, and Zwetnow1973; Marmarou, Shulman, and LaMorgese 1975; Marmarou, Shulman, andRosende 1978; Miller and Garibi 1972; Miller and Pickard 1974). Nornes etal. (Nornes, Aaslid, and Lindegaard 1977) and Avezaat et al. (Avezaat, VanEijndhoven, and Wyper 1979) took the concept one step further when theyexplored the analogy between the increasing balloon volume and the cerebralblood volume increase that happens during each cardiac cycle, and postulatedthat the heart is generating volume-pressure tests continuously. The pressureresponse to the cardiac-induced cerebral blood volume changes is, in reality,the measurable pulsatile ICP and could, therefore, give information about theICC. They further proposed that pulsatile ICP, therefore, could be used as adiagnostic tool to assess a patient’s ICC without the invasiveness associated withthe balloon.
In the 1980s, Czosnyka et al. continued this work by introducing a metric forpulsatile ICP quantification. In this approach, the ICP signal is converted to thefrequency domain, the amplitude of the fundamental mode (AMP) is extracted(Czosnyka et al. 1988) and an index found from the correlation between AMPand mean ICP is calculated. However, in this filtering of the signal, significantinformation of clinical importance is lost (Holm and Eide 2008) and the computedindex is mean ICP dependent, making it prone to various signal quality relatedchallenges (Evensen and Eide 2020a). In order to improve the clinical utilityof pulsatile ICP monitoring a new metric was, therefore, proposed by Eide(Eide 2006b). Eide’s method is time-domain based and includes automaticidentification of single waves to remove noise and artifacts from the analysis.Only single waves of high enough quality are used to compute the mean waveamplitude (MWA) and the metric has proven more robust than mean ICPdependent metrics (Evensen and Eide 2020a).
While the work by Avezaat, Eijndhoven, Nordnes, Lindegaard and Czosnyka,was primarily research-oriented and has not made it into clinical practice, theterm ICP wave-guided management has been introduced to describe the clinicaldecision making procedure where the MWA metric is used to guide patientmanagement rather than mean ICP. Clinical intervention based on MWA hasconsistently produced better results than management of mean ICP alone, bothin the case of critically ill patients (Eide et al. 2011) and in the management ofpatients with more slowly developing pathologies such as NPH (Eide 2011; Eideand Sorteberg 2010a). The efforts toward making pulsatile ICP monitoring partof common clinical practice worldwide, however, are ongoing.
Currently, the only clinically viable approach for long term pulsatile or meanICP monitoring includes drilling a hole through the skull and placement ofa catheter into the parenchyma or ventricular space. These are both highlyinvasive procedures that carry a 1–2% associated risk of hemorrhage (Binz,Toussaint, and Friedman 2009) and a 7% risk of infection (Rebuck et al. 2000)depending on the procedure. Despite considerable effort to make non-invasiveICP monitoring a reality, none of the proposed methods are currently robust
2

Research aims
and accurate enough to replace the invasive gold standard, neither for mean ICPmonitoring (Zhang et al. 2017), MWA monitoring, nor for other ICC assessmentmetrics (Harary, Dolmans, and Gormley 2018; Heldt et al. 2019).
As a result, ICP and MWA monitoring is only conducted in a small subsetof patients, where the need to gain information about the intracranial conditionoutweighs the invasiveness of the procedure. In addition to the in-surgery ICPmonitoring, the current procedure is to continue the monitoring for only a fewdays after the intervention to track the patient’s progress. However, prolongedmeasurements are associated with increased risks of infection, and monitoringis therefore discontinued after, at the most, three days (Greenberg 2016). Aspatients are different, with individual starting points, conditions and healingprocesses, long term monitoring of both pulsatile and mean ICP could be helpfulfor the physicians when monitoring the recovery process, as well as planningrehabilitation and the subsequent stages of patient care.
In addition to making ICP and MWA monitoring safer for these patientsand allow for longer measurements duration, a reliable non-invasive monitoringtechnique could impact patients where ICP measurements currently are avoideddue to the associated risks. Given the brain’s role as a central organ, onecan imagine a series of pathologies where both mean and pulsatile ICP are ofimportance. How ICP and ICC affects migraine, sight and hearing, are themost obvious questions that currently stand unanswered. A non-invasive MWAmonitoring tool could also reveal changes in ICC at early stages of diseases such asTBI, growing tumors or accumulation of CSF fluid, before the situation becomescritical. An early diagnosis could help the physicians make the best decisionsat the onset of disease so that the necessary competence can be acquired, thecorrect medical actions can be performed, and an impending medical emergencycan be averted.
1.2 Research aims
In the research that makes out this thesis, the primary aim is to non-invasivelypredict the MWA parameter, with the necessary clinical accuracy, from biologicaltime series other than invasive ICP measurements. In addition, we wish to relateICP measurements to different physiological parameters to better understandthe source of the different changes that occur in the diseased brain in the case ofidiopathic NPH (iNPH). To non-invasively obtain information about the ICPwaveform, we approach the problem from several different perspectives usingreal clinical data as our primary source of information.
The first paper explores whether central aortic blood pressure (BP) waveformsare a viable input signal for non-invasive MWA estimation and if this can be donewith the necessary clinical accuracy. We examine whether this is possible withina patient or even across patient cohorts. We also explore whether the transferfrom central aortic BP waveforms to ICP waveforms depend on physiologicalparameters such as age, condition and weight.
The second paper has the same end goal (non-invasive prediction of MWA)
3

1. Introduction
but uses an entirely different input signal and has a different physiological basis.There is a known connection between the intracranial compartment and theinner ear. We examine whether this allows for direct pressure transfer fromthe intracranial compartment to the tympanic membrane or whether the signaldistortion is too extensive for the necessary clinical accuracy to be within reach.
The third paper pivots back to the questions about what mainly affects themorphology of the ICP in iNPH patients and how much of the changes in theICP morphology in the brains of iNPH patients happen due to changes in themorphology of the intracranial arterial BP and how much is due to changes inthe state of the intracranial constituents. In this paper, we also touch on howthis likely affects the brain’s waste clearance capacity.
In sum, the primary research questions we aim to answer can be concretized,one per paper, as follows:
• Can central aortic BP waveforms be a viable input signal for non-invasiveMWA estimation with the necessary clinical accuracy?
• Can the connection from the intracranial compartment to the inner ear beused for non-invasive MWA prediction?
• Are the primary mechanisms behind the altered MWA in iNPH patientsdue to extra-vascular or vascular factors?
1.3 Thesis outline
The remainder of this thesis is subdivided into five main chapters before theincluded papers are reprinted. Chapter 2 describes the relevant cerebrovascularphysiology necessary to motivate the choices made in our contributions. Theorigin of the clinical source signals we utilize is described, as well as the pathologiesrelevant for our patient cohorts.
Then, the current state of the art for ICP monitoring is covered. Theclinical standard for invasive ICP measurements and the different variationsare described, together with the field’s current views on possible improvements.To illustrate the wide range of approaches explored throughout the 40 yearsof research, some of the many non-invasive approaches to ICP monitoring arealso included. The latter is necessary to place our contributions in a holisticperspective.
The presented contributions in all our papers rely on statistical models totransform our source signals to signals a physician can interpret. The relevantmodeling approaches utilized in addition to modeling approaches used in othercontributions to the field are therefore also covered.
In Chapter 3, the three papers included in this thesis are summarized, whilethey are discussed and put into context in Chapter 4. Our main findings areconcretized in the conclusion, which constitutes Chapter 5. Chapter 6 describesthe most promising techniques before the three discussed papers are presentedin their published form.
4

Chapter 2
Background
2.1 Physiology
To fully understand what ICP and ICC are and the mechanisms that affect them,a brief overview of the relevant anatomy and physiology of the cerebrovascularand cerebrospinal systems is provided in this section. To motivate the choicesmade in our contributions, short descriptions of the cardiovascular system andinner ear, relevant for papers I, III and II respectively, are also presented.Further, the pathophysiology and prevalence of the relevant brain diseases aredescribed to emphasize the utility and the potential impact of non-invasive ICPand MWA monitoring.
2.1.1 Cerebrovascular physiology
Once the bony plates that cover a newborns brain have closed, the skull becomesa rigid structure that confines three main components: brain tissue, the cerebralvascular network and cerebrospinal fluid. Together the volume of these con-stituents and the intracranial elastance properties are the primary determinantsof mean ICP and pulsatile ICP.
The major contributor to the intracranial volume is the brain tissue compart-ment, which fills 80 % of the accessible volume. This compartment consists ofthe neurons- and glial cells of the CNS, as well as the interstitial fluid. In thecase of acute brain injury, the compartment can be significantly expanded aswater can accumulate in the interstitial space or intracellularly.
The cerebral vascular network supplies the brain with oxygen and nutrientsand removes metabolic waste products such as CO2 and lactic acid. The cerebralvasculature has an embedded ability to regulate the brain’s oxygen supply bycontrolling the amount of CBF. Adequate CBF is crucial for brain function andpatient survival but is difficult to measure in vivo. ICP is therefore monitored asit is a relatively easily accessible source of information. CBF can be expressedas the relationship
CBF = CPP
CV R, (2.1)
where CPP is the net pressure gradient that causes blood to flow into the brainand is described as the difference between the mean arterial pressure (MAP)and ICP, while CVR is the cerebrovascular resistance. A change in ICP or MAPaffects the pressure gradient CPP. To maintain CBF, and thereby the oxygensupply, as constant as possible, the cerebral arteries and arterioles respond byvarying their diameters, thus altering the resistance to flow. This resistanceis embedded in the CVR parameter. If there is an ICP drop, the arteriesand arterioles dilate to ease the blood flow into the brain. If ICP rises, they
5

2. Background
contract to reduce CBF. During hypertension, the arterioles constrict to raise theresistance and protect against edema and ischemia. This sophisticated controlmechanism allows for seemingly constant CBF over a wide range of pressuregradients and is referred to as cerebral autoregulation. The vessels’ ability tovary their diameters is due to smooth muscle cells inside the walls. A completemechanistic understanding of what triggers their response is, however, still nota reality and research is progressing. Blood viscosity, changes in the pressuregradient across the venous walls, and changes in CBF, MAP, O2 and CO2 levelsare all important factors (Moore and Newell 2005; Willie et al. 2014). As theintracranial vascular pulsations are the source of the ICP pulsations, there isreason to believe that these mechanisms affect the morphology of the pulsatileICP. Under normal circumstances, the cerebrovascular compartment makes up 10% of the intracranial volume, but in the case of acute injury causing bleeding, orin the case of venous outflow obstructions, this volume can increase significantly.
Approximately 10% of the intracranial volume is filled with CSF, whichis found around the brain tissue, in the ventricles and the spinal cord, asillustrated in Figure 2.1. Novel research over the last decade revealed thatCSF also is an integrated part of the CNS and is distributed throughout theperivascular compartments of the brain (Ringstad et al. 2018) and the visualpathway (Jacobsen et al. 2019). In addition to providing essential mechanicaland immunological protection, CSF plays a crucial role in brain waste clearance(Jessen et al. 2015) and in cerebral homeostasis (Matsumae et al. 2016).
Dura materArachnoid Subdural space
Subarachnoidspace
Perivascularspace
Artery
Fourth ventricle
Lateral ventricle
Third ventricle
Brain tissueTraditionalCSF circulationpathway
Figure 2.1: Illustrates the intracranial compartment, brain tissue, CSF space,part of the cerebrovascular network, and the traditional, incomplete circulationpath of the CSF (black arrows). In addition to what is shown on this illustration,the process of production and re-absorption of CSF has been expanded on inrecent years (Jessen et al. 2015; Kapoor et al. 2008; Orešković, Radoš, andKlarica 2017) and paravascular CSF transport has been proven. This figure isadapted, with permission, from (Lyons and Meyer 1990).
6

Physiology
The CSF volume can expand beyond the mentioned 10 % in the case of CSFcirculation failure, which is the case in certain types of hydrocephalus.
All three compartments are illustrated in Figure 2.1. The subfigure to theleft shows the brain tissue compartment and the traditional CSF circulationpathway, while perivascular CSF transport and a small excerpt of the cerebralvascular network is illustrated in the subfigure to the right. The compartmentaldivision is also illustrated in Figure 2.3.
In addition to the intracranial and intraspinal CSF circulation scheme illus-trated in Figure 2.1, there is a direct connection from the CSF space to theperilymph of the cochlea in the inner ear. The pathway is illustrated in red inFigure 2.2 and allows for direct propagation of the cardiac-induced pulsatile ICPin the subarachnoid space to the perilymphatic space of the inner ear (Lang etal. 2003). The pulsatile ICP waves propagate through the non-compressible fluidsof the inner ear and excite the oval window and the ossicles causing vibrations inthe tympanic membrane. This mechanistic chain of pressure transfer is the samethat occurs when audible sound hits the tympanic membrane but in reverse.For a healthy subject, the low-frequency hearing threshold of audible sound canbe as low as 20 Hz (Contours 2003). As seen from the frequency spectrum inFigure 2.8, the pulsatile ICP signals have the majority of their energy well belowthis limit. They are thereby in the infrasonic range and can not be heard. Thisinspired an interesting approach to non-invasive ICP monitoring, which is moreextensively covered in Section 2.3.5 and Chapter 3.
Figure 2.2: The pathway allowing pressure transfer from the subarachnoid spaceto the inner ear, called the cochlear aqueduct, is illustrated in red. The ICP wavespropagate through the cochlea and ossicles and excite the tympanic membraneto the left.
7

2. Background
2.1.2 Intracranial compliance
The division of the craniospinal space into three interacting compartments isthe basis of the Monro-Kellie doctrine, which is essential for explaining thespecial intracranial volume-pressure relationship that arises due to the cranium’sconfining structure. The nature of the volume-pressure relationship is againcrucial for understanding the concept of ICC and the motivation behind ICPwaveform analysis, which is one of the central themes in this thesis.
The doctrine originated from observations made by Monro (Monro 1783)and was modified by Kellie, his assistant (Kellie 1824). In short, it states thatthe three compartments must maintain equilibrium as the total volume at theirdisposal is constant. The volume percentages indicated for the three constituentsin the previous sections, and to the left in Figure 2.3, are descriptive of thepercentages under normal conditions. If the total volume is to stay constant,that implies that any volume increase in one of these three must result in acorresponding volume decrease in the other two. It should be noted that this isthe case for a small modification of the Monro-Kellie doctrine, namely that thevolume of the intradural space, rather than the intracranial space, is constant, asthere is free communication of CSF between the lumbar cistern and intracranialspace (Bruce 1980; Heldt et al. 2019).
In the earliest stages of trauma or disease, variations that occur in the volumeof one of the constituents are immediately compensated for by CSF displacementinto the lumbar cistern. Following that step, CBF decreases, and the sectiondenoted intravascular blood in Figure 2.3 is reduced. In the case of a foreignmass, the added volume initially does not affect ICP, nor the condition of thebrain tissue.
10 %
10 %80 % 80 % < 80 %
Cerebrospinal fluid Intravascular blood Extra mass
Healthy Buffer mechanisms intact Buffer mechanisms failing
Brain tissue
Figure 2.3: Examples of the intracranial compartment volumes in a healthysubject (left), initial stages of disease where the buffering mechanisms are intact(middle) and a case of severe disease where an added extra mass, for example,extravascular blood or additional CSF, has caused buffering mechanisms to fail,the ICP to rise, and the parenchyma to change its shape (right).
8

Physiology
In Figure 2.3, the orange section illustrates such an added mass, which can beextravascular blood in the case of traumatic brain injury, a brain tumor or extraCSF volume due to re-absorption obstructions. In this subfigure, the bufferingmechanisms described in the Monro-Kellie doctrine are still operating, but nolonger at full capacity. To the right in Figure 2.3, the buffering mechanisms areexhausted, and the medical situation is critical.
Regardless of the cause of increased pressure on the other intracranial com-partments, the compensatory mechanisms of the self-regulatory system will,when the disease has progressed enough, reach a point where the system isoverloaded. At this point, it has lost its ability to compensate for added volume.In the case of further volume expansion after this threshold, the ICP starts to risealmost exponentially, the parenchyma loses extracellular water, and eventuallyeven neurons and glial cells. In the end, the brain will, therefore, change itsshape and permanent damage occurs, as illustrated to the right in Figure 2.3.
The body’s ability to reduce the volume of the intracranial constituents whennecessary results in a special pressure-volume relationship within the intracranialcompartment. Among others, this was thoroughly explored by Langfitt et al. whoin the mid-1960s, used approximately 70 rhesus monkeys to map the relationshipbetween ICP and injected volume (Langfitt, Weinstein, and Kassell 1965, 1964).The resulting curve is rendered in Figure 2.4 and illustrates further how thebody’s volume-compensating mechanisms control the ICP.
Figure 2.4: Illustrates the nature of the intracranial pressure-volume relationship.To the left the ICP stays relatively constant with added volume and the ICPwave amplitude is small. To the right, the ICP increases almost exponentially asthe volume is added as the intracranial self-regulatory system loses its abilityto compensate for added volume. To the right the ICP wave amplitude alsoincreases. The figure is adapted, with permission, from (Avezaat, Van Eijndhoven,and Wyper 1979).
9
2. Background
Mathematically, ICC is defined as the relationship between changes in volumeand pressure given as
ICC = ∆V∆P , (2.2)
and can be seen as a measure of the state of the self-regulatory system. When thesystem ceases to function, minimal changes in volume result in a very pronouncedrise in ICP and the system is said to have low ICC. At this point, the system isfar to the right in Figure 2.4. Conversely, when ICC is high, even large volumeincreases yield small-pressure changes, and the system is to the left in the figure.As a result, relatively similar ICP values can correspond to very different ICCvalues and only measuring mean ICP, therefore, provides the clinician withlimited information about a patient’s condition.
The critical limit for impaired ICC, is patient-specific and will, in part,depend on the patient’s pathology. In the context of acute brain injury, the extravolume is the determining factor. In the case of more slowly developing diseasessuch as NPH, the mechanisms involved are more complex, and the biomedicalproperties of the brain and the intracranial elastance properties play pivotingroles. Knowing the ICC would, therefore, be very useful for the physicians whenmaking clinical decisions about when, or if, to intervene in order to preventmedical emergencies.
Avezaat and Eijndhoven’s idea to use the intracranial volume increase thathappens during each cardiac cycle as a non-invasive alternative to the balloon,resulted in the concept of pulsatile ICP as a possible ICC monitoring tool. Thisis also illustrated on Figure 2.4 where the magnitude of the pulsatile ICP changeswhen the regulating mechanisms progress to fail. A complete mechanisticunderstanding of why this happens is currently not a reality, but increasedpulsatile ICP with decreasing ICC has been proven accurate through numerousclinical studies (Avezaat and Eijndhoven 1986; Avezaat, Van Eijndhoven, andWyper 1979; Chopp and Portnoy 1980; Eide 2016; Gonzĺez-Darder and Barcia-Salorio 1989). Exactly how pulsatile ICP monitoring is used to gain informationabout ICC is more thoroughly described in Section 2.4.1.
10
Pathophysiology
2.2 Pathophysiology
Various disorders can cause elevated ICP, and a wide range of patients mightbenefit from mean and pulsatile ICP monitoring. These patients can be subdi-vided into two primary categories: the chronically ill and the critically ill. Thefirst category is patients where the cause of brain disease is complex and notnecessarily given. This is the case for NPH patients and patients suffering fromidiopathic intracranial hypertension (IIH). The second category can experiencerapid ICP increase due to a sudden trauma causing bleeding or CSF re-absorptionobstruction, and the reason for disease is often evident.
The management strategies for the two patient categories differ, and a shortdescription of the cause of disease and the following clinical intervention istherefore covered. The following sections focus on the pathologies included inthe patients’ cohorts in the work presented in this thesis and highlight why theseconditions, in particular, could benefit from ICC monitoring and, more precisely,non-invasive MWA monitoring.
2.2.1 Chronic disorders
Patients with chronic disorders include patients suffering from NPH and idio-pathic intracranial hypertension. Relevant to this thesis are patients with iNPH.NPH is categorized by enlarged ventricles and is typically subdivided into twocategories: idiopathic and secondary NPH. The secondary prefix is used whenthere is an identifiable condition that causes CSF re-absorption issues such asmeningitis, trauma or subarachnoid hemorrhage (Gooriah and Raman 2016).When the cause of the complications is unknown, which is usually the case, theprefix idiopathic is added.
There are no exact unique inclusion/exclusion criteria for iNPH, and bothJapanese (Mori et al. 2012) and an American-European (Relkin et al. 2005)guidelines exist and are used as a basis for diagnosis. In general, one or more ofthe three classical items of the triad of gait disturbance, urinary incontinenceand cognitive decline must be present, together with ventricular dilation. Bothguidelines differentiate between the categories probable NPH and possible NPH,but exactly which category a patient ends up in depends on the selected guideline(Andersson et al. 2017). A prevalence study of iNPH in Norway performed byBrean and Eide reported 181.7 events per 100,000 people in the age group from70–79 years (Brean and Eide 2008). The number of people affected is thereforesignificant.
Current clinical practice for this group of patients is surgical diversion of CSFvia shunt, which is an invasive procedure associated with complications. TheAmerican-European guidelines acknowledge that the diagnostic criteria aloneare not an indicator of shunt response and that there is no link between thenumber of diagnosis criteria a patient fulfills and the effect of shunt response.Even if a patient meets the diagnostic criteria, only 5–6 of 10 individuals willhave a positive effect from shunt treatment.
11

2. Background
Thorough clinical studies have shown that ICP wave-guided management, orin other words, shunt intervention based on MWA values, have increased thispatient share with 9/10 and has demonstrated better clinical outcomes thanpatient management based on mean ICP alone for this patient group (Eide andSorteberg 2010a). Thereby 3–4 per 10 individuals will not have to go throughthe dangerous operation of shunt placement (10 % risk of severe complications) ifMWA guided management is used. Other supplementary tests to predict whetherpatients would benefit from shunt surgery includes extended lumbar drainage andinfusion tests (Marmarou et al. 2005), but are currently not clinically validatedto the same degree as ICP wave-guided management.
Invasive parenchymal ICP monitoring, which currently is a necessity for MWAmonitoring, has an associated risk of 1–2 % (Eide and Sorteberg 2016). This riskis usually accepted for this cohort in order to not put patients who probably willnot benefit from shunt surgery through that notably more dangerous procedure.It is, however, an added risk and non-invasive monitoring could, therefore, be animportant evaluation tool aiding the physicians and lead to timely patient care.
Despite iNPH being a severe brain disease that progressively worsens overtime (Andrén et al. 2014), a complete understanding of the condition is not yeta reality. Consistent observations of elevated MWA (Eide and Sorteberg 2010a)and evidence of delayed glymphatic clearance within the brain parenchymahas, however, been provided (Ringstad et al. 2018; Ringstad, Vatnehol, andEide 2017). A common misconception is that iNPH is solely a CSF circulationfailure disorder. iNPH should rather primarily be considered a neurodegenerativedisease, combined with CSF circulatory failure, where some patients can benefitfrom shunt-surgery and CSF drainage.
Although shunt surgery does help many patients, it is not an interventiondirected towards the disease cause, but rather towards part of the pathophysiology,thereby improving some of the associated symptoms. Brain biopsy, commonlydone together with shunt surgery, addresses the neurodegenerative part of iNPHand reveals several of the waste substances seen in Alzheimer’s patients (Leinonenet al. 2010). Research aimed at improving the understanding of the diseasecause, and the role played by the brain’s waste clearance, is therefore ongoingin order to eventually improve patient care. Paper III is a contribution to thisliterature.
2.2.2 Critical disorders
Patients in this subcategory are at risk of very rapid ICP increase and couldbenefit from non-invasive MWA monitoring in order to evaluate how theircondition progresses. The patients in this category suffer from TBI, intracranialbleeds, infections, or complications due to neuro-surgical intervention. In paperII, 9 of the 28 patients experienced subarachnoid hemorrhage (SAH) and therebybelong in this subgroup.
The primary reason for ICP elevation and decreasing ICC is apparent andidentifiable in these patients; namely, the added intracranial extravascular bloodvolume. A clinical study evaluating ICP wave-guided management compared
12

Pathophysiology
with traditional mean ICP management demonstrated a significantly betterprimary effect variable in the group that was managed based on MWA (Eideet al. 2011). In SAH patients, the fatality rate has been reported to be ashigh as 50 % with one third of survivors needing lifelong medical care (Hop etal. 1997). Improving the accessibility to proactive intensive care management ofMWA-tailored CSF drainage through non-invasive monitoring would, therefore,improve SAH outcome and have obvious positive effects.
13

2. Background
2.3 Continuous physiological monitoring
Diagnosing, monitoring and management of patients suffering from brain injury orother brain trauma require continuous real-time monitoring of their cardiovascularstate (ABP and CPP monitoring) due to the rapid dynamics of the intracranialsystem. Since the 1960s, there has been a communal effort to use the advancesin technology to improve intraoperative activity and provide the best patientcare. The focus has been on developing good monitoring techniques, whichideally entail minimal additional risks to the patient, are easy to use, and guidethe neurosurgeon towards the decisions that prevent or minimize neurologicaldamage. ABP measurements and ICP measurements are both fundamentalphysiological parameters of the cranio-spinal system and the two most informativemeasurements for the clinicians in their assessment of a patient’s state andprogress.
In the following sections, the current state of the art in ICP monitoring,radial ABP monitoring and central aortic BP monitoring are described. Whileradial ABP measurements are first-line health care, ICP measurements arerarely performed in the general population. In general, ICP monitoring can besubdivided into two primary categories: invasive and non-invasive measurementapproaches. The invasive systems are the current clinical gold standard, butthey have their limitations, and the evident room for improvement is clearlyillustrated by the numerous approaches to non-invasive ICP monitoring. Bothmeasurement protocols are covered and evaluated in the following sections toprovide the motivation for the contributions presented later in this thesis.
2.3.1 Invasive ICP monitoring
Since the introduction of continuous ICP measurements in the 1950s by Janny(Guilluame and Janny 1951) and 1960s by Lundberg (Lundberg 1960), it hasbecome one of the most important sources of information in neurointensive care(Le Roux et al. 2014). In general, the goal of therapy is to maintain ICP ≤20 mmHg, in order to prevent compromising CBF, which would cause cerebralischemia and brain death (Greenberg 2016). ICP is, therefore, a vital source ofinformation in cerebrovascular monitoring because of its indication of intracranialdynamics and its correlation between prognosis and outcome.
Traditionally, the classical clinical presentation of extremely elevated ICP,regardless of cause, is Cushing’s triad, which includes: respiratory irregularity,bradycardia (bpm < 50) and hypertension. This triad is, however, only seen inthe terminal stages of intracranial hypertension and is rarely seen in a clinicalsetting where modern intensive care is accessible. While CT findings can becorrelated with a risk of increased ICP, no combination of CT findings hasbeen shown to allow accurate estimates of actual ICP and other measurementmodalities are therefore a necessity (Greenberg 2016).
There has been significant progress in the field of neurological monitoring sinceLundberg’s initial explorations, yet invasive ICP monitoring is still the clinicalstandard. Invasive measurements of ICP are carried out in local anesthesia by
14

Continuous physiological monitoring
neurosurgeons who make a burr hole in the skull and insert a physical pressuretransducer. As illustrated in Figure 2.5, there are several possible sites forsensor placement, but the two sites acknowledged to be the most accurate arethe ventricular space or the parenchyma (Zhang et al. 2017). Both of the twopreferred measurement placements have advantages and disadvantages, and bothrequire neurosurgical expertise.
The approach still considered the most accurate is the placement of a pressureprobe inside the lateral ventricle (Zhang et al. 2017). With this placement, thereis an added benefit of allowing for CSF drainage. This is the only approach thatgives a universal ICP, which is primarily why it is preferred. However, it is alsothe most invasive of all the measurement modalities and comes with a higherrisk of hemorrhage and occasional CSF leakage, which can lead to inaccuratelylow readings. Moreover, this measurement procedure carries a risk of infectionas high as 10% (in some series) (Zhang et al. 2017). The problem with infectionsmainly arises when the continuous measurement is made over several hours ordays. As the norm is to monitor during surgery, as well as or 46–72 hours afterwithdrawal of ICP therapy (Greenberg 2016), this becomes a risky procedure.In addition, probe or catheter placement can cause significant damage to thecerebral structure. This is a real concern, as the small ventricles and oftenswollen brain make correct placement challenging. In a study by Saladion etal. it was reported that the share of incorrectly placed catheters was 12.3 %(Saladino et al. 2009).
Intraventricular
Subarachnoid
Epidural
Intraparenchymal
Figure 2.5: Possible sites for sensor placement when performing invasive ICPmonitoring. The intraventricular probe is advanced directly into ventricularspace and the parenchymal probe in the parenchyma. In the figure, this probe isplaced on the right side. The Intraparenchymal probe is placed on the left sideof the figure and is advanced approximately 2 cm into the parenchyma. Thefigure is adapted, with permission, from (Lyons and Meyer 1990).
15

2. Background
The second of the two measurement modalities with the acceptable clinicalaccuracy is measurements performed with a parenchymal probe as illustrated tothe left in Figure 2.5. With this measurement technique, a pressure transducer isusually placed in the frontal region 1–2 cm into the brain parenchyma. Correctplacement is significantly easier than in the case of the ventricular probe, and itis, therefore, the most widely used ICP monitoring method. This type of deviceis currently the choice in the emergency room and for elective surgical cases. Thetwo market-leading manufacturers are Camino and Codman MicroSensor, whichhave been reported to perform comparably (Eide 2006a). Intraparenchymalprobes are a good alternative to ventricular catheters and usually have a signifi-cantly lower infection rate (Zhang et al. 2017). The main disadvantage is thesmall drift and the inability to drain CSF. Moreover, parenchymal measurementsare sometimes critiqued for not providing a universal ICP, as there are pressuregradients across the parenchyma resulting in slightly different readings basedon the probe’s position. However, this problem only applies to baseline ICPlevels and not ICP waveforms (Eide, Holm, and Sorteberg 2012). All the ICPmeasurements used in this thesis were done with a Codman microSensorTM
(Johnson & Johnson, MA, USA) zeroed at atmospheric pressure before insertion.In the case of the two other measurement sites shown in Figure 2.5, the CSF
is more indirectly assessed. The skull is still penetrated, but the sensors are notpassed into the ventricles or brain tissue. Both these options lack the desiredmeasurement accuracy, and there are other evident disadvantages. For instance,at higher pressures, a subdural bolt reports a lower ICP reading because of thepressure drop associated with CSF flow from the ventricles to subdural space.Furthermore, a much larger dural opening is required, and they are reportedto provide less reliable ICP readings (Bhatia and Gupta 2007; Wiegand andRichards 2007). With regards to the epidural devices, a study by Eide et al.(Eide 2008) revealed that these gave an average error in mean ICP of 10.8 ±2.3mmHg. As 20 mmHg often is used as the threshold for surgical intervention,this is a significant error. The reported MWA, however, was close to identical(Eide and Sorteberg 2010b) with parenchymal measurements.
Another common approach to ICP measurements is not illustrated in Fig-ure 2.5 as it is based on accessing the CSF in the spinal canal via lumbarpuncture (LP) and is thereby not an intracranial measurement. In the caseof LP measurements, a spinal tap is inserted into the spinal canal connectedto a pressure transducer. Under normal circumstances, this provides relativelyaccurate measures of ICP, especially the waveform (Eide and Brean 2006), andis used in cases where ICP is believed to be in the normal range. However, inthe case of brain injury or CSF obstructions, as is the case in certain typesof hydrocephalus, ICP can be very different from the CSF measured in thelumbar region. In addition, LP is a highly risky procedure during intracranialhypertension, as a high pressure-gradient between the cranial fluid and the pointof the spinal tap can lead to a sudden downward flow of CSF, pushing the brainstem towards the foramen magnum and thus causing fatal brain herniation.In their current state, LP measurements are also not suitable for continuousmonitoring (Speck et al. 2011).
16
Continuous physiological monitoring
2.3.2 Non-invasive ICP monitoring
Due to the invasive nature of the current ICP monitoring methods, ICP mea-surements are only carried out on a limited number of patients fulfilling specificcriteria. In addition to eliminating the risks currently associated with ICPmeasurements, non-invasive ICP monitoring could enable physicians to monitora wider range of patients allowing researchers to explore the role played by ICPin various less severe pathologies. Due to the apparent benefits, there has beena considerable effort among neuroscientists, engineers etc. to find alternativemethods to measure ICP or in more indirect ways monitor the brains conditionand anticipate brain deterioration. Numerous patent applications related tonon-invasive assessment of ICP have been filed in the last 30 years, though nonon-invasive method has yet made it into routine clinical use. While some patentsare based on evaluation of assumed changes in the intracranial structure thatfollows ICP elevation, others aim to estimate ICP from extracranial structures.In this thesis, one approach in each category is explored. As there is a wide rangeof approaches, a summary of the most significant methods and those relevant tothe presented work is provided below.
2.3.2.1 Otic-based methods
As illustrated in Figure 2.2, there is a pathway for CSF exchange from thesubarachnoid space to the inner ear named the cochlear aqueduct. Utilizing thisaqueduct for non-invasive ICP estimation was first suggested by Marchbanks,who looked at how the tympanic membrane responded differently to excitationof the stapedial reflex relative to the ICP level (Marchbanks et al. 1987). Thistechnique has since been used as a tool to measure mean ICP in various studieswith variable results (Gwer et al. 2013; Raboel et al. 2012; Shimbles et al. 2005).
A study by Davids et al. found that the pulse waves measured in the outerear changed shape when the ICP was altered (by tilting the patient) (Davids,Birch, and Marchbanks 2012). This indicates that waveform analysis could be anapproach worth investigating. This has been explored in a few studies (Evensenet al. 2018b; Lang et al. 2003), ours included and is covered more extensively inpaper II. Although there is an evident resemblance between the non-invasivelyestimated ICP waveforms and the invasive ICPs, the technique was found tonot provide the necessary clinical accuracy for non-invasive MWA based patientmanagement. The method was also found to most likely be limited by the qualityof the cochlear aqueduct, which was believed to be the primary cause of theobserved high patient variability.
A technique very similar to Marchbanks’ utilizes the change in otoacousticemissions that occur when ICP varies. The basis is that evoked CSF pressurein the inner ear alters the mechanical load on the stapes footplate. As a result,sounds generated by the inner ear in response to loud sound, changes whenICP changes (Büki et al. 1996; Voss et al. 2006). Similar to both waveformanalysis of tympanic membrane displacement and absolute tympanic membranevariations, this technique allows for easy to access to measurements and is
17
2. Background
inexpensive to perform. However, otoacoustic emissions are also subject tosignificant intersubject variability (Zhang et al. 2017).
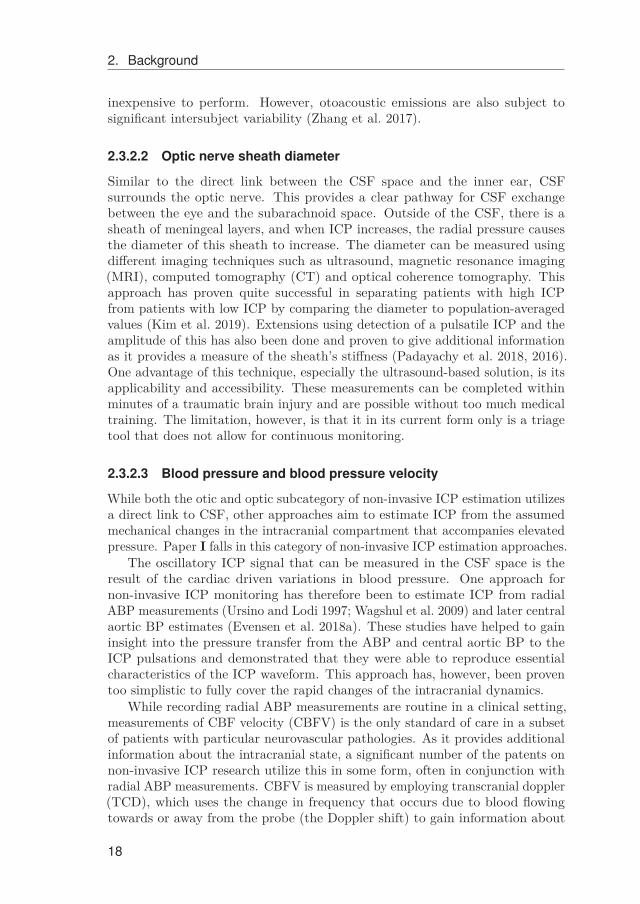
2.3.2.2 Optic nerve sheath diameter
Similar to the direct link between the CSF space and the inner ear, CSFsurrounds the optic nerve. This provides a clear pathway for CSF exchangebetween the eye and the subarachnoid space. Outside of the CSF, there is asheath of meningeal layers, and when ICP increases, the radial pressure causesthe diameter of this sheath to increase. The diameter can be measured usingdifferent imaging techniques such as ultrasound, magnetic resonance imaging(MRI), computed tomography (CT) and optical coherence tomography. Thisapproach has proven quite successful in separating patients with high ICPfrom patients with low ICP by comparing the diameter to population-averagedvalues (Kim et al. 2019). Extensions using detection of a pulsatile ICP and theamplitude of this has also been done and proven to give additional informationas it provides a measure of the sheath’s stiffness (Padayachy et al. 2018, 2016).One advantage of this technique, especially the ultrasound-based solution, is itsapplicability and accessibility. These measurements can be completed withinminutes of a traumatic brain injury and are possible without too much medicaltraining. The limitation, however, is that it in its current form only is a triagetool that does not allow for continuous monitoring.
2.3.2.3 Blood pressure and blood pressure velocity
While both the otic and optic subcategory of non-invasive ICP estimation utilizesa direct link to CSF, other approaches aim to estimate ICP from the assumedmechanical changes in the intracranial compartment that accompanies elevatedpressure. Paper I falls in this category of non-invasive ICP estimation approaches.
The oscillatory ICP signal that can be measured in the CSF space is theresult of the cardiac driven variations in blood pressure. One approach fornon-invasive ICP monitoring has therefore been to estimate ICP from radialABP measurements (Ursino and Lodi 1997; Wagshul et al. 2009) and later centralaortic BP estimates (Evensen et al. 2018a). These studies have helped to gaininsight into the pressure transfer from the ABP and central aortic BP to theICP pulsations and demonstrated that they were able to reproduce essentialcharacteristics of the ICP waveform. This approach has, however, been proventoo simplistic to fully cover the rapid changes of the intracranial dynamics.
While recording radial ABP measurements are routine in a clinical setting,measurements of CBF velocity (CBFV) is the only standard of care in a subsetof patients with particular neurovascular pathologies. As it provides additionalinformation about the intracranial state, a significant number of the patents onnon-invasive ICP research utilize this in some form, often in conjunction withradial ABP measurements. CBFV is measured by employing transcranial doppler(TCD), which uses the change in frequency that occurs due to blood flowingtowards or away from the probe (the Doppler shift) to gain information about
18

Continuous physiological monitoring
CBF. Since its introduction by Aaslid et al. in 1982 (Aaslid, Markwalder, andNornes 1982) it has evolved to become a diagnostic and monitoring tool especiallyrelevant for detecting vasospasms following SAH (Bathala, Mehndiratta, andSharma 2013). Mean flow velocity is directly proportional to flow and inverselyproportional to the cross-section of the vessel. Any circumstances that can leadto a variation of one of these factors can thus affect mean velocity. IncreasedICP is one of these circumstances.
There have been several approaches to non-invasive ICP estimation usingboth CBFV (Klingelhöfer et al. 1991) and CBFV waveform characteristics(Homburg, Jakobsen, and Enevoldsen 1993), but a recent study found thatusing a combination is superior to using only one (Cardim et al. 2016). Likeultrasound techniques can be, they are prone to operator variability and theskull characteristics of the patient, which sometimes limits the propagation ofultrasound waves (Harary, Dolmans, and Gormley 2018).
However, TCD-based assessments have proven more successful than othernon-invasive ICP estimation approaches (Harary, Dolmans, and Gormley 2018).In particular an approach combining radial ABP and CBFV waveforms with amechanistic model, which does not require training on population-averaged datafor calibration, has been shown to provide promising results (Heldt et al. 2019;Kashif et al. 2012) in mean ICP estimation. Pulsatile ICP measurements are,however, not possible with the current model and continuous monitoring ofCBFV waveforms are somewhat challenging.
2.3.2.4 Imaging-based methods
Several of the anatomic changes related to ICP increase can be captured usingmodern medical imaging techniques such as magnetic MRI and CT. Enlargedventricles indicate hydrocephalus and foreign masses, such as lesions and tumors,can occur on screen. This can also result in compressed ventricles or midlineshifts that become evident in images. This kind of direct evaluation of imagesis, however, only applicable as screening tools for very high ICP and not nearlyinformative enough for detailed ICP estimation. Although useful in some cases,a study conducted on 184 patients found no significant correlation between thesize of the cerebral ventricles measured by CT scans and the invasively measuredICP (Eide 2003).
A more detailed non-invasive ICP monitoring technique combining fluidmechanics with MRI obtained measures of the blood and CSF volumes thatenter and leave the cranium during the cardiac cycle has bewhich in several small-scale studies have been found to give information about the brain compliance(Alperin et al. 2000; Burman et al. 2019). Other attempts to gain pulsatileICP information from MRI imaging have given contradictory results (Ringstadet al. 2017).
A CT-based study on TBI patients decided the CSF volume relative to thetotal intracranial volume and used this to differenciate between high and low ICPwith 67 % accuracy (Pappu, Lerma, and Khraishi 2016). Although potentiallyproviding valuable information about ICP, the methods are currently not reliable
19

2. Background
enough for clinical ICP evaluation, and they also do not allow for continuousmonitoring (Harary, Dolmans, and Gormley 2018; Miller et al. 2004; Zhanget al. 2017).
2.3.2.5 Acoustic methods
Acoustic-based methods aim to derive ICP from changes in the acousticalproperties of the constituents of the compartment or changes in the acousticalproperties of the cranium itself. One acoustic-based approach, which can beseen as a combination of an otic method and an acoustic method, was proposedby Levinsky et al. (Levinsky et al. 2016). The approach was called transcranialacoustic signals (TCA) and is based on a pure tone source signal of 621 Hz beingsent from an earplug in one ear that is received in the other ear together withthe head generated sounds. A mathematical model was established based on atraining group where both TCA signals and invasive ICP measurements wereavailable. The non-invasive ICP estimates were then found after splitting theacoustic signal into different frequency bands corresponding to: blood flow (0–15Hz, 0–25 Hz, 0–45 Hz, 0–75 Hz), breathing processes (150–180 Hz) and testsignal (621±3 Hz), before parameters were extracted for mean and pulsatile ICPestimation (Levinsky et al. 2016). The initial study reported good agreementbetween estimated and invasive ICP with a mean difference of 0.39 mmHgand 0.53 mmHg for mean ICP and pulsatile ICP, respectively. This techniquehas been investigated as a part of this PhD project, but the method appearsdependent on data quality, which could be the leading cause of lack of clinicalvalidation following the initial study.
Another group of approaches is the ultrasonic time of flight (TOF) techniques.These are based on the assumption that changes in ICP will affect the acousticproperties of the intracranial structures and that the physical dimensions of thecranial vault can change. The TOF-based assessment of non-invasive ICP wasamong others introduced by Ragauskas et al. (Ragauskas and Daubaris 1995)and later elaborated upon (Petkus, Ragauskas, and Jurkonis 2002; Ragauskasand Petkus 2001; Ragauskas et al. 2003). In these studies, pulsatile informationis obtained from a combination of changes in sent and received ultrasoundpulses, and hemodynamic-induced changes in sound speed. The TOF signalsare strongly dependent on the position of the ultrasound probes relative to thebrain’s inner structure. When addressing TOF derived waveforms as a part ofthis PhD project for pulsatile ICP estimation, it became evident that the dataquality is a significant challenge. The project was, therefore, not elaboratedupon in the presented work.
The categories of non-invasive ICP monitoring described in the previousparagraphs represent a small selection of the various approaches, chosen becausethey are most closely linked to the work in this thesis or currently evaluatedto have the highest potential. There are, however, other creative methods fornon-invasive ICP estimation that are thoroughly described in review paperson the subject (Bruce 2014; Popovic, Khoo, and Lee 2009; Raboel et al. 2012;Robba et al. 2016; Zhang et al. 2017).
20

Continuous physiological monitoring
A summary of the techniques described in the preceding paragraphs isprovided in Table 2.1.
Table 2.1: Some approaches to non-invasive ICP monitoring, together with therelevant source signals used for estimation. Several of these approaches, such asthe TOF and TCD based techniques, utilize some form of BP measurements aswell as their primary source signal.
Otic-basedTympanic membrane displacement Raboel et al. 2012; Shimbles et al. 2005;
Gwer et al. 2013; Marchbanks et al. 1987Tympanic pressure waveforms Evensen et al. 2018b; Lang et al. 2003Otoacoustic emission Büki et al. 1996; Voss et al. 2006Optic-basedOptic nerve sheath diameter Padayachy et al. 2018, 2016;
Kim et al. 2019BP, CBF and CBFV basedTranscranial doppler Kashif et al. 2012; Klingelhöfer et al. 1991;
Homburg, Jakobsen, and Enevoldsen 1993;Cardim et al. 2016; Heldt et al. 2019
Radial arterial BP Ursino and Lodi 1997; Wagshul et al. 2009Central arterial BP Evensen et al. 2018aImaging-basedMagnetic resonance imaging Alperin et al. 2000; Ringstad et al. 2017;
Burman et al. 2019Computed tomography Pappu, Lerma, and Khraishi 2016;
Eide 2003
Acoustic basedTranscranial acoustic signals Levinsky et al. 2016Time of flight Ragauskas and Petkus 2001;
Ragauskas and Daubaris 1995;Petkus, Ragauskas, and Jurkonis 2002;Ragauskas et al. 2003
21

2. Background
2.3.3 Blood pressure monitoring
While current techniques for non-invasive monitoring of ICP are still far fromreaching the required accuracy and level of validation necessary for clinical use,non-invasive ABP measurements have been a reality since 1855, when Karlvon Vierord developed the first non-invasive transducer (Saugel, Scheeren, andTeboul 2019). Today his complex system of weights and levers is replaced withinflatable air-filled cuffs that are used at first-line health care facilities worldwide.However, these do not provide the opportunity of continuous measurements asthey occlude the artery at the measurement site.
Radial artery tonometry or applanation tonometry is a non-invasive op-tion that does allow for continuous measurements. The technique is based oncompressing and partially flattening an artery against the underlying surface(preferably a bony structure) and logging the forces exerted on a pressure sensorby the arterial pulsations (Weiss et al. 1996). However, the technique requirescalibration through cuff measurements in order to provide anything beyondwaveform information, and its clinical accuracy is inferior to invasive BP mea-surements (Meidert et al. 2013; Weiss et al. 1996). Direct invasive continuousmeasurements, typically in a peripheral artery, remains the clinical gold standardand is the backbone of hemodynamic monitoring in numerous fields of medicine,intensive and neurosurgical care included.
The invasive procedure includes the placement of an arterial catheter in thebrachial, femoral or radial artery and is associated with a relatively low overallcomplication rate. The measurement insecurities are primarily linked to theexecution. If the measurements are carried out in the radial artery, for example,different readings will be obtained for different hand placements. Papers I andIII in this thesis utilizes these kinds of radial pressure measurements as an inputfor estimating the input signals in our analysis. The measurements in our studieswere conducted in the right radial artery using a Truwave PX-600F PressureMonitoring Set (Edwards Life sciences LLC, Irvine, CA) placed at heart level.
Central aortic BP measurements are often promoted to be more physiologi-cally relevant than peripheral BP measurements such as those performed in theradial or brachial artery. Due to it’s closeness to the heart and thereby the site ofhemodynamic events, it is argued to be a preferable predictor of cardiovascularrisk compared to more peripheral BP measurements (Narayan et al. 2014). Apreliminary study also revealed that the morphological relationship between theICP waveforms and central aortic BP waveforms was superior to that of ICPwaveforms and radial ABP waveforms (Kim et al. 2016), making them highlyrelevant for the topic of this thesis.
Invasive measurement of central aortic BP waveforms, however, is difficultin vivo and potentially hazardous (Avolio et al. 2009). Consequently, severalnon-invasive techniques have been proposed and clinically validated to varyingextent (Narayan et al. 2014). One approach is to estimate the central aorticBP waveforms from radial ABP waveforms or brachial artery BP waveformsusing a population generalized transfer function (Chen et al. 1997; Karamanogluet al. 1993; Sharman et al. 2006).
22
Continuous physiological monitoring
For papers I and III, this was done using a commercially available productnamed the SphygmoCor system (SphygmoCor®; AtCor Medical, West Ryde,NSW, Australia). The SphygmoCor system has been validated to successfullyderive central aortic BP waveforms in various settings from invasive brachialartery BP measurements (Karamanoglu et al. 1993), invasive radial artery BPmeasurements (Pauca, O’rourke, and Kon 2001) and radial artery tonometrymeasurements (Ding et al. 2011; Gallagher, Adji, and O’Rourke 2004). Thevalidation study by Gallagher et al. is the most thorough and was conducted ona total of 439 patients and healthy subjects. As invasive radial ABP waveformmeasurements are more accurate than tonometry based radial ABP waveformmeasurements, this can be generalized to the measurements included in ourcohort (Geoffrey et al. 2003; Meidert et al. 2013; Weiss et al. 1996). TheSphygmocor system has also been approved by regulatory bodies such as the USFDA (Gallagher, Adji, and O’Rourke 2004; Ltd 2012).
In our contributions, we acknowledge that the central aortic BP waveformsare indeed estimates and that they do provide an additional source of uncertaintyin the analysis. The thorough validation study that illustrated the generalizedtransfer function’s performance across different arterial pressures, genders andpathologies and how different research groups find similar transfer functionsdo, however, provide some reassurance in the validity of the estimates. In thepreparation of paper III we also saw a better correlation between hemodynamicevents and central aortic BP waveforms compared to radial ABP waveforms andtheir similarity with the ICP waveforms supports the same conclusion. Variousother epidemiological (Li et al. 2008; Roman et al. 2007) and clinical studies(McEniery et al. 2008; Williams et al. 2006) using the Sphygmocor system furthersubstantiates our observations.
2.3.4 Additional hemodynamic variables
In addition to blood pressure monitoring and blood pressure waveform monitoring,monitoring of other hemodynamic variables provides additional information tothe clinicians. The relevant variables relevant for the work in this thesis areheart rate, MAP, systemic vascular resistance, stroke volume, cardiac input andthe cardiac index, which are all included in the analysis in Paper III (Evensenand Eide 2020b).
In our work, the variables were measured using the LiDCOMTM+ software(version 4.0, LiDCO Ltd., Cambridge, UK). This provides a continuous BPwaveform analysis (PulseCO) and a lithium dilution calibration system. Thecalibration procedure involves injecting 0.3 mmol lithium chloride through acentral line. Following this, the lithium is detected by an external lithium-ion sensitive external electrode connected to the peripheral arterial line whichpermits monitoring of the previously mentioned hemodynamic variables.
23

2. Background
2.3.5 Tympanic membrane monitoring
Whereas invasive ICP measurements, invasive radial ABP measurements andmeasurements of hemodynamic variables are standard clinical measurementsundertaken using commercial products and analyzed on commercial software, thetympanic membrane monitoring technique utilized for paper II is less clinicallyestablished.
The rationale behind measuring the pulsatile ICP waveform in the outer earis based on pulsatile ICP waves propagating through the inner ear and excitingthe tympanic membrane, as illustrated in Figure 2.2. To log the oscillations ofthe tympanic membrane, the ear canal must be completely sealed. In our work,this was achieved by placing a tube in the outer ear and, closing it airtight usinga glove around the tube, as the Otorhinolaryngology department does whenfitting hearing aids.
The tympanic membrane pressure (TMP) oscillations believed to originatefrom the pulsatile ICP waveforms were then measured in one ear using a spe-cially designed pressure transducer developed by Paulat and coworkers (Paulat,Brucher, and Russell 2002). The device is a miniature transducer placed in theouter ear channel and connected to a pressure logger and a processing device.The measurement equipment is more thoroughly described in the technical note(Lang et al. 2003) and the relevant paper (Evensen et al. 2018b).
24

Improving the utility of ICP Monitoring
2.4 Improving the utility of ICP Monitoring
The primary aim of critical care for patients suffering from brain injury orcerebrovascular disease is to anticipate brain deterioration in order to performthe appropriate medical intervention. In this regard, considerable effort has beenexpended towards finding a safe and easily accessible ICC parameter. AlthoughMWA monitoring is the only parameter to find its way into clinical practice,several other ICC metrics have been explored and are thoroughly discussed inthe literature. The most relevant metrics and a more thorough explanation ofMWA and the pulsatile ICP signal are provided in the following section, togetherwith metrics for monitoring of autoregulation.
2.4.1 Intracranial compliance monitoring
The ICP signals measured and evaluated by the physicians consist of a sumof different cyclic variations originating from different mechanisms in the body.When discussing the ICP morphology, this is usually in reference to the shape ofa single wave, as illustrated in Figure 2.6.
A typical ICP waveform, or single wave, has three distinct peaks: thepercussion peak P1, the tidal peak P2, and the dicrotic peak P3 (Cardoso,Rowan, and Galbraith 1983). The P1 peak is thought to reflect the systolicupstroke from the arterial pulse that is transmitted to the CSF space (Adolph,Fukusumi, and Fowler 1967). The P2 peak ends in the dicrotic notch and istypically rounder and more variable than the P1 peak. Its origin is not as clear,but is believed to be a reflection of the initial arterial pulse wave (Cardoso,Rowan, and Galbraith 1983). An increase in elevation of the P2 peak relativeto the P1 peak has been reported in the literature to be linked to reduced ICC(Cardoso, Rowan, and Galbraith 1983), but the mechanisms behind this arenot fully understood. The P3 peak begins at the dicrotic notch and ends atthe diastolic minimum, and has been attributed to venous pulsations (Adolph,Fukusumi, and Fowler 1967).
Figure 2.6: A typical ICP single wave with the three peaks.
25

2. Background
In addition to the ICP single waves that occur one per heartbeat, there is aslower cyclic variation driven by respiration (Wagshul, Eide, and Madsen 2011).This is illustrated in Figure 2.7, where the respiratory signal is shown in thegrey dotted lines together with the cardiac-induced variations shown in black.
0 5 10 15
Time [Sec]
0
5
10
15
20
ICP
[m
mH
g]
Figure 2.7: The black line shows the pulsatile ICP waveform for an iNPHpatient. The dotted gray line illustrates the respiratory signal where the peaksare inspiration and the minima expiration. This signal is found from interpolationbetween the peaks and onsets of the ICP waveform and has not been directlymeasured. The interpolated signal has a frequency of around 0.2 Hz.
Figure 2.8: Frequency spectrum of the invasively detected ICP signal shown inFigure 2.7. The respiratory signal 0.20 Hz (orange), heart rate 1.29 Hz (blue)and harmonics (red and green).
26

Improving the utility of ICP Monitoring
While it is possible to see the different components of the ICP signal in thetime domain, they are easier to distinguish in the frequency domain. This isillustrated in Figure 2.8, where the spectral content of Figure 2.7 is shown. Thepeak illustrated in orange originates from the respiratory variations and has afrequency of 0.20 Hz. This corresponds to 12 breaths per minute, which is in thenormal range for those aged over 65. The blue peak at 1.29 Hz illustrates theheart rate, which for this patient at this time segment is ≈ 77 beats per minute.The other peaks illustrate the harmonics of the spectrum, which are the resultsof the quicker oscillations in the ICP waveform and the sharper segments.
In the case of long periods of data and/or significantly high ICP, even slowersemi-periodic variations in ICP can be seen. These are low frequency fluctuationsin static mean ICP and should not be confused with pulsaltile ICP. Togetherwith the respiratory waves, these are known as ICP slow waves. Lundbergcategorized such pressure variations as A, B and C waves based on their durationand pressure level (Lundberg 1960). The A waves, or plateau waves, only occurif the ICP level becomes very high (above 50 mmHg) and are if present a clearindicator of a severe intracranial state. The B waves have more of an oscillatoryshape as they occur 0.5-2 cycles per minute and present with various ICP levelsup to 30-50 mmHg. The C waves have a frequency of 4-8 waves per minuteand ICP levels up to 30 mmHg. These waves are thoroughly described in theliterature but currently have limited clinical relevance, as clinical practice is tomanage ICP aggressively and keep the mean level below 20 mmHg. However, inthe case of acute brain crisis they can occur, as illustrated with the reading froma patient suffering from SAH in Figure 2.9 where Lundberg A waves can be seenin the ICP recordings. If such critical levels are reached, however, the patient’sstate is so severe that non-invasive ICP monitoring is no longer a relevant focus.
0 5 10 15 20 25 30
Time [Minutes]
20
40
60
80
100
120
ICP
[m
mH
g]
Figure 2.9: Lundberg A waves. These plateau waves can occur in the case ofvery high ICP and are a clear indicator of a medical emergency.
27

2. Background
In addition to the well known pathological waveforms such as the Lundbergwaves, there is significant amount of research that explores the idea of the pul-satile ICP giving quantifiable information about the intracranial compartment’spressure response capacity, and thereby the ICC. Exactly how this manifest inthe morphology is, however, not evident. While currently not proven clinicallyuseful, one approach to linking ICC to the ICP waveform was proposed byCardoso et al. who suggested a direct time domain analysis of each ICP singlewave. They demonstrated that a reduction in ICC corresponded to an elevationof the amplitude of P2 (Cardoso, Rowan, and Galbraith 1983) relative to thenormal state. This is the case in Figure 2.6, as the height of the P2 peak is higherthan the P1 peak. The same group also hypothesized that the ratio betweenthe P2 and P1 amplitudes could provide information about the ICC (Cardoso,Reddy, and Bose 1988). A detailed understanding is, however, still not available.In addition, distinguishing the different peaks relies on high-quality ICP tracingsand is especially hard when the ICP level rises and the peaks become rounderand occasionally disappear entirely. These attempts to link waveform analysisto ICC have, therefore, not been adopted into clinical practice.
One of the metrics most often mentioned in the literature is the AMP metric,which is the peak to peak amplitude of the fundamental mode proposed asan ICC metric by Czosnyka et al. in the 1980s (Czosnyka et al. 1988). Thisparameter is calculated in the frequency domain using a fast Fourier transform,and only the amplitude of the cardiac frequency is extracted. In this, there isan implicit assumption that the ICP signal differs little from a pure sinusoidor that the frequency content above this limit is unimportant. Studies haverevealed that a significant amount of information disappears in this process,which in reality is hard filtering of the original ICP signal (Holm and Eide 2008),especially in the case of irregular heart rates.
The biggest portion of literature regarding ICC and the AMP metric linksAMP to the mean ICP in the so-called RAP index (Czosnyka et al. 1988). Thisis the correlation coefficient (R) between the AMP (A) and mean ICP (P).Neither the AMP nor the RAP index have been adopted into current clinicalpractice but they remain research tools included in the commercially availablesoftware ICM+. In particular, the RAP index’s dependence on mean ICP makesit vulnerable to ICP baseline errors caused by sensor drift, erroneous referencepressure or electrostatic discharges in the monitoring system (Eide et al. 2014).An example of an extreme case is the unphysiological baseline jump in meanICP level illustrated in Figure 2.10. The rapid change indicates an electrostaticdischarge event. This illustrates why mean ICP alone is unsafe as the onlydecision making tool, and also why the RAP index is unreliable.
The link between increased ICP waveform amplitude and negative patientoutcomes, however, is well documented (Avezaat, Van Eijndhoven, and Wyper1979; Gonzĺez-Darder and Barcia-Salorio 1989) and a potentially more usefulguide to clinical management, the MWA metric, was proposed by Eide et al(Eide 2006b). This is the peak to peak amplitude of the invasively obtained ICPwaveform averaged over 6-second intervals. Artifacts are identified in the timedomain and not included in the final MWA value. Figure 2.10 also illustrates
28

Improving the utility of ICP Monitoring
that the MWA metric is the same before and after the jump.The computation of the MWA parameter is available in commercial software
and incorporated in the Sensometrics® software (dPCom AS, Oslo, Norway).Clinical intervention based on this metric has consistently produced betterresults than management of mean ICP alone (Eide and Sorteberg 2010a; Eideet al. 2007). It is also the only ICP morphology-based tool that is currently inclinical use for patient management.
The MWA parameter is therefore used as the primary source of ICP waveforminformation in this thesis and is the focus of papers I, II and a valuable sourceof information for paper III.
0 0.5 1 1.5 2 2.5 3 3.5 4
Time [Minutes]
-5
0
5
10
15
20
25
30
35
ICP
[m
mH
g]
Figure 2.10: A common problem in intensive care monitoring, where the rapidchange in mean ICP is of an unphysiological nautre, while the MWA metricremains constant.
2.4.2 Intracranial autoregulation
In addition to using the ICP waveform as a surrogate marker of ICC and asan added safety measure to mean ICP evaluation, there have been examples ofusing the ICP waveform to obtain information about the patient’s autoregulatorystate.
Under normal circumstances the cerebral vessels dilate and constrict depend-ing on CPP in order to assure sufficient oxygen supply to the brain. Outsidepatient specific limits for both low CPP and high CPP, the vessels ability toadapt are exhausted and a linear pressure-flow relationship occurs. In theselinear regions, the patient has lost its autoregulatory mechanisms due to, forexample, stroke, TBI or cerebral artery disease and there can be significantneurological damage (Aaslid et al. 1989). To monitor which state the patient’sautoregulation is in, is therefore important information for the physicians.
29

2. Background
As autoregulation is impossible to measure directly, it must be assessed basedon indirect observations and other measures such as hemodynamic variables.With impairment of autoregualtion in the injured brain, CBF will passivelyfollow systemic BP. One of several proposed autoregulation metrics is thereforethe Pressure Reactivity index (PRx), which is the moving correlation coefficientbetween mean ICP and mean ABP, where arterial blood pressure acts as a proxyfor MAP (Czosnyka et al. 1997). The index has been found to correlate stronglywith patient outcome after TBI and to correlate positively with other methods tomeasure autoregulation (i. e. Doppler ultrasonography) (Budohoski et al. 2012).
A similar metric which utilizes the intracranial arterial amplitude correlation(IAAC) instead of time-averaged mean values was proposed by Eide et. al.(Eideet al. 2007). In a study conducted on 94 patients with SAH, IAAC was foundto be a better predictor of outcome than PRx (Eide et al. 2012). Includingmonitoring of IAAC or PRx in a clinical setting is therefore likely to providephysicians with valuable information about the cerebrovascular state of thepatient. A variant of the IAAC metric is utilized in Paper III to gain valuableinformation about the mechanisms behind the altered pulsatile ICP seen iniNPH patients.
30

Modeling approaches
2.5 Modeling approaches
The majority of the proposed non-invasive ICP monitoring systems require someform of mathematical modeling of the cerebrovascular system for the variousmeasurements to be transformed into precise information that is valuable forclinicians. The first mathematical model of the cerebrovascular system was thethree-compartment Monro-Kellie doctrine, and since then, various models ofdifferent complexity have been proposed. Based on the structure of the models,these can be categorized into statistical-based and mechanical-based models.The first category attempts to identify top-level statistical relations of importantclinical variables. They rely on statistics, ideally large amounts of data, and toan increasing extent, machine learning. The second category is the mechanicalmodels, which usually start with the clinician’s physical understanding of thephysiological system and the data they extract, the parameters they use, andthe parameters they do not have but would like to have. Only the first categoryof models is utilized in this research, but as the second category is believed toshape the way forward, an overview of the benefits and disadvantages is providedbelow.
2.5.1 Statistical models
In the category of statistical models, we find the models derived by observingstatistical correlations of some clinical measurements of interest. These mod-els do not attempt to model the complicated system, but rather accept thatthe human physiology is not sufficiently understood to easily be rendered in amechanistic model. These models are called black box models as they provideempirical relationships between the input and output variables and are oftenused as a tool to investigate if relatively simple relationships exist. The goal isto expose an unknown, empirical physiological relationship if it is present andsimply reject them if this is not the case. The concept is illustrated in Figure 2.11with an example from Paper I, where central aortic BP waveforms and a blackbox approach is used to estimate ICP waveforms non-invasively.
ICP
waveform
?Central aortic BP
waveform
Figure 2.11: Illustrates the concept behind black box models or statistical models.The figure is adapted from (Evensen et al. 2018a) and is licensed under a CreativeCommons Attribution 4.0 International Public License. n
31

2. Background
All three papers presented in this thesis employ some form of statisticalmodel. Papers I and II utilizes a signal processing approach called spectralanalysis. This includes transforming the time series into the frequency domain,which is often fruitful when looking at biomedical signal processing due to theperiodicity of the relevant signals. Paper III uses statistical analysis in the timedomain.
In the case of spectral analysis, a linear, time-invariant (LTI) system isassumed. In linear the embedded assumption is that the output of the systemis linearly related to the input. In other words, changing the input in a linearway will change the output in the same way. If the input xi(t) produces theoutput yi(t) a scaling ai(t) of xi(t) will produce the output ai(t)yi(t) and thesummed input x1(t) + x2(t) will produce the output y1(t) + y2(t). In the phrasetime-invariant there is an assumption that the output does not depend on theparticular time the input is applied, so that if x(t) produces y(t), x(t − T )produces y(t − T ). There is also an implied assumption of the signals beingstationary (i. e. signals whose characteristics do not change over long timeintervals).
Making these kinds of assumptions is clearly only an approximation of thereal case and theoretically valid only for infinitely long signals. When analyzingshorter time segments, however, it is sufficient to assume short-time-in-varianceand stationary, which usually is fulfilled. This allows for general solutions thatare highly useful in biomedical signal processing, namely that the system’simpulse response can fully characterize any LTI system. In the time domain, theoutput of the system is simply the convolution of the input of the system withthe system’s impulse response. Mathematically, this is rendered as y = h ∗ x,where ∗ is the convolution symbol, and h denotes the impulse response.
In practical situations for live systems, only finite amounts of data areavailable, and x(t) and y(t) will not be continuous signals but rather discreterecordings x(n) and y(n), where n denotes the sample number. The transferfunction is thereby not analytically known and must be estimated from themeasured clinical time series. The goal is to design a model of the unknownsystem that produces a known output y(n) from a known input x(n). In otherwords, given two random signals x(n) and y(n), identifying what filter h(n) bestproduces y(n) from x(n). The filter that minimizes the mean power in the errorsignal e(n) = y(n)− y(n) is the best. The term random is used for the relevanttype of signals because physiological waveforms are typically complicated andirregular, not because the signals are unpredictable. Time-averaged values musttherefore be used to safely predict signal behavior. The problem was initiallysolved by the mathematician Norbert Wiener, who in the 1940’s, solved theproblem of minimizing the mean power in the error signal e(n) (Wiener 1950).
Transfer function estimation consists of estimating the frequency responseH(f) of the Wiener filter that best approximates a desired signal y(n) from theinput x(n). The frequency response of a Wiener filter is given by
H(f) = PxyPxx
. (2.3)
32

Modeling approaches
The power spectrum Pxx represents the contribution of each frequency componentof the signal to the total power in the signal. The cross spectrum Pxy at acertain frequency f0 can be interpreted as the mean product of the frequencycomponents of x(n) and y(n) at that the frequency f0.
In practice, we have a finite amount of data available, and the power spectramust, therefore, be estimated. The resulting transfer function estimate is then
Hxy(f) = Pxy(f)Pxx(f)
. (2.4)
One popular technique for power spectrum estimation is Welch’s averaged,modified periodogram method. This allows for the signal to be divided into Koverlapping sequences of length L that overlaps by L−D points. Each sequenceis weighted by a window w(n) and an estimate for the power spectral densityfor the input signal x(n) is provided (Hayes 1996) as
Pxx(f) = 1KLU
K−1∑i=0
∣∣∣∣∣L−1∑n=0
w(n)x(n+ iD)e−jn2πf
∣∣∣∣∣2
, (2.5)
where
U = 1L
L−1∑n=0|w(n)|2. (2.6)
The windowing allows for smoothing of the signal and reduces the variance of theestimates. The cross power spectral density estimate for the input and output isgiven equivalently as
Pxy(f) = 1KLU
K−1∑i=0
(L−1∑n=0
w(n)x(n+ iD)e−jn2πf
)∗
(L−1∑n=0
w(n)y(n+ iD)e−jn2πf
).
(2.7)
There are several examples of generalized, or patient-specific, transfer func-tions that provide good results in clinical medicine. One example, as describedin section 2.3.3, is the transfer from radial ABP to central aortic BP. In thecase of non-invasive ICP estimation, transfer functions have been used to predictICP from radial ABP measurements (Kasuga et al. 1987) and to gain insightinto the intracranial compartment (Zou et al. 2008). A combination of radialABP and TCD derived CBFV measurements has also been explored in similarfashion(Schmidt et al. 1998). The technique described above has been utilizedin papers I and II.
Like spectral estimation using correlation coefficients between physiologicaltime series also falls in the category of statistical modeling. The most relevantexample is the evaluation of ICC from the correlation between the mean ICPand the amplitude of the fundamental mode (RAP), as discussed in Section
33

2. Background
2.4.1, and the evaluation of autoregulation from mean ICP and mean radial ABP(PRx), and MWA and radial ABP amplitude (IAAC) as described in Section2.4.2. A variant of this approach is utilized in Paper III.
With the recent advances in data storage and data processing capacity, thesekinds of statistical analysis have gained renewed interest and possibly representnew opportunities. Machine learning is currently a widely used tool in thediscovery of patterns in large datasets and in the development of predictivemodels in various fields, including medicine. The progress in the clinical utilityof ICP based on this, however, has so far been limited. Hu et al. lookedat features of CBFV waveforms and radial ABP waveforms and linked theseto ICP using 24 metrics characterizing the morphology of the ICP pulse (Huet al. 2010). The performance was promising on the training set but declinedwhen tested on a general set. A study by Quachtran et al. aimed to predictimmediate hypertension by waveform analysis and, unlike Hu et al., avoidedpredefining features of the ICP morphology (Quachtran, Hamilton, and Scalzo2016). However, further analysis is required to compare these findings withtraditional ICP morphology analysis as well as on more extensive test sets.
2.5.2 Physiological models
The other model category is physiological models, where mathematical represen-tations are derived using the current understanding of the underlying physiologyof the cerebrovascular system. Good models provide a plausible representation ofthe reality the clinicians interact with daily and can have a significantly varyinglevel of detail. Generally, models in this category have the advantage of resonat-ing well with the clinicians and often start with the physiological understandingthey have achieved through years of training and hands-on patient care. Thecorrelation among different variables does not usually come as a surprise as theycan often be traced back to a physiological origin.
A model where the cranial cavity is subdivided into three compartments(CSF, blood and brain) has been the cornerstone of the understanding of theintracranial system for the past two hundred years (Kellie 1824; Monro 1783).Of the more advanced cerebrovascular models, Marmarou’s model of the CSFsystem (Marmarou, Shulman, and Rosende 1978) and Ursino-Lodi’s (Ursinoand Lodi 1997) more detailed representation are among the fundamentals. Thecriticism of these models, and others with added details, is that they are oftentoo complex to simulate. However, with the increasing computational power,this is no longer a relevant concern. A more substantiated claim, often voicedby clinicians, is that almost regardless of the model’s number of variables, thecomplexity is still far from the actual physiological reality.
As the understanding changes through continuous research, often aided byadvances in monitoring technology, these models evolve and, most commonly,expand. This is valuable for teaching and exploring properties, but makes clinicaluse challenging. As new variables are introduced, what originally was a relativelysimplistic model quickly becomes complicated in the process of trying to capturethe dynamic of an extremely complex system. At the base is a relatively simple
34
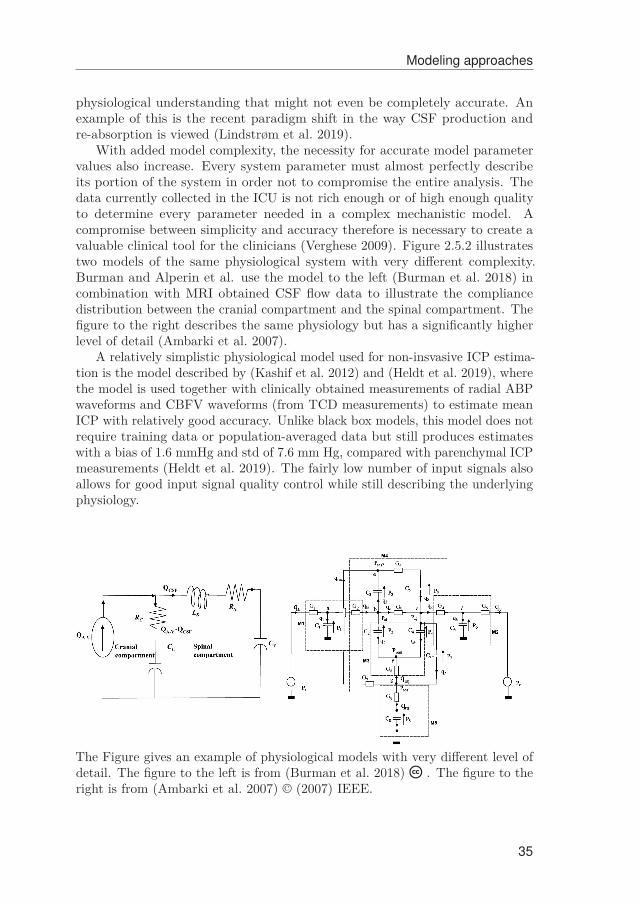
Modeling approaches
physiological understanding that might not even be completely accurate. Anexample of this is the recent paradigm shift in the way CSF production andre-absorption is viewed (Lindstrøm et al. 2019).
With added model complexity, the necessity for accurate model parametervalues also increase. Every system parameter must almost perfectly describeits portion of the system in order not to compromise the entire analysis. Thedata currently collected in the ICU is not rich enough or of high enough qualityto determine every parameter needed in a complex mechanistic model. Acompromise between simplicity and accuracy therefore is necessary to create avaluable clinical tool for the clinicians (Verghese 2009). Figure 2.5.2 illustratestwo models of the same physiological system with very different complexity.Burman and Alperin et al. use the model to the left (Burman et al. 2018) incombination with MRI obtained CSF flow data to illustrate the compliancedistribution between the cranial compartment and the spinal compartment. Thefigure to the right describes the same physiology but has a significantly higherlevel of detail (Ambarki et al. 2007).
A relatively simplistic physiological model used for non-insvasive ICP estima-tion is the model described by (Kashif et al. 2012) and (Heldt et al. 2019), wherethe model is used together with clinically obtained measurements of radial ABPwaveforms and CBFV waveforms (from TCD measurements) to estimate meanICP with relatively good accuracy. Unlike black box models, this model does notrequire training data or population-averaged data but still produces estimateswith a bias of 1.6 mmHg and std of 7.6 mm Hg, compared with parenchymal ICPmeasurements (Heldt et al. 2019). The fairly low number of input signals alsoallows for good input signal quality control while still describing the underlyingphysiology.
The Figure gives an example of physiological models with very different level ofdetail. The figure to the left is from (Burman et al. 2018) n . The figure to theright is from (Ambarki et al. 2007) © (2007) IEEE.
35

2. Background
A significant effort has been made in this PhD work towards developing amechanistic model that connects the pulsatile component of BP measurementsto pulsaltile ICP measurements. Such a model could potentially improve currentmechanistic models and potentially be adaptive, unlike the stationary modelpresented in paper I. It is, however, too early to conclude on whether that isfeasible, and further work remains. In this process, interdisciplinarity research isessential as the practitioners, in general, will have an intuitive understandingof which parameters can be useful for them, while engineers etc. can providevaluable inputs on feasibility and possible avenues for technology development.Combining different fields of research is therefore crucial in order to gain anincreased understanding of the intracranial space and the mechanisms affectingit. The presented thesis aims to be a contribution to that work.
36

Chapter 3
Summary of presented work
Paper I: Non-invasive Estimation of the Intracranial PressureWaveform from the Central Aortic Blood Pressure Waveformin Idiopathic Normal Pressure Hydrocephalus Patients
Evensen, K. B., O’Rourke M., Holm, S., Prieur, F. and Eide, P. K.,Scientific Reports 8.1:4741, March 2018
In patients with iNPH, thorough clinical studies have demonstrated that shuntevaluation based on analysis of the cardiac-induced portion of the ICP measure-ments and, more precisely, the MWA parameter, provided significantly betterpatient outcome than traditional patient management based on mean ICP (Eideand Sorteberg 2010a).
As the ICP waveform is the cerebrospinal space’s response to the cardiac beatcontractions that cause pulsatile blood flow into the central aorta it has beensuggested that the central aortic BP waveform could be a source for non-invasiveICP waveform estimation. A preliminary study showed that the central aorticBP waveform was almost identical to the ICP waveform during systole, and theaugmentation index was similar to that of pulsatile ICP. When comparing theICP waveform with the more commonly utilized peripheral radial artery BPwaveforms, these were significantly different (Kim et al. 2016).
In this study, we aimed to estimate the MWA parameter from the centralaortic BP waveform. To decide whether the morphological relationship betweencentral aortic BP pulsations and ICP pulsations can be used to detect the ICPwaveform non-invasively, patient-specific transfer functions were calculated usingspectral analysis of the first hour of data after midnight. The study includedthe multi-hour recordings of 29 patients with iNPH who were admitted tothe Department of Neurosurgery at Oslo University Hospital – Rikshospitalet.Central aortic BP waveforms were used as input signals, while invasive ICPmeasurements performed with a parenchymal probe were used as output signals.All patients had ICP levels in the normal range, with a maximum mean ICP of9.8 mmHg in the cohort.
The patient-specific transfer functions were then applied to the centralaortic BP waveform signals of the respective patient to create non-invasiveICP estimates. These were compared to the invasively obtained ICP signals,and a mean absolute error in MWA was found to be 1.9 1.0 mmHg. Further,the transfer function that gave the best spectral correlation between the ICPestimates and the invasive ICP was applied to the central aortic BP waveform ofthe entire cohort, creating completely non-invasive ICP estimates, except for theinvasive central line used for the radial ABP measurements. With this approach,
37
3. Summary of presented work
the mean error in MWA was found to be 1.6 ± 1.0 mmHg for the 29 individuals.A total of 137,512 six-second time windows, equivalent of 229 hours of data,were included in this analysis.
The study concluded that central aortic BP waveforms reproduced the MWAand general morphology of the ICP waveforms reasonably well, but that theerror in MWA is too large to have direct clinical utility. The correlation betweenerror in MWA prediction and height and weight was also investigated, but nosuch correlation was found.
Paper II: Utility of the Tympanic Membrane PressureWaveform for Non-invasive Estimation of The IntracranialPressure Waveform
Evensen, K. B., Paulat, K., Holm, S., Prieur, F. and Eide, P. K.,Scientific Reports 8.1:15776, October 2018
The second paper utilizes the same transfer function technique as described in theprevious section, but the challenge of non-invasive ICP waveform estimation isapproached in a different way. The rationale behind this paper is the connectionfrom the inner ear to subarachnoid space made out by the cochlear aqueduct.The physiology is more thoroughly described in section 2.1.1, but in short,the concept is that the pulsatile ICP waves propagate from the CSF in theintracranial cavity to the perilymph of the inner ear. Thereafter, they excitethe oval window and put the mechanical chain made up by the ossicles intomotion. This results in pressure variations in the tympanic membrane possibleto measure in the outer ear if the ear canal is completely sealed. A preliminarystudy using commercial equipment showed that the ICP waveform changes whenpatients are tilted (thereby changing ICP), which substantiated the hypothesisthat the ICP waveforms are indeed measurable in the outer ear.
In parallel to invasive parenchymal probe measurements of ICP, the rightouter ear of 28 patients was sealed entirely airtight and the pressure variations inthe outer ear were logged using a sensitive pressure sensor. Nine of the patientswere undergoing ICP monitoring due to SAH, while 19 had ICP measurementsdue to CSF circulation disorders. For each patient recording, the first 10 minuteswere used to find a transfer function estimate. The measured TMP waveformswere used as input signals and the invasively obtained ICP as output signals. Inreality, this results in a non-causal filter, as the ICP signal, physically, is the sourceof the TMP signal, unlike the case of the central aortic BP waveforms. Whenapplying the patient-specific estimated transfer function to the correspondingTMP signals, non-invasive ICP estimates were found. These were then comparedto the invasive ICP measurements.
The estimates predicted MWA satisfactorily in four of the 28 patients. Forthese four, the difference between original and estimated MWA was less than
38

1.0 mmHg in more than 50 % of the observations. In more than 20 % of theobservations, the difference was less than 0.5 mmHg.
In addition, an evaluation of the transfer function estimates was conducted foreach patient. When visually inspecting the phase information, it became evidentthat this was only linear up until a patient-specific frequency limit. Linearphase implies a dispersionless pathway where all frequencies display the sametime delay. As an additional study, the patient transfer function was limited infrequency to only the linear phase part. When comparing the resulting estimateswith the ICP signals filtered using a filter with the same cutoff, the errors inMWA were notably smaller. This has limited clinical value but indicates thatthe cochlear aqueduct is only dispersion-free for low frequencies; hence, it worksas a physical lowpass filter, distorting the propagating ICP signal for higherfrequencies. This filter effect was very patient-dependent, and no correlationbetween the age or BMI of the patient was found.
Paper III: Mechanisms behind altered pulsatile intracranialpressure in idiopathic normal pressure hydrocephalus: Roleof vascular pulsatility and systemic hemodynamic variables
Evensen, K.B and Eide, P. K.,Acta Neurochirurgica, June 2020
Despite the advances in treatment for iNPH patients, there is still a limitedunderstanding of the pathophysiology and the mechanisms that possibly play arole in reduced cerebral blood flow and impaired intracranial compliance (Eide2011). A new level of insight was gained with the recent discovery and descriptionof the glymphatic system. It is possible that the proficiency of this clearancesystem could play a significant role in the development of Alzheimer’s (Iliffet al. 2012) and other dementia types.
In this paper, we aimed to add to the understanding of the reasons forthe known elevated pulsatile ICP and delayed glymphatic circulation in iNPHpatients. As the arterial pulsations are the source of both the pulsatile ICP andthe driving force for glymphatic circulation, assessing the relationship betweenthe arterial and ICP pulsations could shed light on the impact of extravascularfactors on the altered ICP wave amplitudes in this cohort. As the intracranialarterial pulsations are impossible to study in vivo, central aortic BP waveformswere used as a proxy.
The association between the arterial pulsations and ICP pulsations wereaccessed by examining a version of the autoregulation parameter IAAC, describedin section 2.4.2, namely the IAACAortic parameter. The parameter is foundfrom the Pearson correlation between the central aortic BP waveforms andICP waveforms, where the subscript Aortic highlights that it is not the typicalperipheral radial ABP waveforms that are used. The 29 patients with iNPHfrom Paper I were included in the study and, in addition to the time series of
39

3. Summary of presented work
the pressure signals, other systemic hemodynamic variables were measured andcomputed.
We hypothesized that there would be a high degree of correlation IAACAortic ifthere is little extravascular effect on the ICP waveform and glymphatic circulationand a low degree of correlation if there is. If the latter is the case, the vascularcontribution to the abnormal pulsatile ICP in iNPH patients is dominant andwe would expect to see this effect in the other hemodynamic variables as well.
The results of the study revealed an average IAACAortic value of 0.28± 16 atgroup level, hence revealing a generally low degree of correlation, indicating thatthe MWA in most iNPH patients primarily is due to extravascular factors andnot hemodynamic events. This assumption was supported by the correlation notdepending on most systemic hemodynamic variables. An exception was foundfor a subgroup of the cohort with high systemic vascular resistance where somecorrelation was found.
40
Chapter 4
Discussion
Despite Class I evidence for its clinical beneftis still lacking, continuous invasivemonitoring of ICP is routinely performed in the intensive care unit as wellas in neurosurgical departments worldwide (Evensen and Eide 2020a). It is acrucial source of information for physicians during clinical emergencies, surgicalprocedures, and at the bedside before and after surgical intervention. Non-invasive investigation of the intracranial compartment has commonly representeda challenge to clinicians and scientists, and non-invasive estimation of ICP isno exception. Due to the risks associated with current measurement modalities,significant effort has been made to discover a reliable non-invasive alternative.The community has, however, yet to produce a continuous monitoring techniquewith the clinical accuracy necessary for routine use.
Recent research clearly highlights that, in terms of ICP, a mean level alonedoes not provide clinicians with enough information about the intracranial state.Their goal is to anticipate an impending intracranial crisis and perform the bestpossible patient care. To do so, they must be able to identify potentially unstableICP behavior at an early stage. The classical threshold for surgical interventionis a mean ICP level of 20 mmHg (Greenberg 2016). If the brain is in a stablestate, where the buffering mechanisms and elastic properties of the intracranialconstituents are still intact, a ICP level of 20 mmHg is not necessarily critical.However, if the brain is in an uncompensated state, any further incrementalvolume increase can be fatal. The situation is also far more critical if all thetherapeutic options have been exhausted, and if the patient’s state is worseningrapidly. Patient management based on mean ICP alone is therefore clearly notenough.
The goal of ICP waveform monitoring is to be able to separate the twooutlined scenarios. The goal of non-invasive ICP waveform monitoring is todo so without drilling a burr hole in the patient’s head. In this thesis, themain focus has been on one of the primary characteristics of the ICP waveform,namely the time-averaged peak to peak amplitude, MWA. Research implies thatthis is a surrogate marker for ICC and hence a tell-all about the intracranialstate (Eide and Sorteberg 2010a; Eide et al. 2007). If this parameter couldbe measured without risks over longer time periods, pathological changes andshifts in the intracranial condition can be exposed at an early stage and allowfor timely intervention. The clinical benefits of patient treatment based on theMWA parameter in ICP monitoring has primarily been established throughthorough clinical studies (Eide and Sorteberg 2010a). A complete mechanisticunderstanding of the processes that affect it, however, has not yet been provided.Improving the understanding of why MWA changes in iNPH patients, which isour primary subgroup of patients in this study, has therefore been a focus of
41
4. Discussion
research.Continuous non-invasive estimation of MWA has been approached from two
different angles in the papers reprinted in the following chapters. In Paper I, weutilize a causal statistical model, where the source of the ICP pulsations, namelythe cardiac pulsations in central aortic BP, are used as input signals. In PaperII, we use a non-causal approach, where the pressure oscillations caused by ICPpulsations, measurable in the outer ear, are used as input.
The approach in Paper I, where the central aortic BP waveforms are usedas input signals, was explored because a preliminary study revealed that theICP waveforms and the central aortic BP waveforms were very similar. Inaddition, the central aortic BP waveforms fulfill other criteria, making it anappealing source signal. These criteria include the possibility of continuousmonitoring over long time periods as they only require radial ABP measurementsfor estimation. Such measurements are minimally invasive, as they only dependon a central line, which is already the standard clinical protocol for most of therelevant patients. From a mechanistic standpoint, it also appears to be a naturalapproach as the cardiac beats are the source for both pulsations. In addition,the same respiratory component will be present in both signals. The results inour paper reveal that the mean absolute error in MWA prediction, both in thegeneralized case and in the patient-specific case, was higher than the clinicallynecessary accuracy (here set to be 1 mmHg, which is a somewhat strict demand).By visually inspecting the predicted waveforms, it becomes evident that theestimated waveforms resemble the invasive ones to a high degree nine hoursafter the initial transfer function estimation. If this approach is to be exploredfurther, it would be appealing to include more of the wavelet morphology whencomparing the estimates to the invasive waves. However, the clinical value ofother morphology measures has currently not been studied to the same degreeas MWA.
One limitation in our study that should be highlighted is that, due toaggressive ICP treatment, the mean ICP and MWA values for the includedpatients were quite low. There is reason to believe that the estimates willremain reasonably good as long as the patient’s state differs little from theinitial state used to find the transfer function estimate. If the ICC changessignificantly, a constant statistical model will probably perform significantlyworse than reported in our study. In a state of transition from stable to unstable,a more physiological or mechanical model predicting the ICP waveforms fromcentral aortic BP waveforms would most likely produce better results. However,an adaptive model would have to be calibrated from other measurements totrack these changes, which likely will reduce clinical usability. Such models can,however, be used to gain understanding about the small scale ICP pulsationsand possibly be valuable when combined with other models and richer data.
The results in Paper I indicate that the morphology changes in ICP seen iniNPH patients most likely are due to extravascular factors. The question thatremains is how large a role the intracranial arterial BP pulsations play in theobserved changes. However, it is not possible to measure intracranial arterialBP waveforms in vivo, so central aortic BP waveforms were therefore used as
42
a proxy when exploring this further. While this is not ideal, by expanding thedata used in Paper I to include other hemodynamic variables, we are closer tofinding an answer to this question. If there are clear cardiac events that affectpulsatile ICP, the correlation between the ICP waveform amplitude and centralaortic BP amplitude should be directly dependent on these events.
In our study presented in Paper III, we generally found a low degree ofIAACAortic correlation for all the hemodynamic variables except for in a subgroupwith increased systemic vascular resistance. Our findings in Papers I and IIIclearly illustrate that the changes in pulsatile ICP in iNPH patients are notdue to changes in the source signal (i. e. the BP waveforms) but rather aredue to changes in other intracranial factors. Therefore, it is more likely thatdelayed glymphatic circulation found in these patients implicitly affects theintracranial arterial BP pulsations than the intracranial arterial BP pulsationschange glymphatic circulation.
In Paper II, we approached non-invasive waveform ICP monitoring from adifferent angle than that applied in Paper I. The same methodology was used toestablish a statistical model, but the input signal was the pressure oscillationspossible to measure in the outer ear, which we named the tympanic membranepressure waveforms. Like the central aortic BP waveform signal, measurementsmade in the outer ear are, in theory, easily accessible and allow for continuousmonitoring. Unlike the central aortic BP waveforms, TMP waveforms can beobtained entirely non-invasively. With the ongoing research on improved earplugsand general listening devices due to consumer demands in other fields, a low keyeasily accessible measurement regime that, in addition to being accessible, couldbe comfortable seems attainable.
One prerequisite of this technique, however, is that the pathway from thecochlear aqueduct to the inner ear is patent and dispersionless. If this is notthe case, the ICP signal will be distorted or not propagate at all, and thenecessary waveform information will be difficult or impossible to extract. One ofour main findings was that, although a large proportion of the waveform wascorrectly predicted, the success rate was very patient-specific. The investigationof the linearity of the phase portion of the transfer function also revealed thatthe cochlear aqueduct was dispersive for higher frequencies for many of thepatients. The TMP waveforms, therefore, might be more useful for deriving theamplitude of the fundamental frequency, much like that used in the RAP index,than MWA. In our study, no image evidence, or other checks, were done for toevaluate cochlear aqueduct patency. This is the most significant limitation ofthe presented work. If this approach is to be accessed further, this is the firstand most crucial step to improve. There are suggestions for straightforwardtechniques that can evaluate cochlear aqueduct patency. The simplest and mostrelevant test is the TMD-test, which uses a comparison of the displacementof the tympanic membrane in the outer ear in sitting and supine positions. Ifthe volume displacement changes with a given minimum magnitude when thepositions changes, the cochlear aqueduct must be patent, as there are knownICP changes that occur with shifts in posture (Samuel, Burge, and Marchbanks1998).
43
4. Discussion
Another approach worth investigating would be to combine TMP waveformswith measurements of radial or central aortic waveforms and see if the correlationbetween these measurements is cochlear aqueduct-dependent. In the initialstudies it would then be necessary to have a second form of control of thepatency to evaluate if this generally could provide reliable assessments.
Due to the limited success of our approaches, it is unlikely that any of thesetechniques will lead to a sufficiently accurate clinical monitoring tool for ICC.Although several techniques show promise as triage tools or as tools that can beused for semi-continuous non-invasive mean ICP monitoring, the advances innon-invasive ICC monitoring remain elusive for the field as a whole.
Comprehensive clinical studies have, to a large degree, demonstrated thatICP pulsations can be used as a diagnostic tool in the assessment of ICC. Despitethis, MWA monitoring has currently not made it into clinical practice worldwide. Further, several serious challenges in invasive ICP signal quality remains(Evensen and Eide 2020a) which must be rectified in order to improve the utilityof ICP monitoring. This is and other thoughts about the future of ICP and ICCmonitoring further expanded on in Chapter 6.
44

Chapter 5
ConclusionThe three publications upon which this thesis is based answer three conciseresearch questions. One paragraph in the following section is devoted to eachquestion.
The first study concludes that central aortic BP waveforms can not be usedas a direct source signal for MWA estimation using a constant statistic model.Although the ICP morhphology in total was estimated fairly well, MWA couldnot be extracted with the necessary clinical confidence. MWA within the rangeof error less than 1 mmHg was only predicted for a third of patients. Theresults thereby clearly indicate that the assumption of a linear system linkingcentral aortic blood pressure to ICP is too simplistic and that a larger part ofthe complexity of the system must be included for more successful results. Asis, this approach is therefore not a reliable method for use in clinical patientmanagement.
The second study showed that the TMP waveforms measured in the outerear could not be used to correctly predict the ICP waveform parameter MWAnon-invasively with the necessary clinical accuracy. An estimate that could beacceptable in clinic was only observed in 4/28 individuals. This study highlightedthe importance of determining cochlear aqueduct patency when evaluating suchmeasurements. It also revealed that the cochlear aqueduct is dispersive forhigh frequencies and therefore only can be expected to reproduce the lowestfrequency components of the ICP morphology well. Fundamental frequency-basedparameters should, therefore, be in focus when undertaking further research onthis technique.
The third study reveals a weak correlation between central aortic BP waveformamplitudes and ICP waveform amplitudes in iNPH. Further, the degree ofcorrelation was not related to most systemic hemodynamic variables. Theonly exception was found for a subgroup of patients with high systemic vascularresistance. The study thereby reaches a clear conclusion, namely that the elevatedpulsatile ICP observed in iNPH patients are due to extra-vascular factors, suchas possibly delayed glymphatic circulation, and not elevated intracranial arterialpulsations.
45


Chapter 6
Future prospects
Despite the substantial amount of research on non-invasive ICP monitoring inrecent decades, there has been limited success in developing a technique that fullydiminishes the need for continuous invasive ICP measurements. The potentialbenefits are, however, still significant and the research therefore continues. For anon-invasive ICP measurement technique to replace the commonly used invasivemeasures described, it must fulfill a number of requirements. In addition toproviding a comparable level of accuracy, an adequate technique must allow forcontinuous measurements, both in the intensive care unit and at the bedside ofpatients with more chronic pathologies. The technique must be almost risk-free,easy to use, easy to understand and provide consistent and reliable results. Inaddition, there is an implicit demand for the device to be independent of operator,operative environment (temperature, depth of anesthesia, humidity), electricalartifacts and of the patient positioning. Furthermore, the technique shouldprovide information about ICC, not just mean ICP, and must be thoroughlyvalidated in multiple clinical settings for various pathologies for it to replace thecurrent measurement modalities safely.
There are several recent and thorough review papers on the current standingof non-invasive ICP monitoring and monitoring of ICC (Harary, Dolmans, andGormley 2018; Heldt et al. 2019; Zhang et al. 2017). They all conclude thatno technique currently fulfills the criteria listed above. The latter two papers,however, both agree that measurements of ICP in triage situations, whereconventional invasive techniques are unavailable, seems within reach, which isconsistent with other recent literature.
While the focus in this thesis is on long term continuous ICP monitoring ina clinical facility, there are other scenarios where non-invasive ICP monitoringcould be useful. This involves situations where patients suffer from an acute braininjury that typically occurs on the battlefield or in sports arenas. A screeningtool revealing significantly high ICP at the location where the injury occurs,often far away from specialized facilities, gives the emergency medical techniciansa reading of the degree of urgency. This enables efficient decision making, rapidplanning of transport and resources, which allows for the necessary surgicalintervention to be performed at an earlier stage. A result is better patient care,which is the overall goal of all ICP monitoring. An example of such a triage toolis the use of portable ultrasound tools to measure ONSD, as described in Section2.3.2.2, which seems promising, but is currently not sufficiently validated.
Emerging techniques that, to a larger extent, allow for continuous monitoringcover the model-based approach described in Section 2.5.2 and some recentpapers (Kashif et al. 2012) and (Heldt et al. 2019). However, continuousmonitoring, especially of CBFV waveforms, can be challenging and operator-
47
6. Future prospects
dependent. For this to be a clinically viable technique, there must be advances inthe TCD monitoring equipment currently used to measure CBFV. Furthermore,this measurement modality does not allow for assessment of any ICC metric andis currently not clinically validated to the necessary extent.
Although the overall goal is to replace invasive mean ICP and MWA measure-ments fully, any technique that can provide added information to the medicalprofessionals is a promising step. Measurements that guide and improve medicalprocedures at any level of clinical care would be valuable, and the emerging re-search could therefore possibly benefit from focusing on smaller, more attainablegoals. The most attainable ICP monitoring alternatives seem to be minimallyinvasive techniques rather than entirely non-invasive techniques. In particular,advances in biodegradable miniaturized microelectronic sensors seem promis-ing with this in mind (Kang et al. 2016; Shin et al. 2019a; Shin et al. 2019b).Lumbar measurements of ICP are currently unfit for continuous monitoring,but the technique does provide pulsatile ICP measurements almost identicalto parenchymal readings (Eide and Brean 2006), which can be utilized withimproved measurement devices.
However, it is my belief that the weaknesses in current invasive ICP measure-ment modalities, such as the baseline jump illustrated in Figure 2.10 should bethe primary focus of future ICP research and that a shift towards MWA basedpatient management could result in the Class I evidence still necessary to provethe clinical utility of ICP monitoring (Evensen and Eide 2020a).
48

BibliographyAaslid, R., Lindegaard, K.-F., Sorteberg, W., and Nornes, H. 1989. “Cerebral
autoregulation dynamics in humans.” Stroke 20 (1): 45–52.Aaslid, R., Markwalder, T.-M., and Nornes, H. 1982. “Noninvasive transcranial
Doppler ultrasound recording of flow velocity in basal cerebral arteries”.Journal of neurosurgery 57 (6): 769–774.
Adolph, R. J., Fukusumi, H., and Fowler, N. 1967. “Origin of cerebrospinalfluid pulsations”. American Journal of Physiology-Legacy Content 212 (4):840–846.
Alperin, N. J., Lee, S. H., Loth, F., Raksin, P. B., and Lichtor, T. 2000. “MR-Intracranial pressure (ICP): a method to measure intracranial elastance andpressure noninvasively by means of MR imaging: baboon and human study”.Radiology 217 (3): 877–885.
Ambarki, K., Baledent, O., Kongolo, G., Bouzerar, R., Fall, S., and Meyer, M.-E.2007. “A new lumped-parameter model of cerebrospinal hydrodynamics dur-ing the cardiac cycle in healthy volunteers”. IEEE transactions on biomedicalengineering 54 (3): 483–491.
Andersson, J., Rosell, M., Kockum, K., Söderström, L., and Laurell, K. 2017.“Challenges in diagnosing normal pressure hydrocephalus: Evaluation of thediagnostic guidelines”. eNeurologicalSci 7:27–31.
Andrén, K., Wikkelsø, C., Tisell, M., and Hellström, P. 2014. “Natural course ofidiopathic normal pressure hydrocephalus”. J Neurol Neurosurg Psychiatry85 (7): 806–810.
Avezaat, C. J. and Eijndhoven, J. H. van. 1986. “The role of the pulsatile pressurevariations in intracranial pressure monitoring”. Neurosurgical review 9 (1-2):113–120.
Avezaat, C., Van Eijndhoven, J., and Wyper, D. 1979. “Cerebrospinal fluidpulse pressure and intracranial volume-pressure relationships.” Journal ofNeurology, Neurosurgery & Psychiatry 42 (8): 687–700.
Avolio, A. P., Van Bortel, L. M., Boutouyrie, P., Cockcroft, J. R., McEniery, C. M.,Protogerou, A. D., Roman, M. J., Safar, M. E., Segers, P., and Smulyan, H.2009. “Role of pulse pressure amplification in arterial hypertension: experts’opinion and review of the data”. Hypertension 54 (2): 375–383.
Bathala, L., Mehndiratta, M. M., and Sharma, V. K. 2013. “Transcranial doppler:Technique and common findings (Part 1)”. Annals of Indian Academy ofNeurology 16 (2): 174.
49

Bibliography
Bhatia, A. and Gupta, A. K. 2007. “Neuromonitoring in the intensive care unit.I. Intracranial pressure and cerebral blood flow monitoring”. Intensive caremedicine 33 (7): 1263–1271.
Binz, D. D., Toussaint, L. G., and Friedman, J. A. 2009. “Hemorrhagic compli-cations of ventriculostomy placement: a meta-analysis”. Neurocritical care 10(2): 253.
Brean, A. and Eide, P. 2008. “Prevalence of probable idiopathic normal pressurehydrocephalus in a Norwegian population”. Acta neurologica Scandinavica118 (1): 48–53.
Bruce, B. B. 2014. “State-of-the-Art Review: Non-invasive assessment of cere-brospinal fluid pressure”. Journal of neuro-ophthalmology: the official journalof the North American Neuro-Ophthalmology Society 34 (3): 288.
Bruce, D. A. 1980. “Cerebrospinal fluid pressure dynamics and brain metabolism”.In Neurobiology of Cerebrospinal Fluid 1, 351–363. Springer.
Budohoski, K. P., Czosnyka, M., Riva, N. de, Smielewski, P., Pickard, J. D.,Menon, D. K., Kirkpatrick, P. J., and Lavinio, A. 2012. “The relationshipbetween cerebral blood flow autoregulation and cerebrovascular pressurereactivity after traumatic brain injury”. Neurosurgery 71 (3): 652–661.
Büki, B., Avan, P., Lemaire, J., Dordain, M., Chazal, J., and Ribari, O. 1996.“Otoacoustic emissions: a new tool for monitoring intracranial pressurechanges through stapes displacements”. Hearing research 94 (1-2): 125–139.
Burman, R., Alperin, N., Lee, S. H., and Ertl-Wagner, B. 2018. “Patient-specificcranio-spinal compliance distribution using lumped-parameter model: itsrelation with ICP over a wide age range”. Fluids and Barriers of the CNS15, no. 1 (): 29.
Burman, R., Shah, A. H., Benveniste, R., Jimsheleishvili, G., Lee, S. H., Loewen-stein, D., and Alperin, N. 2019. “Comparing invasive with MRI-derivedintracranial pressure measurements in healthy elderly and brain trauma cases:A pilot study”. Journal of Magnetic Resonance Imaging.
Cardim, D., Robba, C., Donnelly, J., Bohdanowicz, M., Schmidt, B., Damian, M.,Varsos, G. V., Liu, X., Cabeleira, M., Frigieri, G., et al. 2016. “Prospectivestudy on noninvasive assessment of intracranial pressure in traumatic brain-injured patients: comparison of four methods”. Journal of neurotrauma 33(8): 792–802.
Cardoso, E. R., Reddy, K., and Bose, D. 1988. “Effect of subarachnoid hemorrhageon intracranial pulse waves in cats”. Journal of neurosurgery 69 (5): 712–718.
Cardoso, E. R., Rowan, J. O., and Galbraith, S. 1983. “Analysis of the cere-brospinal fluid pulse wave in intracranial pressure”. Journal of neurosurgery59 (5): 817–821.
Chen, C.-H., Nevo, E., Fetics, B., Pak, P. H., Yin, F. C., Maughan, W. L.,and Kass, D. A. 1997. “Estimation of central aortic pressure waveform bymathematical transformation of radial tonometry pressure: validation ofgeneralized transfer function”. Circulation 95 (7): 1827–1836.
50

Bibliography
Chopp, M. and Portnoy, H. D. 1980. “Systems analysis of intracranial pressure:comparison with volume-pressure test and CSF-pulse amplitude analysis”.Journal of Neurosurgery 53 (4): 516–527.
Contours, A. E.-L.-L. 2003. “International standard iso 226: 2003”. InternationalOrganization for Standardization, Geneva, Switzerland.
Czosnyka, M., Wollk-Laniewski, P., Batorski, L., and Zaworski, W. 1988. “Analy-sis of intracranial pressure waveform during infusion test”. Acta neurochirur-gica 93 (3-4): 140–145.
Czosnyka, M., Smielewski, P., Kirkpatrick, P., Laing, R. J., Menon, D., andPickard, J. D. 1997. “Continuous assessment of the cerebral vasomotorreactivity in head injury”. Neurosurgery 41 (1): 11–19.
Davids, J., Birch, A., and Marchbanks, R. 2012. “082 Non-invasive measurementsof intracranial pressure: Can Coherent averaging show a tilt-dependent changein the measured Spontaneous Tympanic Membrane Displacement (STMD)signal in healthy volunteers?” J Neurol Neurosurg Psychiatry 83 (3): e1.
Ding, F.-H., Fan, W.-X., Zhang, R.-Y., Zhang, Q., Li, Y., and Wang, J.-G. 2011.“Validation of the noninvasive assessment of central blood pressure by theSphygmoCor and Omron devices against the invasive catheter measurement”.American journal of hypertension 24 (12): 1306–1311.
Eide, P. K. 2011. “Cardiac output in idiopathic normal pressure hydrocephalus:association with arterial blood pressure and intracranial pressure wave am-plitudes and outcome of shunt surgery”. Fluids and barriers of the CNS 8(1): 11.
— . 2006a. “Comparison of simultaneous continuous intracranial pressure (ICP)signals from a Codman and a Camino ICP sensor”. Medical engineering &physics 28 (6): 542–549.
— . 2008. “Comparison of simultaneous continuous intracranial pressure (ICP)signals from ICP sensors placed within the brain parenchyma and the epiduralspace”. Medical engineering & physics 30 (1): 34–40.
Eide, P. K. 2006b. “A new method for processing of continuous intracranialpressure signals”. Medical engineering & physics 28 (6): 579–587.
— . 2016. “The correlation between pulsatile intracranial pressure and indicesof intracranial pressure-volume reserve capacity: results from ventricularinfusion testing”. Journal of neurosurgery 125 (6): 1493–1503.
Eide, P. K., Bentsen, G., Sorteberg, A. G., Marthinsen, P. B., Stubhaug, A.,and Sorteberg, W. 2011. “A randomized and blinded single-center trialcomparing the effect of intracranial pressure and intracranial pressure waveamplitude-guided intensive care management on early clinical state and12-month outcome in patients with aneurysmal subarachnoid hemorrhage”.Neurosurgery 69 (5): 1105–1115.
51
Bibliography
Eide, P. K., Holm, S., and Sorteberg, W. 2012. “Simultaneous monitoring of staticand dynamic intracranial pressure parameters from two separate sensors inpatients with cerebral bleeds: comparison of findings”. Biomedical engineeringonline 11 (1): 66.
Eide, P. K., Sorteberg, A., Bentsen, G., Marthinsen, P. B., Stubhaug, A., and Sor-teberg, W. 2012. “Pressure-derived versus pressure wave amplitude–derivedindices of cerebrovascular pressure reactivity in relation to early clinical stateand 12-month outcome following aneurysmal subarachnoid hemorrhage”.Journal of neurosurgery 116 (5): 961–971.
Eide, P. K., Sorteberg, A., Meling, T. R., and Sorteberg, W. 2014. “The effect ofbaseline pressure errors on an intracranial pressure-derived index: results ofa prospective observational study”. Biomedical engineering online 13 (1): 99.
Eide, P. K. and Sorteberg, W. 2010a. “Diagnostic intracranial pressure monitoringand surgical management in idiopathic normal pressure hydrocephalus: a6-year review of 214 patients”. Neurosurgery 66 (1): 80–91.
— . 2016. “Outcome of surgery for idiopathic normal pressure hydrocephalus: roleof preoperative static and pulsatile intracranial pressure”. World neurosurgery86:186–193.
— . 2010b. “Simultaneous measurements of intracranial pressure parameters inthe epidural space and in brain parenchyma in patients with hydrocephalus”.Journal of neurosurgery 113 (6): 1317–1325.
Eide, P. 2003. “The relationship between intracranial pressure and size of cerebralventricles assessed by computed tomography”. Acta neurochirurgica 145 (3):171–179.
Eide, P. and Brean, A. 2006. “Lumbar cerebrospinal fluid pressure waves versusintracranial pressure waves in idiopathic normal pressure hydrocephalus”.British journal of neurosurgery 20 (6): 407–414.
Eide, P., Czosnyka, M., Sorteberg, W., Pickard, J., and Smielewski, P. 2007.“Association between intracranial, arterial pulse pressure amplitudes andcerebral autoregulation in head injury patients”. Neurological research 29 (6):578–582.
Evensen, K. B. and Eide, P. K. 2020a. “Measuring intracranial pressure byinvasive, less invasive or non-invasive means: limitations and avenues forimprovement”. Fluids and Barriers of the CNS 17 (1): 34.
— . 2020b. “Mechanisms behind altered pulsatile intracranial pressure in id-iopathic normal pressure hydrocephalus : Role of vascular pulsatility andsystemic hemodynamic variables”. Acta Neurochirurgica.
Evensen, K. B., O’Rourke, M., Prieur, F., Holm, S., and Eide, P. K. 2018a. “Non-invasive estimation of the intracranial pressure waveform from the centralarterial blood pressure waveform in idiopathic normal pressure hydrocephaluspatients”. Scientific reports 8 (1): 4714.
52

Bibliography
Evensen, K. B., Paulat, K., Prieur, F., Holm, S., and Eide, P. K. 2018b. “Utilityof the Tympanic Membrane Pressure Waveform for Non-invasive Estimationof The Intracranial Pressure Waveform”. Scientific reports 8 (1): 15776.
Gallagher, D., Adji, A., and O’Rourke, M. F. 2004. Validation of the transferfunction technique for generating central from peripheral upper limb pressurewaveform.
Geoffrey, C., Rajkumar, C., Kooner, J., Cooke, J., and Bulpitt, C. J. 2003.“Estimation of central aortic pressure by SphygmoCor requires intra-arterialperipheral pressures”. Clinical Science 105 (2): 219–225.
Gonzĺez-Darder, J. and Barcia-Salorio, J. 1989. “Pulse amplitude and volume-pressure relationships in experimental hydrocephalus”. Acta neurochirurgica97 (3-4): 166–170.
Gooriah, R. and Raman, A. 2016. “Idiopathic Normal Pressure Hydrocephalus:An Overview of Pathophysiology, Clinical Features, Diagnosis and Treatment”.In Update on Dementia. IntechOpen.
Greenberg, M. S. 2016. “Neuromonitoring”. In Handbook of Neurosurgery, 856–866. Thieme 8th ed.
Guilluame, J. and Janny, P. 1951. “Manometrie intracranienne continue: interetde la methode et premiers resultats”. Rev Neurol (Paris) 84:131–142.
Gwer, S., Sheward, V., Birch, A., Marchbanks, R., Idro, R., Newton, C. R.,Kirkham, F. J., Lin, J.-P., and Lim, M. 2013. “The tympanic membrane dis-placement analyser for monitoring intracranial pressure in children”. Child’sNervous System 29 (6): 927–933.
Harary, M., Dolmans, R., and Gormley, W. 2018. “Intracranial pressure moni-toring - review and avenues for development”. Sensors 18 (2): 465.
Hayes, M. H. 1996. Statistical digital signal processing and modeling. John Wiley& Sons.
Heldt, T., Zoerle, T., Teichmann, D., and Stocchetti, N. 2019. “Intracranial Pres-sure and Intracranial Elastance Monitoring in Neurocritical Care”. Annualreview of biomedical engineering 21:523–549.
Holm, S. and Eide, P. K. 2008. “The frequency domain versus time domain meth-ods for processing of intracranial pressure (ICP) signals”. Medical engineering& physics 30 (2): 164–170.
Homburg, A.-M., Jakobsen, M., and Enevoldsen, E. 1993. “Transcranial Dopplerrecordings in raised intracranial pressure”. Acta Neurologica Scandinavica 87(6): 488–493.
Hop, J. W., Rinkel, G. J., Algra, A., and Gijn, J. van. 1997. “Case-fatality ratesand functional outcome after subarachnoid hemorrhage: a systematic review”.Stroke 28 (3): 660–664.
53

Bibliography
Hu, X., Xu, P., Asgari, S., Vespa, P., and Bergsneider, M. 2010. “ForecastingICP elevation based on prescient changes of intracranial pressure waveformmorphology”. IEEE Transactions on Biomedical Engineering 57 (5): 1070–1078.
Iliff, J. J., Wang, M., Liao, Y., Plogg, B. A., Peng, W., Gundersen, G. A.,Benveniste, H., Vates, G. E., Deane, R., Goldman, S. A., et al. 2012. “Aparavascular pathway facilitates CSF flow through the brain parenchyma andthe clearance of interstitial solutes, including amyloid β”. Science translationalmedicine 4 (147): 147ra111–147ra111.
Jacobsen, H. H., Ringstad, G., Jørstad, Ø. K., Moe, M. C., Sandell, T., andEide, P. K. 2019. “The Human Visual Pathway Communicates Directly Withthe Subarachnoid Space”. Investigative ophthalmology & visual science 60(7): 2773–2780.
Jessen, N. A., Munk, A. S. F., Lundgaard, I., and Nedergaard, M. 2015. “Theglymphatic system: a beginner’s guide”. Neurochemical research 40 (12):2583–2599.
Kang, S.-K., Murphy, R. K., Hwang, S.-W., Lee, S. M., Harburg, D. V., Krueger,N. A., Shin, J., Gamble, P., Cheng, H., Yu, S., et al. 2016. “Bioresorbablesilicon electronic sensors for the brain”. Nature 530 (7588): 71–76.
Kapoor, K. G., Katz, S. E., Grzybowski, D. M., and Lubow, M. 2008. “Cere-brospinal fluid outflow: an evolving perspective”. Brain research bulletin 77(6): 327–334.
Karamanoglu, M., O’rourke, M., Avolio, A., and Kelly, R. 1993. “An analysis ofthe relationship between central aortic and peripheral upper limb pressurewaves in man”. European heart journal 14 (2): 160–167.
Kashif, F. M., Verghese, G. C., Novak, V., Czosnyka, M., and Heldt, T. 2012.“Model-based noninvasive estimation of intracranial pressure from cerebralblood flow velocity and arterial pressure”. Science translational medicine 4(129): 129ra44–129ra44.
Kasuga, Y., Nagai, H., Hasegawa, Y., and Nitta, M. 1987. “Transmission char-acteristics of pulse waves in the intracranial cavity of dogs”. Journal ofneurosurgery 66 (6): 907–914.
Kellie, G. 1824. “An Account of the Appearances Observed in the Dissection ofTwo of Three Individuals Presumed to Have Perished in the Storm of the 3d,and Whose Bodies Were Discovered in the Vicinity of Leith on the Morningof the 4th, November 1821; with Some Reflections on the Pathology of theBrain: Part I”. Transactions. Medico-Chirurgical Society of Edinburgh 1:84.
Kim, M. O., Eide, P. K., O’Rourke, M. F., Adji, A., and Avolio, A. P. 2016.“Intracranial pressure waveforms are more closely related to central aortic thanradial pressure waveforms: implications for pathophysiology and therapy”. InIntracranial Pressure and Brain Monitoring XV, 61–64. Springer.
54
Bibliography
Kim, S.-E., Hong, E. P., Kim, H. C., Lee, S. U., and Jeon, J. P. 2019. “Ultrasono-graphic optic nerve sheath diameter to detect increased intracranial pressurein adults: a meta-analysis”. Acta Radiologica 60 (2): 221–229.
Klingelhöfer, J., Sander, D., Holzgraefe, M., Bischoff, C., and Conrad, B. 1991.“Cerebral vasospasm evaluated by transcranial Doppler ultrasonography atdifferent intracranial pressures”. Journal of neurosurgery 75 (5): 752–758.
Lang, E. W., Paulat, K., Witte, C., Zolondz, J., and Mehdorn, H. M. 2003.“Noninvasive intracranial compliance monitoring: technical note and clinicalresults”. Journal of neurosurgery 98 (1): 214–218.
Langfitt, T. W., Weinstein, J. D., and Kassell, N. F. 1965. “Cerebral vasomotorparalysis produced by intracranial hypertension”. Neurology 15 (7): 622–622.
— . 1964. “Transmission of increased intracranial pressure: I. Within the cran-iospinal axis”. Journal of neurosurgery 21 (11): 989–997.
Le Roux, P., Menon, D. K., Citerio, G., Vespa, P., Bader, M. K., Brophy,G. M., Diringer, M. N., Stocchetti, N., Videtta, W., Armonda, R., et al.2014. “Consensus summary statement of the international multidisciplinaryconsensus conference on multimodality monitoring in neurocritical care”.Neurocritical care 21 (2): 1–26.
Leinonen, V., Koivisto, A. M., Savolainen, S., Rummukainen, J., Tamminen,J. N., Tillgren, T., Vainikka, S., Pyykkö, O. T., Mölsä, J., Fraunberg, M., et al.2010. “Amyloid and tau proteins in cortical brain biopsy and Alzheimer’sdisease”. Annals of neurology 68 (4): 446–453.
Levinsky, A., Papyan, S., Weinberg, G., Stadheim, T., and Eide, P. K. 2016.“Non-invasive estimation of static and pulsatile intracranial pressure fromtranscranial acoustic signals”. Medical engineering & physics 38 (5): 477–484.
Li, Y., Staessen, J. A., Li, L., Huang, Q., Lu, L., and Wang, J. 2008. “Refer-ence values for the arterial pulse wave in Chinese”. American journal ofhypertension 21 (6): 668–673.
Lindstrøm, E. K., Ringstad, G., Sorteberg, A., Sorteberg, W., Mardal, K.-A.,and Eide, P. K. 2019. “Magnitude and direction of aqueductal cerebrospinalfluid flow: large variations in patients with intracranial aneurysms with orwithout a previous subarachnoid hemorrhage”. Acta neurochirurgica 161 (2):247–256.
Löfgren, J., Essen, C. v., and Zwetnow, N. N. 1973. “The pressure-volume curveof the cerebrospinal fluid space in dogs”. Acta Neurologica Scandinavica 49(4): 557–574.
Ltd, A. M. P. 2012. 510(k) Summary - SphygmoCor XCEL.https://www.accessdata.fda.gov/cdrh_docs/pdf12/K122129.pdf.
Lundberg, N. 1960. “Continuous recording and control of ventricular fluid pres-sure in neurosurgical practice”. Acta psychiat. scand. 36 (149): 1–193.
55
Bibliography
Lyons, M. K. and Meyer, F. B. 1990. “Cerebrospinal fluid physiology and themanagement of increased intracranial pressure”. In Mayo Clinic Proceedings,65:684–707. 5. Elsevier.
Marchbanks, R., Reid, A., Martin, A., Brightwell, A., and Bateman, D. 1987.“The effect of raised intracranial pressure on intracochlear fluid pressure: threecase studies”. British journal of audiology 21 (2): 127–130.
Marmarou, A., Bergsneider, M., Klinge, P., Relkin, N., and Black, P. M. 2005.“The value of supplemental prognostic tests for the preoperative assessmentof idiopathic normal-pressure hydrocephalus”. Neurosurgery 57 (suppl_3):S2–17.
Marmarou, A., Shulman, K., and LaMorgese, J. 1975. “A compartmental anal-ysis of compliance and outflow resistance and the effects of elevated bloodpressure”. In Intracranial pressure II, 86–88. Springer.
Marmarou, A., Shulman, K., and Rosende, R. M. 1978. “A nonlinear analysis ofthe cerebrospinal fluid system and intracranial pressure dynamics”. Journalof neurosurgery 48 (3): 332–344.
Matsumae, M., Sato, O., Hirayama, A., Hayashi, N., Takizawa, K., Atsumi, H.,and Sorimachi, T. 2016. “Research into the physiology of cerebrospinal fluidreaches a new horizon: intimate exchange between cerebrospinal fluid andinterstitial fluid may contribute to maintenance of homeostasis in the centralnervous system”. Neurologia medico-chirurgica 56 (7): 416–441.
McEniery, C. M., Yasmin, McDonnell, B., Munnery, M., Wallace, S. M., Rowe,C. V., Cockcroft, J. R., and Wilkinson, I. B. 2008. “Central pressure: variabil-ity and impact of cardiovascular risk factors: the Anglo-Cardiff CollaborativeTrial II”. Hypertension 51 (6): 1476–1482.
Meidert, A. (, Huber, W., Müller, J., Schöfthaler, M., Hapfelmeier, A., Lang-wieser, N., Wagner, J., Eyer, F., Schmid, R., and Saugel, B. 2013. “Radialartery applanation tonometry for continuous non-invasive arterial pressuremonitoring in intensive care unit patients: comparison with invasively assessedradial arterial pressure”. British journal of anaesthesia 112 (3): 521–528.
Miller, J. and Garibi, J. 1972. “Intracranial volume/pressure relationships duringcontinuous monitoring of ventricular fluid pressure”. In Intracranial pressure,270–274. Springer.
Miller, J. and Pickard, J. 1974. “Intracranial volume/pressure studies in patientswith head injury”. Injury 5 (3): 265–269.
Miller, M. T., Pasquale, M., Kurek, S., White, J., Martin, P., Bannon, K., Wasser,T., and Li, M. 2004. “Initial head computed tomographic scan characteristicshave a linear relationship with initial intracranial pressure after trauma”.Journal of Trauma and Acute Care Surgery 56 (5): 967–973.
Monro, A. 1783. “Observations on the Structure and Functions of the NervousSystem”. 4 (2): 113–135.
56

Bibliography
Moore, A. J. and Newell, D. W. 2005. Neurosurgery: principles and practice.Springer Science & Business Media.
Mori, E., Ishikawa, M., Kato, T., Kazui, H., Miyake, H., Miyajima, M., Nakajima,M., Hashimoto, M., Kuriyama, N., Tokuda, T., et al. 2012. “Guidelinesfor management of idiopathic normal pressure hydrocephalus”. Neurologiamedico-chirurgica 52 (11): 775–809.
Narayan, O., Casan, J., Szarski, M., Dart, A. M., Meredith, I. T., and Cameron,J. D. 2014. “Estimation of central aortic blood pressure: a systematic meta-analysis of available techniques”. Journal of hypertension 32 (9): 1727–1740.
Nornes, H., Aaslid, R., and Lindegaard, K.-F. 1977. “Intracranial pulse pressuredynamics in patients with intracranial hypertension”. Acta neurochirurgica38 (3-4): 177–186.
Orešković, D., Radoš, M., and Klarica, M. 2017. “Role of choroid plexus incerebrospinal fluid hydrodynamics”. Neuroscience 354:69–87.
Padayachy, L., Brekken, R., Fieggen, G., and Selbekk, T. 2018. “NoninvasiveTransorbital Assessment of the Optic Nerve Sheath in Children: RelationshipBetween Optic Nerve Sheath Diameter, Deformability Index, and IntracranialPressure”. Operative Neurosurgery.
— . 2016. “Pulsatile dynamics of the optic nerve sheath and intracranial pressure:an exploratory in vivo investigation”. Neurosurgery 79 (1): 100–107.
Pappu, S., Lerma, J., and Khraishi, T. 2016. “Brain CT to assess intracranialpressure in patients with traumatic brain injury”. Journal of Neuroimaging26 (1): 37–40.
Pauca, A. L., O’rourke, M. F., and Kon, N. D. 2001. “Prospective evaluationof a method for estimating ascending aortic pressure from the radial arterypressure waveform”. Hypertension 38 (4): 932–937.
Paulat, K., Brucher, R., and Russell, D. 2002. “Noninvasive monitoring ofintracranial pressure and compliance”. The Annals of Thoracic Surgery 73(1): S371.
Petkus, V., Ragauskas, A., and Jurkonis, R. 2002. “Investigation of intracranialmedia ultrasonic monitoring model”. Ultrasonics 40 (1-8): 829–833.
Popovic, D., Khoo, M., and Lee, S. 2009. “Noninvasive monitoring of intracranialpressure”. Recent patents on biomedical engineering 2 (3): 165–179.
Quachtran, B., Hamilton, R., and Scalzo, F. 2016. “Detection of intracranialhypertension using deep learning”. In 2016 23rd International Conference onPattern Recognition (ICPR), 2491–2496. IEEE.
Raboel, P., Bartek, J., Andresen, M., Bellander, B., and Romner, B. 2012.“Intracranial pressure monitoring: invasive versus non-invasive methods—areview”. Critical care research and practice 2012.
57
Bibliography
Ragauskas, A. and Petkus, V. 2001. “Non-invasive technologies for intracranialpressurevolume measurement”. In 2001 Conference Proceedings of the 23rdAnnual International Conference of the IEEE Engineering in Medicine andBiology Society, 1:259–262. IEEE.
Ragauskas, A. and Daubaris, G. 1995. Method and apparatus for non-invasivelyderiving and indicating of dynamic characteristics of the human and animalintracranial media. US Patent 5,388,583.
Ragauskas, A., Daubaris, G., Ragaisis, V., and Petkus, V. 2003. “Implementationof non-invasive brain physiological monitoring concepts”. Medical engineering& physics 25 (8): 667–678.
Rebuck, J. A., Murry, K. R., Rhoney, D. H., Michael, D. B., and Coplin, W. M.2000. “Infection related to intracranial pressure monitors in adults: analysis ofrisk factors and antibiotic prophylaxis”. Journal of Neurology, Neurosurgery& Psychiatry 69 (3): 381–384.
Relkin, N., Marmarou, A., Klinge, P., Bergsneider, M., and Black, P. M. 2005.“Diagnosing idiopathic normal pressure hydrocephalus”. Neurosurgery 57(suppl3): S2–4.
Ringstad, G., Lindstrøm, E. K., Vatnehol, S. A. S., Mardal, K.-A., Emblem,K. E., and Eide, P. K. 2017. “Non-invasive assessment of pulsatile intracranialpressure with phase-contrast magnetic resonance imaging”. PLOS ONE 12,no. 11 (): 1–17.
Ringstad, G., Valnes, L. M., Dale, A. M., Pripp, A. H., Vatnehol, S.-A. S.,Emblem, K. E., Mardal, K.-A., and Eide, P. K. 2018. “Brain-wide glymphaticenhancement and clearance in humans assessed with MRI”. JCI insight 3(13).
Ringstad, G., Vatnehol, S. A. S., and Eide, P. K. 2017. “Glymphatic MRI inidiopathic normal pressure hydrocephalus”. Brain 140 (10): 2691–2705.
Robba, C., Bacigaluppi, S., Cardim, D., Donnelly, J., Bertuccio, A., and Czosnyka,M. 2016. “Non-invasive assessment of intracranial pressure”. Acta NeurologicaScandinavica 134 (1): 4–21.
Roman, M. J., Devereux, R. B., Kizer, J. R., Lee, E. T., Galloway, J. M., Ali, T.,Umans, J. G., and Howard, B. V. 2007. “Central pressure more stronglyrelates to vascular disease and outcome than does brachial pressure: theStrong Heart Study”. Hypertension 50 (1): 197–203.
Saladino, A., White, J. B., Wijdicks, E. F., and Lanzino, G. 2009. “Malplacementof ventricular catheters by neurosurgeons: a single institution experience”.Neurocritical care 10 (2): 248.
Samuel, M., Burge, D. M., and Marchbanks, R. J. 1998. “Tympanic membranedisplacement testing in regular assessment of intracranial pressure in eightchildren with shunted hydrocephalus”. Journal of neurosurgery 88 (6): 983–995.
58

Bibliography
Saugel, B., Scheeren, T. W. L., and Teboul, J.-L. 2019. “Arterial Blood Pressure”.In Hemodynamic Monitoring, ed. by Pinsky, M. R., Teboul, J.-L., and Vincent,J.-L., 233–245. Cham: Springer International Publishing.
Schmidt, B., Schwarze, J. J., Czosnyka, M., Sander, D., Wittich, I., and Klingel-höfer, J. 1998. “A method for a simulation of continuous intracranial pressurecurves”. Computers and biomedical research 31 (4): 231–243.
Sharman, J. E., Lim, R., Qasem, A. M., Coombes, J. S., Burgess, M. I., Franco,J., Garrahy, P., Wilkinson, I. B., and Marwick, T. H. 2006. “Validation of ageneralized transfer function to noninvasively derive central blood pressureduring exercise”. Hypertension 47 (6): 1203–1208.
Shimbles, S., Dodd, C., Banister, K., Mendelow, A., and Chambers, I. 2005.“Clinical comparison of tympanic membrane displacement with invasive in-tracranial pressure measurements”. Physiological measurement 26 (6): 1085.
Shin, J., Liu, Z., Bai, W., Liu, Y., Yan, Y., Xue, Y., Kandela, I., Pezhouh, M.,MacEwan, M. R., Huang, Y., et al. 2019a. “Bioresorbable optical sensorsystems for monitoring of intracranial pressure and temperature”. Scienceadvances 5 (7).
Shin, J., Yan, Y., Bai, W., Xue, Y., Gamble, P., Tian, L., Kandela, I., Haney,C. R., Spees, W., Lee, Y., et al. 2019b. “Bioresorbable pressure sensorsprotected with thermally grown silicon dioxide for the monitoring of chronicdiseases and healing processes”. Nature biomedical engineering 3 (1): 37–46.
Speck, V., Staykov, D., Huttner, H. B., Sauer, R., Schwab, S., and Bardutzky, J.2011. “Lumbar catheter for monitoring of intracranial pressure in patientswith post-hemorrhagic communicating hydrocephalus”. Neurocritical care 14(2): 208–215.
Ursino, M. and Lodi, C. A. 1997. “A simple mathematical model of the interactionbetween intracranial pressure and cerebral hemodynamics”. Journal of AppliedPhysiology 82 (4): 1256–1269.
Verghese, G. 2009. “Getting to the gray box: Some challenges for model reduc-tion”. In 2009 American Control Conference, 5–6. IEEE.
Voss, S. E., Horton, N. J., Tabucchi, T. H., Folowosele, F. O., and Shera, C. A.2006. “Posture-induced changes in distortion-product otoacoustic emissionsand the potential for noninvasive monitoring of changes in intracranial pres-sure”. Neurocritical Care 4 (3): 251–257.
Wagshul, M. E., Eide, P. K., and Madsen, J. R. 2011. “The pulsating brain: areview of experimental and clinical studies of intracranial pulsatility”. Fluidsand Barriers of the CNS 8 (1): 5.
Wagshul, M. E., Kelly, E. J., Yu, H. J., Garlick, B., Zimmerman, T., and Egnor,M. R. 2009. “Resonant and notch behavior in intracranial pressure dynamics”.Journal of Neurosurgery: Pediatrics 3 (5): 354–364.
59

Bibliography
Weiss, B., Spahn, D., Rahmig, H., Rohling, R., and Pasch, T. 1996. “Radial arterytonometry: moderately accurate but unpredictable technique of continuousnon-invasive arterial pressure measurement”. British journal of anaesthesia76 (3): 405–411.
Wiegand, C. and Richards, P. 2007. “Measurement of intracranial pressure inchildren: a critical review of current methods”. Developmental Medicine &Child Neurology 49 (12): 935–941.
Wiener, N. 1950. Extrapolation, interpolation, and smoothing of stationary timeseries: with engineering applications. Technology Press.
Williams, B., Lacy, P. S., Thom, S. M., Cruickshank, K., Stanton, A., Collier, D.,Hughes, A. D., Thurston, H., and O’Rourke, M. 2006. “Differential impact ofblood pressure-lowering drugs on central aortic pressure and clinical outcomes:principal results of the Conduit Artery Function Evaluation (CAFE) study.”Circulation 113 (9): 1213–1225.
Willie, C. K., Tzeng, Y.-C., Fisher, J. A., and Ainslie, P. N. 2014. “Integrativeregulation of human brain blood flow”. The Journal of physiology 592 (5):841–859.
Zhang, X., Medow, J. E., Iskandar, B. J., Wang, F., Shokoueinejad, M., Koueik,J., and Webster, J. G. 2017. “Invasive and noninvasive means of measuringintracranial pressure: a review”. Physiological measurement 38 (8): R143.
Zou, R., Park, E.-H., Kelly, E. M., Egnor, M., Wagshul, M. E., and Madsen, J. R.2008. “Intracranial pressure waves: characterization of a pulsation absorberwith notch filter properties using systems analysis”. Journal of Neurosurgery:Pediatrics 2 (1): 83–94.
60

Papers


Paper I
Non-invasive Estimation of theIntracranial Pressure Waveformfrom the Central Arterial BloodPressure Waveform in IdiopathicNormal Pressure HydrocephalusPatients
Karen Brastad Evensen, Michael O’Rourke, Fabrice Prieur,Sverre Holm, Per Kristian EidePublished in Scientific Reports, March 2018, volume 8, issue 1, pp. 4714.DOI: 10.1038/s41598-018-23142-7.
I
The work was supported by grant from Health south-East, Norway (grant 2016032).
63

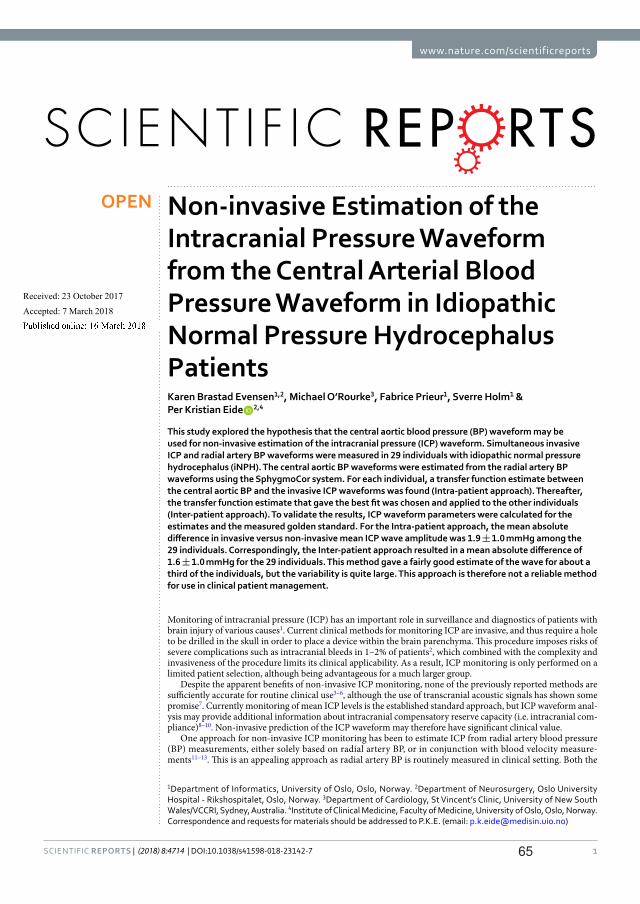
1SCIENtIFIC REPORts | (2018) 8:4714 | DOI:10.1038/s41598-018-23142-7
www.nature.com/scientificreports
Non-invasive Estimation of the Intracranial Pressure Waveform from the Central Arterial Blood Pressure Waveform in Idiopathic Normal Pressure Hydrocephalus PatientsKaren Brastad Evensen1,2, Michael O’Rourke3, Fabrice Prieur1, Sverre Holm1 & Per Kristian Eide 2,4
This study explored the hypothesis that the central aortic blood pressure (BP) waveform may be used for non-invasive estimation of the intracranial pressure (ICP) waveform. Simultaneous invasive ICP and radial artery BP waveforms were measured in 29 individuals with idiopathic normal pressure hydrocephalus (iNPH). The central aortic BP waveforms were estimated from the radial artery BP waveforms using the SphygmoCor system. For each individual, a transfer function estimate between the central aortic BP and the invasive ICP waveforms was found (Intra-patient approach). Thereafter, the transfer function estimate that gave the best fit was chosen and applied to the other individuals (Inter-patient approach). To validate the results, ICP waveform parameters were calculated for the estimates and the measured golden standard. For the Intra-patient approach, the mean absolute difference in invasive versus non-invasive mean ICP wave amplitude was 1.9 ± 1.0 mmHg among the 29 individuals. Correspondingly, the Inter-patient approach resulted in a mean absolute difference of 1.6 ± 1.0 mmHg for the 29 individuals. This method gave a fairly good estimate of the wave for about a third of the individuals, but the variability is quite large. This approach is therefore not a reliable method for use in clinical patient management.
Monitoring of intracranial pressure (ICP) has an important role in surveillance and diagnostics of patients with brain injury of various causes1. Current clinical methods for monitoring ICP are invasive, and thus require a hole to be drilled in the skull in order to place a device within the brain parenchyma. This procedure imposes risks of severe complications such as intracranial bleeds in 1–2% of patients2, which combined with the complexity and invasiveness of the procedure limits its clinical applicability. As a result, ICP monitoring is only performed on a limited patient selection, although being advantageous for a much larger group.
Despite the apparent benefits of non-invasive ICP monitoring, none of the previously reported methods are sufficiently accurate for routine clinical use3–6, although the use of transcranial acoustic signals has shown some promise7. Currently monitoring of mean ICP levels is the established standard approach, but ICP waveform anal-ysis may provide additional information about intracranial compensatory reserve capacity (i.e. intracranial com-pliance)8–10. Non-invasive prediction of the ICP waveform may therefore have significant clinical value.
One approach for non-invasive ICP monitoring has been to estimate ICP from radial artery blood pressure (BP) measurements, either solely based on radial artery BP, or in conjunction with blood velocity measure-ments11–13. This is an appealing approach as radial artery BP is routinely measured in clinical setting. Both the
1Department of Informatics, University of Oslo, Oslo, Norway. 2Department of Neurosurgery, Oslo University Hospital - Rikshospitalet, Oslo, Norway. 3Department of Cardiology, St Vincent’s Clinic, University of New South Wales/VCCRI, Sydney, Australia. 4Institute of Clinical Medicine, Faculty of Medicine, University of Oslo, Oslo, Norway. Correspondence and requests for materials should be addressed to P.K.E. (email: [email protected])
Received: 23 October 2017
Accepted: 7 March 2018
Published: xx xx xxxx
OPEN
65

www.nature.com/scientificreports/
2SCIENtIFIC REPORts | (2018) 8:4714 | DOI:10.1038/s41598-018-23142-7
radial artery BP waves and the ICP waves are created from BP waves induced by the cardiac beat contractions. Each cardiac beat contraction produces an ICP wave that passes through the intracranial compartment. It has therefore been proposed that the central aortic BP waveform is a better source for nICP estimation than the radial artery BP waveform. This was supported by a previously conducted preliminary study that reported that the cen-tral aortic BP waveform compared better with the ICP waveform than the radial artery BP retrieved from radial artery measurements14. The authors reported that the central aortic BP waveform was almost identical to the ICP waveform during the period of systole, and that the augmentation index was similar to that of ICP. The radial artery BP and ICP waveforms were notably more different.
The present study was undertaken to examine this hypothesis further and to study how the ICP waveform associates with the central aortic BP waveform. The central aortic BP waveforms were estimated from the radial artery BP waveform using the SphygmoCor system15. Two approaches were used, one Intra-patient approach and one Inter-patient approach. The first approach was to generate a transfer function estimate from the central aortic BP waveform to the invasive ICP waveform for each patient. This was done to investigate the potential of the method. The second approach was to utilize the transfer function estimate from the Intra-patient approach that gave the highest cross correlation between the non-invasive ICP estimate and the invasively measured ICP waveforms on the total cohort of individuals. The first approach provides important information about the pos-sibility of using the central aortic BP waveforms as a source for non-invasive ICP estimation, while the second approach has potential clinical value.
Materials and MethodsPatient material and ethical approval. To validate whether the central aortic BP waveforms can be used to estimate the ICP waveform non-invasively, a set of simultaneous ICP and radial artery BP waveforms from 29 patients with idiopathic normal pressure hydrocephalus (iNPH) was retrieved.
The ICP and radial artery BP waveforms had been obtained as part of a study approved by the Regional Ethics Committee, REK South-East (approval no. 07362) and by the hospital authority (approval no. 07/5870). The study protocol was in accordance with relevant guidelines and regulations and inclusion was by written and oral informed consent. The enrolled subjects were patients admitted to the Department of Neurosurgery, Oslo University Hospital - Rikshospitalet, from October 2008 to January 2009, for whom continuous invasive ICP monitoring was a part of their clinical work-up. The ICP levels measured were not used as an enrolment or exclusion criterion, and inclusion in the study did not influence the patient management. The continuous ICP and artery BP recordings were stored as anonymous raw data files to be analysed at a later stage.
Measurements of radial artery BP and ICP waveforms. Overnight invasive monitoring of radial artery BP and ICP was performed as described in16. The radial artery BP was continuously measured in the right radial artery using a Truwave PX-600F Pressure Monitoring Set (Edwards Life sciences LLC, Irvine, CA). The radial artery BP sensor was placed at the level of the heart.
Simultaneously with the BP measurements, ICP was continuously monitored using a solid ICP sensor (Codman MicroSensorTM, Johnson & Johnson, Raynham, MA, USA), which was introduced 1–2 cm into the frontal brain parenchyma through a small burr hole and a minimal opening in the dura, as described in17.
Both the radial artery BP and ICP waveforms were sampled at 200 Hz, ensuring a sufficient sampling rate18. The data was digitized using the Sensometrics® Pressure Logger (dPCom AS, Oslo, Norway) and analysed using Sensometrics® software (dPCom AS, Oslo, Norway).
Implantation of an ICP sensor may give some cerebrospinal fluid (CSF) leakage. The first two hours of moni-toring were therefore omitted for all individuals.
Estimation of the central aortic BP waveforms from the radial artery BP waveforms. The cen-tral aortic BP waveforms were estimated from the radial artery BP waveforms using the SphygmoCor system (SphygmoCor®; AtCor Medical, West Ryde, NSW, Australia). For each patient, a raw data file with the time series of the central aortic BP and ICP waveforms were obtained, both having identical time reference.
Transfer function estimation. In19 Gao et al. presents a patient specific transfer function based on a model consisting of tubes, travel time and reflection coefficients. In this paper the complex piping system from the cen-tral aorta to the brain is modelled as a black box using signal processing and spectral analysis.
The initial assumption is a linear, time-invariant system, where the output y is connected to the input x as y h x= ∗ , where * denotes a linear convolution and h the system’s impulse response. The Fourier Transform
H f Y fX f
( ) ( )( )
,(1)
=
produces a direct frequency domain description of the system properties through the transfer function H(f). This allows for simpler signal processing than their corresponding signals in the time domain. When the transfer function is unknown, a transfer function estimate H f( ) can be found from
ˆ =H fP fP f
( )( )( )
,(2)
xy
xx
for the case of a single-input/single-output system20. In this equation Pxx(f) is the power spectral density of the input signal and Pxy(f) the cross power spectral density function of x and y. The latter is given as
66

www.nature.com/scientificreports/
3SCIENtIFIC REPORts | (2018) 8:4714 | DOI:10.1038/s41598-018-23142-7
∑= π
=−∞
∞−P f R m e( ) ( ) ,
(3)xym
xyj fm2
where j denotes the imaginary number, ⋅E{ } the expected value operator and Rxy(m) the cross-correlation sequence
⁎= .+R m E x y( ) { } (4)xy n m n
The power spectral density Pxx(f) is found by using the auto-correlation variant of equation (3), where Rxy(m) is replaced by Rxx(m).
The most direct application of single-input/single-output relationships like this is to estimate the system fre-quency response function, or transfer function, based on measured input/output data. In this study, the prelimi-nary objective was to determine the transfer function from the central aortic BP signals to the ICP signals, and then use this for future non-invasive ICP estimation. The discrete time series of the central aortic BP signal x[n], was used as input with n=0, …, N–1, and N denoting the total number of time samples. The equivalently sampled invasive ICP measurements, here denoted y[n], were used as output. The basic concept is illustrated in Fig. 1. As the transfer functions established in our study are estimated from the estimates of central aortic BP and measured ICP, height and weight are implicitly compensated for. With regard to the present data, linearity was assumed since ICP is in low range (mean ICP 1.8 ± 3.6 mmHg). In another situation with very high ICP, non-linear associ-ations might be expected.
Transfer function estimation: Intra-patient approach. In order to establish patient specific transfer function estimates, an individual H f( ) was found for each patient using MATLAB’s predefined tfestimate func-tion. This function uses Welch’s averaged periodogram method to minimize variance (MATLAB and Statistics Toolbox Release 2016a, The MathWorks Inc., Natick, Massachusetts, USA). A total of one hour of data was used for the transfer function estimation. The one hour was divided into six second windows with 50% overlap in order to find a representative average.
The first hour of data after midnight was used in all cases, except for patient ID 7, where measurements had not been performed around midnight. In this case the data between 02.00 and 03.00 a.m. was used. The reason for selecting this point in time was that all patients were in bed, and therefore the pressure measurements were most standardized. The mean was removed from the input and output series in order to ensure that the transfer function analysis would not be influenced by fluctuations in mean ICP level and to avoid side lobe leakage21. After establishing the patient specific transfer function estimates, all data above 15 Hz were zeroed, as prior studies have shown that the significant harmonic content of the central aortic BP waveforms is contained within 0 and 15 Hz15.
The transfer function estimates established for each individual was then applied to the remaining part of the recording using equation (1), and thus giving an estimated non-invasive ICP signal for the specific patient.
Figure 1. Non-invasive estimation of ICP waveforms from central aortic BP waveforms. (a) In this study, central aortic BP waveforms were used as input for estimation of non-invasive ICP signals, when the system from the heart to the cranium was said to be unknown. (b) A system description in the frequency domain is found from the transfer function H f( ). (c) An estimate for the system is found based on the power spectral density of the central aortic BP waveforms (dotted line) and ICP waveforms (continuous line).
67

www.nature.com/scientificreports/
4SCIENtIFIC REPORts | (2018) 8:4714 | DOI:10.1038/s41598-018-23142-7
Figure 2. shows an example of the results where the non-invasively estimated ICP waveform is plotted together with the invasively measured ICP waveform. The figure shows six different time windows for one patient.
Transfer function estimation: Inter-patient approach. The transfer function estimate, which gave the best cross-correlation between the non-invasive and invasive ICP signal (H f( ) for patient ID 20), was then applied to the central aortic BP waveforms for all other patients using equation (1). This resulted in non-invasive ICP time domain estimates for the total cohort of patients. All available data from midnight until the end of the measure-ments were utilised. An example showing the resulting estimated non-invasive ICP waveform together with the invasively measured ICP waveforms is shown in Fig. 3. The figure shows six different time windows where the transfer function estimate found for patient ID 20 is applied to patient ID 8.
Comparison of measured and estimated ICP waveforms. In order to validate the output of the Intra-patient and the Inter-patient approaches, the non-invasive ICP estimates were compared to the invasive ICP measurements using a time-domain method previously described by Eide in17. According to this method, the cardiac-induced waves were identified by their beginning and ending diastolic minimum pressures and systolic maximum pressures. For each cardiac-beat–induced ICP wave, the pulse amplitude (dP; pressure difference from diastolic minimum pressure to systolic maximum pressure), rise time (dT; time difference from diastolic mini-mum pressure to systolic maximum pressure) and rise time coefficient (RTC, dP/dT) were determined. Further, the ICP waveform indices such as the mean wave amplitude (MWA), the mean wave rise time (MWRT) and the mean wave rise time coefficient (MWRTC) were computed for subsequent six-second (6-sec) time windows. The mean wave amplitude (MWA) is a type of time averaging of the pulse amplitude (dP). For detailed description of the MWA parameter, see17.
Only 6-sec time windows containing minimum four cardiac beat induced waves were considered to be of good quality and were used for the present analysis. The software also identified artefact waves due to noise in the pressure signal caused by patient movement, sensor movement or dysfunction. Such artefact waves were conse-quently omitted from the analysis. For each 6-sec time window of non-invasive and invasive ICP recordings, the differences between estimated and measured MWA, RT and RTC were determined.
In the diagnostic assessment of patients with idiopathic normal pressure hydrocephalus (iNPH), the inva-sively measured MWA (iMWA) is used to select patients for surgery. Based on previous studies, an upper normal threshold of iMWA has been determined22. To test the clinical utility of central aortic BP-derived non-invasive MWA (nMWA), the predictive values of non-invasive MWA versus invasive MWA were tested.
Figure 2. The non-invasive ICP waveform estimated from the Intra-patient approach superimposed on the invasive ICP waveform. For six different time windows of six second duration, the invasive ICP raw signal (continuous red line) is shown superimposed on the estimated non-invasive ICP signal (interrupted blue line) for patient 20. The estimate is established with the Intra-patient approach and shown for the time points (a) 00:00, (b) 1 hour after 00:00, (c) 2 hours after 00:00, (d) 4 hours after 00:00, (e) 7 hours after 00:00, and (f) 9 hours after 00:00. For visual comparison, the estimated ICP signal is time-shifted to match the invasive ICP signal for each time window.
68

www.nature.com/scientificreports/
5SCIENtIFIC REPORts | (2018) 8:4714 | DOI:10.1038/s41598-018-23142-7
Statistics. The statistical analyses were performed using the SPSS software version 22 (IBM Corporation, Armonk, NY). Statistical significance was accepted at the 0.05 level.
ResultsPatient material. A total of 29 patients were included in the study. Supplementary Table 1 presents demo-graphic data of the patients, as well as basic physiological data about mean BP from radial artery, mean ICP and mean cerebral perfusion pressure (CPP).
Validation of the Intra-patient and Inter-patient approaches. The differences in absolute pulsatile pressure parameters between measured ICP and estimated pulsatile ICP according to the Intra-patient approach are presented in Fig. 4. In addition, Supplementary Table 2 presents the ICP waveform parameters retrieved from the measured invasive ICP signal to the left, and the absolute differences in ICP waveform parameters estimated according to the Intra-patient approach to the right. For the total cohort of 29 individuals, the mean absolute difference in MWA was 1.9 ± 1.0 mmHg. The difference in MWA was <1.0 mmHg for 2 of 29 patients, and the absolute differences in MWRT and MWRTC were 0.05 ± 0.03 sec and 9.7 ± 5.0 mmHg/sec, respectively (Fig. 4; Suppl. Table 2). The measured and estimated ICP waveform parameters were compared in 137,512 6-sec time windows for the 29 individuals (Suppl. Table 2).
Figure 5 presents the differences in absolute pulsatile pressure parameters between measured ICP and esti-mated pulsatile ICP according to Inter-patient approach. Supplementary Table 3 provides the absolute differences in pulsatile ICP parameters estimated non-invasively using the Inter-patient (shown to the right). The averaged absolute difference in MWA was found to be 1.6 ± 1.0 mmHg for the total cohort of 29 individuals. Furthermore, the absolute difference in MWA was <1 mmHg in 8 out of 29 patient recordings. The averaged absolute differ-ences in MWRT and MWRTC were 0.05 ± 0.03 sec and 7.0 ± 6.1 mmHg/sec respectively (Fig. 5; Suppl. Table 3). These results indicate that the Inter-patient approach produces a better result than the Intra-patient approach.
For both the Intra- and Inter-patient approaches, Table 1 presents the percentage of 6-sec time windows wherein absolute differences in MWA were <0.5 mmHg or <1.0 mmHg. The Inter-patient approach seemed to perform best; on average an absolute difference in MWA <0.5 mmHg was observed in 22.2% of 6-sec time win-dows, while the average absolute difference in MWA <1.0 mmHg was seen in 42.1% of 6-sec time windows. For example, a difference in absolute MWA <0.5 mmHg in >30% of 6-sec time windows was observed in 9 of 29 individuals (PatIDs 1, 4, 5, 7, 9, 11, 18, 26 and 28).
Predictive ability of estimated pulsatile non-invasive ICP. The ability of the non-invasive ICP esti-mates to predict MWA, and thereby the clinically important thresholds of MWA (</≥ 4 mmHg), are presented
Figure 3. The non-invasive ICP waveform estimated from the Inter-patient approach superimposed on the invasive ICP waveform. For six different time windows of six second duration, the invasive ICP raw signal (continuous red line) superimposed on the estimated non-invasive ICP signal (interrupted blue line) are shown for one patient, established with the Inter-patient approach. The results are shown for the time points (a) 00:00, (b) 1 hour after 00:00, (c) 2 hours after 00:00, (d) 4 hours after 00:00, (e) 7 hours after 00:00, and (f) 9 hours after 00:00. For visual comparison the estimated non-invasive ICP signal is time-shifted to match the invasive ICP signal for each time window.
69
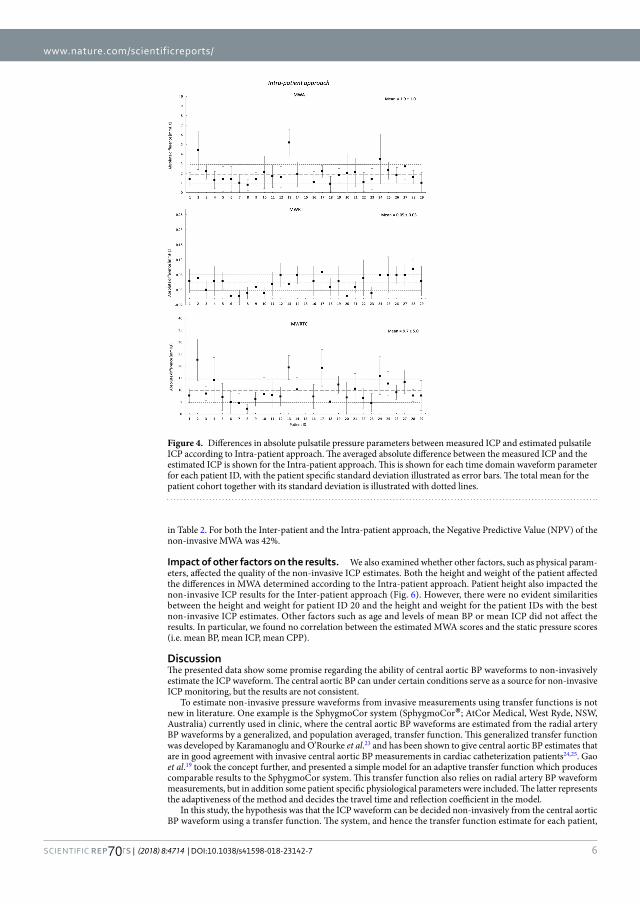
www.nature.com/scientificreports/
6SCIENtIFIC REPORts | (2018) 8:4714 | DOI:10.1038/s41598-018-23142-7
in Table 2. For both the Inter-patient and the Intra-patient approach, the Negative Predictive Value (NPV) of the non-invasive MWA was 42%.
Impact of other factors on the results. We also examined whether other factors, such as physical param-eters, affected the quality of the non-invasive ICP estimates. Both the height and weight of the patient affected the differences in MWA determined according to the Intra-patient approach. Patient height also impacted the non-invasive ICP results for the Inter-patient approach (Fig. 6). However, there were no evident similarities between the height and weight for patient ID 20 and the height and weight for the patient IDs with the best non-invasive ICP estimates. Other factors such as age and levels of mean BP or mean ICP did not affect the results. In particular, we found no correlation between the estimated MWA scores and the static pressure scores (i.e. mean BP, mean ICP, mean CPP).
DiscussionThe presented data show some promise regarding the ability of central aortic BP waveforms to non-invasively estimate the ICP waveform. The central aortic BP can under certain conditions serve as a source for non-invasive ICP monitoring, but the results are not consistent.
To estimate non-invasive pressure waveforms from invasive measurements using transfer functions is not new in literature. One example is the SphygmoCor system (SphygmoCor®; AtCor Medical, West Ryde, NSW, Australia) currently used in clinic, where the central aortic BP waveforms are estimated from the radial artery BP waveforms by a generalized, and population averaged, transfer function. This generalized transfer function was developed by Karamanoglu and O’Rourke et al.23 and has been shown to give central aortic BP estimates that are in good agreement with invasive central aortic BP measurements in cardiac catheterization patients24,25. Gao et al.19 took the concept further, and presented a simple model for an adaptive transfer function which produces comparable results to the SphygmoCor system. This transfer function also relies on radial artery BP waveform measurements, but in addition some patient specific physiological parameters were included. The latter represents the adaptiveness of the method and decides the travel time and reflection coefficient in the model.
In this study, the hypothesis was that the ICP waveform can be decided non-invasively from the central aortic BP waveform using a transfer function. The system, and hence the transfer function estimate for each patient,
Figure 4. Differences in absolute pulsatile pressure parameters between measured ICP and estimated pulsatile ICP according to Intra-patient approach. The averaged absolute difference between the measured ICP and the estimated ICP is shown for the Intra-patient approach. This is shown for each time domain waveform parameter for each patient ID, with the patient specific standard deviation illustrated as error bars. The total mean for the patient cohort together with its standard deviation is illustrated with dotted lines.
70

www.nature.com/scientificreports/
7SCIENtIFIC REPORts | (2018) 8:4714 | DOI:10.1038/s41598-018-23142-7
is expected to be constant. Non-invasive ICP estimation should thereby be possible on patients where invasive ICP measurements already has been done. This was denoted the Intra-patient approach in this paper, which alone will have very limited clinical potential, as it relies on patient specific training data requiring invasive ICP measurements.
When remembering Gao et al.’s19 approach to transfer function estimation, one would expect different patients to have similar transfer functions if similar biological parameters such as age, height, weight and mean ICP coincide. The first three are sizes available for the physician and could thereby be used as input when selecting a pre-determined transfer function from an already established database. This would give an almost completely non-invasive patient specific ICP estimate, where the invasiveness is limited to an intra-arterial line for radial artery BP measurements. If successful, this approach (the Inter-patient approach) would have significant clinical value.
The comparison of the non-invasive ICP estimates and the invasive ICP signals for the Intra-patient approach is shown in Fig. 4, which illustrates variability of the quality of the estimated ICP signals. Whereas the approach works for some patients, it gives a very non-informative result for others. When the differences in the most impor-tant clinical parameter MWA was explored, it was found to be <1 mmHg for 2 of 29 patients (Suppl. Table 2).
One of the assumptions made in the initial determination of the transfer function estimates was that the sys-tem had to be linear and constant for the estimates to be valid. It was expected that this would be a relatively good approximation for the case of the Intra-patient approach, but as evident in Table 1 and Supplementary Table 2, this does not match the presented results. The varying quality of the results indicates that the initial assumptions are not applicable for the entire cohort of 29 patients, but rather a subgroup. This is a clear limitation and further studies are needed to explore possible reasons. One confounding factor that might affect the results is variability in pressure cerebrovascular auto-regulation. Variability in cardiovascular co-morbidity might be another factor. It should also be mentioned, that although the SphygmoCor system has been shown to give good central aortic BP estimates, they are estimates, and thus an additional source of uncertainty.
The present patient cohort only included individuals with the condition iNPH, which is a neurodegenerative hydrocephalic disease in adults. One advantage with this cohort is that ICP monitoring was not combined with drainage of CSF. The ICP waveforms of this particular patient cohort do not present with particular characteris-tics as compared to other patient groups, e.g. children26 or individuals managed for stroke within the intensive
Figure 5. Differences in absolute pulsatile pressure parameters between measured ICP and estimated pulsatile ICP according to Inter-patient approach. The averaged absolute difference between the measured ICP and the estimated ICP is shown for the Inter-patient approach. This is shown for each time domain waveform parameter for each patient ID, with the patient specific standard deviation illustrated as error bars. The total mean for the patient cohort together with its standard deviation is illustrated with the dotted lines.
71

www.nature.com/scientificreports/
8SCIENtIFIC REPORts | (2018) 8:4714 | DOI:10.1038/s41598-018-23142-7
care unit27. Accordingly, there are no particular features with these ICP recordings making them more or less useful for validation of a non-invasive ICP estimation approach. This is, however, the only condition this method has been applied to, and the results presented in this study are not necessarily generalizable to other patient pop-ulations or normal human subjects.
Validation of the non-invasive ICP estimates found from the Inter-patient approach showed a mean absolute difference in MWA of 1.6 mmHg and a mean absolute difference in MWRTC of 8.3 mmHg/sec. These results are better than for the Intra-patient approach. The differences between the two approaches at the individual level are presented in Supplementary Tables 2 and 3. For some individuals, the invasive and non-invasive ICP waveform
PatID
Intra-patient approach Inter-patient approach
Difference in MWA <0.5 mmHg: Percentage of 6-s observations
Difference in MWA <1.0 mmHg: Percentage of 6-s observations
Difference in MWA <0.5 mmHg: Percentage of 6-s observations
Difference in MWA <1.0 mmHg: Percentage of 6-s observations
1 11 30 47 76
2 1 2 0 1
3 0 4 24 52
4 19 44 32 61
5 30 53 31 56
6 23 47 26 48
7 38 61 38 65
8 35 66 11 32
9 4 34 42 62
10 15 30 3 8
11 16 33 32 62
12 12 31 23 36
13 0 0 5 12
14 12 26 13 28
15 24 46
16 32 57 21 51
17 0 0 28 58
18 34 67 43 67
19 2 14 0 13
20 19 38 19 38
21 12 25 1 5
22 32 60 27 49
23 22 42 19 36
24 6 14 22 39
25 0 3 22 49
26 4 14 51 83
27 4 9 3 7
28 5 22 34 68
29 36 64 4 12
AVG ± STD 15.1 ± 13.0 31.8 ± 21.8 22.2 ± 14.7 42.1 ± 23.2
Table 1. Percentage of individual 6-s observations with difference in MWA either <0.5 mmHg or <1.0 mmHg for the two approaches.
Transfer function (Intra-patient approach) Number Test results
Measured/Estimate ≥4 mmHg 9 Sensitivity 45%
Measured /Estimate <4 mmHg 8 Specificity 100%
Measured ≥4/Estimate<4 11 PPV 100%
Measured <4/Estimate≥4 0 NPV 42%
Measured /Estimate ≥4 mmHg 14 Sensitivity 67%
Measured /Estimate<4 mmHg 5 Specificity 63%
Measured ≥4/Estimate<4 7 PPV 82%
Measured <4/Estimate ≥4 3 NPV 42%
Table 2. Predictive ability of Intra-patient and Inter-patient approaches for MWA threshold of 4 mmHg. PPV: Positive predictive value. NPV: Negative predictive value.
72
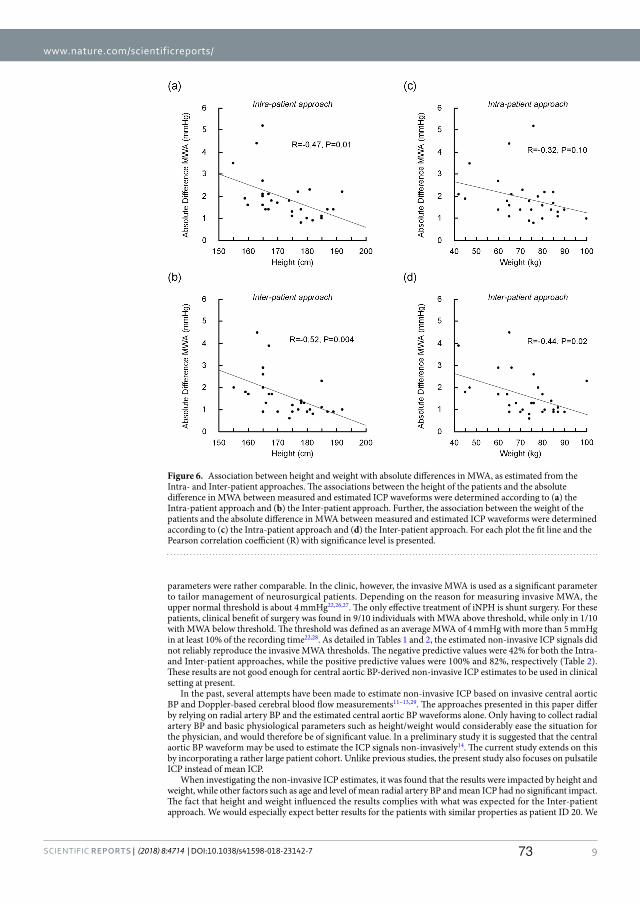
www.nature.com/scientificreports/
9SCIENtIFIC REPORts | (2018) 8:4714 | DOI:10.1038/s41598-018-23142-7
parameters were rather comparable. In the clinic, however, the invasive MWA is used as a significant parameter to tailor management of neurosurgical patients. Depending on the reason for measuring invasive MWA, the upper normal threshold is about 4 mmHg22,26,27. The only effective treatment of iNPH is shunt surgery. For these patients, clinical benefit of surgery was found in 9/10 individuals with MWA above threshold, while only in 1/10 with MWA below threshold. The threshold was defined as an average MWA of 4 mmHg with more than 5 mmHg in at least 10% of the recording time22,28. As detailed in Tables 1 and 2, the estimated non-invasive ICP signals did not reliably reproduce the invasive MWA thresholds. The negative predictive values were 42% for both the Intra- and Inter-patient approaches, while the positive predictive values were 100% and 82%, respectively (Table 2). These results are not good enough for central aortic BP-derived non-invasive ICP estimates to be used in clinical setting at present.
In the past, several attempts have been made to estimate non-invasive ICP based on invasive central aortic BP and Doppler-based cerebral blood flow measurements11–13,29. The approaches presented in this paper differ by relying on radial artery BP and the estimated central aortic BP waveforms alone. Only having to collect radial artery BP and basic physiological parameters such as height/weight would considerably ease the situation for the physician, and would therefore be of significant value. In a preliminary study it is suggested that the central aortic BP waveform may be used to estimate the ICP signals non-invasively14. The current study extends on this by incorporating a rather large patient cohort. Unlike previous studies, the present study also focuses on pulsatile ICP instead of mean ICP.
When investigating the non-invasive ICP estimates, it was found that the results were impacted by height and weight, while other factors such as age and level of mean radial artery BP and mean ICP had no significant impact. The fact that height and weight influenced the results complies with what was expected for the Inter-patient approach. We would especially expect better results for the patients with similar properties as patient ID 20. We
Figure 6. Association between height and weight with absolute differences in MWA, as estimated from the Intra- and Inter-patient approaches. The associations between the height of the patients and the absolute difference in MWA between measured and estimated ICP waveforms were determined according to (a) the Intra-patient approach and (b) the Inter-patient approach. Further, the association between the weight of the patients and the absolute difference in MWA between measured and estimated ICP waveforms were determined according to (c) the Intra-patient approach and (d) the Inter-patient approach. For each plot the fit line and the Pearson correlation coefficient (R) with significance level is presented.
73

www.nature.com/scientificreports/
1 0SCIENtIFIC REPORts | (2018) 8:4714 | DOI:10.1038/s41598-018-23142-7
would then have a similar system, and expect to have similar transfer functions, hence producing better results. This was however not the case, indicating that a simple tube length/reflection coefficient description will not be sufficient when estimating ICP non-invasively from radial artery BP. The variability of the Intra-patient approach points towards a much more complex mechanism than a simple linear system linking central aortic BP to ICP. The relevance of height and weight for the Intra-patient approach was surprising, and clearly indicates that the patient’s height and weight in general affected the successfulness of the approach.
The diagnosis of the patient, and co-morbidity such as cardiovascular disease, may influence the patient’s sys-tem, and thereby its transfer function estimate and resulting non-invasive ICP signal. When further investigations are made this should be taken into consideration.
ConclusionsIn the present study, it has been investigated whether central aortic BP signals estimated from radial artery BP signals can be used to non-invasively predict the pulsatile ICP waveform. Patient specific transfer function esti-mations from the central aortic BP signals to invasively measured ICP signals has been found for a total cohort of 29 patients. The patient specific transfer functions were further utilized to find individual ICP estimates for each patient. A time domain analysis of the estimated ICP compared to the invasive ICP signals found that the estimates correctly predicted the most important clinical parameter MWA in about 2 of 29 cases. This indicates that the method has some potential, but that there are large uncertainties.
For the method to have significant clinical value it should be possible to estimate ICP signals without first measuring invasive ICP signals. This was achieved by using the transfer function estimate that gave the best cross-correlation between the estimated ICP and measured ICP on the total cohort of 29 individuals. The result-ing ICP estimates correctly predicted the MWA parameter within the necessary range in 8 out of 29 cases. However, they did not reproduce the invasive MWA threshold. As the quality of the results are too varying, these results are inadequate for central aortic BP-derived non-invasive ICP estimates to be used in the clinical setting. However, the method shows some promise regarding utility of the central aortic BP waveform to predict the ICP waveform. The assumption of a linear system linking central aortic BP to ICP seems to be too simplistic and the model should be expanded to incorporate more of the complexity of the system. Further studies should therefore be performed to determine the future clinical possibilities of this approach.
References1. Czosnyka, M. Monitoring and interpretation of intracranial pressure. J. Neurol. Neurosurg. Psychiatry 75, 813–821 (2004).2. Binz, D. D., Toussaint, L. G. 3rd & Friedman, J. A. Hemorrhagic complications of ventriculostomy placement: a meta-analysis.
Neurocritical care 10, 253–256 (2009).3. Popovic, D., Lee, K. M. & Noninvasive, S. monitoring of intracranial pressure. Recent Patents Biomed Engineer 2, 165–179 (2009).4. Zhang, X. et al. Invasive and noninvasive means of measuring intracranial pressure: a review. Physiol. Meas. (2017).5. Robba, C. et al. Non-invasive assessment of intracranial pressure. Acta Neurol. Scand. 134, 4–21 (2016).6. Czarnik, T. et al. Noninvasive measurement of intracranial pressure: is it possible? J. Trauma 62, 207–211 (2007).7. Levinsky, A., Papyan, S., Weinberg, G., Stadheim, T. & Eide, P. K. Non-invasive estimation of static and pulsatile intracranial pressure
from transcranial acoustic signals. Med. Eng. Phys. 38, 477–484 (2016).8. Avezaat, C. J., van Eijndhoven, J. H. & Wyper, D. J. Cerebrospinal fluid pulse pressure and intracranial volume-pressure relationships.
J. Neurol. Neurosurg. Psychiatry 42, 687–700 (1979).9. Takizawa, H., Gabra-Sanders, T. & Miller, J. D. Changes in the cerebrospinal fluid pulse wave spectrum associated with raised
intracranial pressure. Neurosurgery 20, 355–361 (1987). 10. Eide, P. K. The correlation between pulsatile intracranial pressure and indices of intracranial pressure-volume reserve capacity:
results from ventricular infusion testing. J. Neurosurg. 125, 1493–1503 (2016). 11. Kashif, F. M., Verghese, G. C., Novak, V., Czosnyka, M. & Heldt, T. Model-based noninvasive estimation of intracranial pressure
from cerebral blood flow velocity and arterial pressure. Science translational medicine 4, 129ra144 (2012). 12. Schmidt, B. et al. A method for a simulation of continuous intracranial pressure curves. Comput. Biomed. Res. 31, 231–243 (1998). 13. Schmidt, B., Czosnyka, M. & Klingelhofer, J. Clinical applications of a non-invasive ICP monitoring method. Eur. J. Ultrasound 16,
37–45 (2002). 14. Kim, M. O., Eide, P. K., O’Rourke, M. F., Adji, A. & Avolio, A. P. Intracranial Pressure Waveforms are More Closely Related to Central
Aortic than Radial Pressure Waveforms: Implications for Pathophysiology and Therapy. Acta neurochirurgica. Supplement 122, 61–64 (2016).
15. Nichols, W.W., O’Rourke, M.F., Vlachopoulos, C. Pressure pulse waveform analysis. In McDonald’s blood flow in arteries. Theoretical, experimental and clinical priniciples. 595–741 (Hodder Arnold, London, UK, 2011).
16. Eide, P. K. Cardiac output in idiopathic normal pressure hydrocephalus: association with arterial blood pressure and intracranialpressure wave amplitudes and outcome of shunt surgery. Fluids and barriers of the CNS 8, 11 (2011).
17. Eide, P. K. A new method for processing of continuous intracranial pressure signals. Med. Eng. Phys. 28, 579–587 (2006). 18. Holm, S. & Eide, P. K. Impact of sampling rate for time domain analysis of continuous intracranial pressure (ICP) signals. Med. Eng.
Phys. 31, 601–606 (2009). 19. Gao, M. et al. A Simple Adaptive Transfer Function for Deriving the Central Blood Pressure Waveform from a Radial Blood Pressure
Waveform. Scientific reports 6, 33230 (2016). 20. Bendat, J. S. & Piersol, A. G. Engineering applications of correlation and spectral analysis. New York, Wiley-Interscience, 1980. 315 p.
(1980). 21. Eide, P. K., Holm, S. & Sorteberg, W. Simultaneous monitoring of static and dynamic intracranial pressure parameters from two
separate sensors in patients with cerebral bleeds: comparison of findings. Biomedical engineering online 11, 66 (2012). 22. Eide, P. K. & Sorteberg, W. Diagnostic intracranial pressure monitoring and surgical management in idiopathic normal pressure
hydrocephalus: a 6-year review of 214 patients. Neurosurgery 66, 80–91 (2010). 23. Karamanoglu, M., O’Rourke, M. F., Avolio, A. P. & Kelly, R. P. An analysis of the relationship between central aortic and peripheral
upper limb pressure waves in man. Eur. Heart J. 14, 160–167 (1993). 24. Chen, C. H. et al. Estimation of central aortic pressure waveform by mathematical transformation of radial tonometry pressure.
Validation of generalized transfer function. Circulation 95, 1827–1836 (1997). 25. Fetics, B., Nevo, E., Chen, C. H. & Kass, D. A. Parametric model derivation of transfer function for noninvasive estimation of aortic
pressure by radial tonometry. IEEE Trans. Biomed. Eng. 46, 698–706 (1999).
74

www.nature.com/scientificreports/
1 1SCIENtIFIC REPORts | (2018) 8:4714 | DOI:10.1038/s41598-018-23142-7
26. Eide, P. K., Egge, A., Due-Tonnessen, B. J. & Helseth, E. Is intracranial pressure waveform analysis useful in the management of pediatric neurosurgical patients? Ped Neurosurg 43, 472–481 (2007).
27. Eide, P. K. et al. A randomized and blinded single-center trial comparing the effect of intracranial pressure and intracranial pressure wave amplitude-guided intensive care management on early clinical state and 12-month outcome in patients with aneurysmal subarachnoid hemorrhage. Neurosurgery 69, 1105–1115 (2011).
28. Eide, P. K. & Sorteberg, W. Outcome of surgery for idiopathic normal pressure hydrocephalus: Role of preoperative static and pulsatile intracranial pressure. World neurosurgery 86, 186–193 e181 (2016).
29. Ragauskas, A. et al. Clinical assessment of noninvasive intracranial pressure absolute value measurement method. Neurology 78, 1684–1691 (2012).
AcknowledgementsThe authors thank AtCorMedical Pty Ltd (West Ryde, Australia) for estimating the central aortic blood pressure waveforms from the radial artery blood pressure waveforms using the SphygmoCor system. This work was supported by grants from Health South-East, Norway (grant 2016032).
Author ContributionsConception and design: K.B.E. and P.K.E. Acquisition of data: K.B.E. and P.K.E. Analysis and interpretation of data: K.B.E., M.O.R., F.P., S.H., P.K.E. Drafting the article: K.B.E. and P.K.E. Statistical analysis: K.B.E., P.K.E. Critically revising the article: K.B.E., M.O.R., F.P., S.H., P.K.E. Reviewed submitted version of manuscript: K.B.E., M.O.R., F.P., S.H., P.K.E. Approved the final version of the manuscript on behalf of all authors: P.K.E.
Additional InformationSupplementary information accompanies this paper at https://doi.org/10.1038/s41598-018-23142-7.Competing Interests: KBE, FP and SH declare no conflicts of interest. MOR is founding director of AtCor Medical, manufacturer of the SphygmoCor system. PKE has a financial interest in the software company (dPCom AS, Oslo) manufacturing the software (Sensometrics Software) used for analysis of the ICP recordings.Publisher's note: Springer Nature remains neutral with regard to jurisdictional claims in published maps and institutional affiliations.
Open Access This article is licensed under a Creative Commons Attribution 4.0 International License, which permits use, sharing, adaptation, distribution and reproduction in any medium or
format, as long as you give appropriate credit to the original author(s) and the source, provide a link to the Cre-ative Commons license, and indicate if changes were made. The images or other third party material in this article are included in the article’s Creative Commons license, unless indicated otherwise in a credit line to the material. If material is not included in the article’s Creative Commons license and your intended use is not per-mitted by statutory regulation or exceeds the permitted use, you will need to obtain permission directly from the copyright holder. To view a copy of this license, visit http://creativecommons.org/licenses/by/4.0/. © The Author(s) 2018
75

Paper II
Utility of the Tympanic MembranePressure Waveform forNon-invasive Estimation of TheIntracranial Pressure Waveform
Karen Brastad Evensen, Klaus Paulat, Fabrice Prieur, SverreHolm, Per Kristian EidePublished in Scientific Reports, October 2018, volume 8, issue 1, pp. 15776.DOI: 10.1038/s41598-018-34083-6.
II
The work was supported by grant from Health south-East, Norway (grant 2016032).
77


1SCIENtIFIC REPORTs | (2018) 8:15776 | DOI:10.1038/s41598-018-34083-6
www.nature.com/scientificreports
Utility of the Tympanic Membrane Pressure Waveform for Non-invasive Estimation of The Intracranial Pressure WaveformKaren Brastad Evensen1,3, Klaus Paulat2, Fabrice Prieur1, Sverre Holm 1 & Per Kristian Eide 3,4
Time domain analysis of the intracranial pressure (ICP) waveform provides important information about the intracranial pressure-volume reserve capacity. The aim here was to explore whether the tympanic membrane pressure (TMP) waveform can be used to non-invasively estimate the ICP waveform. Simultaneous invasive ICP and non-invasive TMP signals were measured in a total of 28 individuals who underwent invasive ICP measurements as a part of their clinical work up (surveillance after subarachnoid hemorrhage in 9 individuals and diagnostic for CSF circulation disorders in 19 individuals). For each individual, a transfer function estimate between the invasive ICP and non-invasive TMP signals was established in order to explore the potential of the method. To validate the results, ICP waveform parameters including the mean wave amplitude (MWA) were computed in the time domain for both the ICP estimates and the invasively measured ICP. The patient-specific non-invasive ICP signals predicted MWA rather satisfactorily in 4/28 individuals (14%). In these four patients the differences between original and estimated MWA were <1.0 mmHg in more than 50% of observations, and <0.5 mmHg in more than 20% of observations. The study further disclosed that the cochlear aqueduct worked as a physical lowpass filter.
Continuous monitoring of intracranial pressure (ICP) is routine in everyday neuro-intensive care, and is an inval-uable tool in the surveillance of critically ill patients1. Timely detection of raised ICP allows for early management which reduces the risk of permanent brain damage, and improves patients outcome after brain injury caused by e.g. trauma or stroke2,3.
Currently, measurements of ICP require a neurosurgeon to drill a hole in the patient’s skull and advance a catheter into the brain parenchyma, or through the brain tissue and into the ventricular space. This is an inva-sive procedure, associated with risk of severe complications such as infection and hemorrhage in about 1–2% of patients4. Despite a 40-year history of research on non-invasive ICP, none of the presented methods are currently accurate enough to be used in clinical practice5–8. Therefore, ICP monitoring is restricted to patients with severe brain disease, in whom the invasiveness of the procedure is outweighed by the importance of measuring ICP.
As ICP monitoring would benefit a significantly larger patient pool, there has been a considerable effort among neuroscientists to find alternative measures to evaluate the brain’s condition and anticipate brain deteri-oration9. One of the suggested measures is the intracranial pressure-volume reserve capacity, often referred to as the intracranial compliance (ICC), which is given as the relationship between the change in volume and change in pressure dV/dP10. If the intracranial system has high compliance, a small increase in volume, caused by forexample a cerebral hemorrhage, will result in a small pressure increase. If the system has low compliance, the same volume increase will result in a much higher intracranial pressure increase. Knowledge about the ICC of the system would therefore give the clinicians important information about the patient’s condition.
While ICP usually is assessed by the mean ICP, representing the absolute pressure difference between the outside and inside of the skull cavity, an increasing body of data suggests that the intracranial pressure-volume reserve capacity is better described by the ICP waveform than the mean ICP itself11–15. One key component of
1Department of Informatics, University of Oslo, Oslo, Norway. 2Institute of Medical Engineering and Mechatronics, Hochschule Ulm, Ulm, Germany. 3Department of Neurosurgery, Oslo University Hospital - Rikshospitalet, Oslo, Norway. 4Institute of Clinical Medicine, Faculty of Medicine, University of Oslo, Oslo, Norway. Correspondence and requests for materials should be addressed to P.K.E. (email: [email protected])
Received: 24 May 2018
Accepted: 11 October 2018
Published: xx xx xxxx
OPEN
79

www.nature.com/scientificreports/
2SCIENtIFIC REPORTs | (2018) 8:15776 | DOI:10.1038/s41598-018-34083-6
the ICP waveform is the time averaged peak-to-peak value, here denoted Mean Wave Amplitude (MWA), which can be considered as a surrogate marker of ICC13,16. Hence, clinical studies show that managing patients with intracranial bleeds (subarachnoid hemorrhage, SAH) according to MWA gave better outcome than management according to the traditional mean ICP17. Therefore, Non-invasive techniques for monitoring the ICP waveform, including waveform parameters such as MWA, could have significant clinical value.
One suggested technique for non-invasive monitoring of the intracranial pressure-volume reserve (compli-ance) is to utilize the pathway from the intracranial compartment to the inner ear named the cochlear aqueduct. This approach was first proposed by Marchbanks in the late 1970s, who reported that patients with raised and normal ICP showed differences in tympanic membrane displacement (TMD) in response to the stimulation of the stapedial reflex18. The technique was later commercialized, and this equipment has been used to measure absolute, or mean ICP, in several different studies19–21. The study by Gwer et al.20 found TMD measurements to give indications of raised mean ICP, but in the study by Shimbles et al.19 the technique was applied successfully to only 40% of the patient population. In general, the inter-subject variability was found to be too large for clin-ical use. In a study by Davids et al. it was suggested that the pulse shaped waves possible to measure using the Marchbanks system were generated by ICP waves transmitted through the ossicular chain22. The authors were able to change the ICP level by varying the subject’s head position, giving raise to different outer ear pressure waveforms in the supine and sitting positions, suggesting that difference in pressure waveforms could give infor-mation about the intracranial compliance.
The aim of the present study was to investigate whether the pathway between the inner ear and the intracranial compartment can be used to non-invasively predict the peak to peak amplitude of the ICP waveform, here used as an indication of intracranial compliance. The hypothesis is that the infrasonic ICP waves propagate through the cochlear aqueduct, the inner ear and middle ear, and are possible to measure in the outer ear due to the move-ment they cause in the tympanic membrane. If so, this would provide additional clinical information currently not assessable with traditional TMD measurements and without the uncomfortable stimulation of the stapedial reflex.
MethodsEthical permissions. The study was approved by The Regional Committee for Medical and Health Research Ethics (REK) of Health Region South-East, Norway (approval no. 2005/4307), and was performed in accordance with relevant guidelines and regulations. Patients were included after oral and written informed consent.
Patients. In order to evaluate the hypothesis, the study enrolled individuals undergoing continuous ICP mon-itoring as part of surveillance or diagnostic assessment of at the Department of Neurosurgery, Oslo University Hospital-Rikshospitalet.
Rationale behind TMP measurements. Figure 1 provides an overview of the anatomical structures involved in the TMP measurements. The perilymph of the inner ear primarily communicates with the cerebrospinal fluid (CSF) space of the posterior cranial fossa via a bony canal called the cochlear aqueduct. Studies done in monkeys/guinea pigs23 and cats24–26 show that a patent cochlear aqueduct allows for pressure transfer between the perilym-phatic fluid and the cerebrospinal fluid. The ICP waveforms have the majority of their energy below the 20 Hz hear-ing threshold and will propagate via the non-compressible fluid in the cochlear aqueduct to the perilymphatic space of the inner ear. Here the infrasonic waves cause motion of the oval window, the ossicles, and thereafter the tympanic membrane, as illustrated in Fig. 1. If the outer ear is sealed completely, so that the ear canal is perfectly airtight, the oscillations of the tympanic membrane should be possible to detect in the outer ear using a very high-resolution transducer. The goal is hence to do non-invasive pressure waveform measurements in the outer ear, and use these to estimate the cochlear fluid pressure waveform, which potentially can be a measure of ICP27,28.
Figure 1. Schematic illustration of the anatomical structures involved in measurements of TMP waveforms. In this study, non-invasive TMP waveforms were measured in the outer ear and used as input for the estimation of non-invasive ICP. The labels represents the following; ICP: ICP input signal, CA: Cochlear Aqueduct, OW: Oval Window, RW: Round Window, T: Tympanic membrane and S: Sensor.
80

www.nature.com/scientificreports/
3SCIENtIFIC REPORTs | (2018) 8:15776 | DOI:10.1038/s41598-018-34083-6
Non-invasive TMP waveform measurements. The non-invasive TMP signals were measured from the outer ear channel using a specially designed pressure transducer developed by Paulat and coworkers29. The sensor is a highly sensitive pressure sensor designed to log the movement of the tympanic membrane, i.e. the change in pressure difference relative to the ambient air pressure. In order to only measure the motions of the tympanic membrane caused by the pulsatile ICP wave, and not external pressure fluctuations, the ear canal was completely sealed. This was done by placing a tube in the outer ear canal which was closed air-tight using a glove around the tube within the outer ear canal. This is the same equipment applied by the Otorhinolaryngology Department when fitting hearing aids. The tympanic membrane pressure waveform was thereafter measured continuously for 0.5 to 5 hours with measurement time varying from patient to patient. A sampling frequency of 200 Hz was used to secure no loss of time- and frequency domain information30. For more details about the measurement proce-dure and setup, see the relevant technical note14. All TMP measurements were done in the right ear, unless there were obvious wounds or other obstructions of the ear canal in this ear. If so, the left ear was used. Both ears were never included. For an illustration of the measurement set up and underlying concept, see Fig. 1. For an example of TMP waveform measurements see Fig. 2a).
Invasive ICP waveform measurements. Simultaneously with the TMP measurements, continuous meas-urements of invasive ICP were done with the same time reference and sampling frequency. A small burr hole was made in the skull and a Codman MicroSensorTM (Johnson & Johnson, Raynham, MA, USA) was placed 1–2 cm into the frontal brain parenchyma. Continuous pressure time series were stored as anonymous raw data files for future analysis. For more detailed description of the monitoring procedure for invasive ICP see31. The entire measurement time was used in the analysis, with all the fluctuations in ICP level which that entails. The ICP measurements done for diagnostic purpose were done in awake unventilated patients, while individuals under-going ICP monitoring as part of surveillance were on artificial ventilation (Table 1).
Transfer function estimation. When studying the path of the pressure wave propagating from the suba-rachnoid space to the outer ear, Gopen et al.32 found that the cochlear aqueduct is the factor that primarily affects the frequencies below 20 Hz. If the cochlear aqueduct is the main component that affects infrasonic frequencies, there should be a relatively simple relationship connecting the inner ear and the subarachnoid space which should be possible to estimate using signal processing.
A linear, time-invariant system is assumed, where the output y is connected to the input x as = ∗y h x. In this relation, h is the system’s impulse response, and ∗ the symbol for convolution. The Fourier transform of the impulse response gives the transfer function H(f), which is a description of the system in the frequency domain
=H f Y fX f
( ) ( )( )
,(1)
where H(f) is the Fourier transform of the input signal, and Y(f) the Fourier transform of the output signal. An estimate of the transfer function H f( ) can be found from the relation.
= .ˆ ˆˆH fP f
P f( )
( )
( ) (2)xy
xx
In Equation (2) P f( )xy is the cross power spectral density of the input and output signal x and y, and P f( )xx is thepower spectral density of the input signal.
In this study, the aim is to establish transfer function estimates for each patient, and thereafter use them to estimate the ICP waveform non-invasively. This is similar as to what is done by Evensen et al. in33, where estimates of the central aortic wave form have been used as a source signal. In this study however, the time series of the measured ICP signals, here denoted as = … −x n n N( ), 0 , 1 acts as the source for the corresponding measured
Figure 2. An example showing 6 seconds of the input signals and the corresponding transfer function estimate based on a total 10 minutes is shown in Figure (a,b) respectively (patient ID 3). The resulting output from the combination of Fig. 1a and the inverse of Fig. 1b is shown in Fig. 1c.
81

www.nature.com/scientificreports/
4SCIENtIFIC REPORTs | (2018) 8:15776 | DOI:10.1038/s41598-018-34083-6
TMP signals, which are the output y(n). Because we have a finite number of samples N, the power spectral densi-ties are not known and must be estimated. One possible technique, and the one applied here, is Welch’s averaged, modified periodogram method of spectral estimation. This allows for the signal to be divided into K overlapping sequences of length L that overlaps by L − D points. Each sequence is weighted by a window w(n) and an estimate for the power spectral density for the input signal x(n) is given in34 as
∑ ∑= + π
=
−
=
−P f
KLUw n x n iD e( ) 1 ( ) ( ) ,
(3)xx
i
K
n
Ljn f
0
1
0
12
2
where
∑= .=
−U
Lw n1 ( )
(4)n
L
0
12
The cross power spectral density estimate for the input and output is then given as
∑ ∑ ∑=
+
+
.π π
=
−
=
−
=
−ˆ⁎
P fKLU
w n x n iD e w n y n iD e( ) 1 ( ) ( ) ( ) ( )(5)
xyi
K
n
Ljn f
n
Ljn f
0
1
0
12
0
12
Non-invasive ICP estimation. The invasive ICP and non-invasive TMP signals were first lowpass filtered in order to remove non-physiological high frequency noise such as the 50 Hz power line hum. The low pass filter-ing was done using a linear phase FIR (Finite Impulse Response) filter with filter order 104, cut-off frequency of 40 Hz and an attenuation of 96 dB at 50 Hz. The transient was removed from the analysis.
To investigate the method’s potential, a patient specific transfer function estimate was found for each patient, using MATLAB’s predefined tfestimate function with a Hamming window (MATLAB and Statistics Toolbox Release 2016a, The MathWorks Inc., Natick, Massachusetts, USA). The first ten minutes of each measurements
PatID Sex Age (yrs) BMI (kg/m2) Reason for ICP Admission diagnosis
1 F 54 20.4 D Secondary HC (after SAH)
2 M 59 D Secondary HC (after TBI)
3 M 71 20.6 D iNPH
4 M 34 S Surveillance for SAH
5 F 58 20.7 D Secondary HC (after SAH)
6 F 53 S Surveillance for SAH
7 M 60 31.0 D iNPH
8 F 17 21.9 D Secondary HC (cerebral tumour)
9 F 75 22.3 D iNPH
10 M 58 D iNPH
11 F 27 20.0 D Communicating HC
12 F 70 S Surveillance for SAH
13 F 42 22.5 D Communicating HC
14 F 50 S Surveillance for SAH
15 M 50 18.6 S Surveillance for SAH
16 F 42 28.1 D IIH
17 F 38 D Communicating HC
18 F 70 27.1 D iNPH
19 F 48 31.9 D IIH
20 F 67 S Surveillance for SAH
21 M 77 S Surveillance for SAH
22 F 49 20.4 S Surveillance for SAH
23 F 55 30.1 D iNPH
24 M 66 D iNPH
25 M 59 24.3 S Surveillance for SAH
26 M 73 29.3 D iNPH
27 F 81 28.9 D iNPH
28 F 11 29.6 D Secondary HC (cerebral tumour)
Mean ± std 54 ± 18 25 ± 5 Admission diagnosis
Table 1. Demographic information and number of observations. D: Diagnostic. HC: Hydrocephalus. IIH: idiopathic intracranial hypertension. iNPH: idiopathic normal pressure hydrocephalus. SAH: subarachnoid hemorrhage, S: Surveillance.
82

www.nature.com/scientificreports/
5SCIENtIFIC REPORTs | (2018) 8:15776 | DOI:10.1038/s41598-018-34083-6
series were used for the transfer function estimation. These ten minutes were divided into 6-second windows with 50% overlap in order to find a representative average. The mean was removed from the input and output series for the transfer function analysis not to be influenced by fluctuations in the mean ICP level, and in order to avoid side lobe leakage35. For patients where several measurement series had been done, the longest series was chosen. After establishing patient specific transfer function estimates, these were applied to the entire patient’s recording. This resulted in non-invasive ICP estimates for each patient based on invasive training data.
An example showing 6 seconds of the input signals and the corresponding transfer function estimate based on a total of 10 minutes for one patient is shown in Fig. 2a) and b) respectively. As we wish to use the TMP signals to estimate the ICP signals non-invasively, we apply the non-causal inverse of the transfer function estimate on the recorded TMP signals. The resulting output from the combination of Fig. 2a) and the inverse of Fig. 2b) is shown in Fig. 2c).
Transfer function estimate evaluation. The transfer function shown in Fig. 2b) is a representative exam-ple from the cohort. When visually inspecting the phase, shown in the lower half of the figure, it becomes evident that it is only linear up to approximately 11 Hz for this patient. A single frequency of the ICP signal ωtcos( ), which is delayed by a time τ by passing through the cochlear aqueduct, will be ω τ−tcos( ( )) at the exit. Now, a time-delayed cosine can be written in terms of phase as ω φ+tcos( ). That means that the time delay and the phase delay are related as φ ωτ= − . A phase that varies linearly with frequency is therefore equivalent to a time delay which is constant and does not vary with frequency. If that is the case, the canal is dispersion-less. Assuming this, and that deviations from a linear phase are due to estimation problems due to noise, and not the physics of the canal, the transfer function was limited in frequency to only the linear phase part. A filter was applied to each patient’s nICP estimates and ICP measurements as a secondary study. The filter applied is a frequency sampling filter which is specified in the Fourier domain. In its simplest version, it consists of 1’s in the passband and 0′s in the stopband. However, this introduces unnecessary large ripple in the passband and poor stopband suppression near the transition band. In order to reduce these undesirable effects, one simple method is to introduce one or more samples in the transition band with values between 0 and 136. Here, the simplest possible option is used with only a single transition sample with value 0.5. The limit frequency of linear phase was found for each patient and chosen by visual inspection.
Comparison of measured and estimated ICP waveforms. To investigate the quality of the non-invasive ICP estimates the unfiltered estimates were compared to the untouched, invasive ICP measurements using a time-domain method currently used in the clinic. The method is described in detail in31, and includes identifying the cardiac-induced waves by their beginning and ending diastolic minimum pressure and systolic maximum pressure. For each pulsatile ICP wave, the peak to peak amplitude (dP), rise time (dT) and rise time coefficient (RTC = dP/dT) were found. The averaged values, the mean wave amplitude (MWA), mean wave rise time (MWRT) and mean wave rise time coefficient (MWRTC) were computed for subsequent 6-second (6-sec) time windows. The different parameters, and the averaging, are more thoroughly described in31. This analysis was also done for the non-invasive ICP estimates that underwent the described frequency filtering against ICP measurements that had undergone the same filtering.
Statistics. All statistical analysis was done using SPSS software version 24 (IBM Corporation, Armonk, NY). Statistical significance was accepted at 0.05 level.
Results PatientsThe patient cohort included 28 patients whose demographic information is presented in Table 1. They were enrolled in the study from the period April to August 2005. The reason for ICP monitoring was surveillance after subarachnoid hemorrhage in 9 individuals and diagnostic ICP monitoring for CSF circulation disorders of vari-ous causes in 19 individuals (Table 1). The average measurement time was 1 hour and 27 minutes.
Comparison of ICP estimates and measurements. The simultaneous invasive ICP and non-invasive TMP signals included 24,349 6-second time windows from each individual. The invasive ICP scores are presented in Table 2. For each patient a patient specific transfer function estimate was found, which was then used to deter-mine a patient specific ICP estimate. In order to validate the results, the estimated and original ICP waveforms were compared for each individual. An example showing the resulting estimated non-invasive ICP waveform together with the invasively measured ICP waveform for Patient ID 3, 4 and 9 is shown in Fig. 3 for four different time windows. Patient ID 3 was selected because it is a representative example from the cohort, while patient IDs 4 and 9 were chosen as examples of good and poor results, when looking at the average error in MWA prediction.
In clinic, the MWA is most commonly used for diagnostic and surveillance purposes37,38. The absolute dif-ferences between invasive and estimated ICP scores for the entire measurement for all patients are therefore given in Table 2 and illustrated in Fig. 4. At group level, the absolute difference in MWA between original ICP and estimated non-invasive ICP signals was 2.2 ± 1.5 mmHg (Table 2). This difference was estimated from the entire recording period. When only considering the first 100 6-sec periods, the absolute difference in MWA was 1.7 ± 1.1 mmHg, and when considering the last 10 minutes of recording the absolute difference in MWA was 2.5 ± 1.7 mmHg. Accordingly, the difference in MWA became more pronounced at the end of the measurement period, which indicates lower quality of the TMP signal with time and/or a time varying ICP signal, as the first 10 minutes were used as basis for the transfer function estimation. The same trend becomes evident when com-paring the first and last time windows in Fig. 3.
From a clinical perspective, we consider the method to show promise in 4/28 of the individuals. This conclu-sion was made by looking at the averaged absolute difference between original and estimated MWA. For patient
83

www.nature.com/scientificreports/
6SCIENtIFIC REPORTs | (2018) 8:15776 | DOI:10.1038/s41598-018-34083-6
IDs 6, 9, 13 and 24 this was <1.0 mmHg in >50% of observations, and <0.5 mmHg in >20% of observations (Table 3). An average absolute difference of MWA <1 mmHg was observed in 3/28 individuals (Patient IDs 6, 9, and 13; Table 2). In conclusion the non-invasive MWA was estimated rather satisfactorily in four individuals (Patient IDs 6, 9, 13, and 24) (Tables 2 and 3), thus providing a promising non-invasive estimation of MWA in up to 14% of the patient cohort.
We also examined the ability of the estimates to predict MWA at a threshold of 4 rather than 1 mm Hg, given that this is a commonly used clinical threshold value (Table 4). The negative predictive value for this threshold was low, at only 53% (15/28).
Transfer function estimate evaluation. As mentioned in the method section, a frequency sampling fil-ter at the limit of the linear phase frequency region was applied in order to get information about the estimator’s performance, as an additional study. The limit of linear phase varied from around 2 Hz and up to 15 Hz for the patient cohort. Some transfer functions had no linear phase part at all. The filter was applied to both estimates and the invasive ICP gold standard in order to compare signals of equal bandwidth. For these comparisons the error in MWA was notably smaller, but as these results yield little clinical value in our particular clinical applica-tion, they are not covered in detail here, but shown in Table 5. The improvement of the MWA prediction, and the varying linear phase limit, indicates that the pressure equalization from the subarachnoid space to the outer ear is only dispersion-free for low frequencies, and that the cochlear aqueduct therefore reproduces the low frequency content of the ICP signal with better accuracy than the high frequency content. The results in Table 5 also reveal that this is highly patient dependent. No significant correlation was found between the improved results and the age or BMI of the patients.
PatID
N 6-sec time windows
Original invasive static and pulsatile ICPAbsolute differences between original ICP and estimated non-invasive pulsatile ICP
Mean ICP (mmHg)
MWA (mmHg) MWRT (sec)
MWRTC (mmHg/sec)
MWA (mmHg) MWRT (sec)
MWRTC (mmHg/sec)
1 462 3.5 ± 1.7 4.2 ± 0.4 0.23 ± 0.02 18.8 ± 1.4 1.6 ± 0.5 0.05 ± 0.03 8.9 ± 2.1
2 666 8.6 ± 3.6 5.3 ± 1.5 0.20 ± 0.04 27.6 ± 7.0 2.3 ± 1.8 0.15 ± 0.05 12.7 ± 8.3
3 409 6.1 ± 1.3 8.0 ± 0.9 0.26 ± 0.01 31.1 ± 3.4 1.6 ± 1.1 0.02 ± 0.02 7.4 ± 4.4
4 1044 33.9 ± 8.6 19.9 ± 7.8 0.31 ± 0.04 64.7 ± 29.6 8.0 ± 6.7 0.07 ± 0.04 32.2 ± 27.2
5 682 13.4 ± 3.7 3.8 ± 0.9 0.25 ± 0.03 15.7 ± 3.2 1.5 ± 1.0 0.11 ± 0.04 7.9 ± 4.7
6 321 6.1 ± 0.9 3.3 ± 0.2 0.19 ± 0.01 18.6 ± 1.0 0.9 ± 0.6 0.02 ± 0.02 6.1 ± 3.0
7 906 21.6 ± 3.5 4.5 ± 0.8 0.11 ± 0.03 8.2 ± 12.8 2.4 ± 0.7 0.10 ± 0.06 35.5 ± 9.8
8 557 0.8 ± 0.8 2.4 ± 0.5 0.12 ± 0.03 23.5 ± 4.4 1.2 ± 0.5 0.16 ± 0.06 19.3 ± 4.8
9 624 2.9 ± 2.2 6.2 ± 0.8 0.29 ± 0.02 21.4 ± 3.8 0.7 ± 0.6 0.04 ± 0.02 4.2 ± 2.9
10 771 16.4 ± 5.6 5.7 ± 1.3 0.21 ± 0.02 27.0 ± 5.0 3.0 ± 1.6 0.11 ± 0.04 17.8 ± 6.9
11 1311 4.9 ± 0.6 3.7 ± 0.3 0.10 ± 0.02 39.7 ± 3.0 1.2 ± 0.6 0.03 ± 0.03 16.9 ± 7.2
12 601 18.1 ± 2.8 7.8 ± 0.5 0.21 ± 0.01 37.7 ± 2.7 3.4 ± 1.1 0.04 ± 0.03 19.8 ± 5.6
13 1134 6.3 ± 1.3 2.4 ± 0.2 0.14 ± 0.04 20.1 ± 3.9 0.8 ± 0.4 0.09 ± 0.04 13.4 ± 4.5
14 239 19.5 ± 2.0 7.2 ± 0.9 0.26 ± 0.03 28.8 ± 4.3 1.8 ± 1.1 0.04 ± 0.03 8.8 ± 4.4
15 750 7.9 ± 3.4 5.6 ± 1.2 0.13 ± 0.05 49.9 ± 11.7 2.4 ± 1.1 0.11 ± 0.06 33.4 ± 12.8
16 524 1.2 ± 1.3 3.4 ± 0.5 0.18 ± 0.05 25.2 ± 7.0 1.2 ± 0.5 0.09 ± 0.05 16.7 ± 6.8
17 227 6.3 ± 1.3 3.0 ± 0.4 0.12 ± 0.03 28.6 ± 4.0 1.2 ± 0.6 0.16 ± 0.05 21.8 ± 4.6
18 2460 13.8 ± 2.9 7.5 ± 1.3 0.24 ± 0.02 32.1 ± 5.1 2.3 ± 1.6 0.07 ± 0.03 11.2 ± 6.8
19 330 9.7 ± 1.6 6.2 ± 0.7 0.18 ± 0.02 35.8 ± 5.0 1.2 ± 0.7 0.05 ± 0.03 12.1 ± 5.7
20 1722 14.1 ± 2.1 7.7 ± 1.3 0.21 ± 0.04 42.0 ± 8.4 3.6 ± 2.2 0.07 ± 0.05 21.1 ± 13.7
21 265 11.7 ± 2.7 13.8 ± 1.9 0.23 ± 0.01 61.7 ± 8.4 3.4 ± 2.4 0.06 ± 0.02 23.1 ± 11.6
22 498 10.7 ± 2.2 4.5 ± 0.6 0.16 ± 0.03 32.9 ± 7.9 2.1 ± 0.8 0.08 ± 0.03 22.7 ± 7.3
23 559 3.3 ± 2.2 3.5 ± 0.5 0.21 ± 0.03 18.5 ± 3.8 1.2 ± 0.5 0.07 ± 0.04 10.3 ± 3.9
24 347 2.7 ± 2.3 6.2 ± 0.8 0.22 ± 0.01 27.7 ± 3.6 1.0 ± 0.8 0.03 ± 0.02 6.3 ± 4.3
25 2957 9.1 ± 2.4 4.3 ± 0.7 0.16 ± 0.03 28.4 ± 4.0 1.6 ± 0.9 0.14 ± 0.05 19.1 ± 6.0
26 420 12.9 ± 2.1 9.0 ± 0.6 0.25 ± 0.01 36.2 ± 2.4 1.7 ± 0.9 0.04 ± 0.02 11.1 ± 3.6
27 2782 8.2 ± 2.0 5.8 ± 1.0 0.26 ± 0.02 22.0 ± 3.8 3.3 ± 1.1 0.10 ± 0.03 15.4 ± 4.2
28 791 42.0 ± 4.7 16.9 ± 4.0 0.17 ± 0.03 103.6 ± 22.2 4.1 ± 3.1 0.07 ± 0.04 36.7 ± 23.3
AVG ± STD 11.3 ± 9.4 6.5 ± 4.2 0.20 ± 0.06 34.6 ± 18.3 2.2 ± 1.5 0.08 ± 0.04 16.9 ± 9.1
SUM 24,359
Table 2. Results of estimating pulsatile ICP based on Transfer function from each individual. MWA: Mean Wave Amplitude. MWRT: Mean Wave Rise Time, MWRTC: Mean Wave Rise Time Coefficient.
84

www.nature.com/scientificreports/
7SCIENtIFIC REPORTs | (2018) 8:15776 | DOI:10.1038/s41598-018-34083-6
DiscussionThe present study addresses to which degree measurement of the TMP waveform made non-invasively in the outer ear could estimate the invasively measured ICP waveform. This differs from earlier work in the field, where the goal has been to evaluate absolute, or mean ICP utilizing the stapedial reflex18,20,22,39,40. The main observation in this study was that the non-invasive TMP waveforms did not reliably estimate the invasive ICP waveform for the majority of the cohort at the level required for clinical use.
To validate the reliability of the method, we compared the MWA from the invasive ICP signal with the ICP signal estimated from the TMP waveform. From a clinical perspective, the non-invasive MWA was estimated rather satisfactorily in only 4/28 individuals (14%). In these four patients the differences between original and estimated MWA were <1.0 mmHg in >50% of observations, and <0.5 mmHg in >20% of observations (Table 3).
One of the prerequisites of this method is a relatively clear path allowing pressure transfer between the intracra-nial compartment and the outer ear. For the normal case, where no dehiscence is present, a total of three commu-nication routes exist, namely the vestibular aqueduct, cochlear aqueduct and the internal auditory canal. If there are no irregularities, there is a perfect hydrodynamic relationship between the cerebrospinal fluid pressure and the perilymphatic pressure32,41,42. Animal studies show that the cochlear aqueduct is the most prominent route for pressure transfer43, but due to the vestibular aqueduct, pressure equalization still happens to some degree also if the cochlear aqueduct is occluded, but if so, with time delay, and with lower magnitude44,45. The percentage of patent cochlear aqueducts in humans has been studied by Gopen et al.32, who found 34% of the cochlear aqueducts to be clearly patent, 7% not to exist or to be completely occluded, and 59% to contain loose connective tissue. From this study alone, a success rate in the range from 34% to 93% would be expected, when assuming that the loose tissue does not completely prevent pressure equalization. Our results are even lower than this.
Figure 3. The non-invasive ICP waveform estimate (nICP, interrupted red line) is shown together with the invasive ICP waveform (continuous red line) for four different 6-second time windows after the beginning of the measurement (patient ID 3). The time delay between the nICP and ICP signals, as seen in Fig. 2a, has been removed for visual comparison.
Figure 4. The averaged absolute difference in Mean Wave Amplitude (MWA), Mean Wave Rise Time (MWRT) and Mean Wave Rise Time Coefficient (MWRTC) between the non-invasive ICP estimate and the measured ICP signal is shown for each patient ID. The error bars illustrate the patient specific standard deviation (mean ± stdev).
85

www.nature.com/scientificreports/
8SCIENtIFIC REPORTs | (2018) 8:15776 | DOI:10.1038/s41598-018-34083-6
It should be noted that the result for Patient ID 3 illustrated to the left in Fig. 3, which is representative for the study, is an example of one of the patients where the results from this method were found unsatisfactory. When visually comparing the waveform estimates for Patient ID 3 and Patient ID 9 to the corresponding invasive ICP signal, it is not evident which estimate that performs best. For both patients there is an apparent resemblance in waveform between the nICP estimates and the invasive ICP signal, but when focusing only on the averaged peak-to-peak amplitude, the difference is evidently higher for Patient ID 3 (Table 2). Figure 3 shows that the estimates overshoot for some and undershoot for others, which in sum easily gives an absolute error of more than 1 mmHg. Although MWA is currently the most informative parameter for indicating brain compliance in clinic, and therefore is the measure assessed here, there are other examples in literature where more of the frequency content of the ICP waveform is included in the analysis14,15. Given the apparent resemblance in total waveform exemplified in Fig. 3 there are reasons to believe that an analysis focusing on more of the spectral content could give somewhat better results and that the method still might have potential as an initial screening device for ICP.
In the literature, there is some controversy on whether the cochlear aqueduct patency is age dependent. While Gopen et al. found no such dependency, an earlier study shows the opposite result46. We were not able to find any correlation between age and the ability to estimate MWA from TMP signals in our results. It could be speculated whether age affect the patency of the cochlear aqueduct, and if so, this would affect our results as they are based on a patient cohort with high mean age (54.1 ± 17.8 years).
PatID
Difference in MWA <0.5 mmHg: Percentage of 6-s observations
Difference in MWA <1.0 mmHg: Percentage of 6-s observations
1 1 10
2 10 22
3 14 33
4 10 18
5 17 35
6 23 66
7 2 3
8 4 40
9 45 74
10 11 19
11 9 40
12 2 4
13 23 66
14 14 28
15 5 11
16 15 39
17 12 33
18 12 23
19 12 38
20 9 20
21 5 9
22 0 6
23 5 37
24 33 59
25 13 24
26 3 19
27 1 3
28 8 15
AVG ± STD 11.4 ± 10.0 28.4 ± 19.7
Table 3. Percentage of 6-s observations with difference in MWA either <0.5 mmHg or <1.0 mmHg. MWA: Mean Wave Amplitude.
Criteria Number Test results
Original & Estimate ≥4 mmHg 13Sensitivity 65%Specificity 100%PPV 100%NPV 53%
Original & Estimate <4 mmHg 8
Original ≥4 mmHg & Estimate <4 mmHg 7
Original <4 mmHg & Estimate ≥4 mmHg 0
Table 4. Predictive ability of MWA threshold of 4 mmHg. PPV: Positive predictive value. NPV: Negative predictive value.
86
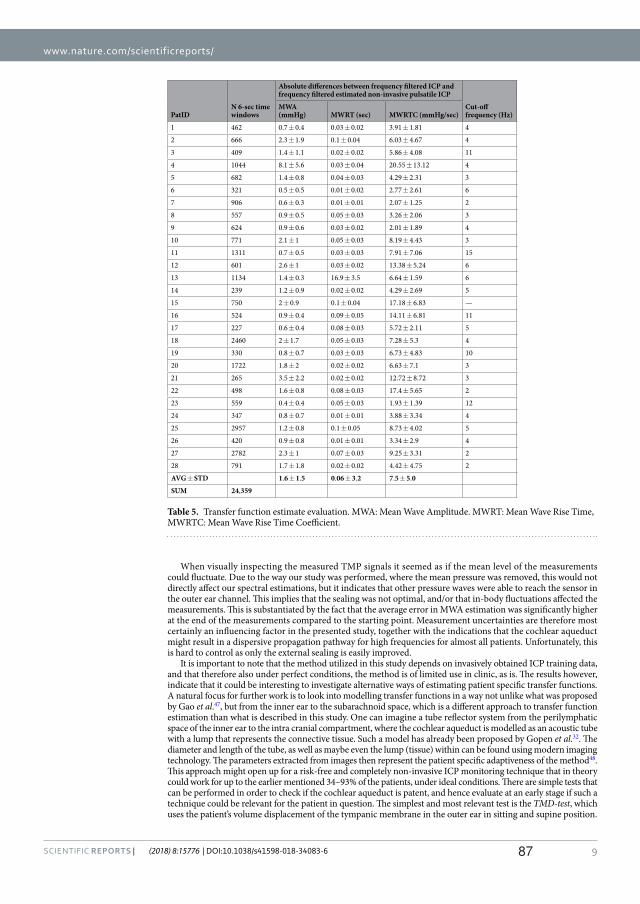
www.nature.com/scientificreports/
9SCIENtIFIC REPORTs | (2018) 8:15776 | DOI:10.1038/s41598-018-34083-6
When visually inspecting the measured TMP signals it seemed as if the mean level of the measurements could fluctuate. Due to the way our study was performed, where the mean pressure was removed, this would not directly affect our spectral estimations, but it indicates that other pressure waves were able to reach the sensor in the outer ear channel. This implies that the sealing was not optimal, and/or that in-body fluctuations affected the measurements. This is substantiated by the fact that the average error in MWA estimation was significantly higher at the end of the measurements compared to the starting point. Measurement uncertainties are therefore most certainly an influencing factor in the presented study, together with the indications that the cochlear aqueduct might result in a dispersive propagation pathway for high frequencies for almost all patients. Unfortunately, this is hard to control as only the external sealing is easily improved.
It is important to note that the method utilized in this study depends on invasively obtained ICP training data, and that therefore also under perfect conditions, the method is of limited use in clinic, as is. The results however, indicate that it could be interesting to investigate alternative ways of estimating patient specific transfer functions. A natural focus for further work is to look into modelling transfer functions in a way not unlike what was proposed by Gao et al.47, but from the inner ear to the subarachnoid space, which is a different approach to transfer function estimation than what is described in this study. One can imagine a tube reflector system from the perilymphatic space of the inner ear to the intra cranial compartment, where the cochlear aqueduct is modelled as an acoustic tube with a lump that represents the connective tissue. Such a model has already been proposed by Gopen et al.32. The diameter and length of the tube, as well as maybe even the lump (tissue) within can be found using modern imaging technology. The parameters extracted from images then represent the patient specific adaptiveness of the method48. This approach might open up for a risk-free and completely non-invasive ICP monitoring technique that in theory could work for up to the earlier mentioned 34–93% of the patients, under ideal conditions. There are simple tests that can be performed in order to check if the cochlear aqueduct is patent, and hence evaluate at an early stage if such a technique could be relevant for the patient in question. The simplest and most relevant test is the TMD-test, which uses the patient’s volume displacement of the tympanic membrane in the outer ear in sitting and supine position.
PatIDN 6-sec time windows
Absolute differences between frequency filtered ICP and frequency filtered estimated non-invasive pulsatile ICP
Cut-off frequency (Hz)
MWA (mmHg) MWRT (sec) MWRTC (mmHg/sec)
1 462 0.7 ± 0.4 0.03 ± 0.02 3.91 ± 1.81 4
2 666 2.3 ± 1.9 0.1 ± 0.04 6.03 ± 4.67 4
3 409 1.4 ± 1.1 0.02 ± 0.02 5.86 ± 4.08 11
4 1044 8.1 ± 5.6 0.03 ± 0.04 20.55 ± 13.12 4
5 682 1.4 ± 0.8 0.04 ± 0.03 4.29 ± 2.31 3
6 321 0.5 ± 0.5 0.01 ± 0.02 2.77 ± 2.61 6
7 906 0.6 ± 0.3 0.01 ± 0.01 2.07 ± 1.25 2
8 557 0.9 ± 0.5 0.05 ± 0.03 3.26 ± 2.06 3
9 624 0.9 ± 0.6 0.03 ± 0.02 2.01 ± 1.89 4
10 771 2.1 ± 1 0.05 ± 0.03 8.19 ± 4.43 3
11 1311 0.7 ± 0.5 0.03 ± 0.03 7.91 ± 7.06 15
12 601 2.6 ± 1 0.03 ± 0.02 13.38 ± 5.24 6
13 1134 1.4 ± 0.3 16.9 ± 3.5 6.64 ± 1.59 6
14 239 1.2 ± 0.9 0.02 ± 0.02 4.29 ± 2.69 5
15 750 2 ± 0.9 0.1 ± 0.04 17.18 ± 6.83 —
16 524 0.9 ± 0.4 0.09 ± 0.05 14.11 ± 6.81 11
17 227 0.6 ± 0.4 0.08 ± 0.03 5.72 ± 2.11 5
18 2460 2 ± 1.7 0.05 ± 0.03 7.28 ± 5.3 4
19 330 0.8 ± 0.7 0.03 ± 0.03 6.73 ± 4.83 10
20 1722 1.8 ± 2 0.02 ± 0.02 6.63 ± 7.1 3
21 265 3.5 ± 2.2 0.02 ± 0.02 12.72 ± 8.72 3
22 498 1.6 ± 0.8 0.08 ± 0.03 17.4 ± 5.65 2
23 559 0.4 ± 0.4 0.05 ± 0.03 1.93 ± 1.39 12
24 347 0.8 ± 0.7 0.01 ± 0.01 3.88 ± 3.34 4
25 2957 1.2 ± 0.8 0.1 ± 0.05 8.73 ± 4.02 5
26 420 0.9 ± 0.8 0.01 ± 0.01 3.34 ± 2.9 4
27 2782 2.3 ± 1 0.07 ± 0.03 9.25 ± 3.31 2
28 791 1.7 ± 1.8 0.02 ± 0.02 4.42 ± 4.75 2
AVG ± STD 1.6 ± 1.5 0.06 ± 3.2 7.5 ± 5.0
SUM 24,359
Table 5. Transfer function estimate evaluation. MWA: Mean Wave Amplitude. MWRT: Mean Wave Rise Time, MWRTC: Mean Wave Rise Time Coefficient.
87

www.nature.com/scientificreports/
1 0SCIENtIFIC REPORTs | (2018) 8:15776 | DOI:10.1038/s41598-018-34083-6
If the volume displacement changes with a given minimum magnitude when the positions changes, the cochlear aqueduct must be patent, as there are known intracranial pressure changes that occur with shifts in posture40.
Despite a wide range of approaches over long time, clinically viable non-invasive ICP monitoring is still not a reality. There are techniques that provide promising results49–51, but these are currently lacking clinical validation. The importance of ICP level in the case of traumatic brain injury and critical pathologies is well documented, but due to the lack of a good non-invasive monitoring technique, the role played by ICP is unknown in several different less critical pathologies. To create a non-invasive ICP monitoring tool of considerable utility, it must be accurate, non-dangerous, and possible to use for people with relatively little medical expertise. The approach presented here as a possibility for further work is not ideal in this regard, but the risk associated with invasive placement of a pressure probe is removed. In addition, intracranial pressure monitoring through the outer ear, is highlighted by Popovic et al. as the technology for non-invasive ICP monitoring that is the most user friendly5. However, with traditional tympanic membrane displacement using the stapedial reflex, continuous monitoring is not possible. This changes when looking at the pulsatile pressure and waveform analysis used in this study. The TMP technique utilized here also allows for very comfortable measurements, as there is no exposure of the patients to extreme sound pressure levels, which is necessary in order to trigger the stapedial reflex. It also has the advantage that it can work on people who are on muscle relaxes, which traditional TMD measurements cannot. The potential value for different patient groups if this technique works is therefore significant.
ConclusionThis study showed that the TMP waveforms measured in the outer ear could not be used to correctly predict the ICP waveform parameter MWA non-invasively. An estimate that might possibly be acceptable in clinic was only observed in 4/28 (14%) individuals. An observation of the study was that the cochlear aqueduct worked as a physical lowpass filter. This reduced the TMP measurement’s ability to reproduce the entire spectral content of the ICP waveform, and hence affected the MWA estimation.
References 1. Czosnyka, M. & Pickard, J. D. Monitoring and interpretation of intracranial pressure. J. Neurol. Neurosurg. Psychiatry 75, 813–821
(2004). 2. Miller, J. D. et al. Significance of intracranial hypertension in severe head injury. Journal of neurosurgery 47, 503–516 (1977). 3. Steiner, L. & Andrews, P. Monitoring the injured brain: ICP and CBF. BJA: British Journal of Anaesthesia 97, 26–38 (2006). 4. Binz, D. D., Toussaint, L. G. & Friedman, J. A. Hemorrhagic complications of ventriculostomy placement: a meta-analysis.
Neurocritical care 10, 253 (2009). 5. Popovic, D., Khoo, M. & Lee, S. Noninvasive monitoring of intracranial pressure. Recent patents on biomedical engineering 2,
165–179 (2009). 6. Zhang, X. et al. Invasive and noninvasive means of measuring intracranial pressure: a review. Physiological Measurement 38, R143
(2017). 7. Robba, C. et al. Non‐invasive assessment of intracranial pressure. Acta Neurologica Scandinavica 134, 4–21 (2016). 8. Czarnik, T. et al. Noninvasive measurement of intracranial pressure: is it possible? Journal of Trauma and Acute Care Surgery 62,
207–211 (2007). 9. Czosnyka, M. & Citerio, G. (Springer, 2012). 10. Löfgren, J., Essen, C. V. & Zwetnow, N. N. The pressure‐volume curve of the cerebrospinal fluid space in dogs. Acta Neurologica
Scandinavica 49, 557–574 (1973). 11. Avezaat, C., Van Eijndhoven, J. & Wyper, D. Cerebrospinal fluid pulse pressure and intracranial volume-pressure relationships.
Journal of Neurology, Neurosurgery & Psychiatry 42, 687–700 (1979). 12. Takizawa, H., Gabra-Sanders, T. & Miller, D. J. Changes in the cerebrospinal fluid pulse wave spectrum associated with raised
intracranial pressure. Neurosurgery 20, 355–361 (1987). 13. Eide, P. K. The correlation between pulsatile intracranial pressure and indices of intracranial pressure-volume reserve capacity:
results from ventricular infusion testing. Journal of neurosurgery 125, 1493–1503 (2016). 14. Lang, E. W., Paulat, K., Witte, C., Zolondz, J. & Mehdorn, H. M. Noninvasive intracranial compliance monitoring: technical note and
clinical results. Journal of neurosurgery 98, 214–218 (2003). 15. Robertson, C. S. et al. Clinical experience with a continuous monitor of intracranial compliance. Journal of neurosurgery 71, 673–680
(1989). 16. Eide, P., Czosnyka, M., Sorteberg, W., Pickard, J. & Smielewski, P. Association between intracranial, arterial pulse pressure
amplitudes and cerebral autoregulation in head injury patients. Neurological research 29, 578–582 (2007). 17. Wagshul, M. E., Eide, P. K. & Madsen, J. R. The pulsating brain: a review of experimental and clinical studies of intracranial
pulsatility. Fluids and Barriers of the CNS 8, 5 (2011). 18. Marchbanks, R., Reid, A., Martin, A., Brightwell, A. & Bateman, D. The effect of raised intracranial pressure on intracochlear fluid
pressure: three case studies. British journal of audiology 21, 127–130 (1987). 19. Shimbles, S., Dodd, C., Banister, K., Mendelow, A. & Chambers, I. Clinical comparison of tympanic membrane displacement with
invasive intracranial pressure measurements. Physiological measurement 26, 1085 (2005). 20. Gwer, S. et al. The tympanic membrane displacement analyser for monitoring intracranial pressure in children. Child’s Nervous
System. 29, 927–933 (2013). 21. Raboel, P., Bartek, J., Andresen, M., Bellander, B. & Romner, B. Intracranial pressure monitoring: invasive versus non-invasive
methods—a review. Critical care research and practice 2012 (2012). 22. Davids, J., Birch, A. & Marchbanks, R. 082 Non-invasive measurements of intracranial pressure: Can Coherent averaging show a
tilt-dependent change in the measured Spontaneous Tympanic Membrane Displacement (STMD) signal in healthy volunteers? J Neurol Neurosurg Psychiatry 83, e1–e1 (2012).
23. Parker, D. Labyrinth and cerebral-spinal fluid pressure changes in guinea pigs and monkeys during simulated zero G. Aviation, space, and environmental medicine 48, 356–361 (1977).
24. Beentjes, B. The cochlear aqueduct and the pressure of cerebrospinal and endolabyrinthine fluids. Acta oto-laryngologica 73, 112–120 (1972).
25. Carlborg, B., Densert, B. & Densert, O. Functional patency of the cochlear aqueduct. Annals of Otology, Rhinology & Laryngology 91, 209–215 (1982).
26. Carlborg, B. I., Konrádsson, K. S., Carlborg, A. H., Farmer, J. C. Jr. & Densert, O. Pressure transfer between the perilymph and the cerebrospinal fluid compartments in cats. Otology & Neurotology 13, 41–48 (1992).
27. Pranevicius, O., Pranevicius, M., Pranevicius, H., Marcinkevicius, E. & Liebeskind, D. S. (Google Patents, 2012).
88

www.nature.com/scientificreports/
1 1SCIENtIFIC REPORTs | (2018) 8:15776 | DOI:10.1038/s41598-018-34083-6
28. Stettin, E., Paulat, K., Schulz, C., Kunz, U. & Mauer, U. M. Noninvasive intracranial pressure measurement using infrasonic emissions from the tympanic membrane. Journal of clinical monitoring and computing 25, 203–210 (2011).
29. Paulat, K., Brucher, R. & Russell, D. Noninvasive monitoring of intracranial pressure and compliance. The Annals of Thoracic Surgery 73, S371 (2002).
30. Holm, S. & Eide, P. K. Impact of sampling rate for time domain analysis of continuous intracranial pressure (ICP) signals. Medical engineering & physics 31, 601–606 (2009).
31. Eide, P. K. A new method for processing of continuous intracranial pressure signals. Medical engineering & physics 28, 579–587 (2006).
32. Gopen, Q., Rosowski, J. J. & Merchant, S. N. Anatomy of the normal human cochlear aqueduct with functional implications. Hearing research 107, 9–22 (1997).
33. Evensen, K. B., O’Rourke, M., Prieur, F., Holm, S. & Eide, P. K. Non-invasive Estimation of the Intracranial Pressure Waveform from the Central Arterial Blood Pressure Waveform in Idiopathic Normal Pressure Hydrocephalus Patients. Scientific reports 8, 4714 (2018).
34. Hayes, M. H. Statistical digital signal processing and modeling. 415 (John Wiley & Sons, 1996). 35. Eide, P. K., Holm, S. & Sorteberg, W. Simultaneous monitoring of static and dynamic intracranial pressure parameters from two
separate sensors in patients with cerebral bleeds: comparison of findings. Biomedical engineering online 11, 66 (2012). 36. Rabiner, L., Gold, B. & McGonegal, C. An approach to the approximation problem for nonrecursive digital filters. IEEE Transactions
on Audio and Electroacoustics 18, 83–106 (1970). 37. Eide, P. K. & Sorteberg, W. Diagnostic intracranial pressure monitoring and surgical management in idiopathic normal pressure
hydrocephalus: a 6-year review of 214 patients. Neurosurgery 66, 80–91 (2010). 38. Eide, P. K. & Sorteberg, W. Outcome of surgery for idiopathic normal pressure hydrocephalus: role of preoperative static and
pulsatile intracranial pressure. World neurosurgery 86, 186–193. e181 (2016). 39. Marchbanks, R. J. (Google Patents, 1989). 40. Samuel, M., Burge, D. M. & Marchbanks, R. J. Tympanic membrane displacement testing in regular assessment of intracranial
pressure in eight children with shunted hydrocephalus. Journal of neurosurgery 88, 983–995 (1998). 41. Ciuman, R. R. Communication routes between intracranial spaces and inner ear: function, pathophysiologic importance and
relations with inner ear diseases. American journal of otolaryngology 30, 193–202 (2009). 42. Hofman, R., Segenhout, J., Albers, F. & Wit, H. The relationship of the round window membrane to the cochlear aqueduct shown in
three-dimensional imaging. Hearing research 209, 19–23 (2005). 43. Thalen, E., Wit, H., Segenhout, J. & Albers, F. Dynamics of inner ear pressure change caused by intracranial pressure manipulation
in the guinea pig. Acta oto-laryngologica 121, 470–476 (2001). 44. Carlborg, B. I. & Farmer, J. C. Transmission of cerebrospinal fluid pressure via the cochlear aqueduct and endolymphatic sac.
American journal of otolaryngology 4, 273–282 (1983). 45. Kishimoto, S., Nagahara, K., Fisch, V. & Dillier, N. Inner ear pressure measurements. Otolaryngol Clin North Am 16, 21–35 (1983). 46. Włodyka, J. Studies on cochlear aqueduct patency. Annals of Otology, Rhinology & Laryngology 87, 22–28 (1978). 47. Gao, M. et al. A Simple Adaptive Transfer Function for Deriving the Central Blood Pressure Waveform from a Radial Blood Pressure
Waveform. Scientific reports 6, 33230 (2016). 48. Song, C. I., Kang, W. S., Lee, J. H. & Chung, J. W. Diameter of the Medial Side of the Cochlear Aqueduct Is Narrower in Meniere’s
Disease: A Radiologic Analysis. Journal of International Advanced Otology 12 (2016). 49. Levinsky, A., Papyan, S., Weinberg, G., Stadheim, T. & Eide, P. K. Non-invasive estimation of static and pulsatile intracranial pressure
from transcranial acoustic signals. Medical engineering & physics 38, 477–484 (2016). 50. Kashif, F. M., Verghese, G. C., Novak, V., Czosnyka, M. & Heldt, T. Model-based noninvasive estimation of intracranial pressure
from cerebral blood flow velocity and arterial pressure. Science translational medicine. 4, 129ra144–129ra144 (2012). 51. Koskinen, L.-O. D. et al. Can intracranial pressure be measured non-invasively bedside using a two-depth Doppler-technique?
Journal of clinical monitoring and computing 31, 459–467 (2017).
AcknowledgementsThis work was supported by grants from Health South-East, Norway (grant 2016032).
Author ContributionsConception and design: K.B.E. and P.K.E. Acquisition of data: K.B.E. and P.K.E. Analysis and interpretation of data: K.B.E., K.P., F.P., S.H., P.K.E. Drafting the article: K.B.E. and P.K.E. Statistical analysis: K.B.E., P.K.E. Critically revising the article: K.B.E., K.P., F.P., S.H., P.K.E. Reviewed submitted version of manuscript: K.B.E., M.K.P., F.P., S.H., P.K.E. Approved the final version of the manuscript on behalf of all authors: P.K.E.
Additional InformationCompeting Interests: The authors declare no competing interests.Publisher’s note: Springer Nature remains neutral with regard to jurisdictional claims in published maps and institutional affiliations.
Open Access This article is licensed under a Creative Commons Attribution 4.0 International License, which permits use, sharing, adaptation, distribution and reproduction in any medium or
format, as long as you give appropriate credit to the original author(s) and the source, provide a link to the Cre-ative Commons license, and indicate if changes were made. The images or other third party material in this article are included in the article’s Creative Commons license, unless indicated otherwise in a credit line to the material. If material is not included in the article’s Creative Commons license and your intended use is not per-mitted by statutory regulation or exceeds the permitted use, you will need to obtain permission directly from the copyright holder. To view a copy of this license, visit http://creativecommons.org/licenses/by/4.0/. © The Author(s) 2018
89


Paper III
Mechanisms behind alteredpulsatile intracranial pressure inidiopathic normal pressurehydrocephalus: Role of vascularpulsatility and systemichemodynamic variables
Karen Brastad Evensen, Per Kristian EidePublished in Acta Neurochirurgica, June 2020DOI: 10.1007/s00701-020-04423-5.
III
The work was supported by grant from Health south-East, Norway (grant 2016032).
91


ORIGINAL ARTICLE - NEUROSURGERY GENERAL
Mechanisms behind altered pulsatile intracranial pressurein idiopathic normal pressure hydrocephalus: role of vascularpulsatility and systemic hemodynamic variables
Karen Brastad Evensen1,2& Per Kristian Eide1,3
Received: 16 March 2020 /Accepted: 19 May 2020# The Author(s) 2020
AbstractBackground The dementia subtype idiopathic normal pressure hydrocephalus (iNPH) has unknown etiology, but onecharacteristic is elevated intracranial pressure (ICP) wave amplitudes in those individuals who respond with clinicalimprovement following cerebrospinal fluid (CSF) diversion. To explore the mechanisms behind altered ICP waveamplitudes, we correlated central aortic blood pressure (BP) and ICP waveform amplitudes (intracranial aortic amplitudecorrelation) and examined how this correlation relates to ICP wave amplitude levels and systemic hemodynamicparameters.Methods The study included 29 patients with probable iNPH who underwent continuous multi-hour measurement ofICP, radial artery BP, and systemic hemodynamic parameters. The radial artery BP waveforms were used to estimatecentral aortic BP waveforms, and the intracranial aortic amplitude correlation was determined over consecutive 4-minperiods.Results The average intracranial aortic amplitude correlation was 0.28 ± 0.16 at the group level. In the majority of iNPHpatients, the intracranial aortic amplitude correlation was low, while in about 1/5 patients, the correlation was rather high(average Pearson correlation coefficient > 0.4). The degree of correlation was hardly influenced by systemic hemody-namic parameters.Conclusions In about 1/5 iNPH patients of this study, the intracranial aortic amplitude correlation (IAACAORTIC) wasrather high (average Pearson correlation coefficient > 0.4), suggesting that cerebrovascular factors to some extent mayaffect the ICP wave amplitudes in a subset of patients. However, in 14/19 (74%) iNPH patients with elevated ICP waveamplitudes, the intracranial aortic amplitude correlation was low, indicating that the ICP pulse amplitude in most iNPHpatients is independent of central vascular excitation, ergo it is modulated by local cerebrospinal physiology. In supportof this assumption, the intracranial aortic amplitude correlation was not related to most systemic hemodynamic variables.An exception was found for a subgroup of the patients with high systemic vascular resistance, where there was acorrelation.
Keywords ICPwave amplitudes . Central aortic waveforms . Idiopathic normal pressure hydrocephalus . Autoregulation
Introduction
Idiopathic normal pressure hydrocephalus (iNPH) is a subtypeof dementia incorporating gait ataxia, urinary incontinence,and cerebrospinal fluid (CSF) circulation failure, but with anunknown cause. We have previously reported that the iNPHpatients responding clinically to CSF diversion surgery (shuntsurgery) typically present with elevated ICP wave amplitudesmeasured invasively [7, 8]. While elevated ICP wave ampli-tudes characterize iNPH shunt responders, the underlyingmechanisms remains unclear. For example, are the ICP wave
This article is part of the Topical Collection on Neurosurgery general
* Per Kristian [email protected]
1 Department of Neurosurgery, Oslo University Hospital –Rikshospitalet, P.O.Box 4950, Nydalen, 0424 Oslo, Norway
2 Department of Informatics, Faculty of Mathematics and NaturalSciences, University of Oslo, Oslo, Norway
3 Institute of Clinical Medicine, Faculty of Medicine, University ofOslo, Oslo, Norway
Acta Neurochirurgicahttps://doi.org/10.1007/s00701-020-04423-5
93

amplitudes primarily related to vascular factors such as theblood pressure (BP) wave amplitudes or are the ICP waveamplitudes more influenced by extravascular factors?
In particular, the association between pulsatile arterial BPand ICP may be one factor behind the delayed paravascularclearance of CSF tracer observed in vivo in individuals withiNPH [6, 34]. In 2012, a brain-wide paravascular route fortransport of fluids and solutes, denoted the glymphatic (glia-lymphatic) system, was described [15]. Convective forces cre-ated by the pressure gradients from the arterial pulsatile BPwere hypothesized to represent the primary driving force be-hind the antegrade transport of fluid and solutes along theblood vessels [15, 16, 24]. Moreover, reduced arterial pulsa-tions, such as seen in arterial hypertension, are associated withhampered paravascular solute transport [24]. With regard toiNPH, we have proposed that restricted arterial BP pulsatilityrelated to abnormal pulsatile ICP may hamper theparavascular waste removal [6].
The present study addressed to which degree the pulsatileICP that is created from the pulsatile arterial BP is affected byextra-cerebrovascular factors in iNPH patients. As a surrogatemarker of arterial BP pulsatility within the cranial cavity, we
utilize the central aortic BP waveforms, which are close to thescene both for hemodynamic events and the intracranial arte-rial pulsations. The concept described here is illustrated inFig. 1. Using terms from system analysis, we consider thepulsatile central aortic BP our input signal and the pulsatileICP our output signal. The unknown system consists of thevascular (blood vessel and flow) and extra-cerebrovascularfactors (brain parenchyma and CSF) and will act as a physio-logical filter on the central aortic BP waves. The measuredICP waves are then the final result. This yields that the corre-lation between central aortic BP and ICP waveforms, heredenoted Intracranial Aortic Amplitude Correlation(IAACAORTIC), provides information about the impact ofextra-cerebrovascular factors on the ICP waveform. A highdegree of correlation would suggest a direct transfer of thecentral aortic BP waveform to the ICP waveform (i.e., extra-cerebrovascular compartment hardly affects the ICP wave-form). If the abnormal ICP waveform in iNPH patients pri-marily is determined by vascular BP pulsatility, we wouldexpect IAACAORTIC to be increased and to be affected bysystemic vascular variables and various patient characteristics.We would, however, not expect that surrogate markers of the
Fig. 1 The transmission from central aortic BP waveforms to ICPwaveforms. a The pulsatile arterial BP causes pressure forces in theradial direction (white arrows) and towards the arterial blood vesselwall. The degree of movement of the arterial blood vessel wall partlydepends on the properties of arterial wall (e.g., stiff blood pressurewalls as seen in arterial hypertension, auto-regulatory capacity) and theblood flow (here collectively denoted vascular factor), and partly on thecounter pressure (black arrows) determined by factors in the compartmentoutside the blood vessel (here denoted extra-cerebrovascular factor). bThe cardiac contractions create arterial BP waveforms that propagate viathe systemic circulation and cerebral circulation. Typically, the arterialBP waveform diminishes from the arterial (red) to the venous side (blue).While it is not feasible to continuously monitor the pulsatile arterial BPwithin the cranial compartment, the central aortic BP waveform is moreclosely related to the intracranial arterial BP waveform than peripheralarterial BP, e.g., the radial arterial BP waveform. c In this study, the
“unknown” system consists of the vascular factors (intracranial bloodvessels and cerebral blood flow) and extra-cerebrovascular factors(brain parenchyma and CSF). The central aortic BP waveform acts as aproxy for the intracranial arterial BP waveform and is our input signal,while the measured ICP waveform is the output signal. To study to whichextent the vascular and extra-cerebrovascular factors constitute thesystem, we determined the Pearson correlation coefficient betweenamplitudes of central aortic and ICP waveforms for every 4 min period(referred to as Intracranial Aortic Amplitude Correlation, IAACAORTIC).A high degree of correlation between input and output suggests a semi-direct transfer from input to output, i.e., ICP is mainly determined byvascular factors (arterial BP) and the extra-cerebrovascular factors ofthe system are negligible. A low correlation indicates that the extra-cerebrovascular factors of the system highly affect the measured ICPsignal. Illustration: Ine Eriksen, University of Oslo
Acta Neurochir
94
extra-cerebrovascular content to affect the correlation. Ourhypothesis is, therefore, that the transfer of central aortic BPto ICP waveform primarily is affected by extra-cerebrovascular factors and that the elevated pulsatile ICPseen in iNPH patients are due to other pathophysiologicalfactors than vascular factors per se.
Materials and methods
Patients
The study included patients with probable iNPH [33] whounderwent work-out for CSF diversion surgery at theDepartment of Neurosurgery, Oslo University Hospital—Rikshospitalet, from October 2008 to January 2009. Multi-hour continuous ICP monitoring with the determination ofmean ICP wave amplitude (MWAICP) is part of the clinicalroutine and an important factor when deciding on whether toperform CSF diversion surgery. Individuals with mean ICPwave amplitudes (MWAICP) above a selected threshold areoffered shunt surgery, as previously described [7].
Monitoring and analysis of continuous pressure andhemodynamic variables
The ICP was measured continuously using a solid ICP sensor(Codman MicroSensor™, Johnson & Johnson, Raynham,MA, USA) that had been placed 1–2 cm into the frontal brainparenchyma through a small burr hole and a minimal openingin the dura in local anesthesia. The radial artery BP was mea-sured continuously and invasively from the right radial arteryusing a Truwave PX-600F Pressure Monitoring Set (EdwardsLife sciences LLC, Irvine, CA) that was placed at the level ofthe heart. Both the ICP waveform and radial artery BP wave-forms were sampled at 200 Hz, which is an adequate samplingrate [14] and digitized using an analogue-to-digital converter(Sensometrics® Pressure Logger; dPCom AS, Oslo, Norway)before they were stored as raw data files with an identical timereference. The continuous pressure signals were analyzedusing Sensometrics® software (dPCom AS, Oslo, Norway).
Central aortic BP waveforms were estimated from the ra-dial artery BP waveforms using the SphygmoCor system(SphygmoCor®; AtCor Medical, West Ryde, NSW,Australia). The SphygmoCor system has been validated tosuccessfully estimate central aortic BP waveforms from sev-eral different variants of peripheral BP measurements. Themost relevant validation studies are brachial artery BP mea-surements [17], invasive radial artery BP measurements [25],and radial artery tonometry measurements [3, 12]. In addition,the SphygmoCor system has been approved for clinical use byregulatory bodies such as the US FDA [12].
Systemic hemodynamic variables were measured simulta-neously with the continuous pressure signals using theLiDCO™plus software (version 4.0, LiDCO Ltd.,Cambridge, UK), which provides for a minimally invasivetechnique of hemodynamic monitoring. The methodology in-corporates two methods, namely, a continuous arterial BPwaveform analysis system (PulseCO), coupled to a single-point lithium indicator dilution calibration system (LiDCO)[26, 29]. The calibration procedure incorporates an injectionof 0.3 mmol lithium chloride through a peripheral line [29].The lithium is detected by an external lithium ion-sensitiveexternal electrode connected to the peripheral arterial line,which enables monitoring of the hemodynamic variables car-diac output (CO), systemic vascular resistance (SVR), strokevolume (SV), cardiac index (CI), mean radial arterial BP, andheart rate (HR). The software in LiDCO™plus andSensometrics® has an identical time reference. We used aminimally invasive approach to monitor the systemic hemo-dynamic variables, namely, the PulseCO hemodynamic mon-itor. This approach has previously been validated against thepulmonary artery catheter method [19] and applied for hemo-dynamic monitoring in several patient cohorts [2, 20].
In this study, for the first time, the moving correlation be-tween single-pressure wave amplitudes of ICP and centralaortic BP waveform amplitudes were determined(Intracranial Aortic Amplitude Correlation; IAACAORTIC).For this purpose, the peak to peak amplitudes of correspond-ing central aortic BP and ICP single pressure waves wereautomatically identified. In the following, the peak to peakamplitude refers to the difference between the maximum sys-tolic BP and the minimum diastolic BP for the central aorticBP single waves and the difference between the maximumICP and minimum ICP for the ICP single waves. The ampli-tude identification did not identify the P1, P2, and P3 peaks,but identified the highest peak between two diastolic mini-mum pressures. The intracranial aortic amplitude correlation(IAACAORTIC) was thereafter determined as Pearson correla-tion coefficient for every consecutive 4-min period of the in-dividual central aortic BP and ICP recording (Fig. 2). In pre-vious studies, we have used a similar approach based on arte-rial BP measurements from the radial artery (intracranial arte-rial amplitude correlation; IAAC) [4, 10].
In the present study, we further explored the degree ofintracranial aortic amplitude correlation for various levels ofmean ICP wave amplitude (MWAICP), systemic hemodynam-ic variables, and how the correlation related to various patientcharacteristics and to clinical response to CSF diversionsurgery.
Time alignment of pressure signals
As a central part of the study is to examine the correlationbetween the amplitudes of single waves resulting from the
Acta Neurochir
95

same heartbeat, perfect time alignment between the signalswas crucial. To exclude uncertainties, time alignment of thetime series was thoroughly checked, initially by visual com-parison. If apparent artifacts due to patient movement did notalign, or the time delay between signals shifted throughout therecording, there was reason to believe that there had beensome corruption of the signal. In the dataset presented here,there was a systematically recurring time shift that only hap-pened in one of the time series (central aortic BP waveforms).The time shift was corrected using a two-step approach. First,the onset of each single wave was calculated by a beat detec-tion algorithm that utilizes a curve length transformation [38].The onset before the anomaly was chosen for both time seriesand joined with the time aligned onset 6 s after, thereby re-moving the anomaly. The diastolic pressure over such a shorttimeframe was found to be approximately constant.
Statistics
The statistical analyses were performed using the SPSS soft-ware version 25 (IBM Corporation, Armonk, NY). Differencesbetween continuous data were determined using one-wayANOVA and Bonferroni post hoc tests for multiple compari-sons. Statistical significance was accepted at the 0.05 level.
Results
Patients
The study included 29 patients with probable iNPH; demo-graphic and management data are presented in Table 1.Twenty-two patients were shunted and seven managed con-servatively. All iNPH patients had normal static ICP (meanICP) < 18mmHg, which is required for the diagnosis probableiNPH [33]. The iNPH patients responding clinically to CSFdiversion surgery had elevated mean ICP wave amplitudes(n = 20; MWAICP = 5.8 mmHg), as compared with the nineiNPH patients managed conservatively or without clinical re-sponse to surgery (MWAICP = 3.5 mmHg; P < 0.001; inde-pendent samples t test).
The intracranial aortic amplitude correlation fordifferent levels of mean ICP wave amplitude
The individual average levels of mean ICP wave amplitude(MWAICP), determined from observations every 6 s, are pre-sented in Table 2. With reference to our established thresholds[7], MWAICP was above threshold (> 4.0 mmHg) in 19/29(66%) individuals. At the group level, the average MWAICP
was 5.0 ± 1.8 mmHg (Table 2).The individual average values for intracranial aortic ampli-
tude correlation (IAACAORTIC) over consecutive 4-min periodsare shown in Table 2. The average number of 4-min periodsavailable for analysis for individuals of this cohort was 254 ±64. At the group level, the average intracranial aortic amplitudecorrelation (IAACAORTIC) was 0.28 ± 0.16 (Table 2). While athreshold level for IAACAORTIC has previously not beenestablished, given a threshold of IAACAORTIC > 0.4, 6/29(21%) of individuals were above threshold.
Among the 19 individuals with MWAICP > 4.0 mmHg,IAACAORTIC < 0.4 was observed in 14 (74%) (Table 3).Moreover, among the 10 patients with MWAICP <4.0 mmHg, one individual (10%) had IAACAORTIC > 0.4.Even though MWAICP tended to be higher whenIAACAORTIC increased, this was not significant (P = 0.30;Pearson chi-square test). Defining a threshold ofIAACAORTIC of 0.3 gave no different results (P = 0.68;Pearson chi-square test). We also determined the association
Fig. 2 The intracranial aortic amplitude correlation. a Simultaneouscentral aortic blood pressure (BP; blue waveform) and intracranialpressure (ICP) single-pressure waves (red waveform) wereautomatically identified and the single aortic BP and ICP waveamplitude values determined for every aortic BP/ICP single wave pair.b The Pearson correlation coefficient of corresponding aortic BP/ICPsingle-wave amplitudes (intracranial aortic amplitude correlation,IAACAORTIC) was determined for consecutive 4-min period. In thisexample, the Pearson correlation coefficient was 0.67 (P < 0.001).Notably, this example refers to one particular 4-min period; themagnitude of this IAACAORTIC observation was substantially higherthan observed in the vast majority of 4-min periods
Acta Neurochir
96

Table 2 Individual mean ICP wave amplitude (MWAICP) vs. intracranial aortic amplitude correlation (IAACAORTIC)
Patient Mean ICP wave amplitude (MWAICP) Intracranial aortic amplitude correlation (IAACAORTIC)
6-s observations (N) Average (mmHg) > 4.0 mmHg < 4.0 mmHg 4-min observations (N) Average > 0.4 < 0.4
1 6764 3.2 1 103 0.33 1
2 7819 6.9 1 350 0.12 1
3 8114 3.3 1 325 0.47 1
4 7532 5.1 1 325 0.32 1
5 4810 5.6 1 189 0.22 1
6 5280 5.5 1 238 0.40 1
7 7226 5.0 1 119 0.29 1
8 4610 3.9 1 237 0.31 1
9 4757 3.6 1 237 0.25 1
10 6721 9.4 1 346 0.66 1
11 6343 4.1 1 326 0.21 1
12 5762 3.0 1 233 0.03 1
13 7508 7.4 1 325 0.55 1
14 5191 4.9 1 236 0.18 1
15 3933 3.9 1 194 0.03 1
16 4892 4.8 1 301 0.12 1
17 5704 3.6 1 264 0.37 1
18 4021 4.4 1 208 0.10 1
19 8682 4.1 1 234 0.12 1
20 5681 10.9 1 267 0.16 1
21 4918 5.6 1 222 0.59 1
22 4172 3.9 1 260 0.34 1
23 4136 6.2 1 223 0.15 1
24 8161 5.3 1 357 0.30 1
25 8086 4.6 1 327 0.44 1
26 6350 3.3 1 207 0.22 1
27 6492 6.2 1 244 0.21 1
28 5506 2.9 1 255 0.17 1
29 4487 5.5 1 208 0.39 1
AVG ± STDEV 5988 ± 1439 5.0 ± 1.8 254 ± 64 0.28 ± 0.16
N 19 10 6 23
Table 1 Material of patients withprobable iNPH iNPH patients (N) 29
Age (years) 75 ± 6 years
Gender (F/M) 15/14
BMI (kg/m2) 24.1 ± 3.7
Co-morbidity with arterial hypertension and/or diabetes mellitus (N) 11
Symptom duration (years) 2.5 ± 2.2
Severity of iNPH symptoms (iNPH grading scalea; median, ranges) 10 (7, 13)
Treatment
CSF diversion surgery/no surgery (N) 22/7
Response to CSF diversion surgery
Positive clinical response (Change in an iNPH grading scalea > 1; N) 20
No positive clinical response (N) 2
a iNPH grading scale, ref. Eide and Sorteberg, 2010. Continuous data presented as average ± standard deviation
Acta Neurochir
97

between individual average levels of IAACAORTIC andMWAICP that was non-significant (Fig. 3).
The intracranial aortic amplitude correlation versussystemic hemodynamic variables
The intracranial aortic amplitude correlations (IAACAORTIC)present in Table 2 were assessed for various levels of the sys-temically measured hemodynamic variables. Since theIAACAORTIC is an index derived from a correlation coefficient,we decided to assess categories of the systemic hemodynamicvariables. The correlation IAACAORTIC was significantlyhigher in the group with systemic vascular resistance (SVR)above 1600, compared to the group with SVR in the range1200–1600 dynes/s/cm5. However, the degree of correlationwas not different for other levels of the systemic hemodynamicvariables. Figure 4 presents average values of IAACAORTIC forvarious levels of CO (Fig. 4a), SVR (Fig. 4b), SV (Fig. 4c), CI(Fig. 4d), mean arterial BP (Fig. 4e), and HR (Fig. 4f).
The intracranial aortic amplitude correlation versuspatient characteristics
It could be expected that patient characteristics substantiallymodify the intracranial aortic amplitude correlation. However,as shown in Fig. 5, we found no difference in IAACAORTIC forvarious categories of age (Fig. 5a), BMI (Fig. 5b), duration of
disease (Fig. 5c), or presence of co-morbidity (i.e., arterialhypertension and/or diabetes mellitus; Fig. 5d). Another pointworth investigating is whether IAACAORTIC is dependent onthe clinical response to CSF diversion (shunt) surgery. Wefound no evidence that neither shunt response (Fig. 6a) northe degree of shunt response (Fig. 6b) was related to the levelof IAACAORTIC in this study.
Discussion
The main observation was a rather low degree of correlationbetween intracranial and aortic pressure amplitudes at thegroup level (IAACAORTIC average of 0.28 ± 0.16), though ahigher degree of correlation (> 0.4) was seen in about 1/5iNPH patients. Moreover, the correlation was hardly affectedby systemic hemodynamic variables, except for in a subgroupwith increased systemic vascular resistance.
The presently reported elevatedmean ICPwave amplitudesin iNPH patients responding favorably to CSF diversion sur-gery confirm previous clinical experience from larger iNPHpatient cohorts [7, 8].
In the past, the relationship between radial arterial BP andICP pressure signals has been studied extensively in the fre-quency domain and been referred to as transfer function orsystems analysis [27, 28]. These studies were interpreted toprovide evidence that loss of vasomotor tone of the precapillaryvessels changed the radial arterial BP to ICP transmission into apassive and linear pressure transmission [28, 30, 31]. As loss ofvasomotor tone is an indication of impaired autoregulation, thisimplies that the physical mechanisms that dampen parts of thefrequency spectrum are reduced or diminished when autoregu-lation is reduced. As a result, the correlation between meanradial arterial BP and mean ICP was established as a surrogatemarker of intracranial pressure autoregulation [36]. When auto-regulation is impaired, the physical mechanisms dampen less,and the correlation increases.While comparingmean levels, thecorrelation is denoted the cerebrovascular Pressure-Reactivityindex (PRx). A similar index exists for the correlation betweensingle-pressure wave amplitudes of ICP and radial arterial BP[1, 11].
The current study explored a comparable concept to thatexplained in the previous work [27, 28], but differs from pre-vious studies by utilizing the central aortic BP waveform forthe first time. A limitation with the studies utilizing radial
Fig. 3 Association between intracranial aortic amplitude correlation andthe level of mean ICP wave amplitude. The IAACAORTIC is plotted fordifferent levels of MWAICP, including presentation of the fit line and thePearson correlation coefficient (R) with P value
Table 3 Number of individualswith MWAICP/IAACAORTIC
combinations above or belowthresholds
MWAICP (mean ICP wave amplitude)
> 4.0 mmHg < 4.0 mmHg
IAACAORTIC (intracranial aortic amplitude correlation) > 0.4 5 1
< 0.4 14 9
P = 0.30 (Pearson chi-square test)
Acta Neurochir
98
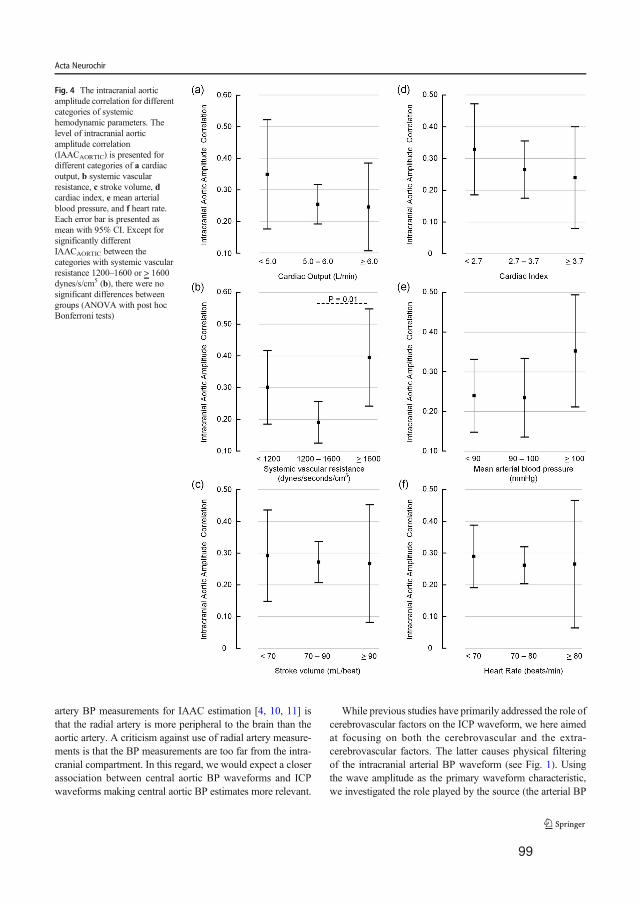
artery BP measurements for IAAC estimation [4, 10, 11] isthat the radial artery is more peripheral to the brain than theaortic artery. A criticism against use of radial artery measure-ments is that the BP measurements are too far from the intra-cranial compartment. In this regard, we would expect a closerassociation between central aortic BP waveforms and ICPwaveforms making central aortic BP estimates more relevant.
While previous studies have primarily addressed the role ofcerebrovascular factors on the ICP waveform, we here aimedat focusing on both the cerebrovascular and the extra-cerebrovascular factors. The latter causes physical filteringof the intracranial arterial BP waveform (see Fig. 1). Usingthe wave amplitude as the primary waveform characteristic,we investigated the role played by the source (the arterial BP
Fig. 4 The intracranial aorticamplitude correlation for differentcategories of systemichemodynamic parameters. Thelevel of intracranial aorticamplitude correlation(IAACAORTIC) is presented fordifferent categories of a cardiacoutput, b systemic vascularresistance, c stroke volume, dcardiac index, e mean arterialblood pressure, and f heart rate.Each error bar is presented asmean with 95% CI. Except forsignificantly differentIAACAORTIC between thecategories with systemic vascularresistance 1200–1600 or > 1600dynes/s/cm5 (b), there were nosignificant differences betweengroups (ANOVA with post hocBonferroni tests)
Acta Neurochir
99

waveform) and the filter (the intracranial constituents).Intracranial aortic amplitude correlation values approaching0 indicate low degree of association, indicating that the ICPwaveform is less impacted by vascular factors (preservedautoregulation) and that is primarily determined by extra-cerebrovascular factors (i.e., alterations in the brain andCSF). Correlation values approaching + 1, on the other hand,implies a direct association between alterations in arterial BPand ICP, which suggest a more extensive role of vascularfactors such as impaired pressure autoregulation and alteredcerebral blood flow.
There are presently no established threshold values forwhich intracranial aortic amplitude correlation values repre-sent an upper threshold value. We would expect this correla-tion to be higher than previously reported correlation levelsthat were based on peripheral arterial BP measurements. Incomparison, despite the general agreement that the traditionalPRx and IAAC indices of cerebrovascular pressure-reactivitycan be looked upon as surrogate markers of intracranial pres-sure autoregulation, the threshold levels for impairment/notimpairment have not been defined. A clinical study showedthat the outcome seems to worsen when PRx remained above
0.2–0.3 [39] among a cohort of individuals with traumaticbrain injury. A different study reported that average valuesof amplitude correlation above 0.2 during week 1 after a sub-arachnoid hemorrhage was associated with worse outcome[11]. The thresholds for impaired autocorrelation are therebyclearly in the lower part of the spectrum.
In the present study, the average correlation between ICP andcentral aortic BP amplitudes was low in our cohort(IAACAORTIC 0.28 ± 0.16) and hardly influenced by the system-ic hemodynamic variables. However, in 6/29 of the patients(21%), the average correlation IAACAORTIC was above 0.40.This might indicate that cerebrovascular factors play a dominat-ing role in determining the ICP wave amplitude level in thissubgroup. The cerebrovascular factors may be impaired cerebralpressure autoregulation as well as cerebrovascular disease thattogether affect cerebral blood flow and thereby the ICP waveamplitudes. Cardiovascular risk factors are more prevalent iniNPH; the prevalence of arterial hypertension and diabetes isincreased in patients with iNPH [5]. This fits well with ourfindings of increased correlation IAACAORTIC for a subgroupwith high systemic vascular resistance. Another aspect is that BPwaveforms change with age. Notably, iNPH is a disease of the
Fig. 5 The intracranial aorticamplitude correlation for differentcategories of patientcharacteristics. The level ofintracranial aortic amplitudecorrelation (IAACAORTIC) ispresented for different categoriesof patient data, including a age, bbody mass index (BMI), cduration of disease, and dpresence of co-morbidity (i.e.,arterial hypertension and/ordiabetes mellitus). Each error baris presented as mean with 95%CI. There were no significantdifferences between groups(ANOVA with post hocBonferroni tests)
Acta Neurochir
100

elderly. Elevated ICP wave amplitudes in these individualscould be an age phenomenon. In line with this assumption, astudy by Lloyd et al. [22] reported an age-dependent change in
the intracranial arterial waveform that corresponded well withthe arterial wall stiffening seen with increased age. However, wefound no increase in IAACAORTIC with increasing age in ourcohort. If the intracranial arterial BP waveform was a decisivefactor for pulsatile ICP, we would, therefore, expect an age-dependent IAACAORTIC, as the amplitude is the major wave-form characteristic.
Among the present 19 patients with ICP wave amplitudesabove the threshold (MWAICP > 4.0 mmHg), 5/19 individuals(26%) also presented with IAACAORTIC indices above 0.4.According to our model, the levels of ICP wave amplitudesin this subgroup might be partly affected by cerebrovascularfactors such as impaired autoregulation. However, in the ma-jority of the patients with iNPH, the levels of ICP wave am-plitudes seemed to be primarily determined by extra-cerebrovascular factors. Accordingly, in 74% of iNPH indi-viduals, the increased ICP wave amplitudes were accompa-nied with IAACAORTIC below 0.4. Moreover, at the grouplevel, the intracranial aortic amplitude correlation was not dif-ferent for various levels of mean ICP wave amplitude (Fig. 3).On this background, we find it difficult to explain elevatedICP wave amplitudes by altered intracranial arterial BP am-plitudes and suggest it is necessary to look at other possiblecauses of elevated pulsatile ICP in the majority of iNPH pa-tients. In this regard, the recently described glymphatic systemfor transport of fluid and solutes in the central nervous system[15] could be particularly relevant. The glymphatic systemmay play a critical role in the brain’s ability to remove toxicmetabolic waste products [32], and glymphatic magnetic res-onance imaging (gMRI) gave evidence of impairedglymphatic function in iNPH patients [6, 34]. In rodents, re-duced arterial pulsations, such as seen in arterial hypertension,were associated with hampered antegrade transport of fluidand solutes along the blood vessels [24]. Likewise, we hy-pothesize that unfavorable properties of the extra-cerebrovascular compartment may cause restriction of intra-cranial arterial BP pulsations and result in impairedglymphatic circulation [6]. In histopathological studies ofbrain tissue specimens of iNPH subjects, astrogliosis has beenfound, which may induce stiffening of the brain, as well as aloss of perivascular water channels aquaporin-4, which mayhamper glymphatic circulation [13]. Accordingly, processes atthe glia-vascular interface may be extra-cerebrovascular fac-tors responsible for alterations in pulsatile ICP. Future studiesaddressing disease processes affecting the extra-cerebrovascular compartment in iNPH may lay the basis formedical treatment of this dementia disease.
Limitations
The present approach aiming at differentiation between cere-brovascular and extra-cerebrovascular factors represents a
Fig. 6 The intracranial aortic amplitude correlation for differentcategories of clinical response to CSF diversion surgery. The level ofintracranial aortic amplitude correlation (IAACAORTIC) is presented fora the sub-groups of individuals with either no positive clinical response ora positive clinical response to CSF diversion surgery, and b for sub-groups with different degree of clinical response to CSF diversion sur-gery. Each error bar is presented as mean with 95% CI. There were nosignificant differences between groups (ANOVA with post hocBonferroni tests, and revealed)
Acta Neurochir
101

simplification, as these factors interact in vivo. Moreover, thecerebrovascular factors incorporate several variables such ascerebral blood flow changes, vascular wall alterations, andcerebrovascular tone-related variations in autoregulation.Likewise, the extra-cerebrovascular factors may involve vari-ous alterations in the brain parenchyma and its interaction withCSF. Nevertheless, the study of complex physiological mech-anisms requires simplification. In this regard, the differentia-tion between cerebrovascular and extra-cerebrovascular fac-tors seems one useful approach.
The previous studies examining the moving correlationbetween ICP and arterial BP waveform amplitudes exclusive-ly utilized peripheral arterial BPmeasurements, typically fromthe radial artery [4, 9, 10]. We hypothesized that central aorticBP estimates are better for this purpose. It should be noted,however, that despite the thorough validation, the central aor-tic BP waveforms used here are indeed estimates. They there-by do provide an additional source of uncertainty in the anal-ysis and are not the perfect proxy for intracranial arterial BPwaveforms. The SphygmoCor systems extensive validationstudy, however, does provide some reassurance of the validityof the estimates [12]. A preliminary study showing a highersimilarity between ICP waveforms and central aortic BPwaveforms compared to radial arterial BP waveforms furthersubstantiates our observations [18]. Various other epidemio-logical [21, 35] and clinical studies [23, 37] using theSphygmoCor system supports the same conclusion.
Conclusions
In about 1/5 iNPH patients of this study, the intracranial aorticamplitude correlation (IAACAORTIC) was rather high (averagePearson correlation coefficient > 0.4), suggesting that cerebro-vascular factors to some extent may affect the ICP wave am-plitudes in a subset of patients. However, in 14/19 (74%)iNPH patients with elevated ICP wave amplitudes, the intra-cranial aortic amplitude correlation was low, indicating thatthe ICP pulse amplitude in most iNPH patients is independentof central vascular excitation, ergo it is modulated by localcerebrospinal physiology. In support of this assumption, theintracranial aortic amplitude correlation was not related tomost systemic hemodynamic variables. An exception wasfound for a subgroup of the patients with high systemic vas-cular resistance, where there was a correlation.
Acknowledgments The authors thank AtCorMedical Pty Ltd. (WestRyde, Australia) for estimating the central aortic blood pressure wave-forms from the radial artery blood pressure waveforms using theSphygmoCor system.
Funding information Open Access funding provided by University ofOslo (incl Oslo University Hospital). Health South-East, Norway, pro-vided financial support in the form of grant 2016032.
Compliance with ethical standards
Disclaimer The sponsor had no role in the design or conduct of thisresearch.
Conflict of interest PKE has a financial interest in the software company(dPCom AS, Oslo) manufacturing the software (Sensometrics Software)used for analysis of the pressure recordings. KBE and PKE certify thatthey have no affiliations with or involvement in any organization or entitywith any financial interest (such as honoraria; educational grants; partic-ipation in speakers’ bureaus; membership, employment, consultancies,stock ownership, or other equity interest; and expert testimony orpatent-licensing arrangements), or non-financial interest (such as personalor professional relationships, affiliations, knowledge or beliefs) in thesubject matter or materials discussed in this manuscript.
Ethical approval The pressure recordings used in this study were re-trieved from a study approved by the Regional Ethical Committee ofHealth Region South-East in Norway (S-07362b) and by Rikshospitalet(07/5870). Informed consent was obtained from all individual participantsincluded in the study. All procedures performed in studies involvinghuman participants were in accordance with the ethical standards of theinstitutional and/or national research committee (name of institute/com-mittee) and with the 1964 Helsinki declaration and its later amendmentsor comparable ethical standards.
Open Access This article is licensed under a Creative CommonsAttribution 4.0 International License, which permits use, sharing, adap-tation, distribution and reproduction in any medium or format, as long asyou give appropriate credit to the original author(s) and the source, pro-vide a link to the Creative Commons licence, and indicate if changes weremade. The images or other third party material in this article are includedin the article's Creative Commons licence, unless indicated otherwise in acredit line to the material. If material is not included in the article'sCreative Commons licence and your intended use is not permitted bystatutory regulation or exceeds the permitted use, you will need to obtainpermission directly from the copyright holder. To view a copy of thislicence, visit http://creativecommons.org/licenses/by/4.0/.
References
1. Aries MJ, Czosnyka M, Budohoski KP, Kolias AG, RadolovichDK, Lavinio A, Pickard JD, Smielewski P (2012) Continuous mon-itoring of cerebrovascular reactivity using pulse waveform of intra-cranial pressure. Neurocrit Care 17:67–76
2. Cecconi M, Dawson D, Grounds RM, Rhodes A (2009) Lithiumdilution cardiac output measurement in the critically ill patient:determination of precision of the technique. Intensive Care Med35:498–504
3. Ding F-H, FanW-X, Zhang R-Y, Zhang Q, Li Y,Wang J-G (2011)Validation of the noninvasive assessment of central blood pressureby the SphygmoCor and Omron devices against the invasive cath-eter measurement. Am J Hypertens 24:1306–1311
4. Eide PK (2011) Cardiac output in idiopathic normal pressure hy-drocephalus: association with arterial blood pressure and intracra-nial pressure wave amplitudes and outcome of shunt surgery. FluidsBarriers CNS 8:11
5. Eide PK, Pripp AH (2014) Increased prevalence of cardiovasculardisease in idiopathic normal pressure hydrocephalus patients com-pared to a population-based cohort from the HUNT3 survey. FluidsBarriers CNS 11:19
Acta Neurochir
102

6. Eide PK, Ringstad G (2019) Delayed clearance of cerebrospinalfluid tracer from entorhinal cortex in idiopathic normal pressurehydrocephalus: a glymphatic magnetic resonance imaging study. JCereb Blood Flow Metab 39:1355–1368
7. Eide PK, SortebergW (2010) Diagnostic intracranial pressure mon-itoring and surgical management in idiopathic normal pressure hy-drocephalus: a 6-year review of 214 patients. Neurosurgery 66:80–91
8. Eide PK, Sorteberg W (2016) Outcome of surgery for idiopathicnormal pressure hydrocephalus: role of preoperative static and pul-satile intracranial pressure. World Neurosurg 86:186–193.e181
9. Eide PK, Czosnyka M, Sorteberg W, Pickard JD, Smielewski P(2007) Association between intracranial, arterial pulse pressure am-plitudes and cerebral autoregulation in head injury patients. NeurolRes 29:578–582
10. Eide PK, Park EH, Madsen JR (2010) Arterial blood pressure vsintracranial pressure in normal pressure hydrocephalus. ActaNeurol Scand 122:262–269
11. Eide PK, Sorteberg A, Bentsen G, Marthinsen PB, Stubhaug A,Sorteberg W (2012) Pressure-derived versus pressure waveamplitude-derived indices of cerebrovascular pressure reactivity inrelation to early clinical state and 12-month outcome followinganeurysmal subarachnoid hemorrhage. J Neurosurg 116:961–971
12. Gallagher D, Adji A, O'Rourke MF (2004) Validation of the trans-fer function technique for generating central from peripheral upperlimb pressure waveform. Am J Hypertens 17:1059–1067
13. Hasan-Olive MM, Enger R, Hansson HA, Nagelhus EA, Eide PK(2019) Loss of perivascular aquaporin-4 in idiopathic normal pres-sure hydrocephalus. Glia 67:91–100
14. Holm S, Eide PK (2009) Impact of sampling rate for time domainanalysis of continuous intracranial pressure (ICP) signals. Med EngPhys 31:601–606
15. Iliff JJ, Wang M, Liao Y, Plogg BA, Peng W, Gundersen GA,Benveniste H, Vates GE, Deane R, Goldman SA, Nagelhus EA,Nedergaard M (2012) A paravascular pathway facilitates CSF flowthrough the brain parenchyma and the clearance of interstitial sol-utes, including amyloid beta. Sci Transl Med 4:147ra111
16. Iliff JJ,WangM, Zeppenfeld DM, VenkataramanA, Plog BA, LiaoY,Deane R, NedergaardM (2013) Cerebral arterial pulsation drivesparavascular CSF-interstitial fluid exchange in the murine brain. JNeurosci 33:18190–18199
17. Karamanoglu M, O'rourke M, Avolio A, Kelly R (1993) An anal-ysis of the relationship between central aortic and peripheral upperlimb pressure waves in man. Eur Heart J 14:160–167
18. Kim MO, Eide PK, O’Rourke MF, Adji A, Avolio AP (2016)Intracranial pressure waveforms are more closely related to centralaortic than radial pressure waveforms: implications for pathophys-iology and therapy Intracranial Pressure and Brain Monitoring XV.Springer, pp 61-64
19. Kurita T, Morita K, Kato S, Kikura M, Horie M, Ikeda K (1997)Comparison of the accuracy of the lithium dilution technique withthe thermodilution technique for measurement of cardiac output. BrJ Anaesth 79:770–775
20. Langesaeter E, Rosseland LA, Stubhaug A (2008) Continuous in-vasive blood pressure and cardiac output monitoring during cesar-ean delivery: a randomized, double-blind comparison of low-doseversus high-dose spinal anesthesia with intravenous phenylephrineor placebo infusion. Anesthesiology 109:856–863
21. Li Y, Staessen JA, Li L, Huang Q, Lu L, Wang J (2008) Referencevalues for the arterial pulse wave in Chinese. Am J Hypertens 21:668–673
22. Lloyd RA, Stoodley MA, Fletcher DF, Bilston LE (2019) Theeffects of variation in the arterial pulse waveform on perivascularflow. J Biomech 90:65–70
23. McEniery CM, Yasmin MDB, Munnery M, Wallace SM, RoweCV, Cockcroft JR, Wilkinson IB (2008) Central pressure: variabil-ity and impact of cardiovascular risk factors: the Anglo-Cardiffcollaborative trial II. Hypertension 51:1476–1482
24. Mestre H, Tithof J, Du T, SongW, PengW, Sweeney AM, OlvedaG, Thomas JH, Nedergaard M, Kelley DH (2018) Flow of cerebro-spinal fluid is driven by arterial pulsations and is reduced in hyper-tension. Nat Commun 9:4878
25. Pauca AL, O’Rourke MF, Kon ND (2001) Prospective evaluationof a method for estimating ascending aortic pressure from the radialartery pressure waveform. Hypertension 38:932–937
26. Pearse RM, IkramK, Barry J (2004) Equipment review: an apprais-al of the LiDCO plusmethod ofmeasuring cardiac output. Crit Care8:190–195
27. Piper IR, Miller JD, Dearden NM, Leggate JR, Robertson I (1990)Systems analysis of cerebrovascular pressure transmission: an ob-servational study in head-injured patients. J Neurosurg 73:871–880
28. Piper IR, Chan KH, Whittle IR, Miller JD (1993) An experimentalstudy of cerebrovascular resistance, pressure transmission, andcraniospinal compliance. Neurosurgery 32:805–815 discussion815-806
29. Pittman J, Bar-Yosef S, SumPing J, Sherwood M, Mark J (2005)Continuous cardiac output monitoring with pulse contour analysis:a comparison with lithium indicator dilution cardiac output mea-surement. Crit Care Med 33:2015–2021
30. Portnoy HD, Chopp M, Branch C, Shannon MB (1982)Cerebrospinal fluid pulse waveform as an indicator of cerebralautoregulation. J Neurosurg 56:666–678
31. Portnoy HD, ChoppM, Branch C (1983) Hydraulic model of myo-genic autoregulation and the cerebrovascular bed: the effects ofaltering systemic arterial pressure. Neurosurgery 13:482–498
32. Rasmussen MK, Mestre H, Nedergaard M (2018) The glymphaticpathway in neurological disorders. Lancet Neurol 17:1016–1024
33. Relkin N, Marmarou A, Klinge P, Bergsneider M, Black PM(2005) Diagnosing idiopathic normal-pressure hydrocephalus.Neurosurgery 57:S4–S16 discussion ii-v
34. Ringstad G, Vatnehol SAS, Eide PK (2017) Glymphatic MRI inidiopathic normal pressure hydrocephalus. Brain 140:2691–2705
35. Roman MJ, Devereux RB, Kizer JR, Lee ET, Galloway JM, Ali T,Umans JG, Howard BV (2007) Central pressure more stronglyrelates to vascular disease and outcome than does brachial pressure:the strong heart study. Hypertension 50:197–203
36. Steiner LA, Coles JP, Johnston AJ, Chatfield DA, Smielewski P,Fryer TD, Aigbirhio FI, Clark JC, Pickard JD, Menon DK,Czosnyka M (2003) Assessment of cerebrovascular autoregulationin head-injured patients: a validation study. Stroke 34:2404–2409
37. Williams B, Lacy PS, Thom SM, Cruickshank K, Stanton A,Collier D, Hughes AD, Thurston H, O'Rourke M (2006)Differential impact of blood pressure-lowering drugs on centralaortic pressure and clinical outcomes: principal results of the con-duit artery function evaluation (CAFE) study. Circulation 113:1213–1225
38. Zong W, Heldt T, Moody G, Mark R (2003) An open-source algo-rithm to detect onset of arterial blood pressure pulses Computers inCardiology, 2003. IEEE, pp 259-262
39. Zweifel C, Lavinio A, Steiner LA, Radolovich D, Smielewski P,Timofeev I, Hiler M, Balestreri M, Kirkpatrick PJ, Pickard JD,Hutchinson P, Czosnyka M (2008) Continuous monitoring of cere-brovascular pressure reactivity in patients with head injury.Neurosurg Focus 25:E2
Publisher’s note Springer Nature remains neutral with regard to jurisdic-tional claims in published maps and institutional affiliations.
Acta Neurochir
103


Appendices

Appendix A
Acronyms
ABP Arterial Blood PressureAMP Mean peak to peak ICP amplitudeBP Blood PressureCA Cochlear AqueductCBF Cerebral Blood FlowCBFV Cerebral Blood Flow VelocityCI Cardiac IndexCNS Central Nervous SystemCO Cardiac OutputCPP Cerebral Perfusion PressureCSF Cerebrospinal FluidCT Computed TomographyCVR Cerebrovascular ResistanceIAAC Intracranial Arterial Amplitude CorrelationICC Intracranial complianceICP Intracranial PressureICU Intensive Care UnitIIH Idiopathic intracranial hypertensioniNPH Idiopathic Normal Pressure HydrocephalusLP Lumbar PuncturenICP Noninvasive ICPMAP Mean Arterial PressureMRI Magnetic Resonance ImagingMWA Mean Wave AmplitudeNPH Normal Pressure HydrocephalusOUH Oslo University HospitalONSD Optic Neve Shear DiameterPRx Pressure Reactivity indexRAP Correlation Amplitude PressureSAH Subarachnoid hemorrhagesNPH Secondary Normal Pressure HydrocephalusSV Stroke VolumeSVR Systemic Vascular ResistanceTBI Traumatic Brain InjuryTCA Transcranial AcousticTCD Transcranial DopplerTMP Tympanic membrane pressureTOF Time of Flight
107
Related Documents