Journals Library DOI 10.3310/hta25560 Non-invasive imaging software to assess the functional significance of coronary stenoses: a systematic review and economic evaluation Ana Duarte, Alexis Llewellyn, Ruth Walker, Laetitia Schmitt, Kath Wright, Simon Walker, Claire Rothery and Mark Simmonds Health Technology Assessment Volume 25• Issue 56 • September 2021 ISSN 1366-5278

Welcome message from author
This document is posted to help you gain knowledge. Please leave a comment to let me know what you think about it! Share it to your friends and learn new things together.
Transcript
Journals Library
DOI 10.3310/hta25560
Non-invasive imaging software to assess the functional significance of coronary stenoses: a systematic review and economic evaluation Ana Duarte, Alexis Llewellyn, Ruth Walker, Laetitia Schmitt, Kath Wright, Simon Walker, Claire Rothery and Mark Simmonds
Health Technology AssessmentVolume 25• Issue 56 • September 2021
ISSN 1366-5278

Non-invasive imaging software to assess thefunctional significance of coronary stenoses:a systematic review and economic evaluation
Ana Duarte ,1 Alexis Llewellyn ,2 Ruth Walker ,2
Laetitia Schmitt ,1 Kath Wright ,2 Simon Walker ,1
Claire Rothery 1 and Mark Simmonds 2*
1Centre for Health Economics, University of York, York, UK2Centre for Reviews and Dissemination, University of York, York, UK
*Corresponding author
Declared competing interests of authors: Simon Walker reports grants from the NIHR Evaluation,Trials and Studies Coordinating Centre (NETSCC) Production of Technology Assessment Reviewsduring the conduct of the study.
Published September 2021DOI: 10.3310/hta25560
This report should be referenced as follows:
Duarte A, Llewellyn A, Walker R, Schmitt L, Wright K, Walker S, et al. Non-invasive imaging
software to assess the functional significance of coronary stenoses: a systematic review and
economic evaluation. Health Technol Assess 2021;25(56).
Health Technology Assessment is indexed and abstracted in Index Medicus/MEDLINE, Excerpta
Medica/EMBASE, Science Citation Index Expanded (SciSearch®) and Current Contents®/
Clinical Medicine.

Health Technology Assessment NICE TAR and DAR
ISSN 1366-5278 (Print)
ISSN 2046-4924 (Online)
Impact factor: 4.014
Health Technology Assessment is indexed in MEDLINE, CINAHL, EMBASE, the Cochrane Library and Clarivate AnalyticsScience Citation Index.
This journal is a member of and subscribes to the principles of the Committee on Publication Ethics (COPE)(www.publicationethics.org/).
Editorial contact: [email protected]
The full HTA archive is freely available to view online at www.journalslibrary.nihr.ac.uk/hta. Print-on-demand copies can bepurchased from the report pages of the NIHR Journals Library website: www.journalslibrary.nihr.ac.uk
Criteria for inclusion in the Health Technology Assessment journalReports are published in Health Technology Assessment (HTA) if (1) they have resulted from work for the HTA programme,and (2) they are of a sufficiently high scientific quality as assessed by the reviewers and editors.
Reviews in Health Technology Assessment are termed ‘systematic’ when the account of the search appraisal and synthesismethods (to minimise biases and random errors) would, in theory, permit the replication of the review by others.
HTA programmeHealth Technology Assessment (HTA) research is undertaken where some evidence already exists to show that a technology canbe effective and this needs to be compared to the current standard intervention to see which works best. Research can evaluateany intervention used in the treatment, prevention or diagnosis of disease, provided the study outcomes lead to findings thathave the potential to be of direct benefit to NHS patients. Technologies in this context mean any method used to promotehealth; prevent and treat disease; and improve rehabilitation or long-term care. They are not confined to new drugs and includeany intervention used in the treatment, prevention or diagnosis of disease.
The journal is indexed in NHS Evidence via its abstracts included in MEDLINE and its Technology Assessment Reports informNational Institute for Health and Care Excellence (NICE) guidance. HTA research is also an important source of evidence forNational Screening Committee (NSC) policy decisions.
This reportThe research reported in this issue of the journal was commissioned and funded by the Evidence Synthesis Programme on behalfof NICE as project number NIHR129932. The contractual start date was in October 2019. The draft report began editorial reviewin July 2020 and was accepted for publication in January 2021. The authors have been wholly responsible for all data collection,analysis and interpretation, and for writing up their work. The HTA editors and publisher have tried to ensure the accuracy of theauthors’ report and would like to thank the reviewers for their constructive comments on the draft document. However, they donot accept liability for damages or losses arising from material published in this report.
This report presents independent research funded by the National Institute for Health Research (NIHR). The views and opinionsexpressed by authors in this publication are those of the authors and do not necessarily reflect those of the NHS, the NIHR,NETSCC, the HTA programme or the Department of Health and Social Care. If there are verbatim quotations included in thispublication the views and opinions expressed by the interviewees are those of the interviewees and do not necessarily reflectthose of the authors, those of the NHS, the NIHR, NETSCC, the HTA programme or the Department of Health and Social Care.
© Queen’s Printer and Controller of HMSO 2021. This work was produced by Duarte et al. under the terms of a commissioningcontract issued by the Secretary of State for Health and Social Care. This issue may be freely reproduced for the purposes ofprivate research and study and extracts (or indeed, the full report) may be included in professional journals provided thatsuitable acknowledgement is made and the reproduction is not associated with any form of advertising. Applications forcommercial reproduction should be addressed to: NIHR Journals Library, National Institute for Health Research, Evaluation,Trials and Studies Coordinating Centre, Alpha House, University of Southampton Science Park, Southampton SO16 7NS, UK.
Published by the NIHR Journals Library (www.journalslibrary.nihr.ac.uk), produced by Prepress Projects Ltd, Perth, Scotland(www.prepress-projects.co.uk).

NIHR Journals Library Editor-in-Chief
NIHR Journals Library Editors
Professor Ken Stein Professor of Public Health, University of Exeter Medical School, UK
Professor John Powell Chair of HTA and EME Editorial Board and Editor-in-Chief of HTA and EME journals.Consultant Clinical Adviser, National Institute for Health and Care Excellence (NICE), UK, and Professor of Digital Health Care, Nuffield Department of Primary Care Health Sciences, University of Oxford, UK
Professor Andrée Le May Chair of NIHR Journals Library Editorial Group (HS&DR, PGfAR, PHR journals) and Editor-in-Chief of HS&DR, PGfAR, PHR journals
Professor Matthias Beck Professor of Management, Cork University Business School, Department of Managementand Marketing, University College Cork, Ireland
Dr Tessa Crilly Director, Crystal Blue Consulting Ltd, UK
Dr Eugenia Cronin Senior Scientific Advisor, Wessex Institute, UK
Dr Peter Davidson Consultant Advisor, Wessex Institute, University of Southampton, UK
Ms Tara Lamont Senior Scientific Adviser (Evidence Use), Wessex Institute, University of Southampton, UK
Dr Catriona McDaid Senior Research Fellow, York Trials Unit, Department of Health Sciences, University of York, UK
Professor William McGuire Professor of Child Health, Hull York Medical School, University of York, UK
Professor Geoffrey Meads Emeritus Professor of Wellbeing Research, University of Winchester, UK
Professor James Raftery Professor of Health Technology Assessment, Wessex Institute, Faculty of Medicine, University of Southampton, UK
Dr Rob Riemsma Reviews Manager, Kleijnen Systematic Reviews Ltd, UK
Professor Helen Roberts Professor of Child Health Research, UCL Great Ormond Street Institute of Child Health, UK
Professor Jonathan Ross Professor of Sexual Health and HIV, University Hospital Birmingham, UK
Professor Helen Snooks Professor of Health Services Research, Institute of Life Science, College of Medicine, Swansea University, UK
Professor Ken Stein Professor of Public Health, University of Exeter Medical School, UK
Professor Jim Thornton Professor of Obstetrics and Gynaecology, Faculty of Medicine and Health Sciences, University of Nottingham, UK
Please visit the website for a list of editors: www.journalslibrary.nihr.ac.uk/about/editors
Editorial contact: [email protected]
NIHR Journals Library www.journalslibrary.nihr.ac.uk
Abstract
Non-invasive imaging software to assess the functionalsignificance of coronary stenoses: a systematic review andeconomic evaluation
Ana Duarte ,1 Alexis Llewellyn ,2 Ruth Walker ,2 Laetitia Schmitt ,1
Kath Wright ,2 Simon Walker ,1 Claire Rothery 1 andMark Simmonds 2*
1Centre for Health Economics, University of York, York, UK2Centre for Reviews and Dissemination, University of York, York, UK
*Corresponding author [email protected]
Background: QAngio® XA 3D/QFR® (three-dimensional/quantitative flow ratio) imaging software(Medis Medical Imaging Systems BV, Leiden, the Netherlands) and CAAS® vFFR® (vessel fractionalflow reserve) imaging software (Pie Medical Imaging BV, Maastricht, the Netherlands) are non-invasivetechnologies to assess the functional significance of coronary stenoses, which can be alternatives toinvasive fractional flow reserve assessment.
Objectives: The objectives were to determine the clinical effectiveness and cost-effectiveness ofQAngio XA 3D/QFR and CAAS vFFR.
Methods: We performed a systematic review of all evidence on QAngio XA 3D/QFR and CAAS vFFR,including diagnostic accuracy, clinical effectiveness, implementation and economic analyses. We searchedMEDLINE and other databases to January 2020 for studies where either technology was used andcompared with fractional flow reserve in patients with intermediate stenosis. The risk of bias wasassessed with quality assessment of diagnostic accuracy studies. Meta-analyses of diagnostic accuracywere performed. Clinical and implementation outcomes were synthesised narratively. A simulation studyinvestigated the clinical impact of using QAngio XA 3D/QFR.We developed a de novo decision-analyticmodel to estimate the cost-effectiveness of QAngio XA 3D/QFR and CAAS vFFR relative to invasivefractional flow reserve or invasive coronary angiography alone. Scenario analyses were undertaken toexplore the robustness of the results to variation in the sources of data used to populate the model andalternative assumptions.
Results: Thirty-nine studies (5440 patients) of QAngio XA 3D/QFR and three studies (500 patients) ofCAAS vFFR were included. QAngio XA 3D/QFR had good diagnostic accuracy to predict functionallysignificant fractional flow reserve (≤ 0.80 cut-off point); contrast-flow quantitative flow ratio had asensitivity of 85% (95% confidence interval 78% to 90%) and a specificity of 91% (95% confidenceinterval 85% to 95%). A total of 95% of quantitative flow ratio measurements were within 0.14 ofthe fractional flow reserve. Data on the diagnostic accuracy of CAAS vFFR were limited and a fullmeta-analysis was not feasible. There were very few data on clinical and implementation outcomes.The simulation found that quantitative flow ratio slightly increased the revascularisation rate whencompared with fractional flow reserve, from 40.2% to 42.0%. Quantitative flow ratio and fractional flowreserve resulted in similar numbers of subsequent coronary events. The base-case cost-effectivenessresults showed that the test strategy with the highest net benefit was invasive coronary angiographywith confirmatory fractional flow reserve. The next best strategies were QAngio XA 3D/QFR and
DOI: 10.3310/hta25560 Health Technology Assessment 2021 Vol. 25 No. 56
© Queen’s Printer and Controller of HMSO 2021. This work was produced by Duarte et al. under the terms of a commissioning contract issued by the Secretary of Statefor Health and Social Care. This issue may be freely reproduced for the purposes of private research and study and extracts (or indeed, the full report) may be included inprofessional journals provided that suitable acknowledgement is made and the reproduction is not associated with any form of advertising. Applications for commercialreproduction should be addressed to: NIHR Journals Library, National Institute for Health Research, Evaluation, Trials and Studies Coordinating Centre, Alpha House,University of Southampton Science Park, Southampton SO16 7NS, UK.
v

CAAS vFFR (without fractional flow reserve). However, the difference in net benefit between thisbest strategy and the next best was small, ranging from 0.007 to 0.012 quality-adjusted life-years(or equivalently £140–240) per patient diagnosed at a cost-effectiveness threshold of £20,000 perquality-adjusted life-year.
Limitations: Diagnostic accuracy evidence on CAAS vFFR, and evidence on the clinical impact ofQAngio XA 3D/QFR, were limited.
Conclusions: Quantitative flow ratio as measured by QAngio XA 3D/QFR has good agreement anddiagnostic accuracy compared with fractional flow reserve and is preferable to standard invasivecoronary angiography alone. It appears to have very similar cost-effectiveness to fractional flowreserve and, therefore, pending further evidence on general clinical benefits and specific subgroups,could be a reasonable alternative. The clinical effectiveness and cost-effectiveness of CAAS vFFR areuncertain. Randomised controlled trial evidence evaluating the effect of quantitative flow ratio onclinical and patient-centred outcomes is needed.
Future work: Studies are required to assess the diagnostic accuracy and clinical feasibility of CAASvFFR. Large ongoing randomised trials will hopefully inform the clinical value of QAngio XA 3D/QFR.
Study registration: This study is registered as PROSPERO CRD42019154575.
Funding: This project was funded by the National Institute for Health Research (NIHR) EvidenceSynthesis programme and will be published in full in Health Technology Assessment; Vol. 25, No. 56.See the NIHR Journals Library website for further project information.
ABSTRACT
NIHR Journals Library www.journalslibrary.nihr.ac.uk
vi
Contents
List of tables xi
List of figures xv
Glossary xix
List of abbreviations xxi
Plain English summary xxiii
Scientific summary xxv
Chapter 1 Background 1Description of the health problem 1Description of the technologies under assessment 1
QAngio XA 3D/QFR 1CAAS vFFR 2Comparators 2
Current service provision and care pathways 3Position of the technology in the diagnostic pathway 4
Chapter 2 Aims and objectives 5
Chapter 3 Assessment of clinical effectiveness 7Methods for reviewing effectiveness 7
Searches 7Contact with study authors and manufacturers and request for individual participant data 7Selection criteria 8Data extraction 9Critical appraisal 10Methods of data synthesis 10Statistical analysis of diagnostic accuracy 10
Quantity and quality of evidence available 14Characteristics of included studies 14Quality of diagnostic accuracy studies 19
Overview of the meta-analyses (QAngio XA 3D/QFR) 21Univariate meta-analyses (QAngio XA 3D/QFR) 21Bivariate meta-analysis (QAngio XA 3D/QFR) 24
Meta-analysis of invasive coronary angiography studies 25Bivariate meta-analysis to compare tests 26
Impact of patient and study characteristics (QAngio XA 3D/QFR) 27Impact of study characteristics 27Impact of patient factors 27
Meta-analyses of data extracted from figures (QAngio XA 3D/QFR) 30Meta-analysis of diagnostic accuracy 31Grey-zone analysis 32Alternative fractional flow reserve thresholds 32Meta-analysis of extracted figure data for two-dimensional invasive coronary angiography 33
DOI: 10.3310/hta25560 Health Technology Assessment 2021 Vol. 25 No. 56
© Queen’s Printer and Controller of HMSO 2021. This work was produced by Duarte et al. under the terms of a commissioning contract issued by the Secretary of Statefor Health and Social Care. This issue may be freely reproduced for the purposes of private research and study and extracts (or indeed, the full report) may be included inprofessional journals provided that suitable acknowledgement is made and the reproduction is not associated with any form of advertising. Applications for commercialreproduction should be addressed to: NIHR Journals Library, National Institute for Health Research, Evaluation, Trials and Studies Coordinating Centre, Alpha House,University of Southampton Science Park, Southampton SO16 7NS, UK.
vii
QAngio XA 3D/QFR: studies not included in meta-analysis 33QAngio XA 3D/QFR: other modes 34
CAAS vFFR 34Bivariate meta-analysis (CAAS vFFR) 36Subgroup and sensitivity analyses (CAAS vFFR) 36
Clinical outcomes 36Morbidity, mortality and major adverse cardiac events 36Subsequent use of invasive pressure wire fractional flow reserve 37Interobserver variability 37Intraobserver variability 38Test failures: rates and reasons 38Other outcomes 39Simulation study of clinical effectiveness 39
Implementation evidence 40Timing of results from data acquisition 40Other outcomes 41Conclusions and recommendations for research from included studies 41
Clinical effectiveness summary and conclusions 42
Chapter 4 Assessment of existing cost-effectiveness evidence 45Methodology of the cost-effectiveness review of QAngio XA 3D/QFR and CAAS vFFR 45
Searches 45Selection process 45
Results of the cost-effectiveness review of QAngio XA 3D/QFR and CAAS vFFR 45Methodology of the review of decision models evaluating invasive coronary angiography 45
Searches 46Study selection 46
Results of the review of decision models evaluating invasive coronary angiography 46Walker et al. 47Genders et al. 49
Conclusions of the assessment of existing cost-effectiveness evidence 52
Chapter 5 Independent economic assessment: York model 53Overview 53Decision problem and population 54Diagnostic strategies 54Model structure 56
Diagnostic model 56Prognostic model 58
Model input parameters 60Patient population 60Setting 61Diagnostic accuracy 62Procedural adverse events 64Risk of major adverse cardiac events and treatment effects of revascularisation 66Other-cause mortality 71Health-related quality of life 71Resource use and costs 74
Analytic methods 78Overview 78Base-case analysis 80Scenario analyses 80Model validation 80
CONTENTS
NIHR Journals Library www.journalslibrary.nihr.ac.uk
viii
Results of the independent economic assessment 80Results of the base-case scenario 80Results of the alternative scenario analyses 85Scenarios 23 and 24: diagnostic-only setting 97
Discussion of the independent economic assessment 98Conclusions from cost-effectiveness results 100
Chapter 6 Discussion 101Statement of principal findings 101
Diagnostic accuracy 101Clinical value and implementation 101Cost-effectiveness 102
Strengths and limitations of the assessment 102Strengths 102Limitations 103
Uncertainties 103
Chapter 7 Conclusions 105Implications for health care 105
Clinical implications 105Economic implications 105
Suggested research priorities 105
Acknowledgements 107
References 109
Appendix 1 Clinical review literature search strategies 125
Appendix 2 Included, excluded and ongoing studies 127
Appendix 3 Risk-of-bias and applicability assessment: Quality Assessment ofDiagnostic Accuracy Studies-2 139
Appendix 4 Further meta-analysis results 147
Appendix 5 Further narrative synthesis results 169
Appendix 6 Further simulation study results 185
Appendix 7 Review of decision models evaluating invasive coronary angiography 187
Appendix 8 Supplemental data used to inform the cost-effectiveness analysis 215
Appendix 9 Deterministic results of the cost-effectiveness analysis 229
DOI: 10.3310/hta25560 Health Technology Assessment 2021 Vol. 25 No. 56
© Queen’s Printer and Controller of HMSO 2021. This work was produced by Duarte et al. under the terms of a commissioning contract issued by the Secretary of Statefor Health and Social Care. This issue may be freely reproduced for the purposes of private research and study and extracts (or indeed, the full report) may be included inprofessional journals provided that suitable acknowledgement is made and the reproduction is not associated with any form of advertising. Applications for commercialreproduction should be addressed to: NIHR Journals Library, National Institute for Health Research, Evaluation, Trials and Studies Coordinating Centre, Alpha House,University of Southampton Science Park, Southampton SO16 7NS, UK.
ix

List of tables
TABLE 1 Characteristics of studies included in the systematic review 15
TABLE 2 Risk of bias and applicability for diagnostic accuracy studies (QUADAS-2) 20
TABLE 3 Results of bivariate meta-analysis 25
TABLE 4 Diagnostic accuracy of included ICA studies 25
TABLE 5 Results of bivariate meta-analysis with comparison of tests 26
TABLE 6 Properties of the CAAS vFFR studies 35
TABLE 7 Bivariate meta-analysis of CAAS vFFR studies 36
TABLE 8 Key results of the simulation study 40
TABLE 9 Diagnostic accuracy estimates for QAngio XA 3D/QFR and CAAS vFFR 63
TABLE 10 The QAngio XA 3D/QFR diagnostic accuracy estimates for strategy 4 63
TABLE 11 Change in EQ-5D utility values from baseline for PCI and OMT by FFRvalue (Nishi et al.) 73
TABLE 12 Optimal medical treatment use and costs in the model 79
TABLE 13 Details of the key elements of the base-case analysis and the variationused in the scenario analysis 81
TABLE 14 Deterministic cost-effectiveness results for base-case scenario 82
TABLE 15 Probabilistic cost-effectiveness results for base-case scenario 83
TABLE 16 Total expected costs and QALYs from the diagnostic and prognostic modelby strategy 83
TABLE 17 Disaggregated costs and QALYs from the diagnostic model by strategy 84
TABLE 18 Diagnostic accuracy results by strategy 84
TABLE 19 Deterministic cost-effectiveness results for scenarios 1 and 2 85
TABLE 20 Deterministic cost-effectiveness results for scenarios 4 and 5 87
TABLE 21 Deterministic cost-effectiveness results for scenario 6: same sensitivityand specificity estimates for vFFR and QFR in strategies 3 and 5 87
TABLE 22 Deterministic cost-effectiveness results for scenario 7: sensitivity andspecificity estimates for ICA based on the meta-analysis by Danad et al. in strategy 1 88
DOI: 10.3310/hta25560 Health Technology Assessment 2021 Vol. 25 No. 56
© Queen’s Printer and Controller of HMSO 2021. This work was produced by Duarte et al. under the terms of a commissioning contract issued by the Secretary of Statefor Health and Social Care. This issue may be freely reproduced for the purposes of private research and study and extracts (or indeed, the full report) may be included inprofessional journals provided that suitable acknowledgement is made and the reproduction is not associated with any form of advertising. Applications for commercialreproduction should be addressed to: NIHR Journals Library, National Institute for Health Research, Evaluation, Trials and Studies Coordinating Centre, Alpha House,University of Southampton Science Park, Southampton SO16 7NS, UK.
xi
TABLE 23 Deterministic cost-effectiveness results for scenario 8: alternativediagnostic threshold (≤ 0.75) for QFR and FFR 89
TABLE 24 Deterministic cost-effectiveness results for scenario 9: alternativedefinition of the grey zone (QFR 0.70–0.90) for strategy 4 89
TABLE 25 Deterministic cost-effectiveness results for scenario 10: the baseline riskof MACE is independent of FFR and diagnostic test results 90
TABLE 26 Deterministic cost-effectiveness results for scenarios 11–13 92
TABLE 27 Deterministic cost-effectiveness results for scenario 14: throughput of100 patients per year for QFR and vFFR 93
TABLE 28 Deterministic cost-effectiveness results for scenarios 15 and 16 93
TABLE 29 Deterministic cost-effectiveness results for scenarios 17 and 18 94
TABLE 30 Deterministic cost-effectiveness results for scenario 19: higher proceduraldisutility associated with FFR 95
TABLE 31 Deterministic cost-effectiveness results for scenarios 20–22 96
TABLE 32 Cost-effectiveness results for scenarios 23 and 24 97
TABLE 33 All studies included in the systematic review of clinical effectiveness 127
TABLE 34 Ongoing studies 129
TABLE 35 Excluded studies from systematic review of clinical effectiveness atfull-text screening stage 131
TABLE 36 Risk-of-bias assessment with justifications 139
TABLE 37 Applicability assessment with justifications 144
TABLE 38 Regression parameters and p-values from metaregression analyses 159
TABLE 39 Comparison of diagnostic accuracy based on figure data and text/table data 164
TABLE 40 Approximate grey-zone thresholds required for sensitivity and specificityof 90% or 95% 167
TABLE 41 Studies included in the meta-analysis 2D ICA 168
TABLE 42 Results of QAngio studies not included in the meta-analysis 170
TABLE 43 Results for alternative QAngio modes (aQFR, iQFR, lQFR, vQFR) 171
TABLE 44 Subgroup analyses from QAngio studies stratified by vessel characteristics 172
TABLE 45 Subgroup analyses from QAngio studies stratified by comorbidities 173
LIST OF TABLES
NIHR Journals Library www.journalslibrary.nihr.ac.uk
xii
TABLE 46 Results from multivariate regression analyses 174
TABLE 47 Patient and vessel exclusions and test failures from diagnosticaccuracy studies 175
TABLE 48 Mortality, morbidity and major cardiovascular outcomes fromQAngio studies 178
TABLE 49 Adenosine and FFR procedures reduced: ‘grey-zone’ strategy models fromincluded studies 179
TABLE 50 Interobserver reliability results 179
TABLE 51 Intraobserver reliability results 180
TABLE 52 Patient and vessel exclusions and test failures from diagnosticaccuracy studies 180
TABLE 53 Timing of QFR results 184
TABLE 54 Results of the search 189
TABLE 55 Summary of excluded studies 190
TABLE 56 Summary of included studies 191
TABLE 57 Annual rates of MACE in Genders et al. 213
TABLE 58 Base-case utility estimates for an individual aged 60 years in Genders et al. 213
TABLE 59 Medication use in Genders et al. 214
TABLE 60 The ICA procedures in the NHS 215
TABLE 61 The FFR/iFR serious procedural complication rates 215
TABLE 62 Summary of RCTs comparing revascularisation in addition to OMT vs.OMT alone in stable CAD 217
TABLE 63 The QALY loss associated with testing and revascularisation procedures 222
TABLE 64 Summary of QAngio XA 3D/QFR costs reported by Medis MedicalImaging Systems BV 222
TABLE 65 QAngio XA 3D/QFR: staff time and costs associated with training andcertification 222
TABLE 66 Costs of QAngio XA 3D/QFR for an annual throughput of 200 patients 222
TABLE 67 Summary of CAAS vFRR software licence, annual maintenance andtraining costs reported by Pie Medical Imaging BV 223
TABLE 68 CAAS vFRR: staff time and costs associated with training 223
DOI: 10.3310/hta25560 Health Technology Assessment 2021 Vol. 25 No. 56
© Queen’s Printer and Controller of HMSO 2021. This work was produced by Duarte et al. under the terms of a commissioning contract issued by the Secretary of Statefor Health and Social Care. This issue may be freely reproduced for the purposes of private research and study and extracts (or indeed, the full report) may be included inprofessional journals provided that suitable acknowledgement is made and the reproduction is not associated with any form of advertising. Applications for commercialreproduction should be addressed to: NIHR Journals Library, National Institute for Health Research, Evaluation, Trials and Studies Coordinating Centre, Alpha House,University of Southampton Science Park, Southampton SO16 7NS, UK.
xiii

TABLE 69 Costs of CAAS vFFR for an annual throughput of 200 patients 223
TABLE 70 Costs of revascularisation in the model 224
TABLE 71 Fractional flow reserve serious procedural complications events 224
TABLE 72 Health state and clinical event costs 225
TABLE 73 Base-case parameters 225
TABLE 74 Summary of deterministic cost-effectiveness results of the base-caseand scenario analyses 229
LIST OF TABLES
NIHR Journals Library www.journalslibrary.nihr.ac.uk
xiv
List of figures
FIGURE 1 Diagnostic pathway for stable angina, including QFR or vFFR 4
FIGURE 2 Study selection process: PRISMA flow diagram 14
FIGURE 3 Sensitivity and specificity estimates for each study, by mode of QFR:(a) cQFR; (b) fQFR; and (c) QFR 22
FIGURE 4 Univariate meta-analysis of sensitivity 23
FIGURE 5 Univariate meta-analysis of specificity 24
FIGURE 6 A ROC plot of bivariate with comparisons of tests 26
FIGURE 7 Fractional flow reserve against QFR for data extracted from figures 30
FIGURE 8 Bland–Altman plot for data extracted from figures 31
FIGURE 9 Extracted data on 2D ICA compared with FFR 33
FIGURE 10 Sensitivity and specificity of CAAS vFFR studies 35
FIGURE 11 Estimated revascularisations per MACE prevented across all simulations 41
FIGURE 12 Strategy 1 of ICA alone, without additional testing to assess thefunctional significance of stenosis 57
FIGURE 13 Strategy 2 of ICA, followed by confirmatory FFR/iFR 57
FIGURE 14 Strategy 3 of ICA with QFR 57
FIGURE 15 Strategy 4 of ICA with QFR, followed by confirmatory FFR/iFR whenQFR is inconclusive 58
FIGURE 16 Strategy 5 of ICA with vFFR 58
FIGURE 17 Schematic of prognostic model 59
FIGURE 18 Meta-analysis of PPVs 147
FIGURE 19 Meta-analysis of NPVs 148
FIGURE 20 Meta-analysis of DORs 149
FIGURE 21 Meta-analysis of AUC 150
FIGURE 22 Meta-analysis of MD between FFR and QFR 151
FIGURE 23 Meta-analysis of correlation between QFR and FFR 152
DOI: 10.3310/hta25560 Health Technology Assessment 2021 Vol. 25 No. 56
© Queen’s Printer and Controller of HMSO 2021. This work was produced by Duarte et al. under the terms of a commissioning contract issued by the Secretary of Statefor Health and Social Care. This issue may be freely reproduced for the purposes of private research and study and extracts (or indeed, the full report) may be included inprofessional journals provided that suitable acknowledgement is made and the reproduction is not associated with any form of advertising. Applications for commercialreproduction should be addressed to: NIHR Journals Library, National Institute for Health Research, Evaluation, Trials and Studies Coordinating Centre, Alpha House,University of Southampton Science Park, Southampton SO16 7NS, UK.
xv
FIGURE 24 Receiver operating characteristic plot of bivariate meta-analysis 153
FIGURE 25 Receiver operating characteristic plot of studies comparing ICA, fQFRand cQFR 153
FIGURE 26 Bivariate meta-analysis by unit of analysis 154
FIGURE 27 Bivariate meta-analysis by study type 154
FIGURE 28 Metaregression of sensitivity, specificity and DOR by proportion withdiabetes: (a) sensitivity; (b) specificity; and (c) log-DOR 155
FIGURE 29 Metaregression of sensitivity, specificity and DOR by proportion withstable CAD: (a) sensitivity; (b) specificity; and (c) log-DOR 156
FIGURE 30 Metaregression of sensitivity, specificity and DOR by proportion withmultivessel disease: (a) sensitivity; (b) specificity; and (c) log-DOR 157
FIGURE 31 Metaregression of sensitivity, specificity and DOR by mean FFR:(a) sensitivity; (b) specificity; and (c) log-DOR 158
FIGURE 32 Sensitivity and specificity by patient subgroups 159
FIGURE 33 Diagnostic odds ratios by patient subgroups 160
FIGURE 34 Bivariate meta-analyses according to QUADAS-2 risk-of-biasclassification: (a) flow; (b) index text; (c) patient selection; and (d) reference standard 160
FIGURE 35 Bivariate meta-analyses according to QUADAS-2 applicabilityclassification: (a) index test; (b) patient selection; and (c) reference standard 161
FIGURE 36 Bivariate meta-analyses according to other factors that might cause bias:(a) blinding; (b) both tests; (c) complete data; (d) online test; (e) same exam; and(f) stable CAD 162
FIGURE 37 Bivariate meta-analysis of extracted figure data 163
FIGURE 38 Fractional flow reserve and QFR data showing QFR grey zone between0.78 and 0.84 165
FIGURE 39 Difference between FFR and QFR values in the grey zone: (a) FN; (b) FP;(c) TN; and (d) TP 165
FIGURE 40 Diagnostic accuracy of QFR with and without using the grey zone 166
FIGURE 41 Diagnostic meta-analysis using FFR/QFR thresholds of 0.75 and 0.80 167
FIGURE 42 Example simulation MACEs 185
FIGURE 43 Simulation study: MACEs prevented 185
FIGURE 44 Simulation study: MACEs not prevented 186
LIST OF FIGURES
NIHR Journals Library www.journalslibrary.nihr.ac.uk
xvi
FIGURE 45 Simulation study: MACEs caused by revascularisation 186
FIGURE 46 Baseline risk of MACE by FFR value in the first year after FFRmeasurement 216
FIGURE 47 Comparison of QAngio XA 3D/QFR and CAAS vFFR test cost at differentthroughputs 224
DOI: 10.3310/hta25560 Health Technology Assessment 2021 Vol. 25 No. 56
© Queen’s Printer and Controller of HMSO 2021. This work was produced by Duarte et al. under the terms of a commissioning contract issued by the Secretary of Statefor Health and Social Care. This issue may be freely reproduced for the purposes of private research and study and extracts (or indeed, the full report) may be included inprofessional journals provided that suitable acknowledgement is made and the reproduction is not associated with any form of advertising. Applications for commercialreproduction should be addressed to: NIHR Journals Library, National Institute for Health Research, Evaluation, Trials and Studies Coordinating Centre, Alpha House,University of Southampton Science Park, Southampton SO16 7NS, UK.
xvii

Glossary
CAAS® vFFR® Non-invasive imaging technology produced by Pie Medical Imaging BV (Maastricht, theNetherlands).
Cost-effectiveness analysis An economic analysis that converts effects into health terms and describesthe costs for additional health gain.
Decision modelling A theoretical construct that allows the comparison of the relationship betweencosts and outcomes of alternative health-care interventions.
False negative Incorrect negative test result: number of diseased persons with a negative test result.
False positive Incorrect positive test result: number of non-diseased persons with a positive test result.
Incremental cost-effectiveness ratio The difference in the mean costs of two interventions in thepopulation of interest divided by the difference in the mean outcomes in the population of interest.
Index test The test whose performance is being evaluated.
Markov model An analytic method particularly suited to modelling repeated events or the progressionof a chronic disease over time.
Meta-analysis A statistical technique used to combine the results of two or more studies and obtain acombined estimate of effect.
Metaregression A statistical technique used to explore the relationship between study characteristicsand study results.
Negative predictive value Proportion of patients who tested negative on the test that do not have thecondition of interest.
Opportunity cost The cost of forgone outcomes that could have been achieved through alternativeinvestments.
Percutaneous coronary intervention A non-surgical procedure that uses a small structure called astent to open up blood vessels in the heart that have been narrowed by plaque build-up.
Positive predictive value Proportion of patients who tested positive on the test that have thecondition of interest.
QAngio® XA 3D/QFR® Non-invasive imaging software produced by Medis Medical Imaging SystemsBV (Leiden, the Netherlands).
Receiver operating characteristic curve A graph that illustrates the trade-offs between sensitivity andspecificity that result from varying the diagnostic threshold.
Reference standard The best currently available diagnostic test against which the index test is compared.
Sensitivity Proportion of people with the target disorder who have a positive test result.
DOI: 10.3310/hta25560 Health Technology Assessment 2021 Vol. 25 No. 56
© Queen’s Printer and Controller of HMSO 2021. This work was produced by Duarte et al. under the terms of a commissioning contract issued by the Secretary of Statefor Health and Social Care. This issue may be freely reproduced for the purposes of private research and study and extracts (or indeed, the full report) may be included inprofessional journals provided that suitable acknowledgement is made and the reproduction is not associated with any form of advertising. Applications for commercialreproduction should be addressed to: NIHR Journals Library, National Institute for Health Research, Evaluation, Trials and Studies Coordinating Centre, Alpha House,University of Southampton Science Park, Southampton SO16 7NS, UK.
xix

Specificity Proportion of people without the target disorder who have a negative test result.
True negative Correct negative test result: number of non-diseased persons with a negative test result.
True positive Correct positive test result: number of diseased persons with a positive test result.
GLOSSARY
NIHR Journals Library www.journalslibrary.nihr.ac.uk
xx
List of abbreviations
2D two-dimensional
3D three-dimensional
ACE angiotensin-converting enzyme
aQFR adenosine–flow quantitative flowratio
AUC area under the curve
BARI 2D Bypass AngioplastyRevascularization Investigation 2Diabetes
BCIS British CardiovascularIntervention Society
BNF British National Formulary
CABG coronary artery bypass graft
CAD coronary artery disease
CCS Canadian CardiovascularSociety
CCTA coronary computed tomographyangiography
CE-MARC Clinical Evaluation of MagneticResonance Imaging in CoronaryHeart Disease
CI confidence interval
CKD chronic kidney disease
cQFR contrast-flow quantitative flowratio
CRD Centre for Reviews andDissemination
DASI Duke Activity Score Index
DEFER DEFERral vs. performanceof percutaneous coronaryintervention of functionallynon-significant coronary stenosis
DOR diagnostic odds ratio
DS diameter stenosis
EAG External Assessment Group
EQ-5D EuroQol-5 Dimensions
EQ-5D-5L EuroQol-5 Dimensions, five-levelversion
EUROPA EUropean trial on Reduction Ofcardiac events with Perindopril instable coronary Artery
FAME Fractional flow reserve versusAngiography for MultivesselEvaluation
FAST Fast Assessment of STenosisseverity
FAVOR Functional Assessment by VirtualOnline Reconstruction
FFR fractional flow reserve
FN false negative
FP false positive
fQFR fixed-flow quantitative flow ratio
GBP Great British pounds
HR hazard ratio
HRG Healthcare Resource Group
HRQoL health-related quality of life
HSROC hierarchical summary receiveroperating characteristic
HTA Health Technology Assessment
ICA invasive coronary angiography
ICC intraclass correlation
ICER incremental cost-effectivenessratio
iFR instantaneous wave-free ratio
IMR index of microcirculatoryresistance
INHB incremental net health benefit
IPD individual participant data
iQFR index quantitative flow ratio
ISCHEMIA International Study of ComparativeHealth Effectiveness With Medicaland Invasive Approaches
JSAP Japanese Stable Angina Pectoris
LAD left anterior descending
lQFR lesion quantitative flow ratio
DOI: 10.3310/hta25560 Health Technology Assessment 2021 Vol. 25 No. 56
© Queen’s Printer and Controller of HMSO 2021. This work was produced by Duarte et al. under the terms of a commissioning contract issued by the Secretary of Statefor Health and Social Care. This issue may be freely reproduced for the purposes of private research and study and extracts (or indeed, the full report) may be included inprofessional journals provided that suitable acknowledgement is made and the reproduction is not associated with any form of advertising. Applications for commercialreproduction should be addressed to: NIHR Journals Library, National Institute for Health Research, Evaluation, Trials and Studies Coordinating Centre, Alpha House,University of Southampton Science Park, Southampton SO16 7NS, UK.
xxi
MACE major adverse cardiac event
MASS II Medicine, Angioplasty, or SurgeryStudy II
MD mean difference
MI myocardial infarction
MPS myocardial perfusion scintigraphy
MR magnetic resonance
NCL non-culprit lesion
NHB net health benefit
NHS EED NHS Economic EvaluationDatabase
NICE National Institute for Health andCare Excellence
NPV negative predictive value
NSTEMI non-ST segment elevationmyocardial infarction
OMT optimal medical treatment
OR odds ratio
ORBITA Objective Randomised BlindedInvestigation with optimal medicalTherapy of Angioplasty in stableangina
PCI percutaneous coronaryintervention
POCE patient-oriented cardiac event
PPV positive predictive value
PRISMA Preferred Reporting Items forSystematic Reviews andMeta-Analyses
PSS Personal Social Services
PSSRU Personal Social Services ResearchUnit
PTCA percutaneous transluminalcoronary angioplasty
QALY quality-adjusted life-year
QCA quantitative coronaryarteriography
QFR quantitative flow ratio
QUADAS-2 Quality Assessment of DiagnosticAccuracy Studies-2
RCT randomised controlled trial
ROC receiver operating characteristic
RR relative risk
SAQ Seattle Angina Questionnaire
SD standard deviation
SE standard error
SF-36 Short Form questionnaire-36 items
SPECT single-photon emission computedtomography
STEMI ST segment elevation myocardialinfarction
TIME Trial of Invasive versus Medicaltherapy in the Elderly
TN true negative
TP true positive
vFFR vessel fractional flow reserve
vQFR vessel quantitative flow ratio
WIFI wire-free invasive functionalimaging
LIST OF ABBREVIATIONS
NIHR Journals Library www.journalslibrary.nihr.ac.uk
xxii
Plain English summary
Stable angina is a type of chest pain; left untreated, it can lead to heart failure, heart attack andsudden death. To avoid these outcomes, patients may require surgical intervention to open
obstructed arteries, known as ‘revascularisation’.
Patients who might need revascularisation undergo tests to identify blocked arteries. The last line oftesting is called invasive fractional flow reserve assessment. This is an invasive measurement of bloodflow that involves inserting a wire into an artery after the patient has taken drugs to dilate the artery.It carries some risks and may have side effects.
Non-invasive tests have been proposed to precede or replace invasive fractional flow reserveassessments. These include QAngio® XA 3D/QFR® (three-dimensional/quantitative flow ratio)(Medis Medical Imaging Systems BV, Leiden, the Netherlands) and CAAS® vFFR® (vessel fractionalflow reserve) (Pie Medical Imaging BV, Maastricht, the Netherlands) imaging software.
This project investigated whether or not these technologies can provide accurate assessments of bloodpressure, and if they are a reasonable use of NHS resources. A thorough review of all the literature onthe technologies was performed. All data were combined and re-analysed to determine whether or notthe tests accurately predict the need for revascularisation and to consider their clinical benefits. Aneconomic analysis was conducted to investigate whether or not using either of these technologies iseconomically viable.
The project found that QAngio XA 3D/QFR can accurately measure blood flow, may be a reasonablealternative to fractional flow reserve, pending more evidence on benefits to patients’ health, and isa reasonable use of NHS resources. The current evidence for CAAS vFFR is too limited to draw anyfirm conclusions.
DOI: 10.3310/hta25560 Health Technology Assessment 2021 Vol. 25 No. 56
© Queen’s Printer and Controller of HMSO 2021. This work was produced by Duarte et al. under the terms of a commissioning contract issued by the Secretary of Statefor Health and Social Care. This issue may be freely reproduced for the purposes of private research and study and extracts (or indeed, the full report) may be included inprofessional journals provided that suitable acknowledgement is made and the reproduction is not associated with any form of advertising. Applications for commercialreproduction should be addressed to: NIHR Journals Library, National Institute for Health Research, Evaluation, Trials and Studies Coordinating Centre, Alpha House,University of Southampton Science Park, Southampton SO16 7NS, UK.
xxiii

Scientific summary
Background
People with stable angina may require intervention known as ‘revascularisation’ to open obstructedarteries. QAngio® XA 3D/QFR® (three-dimensional/quantitative flow ratio) (Medis Medical ImagingSystems BV, Leiden, the Netherlands) and CAAS® vFFR® (vessel fractional flow reserve) (Pie MedicalImaging BV, Maastricht, the Netherlands) imaging software are two non-invasive technologies used asadjuncts to invasive coronary angiography. QAngio XA 3D/QFR measures the quantitative flow ratioand CAAS vFFR measures the vessel fractional flow reserve of coronary lesions to assess the functionalsignificance of coronary stenoses. There is potential for these technologies to partially or wholly replaceinvasive fractional flow reserve assessment as the last-line test to inform revascularisation decisions.
Objectives
This project aimed to evaluate the clinical effectiveness and cost-effectiveness of non-invasiveassessment of the functional significance of coronary stenoses, using QAngio XA 3D/QFR and CAASvFFR imaging software.
Methods
Systematic reviewA systematic review of the diagnostic accuracy, clinical efficacy and practical implementation of QAngioXA 3D/QFR and CAAS vFFR imaging software for assessing the functional significance of coronaryobstructions in people with intermediate coronary stenosis (i.e. stenoses where preceding tests havebeen insufficient to make a revascularisation decision) was conducted.
Comprehensive bibliographic searches, including of MEDLINE and EMBASE™ (Elsevier, Amsterdam,the Netherlands) and supplementary sources, were conducted up to 2 January 2020 for published andunpublished literature.
Diagnostic accuracy and correlation studies in which any version of QAngio XA 3D/QFR or CAAS vFFRwere used, in addition to invasive fractional flow reserve (or instantaneous wave-free ratio) assessmentas a reference standard in the same patients, were included. Empirical studies of quantitative flowratio or vessel fractional flow reserve (with or without invasive fractional flow reserve assessment)that reported relevant clinical outcomes (including morbidity and mortality) or issues relating toimplementation of quantitative flow ratio or vessel fractional flow reserve and their use in clinicalpractice were also eligible. Patients with intermediate stenosis referred for invasive coronaryangiography to assess coronary stenosis and the need for revascularisation were eligible for inclusion.
Two researchers independently screened the titles and abstracts of all reports identified by the bibliographicsearches and of all full-text papers subsequently obtained for assessment. Data extraction and qualityassessment were conducted by at least one researcher and checked by a second. The risk of bias ofdiagnostic accuracy studies was assessed using quality assessment of diagnostic accuracy studies.
For diagnostic accuracy outcomes, bivariate models were fitted to calculate summary estimates ofsensitivity and specificity with 95% confidence intervals using aggregate data and data extracted fromstudy plots. Additional diagnostic accuracy results that could not be pooled in a meta-analysis and
DOI: 10.3310/hta25560 Health Technology Assessment 2021 Vol. 25 No. 56
© Queen’s Printer and Controller of HMSO 2021. This work was produced by Duarte et al. under the terms of a commissioning contract issued by the Secretary of Statefor Health and Social Care. This issue may be freely reproduced for the purposes of private research and study and extracts (or indeed, the full report) may be included inprofessional journals provided that suitable acknowledgement is made and the reproduction is not associated with any form of advertising. Applications for commercialreproduction should be addressed to: NIHR Journals Library, National Institute for Health Research, Evaluation, Trials and Studies Coordinating Centre, Alpha House,University of Southampton Science Park, Southampton SO16 7NS, UK.
xxv
clinical effectiveness and implementation outcomes were synthesised narratively. Data from figuresreported in studies were digitised to simulate the accuracy of a ‘grey-zone’ strategy, whereby confirmatoryfractional flow reserve is performed only in patients with a quantitative flow ratio between 0.78 and 0.84.
Economic analysisCost-effectiveness literature on QAngio XA 3D/QFR and CAAS vFFR was reviewed. The titles andabstracts of all reports identified by the bibliographic searches were screened independently by tworesearchers. A subsequent pragmatic review of existing decision models evaluating invasive coronaryangiography and/or fractional flow reserve/invasive fractional flow reserve was also conducted by oneresearcher, and key findings were summarised narratively.
A decision-analytic model was developed to estimate the cost-effectiveness of QAngio XA 3D/QFRand CAAS vFFR used during invasive coronary angiography for assessing the functional significanceof coronary stenosis in patients with stable angina whose angiograms show intermediate stenosis.Five diagnostic strategies were considered: (1) invasive coronary angiography alone, (2) invasive coronaryangiography followed by confirmatory fractional flow reserve/invasive fractional flow reserve (referencestandard), (3) invasive coronary angiography with quantitative flow ratio, (4) invasive coronaryangiography with quantitative flow ratio, followed by confirmatory fractional flow reserve/invasivefractional flow reserve when quantitative flow ratio is inconclusive, and (5) invasive coronary angiographywith vessel fractional flow reserve.
The decision model had two components: a diagnostic element and a prognostic element. The diagnosticcomponent was used to link the diagnostic accuracy of quantitative flow ratio and vessel fractional flowreserve to short-term costs and consequences [e.g. the impact on the proportion of patients who needrevascularisation (percutaneous or surgical), the proportion of patients who need invasive functionalassessment of stenosis using fractional flow reserve or invasive fractional flow reserve in strategy 4,and adverse event rates and health-related quality of life associated with the diagnostic interventions],whereas the prognostic component was used to link the short-term consequences to longer-term costsand consequences (e.g. the risk of major adverse cardiovascular events including myocardial infarction,sudden cardiac death and need for urgent/unplanned revascularisations) to ensure that differences incosts, life-year gains and quality-adjusted life-years were appropriately quantified over a lifetime horizon.
Results
A total of 41 studies were included in the systematic review, of which 39 (5440 patients) evaluatedQAngio XA 3D/QFR and three (500 patients) assessed CAAS vFFR. Only one study directlycompared QAngio XA 3D/QFR with CAAS vFFR. A total of 17 included studies were reported onlyas conference abstracts.
Most studies included a mix of patients with stable and unstable coronary syndromes. Stenosis severityvaried widely across studies; mean/median fractional flow reserve ranged from 0.75 to 0.88, and meanpercentage diameter stenosis from 37% to 66%. Only seven studies were conducted prospectively, and11 studies (all of QAngio XA 3D/QFR) were rated as being at low risk of bias.
Diagnostic accuracyThe average difference between quantitative flow ratio (measured using QAngio XA 3D/QFR) andfractional flow reserve was 0.01. In 50% of patients, quantitative flow ratio and fractional flow reservediffered by no more than 0.04; in 95% of patients, values differed by no more than 0.14. Thequantitative flow ratio was highly correlated with the fractional flow reserve (r = 0.8).
The QAngio XA 3D/QFR quantitative flow ratio had good diagnostic accuracy to predict fractionalflow reserve (≤ 0.80 cut-off point); contrast-flow quantitative flow ratio had a sensitivity of
SCIENTIFIC SUMMARY
NIHR Journals Library www.journalslibrary.nihr.ac.uk
xxvi
85% (95% confidence interval 78% to 90%) and a specificity of 91% (95% confidence interval 85% to95%); fixed-flow quantitative flow ratio mode had a sensitivity of 82% (95% confidence interval 68% to91%) and a specificity of 89% (95% confidence interval 77% to 95%). Where reported, quantitativeflow ratio had significantly higher diagnostic accuracy than standard invasive coronary angiography.Data on how diagnostic accuracy may vary by key patient characteristics were too limited to drawany firm conclusions.
Using data extracted from figures, simulating a grey-zone strategy, where only patients with a QAngioXA 3D/QFR quantitative flow ratio between 0.78 and 0.84 receive confirmatory fractional flow reserve,improved diagnostic accuracy compared with quantitative flow ratio alone to a sensitivity of 93.1%(95% confidence interval 90.1% to 94.9%) and a specificity of 92.1% (95% confidence interval 88.3% to94.5%). A total of 20.1% patients fell in the grey zone and would receive confirmatory fractional flowreserve. However, only 30.4% of patients with quantitative flow ratio results in the grey zone had resultsthat were discordant with their fractional flow reserve.
Only three retrospective studies of CAAS vFFR were available, limiting the scope for reliable meta-analysis.Only one conference abstract directly compared the diagnostic accuracy of QAngio XA 3D/QFR and CAASvFFR with fractional flow reserve. The abstract reported that QAngio XA 3D/QFR quantitative flow ratiohad a higher overall diagnostic accuracy, with areas under the curve of 0.719 (95% confidence interval0.621 to 0.804) for vessel fractional flow reserve and 0.886 (95% confidence interval 0.807 to 0.940)for contrast-flow quantitative flow ratio.
Clinical effectivenessNo evidence was found on the effectiveness of QAngio XA 3D/QFR on major cardiovascular eventsand death. Three studies that reported clinical outcomes found that QAngio XA 3D/QFR may predictlong-term major cardiovascular adverse events.
A simulation study based on the results of the meta-analysis found that using quantitative flow ratio inplace of fractional flow reserve may slightly increase the number of revascularisations (from 40.2% to42.0%), with a possible small increase in the number of coronary events (an extra one major adversecardiac event per 1000 patients). Using a grey-zone approach of performing a confirmatory fractionalflow reserve where the quantitative flow ratio is close to 0.8 might further increase revascularisationsrates (to 43.2%) but with no impact on incidence of major adverse cardiac events.
Cost-effectivenessNo full cost-effectiveness studies of QAngio XA 3D/QFR or CAAS vFFR were identified by thesystematic review. The pragmatic review identified 21 relevant reports, of which two studies wereselected to inform the conceptualisation of the de novo decision model.
The base-case cost-effectiveness results showed that the test strategy with the highest net benefit(most cost-effective strategy) was invasive coronary angiography followed by confirmatory fractionalflow reserve/instantaneous wave-free ratio (strategy 2), at a cost-effectiveness threshold of £20,000 perquality-adjusted life-year gained. However, the difference in net benefit (i.e. the additional health gainsnet of health losses in the health-care system due to additional costs, expressed in health or monetaryterms) between this strategy and the next best strategies was relatively small at 0.007 quality-adjustedlife-years (or equivalently £140) per patient diagnosed for invasive coronary angiography withquantitative flow ratio (strategy 3), 0.012 quality-adjusted life-years (or equivalently £240) per patientdiagnosed for invasive coronary angiography with quantitative flow ratio, followed by confirmatoryfractional flow reserve/instantaneous wave-free ratio when quantitative flow ratio is inconclusive(strategy 4), and 0.011 quality-adjusted life-years (or equivalently £220) per patient diagnosed forinvasive coronary angiography with vessel fractional flow reserve (strategy 5). The cost-effectivenessresults for strategy 5 must be interpreted with caution because of very limited number of dataavailable from diagnostic accuracy studies of vessel fractional flow reserve.
DOI: 10.3310/hta25560 Health Technology Assessment 2021 Vol. 25 No. 56
© Queen’s Printer and Controller of HMSO 2021. This work was produced by Duarte et al. under the terms of a commissioning contract issued by the Secretary of Statefor Health and Social Care. This issue may be freely reproduced for the purposes of private research and study and extracts (or indeed, the full report) may be included inprofessional journals provided that suitable acknowledgement is made and the reproduction is not associated with any form of advertising. Applications for commercialreproduction should be addressed to: NIHR Journals Library, National Institute for Health Research, Evaluation, Trials and Studies Coordinating Centre, Alpha House,University of Southampton Science Park, Southampton SO16 7NS, UK.
xxvii
Discussion
This review includes a comprehensive systematic review of all the published literature on quantitativeflow ratio as assessed by QAngio XA 3D/QFR and CAAS vFFR and has been conducted followingrecognised guidelines to ensure high quality. The review identified a substantial literature on thediagnostic accuracy of QAngio XA 3D/QFR, so the findings of the analysis of diagnostic accuracy arelikely to be conclusive.
Although there is substantial evidence demonstrating the good diagnostic accuracy of quantitative flowratio assessment using QAngio XA 3D/QFR overall, it remains largely unclear which patient or lesioncharacteristics might significantly affect the diagnostic accuracy of QAngio XA 3D/QFR.
The clinical value of QAngio XA 3D/QFR to support decision-making on revascularisation remainsuncertain, particularly regarding what impact it might have on preventing or causing future coronaryevents, and whether the 0.8 cut-off point or the proposed grey zone are clinically appropriate.However, it appears unlikely that its clinical value or use will differ substantially from widespread useof fractional flow reserve.
The key drivers of cost-effectiveness were (1) the diagnostic sensitivity of test results (rather thanspecificity) because ‘true-positive’ test results translated into higher quality-adjusted life-year gainsthan mismanagement of ‘false-negative’ test results, (2) the procedural quality-adjusted life-year lossassociated with fractional flow reserve/instantaneous wave-free ratio, (3) the magnitude and durationof the quality-adjusted life-year gains associated with revascularisation and (4) the additional costsassociated with confirmatory testing with fractional flow reserve/instantaneous wave-free ratio.
Conclusions
Quantitative flow ratio measured using QAngio XA 3D/QFR has good agreement and diagnostic accuracycompared with fractional flow reserve and is more accurate than standard invasive coronary angiographyfor the evaluation of functionally significant stenoses. The good association between quantitative flowratio and fractional flow reserve, and the high diagnostic accuracy of quantitative flow ratio, suggest that,pending further evidence on clinical benefits, quantitative flow ratio assessment could represent areasonable alternative to invasive fractional flow reserve, particularly where fractional flow reserve isnot available. The cost-effectiveness of QAngio XA 3D/QFR suggests that it is a reasonable use of NHSresources, as it is only marginally less cost-effective than invasive fractional flow reserve assessment.
Evidence on the CAAS vFFR technology was limited to three studies. This prevented any fullmeta-analyses of diagnostic accuracy for CAAS vFFR, or any assessment of its clinical effectiveness.The cost-effectiveness results for CAAS vFFR should be interpreted with caution because of thelimited diagnostic information available.
Recommendations for researchThe substantial existing evidence for diagnostic accuracy of QAngio XA 3D/QFR suggests that furtherstudies of diagnostic accuracy are not required. Large, multicentre prospective studies are required toassess the diagnostic accuracy and clinical feasibility of CAAS vFFR. Ideally these should compareCAAS vFFR with invasive coronary angiography assessment and, if possible, with quantitative flow ratio.
Large ongoing randomised trials will hopefully inform decision-makers of the clinical value ofquantitative flow ratio compared with angiography and fractional flow reserve-guided revascularisation.
SCIENTIFIC SUMMARY
NIHR Journals Library www.journalslibrary.nihr.ac.uk
xxviii

Study registration
This study is registered as PROSPERO CRD42019154575.
Funding
This project was funded by the National Institute for Health Research (NIHR) Evidence Synthesisprogramme and will be published in full in Health Technology Assessment; Vol. 25, No. 56. See the NIHRJournals Library website for further project information.
DOI: 10.3310/hta25560 Health Technology Assessment 2021 Vol. 25 No. 56
© Queen’s Printer and Controller of HMSO 2021. This work was produced by Duarte et al. under the terms of a commissioning contract issued by the Secretary of Statefor Health and Social Care. This issue may be freely reproduced for the purposes of private research and study and extracts (or indeed, the full report) may be included inprofessional journals provided that suitable acknowledgement is made and the reproduction is not associated with any form of advertising. Applications for commercialreproduction should be addressed to: NIHR Journals Library, National Institute for Health Research, Evaluation, Trials and Studies Coordinating Centre, Alpha House,University of Southampton Science Park, Southampton SO16 7NS, UK.
xxix

Chapter 1 Background
Description of the health problem
Stable angina is a type of chest pain caused by insufficient blood supply to the heart, brought on byphysical activity or emotional stress, which goes away with rest. It is the key symptom of coronaryartery disease (CAD), which remains one of the main causes of morbidity and mortality in high-income countries. Complications include unstable angina, heart failure, myocardial infarction (MI) andsudden death.
To alleviate symptoms, patients may receive ‘revascularisation’ to open damaged, obstructed orblocked arteries. This most commonly consists of inserting a small tube or ‘stent’ into the artery tokeep it open and allow blood flow. Patients who might need revascularisation undergo a number oftests to identify blocked arteries, including coronary computed tomography angiography (CCTA) andother non-invasive tests. If these tests are inconclusive, more invasive tests are needed, for exampleinvasive coronary angiography (ICA), where a contrast medium is injected through a catheter into thecoronary arteries and radiographic images (angiograms) are taken.
Angiograms have limited ability to differentiate between arteries with inadequate blood supply(which need revascularisation) and those with adequate supply that do not need treatment. To addressthis, the procedure may be combined with an invasive measurement of blood flow, such as invasivefractional flow reserve (FFR) assessment. During this procedure, the blood flow is measured by insertinga wire into the coronary arteries after the patient has taken drugs to dilate the artery. The procedure isinvasive and, therefore, carries some risks and may have side effects.
The Health Survey for England 2017: Adult Social Care1 reported that the prevalence among adults ofever having ischaemic heart disease (including MI and angina) was 4%. The prevalence was higheramong men (6%) than women (3%) and increased with age (3% in people aged 45–54 years, 16% inpeople aged > 75 years). Prevalence of angina and history of angina among all adults was 3%.
Description of the technologies under assessment
Non-invasive imaging tests have been proposed to precede or replace invasive FFR, by using theexisting angiograms to determine blood flow, without inserting a wire.
QAngio XA 3D/QFRQAngio® XA 3D/QFR® (three-dimensional/quantitative flow ratio) (Medis Medical Imaging Systems BV,Leiden, the Netherlands) imaging software is used to perform quantitative flow ratio (QFR) assessmentof coronary artery obstructions. It is designed to be used with all ICA systems: biplane or monoplane.It uses two standard two-dimensional (2D) angiographic projections, taken at least 25° apart – ideallybetween 35° and 50° apart – to create a three-dimensional (3D) reconstruction of a coronary artery;this shows the QFR values across the artery. QFR is an assessment (by frame count) of the pressure(blood flow velocity) drop over the artery, with a value of 1 representing a normally functioning arterywith no pressure drop. A drop of ≥ 20 mmHg in blood pressure (QFR value of ≤ 0.8) is considered asignificant obstruction where revascularisation should be considered. QAngio XA 3D/QFR softwareis installed on a laptop or workstation that is connected to the ICA system. The Digital Imaging andCommunication in Medicine (DICOM) data from ICA projections are immediately uploaded and viewableon the connected workstation. The total time for data acquisition and analysis is about 4 to 5 minutes(as reported by the company).
DOI: 10.3310/hta25560 Health Technology Assessment 2021 Vol. 25 No. 56
© Queen’s Printer and Controller of HMSO 2021. This work was produced by Duarte et al. under the terms of a commissioning contract issued by the Secretary of Statefor Health and Social Care. This issue may be freely reproduced for the purposes of private research and study and extracts (or indeed, the full report) may be included inprofessional journals provided that suitable acknowledgement is made and the reproduction is not associated with any form of advertising. Applications for commercialreproduction should be addressed to: NIHR Journals Library, National Institute for Health Research, Evaluation, Trials and Studies Coordinating Centre, Alpha House,University of Southampton Science Park, Southampton SO16 7NS, UK.
1
AngioPLUS [Pulse Medical Imaging Technology (Shanghai) Co. Ltd, Shanghai, China] is an equivalentConformité Européenne-marked version marketed in Asia.
The QAngio XA 3D/QFR software offers two different flow models to calculate QFR:
1. fixed-flow quantitative flow ratio (fQFR), using fixed-flow velocity2. contrast-flow quantitative flow ratio (cQFR), using contrast frame count in an angiogram
without hyperaemia.
Fixed-flow quantitative flow ratio is faster to compute, but may be less accurate than cQFR.
Furthermore, the QAngio XA 3D/QFR software provides four different QFR indices along the analysedcoronary segment:
1. vessel quantitative flow ratio (vQFR): the QFR value at the distal location of the analysedvessel segment
2. index quantitative flow ratio (iQFR): a point that can be moved along the QFR pullback curve3. lesion quantitative flow ratio (lQFR): the contribution to the QFR drop by the selected lesion alone4. residual vQFR: an indication of the vQFR, if the selected lesion is resolved.
CAAS vFFRThe CAAS® vFFR® (vessel fractional flow reserve) (Pie Medical Imaging BV, Maastricht, the Netherlands)workflow builds a 3D reconstruction of a coronary artery based on two standard angiograms and assessesthe pressure drop across the stenosis, and quantitative coronary arteriography (QCA) determines a vFFRvalue. It gives both anatomical and functional assessment of the stenosis and can be integrated intocatheter laboratories. According to the company, the total time for analysis is approximately 2 minutesper artery.
All available versions of CAAS (i.e. 8.0, 8.1 and 8.2) use the same algorithm for calculating vFFR. TheCAAS workstation provides various modules (e.g. QCA and left ventricular analysis), and the vFFRmodule can be added to the CAAS workstation. In addition to the vFFR, CAAS vFFR providesmeasurements at the end of the lesion and at a chosen position in the coronary artery.
ComparatorsInvasive coronary angiography may differentiate between arteries with inadequate blood supply(which need revascularisation) and those with adequate supply that do not need treatment.
During an ICA procedure, a coronary diagnostic catheter is inserted into an artery and moved upthe aorta and into the coronary arteries. A special type of dye called contrast medium is injectedthrough the catheter into the coronary artery and angiograms are taken. Although providing valuableinformation on coronary artery anatomy, visual assessment of angiograms taken during ICA may havelimited ability to differentiate between functionally significant (causing inadequate blood supply) andnon-significant (not significantly affecting blood supply) coronary stenoses.
When ICA is inconclusive, it may be combined with the invasive measurement of FFR. In theseprocedures FFR is assessed invasively by advancing a pressure wire towards the stenosis andmeasuring the ratio in pressure between the two sides of the stenosis during maximum blood flow(induced by adenosine infusion). This is associated with risks related to the passage of a guide wire,side effects of adenosine and additional radiation exposure. The invasive FFR measurement is alsoassociated with increased procedural time and costs compared with ICA alone. As an alternative toinvasive FFR, the instantaneous wave-free ratio (iFR) may be used. This also uses inserted pressurewires to assess flow but does not require vasodilator drugs, such as adenosine.
BACKGROUND
NIHR Journals Library www.journalslibrary.nihr.ac.uk
2
Current service provision and care pathways
Patients who experience chest pain and may need revascularisation will be assessed for angina andother cardiovascular conditions. When clinical assessment alone is insufficient for a diagnosis, patientsare referred for a 64-slice (or above) CCTA as the first-line diagnostic test.
Patients may go on to further diagnostic testing. National Institute for Health and Care Excellence (NICE)guidance2 recommends offering non-invasive functional imaging for myocardial ischaemia if a 64-slice (orabove) CCTA has shown CAD of uncertain functional significance, or is non-diagnostic. This could include:
l myocardial perfusion scintigraphy (MPS) with single-photon emission computedtomography (SPECT)
l stress echocardiographyl first-pass contrast-enhanced magnetic resonance (MR) perfusionl MR imaging for stress-induced wall motion abnormalities.
In addition, NICE’s medical technologies guidance3 recommends that HeartFlow FFRCT (HeartFlow, Inc.,Redwood City, CA, USA) should be considered as an option for patients with stable, recent-onset chestpain who are offered 64-slice (or above) CCTA. It provides both functional and anatomical assessmentof coronary arteries and has better diagnostic performance than CCTA alone or other non-invasiveor invasive tests. If these tests are also inconclusive, ICA is offered as a third-line diagnostic tool.
A diagnosis of stable angina is made when clinical symptoms are present and:
l Significant CAD is found during ICA or 64-slice (or above) CCTA. This is usually defined as ≥ 70%diameter stenosis (DS) of at least one major epicardial artery segment, or ≥ 50% DS in the left maincoronary artery.
l Reversible myocardial ischaemia is found during non-invasive functional imaging.
Sometimes ICA is also used to guide treatment strategies for people with a confirmed diagnosis ofstable angina whose symptoms are not satisfactorily controlled with optimal medical treatment (OMT),and so may require revascularisation. ICA may differentiate between arteries with inadequate bloodsupply (which need revascularisation) and those with adequate supply that do not need treatment.When ICA is used to determine the presence and severity of coronary stenosis and it is inconclusive,it may be combined with the invasive measurement of FFR using a pressure wire, as recommended bythe European Society of Cardiology4 and American College of Cardiology.5 Lesions with a FFR of ≤ 0.80are functionally significant and revascularisation may be considered. Should iFR be used, a measure of≤ 0.89 is considered functionally significant.
Invasive coronary angiography is performed either in diagnostic-only ICA laboratories or in interventionalcatheter laboratories as part of the initial stenosis assessment prior to percutaneous coronary intervention(PCI). In diagnostic-only laboratories, patients in whom ICA alone is inconclusive might be referred toan interventional laboratory for a FFR or iFR assessment. In interventional laboratories a FFR or iFRassessment can be performed immediately after ICA, if needed.
The British Cardiovascular Intervention Society (BCIS)’s audit reports that 244,332 ICA procedurestook place in the UK in 2017/18 in NHS and private facilities, with 35,017 procedures performed indiagnostic-only catheter laboratories.
There is substantial regional variation in the diagnostic pathway for stable angina, due in part to theavailability of imaging modalities at each centre, and experience (or preferences) of the cardiologistsreferring for the test. Clinical advisors noted that the pathway recommended by NICE is widelyrecognised as current best practice.
DOI: 10.3310/hta25560 Health Technology Assessment 2021 Vol. 25 No. 56
© Queen’s Printer and Controller of HMSO 2021. This work was produced by Duarte et al. under the terms of a commissioning contract issued by the Secretary of Statefor Health and Social Care. This issue may be freely reproduced for the purposes of private research and study and extracts (or indeed, the full report) may be included inprofessional journals provided that suitable acknowledgement is made and the reproduction is not associated with any form of advertising. Applications for commercialreproduction should be addressed to: NIHR Journals Library, National Institute for Health Research, Evaluation, Trials and Studies Coordinating Centre, Alpha House,University of Southampton Science Park, Southampton SO16 7NS, UK.
3
Position of the technology in the diagnostic pathway
Either QFR or vFFR could potentially replace pressure wire FFR, or iFR, by providing a non-invasivemeans to assess FFR as part of an ICA assessment in people with stable chest pain of recent onset.Visual assessment of angiograms taken during ICA may be limited in its ability to differentiate betweenfunctionally significant (causing inadequate blood supply) and non-significant (not significantly affectingblood supply) coronary stenoses. Alternatively, they may be used as a precursor to invasive FFR, withthe invasive procedure used when QFR or vFFR is inconclusive.
In addition, QFR may be used in other aspects of decision-making, including whether to stent morethan one vessel or to select a stent type or other interventional device for revascularisation.
QAngio XA 3D/QFR and CAAS vFFR could also be used in diagnostic-only laboratories, possiblyreducing the need for referrals to interventional laboratories.
The QAngio XA 3D/QFR instructions recommend the following approach:
l QFR < 0.78 – treat the patient in the catheter laboratoryl QFR > 0.84 – follow the patient medicallyl QFR 0.78–0.84 (grey zone) – verify by invasive FFR measurement.
Following request for clarification, Pie Medical Imaging stated that it recommends the same hybridapproach for CAAS vFFR.
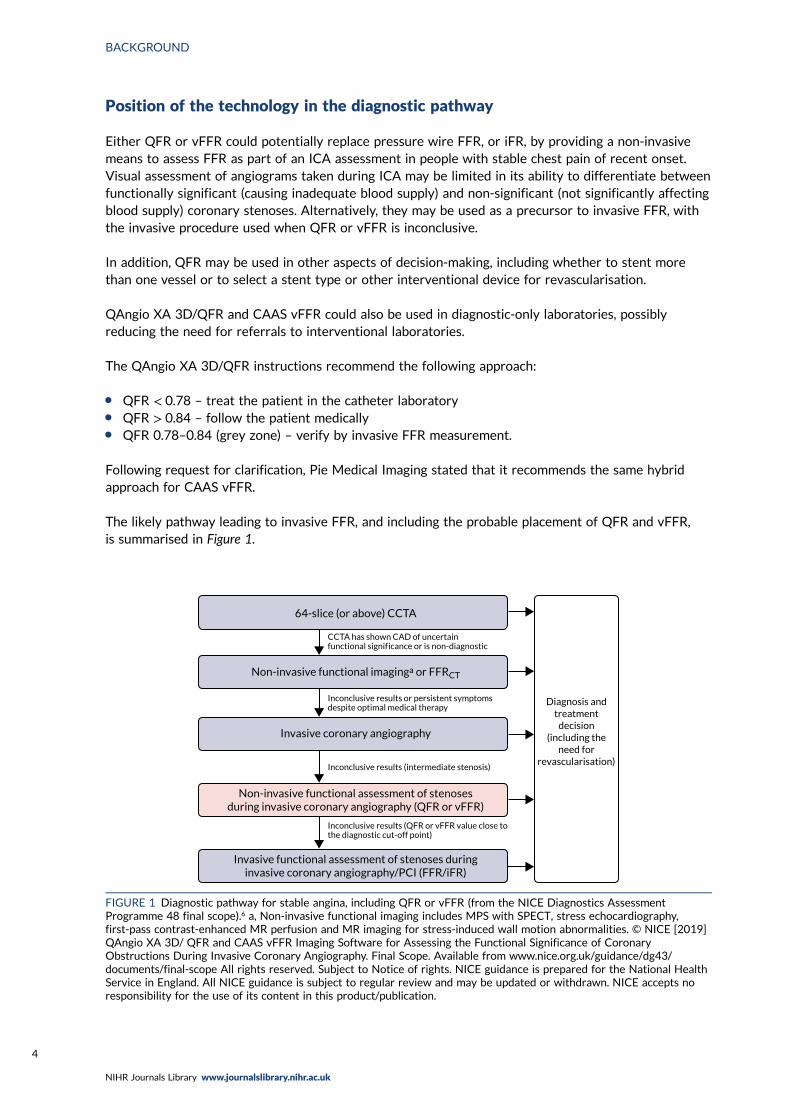
The likely pathway leading to invasive FFR, and including the probable placement of QFR and vFFR,is summarised in Figure 1.
Diagnosis andtreatment
decision(including the
need forrevascularisation)
64-slice (or above) CCTA
Non-invasive functional imaginga or FFRCT
Non-invasive functional assessment of stenosesduring invasive coronary angiography (QFR or vFFR)
Invasive functional assessment of stenoses duringinvasive coronary angiography/PCI (FFR/iFR)
Invasive coronary angiography
Inconclusive results (QFR or vFFR value close tothe diagnostic cut-off point)
Inconclusive results (intermediate stenosis)
Inconclusive results or persistent symptoms despite optimal medical therapy
CCTA has shown CAD of uncertainfunctional signif icance or is non-diagnostic
FIGURE 1 Diagnostic pathway for stable angina, including QFR or vFFR (from the NICE Diagnostics AssessmentProgramme 48 final scope).6 a, Non-invasive functional imaging includes MPS with SPECT, stress echocardiography,first-pass contrast-enhanced MR perfusion and MR imaging for stress-induced wall motion abnormalities. © NICE [2019]QAngio XA 3D/ QFR and CAAS vFFR Imaging Software for Assessing the Functional Significance of CoronaryObstructions During Invasive Coronary Angiography. Final Scope. Available from www.nice.org.uk/guidance/dg43/documents/final-scope All rights reserved. Subject to Notice of rights. NICE guidance is prepared for the National HealthService in England. All NICE guidance is subject to regular review and may be updated or withdrawn. NICE accepts noresponsibility for the use of its content in this product/publication.
BACKGROUND
NIHR Journals Library www.journalslibrary.nihr.ac.uk
4
Chapter 2 Aims and objectives
The aim of the project is to determine the clinical effectiveness and cost-effectiveness of non-invasiveassessment of the functional significance of coronary stenoses, using QAngio XA 3D/QFR and CAAS
vFFR imaging software.
To achieve this, the following objectives were set:
l Clinical effectiveness –
¢ To perform a systematic review and meta-analysis of the diagnostic accuracy and, wherefeasible, clinical efficacy of the QAngio XA 3D/QFR imaging software and CAAS vFFR softwareused during ICA for assessing the functional significance of coronary obstructions in people withstable chest pain whose angiograms show intermediate coronary stenosis.
¢ To perform a narrative systematic review of the clinical efficacy and practical implementationof QAngio XA 3D/QFR and CAAS vFFR imaging software. This includes assessment of theassociated revascularisation rates, mortality and morbidity, patient-centred outcomes, adverseevents and acceptability to clinicians and patients.
l Cost-effectiveness –
¢ To perform a systematic review of published cost-effectiveness studies of the use of the QAngioXA 3D/QFR and CAAS vFFR imaging software for assessing the functional significance ofcoronary stenosis in people with stable chest pain whose angiograms show intermediate stenosis.
¢ To develop a decision model to estimate the cost-effectiveness of the QAngio XA 3D/QFR andCAAS vFFR imaging software used during ICA to indicate whether or not coronary obstructionsare functionally significant. Consideration will be given to differences in the cost-effectiveness ofthe technologies in diagnostic-only or in interventional catheter laboratories.
¢ The decision model will link the diagnostic accuracy of QFR derived from the QAngio XA 3D/QFRimaging software, and vFFR derived from the CAAS vFFR software, to short-term costs andconsequences (e.g. the impact on the number of revascularisations needed, the proportion of peoplewho need invasive functional assessment of stenosis, time to test results, and associated risks of thediagnostic intervention). It will link the short-term consequences to potential longer-term costs andconsequences (e.g. major cardiovascular events such as MI and sudden cardiac death, adverse eventsrelated to revascularisation and diagnosis, and mortality) using the best-available evidence.
DOI: 10.3310/hta25560 Health Technology Assessment 2021 Vol. 25 No. 56
© Queen’s Printer and Controller of HMSO 2021. This work was produced by Duarte et al. under the terms of a commissioning contract issued by the Secretary of Statefor Health and Social Care. This issue may be freely reproduced for the purposes of private research and study and extracts (or indeed, the full report) may be included inprofessional journals provided that suitable acknowledgement is made and the reproduction is not associated with any form of advertising. Applications for commercialreproduction should be addressed to: NIHR Journals Library, National Institute for Health Research, Evaluation, Trials and Studies Coordinating Centre, Alpha House,University of Southampton Science Park, Southampton SO16 7NS, UK.
5

Chapter 3 Assessment of clinical effectiveness
Methods for reviewing effectiveness
The systematic review was conducted following the general principles recommended in the Centre forReviews and Dissemination (CRD) guidance and reported in accordance with the Preferred ReportingItems for Systematic Reviews and Meta-Analyses (PRISMA) statement.7
SearchesComprehensive searches of the literature were conducted to systematically identify all studies relatingto QAngio XA 3D/QFR and CAAS vFFR imaging software.
The searches were carried out during October 2019, with a further updated search undertaken on2 January 2020. The following databases were searched: MEDLINE, PubMed, EMBASE™ (Elsevier,Amsterdam, the Netherlands), the Science Citation Index (Clarivate Analytics, Philadelphia, PA, USA),Cochrane Database of Systematic Reviews, Cochrane Central Register of Controlled Trials (CENTRAL),Health Technology Assessment (HTA) database and EconLit (American Economic Association, Nashville,TN, USA).
Ongoing and unpublished studies were identified by searches of ClinicalTrials.gov; ConferenceProceedings Citation Index: Science (Clarivate Analytics); EU Clinical Trials Register; Open AccessTheses and Dissertations; ProQuest® (ProQuest LLC, Ann Arbor, MI, USA) Dissertations & Theses A&I;PROSPERO; the World Health Organization’s International Clinical Trials Registry Platform portal; andmanufacturer websites. Abstracts from any recent conferences that are thought to be relevant to thereview were also consulted.
A search strategy for Ovid® (Wolters Kluwer, Alphen aan den Rijn, the Netherlands) MEDLINE isreported in Appendix 1. The MEDLINE strategy was translated to run appropriately on the otherdatabases and resources. No language or date restrictions were applied to the searches. No studydesign search filters were used.
Reference lists of relevant recent reviews8 were checked to identify additional potentially relevant reports.
Database searches were carried out to identify cost-effectiveness studies where ICA (alone and/orwith FFR) was one of the interventions under comparison. The following databases were searched:EconLit, EMBASE, HTA database, MEDLINE and NHS Economic Evaluation Database (NHS EED).The search strategies for EconLit, EMBASE and MEDLINE are reported in Appendix 1.
Pragmatic supplementary PubMed and Google Scholar (Google Inc., Mountain View, CA, USA) searcheswere carried out to identify studies of diagnostic data on ICA compared with FFR.
Contact with study authors and manufacturers and request for individual participant dataAn individual participant data (IPD) meta-analysis of four studies that has previously been performedwas eligible for this review.8 The review authors contacted the study authors prior to commencing thisassessment, and the study authors agreed, in principle, to share the collected IPD with the reviewauthors for the purposes of this work. However, because of the slow response from the study authors,the IPD could not be supplied in time for this report, and the decision was made not to pursue an IPDanalysis. Instead, published data and data presented in figures were used. Where possible, IPD-equivalentdata were extracted from plots using a digitising software. See Data extraction for further detail.
DOI: 10.3310/hta25560 Health Technology Assessment 2021 Vol. 25 No. 56
© Queen’s Printer and Controller of HMSO 2021. This work was produced by Duarte et al. under the terms of a commissioning contract issued by the Secretary of Statefor Health and Social Care. This issue may be freely reproduced for the purposes of private research and study and extracts (or indeed, the full report) may be included inprofessional journals provided that suitable acknowledgement is made and the reproduction is not associated with any form of advertising. Applications for commercialreproduction should be addressed to: NIHR Journals Library, National Institute for Health Research, Evaluation, Trials and Studies Coordinating Centre, Alpha House,University of Southampton Science Park, Southampton SO16 7NS, UK.
7
Selection criteriaTwo reviewers independently screened all titles and abstracts. Full papers of any titles and abstractsthat were thought to be relevant were obtained where possible, and the relevance of each studyassessed independently by two reviewers according to the criteria below. Any disagreements wereresolved by consensus or by consulting a third reviewer. Conference abstracts were included wheresufficient data were reported to confirm eligibility. Authors were contacted where insufficient datawere reported to confirm inclusion (for instance, to clarify what index test was used in the study, or toprovide complete 2 × 2 data) and where it was unclear whether or not the same diagnostic accuracyresults were presented in more than one report (e.g. conference abstracts linked to a publication).
Diagnostic accuracyIncluded were diagnostic accuracy and correlation studies in which QFR using any version of theQAngio® system (Medis Medical Imaging Systems BV) or CAAS vFFR were performed in addition toinvasive FFR (or iFR) as a reference standard in the same patients. Only prospective and retrospectivecohorts were included. Case–control studies, letters, editorials and reviews were excluded.
Clinical effectiveness/implementationIncluded were observational studies where QFR or vFFR (with or without invasive FFR) have been usedand that report relevant clinical outcomes as detailed. Relevant publications reporting issues related toimplementation of, or practical advice for, QFR or vFFR and their use in clinical practice were alsoeligible. Case reports and studies focusing only on technical aspects of QFR or vFFR (such as technicaldescriptions of the testing process or specifications of machinery and software) were excluded.
ParticipantsPatients with intermediate stenosis (however defined) who are referred for ICA to assess coronarystenosis and the need for revascularisation were included. Although the main focus of this assessmentwas on patients with stable chest pain (either suspected stable angina or confirmed angina that is notadequately controlled by treatment), patients with all types of angina (including unstable, non-specificand atypical) were eligible for inclusion. Patients with acute MI [ST segment elevation myocardialinfarction (STEMI) and non-ST segment elevation myocardial infarction (NSTEMI) < 72 hours] were alsoincluded provided QFR was performed in non-culprit vessels.
InterventionsAll versions of QAngio XA 3D/QFR (including AngioPlus) and CAAS vFFR imaging software used inconjunction with ICA to allow simulation of FFR were included.
All submeasurements of QFR were eligible, including cQFR and fQFR. Eligible health-care settingswere diagnostic-only and interventional catheter laboratories.
Reference standardThe reference standard was FFR assessed using an invasive pressure wire with or without adenosine.iFR, which was found to be non-inferior to FFR for predicting cardiovascular events and all-causemortality,9 was also accepted as a reference standard.
OutcomesThe eligible outcome measures relating to diagnostic accuracy were:
l sensitivity and specificity of QAngio XA 3D/QFR and CAAS vFFRl positive predictive values (PPVs) and negative predictive values (NPVs)l estimates of difference in measurements between QFR or vFFR and invasive FFR/iFR (including
Bland–Altman assessments)l correlation between QFR or vFFR and invasive FFR/iFR measurements.
ASSESSMENT OF CLINICAL EFFECTIVENESS
NIHR Journals Library www.journalslibrary.nihr.ac.uk
8
Some studies reported differences or concordance between QFR or vFFR and invasive FFR/iFR innumerous ways, including inter- and intra-rater differences in measurements, mean differences (MDs),correlation coefficients, sensitivity and specificity, or receiver operating characteristic (ROC) curves.All relevant outcome definitions and cut-off points were extracted and their applicability to thedecision problem accounted for when presenting the results. Diagnostic accuracy results of ICAalone were considered if reported alongside QFR or CAAS vFFR.
In addition, the following clinical outcomes were eligible:
l morbidity, mortality and major adverse cardiac events (MACEs) (e.g. MI, heart failure)l adverse events related to the diagnostic procedure (e.g. pressure wire damage, adenosine side
effects, stroke)l adverse events related to revascularisationl distress, anxiety and similar harms caused by QAngio XA 3D/QFR, CAAS vFFR, invasive FFR or iFRl subsequent use of invasive pressure wire FFR or iFRl subsequent revascularisation procedures performed (including unscheduled revascularisations)l number of vessels with stent placementsl health-related quality of life (HRQoL)l radiation exposure.
Eligible outcomes related to the implementation of the interventions of interest and related practicalissues included:
l acceptability of QFR, vFFR and invasive FFR (to clinicians and patients)l test failure ratesl inconclusive test ratesl inter-observer variabilityl timing of results from data acquisitionl referral timesl patient satisfactionl training requirementsl uptake and compliance.
Data extractionA standardised data extraction form was developed, piloted and finalised to data-extract both studyand patient characteristics and eligible outcomes. For studies reporting diagnostic accuracy data, thenumber of true-positive (TP), true-negative (TN), false-positive (FP) and false-negative (FN) resultswere extracted for each index test evaluated in each study, along with sensitivity and specificity data,the area under the curve (AUC) and 95% confidence intervals (CIs) and PPVs and NPVs. Whetherdiagnostic accuracy was determined per patient, vessel or lesion was recorded.
Where not reported, sensitivity and specificity were calculated if data allowed. Further data wererequested from study authors when required. Correlation and MD between QFR/vFFR and FFR wererecorded along with reasons for any excluded, failed or inconclusive results and any other relevantclinical outcomes from the studies.
As IPD could not be supplied, digitised data were extracted using WebPlotDigitizer (Ankit Rohatg,Pacifica, CA, USA) software to approximately reconstruct the individual-level data from includedstudies. Data were extracted for all studies that presented a Bland–Altman or correlation plot.Bland–Altman plots were preferred for extraction, as these were found to be generally clearer andeasier to extract. The extracted averages and differences between QFR and FFR were converted intoQFR and corresponding FFR values for each study. For some studies, the quality of published figureswas not sufficient to extract data.
DOI: 10.3310/hta25560 Health Technology Assessment 2021 Vol. 25 No. 56
© Queen’s Printer and Controller of HMSO 2021. This work was produced by Duarte et al. under the terms of a commissioning contract issued by the Secretary of Statefor Health and Social Care. This issue may be freely reproduced for the purposes of private research and study and extracts (or indeed, the full report) may be included inprofessional journals provided that suitable acknowledgement is made and the reproduction is not associated with any form of advertising. Applications for commercialreproduction should be addressed to: NIHR Journals Library, National Institute for Health Research, Evaluation, Trials and Studies Coordinating Centre, Alpha House,University of Southampton Science Park, Southampton SO16 7NS, UK.
9
Data were extracted by one reviewer using a standardised data extraction form and independentlychecked by a second reviewer. Discrepancies were resolved by discussion, with involvement of a thirdreviewer when necessary. Data from relevant studies with multiple publications were extracted andreported as a single study. The most recent or most complete publication was used in situations wherewe could not exclude the possibility of overlapping populations across separate study reports.
Critical appraisalThe quality of the diagnostic accuracy studies was assessed using the Quality Assessment of DiagnosticAccuracy Studies-2 (QUADAS-2) tool. The QUADAS-2 tool evaluates both risk of bias (associatedwith the population selection, index test, reference standard and patient flow) and study applicability(population selection, index test and reference standard) to the review question. The tool was piloted ona sample of studies. Signalling questions and criteria for decisions were finalised following piloting.
The quality assessments were performed by one reviewer and independently checked by a second reviewer.Disagreements were resolved through consensus and, when necessary, by consulting a third reviewer.
Methods of data synthesisThe results of data extraction were presented in structured tables and as a narrative summary,grouped by population and test characteristics. The diagnostic accuracy was calculated for each studybased on extracted data, using the usual index test of QFR ≤ 0.8 and reference standard of FFR ≤ 0.8as defining patients in need of stenting. Where sufficient clinically and statistically homogenous datawere available, data were pooled using appropriate meta-analytic techniques. Studies that did notreport sufficient information to derive 2 × 2 data (from tables, text or plots) were not included in themeta-analysis and were synthesised narratively.
Statistical analysis of diagnostic accuracy
Meta-analysis using 2 × 2 diagnostic dataThe primary meta-analyses in this report were based on studies that reported 2 × 2 diagnostic data,or where data could be reconstructed from tables. Both univariate meta-analysis and bivariate meta-analysis of sensitivity and specificity10 were performed and compared, categorised according to ‘mode’of QFR used: either fQFR, cQFR or non-specified QFR (referred to as QFR). These analyses included allpatients, vessels and lesions. Results are reported in forest plots and summarised in tables and ROC plots.
Separate (univariate) meta-analyses were performed for each diagnostic outcome [sensitivity,specificity, PPV and NPV, diagnostic odds ratio (DOR), area under ROC curve, correlation betweenQFR and FFR, and MD between QFR and FFR] and presented in forest plots.
A hierarchical bivariate generalised linear mixed model, as described by Simmonds et al.,11 was fitted tothe data to calculate summary estimates of sensitivity and specificity and the associated 95% CIs. Thesame model was used to produce summary ROC curves, using the Rutter and Gatsonis formulation forthe hierarchical summary receiver operating characteristic (HSROC) curve.11,12 Results are presented inROC plots. Unless otherwise specified, all analyses used a cut-off point for the index test of QFR ≤ 0.8and reference standard of FFR ≤ 0.8 as defining patients in need of revascularisation.
As some studies reported data on two or more tests (e.g. QFR and ICA or fQFR and cQFR), thebivariate model was extended to include diagnostic accuracy parameters for multiple tests, whichallowed for formal comparison between models in terms of sensitivity and specificity.11
Investigation of heterogeneity and subgroup analysesFor diagnostic accuracy data, we visually inspected the forest plots and ROC space to check forheterogeneity between study results. To assess the impact of patient factors, we performed meta-regressions of sensitivity, specificity and DOR against key patient parameters reported in papers.All meta-regressions were univariate analyses (i.e. one patient parameter per metaregression).
ASSESSMENT OF CLINICAL EFFECTIVENESS
NIHR Journals Library www.journalslibrary.nihr.ac.uk
10
Where available, we considered the following factors as potential sources of heterogeneity:
l type and severity of stenosis (e.g. high percentage DS)l multivessel CADl diffuse CADl multiple stenoses in one vessell microvascular dysfunction (e.g. caused by diabetes)l chronic total occlusionl diabetesl sexl agel ethnicity (or study location as a proxy for ethnicity)l results of previous non-invasive testsl use of fQFR compared with cQFR (QAngio XA 3D/QFR)l previous MI.
For these analyses fQFR was not separated from cQFR; instead, one test per study (cQFR forpreference) was analysed to maximise data. This was judged to be reasonable given that diagnosticaccuracy did not appear to vary substantially according to the type of QFR used.
Where studies reported the factors of interest separately by subgroup, these subgroup results werecompared; however, these were too sparsely reported to permit any meta-analysis. For patient factorswhere data did not allow for metaregression, a narrative synthesis of the impact of covariates hasbeen provided.
Sensitivity analysesWe conducted sensitivity analyses to explore the robustness of the results according to study qualitybased on QUADAS-2 domain results (e.g. risk of incorporation bias) and study design (e.g. in-procedurecompared with retrospective evaluation of index test results) for diagnostic accuracy studies. ROC plots ofsensitivity and specificity according to risk of bias were produced to visually assess possible bias.Wherefeasible, bivariate meta-analyses were repeated, subgrouped according to the assessed risk of bias.
Meta-analysis of data extracted from figuresUsing data extracted from figures, estimates of sensitivity and specificity were calculated and presentedon forest plots and in the ROC space to examine the variability in diagnostic test accuracy withinand between studies. These were compared with the diagnostic accuracy results from 2 × 2 table toinvestigate whether or not the extracted data could be used for analysis. The bivariate meta-analysesperformed using 2 × 2 data were repeated using the extracted figure data.
Grey-zone analysisExtracted figure data were used to conduct an analysis where testing includes a grey zone of intermediateQFR values for which a FFR would be performed as a confirmatory test. The grey-zone diagnosticprocedure considered, following the QAngio XA 3D/QFR instructions, was:
l perform the QFRl if the QFR is > 0.84, continue without stenting/bypass (test negative)l if the QFR is ≤ 0.78, proceed to stenting/bypass (test positive)l if the QFR is between 0.78 and 0.84, perform a FFR test and proceed to stenting/bypass if the FFR
≤ 0.80 (the grey zone).
For the grey-zone analysis, it was assumed that anyone in the grey zone has perfect diagnosticaccuracy (because all received a ‘gold standard’ FFR test); therefore, FPs and FNs are present only inpatients outside the grey zone. The impact of using the grey zone on the diagnostic accuracy of QAngio
DOI: 10.3310/hta25560 Health Technology Assessment 2021 Vol. 25 No. 56
© Queen’s Printer and Controller of HMSO 2021. This work was produced by Duarte et al. under the terms of a commissioning contract issued by the Secretary of Statefor Health and Social Care. This issue may be freely reproduced for the purposes of private research and study and extracts (or indeed, the full report) may be included inprofessional journals provided that suitable acknowledgement is made and the reproduction is not associated with any form of advertising. Applications for commercialreproduction should be addressed to: NIHR Journals Library, National Institute for Health Research, Evaluation, Trials and Studies Coordinating Centre, Alpha House,University of Southampton Science Park, Southampton SO16 7NS, UK.
11
XA 3D/QFR was assessed. The effect of using different FFR thresholds on the diagnostic accuracy ofQAngio XA 3D/QFR was also assessed. Owing to the limited data on CAAS vFFR, no such analyseswere performed for this technology.
Narrative synthesisEvidence related to clinical effectiveness and implementation of QFR, vFFR and invasive FFR were toolimited to allow meta-analysis. Results were tabulated and presented narratively. Conclusions of thesestudies suggested consequences for QFR and ICA and recommendations for practice, and suggestedneeds for further research were summarised.
Narrative summaries were used for any diagnostic accuracy outcomes where meta-analyses or otherstatistical analyses were not feasible. This included tabulating or plotting results as reported in studies,and narratively describing and comparing these results.
Statistical analysis of clinical effectivenessThe systematic review identified very few published data on the clinical impact of using QFR andQAngio screening. In particular, very few data were found on the impact that QFR (with or without agrey zone) might have on future incidence and prevention of coronary events. Therefore, to investigatewhat the clinical impact of using QFR testing might be, a simulation study was performed to identifythe impact that QFR and invasive FFR assessment might have on the number of revascularisationsperformed, and on morbidity and mortality and other longer-term outcomes. This simulation used twokey sources of data:
1. The data on FFR and QFR measurements extracted from published Bland–Altman figures wereused as a representative population of patients with intermediate stenosis, with FFR and QFRmeasurements for each patient.
2. The IRIS-FFR study13 reported the association between FFR and coronary events in patients whoare revascularised and in patients where revascularisation is deferred. These data were used tocalculate the risk of coronary events, and then to simulate events for each patient in our samplepopulation (from point 1), given their observed FFR measurement.
Combining these two data sources produced a simulated data set where each patient had thefollowing data:
l a FFR measurementl the associated QFR measurementl the risk of a coronary event if revascularisation were performedl the risk of a coronary event if revascularisation were deferredl whether or not the patient had a coronary event (if revascularised)l whether or not the patient had a coronary event (if deferred).
Three strategies for deciding on whether or not to revascularise were considered:
1. FFR only – perform FFR on all and revascularise if the FFR is ≤ 0.82. QFR only – perform QFR on all and revascularise if the QFR is ≤ 0.8, without FFR measurement3. grey zone – perform a QFR and:
¢ revascularise if the QFR is ≤ 0.78¢ defer if the QFR is > 0.84¢ if the QFR is between 0.78 and 0.84, perform FFR and revascularise if the FFR is ≤ 0.8.
ASSESSMENT OF CLINICAL EFFECTIVENESS
NIHR Journals Library www.journalslibrary.nihr.ac.uk
12
Applying these strategies to the simulated data set, the following data were calculated for each strategy:
l the proportion of patients who would be revascularisedl the total number of coronary eventsl the proportion of patients who would undergo unnecessary revascularisation (i.e. revascularised, but
would not have had an event if revascularisation were deferred)l the proportion of patients in whom revascularisation prevented an event (i.e. are revascularised, and
would have had an event if revascularisation were deferred)l the proportion of patients in whom revascularisation caused an event (i.e. who would have an event
after being revascularised, but would not have had an event if revascularisation were deferred).
These results were then compared across strategies to investigate how the differing strategies mightalter the incidence of coronary events.
Detailed simulation methodsThe sample population for the simulation was taken to be the data extracted from published Bland–Altmanfigures. For this analysis, fQFR data were excluded and only cQFR or non-specified QFR data were used,making a total of 3193 patients, each with a FFR measurement and its associated QFR measurement.As these data were extracted from figures, they may not be a perfect representation of the actual studypatients (see Data extraction). The simulation did not differentiate between studies, so the patients weretreated as if they came from a single ‘mega-study’.
To predict coronary outcome in this sample population, the results of the recent IRIS-FFR registryreport were used, representing 5846 patients who were either ‘revascularised’ (stent or bypass surgery)or ‘deferred’ (continued with current management without surgery) based on their measured FFR result.The IRIS-FFR study13 used major cardiovascular events (MACE, a composite of cardiac death, MI andrepeated/emergency revascularisation) as its primary outcome. The mean incidence rate from MACEin deferred patients was 1.44 events per 100 lesion-years. For simplicity, it was assumed that eachperson has one lesion, equating to a 1.44% risk in 1 year. Based on data reported in the publication, thisequated to a risk of 0.64% at a FFR of exactly 1. According to IRIS-FFR, most of these events are laterrevascularisations. The hazard ratio (HR) for MACE was estimated as 1.06 per 0.01 decrease in FFR.It was assumed that the 1-year relative risk (RR) is the same as this HR. In patients with revascularisations,the mean risk of MACE was 2.4% in 1 year, with a HR of 1 (so risk is the same regardless of FFR value).
Based on those risks, the predicted risk of MACE for every person in the sample population wascalculated using their reported FFR measurement (this means that risk is not dependent on QFR).A risk of event if revascularised and a risk if deferred was calculated. A Monte Carlo simulation wasthen used to simulate whether or not each person had a MACE if they were ‘deferred’ or if they wererevascularised, based on the calculated risks. Therefore, the incidence of simulated events is solely afunction of FFR values and knowing that the QFR has no impact on risk of MACEs. The simulationprocess was repeated 10,000 times to produce a reasonable sample of plausible simulations.
For each simulated sample, who would and would not be revascularised was determined for each ofthe three strategies listed above. Given that, and the known MACE status for each patient, the fivestatistics in the list above were calculated. The results were pooled across simulations to find medianvalues across simulations and to plot distributions across all simulations.
All statistical analyses were conducted in R software, version 3.6 or later (The R Foundation forStatistical Computing, Vienna, Austria).
DOI: 10.3310/hta25560 Health Technology Assessment 2021 Vol. 25 No. 56
© Queen’s Printer and Controller of HMSO 2021. This work was produced by Duarte et al. under the terms of a commissioning contract issued by the Secretary of Statefor Health and Social Care. This issue may be freely reproduced for the purposes of private research and study and extracts (or indeed, the full report) may be included inprofessional journals provided that suitable acknowledgement is made and the reproduction is not associated with any form of advertising. Applications for commercialreproduction should be addressed to: NIHR Journals Library, National Institute for Health Research, Evaluation, Trials and Studies Coordinating Centre, Alpha House,University of Southampton Science Park, Southampton SO16 7NS, UK.
13
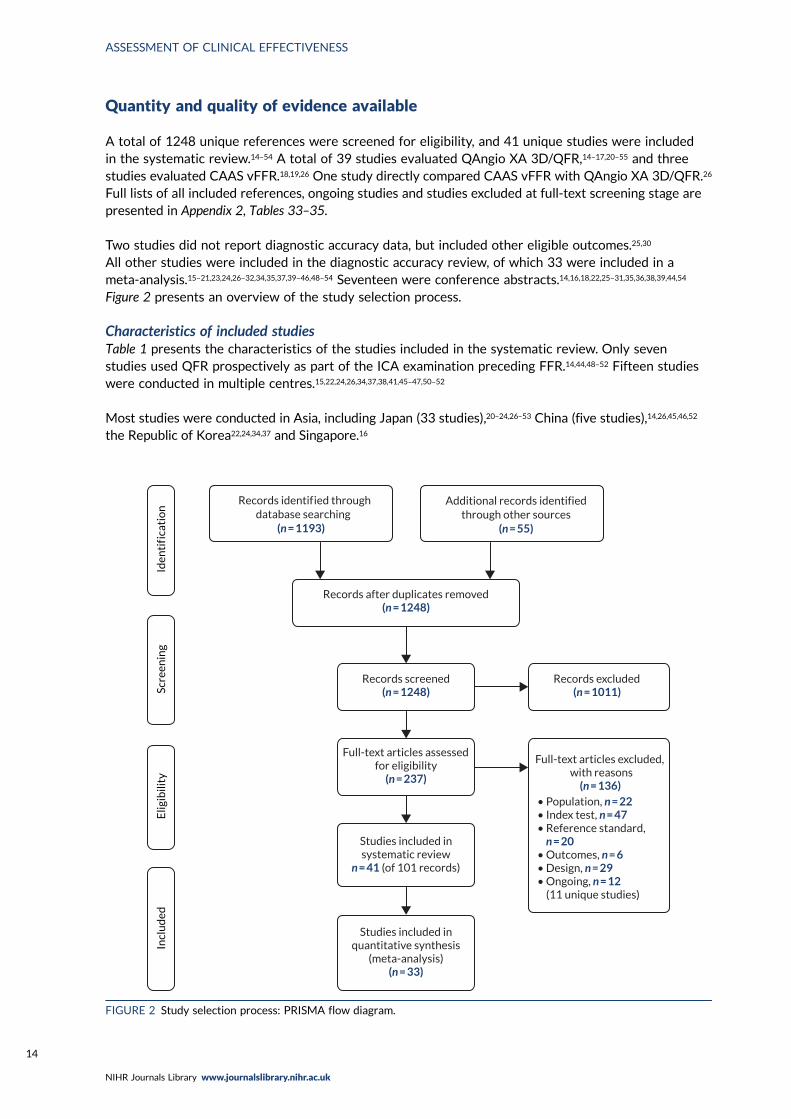
Quantity and quality of evidence available
A total of 1248 unique references were screened for eligibility, and 41 unique studies were includedin the systematic review.14–54 A total of 39 studies evaluated QAngio XA 3D/QFR,14–17,20–55 and threestudies evaluated CAAS vFFR.18,19,26 One study directly compared CAAS vFFR with QAngio XA 3D/QFR.26
Full lists of all included references, ongoing studies and studies excluded at full-text screening stage arepresented in Appendix 2, Tables 33–35.
Two studies did not report diagnostic accuracy data, but included other eligible outcomes.25,30
All other studies were included in the diagnostic accuracy review, of which 33 were included in ameta-analysis.15–21,23,24,26–32,34,35,37,39–46,48–54 Seventeen were conference abstracts.14,16,18,22,25–31,35,36,38,39,44,54
Figure 2 presents an overview of the study selection process.
Characteristics of included studiesTable 1 presents the characteristics of the studies included in the systematic review. Only sevenstudies used QFR prospectively as part of the ICA examination preceding FFR.14,44,48–52 Fifteen studieswere conducted in multiple centres.15,22,24,26,34,37,38,41,45–47,50–52
Most studies were conducted in Asia, including Japan (33 studies),20–24,26–53 China (five studies),14,26,45,46,52
the Republic of Korea22,24,34,37 and Singapore.16
Records identif ied through database searching
(n = 1193)
Additional records identifiedthrough other sources
(n = 55)
Records after duplicates removed(n = 1248)
Records screened(n = 1248)
Records excluded(n = 1011)
Full-text articles assessedfor eligibility
(n = 237)
Full-text articles excluded, with reasons
(n = 136)• Population, n = 22• Index test, n = 47• Reference standard, n = 20• Outcomes, n = 6• Design, n = 29• Ongoing, n = 12 (11 unique studies)
Studies included insystematic review
n = 41 (of 101 records)
Studies included inquantitative synthesis
(meta-analysis)(n = 33)
Incl
ud
edE
ligib
ility
Scre
enin
gId
enti
f ica
tio
n
FIGURE 2 Study selection process: PRISMA flow diagram.
ASSESSMENT OF CLINICAL EFFECTIVENESS
NIHR Journals Library www.journalslibrary.nihr.ac.uk
14
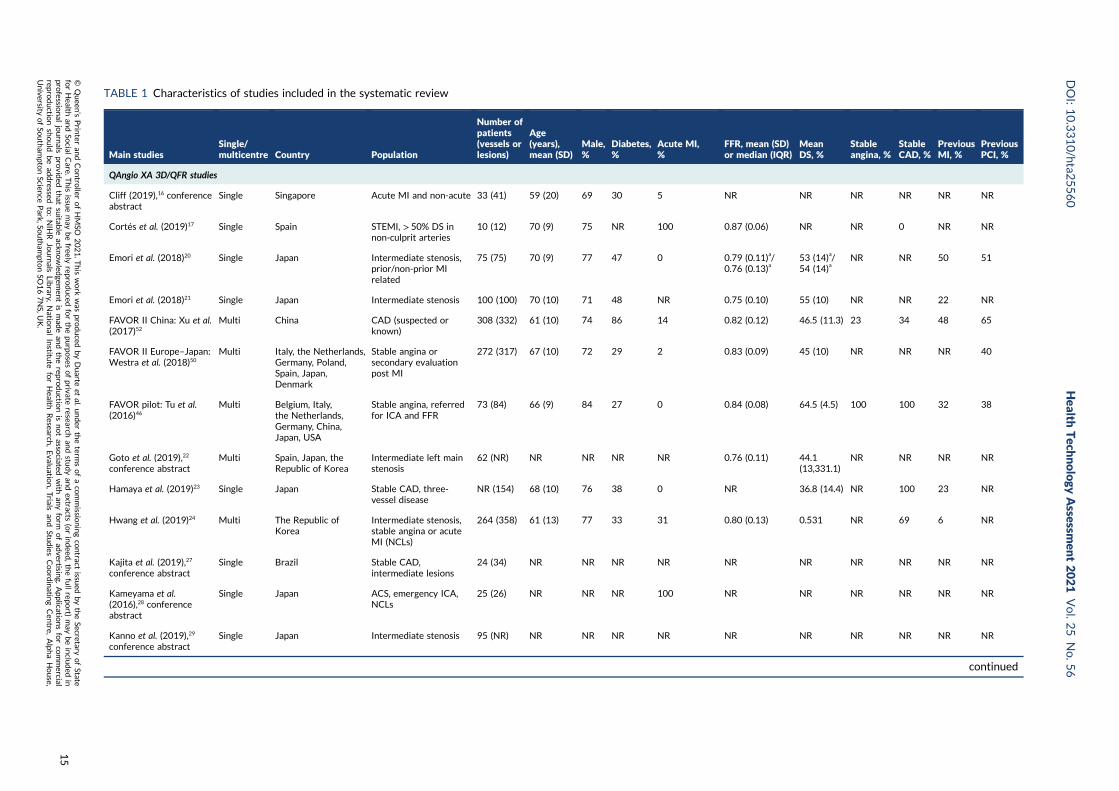
TABLE 1 Characteristics of studies included in the systematic review
Main studiesSingle/multicentre Country Population
Number ofpatients(vessels orlesions)
Age(years),mean (SD)
Male,%
Diabetes,%
Acute MI,%
FFR, mean (SD)or median (IQR)
MeanDS, %
Stableangina, %
StableCAD, %
PreviousMI, %
PreviousPCI, %
QAngio XA 3D/QFR studies
Cliff (2019),16 conferenceabstract
Single Singapore Acute MI and non-acute 33 (41) 59 (20) 69 30 5 NR NR NR NR NR NR
Cortés et al. (2019)17 Single Spain STEMI, > 50% DS innon-culprit arteries
10 (12) 70 (9) 75 NR 100 0.87 (0.06) NR NR 0 NR NR
Emori et al. (2018)20 Single Japan Intermediate stenosis,prior/non-prior MIrelated
75 (75) 70 (9) 77 47 0 0.79 (0.11)a/0.76 (0.13)a
53 (14)a/54 (14)a
NR NR 50 51
Emori et al. (2018)21 Single Japan Intermediate stenosis 100 (100) 70 (10) 71 48 NR 0.75 (0.10) 55 (10) NR NR 22 NR
FAVOR II China: Xu et al.(2017)52
Multi China CAD (suspected orknown)
308 (332) 61 (10) 74 86 14 0.82 (0.12) 46.5 (11.3) 23 34 48 65
FAVOR II Europe–Japan:Westra et al. (2018)50
Multi Italy, the Netherlands,Germany, Poland,Spain, Japan,Denmark
Stable angina orsecondary evaluationpost MI
272 (317) 67 (10) 72 29 2 0.83 (0.09) 45 (10) NR NR NR 40
FAVOR pilot: Tu et al.(2016)46
Multi Belgium, Italy,the Netherlands,Germany, China,Japan, USA
Stable angina, referredfor ICA and FFR
73 (84) 66 (9) 84 27 0 0.84 (0.08) 64.5 (4.5) 100 100 32 38
Goto et al. (2019),22
conference abstractMulti Spain, Japan, the
Republic of KoreaIntermediate left mainstenosis
62 (NR) NR NR NR NR 0.76 (0.11) 44.1(13,331.1)
NR NR NR NR
Hamaya et al. (2019)23 Single Japan Stable CAD, three-vessel disease
NR (154) 68 (10) 76 38 0 NR 36.8 (14.4) NR 100 23 NR
Hwang et al. (2019)24 Multi The Republic ofKorea
Intermediate stenosis,stable angina or acuteMI (NCLs)
264 (358) 61 (13) 77 33 31 0.80 (0.13) 0.531 NR 69 6 NR
Kajita et al. (2019),27
conference abstractSingle Brazil Stable CAD,
intermediate lesions24 (34) NR NR NR NR NR NR NR NR NR NR
Kameyama et al.(2016),28 conferenceabstract
Single Japan ACS, emergency ICA,NCLs
25 (26) NR NR NR 100 NR NR NR NR NR NR
Kanno et al. (2019),29
conference abstractSingle Japan Intermediate stenosis 95 (NR) NR NR NR NR NR NR NR NR NR NR
continued
DOI:10.3310/hta2
5560
Health
Tech
nology
Assessm
ent2021
Vol.2
5No.5
6
©Queen
’sPrin
teran
dContro
llerofHMSO
2021.T
his
work
was
produced
byDuarte
etal.
under
theterm
sofaco
mmissio
ningco
ntract
issued
bytheSecretary
ofState
forHealth
andSo
cialCare.T
his
issuemay
befreely
reproduced
forthepu
rposes
ofprivate
researchan
dstu
dyan
dextracts
(orindeed
,thefullrepo
rt)may
beinclu
ded
inpro
fessional
journals
provid
edthat
suitab
leackn
owled
gemen
tis
mad
ean
dtherepro
ductio
nis
notasso
ciatedwith
anyform
ofad
vertising.
Applicatio
nsforco
mmercial
reproductio
nshould
bead
dressed
to:NIH
RJournals
Library,
Natio
nal
Institu
teforHealth
Research
,Evalu
ation,Trials
and
Studies
Coordinatin
gCen
tre,Alph
aHouse,
University
ofSo
utham
ptonScien
cePark,So
utham
ptonSO
167NS,U
K.
15
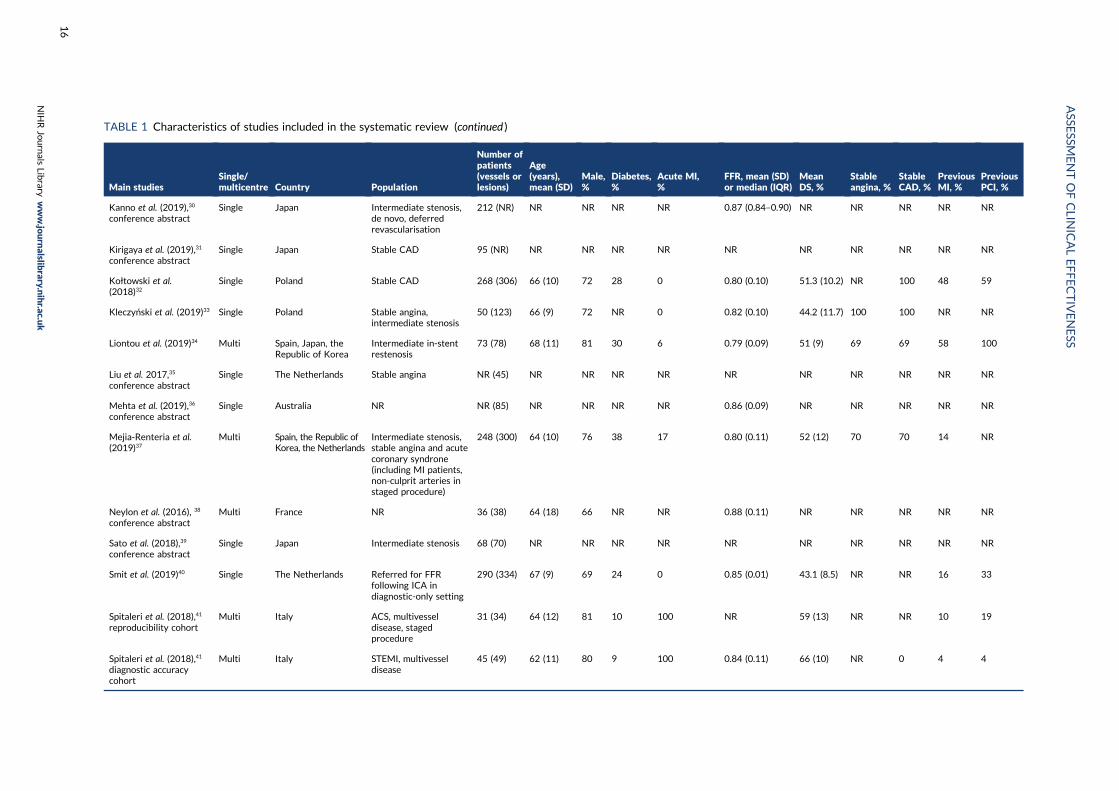
TABLE 1 Characteristics of studies included in the systematic review (continued )
Main studiesSingle/multicentre Country Population
Number ofpatients(vessels orlesions)
Age(years),mean (SD)
Male,%
Diabetes,%
Acute MI,%
FFR, mean (SD)or median (IQR)
MeanDS, %
Stableangina, %
StableCAD, %
PreviousMI, %
PreviousPCI, %
Kanno et al. (2019),30
conference abstractSingle Japan Intermediate stenosis,
de novo, deferredrevascularisation
212 (NR) NR NR NR NR 0.87 (0.84–0.90) NR NR NR NR NR
Kirigaya et al. (2019),31
conference abstractSingle Japan Stable CAD 95 (NR) NR NR NR NR NR NR NR NR NR NR
Kołtowski et al.(2018)32
Single Poland Stable CAD 268 (306) 66 (10) 72 28 0 0.80 (0.10) 51.3 (10.2) NR 100 48 59
Kleczyński et al. (2019)33 Single Poland Stable angina,intermediate stenosis
50 (123) 66 (9) 72 NR 0 0.82 (0.10) 44.2 (11.7) 100 100 NR NR
Liontou et al. (2019)34 Multi Spain, Japan, theRepublic of Korea
Intermediate in-stentrestenosis
73 (78) 68 (11) 81 30 6 0.79 (0.09) 51 (9) 69 69 58 100
Liu et al. 2017,35
conference abstractSingle The Netherlands Stable angina NR (45) NR NR NR NR NR NR NR NR NR NR
Mehta et al. (2019),36
conference abstractSingle Australia NR NR (85) NR NR NR NR 0.86 (0.09) NR NR NR NR NR
Mejia-Renteria et al.(2019)37
Multi Spain, the Republic ofKorea, the Netherlands
Intermediate stenosis,stable angina and acutecoronary syndrone(including MI patients,non-culprit arteries instaged procedure)
248 (300) 64 (10) 76 38 17 0.80 (0.11) 52 (12) 70 70 14 NR
Neylon et al. (2016), 38
conference abstractMulti France NR 36 (38) 64 (18) 66 NR NR 0.88 (0.11) NR NR NR NR NR
Sato et al. (2018),39
conference abstractSingle Japan Intermediate stenosis 68 (70) NR NR NR NR NR NR NR NR NR NR
Smit et al. (2019)40 Single The Netherlands Referred for FFRfollowing ICA indiagnostic-only setting
290 (334) 67 (9) 69 24 0 0.85 (0.01) 43.1 (8.5) NR NR 16 33
Spitaleri et al. (2018),41
reproducibility cohortMulti Italy ACS, multivessel
disease, stagedprocedure
31 (34) 64 (12) 81 10 100 NR 59 (13) NR NR 10 19
Spitaleri et al. (2018),41
diagnostic accuracycohort
Multi Italy STEMI, multivesseldisease
45 (49) 62 (11) 80 9 100 0.84 (0.11) 66 (10) NR 0 4 4
ASSE
SSMENTOFCLIN
ICALEFFECTIVENESS
NIH
RJournals
Library
www.jo
urnalslib
rary.nihr.ac.u
k
16
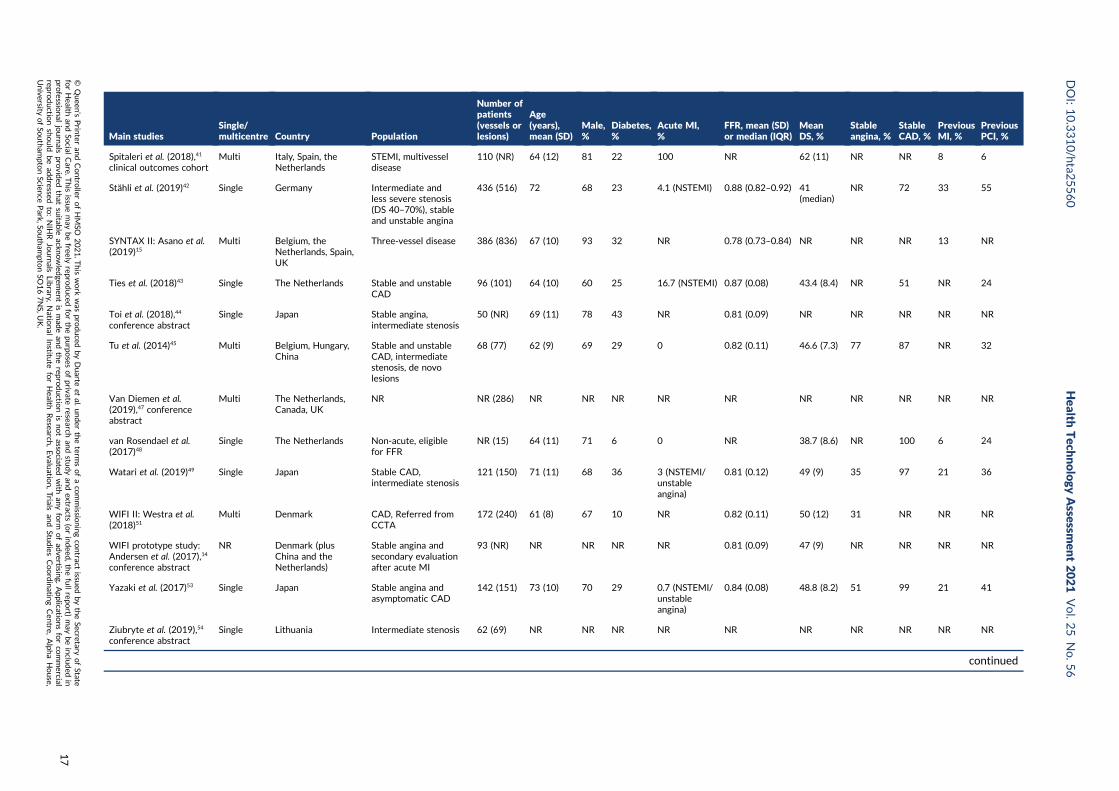
Main studiesSingle/multicentre Country Population
Number ofpatients(vessels orlesions)
Age(years),mean (SD)
Male,%
Diabetes,%
Acute MI,%
FFR, mean (SD)or median (IQR)
MeanDS, %
Stableangina, %
StableCAD, %
PreviousMI, %
PreviousPCI, %
Spitaleri et al. (2018),41
clinical outcomes cohortMulti Italy, Spain, the
NetherlandsSTEMI, multivesseldisease
110 (NR) 64 (12) 81 22 100 NR 62 (11) NR NR 8 6
Stähli et al. (2019)42 Single Germany Intermediate andless severe stenosis(DS 40–70%), stableand unstable angina
436 (516) 72 68 23 4.1 (NSTEMI) 0.88 (0.82–0.92) 41(median)
NR 72 33 55
SYNTAX II: Asano et al.(2019)15
Multi Belgium, theNetherlands, Spain,UK
Three-vessel disease 386 (836) 67 (10) 93 32 NR 0.78 (0.73–0.84) NR NR NR 13 NR
Ties et al. (2018)43 Single The Netherlands Stable and unstableCAD
96 (101) 64 (10) 60 25 16.7 (NSTEMI) 0.87 (0.08) 43.4 (8.4) NR 51 NR 24
Toi et al. (2018),44
conference abstractSingle Japan Stable angina,
intermediate stenosis50 (NR) 69 (11) 78 43 NR 0.81 (0.09) NR NR NR NR NR
Tu et al. (2014)45 Multi Belgium, Hungary,China
Stable and unstableCAD, intermediatestenosis, de novolesions
68 (77) 62 (9) 69 29 0 0.82 (0.11) 46.6 (7.3) 77 87 NR 32
Van Diemen et al.(2019),47 conferenceabstract
Multi The Netherlands,Canada, UK
NR NR (286) NR NR NR NR NR NR NR NR NR NR
van Rosendael et al.(2017)48
Single The Netherlands Non-acute, eligiblefor FFR
NR (15) 64 (11) 71 6 0 NR 38.7 (8.6) NR 100 6 24
Watari et al. (2019)49 Single Japan Stable CAD,intermediate stenosis
121 (150) 71 (11) 68 36 3 (NSTEMI/unstableangina)
0.81 (0.12) 49 (9) 35 97 21 36
WIFI II: Westra et al.(2018)51
Multi Denmark CAD, Referred fromCCTA
172 (240) 61 (8) 67 10 NR 0.82 (0.11) 50 (12) 31 NR NR NR
WIFI prototype study:Andersen et al. (2017),14
conference abstract
NR Denmark (plusChina and theNetherlands)
Stable angina andsecondary evaluationafter acute MI
93 (NR) NR NR NR NR 0.81 (0.09) 47 (9) NR NR NR NR
Yazaki et al. (2017)53 Single Japan Stable angina andasymptomatic CAD
142 (151) 73 (10) 70 29 0.7 (NSTEMI/unstableangina)
0.84 (0.08) 48.8 (8.2) 51 99 21 41
Ziubryte et al. (2019),54
conference abstractSingle Lithuania Intermediate stenosis 62 (69) NR NR NR NR NR NR NR NR NR NR
continued
DOI:10.3310/hta2
5560
Health
Tech
nology
Assessm
ent2021
Vol.2
5No.5
6
©Queen
’sPrin
teran
dContro
llerofHMSO
2021.T
his
work
was
produced
byDuarte
etal.
under
theterm
sofaco
mmissio
ningco
ntract
issued
bytheSecretary
ofState
forHealth
andSo
cialCare.T
his
issuemay
befreely
reproduced
forthepu
rposes
ofprivate
researchan
dstu
dyan
dextracts
(orindeed
,thefullrepo
rt)may
beinclu
ded
inpro
fessional
journals
provid
edthat
suitab
leackn
owled
gemen
tis
mad
ean
dtherepro
ductio
nis
notasso
ciatedwith
anyform
ofad
vertising.
Applicatio
nsforco
mmercial
reproductio
nshould
bead
dressed
to:NIH
RJournals
Library,
Natio
nal
Institu
teforHealth
Research
,Evalu
ation,Trials
and
Studies
Coordinatin
gCen
tre,Alph
aHouse,
University
ofSo
utham
ptonScien
cePark,So
utham
ptonSO
167NS,U
K.
17
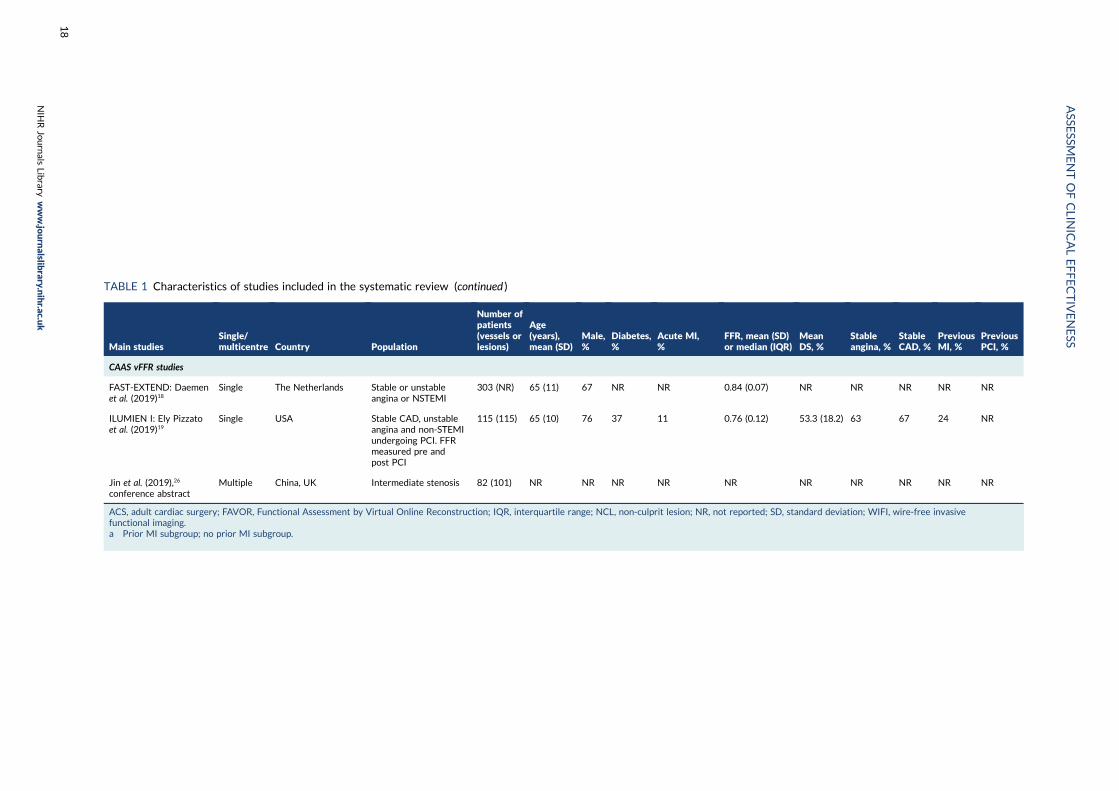
TABLE 1 Characteristics of studies included in the systematic review (continued )
Main studiesSingle/multicentre Country Population
Number ofpatients(vessels orlesions)
Age(years),mean (SD)
Male,%
Diabetes,%
Acute MI,%
FFR, mean (SD)or median (IQR)
MeanDS, %
Stableangina, %
StableCAD, %
PreviousMI, %
PreviousPCI, %
CAAS vFFR studies
FAST-EXTEND: Daemenet al. (2019)18
Single The Netherlands Stable or unstableangina or NSTEMI
303 (NR) 65 (11) 67 NR NR 0.84 (0.07) NR NR NR NR NR
ILUMIEN I: Ely Pizzatoet al. (2019)19
Single USA Stable CAD, unstableangina and non-STEMIundergoing PCI. FFRmeasured pre andpost PCI
115 (115) 65 (10) 76 37 11 0.76 (0.12) 53.3 (18.2) 63 67 24 NR
Jin et al. (2019),26
conference abstractMultiple China, UK Intermediate stenosis 82 (101) NR NR NR NR NR NR NR NR NR NR
ACS, adult cardiac surgery; FAVOR, Functional Assessment by Virtual Online Reconstruction; IQR, interquartile range; NCL, non-culprit lesion; NR, not reported; SD, standard deviation; WIFI, wire-free invasivefunctional imaging.a Prior MI subgroup; no prior MI subgroup.
ASSE
SSMENTOFCLIN
ICALEFFECTIVENESS
NIH
RJournals
Library
www.jo
urnalslib
rary.nihr.ac.u
k
18
Twenty-one studies were conducted in Europe, including Belgium,15,45,46 Denmark,14,50,51 France,38
Germany,42,46,50 Hungary,45 Italy,41,46,50 Lithuania,54 the Netherlands,15,18,35,37,40,41,43,46–48,50 Poland,32,33,50
Spain15,22,34,37,41,50 and the UK.15,26,47 Two studies were conducted in the USA,19,46 one in Brazil,27 one inAustralia36 and one in Canada.47 Eleven studies included an international cohort.14,15,22,26,34,37,41,45–47,50
The QAngio XA 3D/QFR studies analysed a total of 5440 patients (over 6524 vessels or lesions), andCAAS vFFR studies analysed a total of 500 patients (over 519 vessels or lesions). Most studies includeda mixed population of stable and unstable CAD, although 11 studies focused only on patients withstable CAD.23,27,31–33,35,44,46,48,49,53 Three studies evaluated non-culprit vessels in patients with MI,17,28,41
two focused exclusively on patients with three-vessel disease,15,23 one study included only patients withintermediate left main stenosis (mostly left main bifurcation)22 and one focused specifically on in-stentrestenosis.34 Where reported, mean age ranged from 59.0 to 72.5 years, and most participants weremale (60–93%). Patient history and stenosis severity varied widely across studies. The prevalence ofdiabetes ranged from 6% to 48%, rates of previous MI from 4% to 58%, and previous PCI 4% to 65%(not accounting for one study with 100% in-stent restenosis).34 The mean/median FFR ranged from0.75 to 0.88, and mean DS from 37% to 66%.
Quality of diagnostic accuracy studiesTable 2 summarises the results of the risk-of-bias and applicability assessment for QAngio XA 3D/QFRfor the 24 diagnostic accuracy studies reported in a full-text manuscript, with further details reported inAppendix 3, Tables 36 and 37. The risk of bias from the 15 studies included in the diagnostic accuracyreview that were reported only as conference abstracts was not formally assessed because of insufficientreporting.14,16,18,22,25–31,35,36,38,39,44,54 Just as with FAST-EXTEND,18 the extension of the FAST study wasreported as conference abstract only; only the quality of the earlier FAST study was assessed.56
A total of 11 out of the 22 QAngio XA 3D/QFR studies were rated as being at low risk of bias acrossall domains.20,21,37,41,42,45,46,49–52 The main source of bias was related to study participant selection;four studies were considered at high risk of patient selection bias because of high rates of patientexclusions or significant exclusion of potentially harder to diagnose patients,17,23,24,32 and three studiesdid not provide sufficient information on patient selection to assess risk of selection bias (unclearrisk).34,43,48 Exclusion rates and reasons are reported in Appendix 3, Table 37. Risk of bias was rated asbeing generally low for other domains, although three studies were rated as being at high risk of biasbecause of the conduct of the index test or reference standard (e.g. no reporting of blinding betweenQFR and FFR results),33,48,53 and one study was rated as being at high risk of bias because of patientflow concerns, as FFR was performed only in iFR grey-zone patients.15
The ILUMIEN I19 trial was the only CAAS vFFR complete study with a full-text manuscript. The study wasrated as being at high risk of bias because of the large percentage of lesions excluded from the study(65%). In an earlier published report of the FAST-EXTEND study, Masdjedi et al.56 also reported a highrate of exclusions (54%). Although most of these failed tests appear to have been due to angiographicimage processing issues rather than limitations inherent in CAAS vFFR (see Test failures: rates andreasons), the large exclusion rates reported mean that the risk of selection bias cannot be excluded.
Only three studies raised no concerns about their applicability to the review question.48–50 The mainconcern about applicability related to QFR being used retrospectively (offline) rather than as part ofthe ICA examination and before FFR; only five studies (all of QAngio XA 3D/QFR) were conductedprospectively and raised no significant concerns regarding the applicability of the index test.48–52 Therewere no significant concerns regarding the applicability of the reference standard in any of the studies.A total of 12 out of the 22 QAngio XA 3D/QFR studies did not raise significant concerns about theapplicability of their population to the review question;23,32,33,37,40,42,45,46,48–50,53 concerns about studypopulation applicability were primarily related to the under-representation of patients with stable CAD.
DOI: 10.3310/hta25560 Health Technology Assessment 2021 Vol. 25 No. 56
© Queen’s Printer and Controller of HMSO 2021. This work was produced by Duarte et al. under the terms of a commissioning contract issued by the Secretary of Statefor Health and Social Care. This issue may be freely reproduced for the purposes of private research and study and extracts (or indeed, the full report) may be included inprofessional journals provided that suitable acknowledgement is made and the reproduction is not associated with any form of advertising. Applications for commercialreproduction should be addressed to: NIHR Journals Library, National Institute for Health Research, Evaluation, Trials and Studies Coordinating Centre, Alpha House,University of Southampton Science Park, Southampton SO16 7NS, UK.
19
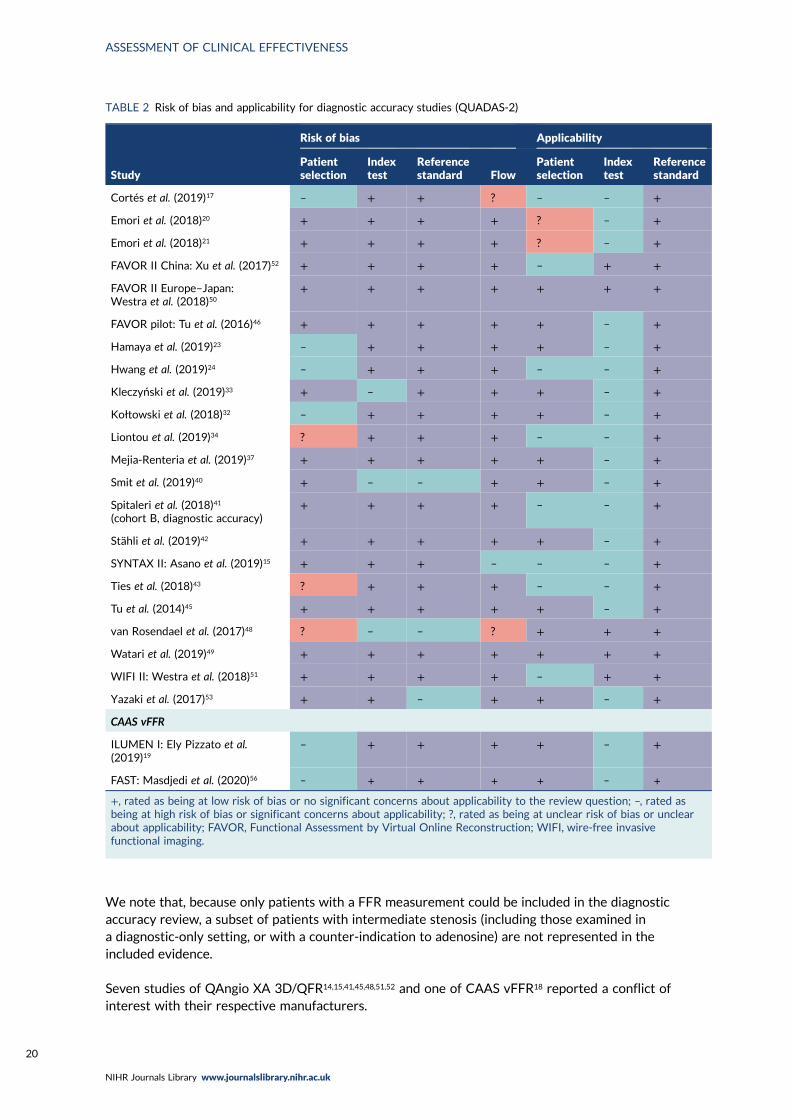
We note that, because only patients with a FFR measurement could be included in the diagnosticaccuracy review, a subset of patients with intermediate stenosis (including those examined ina diagnostic-only setting, or with a counter-indication to adenosine) are not represented in theincluded evidence.
Seven studies of QAngio XA 3D/QFR14,15,41,45,48,51,52 and one of CAAS vFFR18 reported a conflict ofinterest with their respective manufacturers.
TABLE 2 Risk of bias and applicability for diagnostic accuracy studies (QUADAS-2)
Study
Risk of bias Applicability
Patientselection
Indextest
Referencestandard Flow
Patientselection
Indextest
Referencestandard
Cortés et al. (2019)17 – + + ? – – +
Emori et al. (2018)20 + + + + ? – +
Emori et al. (2018)21 + + + + ? – +
FAVOR II China: Xu et al. (2017)52 + + + + – + +
FAVOR II Europe–Japan:Westra et al. (2018)50
+ + + + + + +
FAVOR pilot: Tu et al. (2016)46 + + + + + – +
Hamaya et al. (2019)23 – + + + + – +
Hwang et al. (2019)24 – + + + – – +
Kleczyński et al. (2019)33 + – + + + – +
Kołtowski et al. (2018)32 – + + + + – +
Liontou et al. (2019)34 ? + + + – – +
Mejia-Renteria et al. (2019)37 + + + + + – +
Smit et al. (2019)40 + – – + + – +
Spitaleri et al. (2018)41
(cohort B, diagnostic accuracy)+ + + + – – +
Stähli et al. (2019)42 + + + + + – +
SYNTAX II: Asano et al. (2019)15 + + + – – – +
Ties et al. (2018)43 ? + + + – – +
Tu et al. (2014)45 + + + + + – +
van Rosendael et al. (2017)48 ? – – ? + + +
Watari et al. (2019)49 + + + + + + +
WIFI II: Westra et al. (2018)51 + + + + – + +
Yazaki et al. (2017)53 + + – + + – +
CAAS vFFR
ILUMEN I: Ely Pizzato et al.(2019)19
– + + + + – +
FAST: Masdjedi et al. (2020)56 – + + + + – +
+, rated as being at low risk of bias or no significant concerns about applicability to the review question; –, rated asbeing at high risk of bias or significant concerns about applicability; ?, rated as being at unclear risk of bias or unclearabout applicability; FAVOR, Functional Assessment by Virtual Online Reconstruction; WIFI, wire-free invasivefunctional imaging.
ASSESSMENT OF CLINICAL EFFECTIVENESS
NIHR Journals Library www.journalslibrary.nihr.ac.uk
20
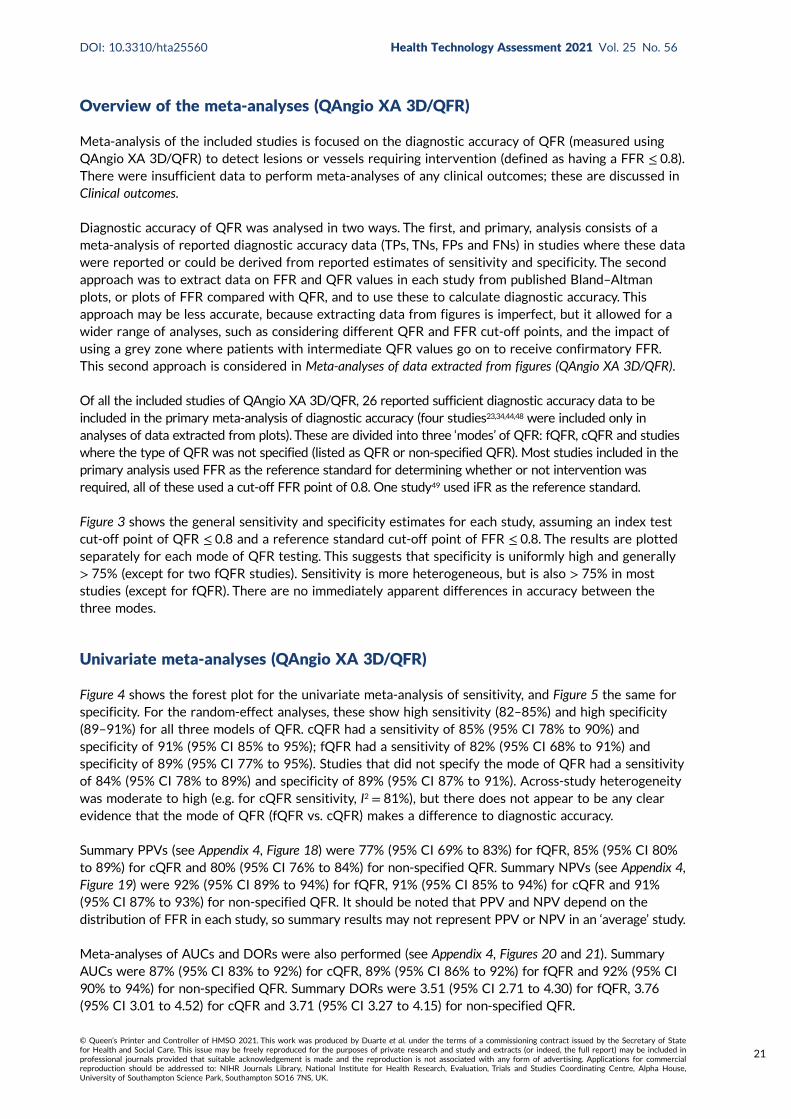
Overview of the meta-analyses (QAngio XA 3D/QFR)
Meta-analysis of the included studies is focused on the diagnostic accuracy of QFR (measured usingQAngio XA 3D/QFR) to detect lesions or vessels requiring intervention (defined as having a FFR ≤ 0.8).There were insufficient data to perform meta-analyses of any clinical outcomes; these are discussed inClinical outcomes.
Diagnostic accuracy of QFR was analysed in two ways. The first, and primary, analysis consists of ameta-analysis of reported diagnostic accuracy data (TPs, TNs, FPs and FNs) in studies where these datawere reported or could be derived from reported estimates of sensitivity and specificity. The secondapproach was to extract data on FFR and QFR values in each study from published Bland–Altmanplots, or plots of FFR compared with QFR, and to use these to calculate diagnostic accuracy. Thisapproach may be less accurate, because extracting data from figures is imperfect, but it allowed for awider range of analyses, such as considering different QFR and FFR cut-off points, and the impact ofusing a grey zone where patients with intermediate QFR values go on to receive confirmatory FFR.This second approach is considered in Meta-analyses of data extracted from figures (QAngio XA 3D/QFR).
Of all the included studies of QAngio XA 3D/QFR, 26 reported sufficient diagnostic accuracy data to beincluded in the primary meta-analysis of diagnostic accuracy (four studies23,34,44,48 were included only inanalyses of data extracted from plots). These are divided into three ‘modes’ of QFR: fQFR, cQFR and studieswhere the type of QFR was not specified (listed as QFR or non-specified QFR). Most studies included in theprimary analysis used FFR as the reference standard for determining whether or not intervention wasrequired, all of these used a cut-off FFR point of 0.8. One study49 used iFR as the reference standard.
Figure 3 shows the general sensitivity and specificity estimates for each study, assuming an index testcut-off point of QFR ≤ 0.8 and a reference standard cut-off point of FFR ≤ 0.8. The results are plottedseparately for each mode of QFR testing. This suggests that specificity is uniformly high and generally> 75% (except for two fQFR studies). Sensitivity is more heterogeneous, but is also > 75% in moststudies (except for fQFR). There are no immediately apparent differences in accuracy between thethree modes.
Univariate meta-analyses (QAngio XA 3D/QFR)
Figure 4 shows the forest plot for the univariate meta-analysis of sensitivity, and Figure 5 the same forspecificity. For the random-effect analyses, these show high sensitivity (82–85%) and high specificity(89–91%) for all three models of QFR. cQFR had a sensitivity of 85% (95% CI 78% to 90%) andspecificity of 91% (95% CI 85% to 95%); fQFR had a sensitivity of 82% (95% CI 68% to 91%) andspecificity of 89% (95% CI 77% to 95%). Studies that did not specify the mode of QFR had a sensitivityof 84% (95% CI 78% to 89%) and specificity of 89% (95% CI 87% to 91%). Across-study heterogeneitywas moderate to high (e.g. for cQFR sensitivity, I2 = 81%), but there does not appear to be any clearevidence that the mode of QFR (fQFR vs. cQFR) makes a difference to diagnostic accuracy.
Summary PPVs (see Appendix 4, Figure 18) were 77% (95% CI 69% to 83%) for fQFR, 85% (95% CI 80%to 89%) for cQFR and 80% (95% CI 76% to 84%) for non-specified QFR. Summary NPVs (see Appendix 4,Figure 19) were 92% (95% CI 89% to 94%) for fQFR, 91% (95% CI 85% to 94%) for cQFR and 91%(95% CI 87% to 93%) for non-specified QFR. It should be noted that PPV and NPV depend on thedistribution of FFR in each study, so summary results may not represent PPV or NPV in an ‘average’ study.
Meta-analyses of AUCs and DORs were also performed (see Appendix 4, Figures 20 and 21). SummaryAUCs were 87% (95% CI 83% to 92%) for cQFR, 89% (95% CI 86% to 92%) for fQFR and 92% (95% CI90% to 94%) for non-specified QFR. Summary DORs were 3.51 (95% CI 2.71 to 4.30) for fQFR, 3.76(95% CI 3.01 to 4.52) for cQFR and 3.71 (95% CI 3.27 to 4.15) for non-specified QFR.
DOI: 10.3310/hta25560 Health Technology Assessment 2021 Vol. 25 No. 56
© Queen’s Printer and Controller of HMSO 2021. This work was produced by Duarte et al. under the terms of a commissioning contract issued by the Secretary of Statefor Health and Social Care. This issue may be freely reproduced for the purposes of private research and study and extracts (or indeed, the full report) may be included inprofessional journals provided that suitable acknowledgement is made and the reproduction is not associated with any form of advertising. Applications for commercialreproduction should be addressed to: NIHR Journals Library, National Institute for Health Research, Evaluation, Trials and Studies Coordinating Centre, Alpha House,University of Southampton Science Park, Southampton SO16 7NS, UK.
21
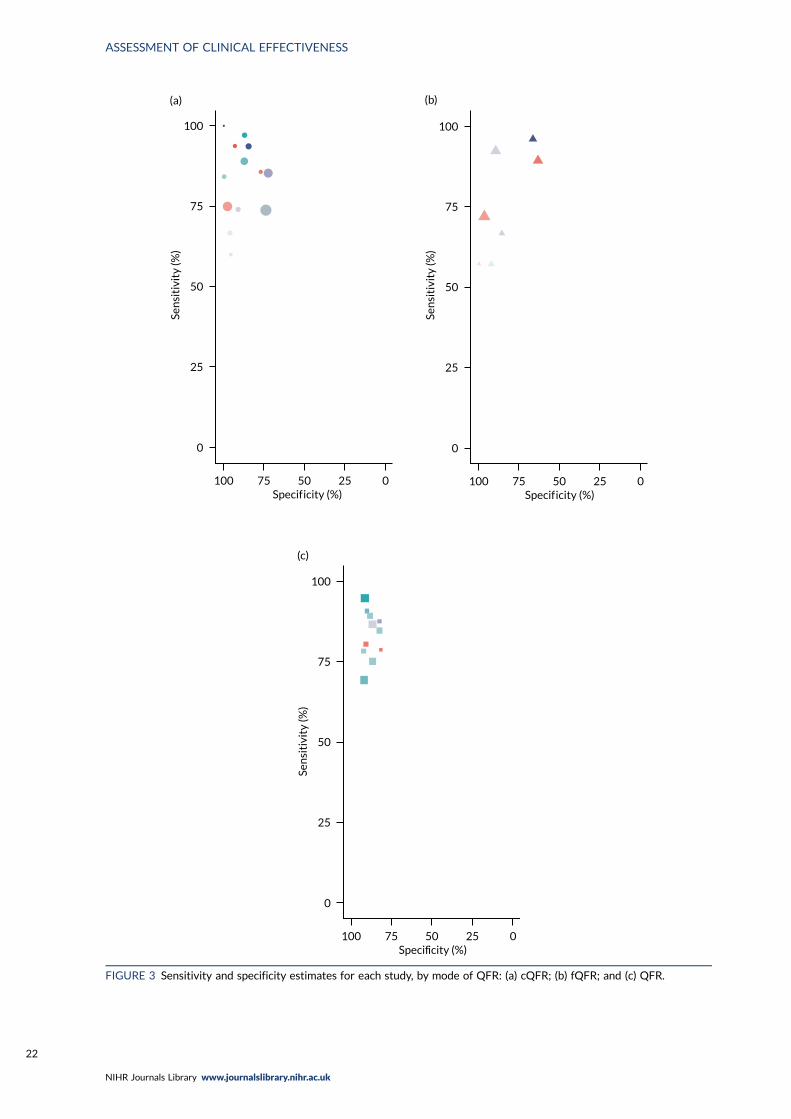
100
75
50
25
0
Sen
siti
vity
(%)
100 75 50 25 0Specif icity (%)
(a)
100
75
50
25
0
Sen
siti
vity
(%)
100 75 50 25 0Specif icity (%)
(b)
100
75
50
25
0
Sen
siti
vity
(%)
100 75 50 25 0Specif icity (%)
(c)
FIGURE 3 Sensitivity and specificity estimates for each study, by mode of QFR: (a) cQFR; (b) fQFR; and (c) QFR.
ASSESSMENT OF CLINICAL EFFECTIVENESS
NIHR Journals Library www.journalslibrary.nihr.ac.uk
22
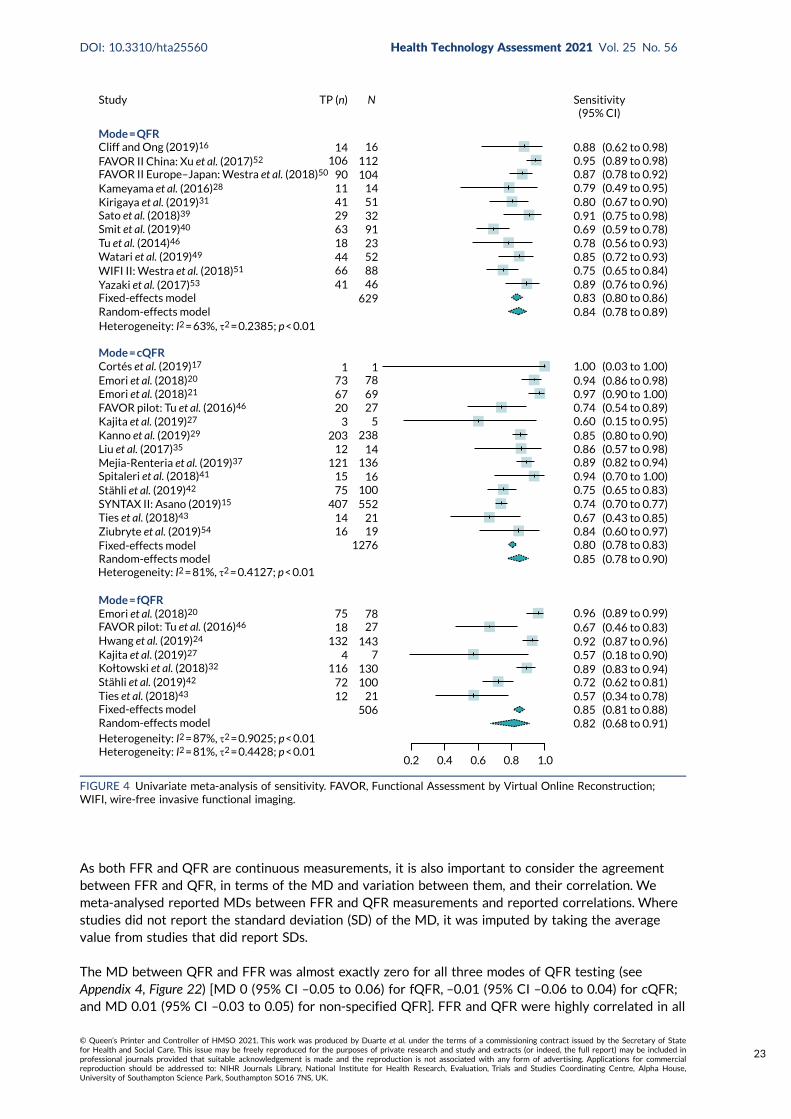
As both FFR and QFR are continuous measurements, it is also important to consider the agreementbetween FFR and QFR, in terms of the MD and variation between them, and their correlation. Wemeta-analysed reported MDs between FFR and QFR measurements and reported correlations. Wherestudies did not report the standard deviation (SD) of the MD, it was imputed by taking the averagevalue from studies that did report SDs.
The MD between QFR and FFR was almost exactly zero for all three modes of QFR testing (seeAppendix 4, Figure 22) [MD 0 (95% CI –0.05 to 0.06) for fQFR, –0.01 (95% CI –0.06 to 0.04) for cQFR;and MD 0.01 (95% CI –0.03 to 0.05) for non-specified QFR]. FFR and QFR were highly correlated in all
Study TP (n) N Sensitivity(95% CI)
0.88 (0.62 to 0.98)0.95 (0.89 to 0.98)0.87 (0.78 to 0.92)0.79 (0.49 to 0.95)0.80 (0.67 to 0.90)0.91 (0.75 to 0.98)0.69 (0.59 to 0.78)0.78 (0.56 to 0.93)0.85 (0.72 to 0.93)0.75 (0.65 to 0.84)0.89 (0.76 to 0.96)0.83 (0.80 to 0.86)0.84 (0.78 to 0.89)
1.00 (0.03 to 1.00)0.94 (0.86 to 0.98)0.97 (0.90 to 1.00)0.74 (0.54 to 0.89)0.60 (0.15 to 0.95)0.85 (0.80 to 0.90)0.86 (0.57 to 0.98)0.89 (0.82 to 0.94)0.94 (0.70 to 1.00)0.75 (0.65 to 0.83)0.74 (0.70 to 0.77)0.67 (0.43 to 0.85)0.84 (0.60 to 0.97)0.80 (0.78 to 0.83)0.85 (0.78 to 0.90)
0.96 (0.89 to 0.99)0.67 (0.46 to 0.83)0.92 (0.87 to 0.96)0.57 (0.18 to 0.90)0.89 (0.83 to 0.94)0.72 (0.62 to 0.81)0.57 (0.34 to 0.78)0.85 (0.81 to 0.88)0.82 (0.68 to 0.91)
Mode = QFRCliff and Ong (2019)16
FAVOR II China: Xu et al. (2017)52
FAVOR II Europe–Japan: Westra et al. (2018)50
Kameyama et al. (2016)28
Kirigaya et al. (2019)31
Sato et al. (2018)39
Smit et al. (2019)40
Tu et al. (2014)46
Watari et al. (2019)49
WIFI II: Westra et al. (2018)51
Yazaki et al. (2017)53
Fixed-effects modelRandom-effects modelHeterogeneity: I2 = 63%, τ2 = 0.2385; p < 0.01
Heterogeneity: I2 = 81%, τ2 = 0.4127; p < 0.01
Heterogeneity: I2 = 87%, τ2 = 0.9025; p < 0.01Heterogeneity: I2 = 81%, τ2 = 0.4428; p < 0.01
Mode = cQFR
Mode = fQFR
Cortés et al. (2019)17
Emori et al. (2018)20
Emori et al. (2018)20
Emori et al. (2018)21
FAVOR pilot: Tu et al. (2016)46
FAVOR pilot: Tu et al. (2016)46
Kajita et al. (2019)27
Kanno et al. (2019)29
Liu et al. (2017)35
Mejia-Renteria et al. (2019)37
Spitaleri et al. (2018)41
Stähli et al. (2019)42
SYNTAX II: Asano (2019)15
Ties et al. (2018)43
Ziubryte et al. (2019)54
Fixed-effects model
Fixed-effects model
Random-effects model
Random-effects model
Hwang et al. (2019)24
Kajita et al. (2019)27
Stähli et al. (2019)42
Ties et al. (2018)43
Kołtowski et al. (2018)32
12 21506
72116
4 7130100
1431321875 78
27
12761921
552
1614
407100
167515
12112 14
136
5238203
320 27
696773
1 178
629468852
41664418 23
913251
63294111 14
104112
1614
90106
0.2 0.4 0.6 0.8 1.0
FIGURE 4 Univariate meta-analysis of sensitivity. FAVOR, Functional Assessment by Virtual Online Reconstruction;WIFI, wire-free invasive functional imaging.
DOI: 10.3310/hta25560 Health Technology Assessment 2021 Vol. 25 No. 56
© Queen’s Printer and Controller of HMSO 2021. This work was produced by Duarte et al. under the terms of a commissioning contract issued by the Secretary of Statefor Health and Social Care. This issue may be freely reproduced for the purposes of private research and study and extracts (or indeed, the full report) may be included inprofessional journals provided that suitable acknowledgement is made and the reproduction is not associated with any form of advertising. Applications for commercialreproduction should be addressed to: NIHR Journals Library, National Institute for Health Research, Evaluation, Trials and Studies Coordinating Centre, Alpha House,University of Southampton Science Park, Southampton SO16 7NS, UK.
23
studies (see Appendix 4, Figure 23): correlation coefficient 0.78 (95% CI 0.72 to 0.82) for fQFR,0.78 (95% CI 0.70 to 0.85) for cQFR and 0.79 (95% CI 0.73 to 0.83) for non-specified QFR. We notethat correlation coefficients are not a good measure of agreement between diagnostic tests; thismeta-analysis is included here for information only.
Bivariate meta-analysis (QAngio XA 3D/QFR)
The results of the full bivariate meta-analysis are summarised in Table 3 and Appendix 4, Figure 24.The results are almost identical to the univariate analyses, with no evidence of differences betweenfQFR and cQFR.
Study TN (n) N
0.5 0.6 0.7 0.8 0.9 1.0
Mode = QFR
Mode = cQFR
Mode = fQFR
1041
10 1061 7227 3152 5722 23
193 26620
143 16427 29
407 416190
77 80257
148150 50
26
48 7249 57
193 21525 25
112402
74 80416176
117693
1328150
2112840 44
31229
5498
152105
9 11213216
2319198185
Sensitivity (95% CI)
0.83 (0.61 to 0.95)0.92 (0.87 to 0.95)0.87 (0.82 to 0.91)0.82 (0.48 to 0.98)0.91 (0.78 to 0.97)0.90 (0.74 to 0.98)0.92 (0.88 to 0.95)0.93 (0.82 to 0.98)0.83 (0.74 to 0.90)0.87 (0.80 to 0.92)0.89 (0.81 to 0.94)0.89 (0.87 to 0.91)0.89 (0.87 to 0.91)
1.00 (0.69 to 1.00)0.85 (0.74 to 0.92)0.87 (0.70 to 0.96)0.91 (0.81 to 0.97)0.96 (0.78 to 1.00)0.73 (0.67 to 0.78)0.77 (0.56 to 0.91)0.87 (0.81 to 0.92)0.93 (0.77 to 0.99)0.98 (0.96 to 0.99)0.74 (0.68 to 0.79)0.96 (0.89 to 0.99)
0.86 (0.85 to 0.88)0.91 (0.85 to 0.95)
0.67 (0.55 to 0.77)0.86 (0.74 to 0.94)0.90 (0.85 to 0.93)1.00 (0.86 to 1.00)0.64 (0.56 to 0.71)0.97 (0.94 to 0.98)0.92 (0.84 to 0.97)0.87 (0.85 to 0.89)0.89 (0.77 to 0.95)
1.00 (0.93 to 1.00)
Heterogeneity: I2 = 19%, τ2 = 0.0239; p = 0.31
Heterogeneity: I2 = 91%, τ2 = 0.9938; p < 0.01
Heterogeneity: I2 = 94%, τ2 = 1.1992; p < 0.01Heterogeneity: I2 = 88%, τ2 = 0.6370; p < 0.01
Cliff and Ong (2019)16
FAVOR II China: Xu et al. (2017)52
FAVOR II Europe–Japan: Westra et al. (2018)50
Kameyama et al. (2016)28
Kirigaya et al. (2019)31
Sato et al. (2018)39
Smit et al. (2019)40
Tu et al. (2014)45
Watari et al. (2019)49
WIFI II: Westra et al. (2018)51
Yazaki et al. (2017)53
Fixed-effects modelRandom-effects model
Cortés et al. (2019)17
Emori et al. (2018)20
Emori et al. (2018)21
FAVOR pilot: Tu et al. (2016)46
Kajita et al. (2019)27
Kanno et al. (2019)29
Liu et al. (2017)35
Mejia-Renteria et al. (2019)37
Spitaleri et al. (2018)41
Stähli et al. (2019)42
SYNTAX II: Asano (2019)15
Ties et al. (2018)43
Ziubryte et al. (2019)54
Fixed-effects modelRandom-effects model
Emori et al. (2018)20
FAVOR pilot: Tu et al. (2016)46
Fixed-effects modelRandom-effects model
Hwang et al. (2019)24
Kajita et al. (2019)27
Stähli et al. (2019)42
Ties et al. (2018)43
Kołtowski et al. (2018)32
FIGURE 5 Univariate meta-analysis of specificity. FAVOR, Functional Assessment by Virtual Online Reconstruction;WIFI, wire-free invasive functional imaging.
ASSESSMENT OF CLINICAL EFFECTIVENESS
NIHR Journals Library www.journalslibrary.nihr.ac.uk
24
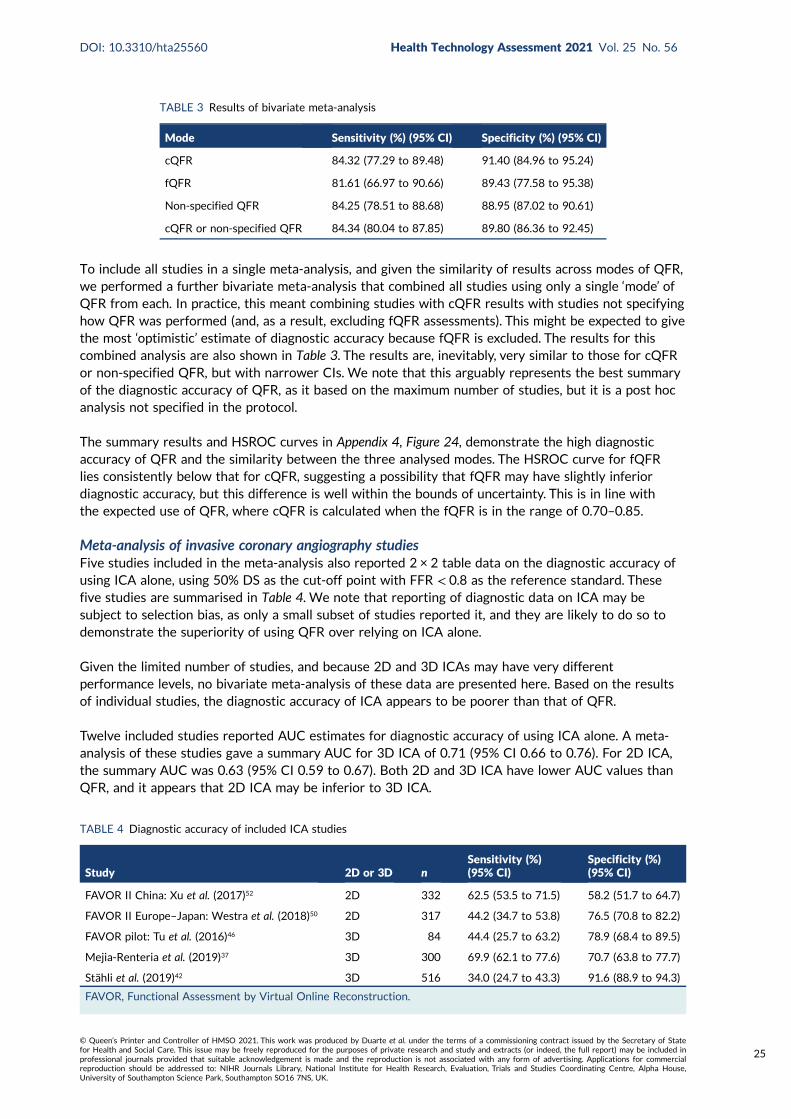
To include all studies in a single meta-analysis, and given the similarity of results across modes of QFR,we performed a further bivariate meta-analysis that combined all studies using only a single ‘mode’ ofQFR from each. In practice, this meant combining studies with cQFR results with studies not specifyinghow QFR was performed (and, as a result, excluding fQFR assessments). This might be expected to givethe most ‘optimistic’ estimate of diagnostic accuracy because fQFR is excluded. The results for thiscombined analysis are also shown in Table 3. The results are, inevitably, very similar to those for cQFRor non-specified QFR, but with narrower CIs. We note that this arguably represents the best summaryof the diagnostic accuracy of QFR, as it based on the maximum number of studies, but it is a post hocanalysis not specified in the protocol.
The summary results and HSROC curves in Appendix 4, Figure 24, demonstrate the high diagnosticaccuracy of QFR and the similarity between the three analysed modes. The HSROC curve for fQFRlies consistently below that for cQFR, suggesting a possibility that fQFR may have slightly inferiordiagnostic accuracy, but this difference is well within the bounds of uncertainty. This is in line withthe expected use of QFR, where cQFR is calculated when the fQFR is in the range of 0.70–0.85.
Meta-analysis of invasive coronary angiography studiesFive studies included in the meta-analysis also reported 2 × 2 table data on the diagnostic accuracy ofusing ICA alone, using 50% DS as the cut-off point with FFR < 0.8 as the reference standard. Thesefive studies are summarised in Table 4. We note that reporting of diagnostic data on ICA may besubject to selection bias, as only a small subset of studies reported it, and they are likely to do so todemonstrate the superiority of using QFR over relying on ICA alone.
Given the limited number of studies, and because 2D and 3D ICAs may have very differentperformance levels, no bivariate meta-analysis of these data are presented here. Based on the resultsof individual studies, the diagnostic accuracy of ICA appears to be poorer than that of QFR.
Twelve included studies reported AUC estimates for diagnostic accuracy of using ICA alone. A meta-analysis of these studies gave a summary AUC for 3D ICA of 0.71 (95% CI 0.66 to 0.76). For 2D ICA,the summary AUC was 0.63 (95% CI 0.59 to 0.67). Both 2D and 3D ICA have lower AUC values thanQFR, and it appears that 2D ICA may be inferior to 3D ICA.
TABLE 3 Results of bivariate meta-analysis
Mode Sensitivity (%) (95% CI) Specificity (%) (95% CI)
cQFR 84.32 (77.29 to 89.48) 91.40 (84.96 to 95.24)
fQFR 81.61 (66.97 to 90.66) 89.43 (77.58 to 95.38)
Non-specified QFR 84.25 (78.51 to 88.68) 88.95 (87.02 to 90.61)
cQFR or non-specified QFR 84.34 (80.04 to 87.85) 89.80 (86.36 to 92.45)
TABLE 4 Diagnostic accuracy of included ICA studies
Study 2D or 3D nSensitivity (%)(95% CI)
Specificity (%)(95% CI)
FAVOR II China: Xu et al. (2017)52 2D 332 62.5 (53.5 to 71.5) 58.2 (51.7 to 64.7)
FAVOR II Europe–Japan: Westra et al. (2018)50 2D 317 44.2 (34.7 to 53.8) 76.5 (70.8 to 82.2)
FAVOR pilot: Tu et al. (2016)46 3D 84 44.4 (25.7 to 63.2) 78.9 (68.4 to 89.5)
Mejia-Renteria et al. (2019)37 3D 300 69.9 (62.1 to 77.6) 70.7 (63.8 to 77.7)
Stähli et al. (2019)42 3D 516 34.0 (24.7 to 43.3) 91.6 (88.9 to 94.3)
FAVOR, Functional Assessment by Virtual Online Reconstruction.
DOI: 10.3310/hta25560 Health Technology Assessment 2021 Vol. 25 No. 56
© Queen’s Printer and Controller of HMSO 2021. This work was produced by Duarte et al. under the terms of a commissioning contract issued by the Secretary of Statefor Health and Social Care. This issue may be freely reproduced for the purposes of private research and study and extracts (or indeed, the full report) may be included inprofessional journals provided that suitable acknowledgement is made and the reproduction is not associated with any form of advertising. Applications for commercialreproduction should be addressed to: NIHR Journals Library, National Institute for Health Research, Evaluation, Trials and Studies Coordinating Centre, Alpha House,University of Southampton Science Park, Southampton SO16 7NS, UK.
25
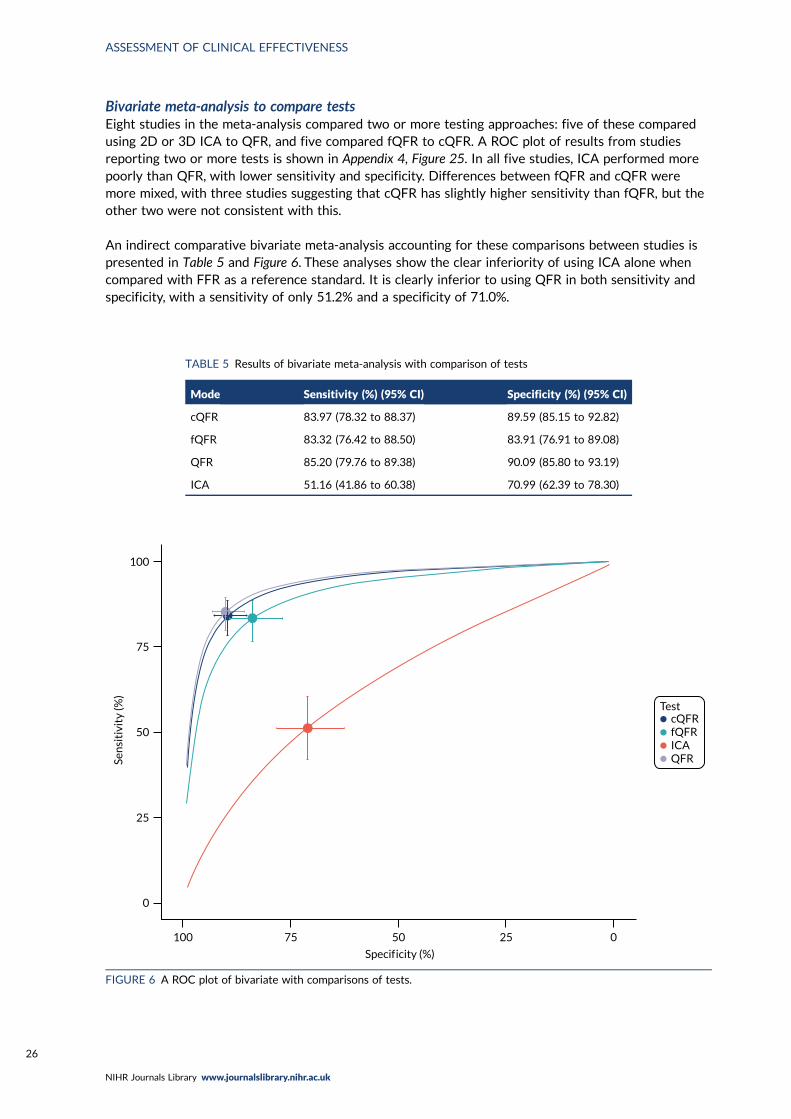
Bivariate meta-analysis to compare testsEight studies in the meta-analysis compared two or more testing approaches: five of these comparedusing 2D or 3D ICA to QFR, and five compared fQFR to cQFR. A ROC plot of results from studiesreporting two or more tests is shown in Appendix 4, Figure 25. In all five studies, ICA performed morepoorly than QFR, with lower sensitivity and specificity. Differences between fQFR and cQFR weremore mixed, with three studies suggesting that cQFR has slightly higher sensitivity than fQFR, but theother two were not consistent with this.
An indirect comparative bivariate meta-analysis accounting for these comparisons between studies ispresented in Table 5 and Figure 6. These analyses show the clear inferiority of using ICA alone whencompared with FFR as a reference standard. It is clearly inferior to using QFR in both sensitivity andspecificity, with a sensitivity of only 51.2% and a specificity of 71.0%.
TABLE 5 Results of bivariate meta-analysis with comparison of tests
Mode Sensitivity (%) (95% CI) Specificity (%) (95% CI)
cQFR 83.97 (78.32 to 88.37) 89.59 (85.15 to 92.82)
fQFR 83.32 (76.42 to 88.50) 83.91 (76.91 to 89.08)
QFR 85.20 (79.76 to 89.38) 90.09 (85.80 to 93.19)
ICA 51.16 (41.86 to 60.38) 70.99 (62.39 to 78.30)
100
75
50
25
0
cQFRfQFRICAQFR
Test
Sen
siti
vity
(%)
100 75 50 25 0
Specif icity (%)
FIGURE 6 A ROC plot of bivariate with comparisons of tests.
ASSESSMENT OF CLINICAL EFFECTIVENESS
NIHR Journals Library www.journalslibrary.nihr.ac.uk
26
Unlike the earlier bivariate meta-analysis (see Appendix 4, Figure 24), the comparative analysis suggests thatfQFR is slightly inferior to cQFR, mainly due to an inferior specificity (83.9% instead of 89.6%). This suggeststhat fQFR produces slightly too many FP results (where QFR ≤ 0.8 but FFR > 0.8). This might suggest that ifan initial fQFR produces a result less than 0.8 it should be followed up by a confirmatory cQFR.
Impact of patient and study characteristics (QAngio XA 3D/QFR)
Impact of study characteristicsReceiver operating characteristic plots differentiating between studies reporting at patient, vesselor lesion level found no evidence that this affects diagnostic accuracy (see Appendix 4, Figure 26).There was also no evidence of any impact on diagnostic accuracy in studies where more than oneapproach was reported. We note that, where there was more than one lesion assessed, ‘by-patient’ and‘by-vessel’ analyses selected a single lesion (either at random or based on clinical importance), so a lackof difference is unsurprising, as it would only arise if the choice of lesion was biased. It should also benoted that by-lesion analysis could be biased because of correlation between lesions within patients.Without full patient-level data, the impact this might have cannot be assessed.
There was no evidence of difference in diagnostic accuracy between prospective and retrospectiveanalyses of QFR (see Appendix 4, Figure 27).
Impact of patient factorsFew studies reported diagnostic accuracy data in any form according to different patient characteristics(such as distinguishing between people with and without diabetes, or with and without multivesseldisease). The limited evidence reported is discussed in Clinical outcomes.
Given this lack of evidence, to investigate the impact on diagnostic accuracy of key patient factors wehave performed meta-regressions of sensitivity, specificity and DOR against the mean value of thesefactors, where reported in papers. These analyses are obviously limited by being meta-regressionsof study-level proportions, rather than true analyses of patient-level data, and because of limitedreporting of these factors across studies. For these analyses we did not separate fQFR from cQFR butused one test per study (cQFR for preference) to maximise data. This was considered reasonable giventhat diagnostic accuracy does not strongly depend on the mode of QFR used.
Appendix 4, Table 38, shows the regression parameter estimates (change in log-DOR, sensitivity orspecificity per unit of the covariate), their 95% CIs and p-values from these metaregression analyses.For most parameters there is no evidence of any association with diagnostic accuracy. However, thismay be due to a lack of data rather than no association.
Four patient factors (i.e. diabetes, stable CAD, multivessel disease and mean FFR) suggest a possibility ofassociation, as all have at least one p-value below 0.05. Plots of the proportions of patients with thesefactors, against estimated sensitivity, specificity and log-DOR are shown in Appendix 4, Figures 28–31.
The association between diabetes and diagnostic accuracy is partly driven by one study where nearly allpatients had diabetes, but the trend for studies with more diabetic patients to have higher sensitivityand DOR remains even if that study is removed. There is a trend for specificity and DOR to declineas higher proportions of patients have stable CAD. Conversely, specificity and DOR increase as morepatients have multivessel disease (although this is based on only five studies32,37,41,42,51).
There is evidence that the lower the average FFR in a study, the higher the sensitivity and the lowerthe specificity (but with no impact on the overall accuracy in terms of the DOR). We might thereforealso expect some variation in diagnostic accuracy with any factor that lowers FFR (DS, medical history,etc.) but the data are too limited to confirm this.
DOI: 10.3310/hta25560 Health Technology Assessment 2021 Vol. 25 No. 56
© Queen’s Printer and Controller of HMSO 2021. This work was produced by Duarte et al. under the terms of a commissioning contract issued by the Secretary of Statefor Health and Social Care. This issue may be freely reproduced for the purposes of private research and study and extracts (or indeed, the full report) may be included inprofessional journals provided that suitable acknowledgement is made and the reproduction is not associated with any form of advertising. Applications for commercialreproduction should be addressed to: NIHR Journals Library, National Institute for Health Research, Evaluation, Trials and Studies Coordinating Centre, Alpha House,University of Southampton Science Park, Southampton SO16 7NS, UK.
27
Subgroup analysesEleven studies reported diagnostic accuracy results stratified by patient or vessel characteristics20,21,24,29,32,38,42,51,52,57,58 and four studies reported results of multivariate regression analyses of predictors of QFR/FFRdiscrepancies.15,37,50,51 All studies were of QAngio XA 3D/QFR.
The number of subgroup analyses was too small to allow meta-analysis and results are summarisednarratively, and in figures. None of the analyses reported in the included studies was prespecified in aprospectively registered protocol. All patient characteristics for which subgroup data were reportedwere specified in the review protocol [high/low index of microcirculatory resistance (IMR) small/non-small vessel diameter, multiple/single lesion, diabetes/no diabetes, MI history], except three[left anterior descending (LAD)/no LAD vessel, chronic kidney disease (CKD) and acute MI], whichare presented for the sake of completion.
Appendix 4, Figure 32, shows a ROC plot for five studies reporting sensitivity and specificity by subgroups,and Appendix 4, Figure 33, shows the DORs for the same studies. The results of subgroup analyses reportedin included diagnostic accuracy studies are summarised in Appendix 5, Tables 44 and 45.
Microcirculatory resistanceTwo studies explored the effect of microcirculatory resistance on the accuracy of QAngio XA 3D/QFRand showed inconsistent results.29,57 In both studies, patient populations were stratified according tomicrocirculatory status, defined by the IMR, the product of hyperemic Tmn and hyperemic distalarterial pressure and measured by pressure wire. Microcirculatory dysfunction was defined as ≥ 23 U(predefined as 75th centile of IMR values) in one study57 and as ≥ 25 U in the other.29 Results differedsignificantly between the two studies. Although both found a statistically significant difference indiagnostic accuracy between high- and low-IMR groups, one study found that the accuracy of QAngioXA 3D/QFR was reduced in patients with high IMR compared with low IMR [sensitivity 86% vs. 90%,specificity 69% vs. 94%, AUC 0.88 vs. 0.96, odds ratio (OR) of misclassification 1.05 (95% CI 1.02 to1.08)],57 whereas the other29 found that QAngio XA 3D/QFR had higher sensitivity but lower specificityin the high-IMR group (sensitivity 96.7% vs. 81.5%, specificity 64.2% vs. 77.2%).
Vessel characteristics and locationThere was limited evidence that vessel characteristics and location were associated with different ratesof QFR/FFR discrepancies, although two studies reported that vessels with bifurcation/trifurcationlesions were associated with poorer diagnostic accuracy than other vessels. The SYNTAX59 trial foundthat bifurcation/trifurcation were independent predictors for the increased incidence of FP QFR(OR 1.81, 95% CI 1.10 to 2.98), and one small study of 38 vessels reported that bifurcations lesionsaccounted for five out of six (83.3%) false measurements.38 One study22 that included only patientswith left main stenosis (85% left main bifurcation) had high sensitivity (84.8%) and moderate specificity(68.2%) (AUC 0.82, 95% CI 0.71 to 0.93). No other studies reported on the potential impact of leftmain stenosis on diagnostic accuracy.
Results from studies evaluating the effect of small vessel disease on diagnostic accuracy were mixed.One study found higher sensitivity and AUC for cQFR in patients with small-vessel disease (≤ 2.8 mmreference diameter), than in other patients [sensitivity 80.0% vs. 65.7%, specificity 98.5% vs. 97.2%,AUC 0.89 (95% CI 0.85 to 0.93) vs. 0.81 (95% CI 0.76 to 0.86)],60 whereas another study found thatsmall-vessel disease (≤ 2.5 mm reference diameter) was associated with an increased incidence of FNQFR (OR 1.67, 95% CI 1.14 to 2.44) in a multivariate analysis.15
One study found that found no significant differences in QAngio XA 3D/QFR accuracy betweensubgroups with LAD and non-LAD coronary arteries,21 although a multivariate analysis from SYNTAX II15
found a non-statistically significant trend suggesting LAD may be associated with a higher rate of FPs(OR 0.53, 95% CI 0.27 to 1.04), and that lesions located in side branches were associated with a higherrate of FP QFR (OR 2.07, 95% CI 1.14 to 3.76) and FNs (OR 0.47, 95% CI 0.28 to 0.81).
ASSESSMENT OF CLINICAL EFFECTIVENESS
NIHR Journals Library www.journalslibrary.nihr.ac.uk
28
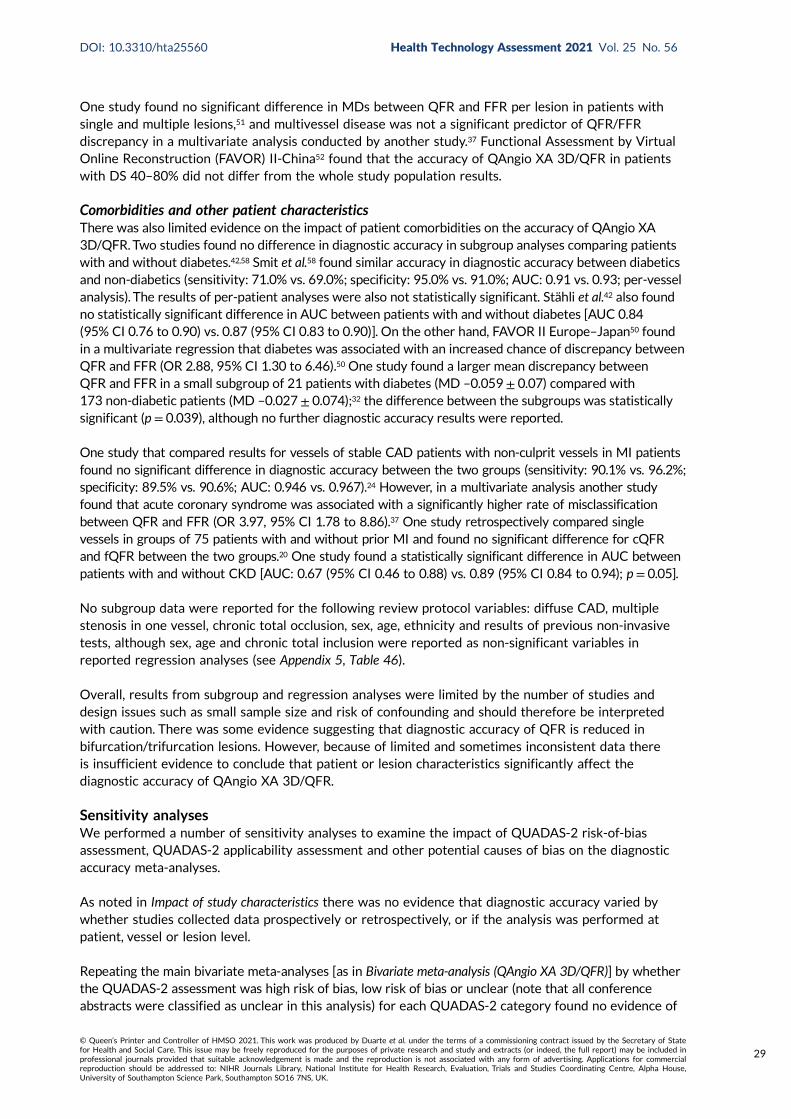
One study found no significant difference in MDs between QFR and FFR per lesion in patients withsingle and multiple lesions,51 and multivessel disease was not a significant predictor of QFR/FFRdiscrepancy in a multivariate analysis conducted by another study.37 Functional Assessment by VirtualOnline Reconstruction (FAVOR) II-China52 found that the accuracy of QAngio XA 3D/QFR in patientswith DS 40–80% did not differ from the whole study population results.
Comorbidities and other patient characteristicsThere was also limited evidence on the impact of patient comorbidities on the accuracy of QAngio XA3D/QFR.Two studies found no difference in diagnostic accuracy in subgroup analyses comparing patientswith and without diabetes.42,58 Smit et al.58 found similar accuracy in diagnostic accuracy between diabeticsand non-diabetics (sensitivity: 71.0% vs. 69.0%; specificity: 95.0% vs. 91.0%; AUC: 0.91 vs. 0.93; per-vesselanalysis). The results of per-patient analyses were also not statistically significant. Stähli et al.42 also foundno statistically significant difference in AUC between patients with and without diabetes [AUC 0.84(95% CI 0.76 to 0.90) vs. 0.87 (95% CI 0.83 to 0.90)]. On the other hand, FAVOR II Europe–Japan50 foundin a multivariate regression that diabetes was associated with an increased chance of discrepancy betweenQFR and FFR (OR 2.88, 95% CI 1.30 to 6.46).50 One study found a larger mean discrepancy betweenQFR and FFR in a small subgroup of 21 patients with diabetes (MD –0.059± 0.07) compared with173 non-diabetic patients (MD –0.027± 0.074);32 the difference between the subgroups was statisticallysignificant (p = 0.039), although no further diagnostic accuracy results were reported.
One study that compared results for vessels of stable CAD patients with non-culprit vessels in MI patientsfound no significant difference in diagnostic accuracy between the two groups (sensitivity: 90.1% vs. 96.2%;specificity: 89.5% vs. 90.6%; AUC: 0.946 vs. 0.967).24 However, in a multivariate analysis another studyfound that acute coronary syndrome was associated with a significantly higher rate of misclassificationbetween QFR and FFR (OR 3.97, 95% CI 1.78 to 8.86).37 One study retrospectively compared singlevessels in groups of 75 patients with and without prior MI and found no significant difference for cQFRand fQFR between the two groups.20 One study found a statistically significant difference in AUC betweenpatients with and without CKD [AUC: 0.67 (95% CI 0.46 to 0.88) vs. 0.89 (95% CI 0.84 to 0.94); p= 0.05].
No subgroup data were reported for the following review protocol variables: diffuse CAD, multiplestenosis in one vessel, chronic total occlusion, sex, age, ethnicity and results of previous non-invasivetests, although sex, age and chronic total inclusion were reported as non-significant variables inreported regression analyses (see Appendix 5, Table 46).
Overall, results from subgroup and regression analyses were limited by the number of studies anddesign issues such as small sample size and risk of confounding and should therefore be interpretedwith caution. There was some evidence suggesting that diagnostic accuracy of QFR is reduced inbifurcation/trifurcation lesions. However, because of limited and sometimes inconsistent data thereis insufficient evidence to conclude that patient or lesion characteristics significantly affect thediagnostic accuracy of QAngio XA 3D/QFR.
Sensitivity analysesWe performed a number of sensitivity analyses to examine the impact of QUADAS-2 risk-of-biasassessment, QUADAS-2 applicability assessment and other potential causes of bias on the diagnosticaccuracy meta-analyses.
As noted in Impact of study characteristics there was no evidence that diagnostic accuracy varied bywhether studies collected data prospectively or retrospectively, or if the analysis was performed atpatient, vessel or lesion level.
Repeating the main bivariate meta-analyses [as in Bivariate meta-analysis (QAngio XA 3D/QFR)] by whetherthe QUADAS-2 assessment was high risk of bias, low risk of bias or unclear (note that all conferenceabstracts were classified as unclear in this analysis) for each QUADAS-2 category found no evidence of
DOI: 10.3310/hta25560 Health Technology Assessment 2021 Vol. 25 No. 56
© Queen’s Printer and Controller of HMSO 2021. This work was produced by Duarte et al. under the terms of a commissioning contract issued by the Secretary of Statefor Health and Social Care. This issue may be freely reproduced for the purposes of private research and study and extracts (or indeed, the full report) may be included inprofessional journals provided that suitable acknowledgement is made and the reproduction is not associated with any form of advertising. Applications for commercialreproduction should be addressed to: NIHR Journals Library, National Institute for Health Research, Evaluation, Trials and Studies Coordinating Centre, Alpha House,University of Southampton Science Park, Southampton SO16 7NS, UK.
29
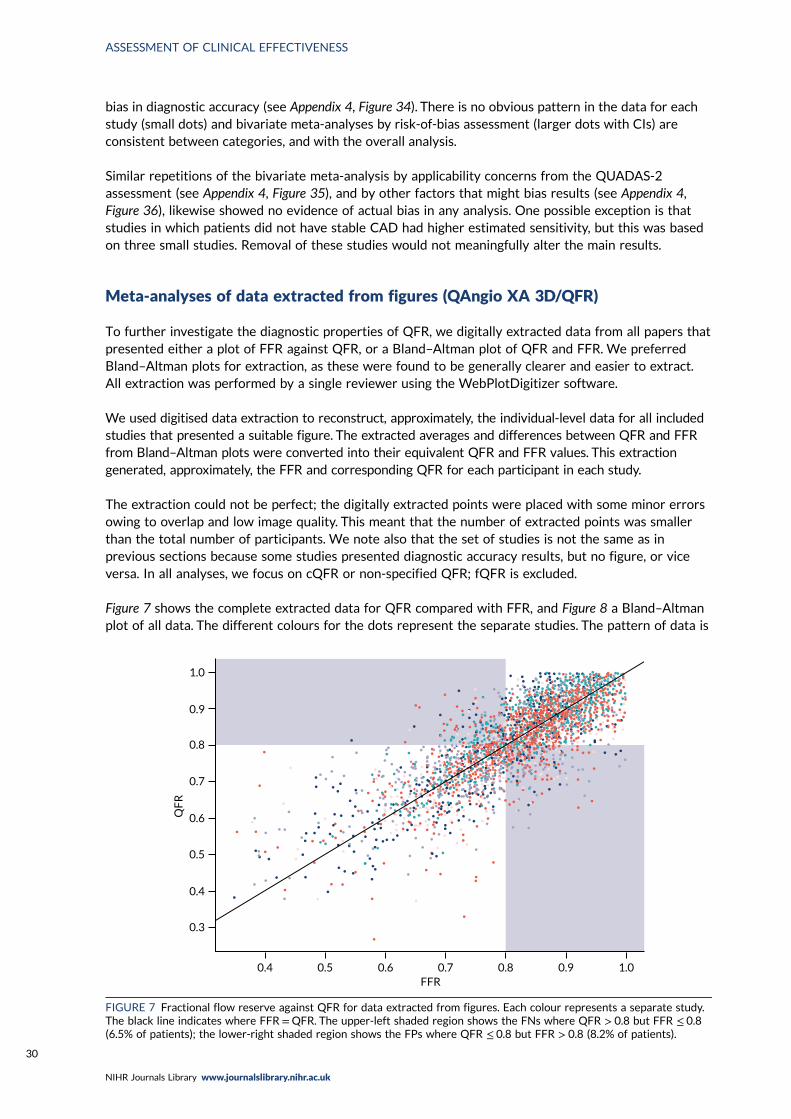
bias in diagnostic accuracy (see Appendix 4, Figure 34). There is no obvious pattern in the data for eachstudy (small dots) and bivariate meta-analyses by risk-of-bias assessment (larger dots with CIs) areconsistent between categories, and with the overall analysis.
Similar repetitions of the bivariate meta-analysis by applicability concerns from the QUADAS-2assessment (see Appendix 4, Figure 35), and by other factors that might bias results (see Appendix 4,Figure 36), likewise showed no evidence of actual bias in any analysis. One possible exception is thatstudies in which patients did not have stable CAD had higher estimated sensitivity, but this was basedon three small studies. Removal of these studies would not meaningfully alter the main results.
Meta-analyses of data extracted from figures (QAngio XA 3D/QFR)
To further investigate the diagnostic properties of QFR, we digitally extracted data from all papers thatpresented either a plot of FFR against QFR, or a Bland–Altman plot of QFR and FFR. We preferredBland–Altman plots for extraction, as these were found to be generally clearer and easier to extract.All extraction was performed by a single reviewer using the WebPlotDigitizer software.
We used digitised data extraction to reconstruct, approximately, the individual-level data for all includedstudies that presented a suitable figure. The extracted averages and differences between QFR and FFRfrom Bland–Altman plots were converted into their equivalent QFR and FFR values. This extractiongenerated, approximately, the FFR and corresponding QFR for each participant in each study.
The extraction could not be perfect; the digitally extracted points were placed with some minor errorsowing to overlap and low image quality. This meant that the number of extracted points was smallerthan the total number of participants. We note also that the set of studies is not the same as inprevious sections because some studies presented diagnostic accuracy results, but no figure, or viceversa. In all analyses, we focus on cQFR or non-specified QFR; fQFR is excluded.
Figure 7 shows the complete extracted data for QFR compared with FFR, and Figure 8 a Bland–Altmanplot of all data. The different colours for the dots represent the separate studies. The pattern of data is
1.0
0.9
0.8
0.7
0.6
0.5
0.4
0.3
0.4 0.5
QF
R
0.6 0.7 0.8 0.9 1.0FFR
FIGURE 7 Fractional flow reserve against QFR for data extracted from figures. Each colour represents a separate study.The black line indicates where FFR=QFR. The upper-left shaded region shows the FNs where QFR > 0.8 but FFR ≤ 0.8(6.5% of patients); the lower-right shaded region shows the FPs where QFR ≤ 0.8 but FFR > 0.8 (8.2% of patients).
ASSESSMENT OF CLINICAL EFFECTIVENESS
NIHR Journals Library www.journalslibrary.nihr.ac.uk
30
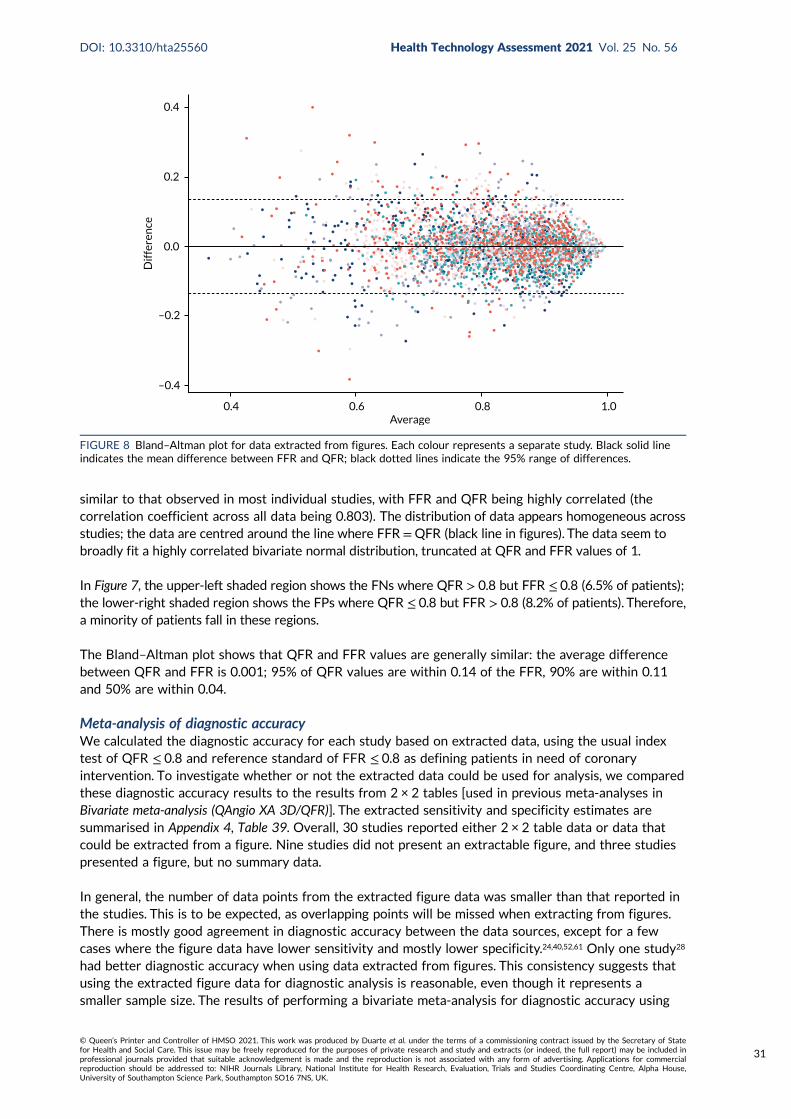
similar to that observed in most individual studies, with FFR and QFR being highly correlated (thecorrelation coefficient across all data being 0.803). The distribution of data appears homogeneous acrossstudies; the data are centred around the line where FFR =QFR (black line in figures). The data seem tobroadly fit a highly correlated bivariate normal distribution, truncated at QFR and FFR values of 1.
In Figure 7, the upper-left shaded region shows the FNs where QFR > 0.8 but FFR ≤ 0.8 (6.5% of patients);the lower-right shaded region shows the FPs where QFR ≤ 0.8 but FFR > 0.8 (8.2% of patients). Therefore,a minority of patients fall in these regions.
The Bland–Altman plot shows that QFR and FFR values are generally similar: the average differencebetween QFR and FFR is 0.001; 95% of QFR values are within 0.14 of the FFR, 90% are within 0.11and 50% are within 0.04.
Meta-analysis of diagnostic accuracyWe calculated the diagnostic accuracy for each study based on extracted data, using the usual indextest of QFR ≤ 0.8 and reference standard of FFR ≤ 0.8 as defining patients in need of coronaryintervention. To investigate whether or not the extracted data could be used for analysis, we comparedthese diagnostic accuracy results to the results from 2 × 2 tables [used in previous meta-analyses inBivariate meta-analysis (QAngio XA 3D/QFR)]. The extracted sensitivity and specificity estimates aresummarised in Appendix 4, Table 39. Overall, 30 studies reported either 2 × 2 table data or data thatcould be extracted from a figure. Nine studies did not present an extractable figure, and three studiespresented a figure, but no summary data.
In general, the number of data points from the extracted figure data was smaller than that reported inthe studies. This is to be expected, as overlapping points will be missed when extracting from figures.There is mostly good agreement in diagnostic accuracy between the data sources, except for a fewcases where the figure data have lower sensitivity and mostly lower specificity.24,40,52,61 Only one study28
had better diagnostic accuracy when using data extracted from figures. This consistency suggests thatusing the extracted figure data for diagnostic analysis is reasonable, even though it represents asmaller sample size. The results of performing a bivariate meta-analysis for diagnostic accuracy using
0.4
0.2
0.0
–0.2
–0.4
Dif
fere
nce
0.4 0.6 0.8 1.0Average
FIGURE 8 Bland–Altman plot for data extracted from figures. Each colour represents a separate study. Black solid lineindicates the mean difference between FFR and QFR; black dotted lines indicate the 95% range of differences.
DOI: 10.3310/hta25560 Health Technology Assessment 2021 Vol. 25 No. 56
© Queen’s Printer and Controller of HMSO 2021. This work was produced by Duarte et al. under the terms of a commissioning contract issued by the Secretary of Statefor Health and Social Care. This issue may be freely reproduced for the purposes of private research and study and extracts (or indeed, the full report) may be included inprofessional journals provided that suitable acknowledgement is made and the reproduction is not associated with any form of advertising. Applications for commercialreproduction should be addressed to: NIHR Journals Library, National Institute for Health Research, Evaluation, Trials and Studies Coordinating Centre, Alpha House,University of Southampton Science Park, Southampton SO16 7NS, UK.
31
the extracted figure data are shown in Appendix 4, Figure 37. The black points are the results ineach study, and the blue dot is the result of the meta-analysis (with its HSROC curve). The summarysensitivity is 84.6% (95% CI 80.7% to 87.8%) and specificity is 87.2% (95% CI 83.4% to 90.3%). Thisis similar to the results from the main analysis when cQFR and non-specified QFR were combined(sensitivity 84.3%, specificity 89.8%), albeit with slightly lower specificity, further confirming thatanalysing the extracted figure data are reasonable.
We note that this bivariate meta-analysis is presented to confirm that the extracted data reasonablyrepresent the properties of the included studies; the bivariate meta-analyses in Bivariate meta-analysis(QAngio XA 3D/QFR) should be taken as the primary analyses.
Grey-zone analysisThe main purpose of extracting data from figures is to permit an analysis where testing includes a greyzone of intermediate QFR values for which a FFR would be performed as a confirmatory test. Thegrey-zone diagnostic procedure is:
l perform QFRl if the QFR is > 0.84, continue without stenting/bypass and defer FFR (test negative)l if the QFR is ≤ 0.78, proceed directly to stenting/bypass without FFR (test positive)l otherwise, perform a FFR and proceed based on that result (i.e. at a 0.8 cut-off point) (the grey zone).
This means that for anyone within the grey zone there is perfect diagnostic accuracy, so FPs and FNsoccur only in patients outside the grey zone.
Appendix 4, Figure 38, shows the FFR and QFR data again, with the proposed grey zone highlighted.In total, across studies, 20.1% of all patients lie within the grey zone (accordingly, up to 79.9% ofpatients would theoretically have a wire-free and adenosine-free procedure in this scenario). Of thesegrey-zone patients, 19.1% are TPs with both QFR and FFR below 0.8, and 50.2% are TNs with bothtests above 0.8. Only 18.3% are FNs and 12.4% FPs. Hence, only 30.4% of patients in the grey zonehave discordant FFR and QFR results (relative to the 0.8 threshold).
Within the grey zone, differences between FFR and QFR are small. This is shown in Appendix 4, Figure 39,categorised by TPs, FPs, etc. Very few patients in the grey zone differ in test values by > 0.1, and mostdiffer by ≤ 0.05.
The diagnostic accuracy when using the grey zone improves, as would be expected, to a sensitivity of93.1% (95% CI 90.1% to 94.9%) and a specificity of 92.1% (95% CI 88.3% to 94.5%). Appendix 4, Figure 40,shows the result of this meta-analysis (with its HSROC curve) compared with the meta-analysis withoutthe grey zone presented in Bivariate meta-analysis (QAngio XA 3D/QFR). Clearly using the grey zone improvesdiagnostic accuracy compared with QFR alone because of the 3.7% of patients reclassified from testnegative to positive and 2.5% who are reclassified in the opposite direction. However, this improvementdepends on assuming that the 0.8 threshold of FFR genuinely separates those who need intervention fromthose who do not.
As an alternative to using the manufacturer-specified grey zone, we also examined what grey-zonethresholds would be required to achieve a sensitivity and specificity of 90% and 95% respectively.This is summarised in Appendix 4, Table 40. This suggests that the manufacturer-recommended greyzone favours high sensitivity over high specificity.
Alternative fractional flow reserve thresholdsThe IRIS-FFR study13 found that only for a FFR ≤ 0.75 did the risk of MACEs become significantly lowerin patients with revascularised lesions than in those in whom revascularisation was deferred. Thissuggests that the current threshold of 0.8 for planning revascularisation may not be clinically appropriate.
ASSESSMENT OF CLINICAL EFFECTIVENESS
NIHR Journals Library www.journalslibrary.nihr.ac.uk
32
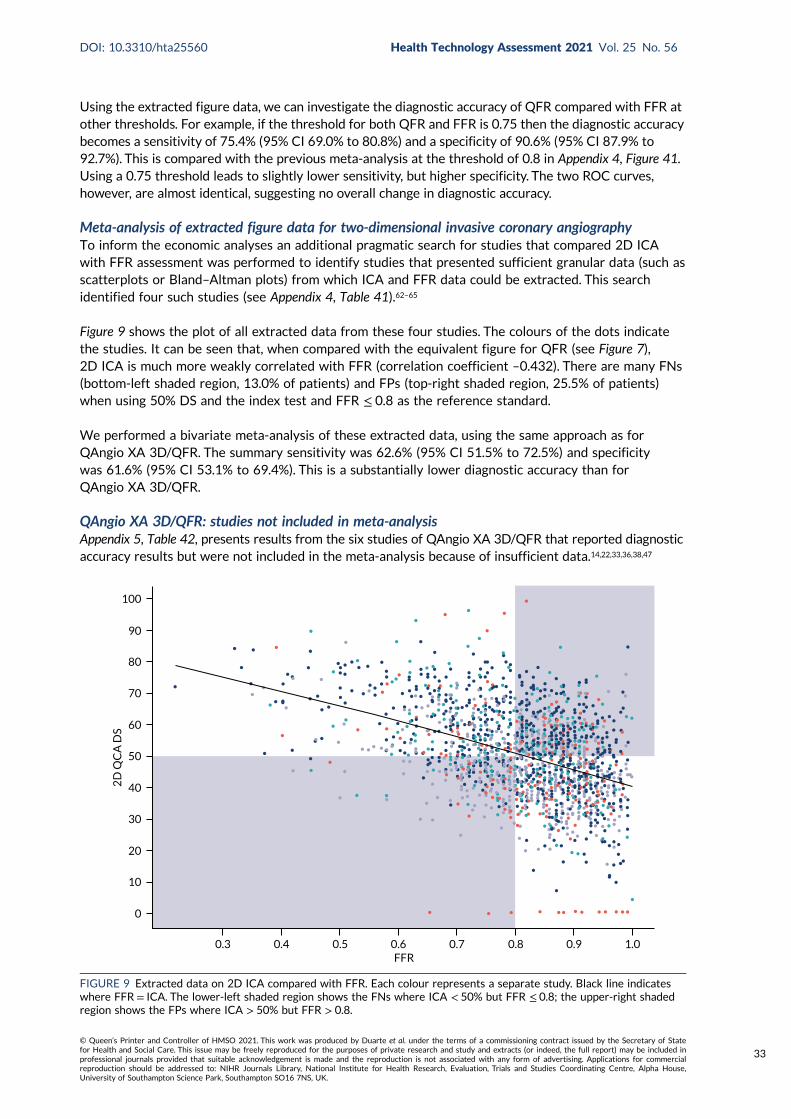
Using the extracted figure data, we can investigate the diagnostic accuracy of QFR compared with FFR atother thresholds. For example, if the threshold for both QFR and FFR is 0.75 then the diagnostic accuracybecomes a sensitivity of 75.4% (95% CI 69.0% to 80.8%) and a specificity of 90.6% (95% CI 87.9% to92.7%). This is compared with the previous meta-analysis at the threshold of 0.8 in Appendix 4, Figure 41.Using a 0.75 threshold leads to slightly lower sensitivity, but higher specificity. The two ROC curves,however, are almost identical, suggesting no overall change in diagnostic accuracy.
Meta-analysis of extracted figure data for two-dimensional invasive coronary angiographyTo inform the economic analyses an additional pragmatic search for studies that compared 2D ICAwith FFR assessment was performed to identify studies that presented sufficient granular data (such asscatterplots or Bland–Altman plots) from which ICA and FFR data could be extracted. This searchidentified four such studies (see Appendix 4, Table 41).62–65
Figure 9 shows the plot of all extracted data from these four studies. The colours of the dots indicatethe studies. It can be seen that, when compared with the equivalent figure for QFR (see Figure 7),2D ICA is much more weakly correlated with FFR (correlation coefficient –0.432). There are many FNs(bottom-left shaded region, 13.0% of patients) and FPs (top-right shaded region, 25.5% of patients)when using 50% DS and the index test and FFR ≤ 0.8 as the reference standard.
We performed a bivariate meta-analysis of these extracted data, using the same approach as forQAngio XA 3D/QFR. The summary sensitivity was 62.6% (95% CI 51.5% to 72.5%) and specificitywas 61.6% (95% CI 53.1% to 69.4%). This is a substantially lower diagnostic accuracy than forQAngio XA 3D/QFR.
QAngio XA 3D/QFR: studies not included in meta-analysisAppendix 5, Table 42, presents results from the six studies of QAngio XA 3D/QFR that reported diagnosticaccuracy results but were not included in the meta-analysis because of insufficient data.14,22,33,36,38,47
100
90
80
70
60
50
40
30
20
10
0
2D
QC
A D
S
FFR0.3 0.4 0.5 0.6 0.7 0.8 0.9 1.0
FIGURE 9 Extracted data on 2D ICA compared with FFR. Each colour represents a separate study. Black line indicateswhere FFR = ICA. The lower-left shaded region shows the FNs where ICA < 50% but FFR ≤ 0.8; the upper-right shadedregion shows the FPs where ICA > 50% but FFR > 0.8.
DOI: 10.3310/hta25560 Health Technology Assessment 2021 Vol. 25 No. 56
© Queen’s Printer and Controller of HMSO 2021. This work was produced by Duarte et al. under the terms of a commissioning contract issued by the Secretary of Statefor Health and Social Care. This issue may be freely reproduced for the purposes of private research and study and extracts (or indeed, the full report) may be included inprofessional journals provided that suitable acknowledgement is made and the reproduction is not associated with any form of advertising. Applications for commercialreproduction should be addressed to: NIHR Journals Library, National Institute for Health Research, Evaluation, Trials and Studies Coordinating Centre, Alpha House,University of Southampton Science Park, Southampton SO16 7NS, UK.
33
All studies were reported as conference abstracts only (although one was subsequently published afterthe cut-off date for conducting meta-analyses).33 One QAngio XA 3D/QFR prototype study recordedQAngio XA 3D/QFR analyses prospectively (on-site analysis), and re-ran analyses retrospectively after‘essential modifications’ (no further details reported). All other studies were retrospective and did notreport which version of QAngio XA 3D/QFR was used.22,33,36,38,47
The results broadly reflected the findings of the meta-analysis. All studies reported moderate to highdiagnostic accuracy for QAngio XA 3D/QFR compared with FFR. There was significant heterogeneityin reported diagnostic accuracy estimates. Sensitivity ranged from 64.0% to 91.8%, and specificity from68.2% to 97.3%. Where reported, PPV estimates ranged from 74.0% to 84.8% and NPV from 68.2%to 93.0%. AUC ranged from 0.77 (95% CI 0.67 to 0.87) to 0.99 (95% CI 0.97 to 1.00). Correlationcoefficients (r) also varied significantly, ranging from 0.578 to 0.801.
The wire-free invasive functional imaging (WIFI) prototype study14 reported moderate sensitivity (0.64,95% CI 0.48 to 0.77) and specificity (0.8, 95% CI 0.66 to 0.89) in its initial analyses. Following ‘essentialmodifications’ (no further details reported) a blinded in-centre core laboratory reanalysis was performed,and this improved both sensitivity (0.66, 95% CI 0.51 to 0.79) and specificity (0.86, 95% CI 0.73 to 0.93).
QAngio XA 3D/QFR: other modesThree studies reported results for QAngio XA 3D/QFR modes other than cQFR and fQFR.32,46,48 Theirresults are presented in Appendix 5, Table 43. Two small studies (n = 15 and 84 vessels) reported resultsfor adenosine–flow quantitative flow ratio (aQFR),46,48 and one larger study (n = 306 lesions) testediQFR, lQFR and vQFR.32 Sensitivity of aQFR per vessel ranged from 78% to 100%, and specificity from91% to 93%; one study reported a high AUC (0.90, 95% CI 0.81 to 0.96) for aQFR, and similar resultsin per-patient analyses. One study found that iQFR had higher diagnostic accuracy overall (sensitivity:83.3%; specificity: 86.6%; AUC: 0.936) than vQFR (sensitivity: 90.5%; specificity: 69.7%; AUC: 0.900)and lQFR (sensitivity: 91.1%; specificity: 71.7%; AUC: 0.822).
CAAS vFFR
The review identified four publications reporting the diagnostic accuracy of CAAS vFFR.18,19,26,56
One is the original FAST study of vFFR,56 and one is a conference abstract reporting an update toFAST (FAST-EXTEND).18 There were two other independent studies, one of which has only beenpublished as a conference abstract.26 All studies performed CAAS vFFR analyses retrospectively(offline), and two were conducted in a single centre.18,19 One study was funded by the CAAS vFFRmanufacturer.18 All studies compared CAAS vFFR with FFR as reference standard.18,19 One study wasfunded by the CAAS vFFR manufacturer.18 Two studies included a mixed population of stable angina,unstable angina or NSTEMI.18,19
We included only studies that explicitly reported that the CAAS system was used, or where this wasconfirmed by the authors. Other studies of vFFR were identified but were not included if othertechnologies were used or the precise technology used could not be determined. Further details onexcluded studies are reported in Appendix 2, Table 35. Only one of the studies19 reported a 2 × 2 tableof diagnostic accuracy, and only one56 presented a Bland–Altman plot, which we digitally extracted tocalculate diagnostic accuracy. The two conference abstracts reported only sensitivity and specificity withoutCIs. To construct approximate CIs, we assumed that the proportion of patients with FFR ≤ 0.8 was 29%(the rate observed in the FAST study56), and constructed 2 × 2 diagnostic data under that assumption.
Table 6 summarises the properties of the CAAS vFFR studies. The sensitivity and specificity from allpublications is summarised in Figure 10. There is notable heterogeneity across even this small numberof studies. In particular, the ILUMIEN I study19 found considerably lower sensitivity and specificity thatthe FAST studies,18,56 and the Jin et al. study26 had lower sensitivity, but slightly higher specificity.
ASSESSMENT OF CLINICAL EFFECTIVENESS
NIHR Journals Library www.journalslibrary.nihr.ac.uk
34
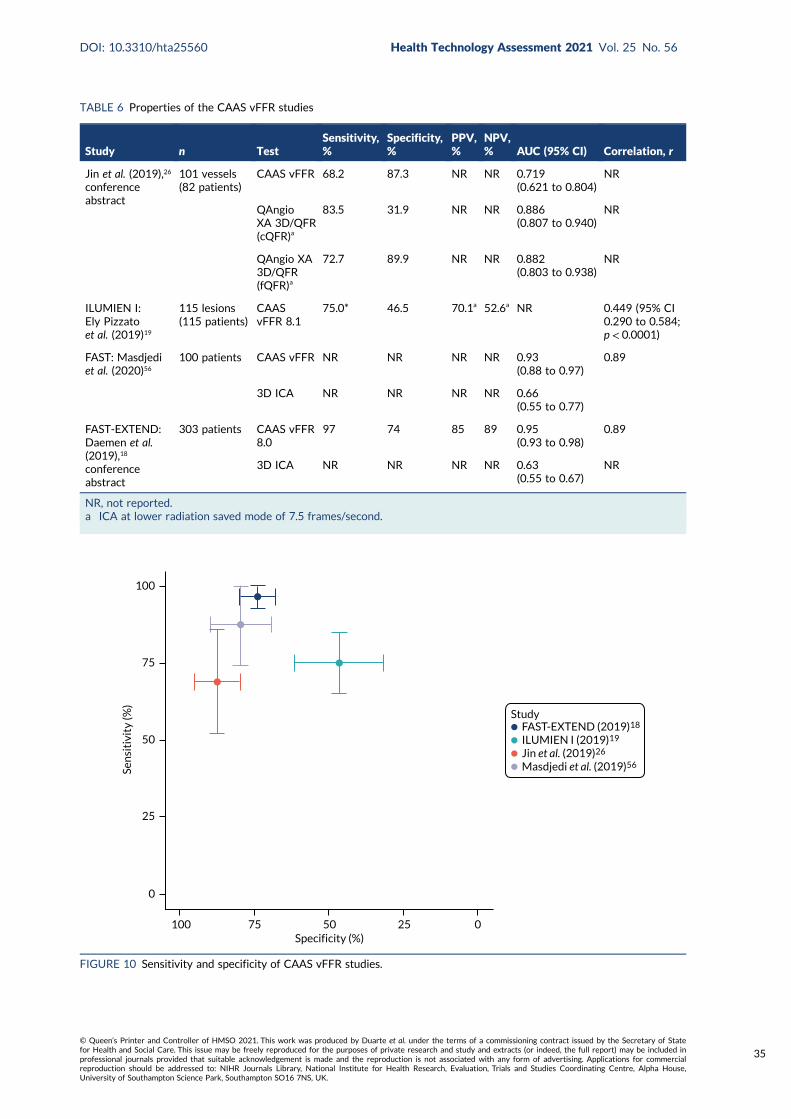
TABLE 6 Properties of the CAAS vFFR studies
Study n TestSensitivity,%
Specificity,%
PPV,%
NPV,% AUC (95% CI) Correlation, r
Jin et al. (2019),26
conferenceabstract
101 vessels(82 patients)
CAAS vFFR 68.2 87.3 NR NR 0.719(0.621 to 0.804)
NR
QAngioXA 3D/QFR(cQFR)a
83.5 31.9 NR NR 0.886(0.807 to 0.940)
NR
QAngio XA3D/QFR(fQFR)a
72.7 89.9 NR NR 0.882(0.803 to 0.938)
NR
ILUMIEN I:Ely Pizzatoet al. (2019)19
115 lesions(115 patients)
CAASvFFR 8.1
75.0* 46.5 70.1a 52.6a NR 0.449 (95% CI0.290 to 0.584;p < 0.0001)
FAST: Masdjediet al. (2020)56
100 patients CAAS vFFR NR NR NR NR 0.93(0.88 to 0.97)
0.89
3D ICA NR NR NR NR 0.66(0.55 to 0.77)
FAST-EXTEND:Daemen et al.(2019),18
conferenceabstract
303 patients CAAS vFFR8.0
97 74 85 89 0.95(0.93 to 0.98)
0.89
3D ICA NR NR NR NR 0.63(0.55 to 0.67)
NR
NR, not reported.a ICA at lower radiation saved mode of 7.5 frames/second.
FAST-EXTEND (2019)18
ILUMIEN I (2019)19
Jin et al. (2019)26
Masdjedi et al. (2019)56
Study
Sen
siti
vity
(%)
100
75
50
25
0
Specificity (%) 100 75 50 25 0
FIGURE 10 Sensitivity and specificity of CAAS vFFR studies.
DOI: 10.3310/hta25560 Health Technology Assessment 2021 Vol. 25 No. 56
© Queen’s Printer and Controller of HMSO 2021. This work was produced by Duarte et al. under the terms of a commissioning contract issued by the Secretary of Statefor Health and Social Care. This issue may be freely reproduced for the purposes of private research and study and extracts (or indeed, the full report) may be included inprofessional journals provided that suitable acknowledgement is made and the reproduction is not associated with any form of advertising. Applications for commercialreproduction should be addressed to: NIHR Journals Library, National Institute for Health Research, Evaluation, Trials and Studies Coordinating Centre, Alpha House,University of Southampton Science Park, Southampton SO16 7NS, UK.
35
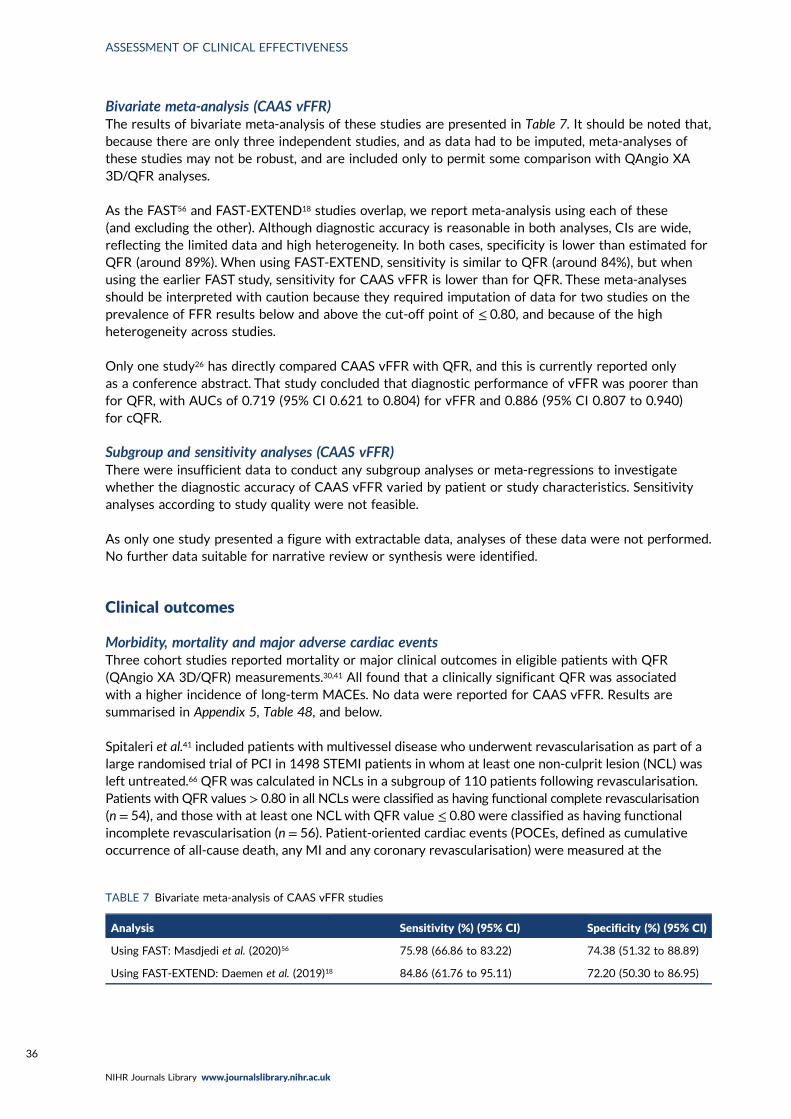
Bivariate meta-analysis (CAAS vFFR)The results of bivariate meta-analysis of these studies are presented in Table 7. It should be noted that,because there are only three independent studies, and as data had to be imputed, meta-analyses ofthese studies may not be robust, and are included only to permit some comparison with QAngio XA3D/QFR analyses.
As the FAST56 and FAST-EXTEND18 studies overlap, we report meta-analysis using each of these(and excluding the other). Although diagnostic accuracy is reasonable in both analyses, CIs are wide,reflecting the limited data and high heterogeneity. In both cases, specificity is lower than estimated forQFR (around 89%). When using FAST-EXTEND, sensitivity is similar to QFR (around 84%), but whenusing the earlier FAST study, sensitivity for CAAS vFFR is lower than for QFR. These meta-analysesshould be interpreted with caution because they required imputation of data for two studies on theprevalence of FFR results below and above the cut-off point of ≤ 0.80, and because of the highheterogeneity across studies.
Only one study26 has directly compared CAAS vFFR with QFR, and this is currently reported onlyas a conference abstract. That study concluded that diagnostic performance of vFFR was poorer thanfor QFR, with AUCs of 0.719 (95% CI 0.621 to 0.804) for vFFR and 0.886 (95% CI 0.807 to 0.940)for cQFR.
Subgroup and sensitivity analyses (CAAS vFFR)There were insufficient data to conduct any subgroup analyses or meta-regressions to investigatewhether the diagnostic accuracy of CAAS vFFR varied by patient or study characteristics. Sensitivityanalyses according to study quality were not feasible.
As only one study presented a figure with extractable data, analyses of these data were not performed.No further data suitable for narrative review or synthesis were identified.
Clinical outcomes
Morbidity, mortality and major adverse cardiac eventsThree cohort studies reported mortality or major clinical outcomes in eligible patients with QFR(QAngio XA 3D/QFR) measurements.30,41 All found that a clinically significant QFR was associatedwith a higher incidence of long-term MACEs. No data were reported for CAAS vFFR. Results aresummarised in Appendix 5, Table 48, and below.
Spitaleri et al.41 included patients with multivessel disease who underwent revascularisation as part of alarge randomised trial of PCI in 1498 STEMI patients in whom at least one non-culprit lesion (NCL) wasleft untreated.66 QFR was calculated in NCLs in a subgroup of 110 patients following revascularisation.Patients with QFR values > 0.80 in all NCLs were classified as having functional complete revascularisation(n = 54), and those with at least one NCL with QFR value ≤ 0.80 were classified as having functionalincomplete revascularisation (n = 56). Patient-oriented cardiac events (POCEs, defined as cumulativeoccurrence of all-cause death, any MI and any coronary revascularisation) were measured at the
TABLE 7 Bivariate meta-analysis of CAAS vFFR studies
Analysis Sensitivity (%) (95% CI) Specificity (%) (95% CI)
Using FAST: Masdjedi et al. (2020)56 75.98 (66.86 to 83.22) 74.38 (51.32 to 88.89)
Using FAST-EXTEND: Daemen et al. (2019)18 84.86 (61.76 to 95.11) 72.20 (50.30 to 86.95)
ASSESSMENT OF CLINICAL EFFECTIVENESS
NIHR Journals Library www.journalslibrary.nihr.ac.uk
36
5-year follow-up. A total of 39 (35%) patients experienced an adverse event. The cumulative incidenceof POCEs was higher in the group with QFR ≤ 0.80 (46%) than in the group with QFR > 0.80 (24%)(HR 2.3, 95% CI 1.2 to 4.5; p = 0.01). Further individual POCE outcomes are reported in Appendix 5,Table 48.
Kanno et al.30 (conference abstract only) evaluated 212 de novo intermediate coronary lesions in212 patients with deferred revascularisation based on FFR values above 0.80. Baseline and physiologicalindices including cQFR were compared between patients with and without MACEs (cardiovascular death,non-fatal MI, target vascular revascularisation and non-target vascular revascularisation) during the4-year follow-up. MACE incidence at the 4-year follow-up was 5.7%. In patients with MACEs, cQFRwas lower than that in patients without MACEs (mean or median 0.80 vs. 0.88; p = 0.030). On logisticregression analysis, cQFR≤ 0.8 was a significant predictor of MACEs (OR 5.60, 95% CI 1.69 to 18.6;p = 0.005).
Hamaya et al.23 included a population of 549 patients with stable three-vessel disease who underwentcQFR. At the median 2.2 years’ follow-up, patients with MACEs had lower cQFR in all three vesselsthan those without MACEs [2.76 (95% CI 2.64 to 2.88) vs. 2.64 (95% CI 2.49 to 2.73); p < 0.001], andthree-vessel cQFR was a statistically significant predictor of MACEs in multivariate analyses (HR 0.97,95% CI 0.96 to 0.99). cQFR was also a better predictor of remote revascularisation (≥ 3 months) thanDS [AUC 0.73 (95% CI 0.65 to 0.79) vs. AUC 0.66 (95% CI 0.56 to 0.74); p = 0.043].
Subsequent use of invasive pressure wire fractional flow reserveNo studies of QFR prospectively evaluated the impact of QFR use and subsequent reductions in theuse of adenosine and pressure wire procedures. However, five studies included in the diagnosticaccuracy review retrospectively derived a grey-zone strategy based on their diagnostic accuracy resultsto model a potential reduction in adenosine and FFR use.29,37,40,50,51
Results are summarised in Appendix 5, Table 49. None of these studies used the grey-zone boundariesrecommended by the manufacturer (0.78–0.84), and only two studies used the same grey zone.40,50 Allstudies derived their grey-zone boundaries from their own cohort, except one40 that used boundariesdefined by another study.50 Diagnostic accuracy criteria of QFR against FFR used to derive grey-zoneboundaries varied across the studies (e.g. minimum sensitivity and specificity of the grey zone was> 95% in one study50 and > 90% in another51). Each study retrospectively modelled a QFR–FFR hybridstrategy using QFR as the main diagnostic method and only performing FFR measurements in theirdefined grey zone. Despite the variety of choice of grey zones and how they were defined, all arebroadly similar to each other and to the manufacturer-specified definition used in the meta-analysis inBivariate meta-analysis (QAngio XA 3D/QFR).
All simulated grey-zone strategies were associated with a large percentage of adenosine/FFR procedures(hypothetically) avoided, ranging from 42% to 68%. The widest grey-zone area (0.71–0.90)51 was associatedwith the lowest proportion of adenosine/FFR-free procedures (42%), and the narrowest boundaries(0.77–0.86, 0.78–0.87) associated with the highest proportion of procedures avoided (61–68%).40,50,51
None of the simulations modelled the clinical impact of delayed FFR in patients with a FFR below 0.8.
Interobserver variabilityEight studies reported outcomes data on the reproducibility of QFR readings between two differentanalysts (see Appendix 5, Table 50). One study directly compared QAngio XA 3D/QFR and CAASvFFR,26 six studies evaluated QAngio XA 3D/QFR only17,24,25,27,33,45 and one CAAS vFFR only.56 Threestudies were reported only as conference abstracts.25–27 The number of single measurements analysedranged from 10 to 101 vessels. All QFR measurements were performed and compared retrospectively(offline) where reported. Only two studies explicitly reported blinding analysts to each other’s readings.45,56
DOI: 10.3310/hta25560 Health Technology Assessment 2021 Vol. 25 No. 56
© Queen’s Printer and Controller of HMSO 2021. This work was produced by Duarte et al. under the terms of a commissioning contract issued by the Secretary of Statefor Health and Social Care. This issue may be freely reproduced for the purposes of private research and study and extracts (or indeed, the full report) may be included inprofessional journals provided that suitable acknowledgement is made and the reproduction is not associated with any form of advertising. Applications for commercialreproduction should be addressed to: NIHR Journals Library, National Institute for Health Research, Evaluation, Trials and Studies Coordinating Centre, Alpha House,University of Southampton Science Park, Southampton SO16 7NS, UK.
37
It was found that QFR had a moderate to high level of inter-rater reliability. Two studies of QAngioXA 3D/QFR reported MDs ≤ 0.01 in repeated QFR measurements between analysts.24,45 One studyreported a moderate correlation between three separate raters [mean intraclass correlation (ICC)0.614, 95% CI 0.464 to 0.728]. Two studies reported high ICC results, one in stable angina patients(r = 0.990)33 and the other in NCLs of STEMI patients (r = 0.991).17 Another study found that inter-rater reliability was higher for cQFR (R2 = 0.82) than for fQFR (R2 = 0.70) and ICA DS (R2 = 0.67).27
One study found high inter-rater repeatability for QAngio XA 3D/QFR [fQFR 0.001 (SD 0.036) andcQFR 0.001 (SD 0.049)] as well as CAAS vFFR [0.005 (SD 0.037)] and no statistically significantdifferences between raters’ measurements. Inter-rater reliability was also high in the FAST studyacross 100 repeated CAAS vFFR measurements (r = 0.95).56
Intraobserver variabilityEight studies reported outcomes data on intraobserver reproducibility of QFR readings (see Appendix 5,Table 51). Seven studies evaluated QAngio XA 3D/QFR only,16,17,25,27,33,45,54 and one study directly comparedQAngio XA 3D/QFR and CAAS vFFR.26 Five studies were reported only as conference abstracts.16,25–27,54
Where reported, all measurements were performed retrospectively (offline). The time gap between initialand repeated measurements was reported in four studies and ranged from 3 days to 2 weeks.16,27,45,54
All studies except one25 reported a high level of intrarater reliability for QFR. One study that assessedQFR readings independently by three analysts twice among 100 vessels reported a moderate ICCcoefficient (r = 0.428). Where reported, r coefficients for QAngio XA 3D/QFR in other studies rangedfrom 0.958 to 0.997, and MDs between repeat measurements from 0.00 (SD 0.03) to 0.016 (SD 0.06).One study found that R2 was higher for fQFR (0.91) and cQFR (0.94) than DS measured by ICA(0.76).27 One study that evaluated both QAngio XA 3D/QFR and CAAS vFFR found high levels ofrepeatability and no statistically significant changes between repeated tests (cQFR: MD 0.009 ± 0.053,p = 0.230; fQFR: MD 0.016 ± 0.060, p = 0.066; vFFR: MD 0.008 ± 0.040, p = 0.175).
Test failures: rates and reasonsAppendix 5, Table 52, reports rates of exclusions from diagnostic accuracy studies and reasons for exclusion.Sixteen studies did not report rates of patient exclusions or reasons for exclusion.14,16,18,22,23,25,29,31,33,35,36,38,39,44,48,54
Exclusion rates varied widely, from 6% to 92%, although this is partly due to differences in patientselection criteria, reporting and methods of calculating exclusions rates (e.g. out of total populationconsidered for eligibility vs. out of total number of patients with FFR). This limits the comparability ofexclusion rates across the studies.
Issues with the acquisition and quality of angiographic images (e.g. lack of at least two projections witha 25% degree angle in between, or poor image quality) were the most reported cause of exclusion,with 15 studies reporting it as their main reason for excluding patients from QFR analyses.15,17,19–21,24,28,32,37,42,43,46,49,50,56 Anatomical features of arteries (e.g. excessive overlapping or foreshortening, ostial lesions,severe tortuosity) were the second most commonly listed reason for exclusion. Rates of exclusionswere higher overall in retrospective studies (median 28%, range 6–92%) compared with prospectivestudies (median 17%, range 7–52%). This may be partly explained by the fact that ICA images inretrospective studies were less likely to have been collected following manufacturer instructions toacquire images suitable for QFR.
Both CAAS vFFR that reported reasons for exclusion reported high exclusion rates (63% and 65%),although both studies were retrospective.19,56 In both studies, the majority of exclusions were explainedby angiographic image processing issues (rather than CAAS vFFR directly). For instance, 83% of exclusionsin ILUMIEN I19 were due to the lack of at least two angiographic projections, table movement during ICAor pixel resolution incompatibility. ILUMIEN I19 concluded that careful adaptions in acquisitions of ICAimages could reduce test failure.
ASSESSMENT OF CLINICAL EFFECTIVENESS
NIHR Journals Library www.journalslibrary.nihr.ac.uk
38
Other outcomesNo evidence was reported in QAngio XA 3D/QFR and CAAS vFFR studies for any of the followingprotocol-specified outcomes: impact of QFR on the rate revascularisation procedures, adverse eventsrelated to the diagnostic procedure, adverse events related to revascularisation, distress, anxiety andsimilar harms caused by QFR, vFFR, invasive FFR or iFR, number of vessels with stent placements,HRQoL and radiation exposure.
Simulation study of clinical effectivenessGiven the very limited data on clinical effectiveness of QAngio XA 3D/QFR reported in publications,we performed a simulation study to investigate the possible impact of using QAngio XA 3D/QFR,compared with FFR, on actual coronary outcomes. This simulation study treats the complete dataextracted from figures (3192 observations) as a representative sample from the true population of FFRand QFR measurements. To predict coronary outcomes we used the results of the recent IRIS-FFRregistry report, representing 5846 patients who were either revascularised (stent or bypass surgery)or deferred (continued with current management without surgery) based on their measured FFR result.The full methods are set out in Statistical analysis of clinical effectiveness.
The IRIS-FFR study used major cardiovascular events (MACE, a composite of cardiac death, MI andrepeated/emergency revascularisation) as its primary outcome. The reported hazard of MACEs by FFRvalue was used to estimate the risk for each person in the extracted data. Based on those risks wesimulated whether or not each person had a MACE if they were ‘deferred’ or if they were revascularised.Note that this assumes that risk is solely a function of FFR values, and that knowing the QFR has noimpact on risk of MACEs.
We investigated three strategies for deciding on whether or not to revascularise:
l FFR only – perform FFR on all and revascularise if the FFR is ≤ 0.8l QFR only – perform QFR on all and revascularise if the QFR is ≤ 0.8, without FFR measurementl grey zone – perform a QFR and:
¢ revascularise if the QFR is ≤ 0.78¢ defer if the QFR is > 0.84¢ if the QFR is between 0.78 and 0.84, perform FFR and revascularise if the FFR is ≤ 0.8.
Results of the simulation studyAppendix 6, Figure 42, presents an example simulation, showing the distribution of simulated MACEsaccording to FFR and QFR. For ease of interpretation, the majority of patients with no MACE areexcluded and only patients with MACE are shown. Preventable MACEs (i.e. patients who would haveMACE if not revascularised) are evenly distributed across both FFR and QFR ranges. MACEs causedby revascularisation (i.e. where MACE occurs if revascularised, but would be avoided if deferred) areconcentrated above values of 0.75 for both FFR and QFR, in line with the suggestion in IRIS-FFR thatdeferral is preferable for a FFR > 0.75.
In Appendix 6, Figure 42, most events occur in the white regions, where the same revascularisationdecision would be made using either FFR or QFR. There are few patients, and hence few MACEs, inthe FP region (upper-left shaded area), where patients would be revascularised based on FFR but notif using QFR. Hence, using QFR would miss out on preventing some events in this region (green dots)but equally would avoid causing MACEs due to revascularisation (blue dots).
In Appendix 6, Figure 42, in the FP region (lower-right shaded area), where patients would be revascularisedbased on QFR but not if using FFR, there are also few events. QFR prevents some events in this region(green dots) that would be missed by FFR, but equally would cause MACEs due to revascularisation (bluedots). The ‘preventable’ and ‘caused’ events in these two regions approximately balance each other out.
DOI: 10.3310/hta25560 Health Technology Assessment 2021 Vol. 25 No. 56
© Queen’s Printer and Controller of HMSO 2021. This work was produced by Duarte et al. under the terms of a commissioning contract issued by the Secretary of Statefor Health and Social Care. This issue may be freely reproduced for the purposes of private research and study and extracts (or indeed, the full report) may be included inprofessional journals provided that suitable acknowledgement is made and the reproduction is not associated with any form of advertising. Applications for commercialreproduction should be addressed to: NIHR Journals Library, National Institute for Health Research, Evaluation, Trials and Studies Coordinating Centre, Alpha House,University of Southampton Science Park, Southampton SO16 7NS, UK.
39
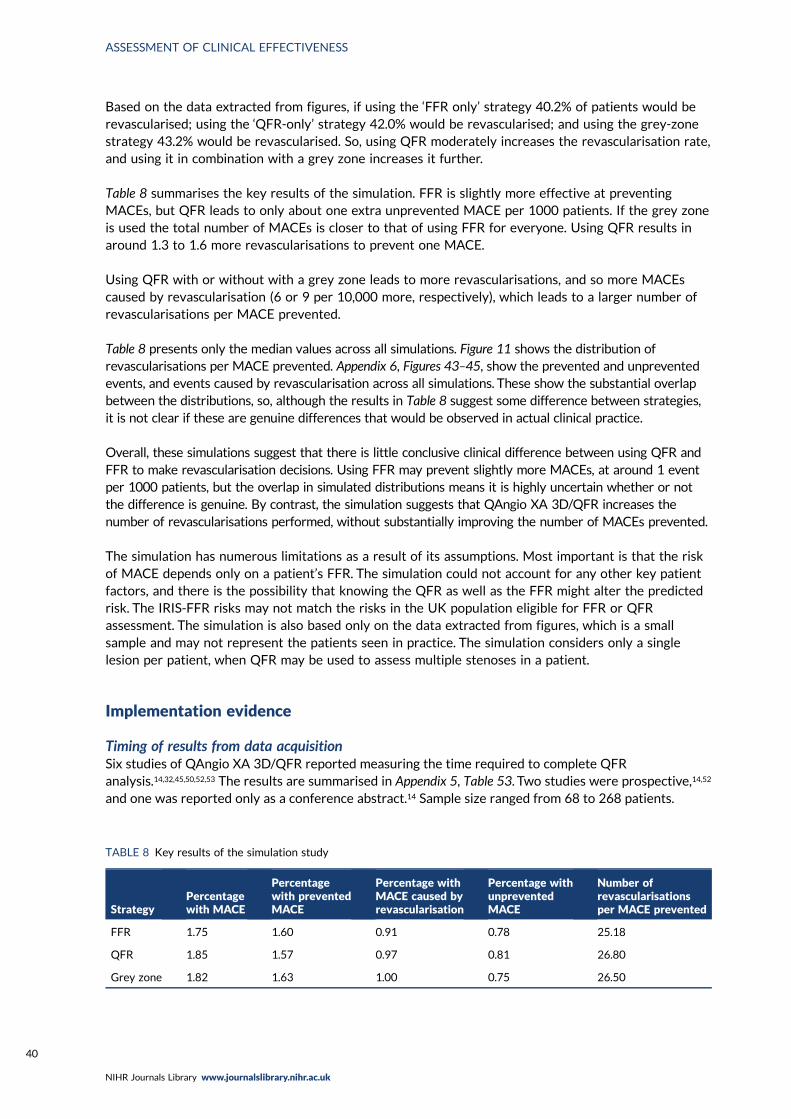
Based on the data extracted from figures, if using the ‘FFR only’ strategy 40.2% of patients would berevascularised; using the ‘QFR-only’ strategy 42.0% would be revascularised; and using the grey-zonestrategy 43.2% would be revascularised. So, using QFR moderately increases the revascularisation rate,and using it in combination with a grey zone increases it further.
Table 8 summarises the key results of the simulation. FFR is slightly more effective at preventingMACEs, but QFR leads to only about one extra unprevented MACE per 1000 patients. If the grey zoneis used the total number of MACEs is closer to that of using FFR for everyone. Using QFR results inaround 1.3 to 1.6 more revascularisations to prevent one MACE.
Using QFR with or without with a grey zone leads to more revascularisations, and so more MACEscaused by revascularisation (6 or 9 per 10,000 more, respectively), which leads to a larger number ofrevascularisations per MACE prevented.
Table 8 presents only the median values across all simulations. Figure 11 shows the distribution ofrevascularisations per MACE prevented. Appendix 6, Figures 43–45, show the prevented and unpreventedevents, and events caused by revascularisation across all simulations. These show the substantial overlapbetween the distributions, so, although the results in Table 8 suggest some difference between strategies,it is not clear if these are genuine differences that would be observed in actual clinical practice.
Overall, these simulations suggest that there is little conclusive clinical difference between using QFR andFFR to make revascularisation decisions. Using FFR may prevent slightly more MACEs, at around 1 eventper 1000 patients, but the overlap in simulated distributions means it is highly uncertain whether or notthe difference is genuine. By contrast, the simulation suggests that QAngio XA 3D/QFR increases thenumber of revascularisations performed, without substantially improving the number of MACEs prevented.
The simulation has numerous limitations as a result of its assumptions. Most important is that the riskof MACE depends only on a patient’s FFR. The simulation could not account for any other key patientfactors, and there is the possibility that knowing the QFR as well as the FFR might alter the predictedrisk. The IRIS-FFR risks may not match the risks in the UK population eligible for FFR or QFRassessment. The simulation is also based only on the data extracted from figures, which is a smallsample and may not represent the patients seen in practice. The simulation considers only a singlelesion per patient, when QFR may be used to assess multiple stenoses in a patient.
Implementation evidence
Timing of results from data acquisitionSix studies of QAngio XA 3D/QFR reported measuring the time required to complete QFRanalysis.14,32,45,50,52,53 The results are summarised in Appendix 5, Table 53. Two studies were prospective,14,52
and one was reported only as a conference abstract.14 Sample size ranged from 68 to 268 patients.
TABLE 8 Key results of the simulation study
StrategyPercentagewith MACE
Percentagewith preventedMACE
Percentage withMACE caused byrevascularisation
Percentage withunpreventedMACE
Number ofrevascularisationsper MACE prevented
FFR 1.75 1.60 0.91 0.78 25.18
QFR 1.85 1.57 0.97 0.81 26.80
Grey zone 1.82 1.63 1.00 0.75 26.50
ASSESSMENT OF CLINICAL EFFECTIVENESS
NIHR Journals Library www.journalslibrary.nihr.ac.uk
40
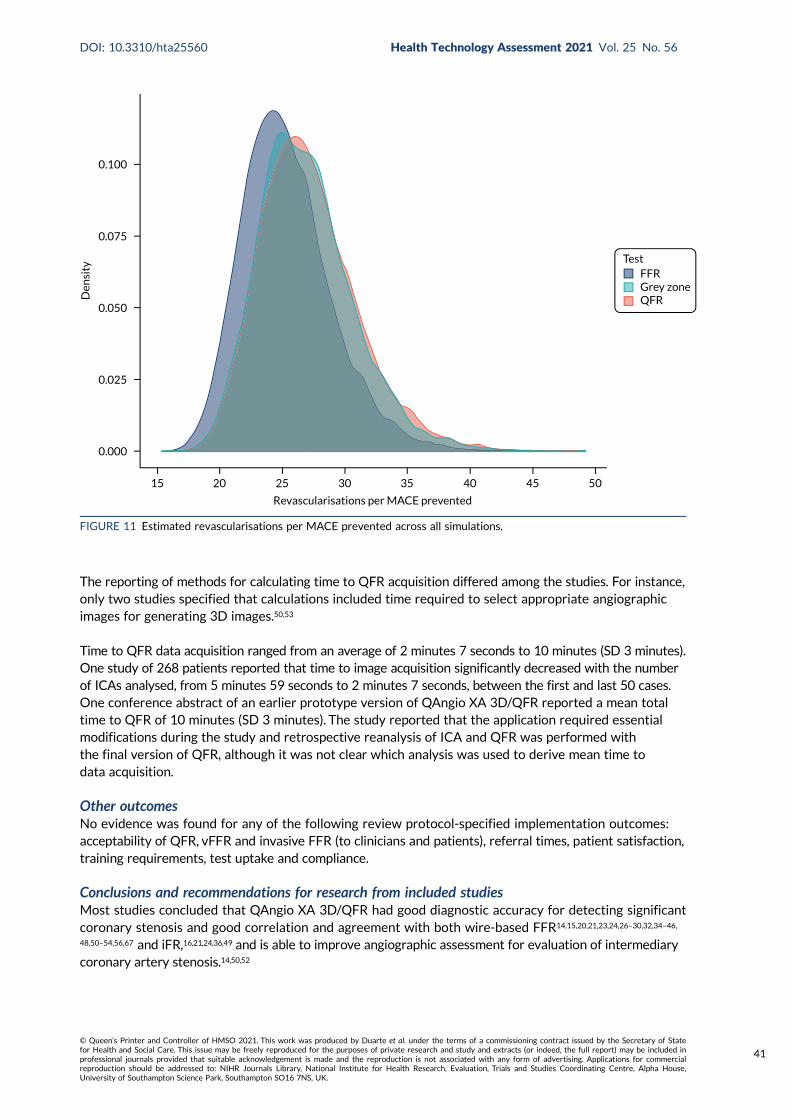
The reporting of methods for calculating time to QFR acquisition differed among the studies. For instance,only two studies specified that calculations included time required to select appropriate angiographicimages for generating 3D images.50,53
Time to QFR data acquisition ranged from an average of 2 minutes 7 seconds to 10 minutes (SD 3 minutes).One study of 268 patients reported that time to image acquisition significantly decreased with the numberof ICAs analysed, from 5 minutes 59 seconds to 2 minutes 7 seconds, between the first and last 50 cases.One conference abstract of an earlier prototype version of QAngio XA 3D/QFR reported a mean totaltime to QFR of 10 minutes (SD 3 minutes). The study reported that the application required essentialmodifications during the study and retrospective reanalysis of ICA and QFR was performed withthe final version of QFR, although it was not clear which analysis was used to derive mean time todata acquisition.
Other outcomesNo evidence was found for any of the following review protocol-specified implementation outcomes:acceptability of QFR, vFFR and invasive FFR (to clinicians and patients), referral times, patient satisfaction,training requirements, test uptake and compliance.
Conclusions and recommendations for research from included studiesMost studies concluded that QAngio XA 3D/QFR had good diagnostic accuracy for detecting significantcoronary stenosis and good correlation and agreement with both wire-based FFR14,15,20,21,23,24,26–30,32,34–46,
48,50–54,56,67 and iFR,16,21,24,36,49 and is able to improve angiographic assessment for evaluation of intermediarycoronary artery stenosis.14,50,52
0.100
0.075
0.050
0.025
0.000
15 20 25 30 35 40 45 50
Den
sity
Revascularisations per MACE prevented
TestFFRGrey zoneQFR
FIGURE 11 Estimated revascularisations per MACE prevented across all simulations.
DOI: 10.3310/hta25560 Health Technology Assessment 2021 Vol. 25 No. 56
© Queen’s Printer and Controller of HMSO 2021. This work was produced by Duarte et al. under the terms of a commissioning contract issued by the Secretary of Statefor Health and Social Care. This issue may be freely reproduced for the purposes of private research and study and extracts (or indeed, the full report) may be included inprofessional journals provided that suitable acknowledgement is made and the reproduction is not associated with any form of advertising. Applications for commercialreproduction should be addressed to: NIHR Journals Library, National Institute for Health Research, Evaluation, Trials and Studies Coordinating Centre, Alpha House,University of Southampton Science Park, Southampton SO16 7NS, UK.
41
Studies of CAAS also concluded that QFR had good correlation and agreement with wire-basedFFR,18,19,24,56 although one concluded that only one-third of routinely acquired coronary angiographicimages were appropriate for retrospective vFFR analysis.19
Studies conducted in patients with acute coronary syndrome concluded that QFR was safe andaccurate in assessment of non-culprit vessels.17,28,31,41 Some studies suggested that diagnostic accuracyof QFR may be affected by specific clinical characteristics, namely small vessels,15,32 presence ofbifurcated lesions and trifurcated lesions,15,38 left main stenosis,22 prior MI-related coronary arteries20
and microvascular function.29,41
Several studies concluded that QFR may be a good alternative tool for identifying significant coronarystenosis in various clinical settings or may complement invasive wire-based options;23,31,37,49 it is applicableto patients allergic to adenosine and adenosine triphosphate (ATP) vasodilators and may avoid proceduralrisks or patient discomfort associated with invasive wire-based options.23,52 Some studies noted that QFRmay reduce procedure time, be associated with reduced cost and allow for wider adoption of functionalassessment of coronary stenosis.23,33,46
Some studies recommended using a hybrid approach to reduce the need for invasive FFR, althoughthere was no consensus on an optimal grey zone.16,33,43 In some cases, patients may be unsuitable forevaluation of stenosis severity using angiography, including diffuse tandem disease, tandem lesions,lesions with angiographic haziness caused by calcification or thrombus and lesions with ulcerationcause by plaque rupture.20 Diagnostic accuracy could be affected in patients with bifurcation lesions,32,50
patients with prior MI-related coronary arteries20 and patients with left main location of stenoses.22
Some studies suggested that confirmation with FFR may be required close to values of 0.8.33,53
One CAAS study noted that careful adaptations in image acquisition will be required to reduce therisk of test failures if used in daily clinical practice.
Further prospective online investigation into the clinical benefit of QFR-based revascularisation wasrecommended by multiple studies,17,37,42,43,45,46,48,50 including using appropriately powered randomisedcontrolled trials (RCTs) with relevant clinical end points before implementing the device as a definitealternative to invasive FFR,24,32,37,40,50 such as the ongoing FAVOR III China trial (NCT03656848).Some recommended further testing of modelled hybrid QFR/FFR approaches.51
A number of studies recommended that that testing of the diagnostic accuracy and feasibility of QFRin clinical practice in different settings is needed.17,32,36–38,40,43,45,48,49
Further investigation of diagnostic precision and the application of the current QFR methodology inpatients with different lesion subtypes,38 including bifurcation lesion,32,50 patients with prior MI-relatedcoronary arteries20 and patients with left main location of stenoses22 was recommended.
Clinical effectiveness summary and conclusions
The diagnostic accuracy of QAngio XA 3D/QFR has been widely studied in 39 studies to date with atotal of 5949 patients (7034 vessels or lesions).
At a cut-off point of 0.8, QFR has good diagnostic accuracy to predict FFR (also at a cut-off pointof 0.8) with sensitivity around 84% and specificity around 89%. Although this means there is somediscordance between QFR and FFR, most FPs or FNs arise near the boundary (e.g. where one is 0.81and the other 0.79), and the discordance may not be clinically meaningful. Data on how this accuracymay vary by key patient characteristics was very limited, and no conclusive variation could be found.QFR, as measured using QAngio XA 3D/QFR, is generally similar to FFR measured with an invasivepressure wire. The average difference between the two values was 0.001, and values rarely differed bymore than 0.14, and, in 50% of patients, by less than 0.04.
ASSESSMENT OF CLINICAL EFFECTIVENESS
NIHR Journals Library www.journalslibrary.nihr.ac.uk
42
The use of a grey zone, where patients with intermediate QFR values go on to have confirmatory FFR,was found to increase diagnostic accuracy. Around 20% of patients fall in the grey zone and wouldreceive confirmatory FFR. Of these, only around 30% have discordant FFR and QFR results, so theconfirmatory FFR is unnecessary for the majority of patients in the grey zone.
Diagnostic accuracy data for CAAS vFFR were limited to only three studies. The results from thestudies were heterogeneous, limiting meta-analysis and a full evaluation of CAAS vFFR. Hence itsdiagnostic value is currently uncertain, but it may be a potential alternative to QAngio XA 3D/QFR.
This report did not perform a full systematic review of 2D or 3D ICA, but in those studies that we dididentify, the diagnostic accuracy of ICA was substantially inferior to QAngio XA 3D/QFR, with DS fromICA being poorly correlated with FFR.
There were very few reported data on clinical effectiveness and implementation outcomes when usingQAngio XA 3D/QFR, as nearly all studies published to date have focused on diagnostic accuracy.What data there is suggests that the QFR results of 0.80 or below for QAngio XA 3D/QFR may besignificant predictors of subsequent MACE, and that a grey-zone strategy is likely to lead to substantialreductions in adenosine and FFR procedures. Timing of results, inter-rater and intrarater reliabilitywere generally acceptable for QAngio XA 3D/QFR, indicating that the technology is feasible in aclinical context. However, data were limited and quality of blinding uncertain, so levels of inter-raterreliability in general use remain unclear. The feasibility of CAAS vFFR is uncertain notably because oflack of evidence on repeatability within and between raters and the high rate of patient exclusionsfrom retrospective evidence.
The simulation study to investigate the clinical impact of using QAngio XA 3D/QFR found that QAngioXA 3D/QFR may lead to a slight increase in revascularisations compared with using FFR, but bothmethods prevent broadly the same number of MACEs. Up to 1 person in 1000 may have a MACE ifusing QAngio XA 3D/QFR that could have been prevented with FFR, but this is highly uncertain. Usinga grey zone seems to lead to an increase in the number of revascularisations, but with no improvementin MACE prevention compared with using FFR alone or QFR alone.
Overall, this review suggests that making decisions on revascularisation in patients with intermediatestenosis using QFR as measured by QAngio XA 3D/QFR is a reasonable diagnostic strategy, and soQFR assessment may be a reasonable alternative to invasive FFR. The trade-off appears to be abalance between avoiding the side effects of FFR (particularly adenosine use) at a cost of possiblyslightly more revascularisation procedures. The use of QFR appears to be conclusively preferable tousing DS measured by standard ICA alone.
The review did not find a strong case for consistently using FFR in patients in whom QFR is borderline(i.e. around 0.8, the grey-zone approach). This seems to place too strong an emphasis on patients closeto the 0.8 threshold. Most patients in this region have similar FFR and QFR results (within 0.05), andso any discordance between QFR and FFR may not be clinically meaningful. A large proportion ofpeople who go on to receive FFR have the same conclusion as their original QFR, exposing them toa potentially harmful, unnecessary test. This conclusion, however, does not prevent the use of FFRwhen clinicians might think it necessary for reasons other than the QFR being close to 0.8.
Data on CAAS vFFR are currently too limited and heterogeneous to draw any useful conclusions on itsclinical value.
DOI: 10.3310/hta25560 Health Technology Assessment 2021 Vol. 25 No. 56
© Queen’s Printer and Controller of HMSO 2021. This work was produced by Duarte et al. under the terms of a commissioning contract issued by the Secretary of Statefor Health and Social Care. This issue may be freely reproduced for the purposes of private research and study and extracts (or indeed, the full report) may be included inprofessional journals provided that suitable acknowledgement is made and the reproduction is not associated with any form of advertising. Applications for commercialreproduction should be addressed to: NIHR Journals Library, National Institute for Health Research, Evaluation, Trials and Studies Coordinating Centre, Alpha House,University of Southampton Science Park, Southampton SO16 7NS, UK.
43

Chapter 4 Assessment of existingcost-effectiveness evidence
This chapter provides an overview of existing cost-effectiveness evidence on the use of the QAngioXA 3D/QFR and CAAS vFFR imaging software for assessing the functional significance of coronary
obstructions in patients with suspected stable chest pain whose angiograms show intermediate stenosisand who may require revascularisation. The literature was systematically searched to identify and describerelevant evidence on the cost-effectiveness of the two new technologies within the indication for whichthese are being evaluated. This systematic review also aimed to identify the central issues associated withadapting existing decision models to address the current decision problem and to assist in the developmentof a new decision model drawing on the issues identified in the clinical effectiveness and cost-effectivenessreview. Given that the two technologies under assessment have only recently been commercialised, itwas anticipated that there would be a dearth of relevant economic evidence. Therefore, to assist thedevelopment of a new decision-analytic model, a pragmatic review of published cost-effectiveness studiesevaluating ICA (alone and/or with FFR) in the management of CAD was also conducted.
Methodology of the cost-effectiveness review of QAngio XA 3D/QFR andCAAS vFFR
SearchesThe bibliographic search detailed in Chapter 3, Searches, was used to identify studies reporting on thecost-effectiveness of QAngio XA 3D/QFR and CAAS vFFR.
Selection processThe review considered a broad range of economic studies including economic evaluations conductedalongside trials, modelling studies and analyses of administrative databases. The inclusion criteriaconsidered were full economic evaluations comparing two or more alternatives and considering bothcosts and consequences (i.e. cost-minimisation, cost-effectiveness, cost–utility and cost–benefit analyses).
The protocol for the selection of relevant studies defined two selection stages: (1) assessment andscreening for possible inclusion of titles and abstracts identified by the search strategy, and (2) acquisitionand screening for inclusion of the full texts of potentially relevant studies. Two researchers independentlyscreened the titles and abstracts of all reports identified by the bibliographic searches. Full-text paperswere to be subsequently obtained for assessment and screened by at least two researchers, with anydisagreement resolved by consensus.
Results of the cost-effectiveness review of QAngio XA 3D/QFR and CAAS vFFR
The initial search identified a total of 1243 records (after deduplication). No studies were identified aspotentially relevant from their titles and/or abstracts, as none evaluated the cost-effectiveness of eitherQAngio XA 3D/QFR or CAAS vFFR.
Methodology of the review of decision models evaluating invasivecoronary angiography
Given the lack of cost-effectiveness studies evaluating QAngio XA 3D/QFR and CAAS vFFR usedduring ICA, a pragmatic review of published cost-effectiveness studies evaluating ICA (alone and/orwith FFR) in the management of CAD was conducted. The search targeted cost-effectiveness studies
DOI: 10.3310/hta25560 Health Technology Assessment 2021 Vol. 25 No. 56
© Queen’s Printer and Controller of HMSO 2021. This work was produced by Duarte et al. under the terms of a commissioning contract issued by the Secretary of Statefor Health and Social Care. This issue may be freely reproduced for the purposes of private research and study and extracts (or indeed, the full report) may be included inprofessional journals provided that suitable acknowledgement is made and the reproduction is not associated with any form of advertising. Applications for commercialreproduction should be addressed to: NIHR Journals Library, National Institute for Health Research, Evaluation, Trials and Studies Coordinating Centre, Alpha House,University of Southampton Science Park, Southampton SO16 7NS, UK.
45
where ICA was one of the interventions under comparison. The aim of the review was to help inform theconceptualisation of the decision problem and identify any relevant sources of evidence. Importantly, thereview aimed to assess how the link between short-term diagnostic outcomes and longer-term impactand subsequent prognosis associated with the diagnostic pathways in the management of CAD andassociated costs and outcomes had been established in the literature. Given that the purpose of thereview was broader than to inform specific inputs of the cost-effectiveness model, it was not consideredappropriate to conduct a full systematic review.
SearchesTargeted searches were conducted in October 2019 in the following databases: MEDLINE databases(i.e. MEDLINE Epub Ahead of Print, In-Process & Other Non-Indexed Citations, Ovid MEDLINE Daily,and Ovid MEDLINE), EconLit, EMBASE, NHS EED and the HTA database. Search strategies aredetailed in Appendix 1.
Study selectionCost-effectiveness studies published after the year 2000 where ICA (alone and/or with FFR) was one ofthe interventions under comparison were considered for inclusion. Only cost-effectiveness, cost–utilityand cost–benefit analyses were considered eligible. Studies that presented results as a cost perdiagnosis were not considered for inclusion, as the key aim of the review was to assess how the linkbetween short-term diagnostic outcomes and longer-term impact and subsequent prognosis associatedwith the diagnostic pathways in the management of CAD and associated costs and outcomes had beenestablished in the literature. The patient population of this review was defined as patients with stablechest pain and suspected or known CAD. Studies in patients with acute coronary syndromes andNSTEMI as the primary diagnosis were excluded. The inclusion criteria further specified that only titlesin English would be considered eligible. Titles that were books, editorials, letters to the editor andreviews that did not include a de novo model were excluded from the review.
One researcher (AD) conducted the two-step selection process consisting of screening for inclusion(1) the titles and abstracts of studies identified by the bibliographic searches, and (2) the full-textarticles identified at the previous step as potentially relevant.
Results of the review of decision models evaluating invasivecoronary angiography
A total of 1740 records were identified during the initial search of economic databases, of which1264 remained after deduplication. The first step of screening identified 25 titles as potentiallyrelevant based on their titles and/or abstracts. After the full-text articles of these records wereobtained and assessed for eligibility, 21 studies68–88 were considered to meet the selection criteriaand included in the review. The studies are summarised in detail in Appendix 7, Table 56. Results ofthe searches and the list of excluded studies are presented in Appendix 7, Tables 54 and 55.
Given the aim of the review, a formal assessment using checklists to assess the quality of the includedcost-effectiveness studies was not conducted. Instead, a narrative review of key model features,including testing and management strategies, and assumptions to support the conceptualisation anddevelopment of a de novo analytical model is presented below.
The majority of studies68–72,75,77,79,81,83,85,86,88 used a decision tree to model the diagnostic pathway andshort-term outcomes, and a long-term Markov model (or multiple Markov models) to characterisedisease progression. Two studies used microsimulation models74,82 that also combined a decision treestructure to model diagnostic outcomes followed by a lifetime disease progression state-transitionmodel. Of the five studies that modelled the full-time horizon with a decision tree model, threemodels71,73,80 captured only short-term outcomes (1-year time horizon), whereas two others comprised
ASSESSMENT OF EXISTING COST-EFFECTIVENESS EVIDENCE
NIHR Journals Library www.journalslibrary.nihr.ac.uk
46
longer time horizons (10 years84 and lifetime87). One study78 used a Bayesian mathematical modelbased on two equations to estimate costs and quality-adjusted life-years (QALYs) for each strategyunder comparison over a 10-year time horizon. The equations appear to be equivalent to thecalculations in a decision tree’s rollback algorithm.
Among the 21 studies, two models77 were considered to be good examples of alternative ways toevaluate diagnostic strategies in patients with suspected stable angina. These studies were selected onthe basis that they encompassed many of the features identified in the other studies. The two modelsdiffered in terms of how they modelled the diagnostic pathway and subsequent long-term risks ofmajor cardiovascular-related events and associated costs and outcomes. The first study77 was a cohortmodel that estimated outcomes for an average patient in clinical practice, and the second study74
was a microsimulation model that estimated outcomes for hypothetical patients at different levels ofdisease severity (defined in terms of number of coronary vessels affected and whether or not patientshave ischaemia). A key difference of the two models was the approach taken to assess the long-termimpact of the diagnostic strategies on the risk of major cardiovascular events. In one study,77 the modeltransition probabilities were based on risk prediction equations and patient covariates from a previouslypublished model on angina, which allowed estimation of the occurrence of a primary cardiovascularevent (with risk conditioned on factors such as age and sex) and of subsequent events conditional onhaving and surviving a first cardiovascular event. By contrast, the second study74 estimated the risk ofprimary and subsequent cardiovascular events dependent on disease severity, based on the rates ofMACEs from the literature. A summary of both models is presented below.
Walker et al.77
Walker et al.77 developed a decision tree and Markov model structure to evaluate the cost-effectivenessof eight alternative testing sequences, including different combinations of exercise treadmill testing,SPECT, cardiovascular MR and coronary angiography, to identify patients with angina who requirerevascularisation (i.e. those with significant stenosis) derived from the CE-MARC (Clinical Evaluation ofMagnetic Resonance Imaging in Coronary Heart Disease) trial.89 The study population included patientswith angina (with and without significant stenosis) and those without angina, based on characteristicsof patients in the CE-MARC trial.89 The base-case analysis considered the case of a 60-year-old man,classified as grade 2 on the Canadian Cardiovascular Society (CCS) scale, with a prior likelihood ofsignificant stenosis requiring revascularisation of 39.5%. Patients with angina were assumed to havehad no previous MI. The Markov model had a 50-year time horizon with a 3-month cycle length.The perspective of the study was NHS and Personal Social Services (PSS), and health outcomeswere measured in terms of QALYs. Costs were expressed in term Great British pounds (GBP)(2010/11 price year), and costs and health outcomes were discounted at a rate of 3.5% per annum.
The aim of the diagnostic testing was to identify patients with significant coronary artery stenosiswho require revascularisation [either PCI or coronary artery bypass graft (CABG)]. It was assumedthat all patients suspected of having significant coronary stenosis would undergo coronary angiographyas a definitive test before revascularisation. ICA was considered the reference standard test withperfect sensitivity and specificity. As ICA was performed on all patients indicated for revascularisation,the model did not consider any FP test results. The diagnostic component of the model divided thepatient cohort according to their underlying disease status based on characteristics of patients in theCE-MARC trial,89 survival to interventional and diagnostic procedures, test results and subsequentclinical management conditional on test results. All patients with positive and inconclusive test resultsprogressed to a further test in the sequence, although the type of the next test depended on whetherthe result was positive or inconclusive for some strategies (e.g. in strategy 8 a positive exercisetreadmill test result would be followed by ICA, whereas inconclusive test results would be followed bya SPECT test). Patients whose overall testing sequence resulted in a positive result were managed witheither PCI or CABG. The relative proportion of patients who underwent each type of revascularisationwas sourced from UK clinical registries. Patients who tested negative at any point in the test sequence
DOI: 10.3310/hta25560 Health Technology Assessment 2021 Vol. 25 No. 56
© Queen’s Printer and Controller of HMSO 2021. This work was produced by Duarte et al. under the terms of a commissioning contract issued by the Secretary of Statefor Health and Social Care. This issue may be freely reproduced for the purposes of private research and study and extracts (or indeed, the full report) may be included inprofessional journals provided that suitable acknowledgement is made and the reproduction is not associated with any form of advertising. Applications for commercialreproduction should be addressed to: NIHR Journals Library, National Institute for Health Research, Evaluation, Trials and Studies Coordinating Centre, Alpha House,University of Southampton Science Park, Southampton SO16 7NS, UK.
47
were managed with optimal medication if they had angina, or with no further medical therapy forthose without angina. The decision tree captures mortality associated with both invasive tests andrevascularisation, and separately applies procedure-specific mortality rates for ICA, PCI and CABG.At the end of the decision tree, patients with significant stenosis could be classified as TP, FN ordead. Patients without significant stenosis could be classified as TN with angina, TN without anginaor dead. All testing strategies are assumed to take the same time and do not account for delays torevascularisation resulting from strategies that involve more tests.
The diagnostic accuracy estimates for the different tests considered in the alternative strategieswere conditional on positive/inconclusive results in previous tests in the strategy, thus accountingfor correlations between tests within diagnostic strategies. This is possible only with access to IPDfrom studies that include all the tests used across the full set of diagnostic strategies, as was the casefor the CE-MARC study,89 which informed diagnostic accuracy in this model. However, the peopleinterpreting each test were blinded to the results of previous tests in each diagnostic sequence,so the data would not have captured the influence of knowledge on previous tests on the diagnosticaccuracy estimates of subsequent tests.
The long-term model is composed of three submodels. Patients with significant stenosis enter onesubmodel at either the TP or FN state. The key difference between TP and FN patients is that TP patientshave undergone revascularisation. In the base-case analysis, the treatment effect of revascularisationis limited to a reduction from angina symptoms, with improved HRQoL for TP patients comparedwith FN patients, whereas the same baseline risk of cardiovascular events is applied for TP and FNpatients. A proportion of FN patients are assumed be correctly diagnosed over time (conditional ontheir CCS grade), and transition to the TP health state. Patients can remain event free, have a primarynon-fatal cardiovascular event, or die from a cardiovascular event or other causes. Patients who survivea primary non-fatal cardiovascular event transition to the non-fatal cardiovascular event state and havean increased risk of further cardiovascular events for 12 months, after which they transition to thenon-fatal event post 12 months state. The risk of cardiovascular events in this state is lower than inthe non-fatal event post 12 months state, but higher than the baseline risk (TP and FN states). Patientsin all health states are subject to a mortality risk from non-cardiovascular death, which is sourced fromUK life tables (with cardiovascular deaths removed to avoid double counting). A similar submodel to theone described above, this is used to estimate the cost and health outcomes of TN patients with angina.TN patients without angina go into a two health states (alive and dead) submodel that derived transitionprobabilities from sex- and age-adjusted UK life tables for all-cause mortality.
The probabilities of fatal and non-fatal cardiovascular events in the submodels for patients with anginawere estimated based on risk equations from the EUROPA (EUropean trial on Reduction Of cardiacevents with Perindopril in stable coronary Artery) trial.90 This study estimated risk equations to predict(1) the risk of a first primary event, cardiovascular death, MI or cardiac arrest (see equation 1), (2) theodds of that event being fatal (see equation 2) and (3) the risk of a further primary event in the firstyear after a first non-fatal event (see equation 3). The equations allow for the adjustment of the rateof events dependent on the patient characteristics (age, sex, medication, comorbidities, etc.) and,importantly, accounting for the occurrence of previous MI. Walker et al.77 applied a fourth equation tomodel the risk of secondary cardiovascular events, which captures the excess cardiovascular risk forpatients who had had a previous MI.
The model also considers cancer-related mortality due to radiation exposure during some testingprocedures (ICA and SPECT) and PCI (assumed to be performed at the same time as ICA). The modelquantified the average radiation exposure in each test sequence; these radiation dosages were thencombined with cancer incidence and mortality estimates from the literature to calculate lifetimeincidence and mortality conditional on the patient’s age when they were tested. The costs andmorbidity associated with cancer were not modelled.
ASSESSMENT OF EXISTING COST-EFFECTIVENESS EVIDENCE
NIHR Journals Library www.journalslibrary.nihr.ac.uk
48
The HRQoL in the model was dependent on age, sex, CCS grade and whether or not the patienthad undergone revascularisation. EuroQol-5 Dimensions (EQ-5D) utility weights by CCS grade from astudy on angina were combined with UK-population norm EQ-5D estimates by age and sex to obtainage- and CCS-specific HRQoL estimates. The underlying assumption was that the relative impact ofCCS grade on HRQoL compared with the population is the same across all age groups.
One important base-case assumption of the Walker et al.77 model is that revascularisation has noimpact on the risk of cardiovascular events, and provides relief only from angina symptoms (capturedby change in CCS score). HRQoL scores for patients with angina (with and without significant stenosis)are based on age- and sex-adjusted UK population scores with a relative adjustment made based onCCS grade. Data from a RCT comparing coronary angioplasty with medical management was used tolink CCS scores at baseline and 6 months after intervention with the two treatments. Patients withangina and significant stenosis who receive revascularisation (TP) are attributed the HRQoL based onthe average CCS grade of those following treatment with angioplasty conditional on initial CCS grade.Patients with angina and significant stenosis who are misclassified (FN) are attributed the HRQoLbased on the average CCS grade of those following treatment with medical management conditionalon initial CCS grade. It was assumed that angina patients without significant stenosis received thesame HRQoL as FN patients, whereas the HRQoL of the other TN patients without angina was basedon age- and sex-adjusted UK population scores.
Costs included in the model were those of tests and interventional procedures, treatment costs inthe long-term model and health-state costs (namely fatal and non-fatal cardiovascular events, andother-cause mortality). Treatment and health-state costs were also sourced from the EUROPA trial90
(with a price year inflation adjustment). Background treatment costs were the same for all patientswith angina and an additional background cost was applied for patients after a cardiovascular event.Patients without angina were assumed to have no costs in the long-term model.
The authors considered uncertainty by performing probability sensitivity analysis and scenario analysiswhere they varied assumptions on baseline characteristics (CCS grade, sex and age), prior likelihood ofcoronary heart disease requiring revascularisation, rediagnosis rate of FN patients, clinical management ofTP patients, the impact of radiation exposure on cancer (risk assumed to be zero), risk of cardiovascularevents following revascularisation (treatment effect from the EUROPA trial90), HRQoL decrements andthe cost of diagnostic tests. The model was sensitive to prior likelihood of disease, reducing the startingage and increasing baseline CCS grade in the model, use of absolute HRQoL decrements by CCS grade,allowing for a proportion of TP patients to not receive revascularisation, reidentification rate of FNpatients, and costs of tests. The prior likelihood of coronary heart disease requiring revascularisationwas considered a key driver of cost-effectiveness.
Genders et al.74
The model developed by Genders et al.74 was a microsimulation model comprising a decision tree anda lifetime state-transition model to assess the cost-effectiveness of invasive and non-invasive testingstrategies for patients with stable chest pain. The base-case population consisted of 60-year-oldpatients with a 30% pretest probability of obstructive CAD (defined as ≥ 50% stenosis on at leastone vessel) who had never undergone revascularisation procedures and had no prior history of CAD.The study presents cost-effectiveness results for the separate jurisdictions. We refer here to inputsand results specific to the analyses under the UK NHS perspective, as they are more relevant to ourstudy. Costs were calculated in GBP (2011 price year), and health outcomes were calculated as QALYs.Both costs and QALYs were discounted at an annual rate of 3.5%.
The diagnostic strategies in the model are evaluated under two different diagnostic workups. In theinvasive workup, patients with obstructive CAD on CCTA and patients with inducible ischaemia oncardiac stress imaging were referred for ICA prior to a decision regarding medical management. In theconservative workup, only patients identified as having higher CAD severity by CCTA or cardiac stress
DOI: 10.3310/hta25560 Health Technology Assessment 2021 Vol. 25 No. 56
© Queen’s Printer and Controller of HMSO 2021. This work was produced by Duarte et al. under the terms of a commissioning contract issued by the Secretary of Statefor Health and Social Care. This issue may be freely reproduced for the purposes of private research and study and extracts (or indeed, the full report) may be included inprofessional journals provided that suitable acknowledgement is made and the reproduction is not associated with any form of advertising. Applications for commercialreproduction should be addressed to: NIHR Journals Library, National Institute for Health Research, Evaluation, Trials and Studies Coordinating Centre, Alpha House,University of Southampton Science Park, Southampton SO16 7NS, UK.
49
imaging would be referred to ICA and patients with milder forms of the disease managed with OMT.Patients with normal arteries or mild CAD (< 50% stenosis) received no further testing under eitherdiagnostic workup.
The decision tree starts by classifying patients according to eight categories of disease severity basedon percentage stenosis, number of vessels affected, location of lesion (left main trunk or not) andseverity of inducible stenosis (where present). Patient distribution across disease severity categorieswas sourced from hospital records for patients who had undergone CCTA and ICA. Diagnosticaccuracy estimates derived from published meta-analyses were then applied to split patients accordingto the test results for each diagnostic strategy. For the purpose of applying these estimates, patientswho were considered correctly classified with a negative result had normal coronary arteries or mildCAD (< 50% stenosis). Patients correctly identified with a positive result had moderate CAD, severeCAD or three-vessel disease/left main coronary stenosis. The model did not consider inconclusive testresults. The authors assumed independence of diagnostic accuracy estimates for CCTA and cardiacstress imaging, and further assumed that FP results were possible only for mild CAD and mild inducibleischaemia (under the conservative diagnostic workup). Patients with FP results are assumed to receiveunnecessary optimal medication for the full time horizon, incurring a treatment cost and utility decrementin the long-term model. As in Walker et al.,77 adverse events from testing and revascularisation procedureswere considered. However, in this model adverse events are not limited to procedural mortality, but alsoinclude non-fatal MI with ICA. This adverse event had a cost attributed to it, but did not translate into anincreased risk of further events in the long-term model.
The decision tree splits the patient population according to disease severity, test results and survival totesting (ICA and FFR) and revascularisation procedures. It also allows quantifying the average exposureto radiation with the different tests and PCI.
In the ICA strategy, all patients were tested with ICA. Those who tested negative received risk factormanagement and those who tested positive would be tested with FFR to decide treatment. ICA is assumedto be a perfect test, and FFR appears to allow prefect distinction between disease severity categories,although this is not explicitly stated in the paper. OMTwas then given to patients with mild ischaemia andmoderate to severe CAD, PCI was given to patients with severe CAD and severe ischaemia, and CABGwas given to patients with three-vessel disease or left main coronary stenosis. Revascularised patientswould also receive OMT, and all individuals in the model received risk factor management.
Subsequent to the decision tree, patients entered a state-transition model comprising three healthstates: alive, post MI and dead. Patients enter the model through the alive state, where they couldremain until death or suffering a non-fatal MI. Patients who suffered a non-fatal MI would transition tothe post-MI state, where they could remain or transition to the dead state. The transition probabilitieswere derived from published trial data that reported risk of MACE (cardiovascular death, non-fatal MIand repeated revascularisation) in patients treated with CABG, PCI and OMT. The rates of MACEwere dependent on disease severity and whether patients were treated with optimal medication orrevascularisation. All FN patients were assumed to be correctly identified and treated by the end ofthe first year, with the exception of those with moderate CAD without ischaemia, of whom only 25%were rediagnosed. Patients who experienced a primary cardiovascular event would have a higher riskof subsequent cardiovascular events, which was modelled by applying a HR of 1.44 to their baselinerisk. The model also considered mortality from non-cardiovascular causes. This was estimated based onage- and sex-specific general mortality data from which deaths attributed to cardiovascular causes hadbeen removed to avoid double counting. The mortality, morbidity and costs due to cancer incidencewere not modelled, although the model calculated cumulative radiation exposure over the time horizon.
The risk of MACE was estimated from the trial data separately for the first year and all subsequentyears to allow for a higher event rate in the first year after starting treatment. The rates wereestimated based on the CABG arm of the SYNTAX trial59 for patients with three-vessel disease or left
ASSESSMENT OF EXISTING COST-EFFECTIVENESS EVIDENCE
NIHR Journals Library www.journalslibrary.nihr.ac.uk
50
main coronary stenosis, and the optimal medication and PCI arms of the COURAGE trial91 for thepatients with suspected or mild inducible ischaemia and moderate to severe CAD (treated with optimalmedication) and patients with severe CAD and severe inducible ischaemia (treated with PCI). Thereciprocal of the treatment HR was applied to this risk to estimate the baseline probability ofcardiovascular events for untreated patients (FN), who have a higher rate of events until they arecorrectly diagnosed. A single treatment effect hazard for optimal medication, PCI and CABG (HR 0.70)was sourced from three meta-analyses of OMT comparing treatment with no treatment, but it isunclear how this estimate was calculated. The rates of MACE applied in the model are summarised inAppendix 7, Table 57.
We note that the MACE rates without treatment seem counterintuitive (e.g. higher MACE rates foruntreated moderate CAD with mild ischaemia compared with untreated severe CAD with severeischaemia). The authors did not comment on the MACE rates.
If the treatment effect applied in the model is indeed the same for optimal medication and revascularisation,this is similar to the absence of a treatment effect of revascularisation in addition to optimal medicationin Walker et al.77 This is an important interpretation of the clinical evidence on the treatment effect ofrevascularisation, and one that is discussed further in Chapter 5, Treatment effect of revascularisation.In previous studies where a treatment effect on the rate of cardiovascular events for revascularisationcompared with optimal medication was considered explicitly for comparable patients (e.g. same diseaseseverity), seven models included the existence of a treatment effect68,69,76,83,85,86,88 and six studies didnot,70–72,79,84,87 in line with Walker et al.77 and Genders et al.74
The HRQoL in the model was assigned to individuals according to disease severity and treatmentreceived. Patients without CAD or inducible ischaemia were assumed to have the HRQoL of the generalpopulation based on age- and sex-specific EQ-5D estimates for the US population. For patients withCAD and inducible ischaemia who underwent active treatment (optimal medication or revascularisation),mapped EQ-5D utility decrements were applied to the general population HRQoL estimates. In the firstyear of treatment, the utility decrements of treatment relative to the general population were derivedfrom the average utility decrement as observed in the same trial data that informed the rates of MACEfor treated patients, whereas for the subsequent year the last observed value in the trials was carriedforward. The authors state that a disutility was considered for patients with FP results. It was notclear how the utility decrements for FN patients were estimated. Appendix 7, Table 58, summarises theutility values for the start age in the model conditional on treatment and disease severity. The HRQoLestimates for the first year and subsequent years of treatment are presented for the same age solely forease of comparison.
The model considers costs of tests, test adverse events, medication, MI in the long-term model, andincidental findings from CCTA. Unit costs were mostly sourced from UK published data. Based on thedescription of the unit cost selected for PCI, this procedure was assumed to take place in an outpatientsetting. It is not, however, clear what assumptions were made regarding the setting for ICA, CABG andtreatment of non-fatal MIs. The unit cost for FFR was sourced from a previous cost-effectiveness studyin a US setting.87 An annual cost of medication was included in the model according to disease severityand treatment received (OMT, PCI or CABG). The resource use assumed for patients who receivedoptimal medication alone and in addition to PCI was sourced from the COURAGE trial,91 whereas forthose who received CABG and optimal medication it was taken from the SYNTAX trial.59 The distributionof medication use applied in the model is shown in Appendix 7, Table 59.
Model parameters were entered as distributions, and probabilistic sensitivity analysis was performedto incorporate joint parameter uncertainty. Scenario analysis was performed to test assumptionson diagnostic accuracy of stress echocardiography, cost of tests, alternative diagnostic pathways,probability of CAD, time to rediagnose FN patients, and treatment effect of optimal medication forFP patients. A subgroup analysis by sex was also performed. The authors do not identify any drivers
DOI: 10.3310/hta25560 Health Technology Assessment 2021 Vol. 25 No. 56
© Queen’s Printer and Controller of HMSO 2021. This work was produced by Duarte et al. under the terms of a commissioning contract issued by the Secretary of Statefor Health and Social Care. This issue may be freely reproduced for the purposes of private research and study and extracts (or indeed, the full report) may be included inprofessional journals provided that suitable acknowledgement is made and the reproduction is not associated with any form of advertising. Applications for commercialreproduction should be addressed to: NIHR Journals Library, National Institute for Health Research, Evaluation, Trials and Studies Coordinating Centre, Alpha House,University of Southampton Science Park, Southampton SO16 7NS, UK.
51
of cost-effectiveness, but note that the assumption that FP patients will remain misclassified over thetime horizon and that FN patients will be rediagnosed after 1 year is likely to have biased resultsagainst strategies with low specificity.
Conclusions of the assessment of existing cost-effectiveness evidence
The review did not identify any studies that evaluated the cost-effectiveness of QAngio XA 3D/QFRor CAAS vFFR. A supplementary review of published cost-effectiveness studies evaluating ICA (aloneand/or with FFR) in the management of CAD identified 21 relevant studies. Two studies were consideredto be particularly good examples of alternative modelling approaches to establish the link betweenshort-term diagnostic outcomes and the longer-term impact and subsequent prognosis associated withthe diagnostic pathways in the management of CAD and associated costs and outcomes. The modellingapproaches identified in Results of the review of decision models evaluating invasive coronary angiographywere used to inform the conceptualisation of the de novo model described in Chapter 5, Model structure,and allowed identifying relevant evidence sources to inform model inputs and assumptions.
ASSESSMENT OF EXISTING COST-EFFECTIVENESS EVIDENCE
NIHR Journals Library www.journalslibrary.nihr.ac.uk
52
Chapter 5 Independent economic assessment:York model
Overview
The review of cost-effectiveness studies in Chapter 4 identified no studies evaluating the cost-effectivenessof QAngio XA 3D/QFR and CAAS vFFR for assessing the functional significance of coronary stenosis.Therefore, a de novo decision-analytic model was developed to formally estimate the cost-effectiveness ofQAngio XA 3D/QFR and CAAS vFFR for assessing the functional significance of coronary obstructionsduring ICA in patients with stable angina and intermediate stenosis, relative to the comparators of invasiveFFR or iFR measurement or clinical decision-making based on visual interpretation of ICA alone, alongsideclinical judgement, in the UK NHS.
In developing and populating the decision model, three issues are considered central to the approachesand methods employed:
1. the need to link the diagnostic accuracy of QFR and vFFR to short-term costs and consequences[e.g. the impact on the proportion of patients who need revascularisation (percutaneous or surgical),the proportion of patients who need invasive functional assessment of stenosis using FFR or iFR,and adverse event rates and HRQoL associated with the diagnostic interventions]
2. the need to link the short-term consequences to potential longer-term costs and consequences(e.g. the risk of major adverse cardiovascular events such as MI, sudden cardiac death and need forurgent/unplanned revascularisations) using the best-available evidence to ensure that differences incosts, life-years gains, and QALYs are appropriately quantified over a lifetime horizon
3. the need to ensure that the data inputs and assumptions are relevant to inform current NHSpractice, with particular consideration given to any differences in the cost-effectiveness of thetechnologies in diagnostic-only laboratories or interventional catheter laboratories.
The decision-analytic model provides a framework for combining the diagnostic outcomes and thesubsequent prognosis associated with the diagnostic outcomes over the long term, and other inputsreflecting current NHS practice. The model evaluates costs from the perspective of the NHS and PSS,expressed in GBP (2018/19 price year). Outcomes in the model are expressed in terms of QALYs.Both costs and outcomes are discounted using a 3.5% annual discount rate, in line with currentNICE guidelines.92 The model was developed using Microsoft Excel® (Microsoft Corporation, Redmond,WA, USA).
The model is probabilistic in that uncertainty in input parameters are reflected through the use ofappropriate probability distributions, rather than using fixed mean estimates for input parameters.93
A Monte Carlo simulation is used to propagate uncertainty in input parameters through the modelto capture the uncertainty in overall results. Scenario analyses are undertaken to explore therobustness of the cost-effectiveness results to changes in the parameter inputs and assumptionsof the model.
The following sections outline the decision problem and the structure of the model, and provide anoverview of the key assumptions and data used to populate the model.
DOI: 10.3310/hta25560 Health Technology Assessment 2021 Vol. 25 No. 56
© Queen’s Printer and Controller of HMSO 2021. This work was produced by Duarte et al. under the terms of a commissioning contract issued by the Secretary of Statefor Health and Social Care. This issue may be freely reproduced for the purposes of private research and study and extracts (or indeed, the full report) may be included inprofessional journals provided that suitable acknowledgement is made and the reproduction is not associated with any form of advertising. Applications for commercialreproduction should be addressed to: NIHR Journals Library, National Institute for Health Research, Evaluation, Trials and Studies Coordinating Centre, Alpha House,University of Southampton Science Park, Southampton SO16 7NS, UK.
53
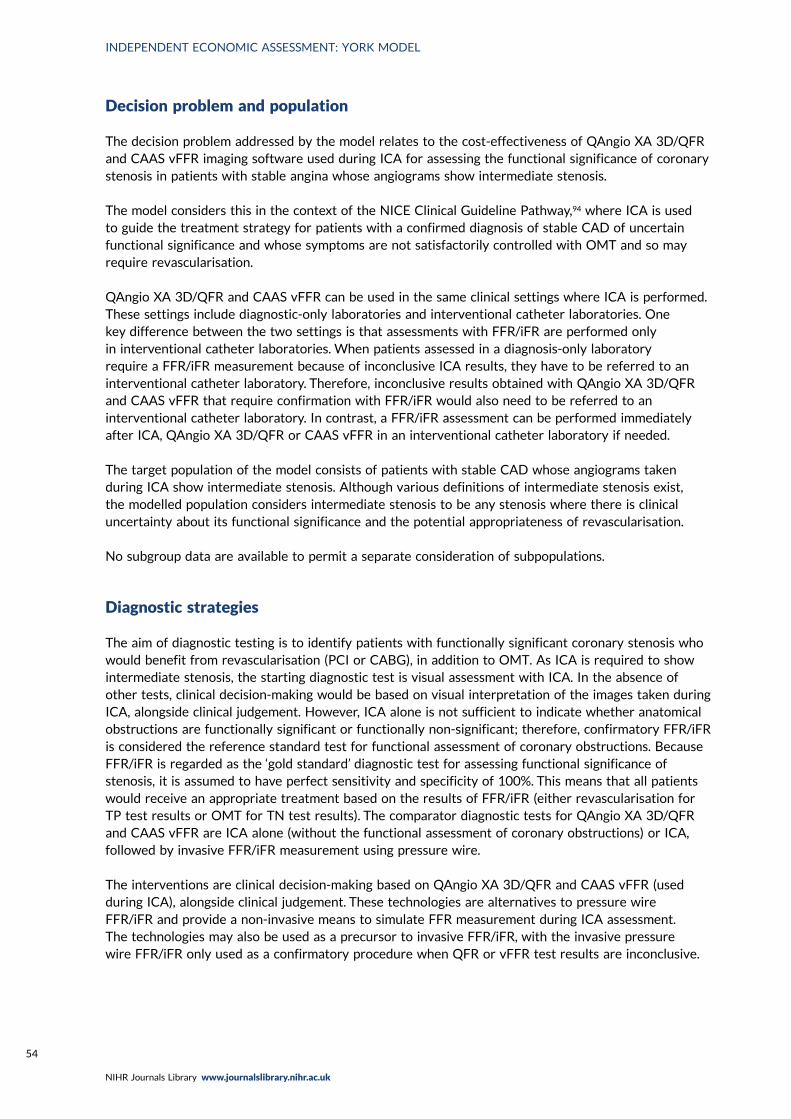
Decision problem and population
The decision problem addressed by the model relates to the cost-effectiveness of QAngio XA 3D/QFRand CAAS vFFR imaging software used during ICA for assessing the functional significance of coronarystenosis in patients with stable angina whose angiograms show intermediate stenosis.
The model considers this in the context of the NICE Clinical Guideline Pathway,94 where ICA is usedto guide the treatment strategy for patients with a confirmed diagnosis of stable CAD of uncertainfunctional significance and whose symptoms are not satisfactorily controlled with OMT and so mayrequire revascularisation.
QAngio XA 3D/QFR and CAAS vFFR can be used in the same clinical settings where ICA is performed.These settings include diagnostic-only laboratories and interventional catheter laboratories. Onekey difference between the two settings is that assessments with FFR/iFR are performed onlyin interventional catheter laboratories. When patients assessed in a diagnosis-only laboratoryrequire a FFR/iFR measurement because of inconclusive ICA results, they have to be referred to aninterventional catheter laboratory. Therefore, inconclusive results obtained with QAngio XA 3D/QFRand CAAS vFFR that require confirmation with FFR/iFR would also need to be referred to aninterventional catheter laboratory. In contrast, a FFR/iFR assessment can be performed immediatelyafter ICA, QAngio XA 3D/QFR or CAAS vFFR in an interventional catheter laboratory if needed.
The target population of the model consists of patients with stable CAD whose angiograms takenduring ICA show intermediate stenosis. Although various definitions of intermediate stenosis exist,the modelled population considers intermediate stenosis to be any stenosis where there is clinicaluncertainty about its functional significance and the potential appropriateness of revascularisation.
No subgroup data are available to permit a separate consideration of subpopulations.
Diagnostic strategies
The aim of diagnostic testing is to identify patients with functionally significant coronary stenosis whowould benefit from revascularisation (PCI or CABG), in addition to OMT. As ICA is required to showintermediate stenosis, the starting diagnostic test is visual assessment with ICA. In the absence ofother tests, clinical decision-making would be based on visual interpretation of the images taken duringICA, alongside clinical judgement. However, ICA alone is not sufficient to indicate whether anatomicalobstructions are functionally significant or functionally non-significant; therefore, confirmatory FFR/iFRis considered the reference standard test for functional assessment of coronary obstructions. BecauseFFR/iFR is regarded as the ‘gold standard’ diagnostic test for assessing functional significance ofstenosis, it is assumed to have perfect sensitivity and specificity of 100%. This means that all patientswould receive an appropriate treatment based on the results of FFR/iFR (either revascularisation forTP test results or OMT for TN test results). The comparator diagnostic tests for QAngio XA 3D/QFRand CAAS vFFR are ICA alone (without the functional assessment of coronary obstructions) or ICA,followed by invasive FFR/iFR measurement using pressure wire.
The interventions are clinical decision-making based on QAngio XA 3D/QFR and CAAS vFFR (usedduring ICA), alongside clinical judgement. These technologies are alternatives to pressure wireFFR/iFR and provide a non-invasive means to simulate FFR measurement during ICA assessment.The technologies may also be used as a precursor to invasive FFR/iFR, with the invasive pressurewire FFR/iFR only used as a confirmatory procedure when QFR or vFFR test results are inconclusive.
INDEPENDENT ECONOMIC ASSESSMENT: YORK MODEL
NIHR Journals Library www.journalslibrary.nihr.ac.uk
54
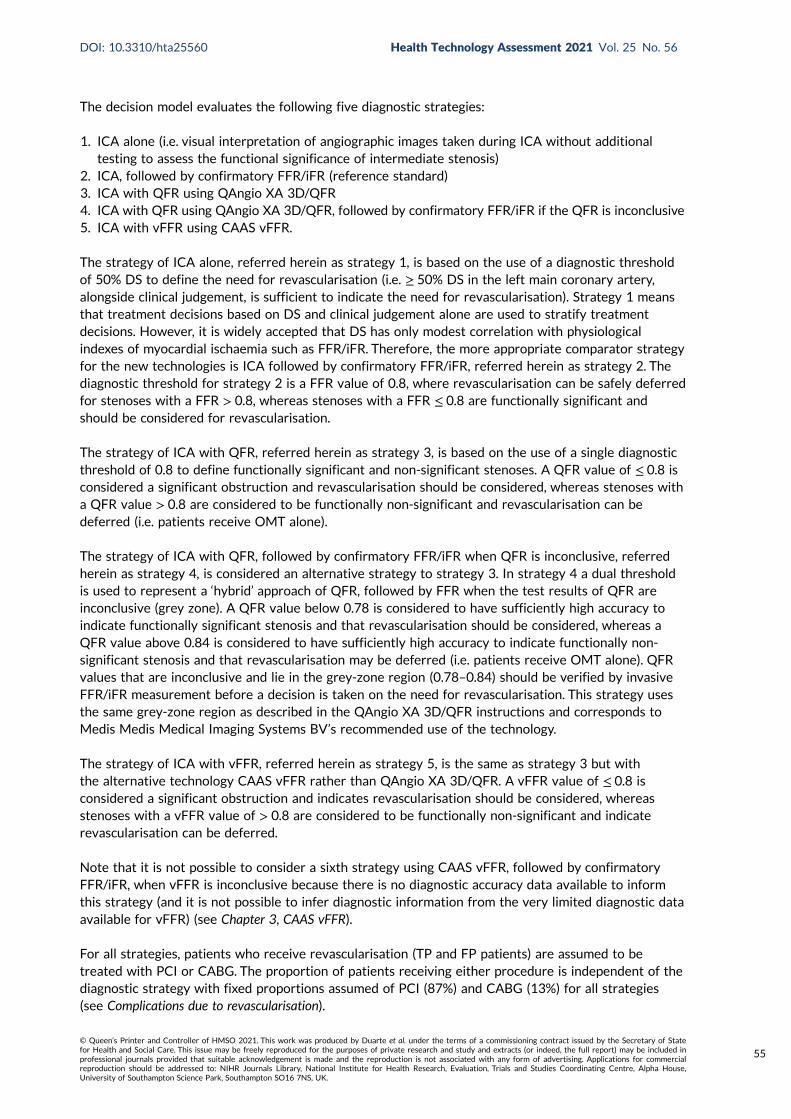
The decision model evaluates the following five diagnostic strategies:
1. ICA alone (i.e. visual interpretation of angiographic images taken during ICA without additionaltesting to assess the functional significance of intermediate stenosis)
2. ICA, followed by confirmatory FFR/iFR (reference standard)3. ICA with QFR using QAngio XA 3D/QFR4. ICA with QFR using QAngio XA 3D/QFR, followed by confirmatory FFR/iFR if the QFR is inconclusive5. ICA with vFFR using CAAS vFFR.
The strategy of ICA alone, referred herein as strategy 1, is based on the use of a diagnostic thresholdof 50% DS to define the need for revascularisation (i.e. ≥ 50% DS in the left main coronary artery,alongside clinical judgement, is sufficient to indicate the need for revascularisation). Strategy 1 meansthat treatment decisions based on DS and clinical judgement alone are used to stratify treatmentdecisions. However, it is widely accepted that DS has only modest correlation with physiologicalindexes of myocardial ischaemia such as FFR/iFR. Therefore, the more appropriate comparator strategyfor the new technologies is ICA followed by confirmatory FFR/iFR, referred herein as strategy 2. Thediagnostic threshold for strategy 2 is a FFR value of 0.8, where revascularisation can be safely deferredfor stenoses with a FFR > 0.8, whereas stenoses with a FFR ≤ 0.8 are functionally significant andshould be considered for revascularisation.
The strategy of ICA with QFR, referred herein as strategy 3, is based on the use of a single diagnosticthreshold of 0.8 to define functionally significant and non-significant stenoses. A QFR value of ≤ 0.8 isconsidered a significant obstruction and revascularisation should be considered, whereas stenoses witha QFR value > 0.8 are considered to be functionally non-significant and revascularisation can bedeferred (i.e. patients receive OMT alone).
The strategy of ICA with QFR, followed by confirmatory FFR/iFR when QFR is inconclusive, referredherein as strategy 4, is considered an alternative strategy to strategy 3. In strategy 4 a dual thresholdis used to represent a ‘hybrid’ approach of QFR, followed by FFR when the test results of QFR areinconclusive (grey zone). A QFR value below 0.78 is considered to have sufficiently high accuracy toindicate functionally significant stenosis and that revascularisation should be considered, whereas aQFR value above 0.84 is considered to have sufficiently high accuracy to indicate functionally non-significant stenosis and that revascularisation may be deferred (i.e. patients receive OMT alone). QFRvalues that are inconclusive and lie in the grey-zone region (0.78–0.84) should be verified by invasiveFFR/iFR measurement before a decision is taken on the need for revascularisation. This strategy usesthe same grey-zone region as described in the QAngio XA 3D/QFR instructions and corresponds toMedis Medis Medical Imaging Systems BV’s recommended use of the technology.
The strategy of ICA with vFFR, referred herein as strategy 5, is the same as strategy 3 but withthe alternative technology CAAS vFFR rather than QAngio XA 3D/QFR. A vFFR value of ≤ 0.8 isconsidered a significant obstruction and indicates revascularisation should be considered, whereasstenoses with a vFFR value of > 0.8 are considered to be functionally non-significant and indicaterevascularisation can be deferred.
Note that it is not possible to consider a sixth strategy using CAAS vFFR, followed by confirmatoryFFR/iFR, when vFFR is inconclusive because there is no diagnostic accuracy data available to informthis strategy (and it is not possible to infer diagnostic information from the very limited diagnostic dataavailable for vFFR) (see Chapter 3, CAAS vFFR).
For all strategies, patients who receive revascularisation (TP and FP patients) are assumed to betreated with PCI or CABG. The proportion of patients receiving either procedure is independent of thediagnostic strategy with fixed proportions assumed of PCI (87%) and CABG (13%) for all strategies(see Complications due to revascularisation).
DOI: 10.3310/hta25560 Health Technology Assessment 2021 Vol. 25 No. 56
© Queen’s Printer and Controller of HMSO 2021. This work was produced by Duarte et al. under the terms of a commissioning contract issued by the Secretary of Statefor Health and Social Care. This issue may be freely reproduced for the purposes of private research and study and extracts (or indeed, the full report) may be included inprofessional journals provided that suitable acknowledgement is made and the reproduction is not associated with any form of advertising. Applications for commercialreproduction should be addressed to: NIHR Journals Library, National Institute for Health Research, Evaluation, Trials and Studies Coordinating Centre, Alpha House,University of Southampton Science Park, Southampton SO16 7NS, UK.
55
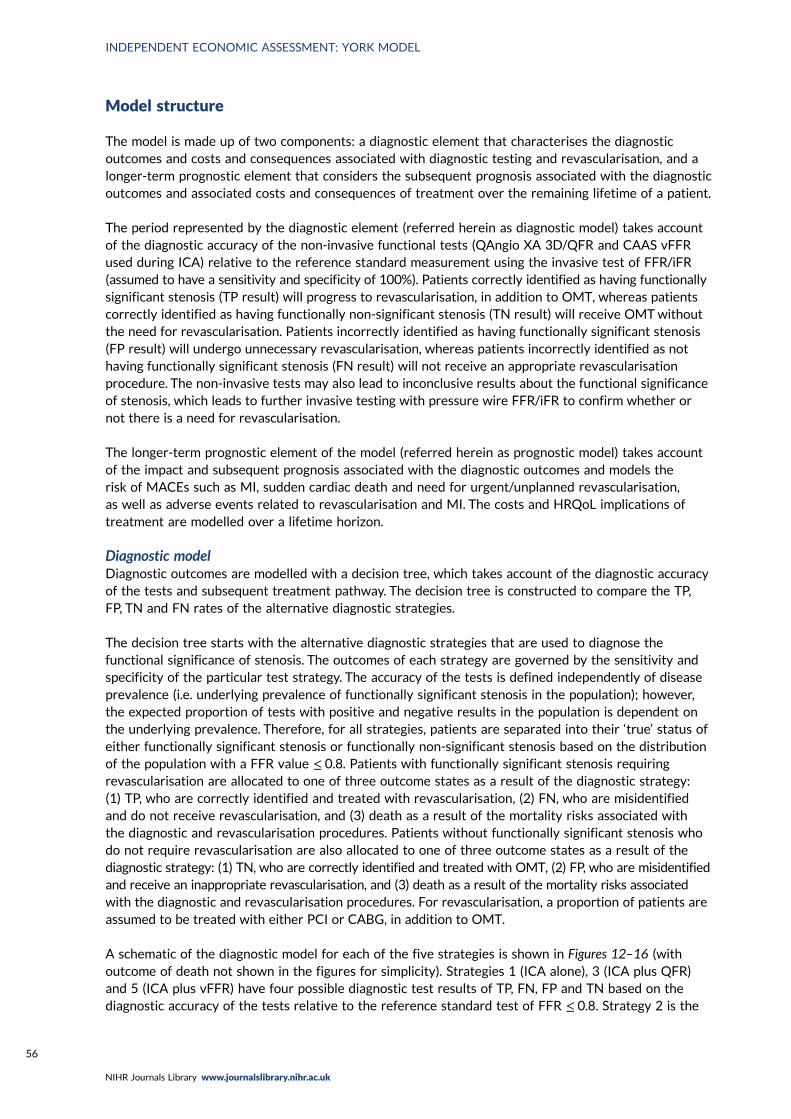
Model structure
The model is made up of two components: a diagnostic element that characterises the diagnosticoutcomes and costs and consequences associated with diagnostic testing and revascularisation, and alonger-term prognostic element that considers the subsequent prognosis associated with the diagnosticoutcomes and associated costs and consequences of treatment over the remaining lifetime of a patient.
The period represented by the diagnostic element (referred herein as diagnostic model) takes accountof the diagnostic accuracy of the non-invasive functional tests (QAngio XA 3D/QFR and CAAS vFFRused during ICA) relative to the reference standard measurement using the invasive test of FFR/iFR(assumed to have a sensitivity and specificity of 100%). Patients correctly identified as having functionallysignificant stenosis (TP result) will progress to revascularisation, in addition to OMT, whereas patientscorrectly identified as having functionally non-significant stenosis (TN result) will receive OMTwithoutthe need for revascularisation. Patients incorrectly identified as having functionally significant stenosis(FP result) will undergo unnecessary revascularisation, whereas patients incorrectly identified as nothaving functionally significant stenosis (FN result) will not receive an appropriate revascularisationprocedure. The non-invasive tests may also lead to inconclusive results about the functional significanceof stenosis, which leads to further invasive testing with pressure wire FFR/iFR to confirm whether ornot there is a need for revascularisation.
The longer-term prognostic element of the model (referred herein as prognostic model) takes accountof the impact and subsequent prognosis associated with the diagnostic outcomes and models therisk of MACEs such as MI, sudden cardiac death and need for urgent/unplanned revascularisation,as well as adverse events related to revascularisation and MI. The costs and HRQoL implications oftreatment are modelled over a lifetime horizon.
Diagnostic modelDiagnostic outcomes are modelled with a decision tree, which takes account of the diagnostic accuracyof the tests and subsequent treatment pathway. The decision tree is constructed to compare the TP,FP, TN and FN rates of the alternative diagnostic strategies.
The decision tree starts with the alternative diagnostic strategies that are used to diagnose thefunctional significance of stenosis. The outcomes of each strategy are governed by the sensitivity andspecificity of the particular test strategy. The accuracy of the tests is defined independently of diseaseprevalence (i.e. underlying prevalence of functionally significant stenosis in the population); however,the expected proportion of tests with positive and negative results in the population is dependent onthe underlying prevalence. Therefore, for all strategies, patients are separated into their ‘true’ status ofeither functionally significant stenosis or functionally non-significant stenosis based on the distributionof the population with a FFR value ≤ 0.8. Patients with functionally significant stenosis requiringrevascularisation are allocated to one of three outcome states as a result of the diagnostic strategy:(1) TP, who are correctly identified and treated with revascularisation, (2) FN, who are misidentifiedand do not receive revascularisation, and (3) death as a result of the mortality risks associated withthe diagnostic and revascularisation procedures. Patients without functionally significant stenosis whodo not require revascularisation are also allocated to one of three outcome states as a result of thediagnostic strategy: (1) TN, who are correctly identified and treated with OMT, (2) FP, who are misidentifiedand receive an inappropriate revascularisation, and (3) death as a result of the mortality risks associatedwith the diagnostic and revascularisation procedures. For revascularisation, a proportion of patients areassumed to be treated with either PCI or CABG, in addition to OMT.
A schematic of the diagnostic model for each of the five strategies is shown in Figures 12–16 (withoutcome of death not shown in the figures for simplicity). Strategies 1 (ICA alone), 3 (ICA plus QFR)and 5 (ICA plus vFFR) have four possible diagnostic test results of TP, FN, FP and TN based on thediagnostic accuracy of the tests relative to the reference standard test of FFR ≤ 0.8. Strategy 2 is the
INDEPENDENT ECONOMIC ASSESSMENT: YORK MODEL
NIHR Journals Library www.journalslibrary.nihr.ac.uk
56
reference standard test (ICA plus FFR), and TP and TN are the only diagnostic outcomes under thisstrategy because FFR/iFR is assumed to be a perfect test (100% sensitivity and specificity). Strategy 4is the hybrid approach of QFR where the possible diagnostic outcomes are TP, FN, FP and TN for thoseconsidered to have conclusive QFR (values outside the grey zone), whereas TP and TN are the onlypossible outcomes for those with inconclusive QFR (grey zone) because these patients undergoconfirmatory FFR/iFR. Death can occur as a result of the diagnostic and revascularisation procedures.
The model assumes that all diagnostic tests in each strategy are performed in the same medicalappointment, and that revascularisation procedures are performed either immediately after testing or
Diagnostic test True disease status Test results, ICA Treatment
ICA alone
Functionally signif icantstenosis (+)
TP
TN
FN
FPFunctionally
non-signif icant stenosis (–)
Intermediate stenosis
Optimal medicaltherapy
Optimal medicaltherapy
Revascularisation
Revascularisation
CABG
PCI
CABG
PCI
FIGURE 12 Strategy 1 of ICA alone, without additional testing to assess the functional significance of stenosis.
Diagnostic test True disease status Test results, FFR/iFR Treatment
ICA, followed byconf irmatory FFR/iFR
Functionally signif icantstenosis (+)
TP
TNFunctionally
non-significant stenosis (–)
Intermediate stenosisOptimal medical
therapy
RevascularisationCABG
PCI
FIGURE 13 Strategy 2 of ICA, followed by confirmatory FFR/iFR.
Diagnostic test True disease status Test result, QFR Treatment
ICA with QFR
Intermediate stenosis
Functionally signif icantstenosis (+)
Functionallynon-signif icant stenosis (–)
TP
TN
FN
FP
Revascularisation
Revascularisation
Optimal medicaltherapy
Optimal medicaltherapy
PCI
CABG
PCI
CABG
FIGURE 14 Strategy 3 of ICA with QFR.
DOI: 10.3310/hta25560 Health Technology Assessment 2021 Vol. 25 No. 56
© Queen’s Printer and Controller of HMSO 2021. This work was produced by Duarte et al. under the terms of a commissioning contract issued by the Secretary of Statefor Health and Social Care. This issue may be freely reproduced for the purposes of private research and study and extracts (or indeed, the full report) may be included inprofessional journals provided that suitable acknowledgement is made and the reproduction is not associated with any form of advertising. Applications for commercialreproduction should be addressed to: NIHR Journals Library, National Institute for Health Research, Evaluation, Trials and Studies Coordinating Centre, Alpha House,University of Southampton Science Park, Southampton SO16 7NS, UK.
57
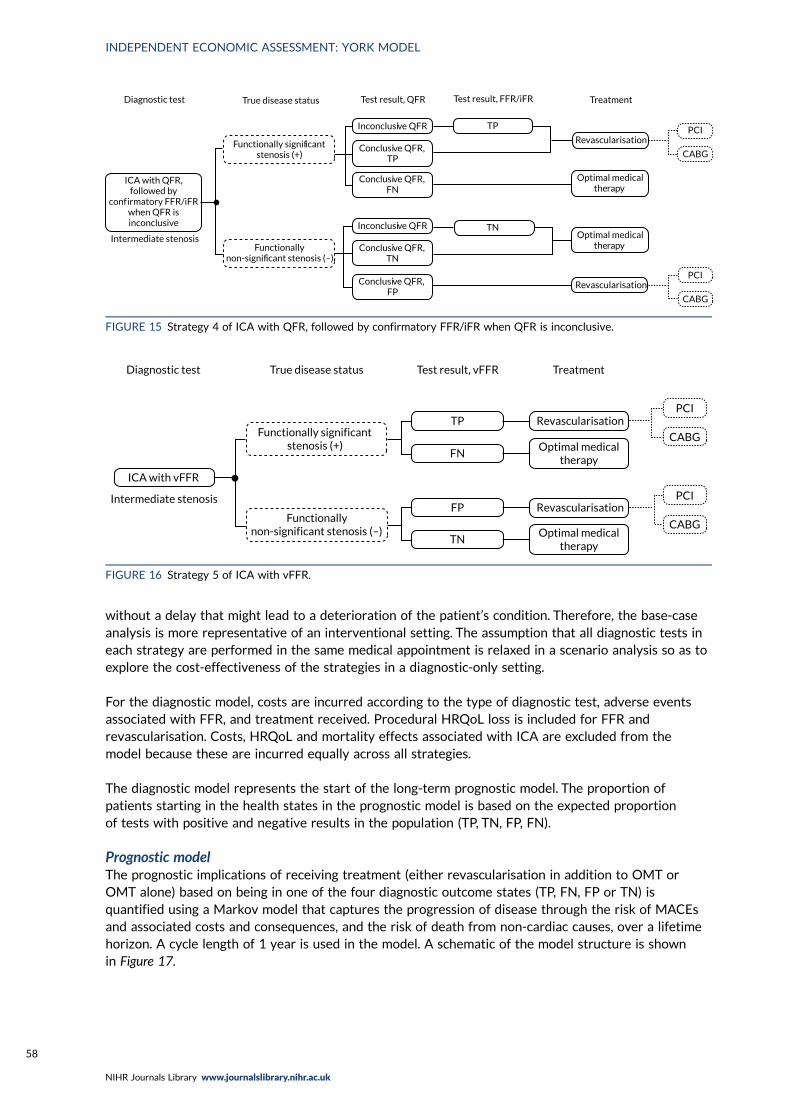
without a delay that might lead to a deterioration of the patient’s condition. Therefore, the base-caseanalysis is more representative of an interventional setting. The assumption that all diagnostic tests ineach strategy are performed in the same medical appointment is relaxed in a scenario analysis so as toexplore the cost-effectiveness of the strategies in a diagnostic-only setting.
For the diagnostic model, costs are incurred according to the type of diagnostic test, adverse eventsassociated with FFR, and treatment received. Procedural HRQoL loss is included for FFR andrevascularisation. Costs, HRQoL and mortality effects associated with ICA are excluded from themodel because these are incurred equally across all strategies.
The diagnostic model represents the start of the long-term prognostic model. The proportion ofpatients starting in the health states in the prognostic model is based on the expected proportionof tests with positive and negative results in the population (TP, TN, FP, FN).
Prognostic modelThe prognostic implications of receiving treatment (either revascularisation in addition to OMT orOMT alone) based on being in one of the four diagnostic outcome states (TP, FN, FP or TN) isquantified using a Markov model that captures the progression of disease through the risk of MACEsand associated costs and consequences, and the risk of death from non-cardiac causes, over a lifetimehorizon. A cycle length of 1 year is used in the model. A schematic of the model structure is shownin Figure 17.
Diagnostic test
Intermediate stenosis
ICA with QFR,followed by
conf irmatory FFR/iFRwhen QFR isinconclusive
Functionally signif icantstenosis (+)
Functionallynon-signif icant stenosis (–)
Inconclusive QFR
Inconclusive QFR
TP
TN
PCI
CABG
PCI
CABG
Optimal medicaltherapy
Optimal medicaltherapy
Revascularisation
Revascularisation
Conclusive QFR,TP
Conclusive QFR,FN
Conclusive QFR,TN
Conclusive QFR,FP
Test result, QFRTrue disease status Test result, FFR/iFR Treatment
FIGURE 15 Strategy 4 of ICA with QFR, followed by confirmatory FFR/iFR when QFR is inconclusive.
Diagnostic test True disease status Test result, vFFR Treatment
ICA with vFFR
Intermediate stenosis
Functionally significant stenosis (+)
Functionallynon-significant stenosis (–)
TP
FN
FP
TN
PCI
CABG
PCI
CABG
Revascularisation
Revascularisation
Optimal medicaltherapy
Optimal medicaltherapy
FIGURE 16 Strategy 5 of ICA with vFFR.
INDEPENDENT ECONOMIC ASSESSMENT: YORK MODEL
NIHR Journals Library www.journalslibrary.nihr.ac.uk
58
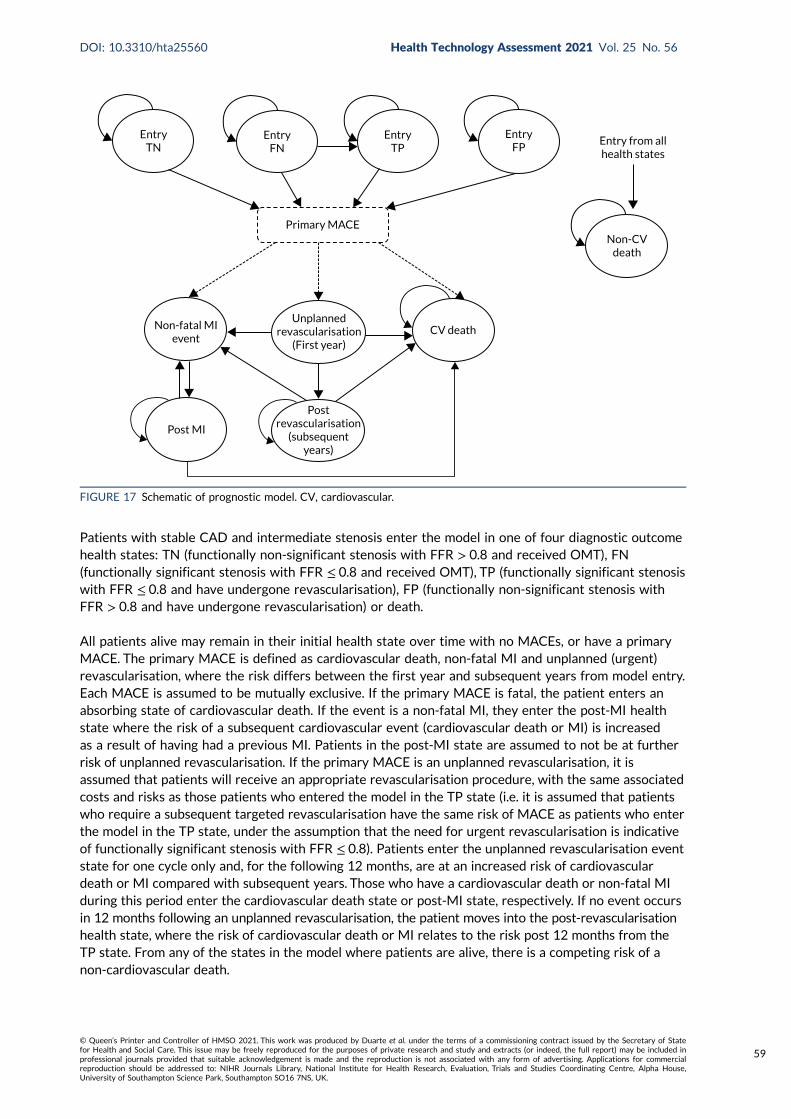
Patients with stable CAD and intermediate stenosis enter the model in one of four diagnostic outcomehealth states: TN (functionally non-significant stenosis with FFR > 0.8 and received OMT), FN(functionally significant stenosis with FFR ≤ 0.8 and received OMT), TP (functionally significant stenosiswith FFR ≤ 0.8 and have undergone revascularisation), FP (functionally non-significant stenosis withFFR > 0.8 and have undergone revascularisation) or death.
All patients alive may remain in their initial health state over time with no MACEs, or have a primaryMACE. The primary MACE is defined as cardiovascular death, non-fatal MI and unplanned (urgent)revascularisation, where the risk differs between the first year and subsequent years from model entry.Each MACE is assumed to be mutually exclusive. If the primary MACE is fatal, the patient enters anabsorbing state of cardiovascular death. If the event is a non-fatal MI, they enter the post-MI healthstate where the risk of a subsequent cardiovascular event (cardiovascular death or MI) is increasedas a result of having had a previous MI. Patients in the post-MI state are assumed to not be at furtherrisk of unplanned revascularisation. If the primary MACE is an unplanned revascularisation, it isassumed that patients will receive an appropriate revascularisation procedure, with the same associatedcosts and risks as those patients who entered the model in the TP state (i.e. it is assumed that patientswho require a subsequent targeted revascularisation have the same risk of MACE as patients who enterthe model in the TP state, under the assumption that the need for urgent revascularisation is indicativeof functionally significant stenosis with FFR ≤ 0.8). Patients enter the unplanned revascularisation eventstate for one cycle only and, for the following 12 months, are at an increased risk of cardiovasculardeath or MI compared with subsequent years. Those who have a cardiovascular death or non-fatal MIduring this period enter the cardiovascular death state or post-MI state, respectively. If no event occursin 12 months following an unplanned revascularisation, the patient moves into the post-revascularisationhealth state, where the risk of cardiovascular death or MI relates to the risk post 12 months from theTP state. From any of the states in the model where patients are alive, there is a competing risk of anon-cardiovascular death.
CV death
Postrevascularisation
(subsequentyears)
Unplannedrevascularisation
(First year)
Primary MACE
EntryTP
EntryFN
EntryTN
EntryFP
Entry from allhealth states
Non-CVdeath
Non-fatal MIevent
Post MI
FIGURE 17 Schematic of prognostic model. CV, cardiovascular.
DOI: 10.3310/hta25560 Health Technology Assessment 2021 Vol. 25 No. 56
© Queen’s Printer and Controller of HMSO 2021. This work was produced by Duarte et al. under the terms of a commissioning contract issued by the Secretary of Statefor Health and Social Care. This issue may be freely reproduced for the purposes of private research and study and extracts (or indeed, the full report) may be included inprofessional journals provided that suitable acknowledgement is made and the reproduction is not associated with any form of advertising. Applications for commercialreproduction should be addressed to: NIHR Journals Library, National Institute for Health Research, Evaluation, Trials and Studies Coordinating Centre, Alpha House,University of Southampton Science Park, Southampton SO16 7NS, UK.
59
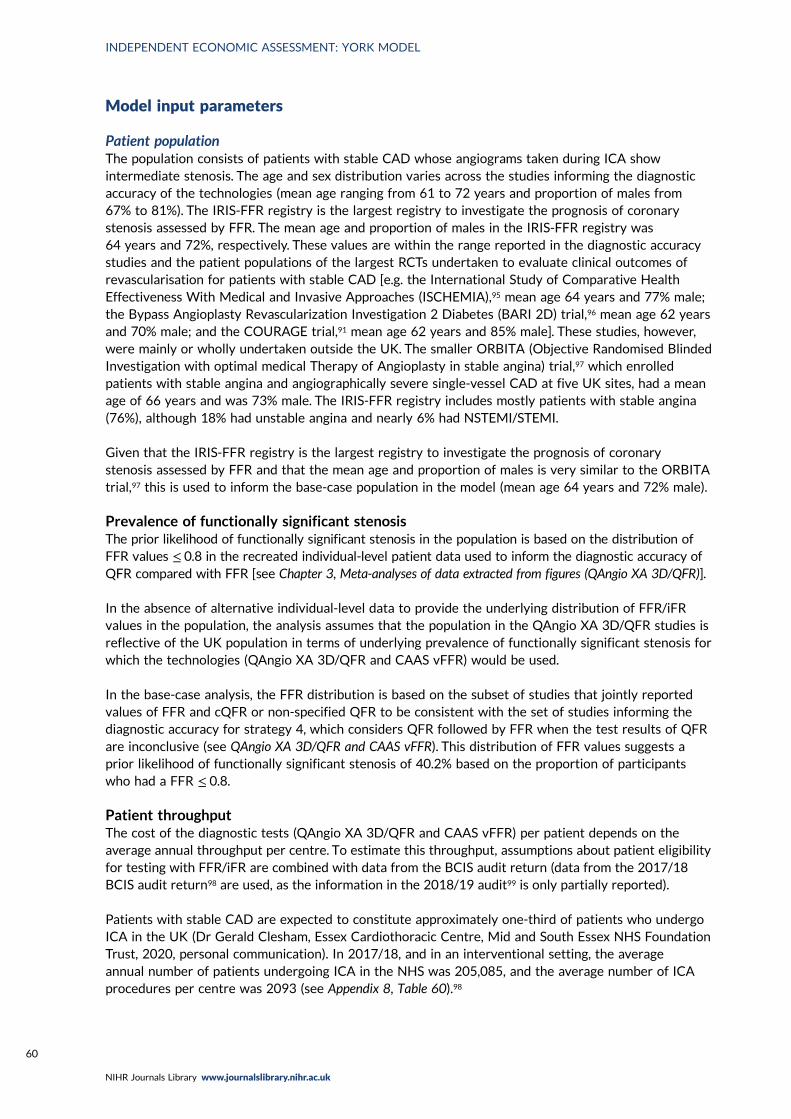
Model input parameters
Patient populationThe population consists of patients with stable CAD whose angiograms taken during ICA showintermediate stenosis. The age and sex distribution varies across the studies informing the diagnosticaccuracy of the technologies (mean age ranging from 61 to 72 years and proportion of males from67% to 81%). The IRIS-FFR registry is the largest registry to investigate the prognosis of coronarystenosis assessed by FFR. The mean age and proportion of males in the IRIS-FFR registry was64 years and 72%, respectively. These values are within the range reported in the diagnostic accuracystudies and the patient populations of the largest RCTs undertaken to evaluate clinical outcomes ofrevascularisation for patients with stable CAD [e.g. the International Study of Comparative HealthEffectiveness With Medical and Invasive Approaches (ISCHEMIA),95 mean age 64 years and 77% male;the Bypass Angioplasty Revascularization Investigation 2 Diabetes (BARI 2D) trial,96 mean age 62 yearsand 70% male; and the COURAGE trial,91 mean age 62 years and 85% male]. These studies, however,were mainly or wholly undertaken outside the UK. The smaller ORBITA (Objective Randomised BlindedInvestigation with optimal medical Therapy of Angioplasty in stable angina) trial,97 which enrolledpatients with stable angina and angiographically severe single-vessel CAD at five UK sites, had a meanage of 66 years and was 73% male. The IRIS-FFR registry includes mostly patients with stable angina(76%), although 18% had unstable angina and nearly 6% had NSTEMI/STEMI.
Given that the IRIS-FFR registry is the largest registry to investigate the prognosis of coronarystenosis assessed by FFR and that the mean age and proportion of males is very similar to the ORBITAtrial,97 this is used to inform the base-case population in the model (mean age 64 years and 72% male).
Prevalence of functionally significant stenosisThe prior likelihood of functionally significant stenosis in the population is based on the distribution ofFFR values ≤ 0.8 in the recreated individual-level patient data used to inform the diagnostic accuracy ofQFR compared with FFR [see Chapter 3, Meta-analyses of data extracted from figures (QAngio XA 3D/QFR)].
In the absence of alternative individual-level data to provide the underlying distribution of FFR/iFRvalues in the population, the analysis assumes that the population in the QAngio XA 3D/QFR studies isreflective of the UK population in terms of underlying prevalence of functionally significant stenosis forwhich the technologies (QAngio XA 3D/QFR and CAAS vFFR) would be used.
In the base-case analysis, the FFR distribution is based on the subset of studies that jointly reportedvalues of FFR and cQFR or non-specified QFR to be consistent with the set of studies informing thediagnostic accuracy for strategy 4, which considers QFR followed by FFR when the test results of QFRare inconclusive (see QAngio XA 3D/QFR and CAAS vFFR). This distribution of FFR values suggests aprior likelihood of functionally significant stenosis of 40.2% based on the proportion of participantswho had a FFR ≤ 0.8.
Patient throughputThe cost of the diagnostic tests (QAngio XA 3D/QFR and CAAS vFFR) per patient depends on theaverage annual throughput per centre. To estimate this throughput, assumptions about patient eligibilityfor testing with FFR/iFR are combined with data from the BCIS audit return (data from the 2017/18BCIS audit return98 are used, as the information in the 2018/19 audit99 is only partially reported).
Patients with stable CAD are expected to constitute approximately one-third of patients who undergoICA in the UK (Dr Gerald Clesham, Essex Cardiothoracic Centre, Mid and South Essex NHS FoundationTrust, 2020, personal communication). In 2017/18, and in an interventional setting, the averageannual number of patients undergoing ICA in the NHS was 205,085, and the average number of ICAprocedures per centre was 2093 (see Appendix 8, Table 60).98
INDEPENDENT ECONOMIC ASSESSMENT: YORK MODEL
NIHR Journals Library www.journalslibrary.nihr.ac.uk
60
Under a very broad definition of intermediate stenosis, where all stable CAD patients would undergoconfirmatory testing with FFR/iFR, the average annual throughput for an NHS interventional centrecould be as much as one-third of the average number of ICA procedures per centre, which would yieldan expected upper bound of 698 patients per centre for annual throughput in an NHS interventionalsetting (which is the setting considered in the base-case analysis; see Diagnostic model and Setting).
A more realistic assumption would be to consider that only patients with stable CAD who currentlyundergo FFR/iFR have intermediate stenosis. According to the BCIS audit returns,98 21,098 pressurewire procedures were performed annually in the UK in 2017/18 (11,726 for diagnostic-only purposesand the rest followed by PCI). This gives an average of 215 pressure wire procedures per interventioncentre per year. In the base-case analysis, it is assumed that the majority of these procedures areperformed in stable CAD in patients with intermediate stenosis. An average annual throughputof 200 patients per centre is assumed in the base case. Alternative throughput assumptions areconsidered in a scenario analysis.
SettingIn UK clinical practice, ICA can be used in two settings: diagnostic-only and interventional catheterlaboratories. QAngio XA 3D/QFR and CAAS vFFR can be used in the same settings as ICA, whereasFFR/iFR is currently performed only in an interventional setting.
The base-case analysis assumes that the tests in each of the five diagnostic strategies are performedat the same medical appointment and, thus, implicitly assumes an interventional setting. Althoughthe large majority of ICA procedures in the NHS are conducted in an interventional setting (seeAppendix 8, Table 60),98 it is important to consider the differences between settings that may affectthe cost-effectiveness of the strategies under comparison.
The key difference between diagnostic-only and interventional catheter laboratories is that FFR/iFR canbe performed only in the latter. In a diagnostic-only setting, strategies that include FFR/iFR in the testingsequence (strategies 2 and 4) require that at least some patients undergo two separate diagnosticcatheterisation procedures. The initial catheterisation corresponds to the ICA that is common to allstrategies in the model and is performed in the diagnostic-only catheter laboratory. Patients who havean inconclusive QFR measurement with QAngio XA 3D/QFR (patients in the grey zone for strategy 4)and all patients in strategy 2 are referred to an interventional catheter laboratory where they undergo asecond catheterisation to obtain a FFR/iFR measurement. This is in contrast with how patients would betested in an interventional setting, as all tests could be performed with a single catheterisation, and atthe same point in time. One of the implications of conducting two separate catheterisations is thatstrategies that involve FFR/iFR will be more costly in a diagnostic-only setting than in an interventionalsetting. Another potential consequence of this is that the condition of patients initially tested in adiagnostic-only setting deteriorates while waiting for the referral to the interventional catheterlaboratory and subsequent clinical management with revascularisation where appropriate. However, thedelays to patient management are unlikely to result in significant condition deterioration with impact onpatients’ health outcomes (Dr Gerald Clesham, personal communication). This is supported by evidenceof the ORBITA trial97 (see Treatment effect of revascularisation), which showed that PCI compared witha placebo (mock PCI) did not demonstrate a statistically significant increase in the exercise time orchange in HRQoL of patients with medically treated angina and severe coronary stenosis at 6 weekspost procedure.97
Another difference between settings is the expected annual patient throughput in diagnostic-onlycompared with interventional catheter laboratories. Appendix 8, Table 60, shows that, on average,584 patients undergo ICA in a diagnostic-only setting compared with 2093 in an interventional setting.However, the proportion of patients with stable CAD who undergo ICA in a diagnostic-only setting islikely to be higher than in an interventional catheter laboratory. The expected patient throughput in adiagnostic-only setting is unknown but needs to be considered when evaluating the cost-effectiveness
DOI: 10.3310/hta25560 Health Technology Assessment 2021 Vol. 25 No. 56
© Queen’s Printer and Controller of HMSO 2021. This work was produced by Duarte et al. under the terms of a commissioning contract issued by the Secretary of Statefor Health and Social Care. This issue may be freely reproduced for the purposes of private research and study and extracts (or indeed, the full report) may be included inprofessional journals provided that suitable acknowledgement is made and the reproduction is not associated with any form of advertising. Applications for commercialreproduction should be addressed to: NIHR Journals Library, National Institute for Health Research, Evaluation, Trials and Studies Coordinating Centre, Alpha House,University of Southampton Science Park, Southampton SO16 7NS, UK.
61
of the alternative diagnostic strategies, as it determines the cost of the QAngio XA 3D/QFR and CAASvFFR tests. This is discussed further in Test costs.
It is possible that the diagnostic accuracy of QAngio XA 3D/QFR and CAAS vFFR is also linked to thediagnostic setting. The diagnostic accuracy studies identified in Chapter 3 do not provide evidence toascertain whether or not there are any differences in the diagnostic accuracy of these technologiesacross settings, as the patient population in the review may not represent patients examined in adiagnostic-only setting. This is because only patients with a FFR measurement could be included in thediagnostic accuracy review (see Chapter 3, Selection criteria).
Finally, it is possible that there are additional training requirements for QAngio XA 3D/QFR and CAASvFFR in diagnostic-only catheter laboratories, as staff in these centres may need more training andsupport to correctly calculate and interpret the QFR and vFFR measurements. It is, however, uncertainwhat resource use is associated with these additional training requirements, so this could not bereflected in the cost-effective analysis.
The base-case scenario assumes that all diagnostic procedures take place in an interventional setting.The diagnostic-only setting is considered in scenario analyses where the impact on cost-effectivenessestimates of the following is explored: (1) additional costs due to the need to refer patients whorequire FFR/iFR measurements to an interventional catheter laboratory and (2) alternative throughputassumptions (see Results of the alternative scenario analyses).
Diagnostic accuracyThe model considers the diagnostic accuracy of ICA, QFR and vFFR, and FFR/iFR is the referencestandard test with 100% sensitivity and specificity. The diagnostic accuracy of iFR is assumed to beequivalent to that of FFR. The definition of functionally significant stenosis is based on a FFR value≤ 0.8. The following sections present the diagnostic accuracy estimates used in the model.
QAngio XA 3D/QFR and CAAS vFFRFor strategies 3 (QFR) and 5 (vFFR) that consider a single diagnostic threshold of 0.8, the test resultsare dichotomous (either positive or negative for functionally significant stenosis) based on theestimates of sensitivity and specificity of the tests relative to the reference standard of FFR ≤ 0.8.For strategy 4, where a hybrid QFR and FFR approach is considered, the QFR test results are no longerclassified as dichotomous. Under this strategy, test results are classified as positive (QFR < 0.78),negative (QFR > 0.84) or inconclusive (QFR 0.78–0.84) based on the dual thresholds of 0.78 and 0.84.Diagnostic accuracy of QFR in strategy 4 is informed by the joint probabilities of having a FFRmeasurement below or above the 0.8 threshold and a QFR measurement within the intervals definedby the dual thresholds of 0.78 and 0.84.
Single diagnostic threshold: sensitivity and specificity estimatesThe diagnostic accuracy of QFR for strategy 3 is informed by the results of the bivariate meta-analysisreported in Chapter 3, Bivariate meta-analysis (QAngio XA 3D/QFR), which combined results of studiesthat reported cQFR or non-specified QFR. Alternative estimates for sensitivity and specificity basedon studies reporting fQFR only and cQFR only are considered in separate scenario analyses. Table 9presents the diagnostic accuracy estimates for QFR in strategy 3 used in the base-case analysis andalternative scenarios.
The diagnostic accuracy of vFFR for strategy 5 is informed by the sensitivity and specificity estimatesof the FAST-EXTEND study,18 an update on the FAST study.56 This study is chosen to represent thebase-case analysis as it is the largest (n = 303) of the four included CAAS vFFR diagnostic accuracystudies (see Chapter 3, CAAS vFFR).18,19,26,56 A pooled meta-analysis is not considered appropriate becauseof the limited reported data, wide CIs, and high heterogeneity across the limited number of vFFRstudies. The limited number of vFFR studies means that the diagnostic accuracy estimates for
INDEPENDENT ECONOMIC ASSESSMENT: YORK MODEL
NIHR Journals Library www.journalslibrary.nihr.ac.uk
62
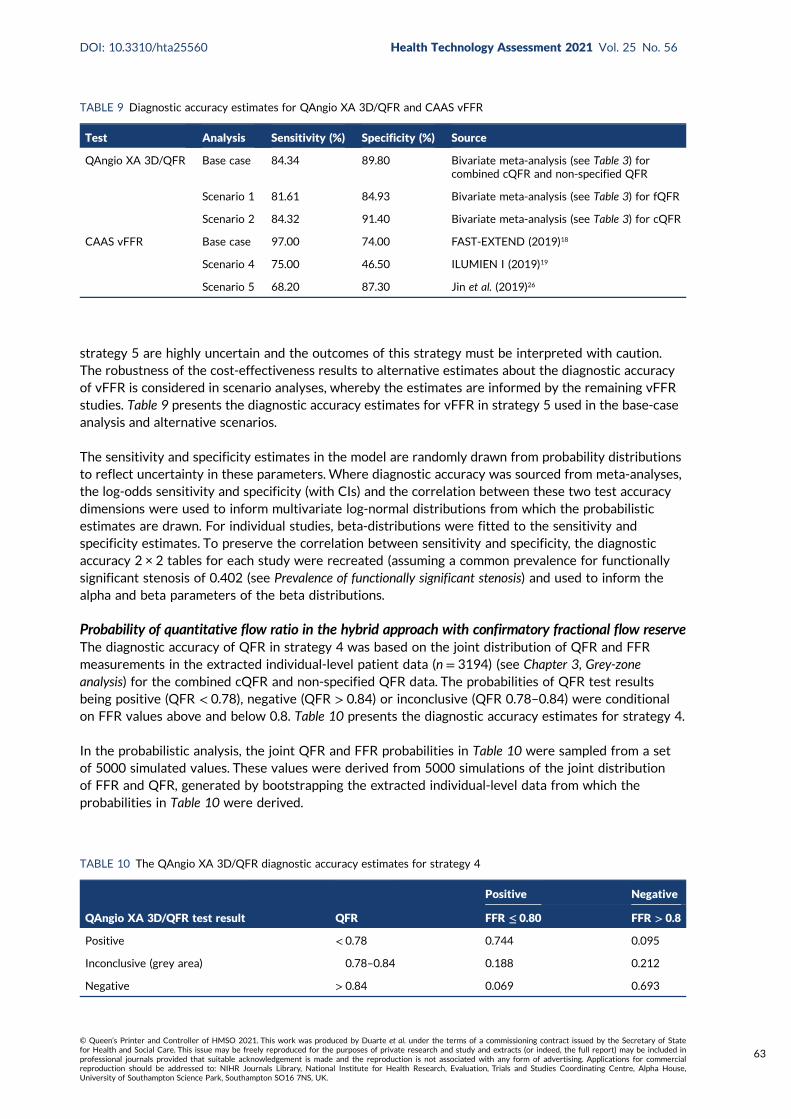
strategy 5 are highly uncertain and the outcomes of this strategy must be interpreted with caution.The robustness of the cost-effectiveness results to alternative estimates about the diagnostic accuracyof vFFR is considered in scenario analyses, whereby the estimates are informed by the remaining vFFRstudies. Table 9 presents the diagnostic accuracy estimates for vFFR in strategy 5 used in the base-caseanalysis and alternative scenarios.
The sensitivity and specificity estimates in the model are randomly drawn from probability distributionsto reflect uncertainty in these parameters. Where diagnostic accuracy was sourced from meta-analyses,the log-odds sensitivity and specificity (with CIs) and the correlation between these two test accuracydimensions were used to inform multivariate log-normal distributions from which the probabilisticestimates are drawn. For individual studies, beta-distributions were fitted to the sensitivity andspecificity estimates. To preserve the correlation between sensitivity and specificity, the diagnosticaccuracy 2 × 2 tables for each study were recreated (assuming a common prevalence for functionallysignificant stenosis of 0.402 (see Prevalence of functionally significant stenosis) and used to inform thealpha and beta parameters of the beta distributions.
Probability of quantitative flow ratio in the hybrid approach with confirmatory fractional flow reserveThe diagnostic accuracy of QFR in strategy 4 was based on the joint distribution of QFR and FFRmeasurements in the extracted individual-level patient data (n = 3194) (see Chapter 3, Grey-zoneanalysis) for the combined cQFR and non-specified QFR data. The probabilities of QFR test resultsbeing positive (QFR < 0.78), negative (QFR > 0.84) or inconclusive (QFR 0.78–0.84) were conditionalon FFR values above and below 0.8. Table 10 presents the diagnostic accuracy estimates for strategy 4.
In the probabilistic analysis, the joint QFR and FFR probabilities in Table 10 were sampled from a setof 5000 simulated values. These values were derived from 5000 simulations of the joint distributionof FFR and QFR, generated by bootstrapping the extracted individual-level data from which theprobabilities in Table 10 were derived.
TABLE 9 Diagnostic accuracy estimates for QAngio XA 3D/QFR and CAAS vFFR
Test Analysis Sensitivity (%) Specificity (%) Source
QAngio XA 3D/QFR Base case 84.34 89.80 Bivariate meta-analysis (see Table 3) forcombined cQFR and non-specified QFR
Scenario 1 81.61 84.93 Bivariate meta-analysis (see Table 3) for fQFR
Scenario 2 84.32 91.40 Bivariate meta-analysis (see Table 3) for cQFR
CAAS vFFR Base case 97.00 74.00 FAST-EXTEND (2019)18
Scenario 4 75.00 46.50 ILUMIEN I (2019)19
Scenario 5 68.20 87.30 Jin et al. (2019)26
TABLE 10 The QAngio XA 3D/QFR diagnostic accuracy estimates for strategy 4
QAngio XA 3D/QFR test result QFR
Positive Negative
FFR ≤ 0.80 FFR > 0.8
Positive < 0.78 0.744 0.095
Inconclusive (grey area) 0.78–0.84 0.188 0.212
Negative > 0.84 0.069 0.693
DOI: 10.3310/hta25560 Health Technology Assessment 2021 Vol. 25 No. 56
© Queen’s Printer and Controller of HMSO 2021. This work was produced by Duarte et al. under the terms of a commissioning contract issued by the Secretary of Statefor Health and Social Care. This issue may be freely reproduced for the purposes of private research and study and extracts (or indeed, the full report) may be included inprofessional journals provided that suitable acknowledgement is made and the reproduction is not associated with any form of advertising. Applications for commercialreproduction should be addressed to: NIHR Journals Library, National Institute for Health Research, Evaluation, Trials and Studies Coordinating Centre, Alpha House,University of Southampton Science Park, Southampton SO16 7NS, UK.
63
The diagnostic accuracy of an equivalent hybrid diagnostic approach for vFFR was not possiblebecause of data limitations. The diagnostic accuracy data for vFFR are very scarce (see Chapter 3, CAASvFFR), and only 81 data points for the joint FFR and vFFR distribution were available from one singlestudy.56 Furthermore, the underlying distribution of FFR values in this single study was considerablydifferent from that of the data extracted for QFR (probability of FFR ≤ 0.80 was 0.296 in the singlevFFR study, compared with 0.402 across 3194 data points in the QFR studies).
Invasive coronary angiographyThe base-case diagnostic accuracy of ICA was informed by the bivariate meta-analysis of extracteddata presented in Meta-analysis of extracted figure data for two-dimensional invasive coronary angiography.The model considered ICA to have a sensitivity and a specificity of 62.61% and 62.59%, respectively,when using a diagnostic threshold of 50% DS. Alternative sensitivity and specificity estimates basedon a meta-analysis by Danad et al.100 (per-vessel analysis) for diagnostic performance of ICA comparedwith FFR are used in a scenario analysis. In this study, ICA was found to have a sensitivity of 71% anda specificity of 66% based on a diagnostic threshold of 50% DS.
Procedural adverse eventsProcedures involving catheterisation for diagnostic testing (ICA and FFR/iFR) or revascularisation(PCI and CABG) have associated complications that may result in health-care resource and HRQoLloss. The diagnostic model considers the impact of serious procedural complications from FFR/iFRand revascularisation. The procedural complications of ICA are excluded from the model because allpatients undergo this procedure in all strategies and, therefore, procedural complications associatedwith ICA do not result in differences in costs and HRQoL across strategies.
The diagnostic pathway explicitly distinguishes between complications associated with invasive testingwith FFR/iFR and revascularisation so that the potential benefits of less invasive testing can becaptured (i.e. non-invasive testing with QFR and vFFR in strategies 3 and 5, respectively). However,revascularisation is often performed immediately after FFR/iFR and, therefore, the rates are often notreported separately in the literature by type of procedure.
Complications due to fractional flow reserve/instantaneous wave-free ratioThree studies were identified that reported procedural complication rates in a format suitable toinform those associated with FFR/iFR alone (i.e. unrelated to the revascularisation procedure). TheRIPCORD trial101 compared the clinical management (OMT alone or in addition to PCI or CABG)of patients with stable chest pain with ICA compared with pressure wire FFR assessment.101 Theplacebo arm of the ORBITA trial97 is also potentially relevant to inform the rates of FFR-/iFR-relatedcomplications. In this study, patients were randomised to either PCI or a placebo procedure for anginarelief, with all patients undergoing FFR/iFR prior to randomisation. Thus, patients who had seriousperiprocedural complications in the placebo arm had undergone FFR/iFR but not PCI. The IRIS-FFRregistry data also reports serious complications associated with FFR measurement.13 The rates ofserious events reported in the three studies are summarised in Appendix 8, Table 61.
Data from the IRIS-FFR registry are used to inform the base-case analysis because this registry isconsiderably larger than the other studies and is used as a source of baseline clinical effectivenessin the prognostic model (see Baseline risk of major adverse cardiac events). A scenario analysis uses thealternative source of data from the RIPCORD trial101 because this is a UK study and the patient populationappears comparable to that of the base-case population (mean age 64 years and 75% male).
The majority of complications reported in the ORBITA trial97 appear to be related to ICA (majorbleeding and pulmonary oedema) and not to FFR/iFR based on the description of the complicationsreported in the manuscript’s supplementary materials. The conversion to PCI as a result of proceduralcomplications in ORBITA97 appears to be because of coronary dissection caused by the pressure wire,and suggests a much higher rate for this complication than that reported in the IRIS-FFR registry.
INDEPENDENT ECONOMIC ASSESSMENT: YORK MODEL
NIHR Journals Library www.journalslibrary.nihr.ac.uk
64
The patient population in ORBITA97 may represent a more severe population (mean baseline FFR0.69 ± 0.16) than the population in the IRIS-FFR registry (mean baseline FFR 0.83 ± 0.11). Therefore,the rate of procedural adverse events in ORBITA97 is expected to be an overestimate of thecomplication rates in the base-case population.
None of the studies above reported procedural mortality as a result of FFR/iFR. In the IRIS-FFRregistry, deaths due to FFR may have been captured within the rates of MACEs, but this is unclear.A procedural death rate associated with FFR/iFR of 0.015% is included in the diagnostic model basedon an estimate sourced from Fearon et al.,87 which was the only study identified in the review ofdecision models evaluating ICA (see Results of the review of decision models evaluating invasive coronaryangiography) to include FFR-specific procedural death. The rates of FFR/iFR procedural complicationsapplied in the base-case analysis are summarised in Appendix 8, Table 73.
Note that, although patients underwent iFR and FFR in ORBITA,97 all patients underwent FFR only inthe IRIS-FFR registry and RIPCORD.101 The base-case analysis assumes that there are no differences inthe rates of procedural complications because of FFR and iFR, that is the complication rates associatedwith pressure wire FFR in IRIS-FFR are also reflective of the average rates of iFR as an alternative toFFR in UK clinical practice.
Probabilistic estimates of the FFR procedural complication rates were obtained by randomly samplingfrom independent beta distributions for each event rate.
Complications due to revascularisationDeath was the most common revascularisation complication reported in the cost-effectiveness modelsreviewed in Results of the review of decision models evaluating invasive coronary angiography. Two studiesalso considered non-fatal MI, but one reports complication rates jointly for ICA and revascularisation74
and the other88 sources complication rates from a very early 1996 study.
The IRIS-FFR registry does not report procedural complications associated with revascularisationseparate from the risk of MACEs. The rate of procedural deaths associated with revascularisationis sourced from UK audit data. A 0.99% death risk for non-emergency CABG102 and 0.17% forin-hospital mortality for PCI103 are applied in the diagnostic model. The mortality rate associatedwith revascularisation is estimated as a weighted average of the mortality rates for PCI and CABG,where the weights correspond to the relative proportion of PCI and CABG procedures. In the base-case analysis, 87% of revascularisation procedures are assumed to be PCI, whereas the remaining13% are CABG based on BCIS audit returns.98 The External Assessment Group (EAG) did not find datasuggesting these proportions differ depending on the diagnostic pathway (e.g. patients for whom therevascularisation decision is made based on ICA results only vs. on ICA plus FFR/iFR results). It is alsounknown whether or not these proportions may differ for patients tested with QAngio XA 3D/QFRor CAAS vFFR. This area of uncertainty was not explored in the analysis, as it would require strongassumptions on clinician behaviour without data to inform a plausible range of alternative assumptions.The EAG notes, however, that the impact of varying the relative proportion of PCI and CABG is likelyto be limited given the high rate of PCI in clinical practice.
Other procedural adverse events: radiation exposurePatients who undergo cardiac catheterisation are exposed to ionising radiation, which may increasethe lifetime risk of malignancy and associated mortality. Some of the previous cost-effectivenessmodels of ICA68,71,72,74,77,79 reviewed in Results of the review of decision models evaluating invasive coronaryangiography considered radiation exposure due to ICA testing and revascularisation.
QAngio XA 3D/QFR or CAAS vFFR may reduce the magnitude of radiation exposure by reducingthe procedural time to less than that of FFR/iFR. However, radiation exposure even with FFR/iFR isexpected to be very low, and the reduction in exposure through the use of QFR or vFFR is expected
DOI: 10.3310/hta25560 Health Technology Assessment 2021 Vol. 25 No. 56
© Queen’s Printer and Controller of HMSO 2021. This work was produced by Duarte et al. under the terms of a commissioning contract issued by the Secretary of Statefor Health and Social Care. This issue may be freely reproduced for the purposes of private research and study and extracts (or indeed, the full report) may be included inprofessional journals provided that suitable acknowledgement is made and the reproduction is not associated with any form of advertising. Applications for commercialreproduction should be addressed to: NIHR Journals Library, National Institute for Health Research, Evaluation, Trials and Studies Coordinating Centre, Alpha House,University of Southampton Science Park, Southampton SO16 7NS, UK.
65
to be very marginal (Dr Gerald Clesham, personal communication). Therefore, the impact of radiationexposure on cost-effectiveness is expected to be very minimal and is not quantified in the model. Thisis supported by the previous cost-effectiveness models; for example, Walker et al.77 explicitly modelledan increased risk of cancer death conditional on the amount of radiation exposure for several differentdiagnostic strategies that included ICA, and found that the cost-effectiveness results were robust tothe exclusion of radiation effects.
Risk of major adverse cardiac events and treatment effects of revascularisation
Baseline risk of major adverse cardiac eventsThe benefits of treatment by correctly identifying patients suitable for revascularisation, or to havetheir ischaemia treated by OMT, are modelled through the impact on risk of MACEs and HRQoL. Thebaseline risk of MACEs in the absence of revascularisation depends on disease severity as measured byFFR/iFR, where lower FFR values are indicative of a higher cardiovascular event rate, and higher FFRvalues of a lower cardiovascular event rate.104 Thus, there is an inverse relationship between FFR valueand subsequent outcomes.
The IRIS-FFR registry is the largest registry to prospectively evaluate the natural history of lesionsafter measurement of FFR in routine clinical practice.13 Revascularisation was deferred in 6468 lesions(75%) and performed in 2165 lesions (25%) after FFR assessment. Treatment with revascularisationwas generally recommended in participating centres when the FFR was ≤ 0.75, and deferred whenthe FFR was > 0.8. For FFR values between 0.75 and 0.8 the decision regarding revascularisationwas left to the operator’s discretion. Of the deferred lesions, 85.1% had a FFR value > 0.8, 9.2% had aFFR value of between 0.76 and 0.8, and 5.7% had a value of ≤ 0.75. The reasons for deferred lesionsdespite low FFR, that is, ≤ 0.75, included minimal coronary artery stenosis on ICA, diffuse diseasewithout focal stenosis, no symptoms, small myocardial territory or unsuitability for PCI.13
The primary end point in the IRIS-FFR registry was MACE arising from FFR-measured lesions, whichwas a composite of cardiac death, MI and repeat revascularisation. Cardiac death was defined as anydeath caused by a proximate cardiac cause, including cardiac arrest, MI and fatal arrhythmia. MI wasdefined as a non-fatal MI event within the first 48 hours of the procedure or ≥ 48 hours after theprocedure accompanied by ischaemic symptoms. Repeat revascularisation was defined as any PCI orCABG of a lesion with an index FFR measurement.13 The registry data provide a source of baseline riskof MACE according to FFR value in deferred lesions in the absence of revascularisation.
The overall incidence rate of MACE in the IRIS-FFR registry across the range of FFR values was1.44% (95% CI 1.15% to 1.73%) during the median follow-up of 1.9 years in deferred lesions. Thecorresponding incidence rates of clinical events were 0.09% for cardiac death, 0.14% for MI, and 1.34%for repeat revascularisation. When the 5.7% of deferred lesions with a FFR value of ≤ 0.75 wereexcluded, the overall incidence rate of MACE was 1.24% (95% CI 0.96% to 1.52%).
The risk of MACE in deferred lesions increased significantly, whereas FFR decreased. The adjustedHR for the risk of MACE when the FFR was included as an independent predictor in deferred lesionswas 1.06 (95% CI 1.05 to 1.08) per 0.01 decrease in the FFR (using FFR values ≥ 0.91 as a reference).The corresponding adjusted HRs for the risk of clinical events were 1.06 (95% CI 0.99 to 1.13) forcardiac death, 1.09 (95% CI 1.05 to 1.14) for MI and 1.07 (95% CI 1.06 to 1.09) for revascularisation.
The reported 1-year and long-term (up to 3 years) cumulative incidence of MACE in the IRIS-FFRregistry for deferred lesions is used in the model to provide an estimate of the baseline risk of MACE(i.e. MACE risk in the absence of revascularisation procedure) for the first year and subsequent years.The risk of MACE and the associated consequences in terms of health-care resource use and HRQoLis modelled by stratifying patients into subgroups of FFR values, to take account of the relationshiplinking FFR value to subsequent prognosis. To adjust for competing risks across cardiac events, the rate
INDEPENDENT ECONOMIC ASSESSMENT: YORK MODEL
NIHR Journals Library www.journalslibrary.nihr.ac.uk
66
of each MACE component was divided by the sum of the rates of the components. The resultingproportions (6% for cardiac death, 9% for MI and 85% for repeat revascularisation) were multipliedby the baseline rate of the composite MACE outcome for the reference group with FFR values ≥ 0.91,which resulted in rates adjusted for competing hazards from the MACE components.
The baseline risk of MACE used in the model for individuals in the group with highest FFR values(FFR values ≥ 0.91) is 0.64% per annum in the first year and 0.32% per annum in subsequent years.This risk was used as a reference to compute the baseline risk of MACE components in categorieswith lower FFR values (i.e. < 0.91), using the adjusted HRs of 1.06, 1.09 and 1.07 per 0.01 decrease inFFR for cardiac death, MI and revascularisation, respectively. The corresponding annual baseline risk ofMACE in deferred lesions by FFR value and by component of the composite outcome are shown inAppendix 8, Figure 46, for the first year. The values for subsequent years are approximately half of thevalues for the first year.
This approach implies that the baseline risk of MACE used in the model is conditional on FFR valueand that the distribution of FFR values differs by diagnostic strategy. Therefore, the baseline risk ofMACE from the TN and FN entry states in the model (in the absence of revascularisation) for eachdiagnostic strategy is based on the joint conditional distribution of FFR values for the diagnosticstrategy across the FFR categories shown in Appendix 8, Figure 46; that is, the expected proportionsof TN outcomes with a FFR 0.81–0.85, FFR 0.86–0.90 and FFR ≥ 0.91; and FN outcomes with a FFR0.76–0.80, FFR 0.71–0.75 and FFR ≤ 0.70 for each diagnostic strategy are dependent on the underlyingdistribution of FFR values across these categories in the population. The same approach is used toestablish the risk of MACE following revascularisation for the TP and FP entry states in the model(see Treatment effect of revascularisation). An alternative assumption is considered in a scenario analysisin which the risk of MACE is assumed to be completely independent of FFR and diagnostic test results.
The main limitation of using the IRIS-FFR registry data as a source of baseline risk of MACE for themodel is that unobserved selection factors may have influenced the decision to perform or not toperform revascularisation, which, in turn, may have exerted a modifying effect on outcomes. In addition,the registry is based outside the UK in participating centres in the Republic of Korea. In the absence ofan alternative source of data that evaluates the natural history of lesions after measurement of FFRin routine UK clinical practice, the model assumes that any potential selection factors in the IRIS-FFRregistry have no causal relation to outcomes and that any underlying reasons would not be expectedto differ from UK practice.
Treatment effect of revascularisationThe treatment effect of revascularisation on MACE in patients with stable CAD is highly uncertainand has been an area of considerable debate over the past decades. Early RCTs examining the benefitof PCI and CABG surgery compared with OMT suggested a survival benefit for revascularisation.However, more recently, the benefits of revascularisation have been questioned as a result of similarrates of death and MI observed in patients who have been optimally pharmacologically managedwithout PCI.
Appendix 8, Table 62, summarises the main findings of recent RCTs (post year 2000) in stable CAD thathave compared revascularisation (in addition to OMT) with OMT alone. The focus on studies after theyear 2000 is because of the changes in interventions over the past decades. For example, PCI usingbare metal stents or early-generation drug-eluting stents have now been shown to be less safe andeffective than currently available second-generation stents,105 whereas pharmacological interventionshave changed over time.
The definition of MACE differs across the studies, but it is generally defined as a composite ofcardiovascular death (or all-cause mortality), MI and hospital admission, with or without the needfor revascularisation. The RCTs that showed a statistically significant difference in MACE between
DOI: 10.3310/hta25560 Health Technology Assessment 2021 Vol. 25 No. 56
© Queen’s Printer and Controller of HMSO 2021. This work was produced by Duarte et al. under the terms of a commissioning contract issued by the Secretary of Statefor Health and Social Care. This issue may be freely reproduced for the purposes of private research and study and extracts (or indeed, the full report) may be included inprofessional journals provided that suitable acknowledgement is made and the reproduction is not associated with any form of advertising. Applications for commercialreproduction should be addressed to: NIHR Journals Library, National Institute for Health Research, Evaluation, Trials and Studies Coordinating Centre, Alpha House,University of Southampton Science Park, Southampton SO16 7NS, UK.
67
revascularisation and medical therapy were the Trial of Invasive versus Medical therapy in the Elderly(TIME),106 Medicine, Angioplasty, or Surgery Study II (MASS II)107 and BARI 2D96 for CABG surgery;COURAGE91 and the Fractional flow reserve versus Angiography for Multivessel Evaluation (FAME) IItrial108 for repeat revascularisation; and the DEFER (DEFERral vs. performance of percutaneouscoronary intervention of functionally non-significant coronary stenosis) trial109 in low FFR (i.e. < 0.75).
In TIME,106 305 patients aged 75 years and older with stable CAD of at least Canadian Cardiac SocietyClass II, despite at least two antianginal drugs, were randomly assigned to PCI, CABG or OMT. Asignificant difference in MACE rate between the revascularisation (19%) and medical therapy (49%)groups was observed over a mean follow-up of 184.4 days. This difference was mainly due to higherrates of hospital admission for acute coronary syndrome that required revascularisation.
In MASS II,107 611 patients with proximal multivessel stenosis and documented ischaemia wererandomly assigned to PCI, CABG or OMT. At the 5-year follow-up, a significant difference in MACEwas observed for CABG (21.2%) compared with PCI (32.7%) and OMT (36%). This difference suggestsa protective effect of CABG, but no significant difference in MACE was observed between PCI andOMT. The difference in MACE for CABG was because of a significant difference in the need for repeatrevascularisation and MI; however, there was no significant difference in overall mortality. In the BARI2D trial,96 2368 patients with stable CAD and type 2 diabetes were randomly assigned to PCI, CABGor OMT.110 At the 5-year follow-up, patients in the CABG stratum, who had more advanced CAD thanthose in the PCI stratum, had a significantly lower rate of MACE (22.4%) than the medical therapygroup (30.5%), which was largely driven by fewer MIs.
In the COURAGE trial,91 2287 patients with stable CAD were randomly assigned to PCI or OMT.A statistically significant difference in the cumulative rate of additional revascularisation at 4.6 yearswas observed between PCI (21.1%) and OMT (32.6%). The corresponding HR was 0.60 (95% CI 0.51 to0.71). In the FAME II trial,108 888 patients with stable CAD were randomly assigned to FFR-guided PCIfor patients in whom at least one stenosis was functionally significant (i.e. FFR ≤ 0.80) or OMT. At the2-year follow-up, a significantly lower rate of MACE was observed in the PCI group (8.1%) than in theOMT group (19.5%), which was largely driven by a lower rate of urgent revascularisation in the PCIgroup. The corresponding HR was 0.39 (95% CI 0.26 to 0.57). In the DEFER trial,109 325 patients withstable CAD and intermediate stenosis were randomly assigned to PCI for a FFR ≥ 0.75, PCI for a FFR< 0.75 or OMT.109 At the 2-year follow-up, a significantly lower rate of MACE was observed in the PCIgroup with FFR < 0.75 (78%) than in the OMT group (89%) and the PCI group with a FFR ≥ 0.75(83%), suggesting that FFR identifies those who will benefit the most from revascularisation in terms ofMACE outcomes.
The RCTs that showed a non-statistically significant difference in MACE between revascularisation andmedical therapy were MASS II107 and BARI 2D96 for PCI, COURAGE91 for the outcomes of mortalityand MI, and Japanese Stable Angina Pectoris (JSAP)111 and ISCHEMIA.95
In the MASS II trial107 at the 5-year follow-up, there was no statistically significant difference in MACEbetween PCI (32.7%) and OMT (36%), whereas in the BARI 2D trial96 there was no statistically significantdifference in MACE between the revascularisation group (77.2%) and the OMT group (75.9%). In theCOURAGE trial,91 there was no statistically significant difference in 4.6-year cumulative event rates forthe composite end point of all-cause mortality and MI (HR 1.05 for PCI, 95% CI 0.87 to 1.27).
In the JSAP trial111, 384 patients with stable CAD and ≥ 75% coronary stenosis were randomly assignedto PCI or OMT.111 At the 3.3-year follow-up, there was no statistically significant difference in MACEbetween the PCI group (2.9%) and OMT group (3.9%). In the largest and most recent ISCHEMIA,95 5179patients with stable CAD and moderate or severe ischaemia were randomly assigned to a revascularisationgroup (74% PCI and 26% CABG) and OMT group.95 Over a median follow-up of 3.2 years, 318 primaryoutcome events (composite of death from cardiovascular causes and MI, or hospitalisation for unstable
INDEPENDENT ECONOMIC ASSESSMENT: YORK MODEL
NIHR Journals Library www.journalslibrary.nihr.ac.uk
68
angina, heart failure or resuscitated cardiac arrest) occurred in the revascularisation group and 352occurred in the OMT group. At 6 months, the cumulative event rate was 5.3% in the revascularisationgroup and 3.4% in the OMT group, whereas at 5 years the cumulative event rate was 16.4% in therevascularisation group and 18.2% in the OMT group. The trial findings were sensitive to the definitionof MI and the timing of results; procedural MI was increased with revascularisation, and spontaneousMI was reduced with revascularisation; thus, the net effect of MI was dependent on the time point atwhich it was measured. The evidence from the trial suggests that there is no statistically significantdifference in MACE between revascularisation and OMT.
There have been several meta-analyses that have synthesised the results of trials examining thetreatment effect of revascularisation on MACE in patients with stable CAD.112–119 Of the most recentmeta-analyses that include new-generation stents, the following findings were identified:
l Pursnani et al.119 included RCTs comparing revascularisation with PCI with OMT in patientswith stable CAD, dating from 1980 until 2012. This study found that PCI was associated witha non-statistically significant improvement in mortality (RR 0.85, 95% CI 0.71 to 1.01), cardiacdeath (RR 0.71, 95% CI 0.47 to 1.06), non-fatal MI (RR 0.93, 95% CI 0.70 to 1.24) or repeatrevascularisation (RR 0.93, 95% CI 0.76 to 1.14), when compared with OMT. These results wereconsistent across different follow-up time points.
l Thomas et al.115 included RCTs comparing revascularisation with PCI with OMT in patients withstable CAD, dating from 1980 until 2011. When compared with OMT, PCI was associated with nostatistically significant improvement in all-cause mortality (RR 0.97, 95% CI 0.84 to 1.12), cardiacdeath (RR 0.91, 95% CI 0.70 to 1.17) and non-fatal MI (RR 1.09, 95% CI 0.92 to 1.29).
l Stergiopoulos et al.118 included RCTs comparing revascularisation with PCI with OMT in patients withstable CAD, dating from 1970 until 2012. When compared with OMT, PCI was associated with nostatistically significant improvement in all-cause mortality (OR 0.90, 95% CI 0.71 to 1.16), non-fatalMI (OR 1.24, 95% CI 0.99 to 1.56) and unplanned revascularisation (OR 0.64, 95% CI 0.35 to 1.17).
l Windecker et al.117 undertook a Bayesian network meta-analysis comparing revascularisation(PCI or CABG) with OMT among patients with stable CAD, dating from 1980 until 2013. CABG wasassociated with a survival benefit (RR 0.80, 95% CI 0.70 to 0.91) compared with OMT. New generationdrug-eluting stents [everolimus-eluting Xience/Promus™ stent (Boston Scientific, Marlborough, MA,USA): RR 0.75, 95% CI 0.59 to 0.96; zotarolimus-eluting Resolute™ stent (Medtronic plc, Dublin,Ireland): RR 0.65, 95% CI 0.42 to 1.00], but not balloon angioplasty (RR 0.85, 95% CI 0.68 to 1.04),bare-metal stents (RR 0.92, 95% CI 0.79 to 1.05) or early-generation drug-eluting stents [paclitaxel-eluting Taxus® stent (Boston Scientific): RR 0.92, 95% CI 0.75 to 1.12; sirolimus-eluting Cypher™ stent(Cordis Corporation, Hialeah, FL, USA): RR 0.91, 95% CI 0.75 to 1.10; zotarolimus-eluting Endeavor®
stent (Medtronic plc): RR 0.88, 95% CI 0.69 to 1.10], were associated with improved survival comparedwith OMT. CABG reduced the risk of MI compared with OMT (RR 0.79, 95% CI 0.63 to 0.99), andeverolimus-eluting stents showed a trend towards a reduced risk of MI (RR 0.75, 95% CI 0.55 to 1.01).The risk of subsequent revascularisation was noticeably reduced by CABG (RR 0.16, 95% CI 0.13 to0.20) followed by new-generation drug-eluting stents (zotarolimus-eluting Resolute stent: RR 0.26,95% CI 0.17 to 0.40; everolimus-eluting Xience/Promus stent: RR 0.27, 95% CI 0.21 to 0.35), early-generation drug-eluting stents (zotarolimus-eluting Endeavor stent: RR 0.37, 95% CI 0.28 to 0.50;sirolimus-eluting Cypher stent: RR 0.29, 95% CI 0.24 to 0.36; paclitaxel-eluting Taxus stent: RR 0.44,95% CI 0.35 to 0.54) and bare-metal stents (RR 0.69, 95% CI 0.59 to 0.81) compared with OMT.
l Chacko et al.116 included RCTs comparing PCI with OMT in patients with stable and unstable CAD, datingfrom 1992 until 2019, which included ISCHEMIA,95 to examine the effects on death and MI. For stableCAD, PCI did not show a statistically significant reduction in mortality (RR 0.98, 95% CI 0.87 to 1.11),cardiac death (RR 0.89, 95% CI 0.71 to 1.12) or MI (RR 0.96, 95% CI 0.86 to 1.08).
The IRIS-FFR registry13 prospectively evaluated the natural history of lesions after measurement ofFFR in routine clinical practice in those revascularised [95.7% PCI, with the majority new-generationdrug-eluting stents (85.1%) and 4.3% CABG] compared with deferred lesions. The overall incidence
DOI: 10.3310/hta25560 Health Technology Assessment 2021 Vol. 25 No. 56
© Queen’s Printer and Controller of HMSO 2021. This work was produced by Duarte et al. under the terms of a commissioning contract issued by the Secretary of Statefor Health and Social Care. This issue may be freely reproduced for the purposes of private research and study and extracts (or indeed, the full report) may be included inprofessional journals provided that suitable acknowledgement is made and the reproduction is not associated with any form of advertising. Applications for commercialreproduction should be addressed to: NIHR Journals Library, National Institute for Health Research, Evaluation, Trials and Studies Coordinating Centre, Alpha House,University of Southampton Science Park, Southampton SO16 7NS, UK.
69
rate of MACE in revascularised lesions was 2.4%, compared with 1.44% in deferred lesions during themedian follow-up of 1.9 years. The corresponding incidence rates of clinical events were 0.71% forcardiac death or MI and 1.83% for repeat revascularisation compared with 0.21% and 1.34% in deferredlesions, respectively. However, unlike the deferred lesions, the risk of MACE was not associated withFFR measurement. After adjustment for independent predictors of MACE, the risk of MACE was notstatistically significantly different between revascularised and deferred lesions for FFR values ≥ 0.76(HR 0.83, 95% CI 0.46 to 1.50 for a FFR 0.76–0.80 and HR 1.21, 95% CI 0.44 to 3.36 for a FFR0.81–0.85). Revascularisation was associated with improved MACE rates, compared with deferredlesions, for lesions with FFR ≤ 0.75 (HR 0.47, 95% CI 0.24 to 0.89 for a FFR 0.71–0.75 and HR 0.47,95% CI 0.26 to 0.84 for a FFR ≤ 0.70). The findings from the IRIS-FFR registry are consistent with thestudy by Johnson et al.,104 which examined the prognostic value of FFR on clinical outcomes. Johnsonet al.104 undertook a meta-analysis of study-level (9173 lesions) and patient-level (6961 lesions) datainvestigating prognoses of MACE outcomes after FFR measurement by revascularisation comparedwith OMT. The study-level metaregression indicated that revascularisation was associated with alower normalised 1-year MACE rate (composite of death, MI and repeat revascularisation), than OMT,when the FFR was ≤ 0.75. The corresponding patient-level metaregression after adjustment for DSindicated that revascularisation was associated with a lower 1-year MACE rate, than OMT, when theFFR was ≤ 0.76.
In summary, the treatment effect of revascularisation on MACE in patients with stable CAD is highlyuncertain. The primary aim of the largest and most recent ISCHEMIA trial,95 which included UK centres,was to address the limitations of previous trials by determining whether or not revascularisation plusOMT, compared with a conservative strategy of OMT alone, would reduce the primary compositeoutcome of death from cardiovascular causes or MI, and hospitalisation for unstable angina, heartfailure or resuscitated cardiac arrest in patients with stable ischaemic heart disease with moderate orsevere ischaemia. As indicated above, the trial did not find evidence that revascularisation reduced therisk of MACE. Therefore, it seems appropriate for the base-case analysis to consider that the benefits ofthe diagnostic tests in identifying the appropriateness for revascularisation confers no benefit on MACEoutcomes. This means that in the base-case analysis the risk of MACE following revascularisation for theTP and FP entry states in the model is the same as the baseline risk of MACE conditioned on FFR value.That is, the expected proportion of TP outcomes with a FFR of 0.76–0.80, 0.71–0.75 and ≤ 0.70, and FPoutcomes with a FFR of 0.81–0.85, 0.86–0.90 and ≥ 0.91 for each diagnostic strategy, is dependent onthe underlying distribution of the FFR values across these categories in the population.
Alternative scenarios are considered in the model where revascularisation does confer a benefit onMACE outcomes compared with OMT. Three alternative scenarios are considered:
1. A significant reduction in MACE only for a FFR ≤ 0.76, in line with the findings of the IRIS-FFRregistry. In this scenario, the HR for revascularisation is set equal to 0.47 (95% CI 0.24 to 0.89 fora FFR 0.71–0.75 and 95% CI 0.26 to 0.84 for a FFR ≤ 0.70) for all components of MACE for a FFR≤ 0.75, whereas the HR is set equal to 1 for a FFR > 0.75.
2. A significant reduction in the component of MACE of unplanned revascularisation only and noreduction for cardiac death or MI. This is in line with the findings of the trials that found there wasa positive effect of revascularisation on MACE outcomes but that this positive effect was largelydetermined by a reduction in the number of repeat/emergency or unplanned revascularisationsrather than cardiac death or MI. In this scenario, the HR is set equal to 0.26 (95% credible interval0.17 to 0.40) for repeat revascularisation from the meta-analysis by Windecker et al.117 fornew-generation drug-eluting stents, whereas the HR is set equal to 1 for cardiac death or MI.
3. A non-statistically significant reduction in MACE for all components. This is in line with the findingsof the trials that found a modest improvement in MACE outcomes for revascularisation comparedwith OMT, but this improvement was not statistically significant. In this scenario, the HR is set equalto 0.71 (95% CI 0.47 to 1.06) for cardiac death, 0.93 (95% CI 0.70 to 1.24) for non-fatal MI and 0.93(95% CI 0.76 to 1.14) for repeat revascularisation based on the meta-analysis by Pursnani et al.119
INDEPENDENT ECONOMIC ASSESSMENT: YORK MODEL
NIHR Journals Library www.journalslibrary.nihr.ac.uk
70
Additional sensitivity analyses using the results from the individual RCTs and meta-analyses reportedabove are considered to assess the impact of alternative assumptions about the treatment effect ofrevascularisation for MACE outcomes on the cost-effectiveness results.
Other-cause mortalityMortality due to non-cardiovascular causes was estimated based on age- and sex-specific UK lifetables120 and by deducting the mortality due to ischaemic heart disease (International Classification ofDiseases, codes 20–25).121 The age-specific probability of death was estimated as a weighted average ofmale and female mortality.
Health-related quality of lifeTo estimate QALYs, it is necessary to quality-adjust the period of time for which the average patientis alive within the model using an appropriate utility or preference score. QALYs are calculated bysumming the time spent in a health state weighted by the utility value associated with the health state.Additional adjustments are made to QALYs to reflect a decrement in utility associated with an acuteor adverse event. The NICE methods guide advocates a preference for EQ-5D data with utility valuesusing UK population weights when available.92
In the diagnostic model a one-off utility decrement is applied to patients undergoing invasive FFR/iFRand those who undergo revascularisation (known as procedural disutility). At the end of the diagnosticmodel, patients who survive enter the long-term prognostic model in one of the four health states of TP,FN, FP or TN. The implications on HRQoL of receiving treatment (either revascularisation in addition toOMT or OMT alone) based on being in one of the four diagnostic health states is quantified by attachinga utility value to each of the health states. A one-off utility decrement is also applied in the prognosticmodel to those who experience a non-fatal MI or require an unplanned revascularisation. To reflect adecrease in HRQoL for those with a history of MI, a separate utility decrement is applied to the post-MIhealth state. For those patients who experience an unplanned revascularisation, the utility valueassociated with the TP health state is applied based on the assumption that patients who undergo atargeted revascularisation achieve the same benefits of revascularisation, in terms of symptom relief,as patients who had a successful initial revascularisation procedure.
The utility values are used to calculate the expected number of QALYs for each diagnostic strategyover the duration of the model.
Procedural disutilityThe model considers the procedural disutility associated with FFR/iFR, PCI and CABG. The disutilityassociated with ICA is not included because all patients undergo the procedure. Targeted literaturesearches were used to identify sources to inform procedural disutility parameters.
No studies reporting HRQoL loss associated with FFR/iFR were identified. However, FFR/iFR, particularlyFFR, which requires the administration of a hyperaemic agent, can cause discomfort to patients.The administration of the most commonly used hyperaemic agent, adenosine, can result in chest pain,dyspnoea, bronchospasm, conduction disturbances, facial flushes, headaches and hypotension.122–125
Patient discomfort can therefore arise from adverse events associated with the hyperaemic agent, butalso relate to vasodilation that is a consequence of inducing a hyperaemic state to perform FFR. In theabsence of suitable estimates to inform the disutility associated with FFR/iFR, a disutility equivalent tothat of a PCI procedure is assumed. Furthermore, this is assumed to apply to all patients undergoingFFR/iFR and not just to those who incurred procedural complications (see Complications due to FFR/iFR).An additional disutility resulting from procedural complications was not included in the model toavoid double counting. It is expected that iFR is more tolerable to patients as it does not require theadministration of a hyperaemic agent; however, a specific disutility estimate for iFR was not identified.Furthermore, the proportion of patients with intermediate stenosis who undergo iFR in UK clinical
DOI: 10.3310/hta25560 Health Technology Assessment 2021 Vol. 25 No. 56
© Queen’s Printer and Controller of HMSO 2021. This work was produced by Duarte et al. under the terms of a commissioning contract issued by the Secretary of Statefor Health and Social Care. This issue may be freely reproduced for the purposes of private research and study and extracts (or indeed, the full report) may be included inprofessional journals provided that suitable acknowledgement is made and the reproduction is not associated with any form of advertising. Applications for commercialreproduction should be addressed to: NIHR Journals Library, National Institute for Health Research, Evaluation, Trials and Studies Coordinating Centre, Alpha House,University of Southampton Science Park, Southampton SO16 7NS, UK.
71
practice is also unknown. Therefore, the base-case analysis makes a simplifying assumption that theQALY loss estimate applied for FFR/iFR is representative of both types of pressure wire procedures.
One UK study126 was identified as relevant to inform the procedural disutility of revascularisation(PCI and CABG). Bagust et al.126 conducted a cost-effectiveness study comparing drug-eluting stentswith conventional stents for the treatment of symptomatic CAD. The model considered the QALY lossper percutaneous transluminal coronary angioplasty (PTCA) and per CABG by combining EQ-5D datafrom two clinical trials in multivessel CAD that compared alternative revascularisation procedures(PTCA with bare and drug-eluting stents, and CABG) with assumptions on the duration of the disutility.The disutility for each procedure was estimated as the difference in utility scores before and afterthe revascularisation procedure. The disutility was assumed to be incurred for 1 month for PTCAand 6 months for CABG, resulting in a QALY loss of 0.0056 and 0.033 QALYs per PTCA and CABGprocedure, respectively. The authors noted, however, that the QALY losses may be an overestimate as allpatients had multivessel disease. These QALY loss estimates are used to inform the base-case scenario.Appendix 8, Table 63, summarises the QALY loss estimates associated with each procedure in thediagnostic model. The QALY loss associated with PCI and CABG is applied in the model as a weightedaverage, assuming that 87% of revascularisation procedures are PCI and 13% CABG (see Complicationsdue to revascularisation). The QALY loss associated with revascularisation is also applied in the prognosticmodel to capture the HRQoL impact of unplanned revascularisation. Gamma distributions were fitted tothe procedural HRQoL loss to generate probabilistic estimates.
Health state utilitiesThe benefits of the diagnostic tests in identifying the appropriateness for revascularisation can conferhealth benefits through greater symptom relief and, therefore, higher HRQoL. Given that the base-caseanalysis assumes that there is no treatment effect of revascularisation on MACE, the improvement insymptom relief is the only benefit of revascularisation. Of the recent RCTs (post year 2000) in stableCAD that have compared revascularisation with OMT (see Treatment effect of revascularisation), therewas a general trend towards significantly greater improvement in HRQoL after revascularisation.In TIME,106 after 6 months, angina severity decreased and measures of HRQoL using the Short Formquestionnaire-36 items (SF-36), Duke Activity Score Index (DASI) and Rose Angina Questionnaireshowed a significantly greater improvement after revascularisation compared with OMT.106 In theMASS II trial,107 HRQoL using the SF-36 instrument was better in both the CABG and PCI groupscompared with OMT at the 1-year follow-up, with the CABG group presenting the greater andprogressive improvement in HRQoL.127 In the COURAGE trial,91 HRQoL using the Seattle AnginaQuestionnaire (SAQ) showed a very modest improvement in SAQ score for the PCI group, comparedwith OMT, at the 1-year follow-up.128 In the BARI 2D trial,96 HRQoL was reported using the DASI,RAND 36-Item Health Survey and patients’ self-rated health, and demonstrated that, comparedwith OMT, revascularisation was associated with significantly greater improvements in DASI, energyand self-rated health components but not health distress.129 The HRQoL effects of revascularisationin BARI 2D96 were largely maintained over a 4-year follow-up. In the FAME II trial,108 HRQoL wasmeasured using EQ-5D at the 1-month and 1-year follow-ups and reported based on patients’ indexFFR measurement.130 The results of the trial showed that HRQoL improved significantly from baselineafter PCI, with the largest marked improvement in those with a lower FFR value, whereas it did notchange significantly in the OMT group. In ISCHEMIA,95 HRQoL using the SAQ at 3, 12 and 36 monthsshowed a significant, durable improvement in angina control and HRQoL with revascularisationcompared with OMT.131 The smaller ORBITA trial,97 which reported HRQoL using SAQ and theEuroQol-5 Dimensions, five-level version (EQ-5D-5L) visual analogue scale, was the only study thatdemonstrated a non-statistically significant difference in HRQoL for PCI compared with OMT.97
In summary, the evidence from the most recent RCTs suggests that revascularisation has a significantlygreater improvement in HRQoL than OMT alone. This is supported by a recent systematic review andmeta-analysis summarising the evidence to determine the impact of coronary revascularisation on HRQoL,which showed that both PCI and CABG had significantly greater effects on HRQoL than medication,but the effects of the revascularisation procedures did not differ significantly from each other.132
INDEPENDENT ECONOMIC ASSESSMENT: YORK MODEL
NIHR Journals Library www.journalslibrary.nihr.ac.uk
72
Of the most recent RCTs, only one trial, FAME II,108 measured improvement in HRQoL using EQ-5D.This trial was a subsequent RCT to the FAME I trial133 that compared two different revascularisationstrategies in patients with stable CAD and multivessel disease using standard ICA-guided revascularisationof lesions with a > 50-mm DS and a FFR-guided revascularisation approach for lesions with a FFR≤ 0.80. The FAME II trial108 was designed to clarify whether PCI of functionally significant stenoses(i.e. lesions with FFR ≤ 0.80) combined with OMTwould be superior to OMT alone in patients withstable CAD. In a study by Nishi et al.,130 patient-level pooled analysis from the FAME I and II trials wasused to assess whether or not the benefit to HRQoL after PCI depends on the severity of the stenosisas determined by FFR measurement. The study is based on patients with stable CAD who underwentPCI with a FFR ≤ 0.80 from the FFR-guided arm of the FAME I trial and the PCI arm of the FAME IItrial.108 The study reports the change from baseline in EQ-5D utility values by FFR 0.70–0.80, FFR0.51–0.69 and FFR ≤ 0.50. The study also reports the change from baseline in EQ-5D utility values forlesions with a FFR ≤ 0.80 that were treated medically from the OMT arm of the FAME II trial.108 Theresults of this study are directly relevant for informing the HRQoL improvement from revascularisationcompared with OMT in the model.
Table 11 presents the change in EQ-5D utility values from baseline to 1 month and 1 year in the PCI(in addition to OMT) group and the OMT-alone group by FFR value based on Nishi et al.130 The EQ-5Dimproved significantly from baseline after PCI in all FFR subgroups at both the 1-month and the 1-yearfollow-ups, with a progressive improvement with lower FFR values. The EQ-5D improved slightly frombaseline in the OMT group to both 1 month and 1 year, but this improvement was not statisticallysignificant (note that the results in Table 11 exclude crossovers to PCI in the OMT group).
The utility values in Table 11 are used to represent the change in baseline utility for the TP and FN healthstates. For the TP health state, the utility value for revascularisation is used to provide a weighted changein utility value based on the expected proportion of TP outcomes with a FFR 0.70–0.80, 0.51–0.69 and≤ 0.50, which differs by diagnostic strategy and is dependent on the underlying distribution of FFR valuesacross these categories in the population. For the FN health state, the utility value for OMTwith a FFR≤ 0.80 is used to provide the change in baseline utility. For the FP and TN health states with a FFR > 0.80(functionally non-significant stenosis), it is assumed that there is no change in baseline utility for patientswith intermediate stenosis.
The underlying baseline utility for a 64-year-old UK patient with stable CAD is also taken from Nishi et al.,130
where the average age of patients in the FAME trials108 was the same as the modelled population.To reflect the decreasing utility of patients as they age through the model, age- and sex-adjustedEQ-5D norms for the UK based on Ara et al.134 were adjusted to reflect the existence of stable CAD.The adjustment factor was estimated by comparing the baseline utility of Nishi et al.130 to the averageutility of a 64-year-old UK patient, derived from a nationally representative UK sample using EQ-5D.
Patients who experience a non-fatal MI receive a one-off utility decrement, whereas those in thepost-MI health state are subject to a decrease in HRQoL for the duration of time spent in this state.Both these utility decrements were sourced from Sullivan et al.135, a study that estimated a catalogueof marginal disutilities for a wide range of health conditions based on UK-specific health preferences.
TABLE 11 Change in EQ-5D utility values from baseline for PCI and OMT by FFR value (Nishi et al.130)
Time point
EQ-5D value (95% CI)
Revascularisation OMT
FFR 0.70–0.80 FFR 0.51–0.69 FFR ≤ 0.50 FFR ≤ 0.80
At 1 month 0.039 (0.019 to 0.059) 0.056 (0.036 to 0.075) 0.080 (0.058 to 0.101) 0.003 (–0.012 to 0.017)
At 1 year 0.038 (0.013 to 0.063) 0.057 (0.037 to 0.078) 0.065 (0.040 to 0.089) 0.015 (–0.004 to 0.033)
DOI: 10.3310/hta25560 Health Technology Assessment 2021 Vol. 25 No. 56
© Queen’s Printer and Controller of HMSO 2021. This work was produced by Duarte et al. under the terms of a commissioning contract issued by the Secretary of Statefor Health and Social Care. This issue may be freely reproduced for the purposes of private research and study and extracts (or indeed, the full report) may be included inprofessional journals provided that suitable acknowledgement is made and the reproduction is not associated with any form of advertising. Applications for commercialreproduction should be addressed to: NIHR Journals Library, National Institute for Health Research, Evaluation, Trials and Studies Coordinating Centre, Alpha House,University of Southampton Science Park, Southampton SO16 7NS, UK.
73
In this study, marginal disutilities were estimated as EQ-5D index score decrements adjusted for patientcharacteristics (age, comorbidity, sex, ethnicity, income and education). The marginal disutility for ‘acuteMI’ (International Classification of Diseases, Ninth Edition, code 410) informed the utility decrement fornon-fatal MI events [–0.0626, standard error (SE) 0.0132], and the estimate for previous MI informedthe post-MI health state (–0.0368, SE 0.0252). Gamma distributions were fitted to the utility decrementsfor the uncertainty analysis.
Resource use and costsThis section details the resource use and costs applied in the model. The diagnostic model considers thecosts of diagnostic testing, revascularisation and treatment of procedural complications. The prognosticmodel considers the costs of OMT, health state and clinical events. Costs in the model are fixed estimates.Details by category of resource use and costs are presented in the sections below.
Test costs
QAngio XA 3D/QFR costsThe costs of QAngio XA 3D/QFR include the cost of the software licence, and training and certificationfees. These costs are summarised in Appendix 8, Table 64 (adapted from the company’s response toNICE’s information request and additional EAG questions). Costs were originally reported in euros,and have been converted to GBP at an exchange rate of 0.86295, based on the average exchange ratebetween 25 August 2019 and 19 February 2020.136
Software licence costs The costs of the QAngio XA 3D/QFR software licence are dependent on thenumber of patients tested (‘per-patient-study basis’). The cost per patient of the software licence is thesame for the 10-patient and 50-patient vouchers, whereas the 100-patient voucher offers a discount of£8.63 per patient compared with the other two options (assuming the same 100 patients are tested).To simplify cost calculations, it is assumed that annual throughput is a multiple of 10. It is furtherassumed that an NHS trust would purchase the least costly combination of vouchers that would coverthe expected annual throughput. For example, if annual expected throughput was 180 patients, thetrust would purchase one 100-patient voucher and eight 10-patient vouchers. For the base-case annualthroughput of 200 patients, the trust would purchase two 100-patient vouchers, at a total cost of£84,569.10 (approximately £423 per patient).
Training costs The cost of the 100-patient voucher also covers the training and certification of up tofour QAngio XA 3D/QFR users. The cost of the 10-patient and 50-patient vouchers does not include anytraining and certification. When training and certification are required and this cost is not covered bythe voucher, a fee of £3020 for up to four software users applies for both on-site and online training.It was assumed that for every 100 patients, four members of staff would require training, and so thetraining fee would, therefore, be covered by the voucher for an average annual throughput ≥ 100. It isonly when annual throughput is lower than 100 patients and, therefore, the trust does not purchase atleast one 100-patient voucher, that this cost will be incurred. In addition to the training and certificationfees charged by the company, the staff time costs required for training activities should also be considered.According to Medis Medical Imaging Systems BV, on-site training is currently available only for groups ofa minimum of 10 participants, but an e-learning platform is being developed to deliver training. E-learningis expected to be available before the fourth quarter of 2020. Another alternative for large researchgroups is to have training delivered over 1.5 days at Leiden but without travel and accommodation costsincluded. Medis Medical Imaging Systems BV states that using the e-learning platform training shouldrequire 5 hours of staff time, whereas certification would be done on a cloud-based solution, taking1–2 hours. This training would typically be required by an observer or technician in the catheterisationlaboratory, who uses the QFR software solution and carries out the analyses. The company also has ashortened e-learning module for the interventional cardiologist that should take 30 minutes to complete.As more details have been provided for online training, and on-site training appears to require a largenumber of participants, we have estimated costs of training assuming that this is delivered online.
INDEPENDENT ECONOMIC ASSESSMENT: YORK MODEL
NIHR Journals Library www.journalslibrary.nihr.ac.uk
74
It was assumed that for each four-member group of staff requiring training, one would be aninterventional cardiologist and the other three cardiac physiologists. The cardiac physiologists areassumed to be the software operators, and thus undergo both the training and the certificationmodule. The first module takes 5 hours to complete, whereas the second requires 1.5 hours (mid-pointof the range of time provided by the company). Unit costs for staff time were taken from the PersonalSocial Services Research Unit (PSSRU) costs.137 The cost per working hour of a surgical consultantwas assumed to cost the same as a cardiologist’s time, and that of an allied professional (band 5) for acardiac physiologist’s time. Staff time and costs associated with NHS staff training and certification per100 patients are shown in Appendix 8, Table 65.
It is assumed that the additional staff time and cost of that time will increase at the same rate asthroughput, which corresponds to a staff cost per patient of £7.76. We assume the same staff cost perpatient for an annual throughput lower than 100 patients. This simplifying assumption effectivelyimplies that staff time is independent of throughput.
Total cost per patient tested The costs of QAngio XA 3D/QFR disaggregated by cost element arepresented in Appendix 8, Table 66, for the base-case throughput assumption of 200 patients per year.The cost per patient tested with QAngio XA 3D/QFR is £430.61.
CAAS vFFR costsThe costs of CAAS vFFR include the cost of (1) the software licence, (2) training and (3) annualmaintenance. Pie Medical Imaging BV has two different pricing models for CAAS vFFR, which aresummarised in Appendix 8, Table 67 (adapted from the company’s response to NICE’s informationrequest). Costs were originally reported in euros, and have been converted to GBP at the sameexchange rate used to estimate the costs of QAngio XA 3D/QFR.136
Software licence costs The cost of the software licence for CAAS vFFR per patient tested variesaccording to the pricing model selected. Under pricing model 1, the software licence costs £31,929and is described as perpetual. The total number of tests covered by the licence depends on the lifespanof the technology, which is unknown. For the purpose of determining a cost per patient tested, it isconservatively considered that the perpetual licence covers the annual patient throughput independentlyof its size (i.e. the lifespan of the technology is 1 year). Under pricing model 2, the cost per patient testedis fixed at £172.59. Assuming that annual throughput is a multiple of 10 (as assumed for QAngio XA3D/QFR cost calculations), the software licence cost per patient is lower for pricing model 2 than forpricing model 1 only when the annual throughput is ≤ 10 patients. For the base-case assumption of200 patients per year, the software licence cost per patient tested with pricing model 1 is £159.65.
Training costs CAAS vFFR training can be delivered through three alternative platforms: e-learning,WebexTM (Cisco Systems, Milpatas, CA, USA) or on-site training. The training fee depends on thedelivery platform, with e-learning offered at no cost and Webex and on-site training offered at a costof £215.74 and £2157.38, respectively. Pie Medical Imaging BV does not specify if there is a maximumnumber of NHS staff covered by the training fee. It is assumed that only one training session by eitherWebex or on-site delivery would be required independent of annual throughput, and that anyadditional training would be delivered online at no additional cost. We calculated the cost of thetraining fee as the average between on-site and Webex training costs (£1186.56).
Pie Medical Imaging BV states that the same training should be delivered to staff using the CAAS vFFRsoftware and the interventional cardiologist who interprets the result. Training delivered throughe-learning and Webex requires 2 hours per member of staff, whereas on-site training requires 4 hours.We made the same assumptions regarding numbers of staff members who would require training asfor QAngio XA 3D/FR, that is one cardiologist and three cardiac physiologists would require trainingfor every 100 patients tested. We also assumed that the additional staff training time and cost of thattime would increase at the same rate as the throughput. Thus, the staff training cost per patient is
DOI: 10.3310/hta25560 Health Technology Assessment 2021 Vol. 25 No. 56
© Queen’s Printer and Controller of HMSO 2021. This work was produced by Duarte et al. under the terms of a commissioning contract issued by the Secretary of Statefor Health and Social Care. This issue may be freely reproduced for the purposes of private research and study and extracts (or indeed, the full report) may be included inprofessional journals provided that suitable acknowledgement is made and the reproduction is not associated with any form of advertising. Applications for commercialreproduction should be addressed to: NIHR Journals Library, National Institute for Health Research, Evaluation, Trials and Studies Coordinating Centre, Alpha House,University of Southampton Science Park, Southampton SO16 7NS, UK.
75
independent of throughput, but depends on the training platform. The same unit costs were applied forthe calculation of staff training costs as for QAngio XA 3D/QFR. Appendix 8, Table 68, shows the stafftraining cost per 100 patients tested with CAAS vFRR.
The staff training cost per patient is £4.40 when delivered online (Webex or e-learning) and £8.80when delivered on site. In the base case we assumed that the staff training cost per patient testedwould correspond to £6.60, the average cost of online and on-site staff training.
Maintenance costs Pie Medical Imaging BV charges a fee for annual maintenance of CAAS vFFR. Thecost of maintenance varies by pricing model. For pricing model 1 there is no maintenance cost in thefirst year, and an annual cost of £4746.23 applies for subsequent years. For pricing model 2 there isan annual cost of £3023.44 incurred every year. As we have made a simplifying assumption that thelifespan of the technology is 1 year when considering the licence fee costs, we did not include anannual maintenance cost for pricing model 1.
Total cost per patient tested We assumed that the NHS trust would select the pricing model thatwould result in fewer costs according to the expected annual throughput. Pricing model 1 results ina lower cost per patient tested when annual throughput is greater than 10. The costs of CAAS vFFRbroken down by cost element are presented in Appendix 8, Table 69, for the base-case assumption of200 patients per year. The cost per patient tested with CAAS vFFR is £172.18.
Comparison of QAngio XA 3D/QFR and CAAS vFFR testing costsThe cost per patient tested with QAngio XA 3D/QFR and with CAAS vFFR varies with annual throughput,as shown in Appendix 8, Figure 47. The cost per patient tested with CAAS vFFR under pricing model 1 ismore sensitive to alternative throughput estimates than QAngio XA 3D/QFR, especially for throughputslower than 100 patients. The cost of QAngio XA 3D/QFR is robust to alternative throughput estimatesfor throughputs greater than 100 patients. This cost is also consistently higher than that of CAASvFFR for throughputs greater than 70 patients. Appendix 8, Figure 47, shows two curves for the cost perpatient tested with CAAS vFFR to illustrate the difference between assuming that training is deliveredover Webex and assuming it is delivered on site. The cost per patient tested with CAAS vFFR seemsconsistently similar for the two modes of training delivered; therefore, an average between the two modeswas used to estimate the cost per patient tested with CAAS vFFR.
Invasive coronary angiography and fractional flow reserveThe unit costs used to estimate the costs of catheterisation tests currently used in NHS clinicalpractice were sourced from NHS reference costs 2017/18138 and uprated to 2018/19 prices.137
The cost of ICA was calculated as the activity-weighted average of the Healthcare Resource Group(HRG) codes for simple catheterisation. However, the model did not consider a cost for ICA becauseall patients who enter the diagnostic model undergo this test. In line with the NICE scope, the unitcost for FFR/iFR, that is, £436.80, was estimated as the difference between the activity-weightedaverage of the HRG codes for complex (£2202.26; currency codes: EY42A–D) and standard cardiaccatheterisation (£1765.46; currency codes: EY43A–F). This difference represents the incremental costof FFR/iFR compared with ICA alone. The cost of iFR was not estimated separately, as it was assumedthat this cost was already captured in the complex cardiac catheterisation HRG codes.
Revascularisation costsPatients who test positive at the last step of each testing strategy undergo revascularisation with eitherPCI or CABG. The unit cost for these procedures was sourced from NHS reference costs 2017/18138
and uprated to 2018/19 prices.137 We estimated the activity-weighted average cost of (1) complex andstandard percutaneous transluminal coronary angioplasty and (2) complex major and standard CABGacross all HRGs to inform the unit cost of PCI and CABG, respectively. Costs applied in the model andthe NHS currency codes used to inform these are presented in Appendix 8, Table 70.
INDEPENDENT ECONOMIC ASSESSMENT: YORK MODEL
NIHR Journals Library www.journalslibrary.nihr.ac.uk
76
As the costs of PCI and CABG were estimated across all HRGs, their unit cost reflects the cost ofthe procedures across all settings under which the procedures are performed in the NHS (adjusted byactivity). We considered this to be the most appropriate assumption in the absence of clear evidenceon the proportion of procedures per setting for patients in our study population. However, patientswho are treated electively for stable angina do not usually require an overnight stay. Despite the NHStarget to have at least 75% of elective PCIs performed as a day case, recent audit data show that thereis extremely wide variation in day-case rates139 and that only 30.4% of PCI is performed as day cases.98
Some centres will perform PCI almost exclusively as a day case, whereas others will require patientsto stay overnight in hospital following the procedure. Given the considerable variation in the NHS interms of the need for overnight stays following PCI, we considered only the cost of PCI to correspondto that of a day-case admission in a scenario analysis.
In the base-case scenario, patients revascularised after their index testing were assumed to incur acost of £3005 and £10,899 if they underwent PCI and CABG, respectively. This resulted in a cost perrevascularisation of £4031.22, assuming that 87% of revascularisation procedures are PCI and 13% areCABG (see Complications due to revascularisation).
Procedural complications costsThe cost of procedural complications for FFR/iFR was calculated based on the rates of complicationsin Appendix 8, Table 71. Unit costs were sourced from NHS reference costs 2017/18138 and uprated to2018/19 prices.137 These costs are summarised in Appendix 8, Table 71, and range between £834.57for bronchospasm and £3005.07 for coronary dissection. Patients who die are assumed to incur noadditional costs.
Optimal medical treatment costsIt was assumed that all patients in the prognostic model are treated with OMT for stable angina. TheNICE existing guidance was reviewed to define OMT. The NICE Clinical Guideline on the managementof stable angina (i.e. CG126)140 recommends that patients with stable angina receive a beta-blocker ora calcium channel blocker in either monotherapy or combination therapy as the first line of treatment.The alternative to the first-line treatment for patients who cannot tolerate it is monotherapy witha long-acting nitrate or one of the novel anti-ischaemic drugs (ivabradine, nicorandil or ranolazine).The use of three anti-angina drugs is not recommended unless patients are not satisfactorily controlledwith two anti-angina drugs or are waiting for revascularisation or cannot undergo revascularisation.Drugs for secondary prevention of cardiovascular disease should also be considered for patientswith stable angina. These drugs include aspirin, angiotensin-converting enzyme (ACE) inhibitors, otherantihypertension drugs and statins. The guideline does not make specific recommendations regardingmedication for patients who have undergone PCI or CABG, but revascularised patients will still need toreceive anti-angina and secondary prevention drugs after the procedures. We have, thus, considered thatOMT comprises both anti-angina secondary prevention drugs. Given that revascularisation will resolve orreduce some of the angina symptomology, it is likely that the composition of OMT varies depending onwhether or not patients have received revascularisation and on the type of procedure received.
One of the models74 described in Results of the review of decision models evaluating invasive coronaryangiography assumed that the relative proportion of each drug class comprised by OMT would varydepending on the patient’s index treatment. We assumed the same, but sourced data on anti-anginamedication use where available from Nishi et al.,130 the same study from which we sourced estimatesof HRQoL (see Results of the review of decision models evaluating invasive coronary angiography). Nishiet al.130 reported anti-angina medication use at 1 year post diagnosis for patients treated with OMT inisolation (TN) or in addition to PCI (TP). This study also reported the use of these drugs for patientstreated with OMT in isolation despite requiring revascularisation (FN). As the study did not include
DOI: 10.3310/hta25560 Health Technology Assessment 2021 Vol. 25 No. 56
© Queen’s Printer and Controller of HMSO 2021. This work was produced by Duarte et al. under the terms of a commissioning contract issued by the Secretary of Statefor Health and Social Care. This issue may be freely reproduced for the purposes of private research and study and extracts (or indeed, the full report) may be included inprofessional journals provided that suitable acknowledgement is made and the reproduction is not associated with any form of advertising. Applications for commercialreproduction should be addressed to: NIHR Journals Library, National Institute for Health Research, Evaluation, Trials and Studies Coordinating Centre, Alpha House,University of Southampton Science Park, Southampton SO16 7NS, UK.
77
patients who had undergone CABG, data on the medication use for these groups (also TPs) were takenfrom the same source used in Genders et al.,74 namely the SYNTAX trial.59 As Nishi et al.130 did notreport the use of secondary prevention drugs, data on medication use for these drugs were taken fromthe SYNTAX trial59 and the COURAGE trial91 (also used in Genders et al.74).
The cost of medication was estimated by combining the proportion of medication use for each type oftreatment [OMT alone for patients who did not required revascularisation (TNs) and those who did(FNs), OMT for patients who underwent PCI (TPs) and CABG (TPs)], with unit costs from the BritishNational Formulary (BNF).141 Patients who underwent revascularisation without needing it (FPs) wereassumed to have the same medication use as the corresponding TP patients. The active substancesand dosages selected, as well as proportion of medication use, were validated by the clinical adviserto the EAG. Medication use and estimated costs per annum of OMT conditional on patient clinicalmanagement after diagnosis are summarised in Table 12. These costs are applied in the prognosticmodel at each annual cycle, and it was assumed that if the patient underwent revascularisation in themodel, the cost of OMT would then correspond to OMT in addition to revascularisation regardless ofthe patient classification at the start of the prognostic model (TN, FN, TP or FP).
Health state and clinical event costsThe costs associated with health state membership and clinical events in the prognostic model aresummarised in Appendix 8, Table 72.
It was assumed in the base-case analysis that only MI and unplanned revascularisation events wouldincur costs. This equates to assuming that all health-care resource use other than anti-angina andsecondary prevention medication use (see Optimal medical treatment costs) is the same across healthstates. The unit costs of MI and unplanned revascularisation events were sourced from the NHS referencecosts 2017/18138 and uprated to the 2018/19 price year.137 The cost of a MI was estimated as the activity-weighted average across all HRG codes for actual or suspected MI (EB10A–E). The cost of an unplannedrevascularisation (£4812.23) comprises the cost of PCI (activity-weighted average of EY40A–D andEY41A–D codes: £3923) and CABG (activity-weighted average of ED26A–C, ED27A–C and ED28A–Ccodes: £10,762) for non-elective long stays, and assumes that 87% of revascularisation performed is PCI(see Complications due to revascularisation).
Analytic methods
OverviewThe cost-effectiveness of the QAngio XA 3D/QFR and CAAS vFFR imaging software used during ICAfor assessing the functional significance of coronary obstructions in patients with intermediate stenosisis evaluated by comparing the total expected costs and QALYs with those obtained using pressure wireFFR/iFR measurement or visual interpretation of angiographic images alone.
Summarising cost-effectiveness using conventional incremental cost-effectiveness ratios (ICERs) requiresconsideration of which pairwise comparisons are appropriate when calculating incremental costs andeffects. With multiple strategies there are several different comparisons that could be made, eachresulting in different incremental QALYs, costs and ICERs. In this case, a fully incremental ICERcomparison is required to rule out any strategies based on the principles of dominance or extendeddominance. However, even with a fully incremental ICER comparison, strategies that are dominatedand would not be considered cost-effective may be ‘better’ than other non-dominated (but not cost-effective) strategies. The ICER comparison is also particularly sensitive to small differences betweenthe strategies (e.g. small changes to the denominator in terms of QALY differences may result in highlyvariable ICERs). For these reasons, the cost-effectiveness of the interventions is summarised in termsof net benefit, which applies a single unambiguous decision rule when there are multiple strategies; thecost-effective strategy is the one with the highest net benefit for a given cost-effectiveness threshold.
INDEPENDENT ECONOMIC ASSESSMENT: YORK MODEL
NIHR Journals Library www.journalslibrary.nihr.ac.uk
78
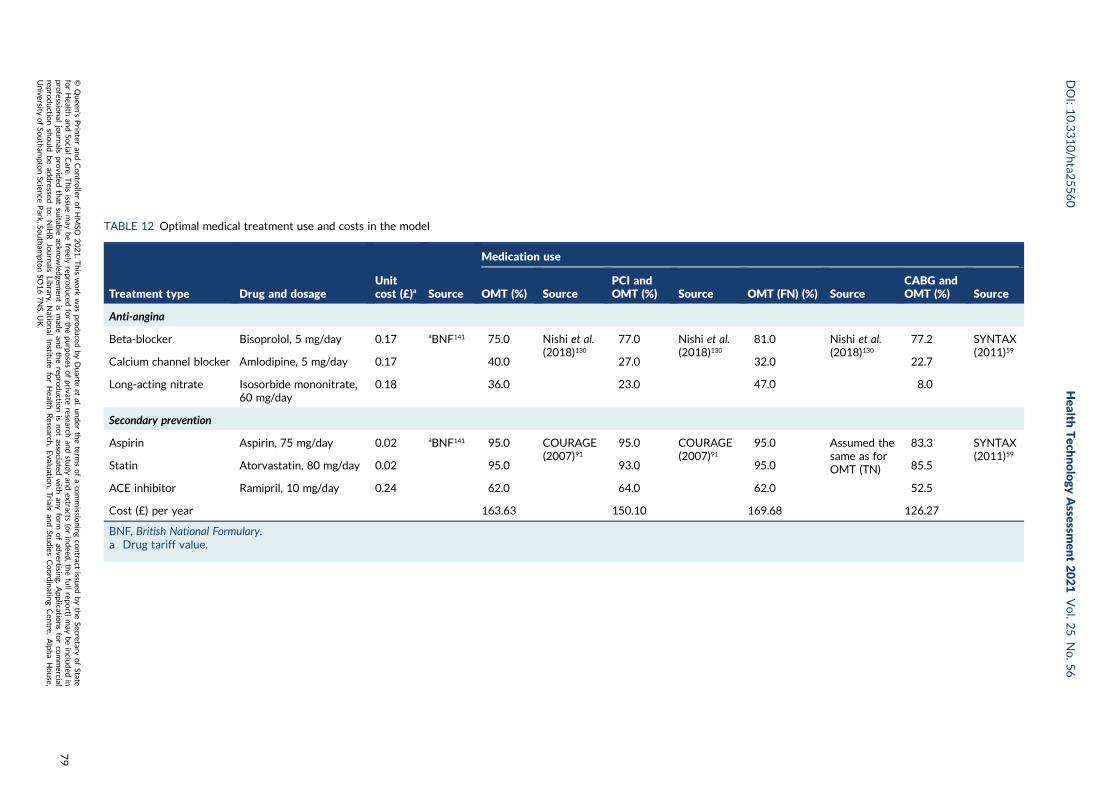
TABLE 12 Optimal medical treatment use and costs in the model
Treatment type Drug and dosageUnitcost (£)a Source
Medication use
OMT (%) SourcePCI andOMT (%) Source OMT (FN) (%) Source
CABG andOMT (%) Source
Anti-angina
Beta-blocker Bisoprolol, 5 mg/day 0.17 aBNF141 75.0 Nishi et al.(2018)130
77.0 Nishi et al.(2018)130
81.0 Nishi et al.(2018)130
77.2 SYNTAX(2011)59
Calcium channel blocker Amlodipine, 5 mg/day 0.17 40.0 27.0 32.0 22.7
Long-acting nitrate Isosorbide mononitrate,60 mg/day
0.18 36.0 23.0 47.0 8.0
Secondary prevention
Aspirin Aspirin, 75 mg/day 0.02 aBNF141 95.0 COURAGE(2007)91
95.0 COURAGE(2007)91
95.0 Assumed thesame as forOMT (TN)
83.3 SYNTAX(2011)59
Statin Atorvastatin, 80 mg/day 0.02 95.0 93.0 95.0 85.5
ACE inhibitor Ramipril, 10 mg/day 0.24 62.0 64.0 62.0 52.5
Cost (£) per year 163.63 150.10 169.68 126.27
BNF, British National Formulary.a Drug tariff value.
DOI:10.3310/hta2
5560
Health
Tech
nology
Assessm
ent2021
Vol.2
5No.5
6
©Queen
’sPrin
teran
dContro
llerofHMSO
2021.T
his
work
was
produced
byDuarte
etal.
under
theterm
sofaco
mmissio
ningco
ntract
issued
bytheSecretary
ofState
forHealth
andSo
cialCare.T
his
issuemay
befreely
reproduced
forthepu
rposes
ofprivate
researchan
dstu
dyan
dextracts
(orindeed
,thefullrepo
rt)may
beinclu
ded
inpro
fessional
journals
provid
edthat
suitab
leackn
owled
gemen
tis
mad
ean
dtherepro
ductio
nis
notasso
ciatedwith
anyform
ofad
vertising.
Applicatio
nsforco
mmercial
reproductio
nshould
bead
dressed
to:NIH
RJournals
Library,
Natio
nal
Institu
teforHealth
Research
,Evalu
ation,Trials
and
Studies
Coordinatin
gCen
tre,Alph
aHouse,
University
ofSo
utham
ptonScien
cePark,So
utham
ptonSO
167NS,U
K.
79
In this analysis, the net benefit is expressed in terms of net health benefit (NHB), estimated byrearranging the ICER equation into the following equation:
NHB =QALYs−Costs
Cost−effectiveness threshold. (1)
Strategies are ranked in terms of NHB from highest to lowest, which is used to identify the cost-effectivestrategy (highest NHB), but NHB is also used to interpret the next best choice (second highest NHB) andso on. A cost-effectiveness threshold of £20,000 per additional QALY is used in the analysis.
Uncertainty in the estimates of cost-effectiveness of the alternative strategies is reflected inprobabilistic analysis, and the probability that each strategy is more cost-effective than the othersat the cost-effectiveness threshold of £20,000 per QALY is presented for the base-case scenario.
Base-case analysisThe base-case parameters and associated assumptions are listed alongside their sources in Appendix 8,Table 73.
Scenario analysesAlternative assumptions to those of the base-case analysis are made in a number of scenarios analyses.The aim of these analyses is to assess the robustness of the base-case results to alternative assumptionsand sources of data used to parametrise the model.
Table 13 summarises the alternative scenarios analyses undertaken. The position in the base-caseanalysis and the alternative assumption applied is described for each element.
Model validationThe model was developed in Microsoft Excel by two analysts (AD and LS) and the programmingchecked by a third analyst (CR). As part of an overall quality assurance process, the internal validity ofthe model was assessed by extensively exploring logical consistency in the model results. A separateversion of the prognostic model was also independently programmed by the third analyst (CR) tosuccessfully replicate the base-case results.
Results of the independent economic assessment
Results of the base-case scenarioDeterministic and probabilistic cost-effectiveness results expressed in terms of NHB at a cost-effectiveness threshold of £20,000 per additional QALY for the base-case scenario are presented inTables 14 and 15, respectively. Strategy ranking from highest to lowest NHB is presented in bothtables. The incremental net health benefit (INHB) is calculated for each strategy relative to ICA alone.The probability that each strategy is cost-effective at a threshold of £20,000 per additional QALY ispresented in Table 15 for the probabilistic analysis. The results are consistent for both the deterministicand probabilistic analyses.
The strategy with the highest NHB is strategy 2 (ICA plus FFR) but the difference between all thestrategies is small. Strategy 2 is also the strategy with the highest probability of being cost-effective(27.8%). The least costly strategy is strategy 1 (ICA alone), which also has the lowest QALY gain,whereas the most costly strategy is strategy 5 (ICA plus vFFR) but this has the highest QALY gain.The INHB per patient diagnosed for each of the strategies relative to ICA alone is 0.027 QALYs(or equivalently £544) for ICA plus FFR; 0.020 QALYs (or equivalently £400) for ICA plus QFR;0.015 QALYs (or equivalently £298) for ICA plus QFR, followed by confirmatory FFR when QFR isinconclusive; and 0.016 QALYs (or equivalently £316) for ICA plus vFFR.
INDEPENDENT ECONOMIC ASSESSMENT: YORK MODEL
NIHR Journals Library www.journalslibrary.nihr.ac.uk
80
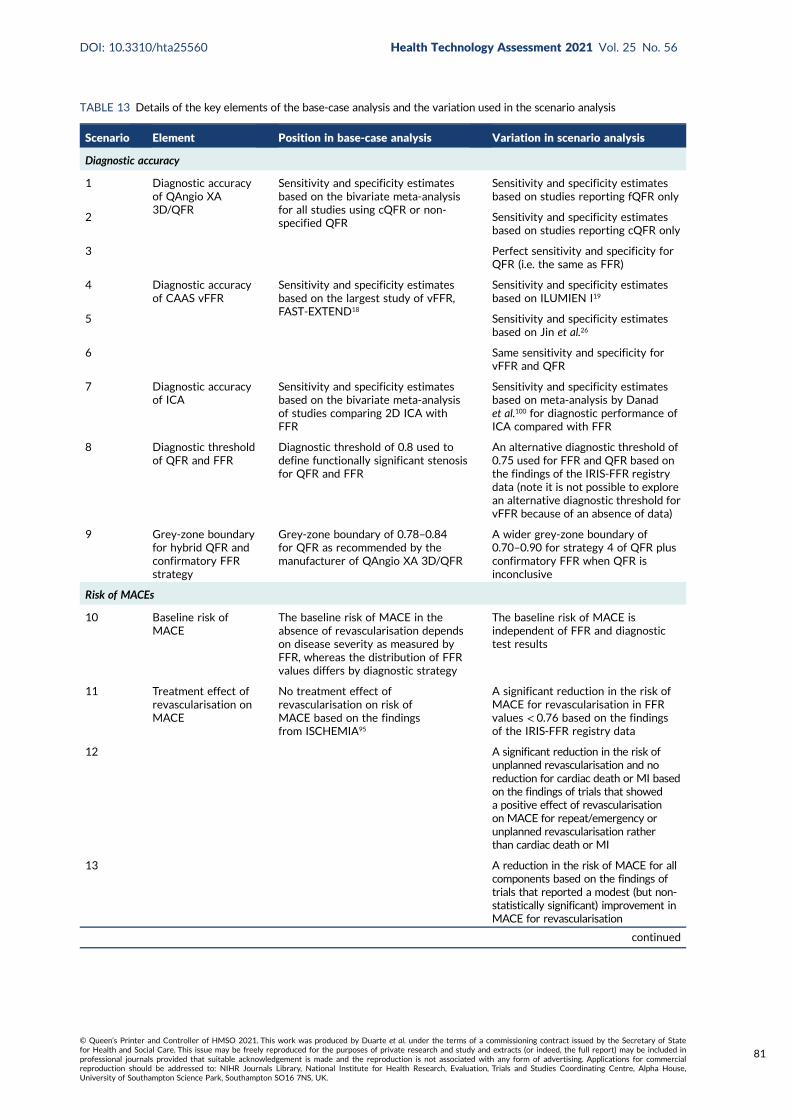
TABLE 13 Details of the key elements of the base-case analysis and the variation used in the scenario analysis
Scenario Element Position in base-case analysis Variation in scenario analysis
Diagnostic accuracy
1 Diagnostic accuracyof QAngio XA3D/QFR
Sensitivity and specificity estimatesbased on the bivariate meta-analysisfor all studies using cQFR or non-specified QFR
Sensitivity and specificity estimatesbased on studies reporting fQFR only
2 Sensitivity and specificity estimatesbased on studies reporting cQFR only
3 Perfect sensitivity and specificity forQFR (i.e. the same as FFR)
4 Diagnostic accuracyof CAAS vFFR
Sensitivity and specificity estimatesbased on the largest study of vFFR,FAST-EXTEND18
Sensitivity and specificity estimatesbased on ILUMIEN I19
5 Sensitivity and specificity estimatesbased on Jin et al.26
6 Same sensitivity and specificity forvFFR and QFR
7 Diagnostic accuracyof ICA
Sensitivity and specificity estimatesbased on the bivariate meta-analysisof studies comparing 2D ICA withFFR
Sensitivity and specificity estimatesbased on meta-analysis by Danadet al.100 for diagnostic performance ofICA compared with FFR
8 Diagnostic thresholdof QFR and FFR
Diagnostic threshold of 0.8 used todefine functionally significant stenosisfor QFR and FFR
An alternative diagnostic threshold of0.75 used for FFR and QFR based onthe findings of the IRIS-FFR registrydata (note it is not possible to explorean alternative diagnostic threshold forvFFR because of an absence of data)
9 Grey-zone boundaryfor hybrid QFR andconfirmatory FFRstrategy
Grey-zone boundary of 0.78–0.84for QFR as recommended by themanufacturer of QAngio XA 3D/QFR
A wider grey-zone boundary of0.70–0.90 for strategy 4 of QFR plusconfirmatory FFR when QFR isinconclusive
Risk of MACEs
10 Baseline risk ofMACE
The baseline risk of MACE in theabsence of revascularisation dependson disease severity as measured byFFR, whereas the distribution of FFRvalues differs by diagnostic strategy
The baseline risk of MACE isindependent of FFR and diagnostictest results
11 Treatment effect ofrevascularisation onMACE
No treatment effect ofrevascularisation on risk ofMACE based on the findingsfrom ISCHEMIA95
A significant reduction in the risk ofMACE for revascularisation in FFRvalues < 0.76 based on the findingsof the IRIS-FFR registry data
12 A significant reduction in the risk ofunplanned revascularisation and noreduction for cardiac death or MI basedon the findings of trials that showeda positive effect of revascularisationon MACE for repeat/emergency orunplanned revascularisation ratherthan cardiac death or MI
13 A reduction in the risk of MACE for allcomponents based on the findings oftrials that reported a modest (but non-statistically significant) improvement inMACE for revascularisation
continued
DOI: 10.3310/hta25560 Health Technology Assessment 2021 Vol. 25 No. 56
© Queen’s Printer and Controller of HMSO 2021. This work was produced by Duarte et al. under the terms of a commissioning contract issued by the Secretary of Statefor Health and Social Care. This issue may be freely reproduced for the purposes of private research and study and extracts (or indeed, the full report) may be included inprofessional journals provided that suitable acknowledgement is made and the reproduction is not associated with any form of advertising. Applications for commercialreproduction should be addressed to: NIHR Journals Library, National Institute for Health Research, Evaluation, Trials and Studies Coordinating Centre, Alpha House,University of Southampton Science Park, Southampton SO16 7NS, UK.
81
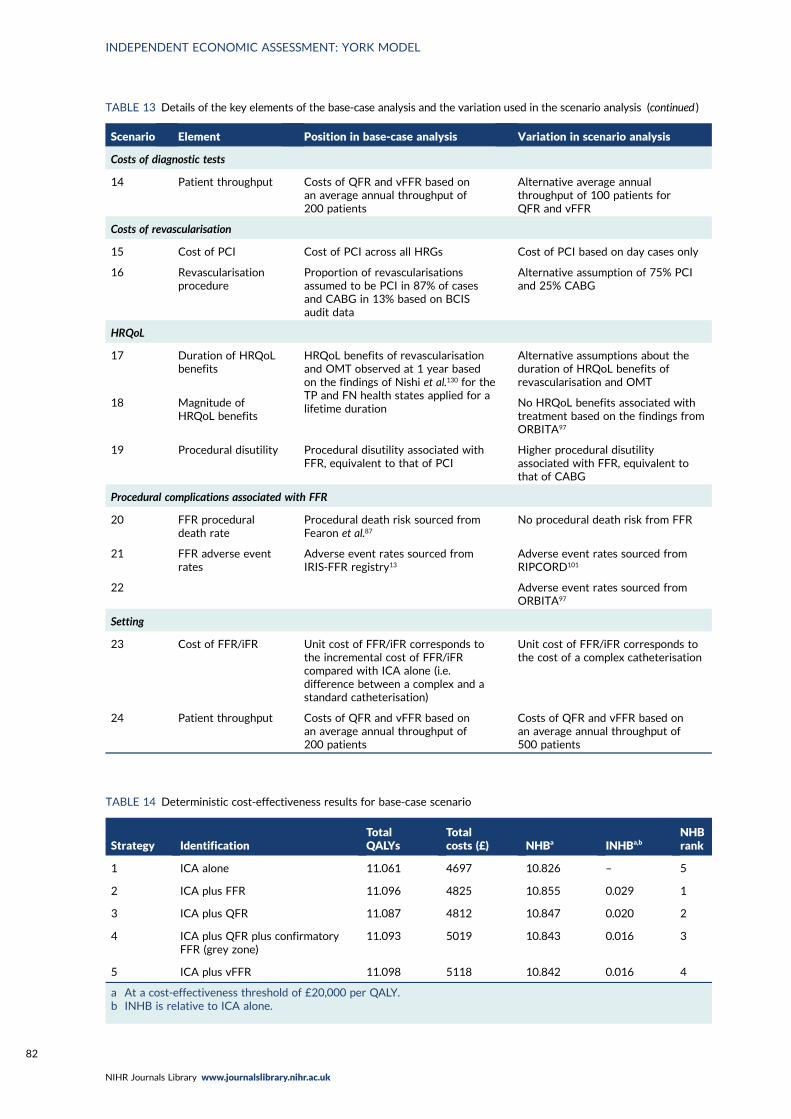
TABLE 13 Details of the key elements of the base-case analysis and the variation used in the scenario analysis (continued )
Scenario Element Position in base-case analysis Variation in scenario analysis
Costs of diagnostic tests
14 Patient throughput Costs of QFR and vFFR based onan average annual throughput of200 patients
Alternative average annualthroughput of 100 patients forQFR and vFFR
Costs of revascularisation
15 Cost of PCI Cost of PCI across all HRGs Cost of PCI based on day cases only
16 Revascularisationprocedure
Proportion of revascularisationsassumed to be PCI in 87% of casesand CABG in 13% based on BCISaudit data
Alternative assumption of 75% PCIand 25% CABG
HRQoL
17 Duration of HRQoLbenefits
HRQoL benefits of revascularisationand OMT observed at 1 year basedon the findings of Nishi et al.130 for theTP and FN health states applied for alifetime duration
Alternative assumptions about theduration of HRQoL benefits ofrevascularisation and OMT
18 Magnitude ofHRQoL benefits
No HRQoL benefits associated withtreatment based on the findings fromORBITA97
19 Procedural disutility Procedural disutility associated withFFR, equivalent to that of PCI
Higher procedural disutilityassociated with FFR, equivalent tothat of CABG
Procedural complications associated with FFR
20 FFR proceduraldeath rate
Procedural death risk sourced fromFearon et al.87
No procedural death risk from FFR
21 FFR adverse eventrates
Adverse event rates sourced fromIRIS-FFR registry13
Adverse event rates sourced fromRIPCORD101
22 Adverse event rates sourced fromORBITA97
Setting
23 Cost of FFR/iFR Unit cost of FFR/iFR corresponds tothe incremental cost of FFR/iFRcompared with ICA alone (i.e.difference between a complex and astandard catheterisation)
Unit cost of FFR/iFR corresponds tothe cost of a complex catheterisation
24 Patient throughput Costs of QFR and vFFR based onan average annual throughput of200 patients
Costs of QFR and vFFR based onan average annual throughput of500 patients
TABLE 14 Deterministic cost-effectiveness results for base-case scenario
Strategy IdentificationTotalQALYs
Totalcosts (£) NHBa INHBa,b
NHBrank
1 ICA alone 11.061 4697 10.826 – 5
2 ICA plus FFR 11.096 4825 10.855 0.029 1
3 ICA plus QFR 11.087 4812 10.847 0.020 2
4 ICA plus QFR plus confirmatoryFFR (grey zone)
11.093 5019 10.843 0.016 3
5 ICA plus vFFR 11.098 5118 10.842 0.016 4
a At a cost-effectiveness threshold of £20,000 per QALY.b INHB is relative to ICA alone.
INDEPENDENT ECONOMIC ASSESSMENT: YORK MODEL
NIHR Journals Library www.journalslibrary.nihr.ac.uk
82

To understand the difference in NHB between the alternative strategies, the disaggregated results fortotal expected costs and QALYs are informative. Table 16 shows the expected costs and QALYs foreach strategy from the diagnostic and prognostic components of the model separately. The diagnosticmodel includes the costs of the diagnostic tests, revascularisation, and costs associated with treatingadverse events related to FFR, and the prognostic model includes costs related to unplanned/repeatrevascularisation, MI events and long-term OMT use. The diagnostic model includes a proceduraldisutility associated with invasive FFR/iFR and revascularisation, and the prognostic model includesthe long-term symptom-free benefits of revascularisation, a disutility associated with unplanned/repeat revascularisation, MI events and history of MI, applied to a baseline utility for patients withintermediate stenosis. Note that costs, adverse events and disutility associated with invasive ICA areexcluded from the model because all strategies undergo ICA. The disaggregated costs and QALYs fromthe diagnostic component of the model are shown in Table 17, and the proportion of patients whoenter the long-term prognostic model in each of the TN, FN, TP and FP entry states for each of thealternative strategies (based on the diagnostic accuracy results) is shown in Table 18.
Certain strategies have among the highest diagnostic model costs, as they result in a greaterproportion of revascularisations. The percentage of revascularisation is dependent on the rate of TPand FP results. The PPV is highest for strategies involving QFR [strategies 3 (84.8%) and 4 (86.8%)],compared with vFFR (71.5%) or ICA alone (52.3%), whereas FFR is assumed to have perfect PPV. Thismeans that there are more unnecessary revascularisations for vFFR and ICA alone, than for QFR orFFR, which increases the costs of revascularisation for these tests. Some of the total diagnostic modelcost is offset by differences in costs of testing. The costs of the diagnostic tests are dependent on thelevel of patient throughput, and for the base-case scenario (throughput assumed to be 200) vFFR has
TABLE 15 Probabilistic cost-effectiveness results for base-case scenario
Strategy Identification Total QALYs Total costs (£) NHBa INHBa NHB rank
Probabilitycost-effective at£20,000/QALY
1 ICA alone 11.039 4696 10.804 – 5 0.100
2 ICA plus FFR 11.073 4825 10.831 0.027 1 0.278
3 ICA plus QFR 11.065 4813 10.824 0.020 2 0.218
4 ICA plus QFR plusconfirmatory FFR(grey zone)
11.070 5020 10.819 0.015 4 0.199
5 ICA plus vFFR 11.076 5119 10.820 0.016 3 0.204
a At a cost-effectiveness threshold of £20,000 per QALY. INHB is relative to ICA alone.
TABLE 16 Total expected costs and QALYs from the diagnostic and prognostic model by strategy
Strategy Identification
Model
Total model resultsDiagnostic Prognostic
Costs (£) QALYs Costs (£) QALYs Costs (£) QALYs
1 ICA alone 1940 –0.0044 2757 11.043 4696 11.039
2 ICA plus FFR 2059 –0.0093 2766 11.082 4825 11.073
3 ICA plus QFR 2044 –0.0037 2769 11.069 4813 11.065
4 ICA plus QFR plusconfirmatory FFR(grey zone)
2259 –0.0051 2761 11.075 5020 11.070
5 ICA plus vFFR 2373 –0.0050 2747 11.081 5119 11.076
DOI: 10.3310/hta25560 Health Technology Assessment 2021 Vol. 25 No. 56
© Queen’s Printer and Controller of HMSO 2021. This work was produced by Duarte et al. under the terms of a commissioning contract issued by the Secretary of Statefor Health and Social Care. This issue may be freely reproduced for the purposes of private research and study and extracts (or indeed, the full report) may be included inprofessional journals provided that suitable acknowledgement is made and the reproduction is not associated with any form of advertising. Applications for commercialreproduction should be addressed to: NIHR Journals Library, National Institute for Health Research, Evaluation, Trials and Studies Coordinating Centre, Alpha House,University of Southampton Science Park, Southampton SO16 7NS, UK.
83
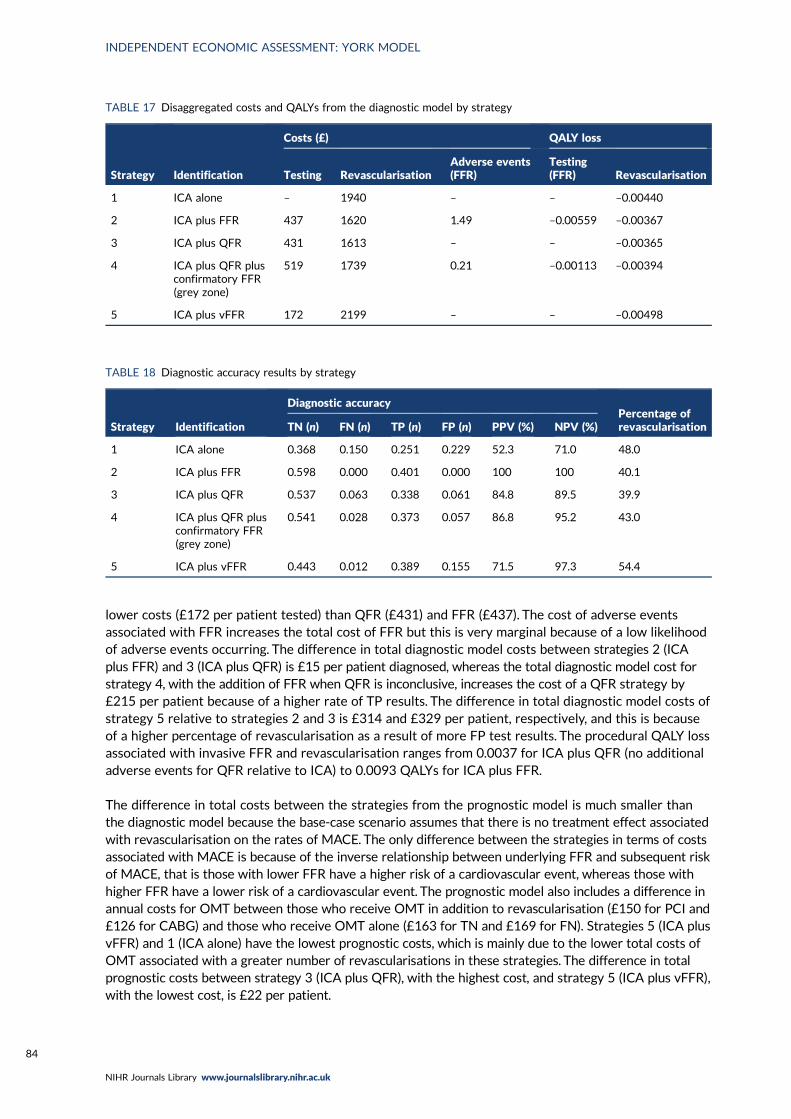
lower costs (£172 per patient tested) than QFR (£431) and FFR (£437). The cost of adverse eventsassociated with FFR increases the total cost of FFR but this is very marginal because of a low likelihoodof adverse events occurring. The difference in total diagnostic model costs between strategies 2 (ICAplus FFR) and 3 (ICA plus QFR) is £15 per patient diagnosed, whereas the total diagnostic model cost forstrategy 4, with the addition of FFR when QFR is inconclusive, increases the cost of a QFR strategy by£215 per patient because of a higher rate of TP results. The difference in total diagnostic model costs ofstrategy 5 relative to strategies 2 and 3 is £314 and £329 per patient, respectively, and this is becauseof a higher percentage of revascularisation as a result of more FP test results. The procedural QALY lossassociated with invasive FFR and revascularisation ranges from 0.0037 for ICA plus QFR (no additionaladverse events for QFR relative to ICA) to 0.0093 QALYs for ICA plus FFR.
The difference in total costs between the strategies from the prognostic model is much smaller thanthe diagnostic model because the base-case scenario assumes that there is no treatment effect associatedwith revascularisation on the rates of MACE. The only difference between the strategies in terms of costsassociated with MACE is because of the inverse relationship between underlying FFR and subsequent riskof MACE, that is those with lower FFR have a higher risk of a cardiovascular event, whereas those withhigher FFR have a lower risk of a cardiovascular event. The prognostic model also includes a difference inannual costs for OMT between those who receive OMT in addition to revascularisation (£150 for PCI and£126 for CABG) and those who receive OMT alone (£163 for TN and £169 for FN). Strategies 5 (ICA plusvFFR) and 1 (ICA alone) have the lowest prognostic costs, which is mainly due to the lower total costs ofOMT associated with a greater number of revascularisations in these strategies. The difference in totalprognostic costs between strategy 3 (ICA plus QFR), with the highest cost, and strategy 5 (ICA plus vFFR),with the lowest cost, is £22 per patient.
TABLE 17 Disaggregated costs and QALYs from the diagnostic model by strategy
Strategy Identification
Costs (£) QALY loss
Testing RevascularisationAdverse events(FFR)
Testing(FFR) Revascularisation
1 ICA alone – 1940 – – –0.00440
2 ICA plus FFR 437 1620 1.49 –0.00559 –0.00367
3 ICA plus QFR 431 1613 – – –0.00365
4 ICA plus QFR plusconfirmatory FFR(grey zone)
519 1739 0.21 –0.00113 –0.00394
5 ICA plus vFFR 172 2199 – – –0.00498
TABLE 18 Diagnostic accuracy results by strategy
Strategy Identification
Diagnostic accuracyPercentage ofrevascularisationTN (n) FN (n) TP (n) FP (n) PPV (%) NPV (%)
1 ICA alone 0.368 0.150 0.251 0.229 52.3 71.0 48.0
2 ICA plus FFR 0.598 0.000 0.401 0.000 100 100 40.1
3 ICA plus QFR 0.537 0.063 0.338 0.061 84.8 89.5 39.9
4 ICA plus QFR plusconfirmatory FFR(grey zone)
0.541 0.028 0.373 0.057 86.8 95.2 43.0
5 ICA plus vFFR 0.443 0.012 0.389 0.155 71.5 97.3 54.4
INDEPENDENT ECONOMIC ASSESSMENT: YORK MODEL
NIHR Journals Library www.journalslibrary.nihr.ac.uk
84
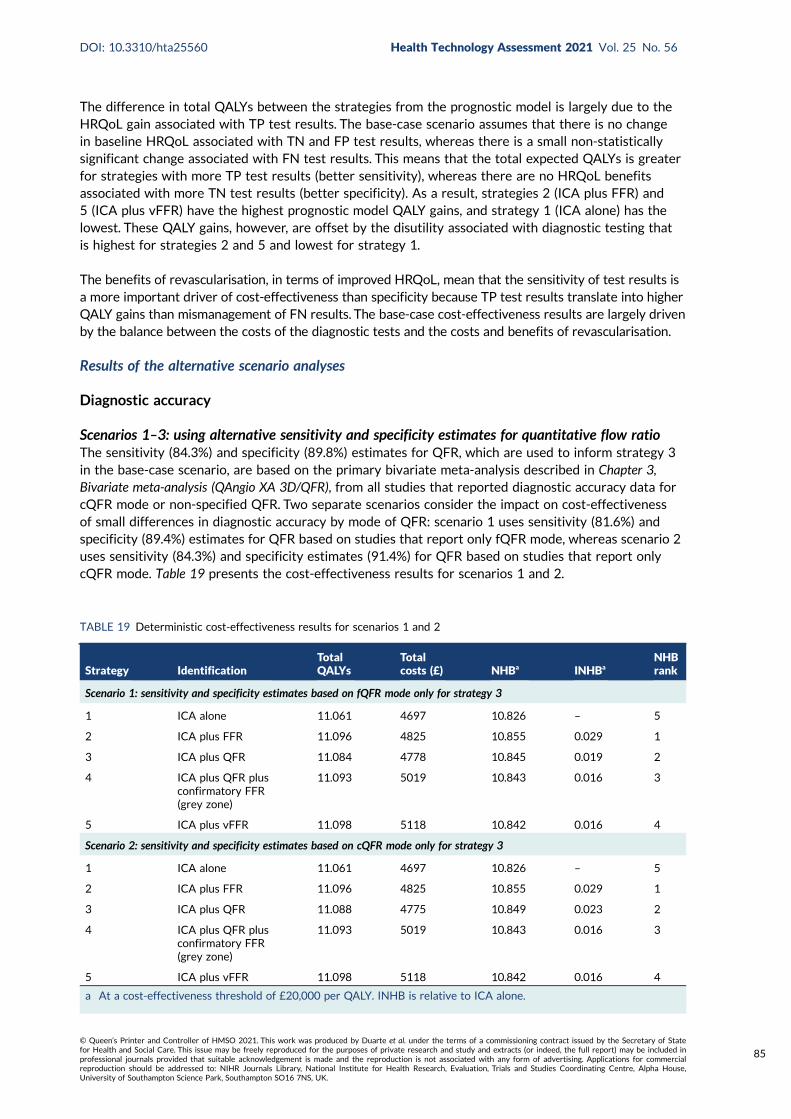
The difference in total QALYs between the strategies from the prognostic model is largely due to theHRQoL gain associated with TP test results. The base-case scenario assumes that there is no changein baseline HRQoL associated with TN and FP test results, whereas there is a small non-statisticallysignificant change associated with FN test results. This means that the total expected QALYs is greaterfor strategies with more TP test results (better sensitivity), whereas there are no HRQoL benefitsassociated with more TN test results (better specificity). As a result, strategies 2 (ICA plus FFR) and5 (ICA plus vFFR) have the highest prognostic model QALY gains, and strategy 1 (ICA alone) has thelowest. These QALY gains, however, are offset by the disutility associated with diagnostic testing thatis highest for strategies 2 and 5 and lowest for strategy 1.
The benefits of revascularisation, in terms of improved HRQoL, mean that the sensitivity of test results isa more important driver of cost-effectiveness than specificity because TP test results translate into higherQALY gains than mismanagement of FN results. The base-case cost-effectiveness results are largely drivenby the balance between the costs of the diagnostic tests and the costs and benefits of revascularisation.
Results of the alternative scenario analyses
Diagnostic accuracy
Scenarios 1–3: using alternative sensitivity and specificity estimates for quantitative flow ratioThe sensitivity (84.3%) and specificity (89.8%) estimates for QFR, which are used to inform strategy 3in the base-case scenario, are based on the primary bivariate meta-analysis described in Chapter 3,Bivariate meta-analysis (QAngio XA 3D/QFR), from all studies that reported diagnostic accuracy data forcQFR mode or non-specified QFR. Two separate scenarios consider the impact on cost-effectivenessof small differences in diagnostic accuracy by mode of QFR: scenario 1 uses sensitivity (81.6%) andspecificity (89.4%) estimates for QFR based on studies that report only fQFR mode, whereas scenario 2uses sensitivity (84.3%) and specificity estimates (91.4%) for QFR based on studies that report onlycQFR mode. Table 19 presents the cost-effectiveness results for scenarios 1 and 2.
TABLE 19 Deterministic cost-effectiveness results for scenarios 1 and 2
Strategy IdentificationTotalQALYs
Totalcosts (£) NHBa INHBa
NHBrank
Scenario 1: sensitivity and specificity estimates based on fQFR mode only for strategy 3
1 ICA alone 11.061 4697 10.826 – 5
2 ICA plus FFR 11.096 4825 10.855 0.029 1
3 ICA plus QFR 11.084 4778 10.845 0.019 2
4 ICA plus QFR plusconfirmatory FFR(grey zone)
11.093 5019 10.843 0.016 3
5 ICA plus vFFR 11.098 5118 10.842 0.016 4
Scenario 2: sensitivity and specificity estimates based on cQFR mode only for strategy 3
1 ICA alone 11.061 4697 10.826 – 5
2 ICA plus FFR 11.096 4825 10.855 0.029 1
3 ICA plus QFR 11.088 4775 10.849 0.023 2
4 ICA plus QFR plusconfirmatory FFR(grey zone)
11.093 5019 10.843 0.016 3
5 ICA plus vFFR 11.098 5118 10.842 0.016 4
a At a cost-effectiveness threshold of £20,000 per QALY. INHB is relative to ICA alone.
DOI: 10.3310/hta25560 Health Technology Assessment 2021 Vol. 25 No. 56
© Queen’s Printer and Controller of HMSO 2021. This work was produced by Duarte et al. under the terms of a commissioning contract issued by the Secretary of Statefor Health and Social Care. This issue may be freely reproduced for the purposes of private research and study and extracts (or indeed, the full report) may be included inprofessional journals provided that suitable acknowledgement is made and the reproduction is not associated with any form of advertising. Applications for commercialreproduction should be addressed to: NIHR Journals Library, National Institute for Health Research, Evaluation, Trials and Studies Coordinating Centre, Alpha House,University of Southampton Science Park, Southampton SO16 7NS, UK.
85
In scenario 1, there is a reduction in both the PPV (from 84.8% to 83.8%) and NPV (from 89.5% to87.9%) for strategy 3, ICA plus QFR, compared with the base-case scenario. This results in a marginallysmaller reduction in total QALYs (0.003 QALYs per patient) and a decrease in total costs (£34 perpatient) for strategy 3 compared with the base case, with no change in the overall ranking of NHB acrossstrategies. In scenario 2, there is an increase in both the PPV (from 84.8% to 86.8%) and NPV (from89.5% to 89.7%) for strategy 3 compared with the base case, due to more TN test results as a resultof better specificity. This results in a marginally small increase in total QALYs (0.001 QALYs per patient)and a decrease in total costs (£37 per patient) for strategy 3 compared with the base-case scenario. Thismeans that the sensitivity and specificity estimates used in scenario 2 are slightly more favourable forthe cost-effectiveness of QFR compared with scenario 1 or the base-case scenario; however, the morefavourable estimates do not result in a change in NHB ranking across the strategies.
To understand the trade-off in diagnostic test costs and adverse events associated with FFR/iFR(strategy 2) compared with QFR (strategy 3), scenario 3 considers the impact on cost-effectivenesswhen QFR and FFR are assumed to be a perfect test (i.e. 100% sensitivity and specificity and the sameunderlying distribution of FFR values are used as in the base case for strategy 2). The total numberof QALYs and costs for strategy 3 increase by 0.017 QALYs and £6 per patient from the base-casescenario, which is largely due to a small increase in the number of revascularisations (from 39.9%to 40.2%). With QFR assumed to be a perfect test, strategy 3 has a higher NHB than strategy 2(an increase of 0.008 QALYs per patient) and is ranked the most cost-effective strategy. The increasein NHB is largely due to greater total QALYs gained for strategy 3 compared with strategy 2, whereasthe difference in total costs between the strategies is small (£7 per patient). The difference in totalcosts is small because QFR and FFR have similar costs of diagnostic testing (£431 for QFR vs. £437for FFR/iFR), the number of revascularisations is the same under this scenario and the costs associatedwith treating adverse events of FFR/iFR are small (average of £1.49 per patient tested). The differencein total QALYs is due to the disutility associated with FFR/iFR and an increased risk of proceduralmortality for FFR/iFR.
Scenarios 4–6: using alternative sensitivity and specificity estimates for vFFRThe sensitivity (97.0%) and specificity (74.0%) estimates for vFFR, which are used to inform strategy 5in the base-case scenario, are based on the largest (303 patients) study of vFFR. As noted in Chapter 3,CAAS vFFR, there are only three independent studies of CAAS vFFR, one of which was published onlyas a conference abstract.26 As reported in Chapter 3, Bivariate meta-analysis (CAAS vs. vFFR), thebivariate meta-analysis of CAAS vFFR studies should be interpreted with caution owing to limiteddata and high heterogeneity across studies. Therefore, this meta-analysis was not used to informthe economic model. Two scenarios consider the impact on cost-effectiveness of different diagnosticaccuracy estimates for vFFR based on the two studies not included in the base-case scenario: scenario4 uses sensitivity (75%) and specificity (46.5%) estimates for vFFR based on the ILUMIEN I study,19 andscenario 5 uses sensitivity (68.2%) and specificity (87.3%) estimates for vFFR based on the Jin et al.26
conference abstract. Table 20 presents the cost-effectiveness results for scenarios 4 and 5.
In scenario 4, there is decrease in both the PPV (from 71.5% to 48.5%) and NPV (from 97.3% to73.5%) for strategy 5 compared with the base-case scenario. This results in a substantial decrease intotal QALYs (0.033 QALYs per patient) and an increase in total costs (£294 per patient) for strategy 5compared with the base case. Strategy 5 is now ranked the least cost-effective strategy (lowest interms of NHB), with lower NHB than in strategy 1 of ICA alone (a reduction of 0.031 QALYs perpatient, equivalent to £620 per patient diagnosed at a cost-effectiveness threshold of £20,000 perQALY). In scenario 5, there is an increase in the PPV (from 71.5% to 78.3%) but a decrease in theNPV (from 97.3% to 80.3%) for strategy 5 owing to lower sensitivity and better specificity than thebase-case scenario. This results in a substantial decrease in both total QALYs (0.030 QALYs per patient)and total costs (£758 per patient) for strategy 5 compared with the base-case scenario. Strategy 5,ICA plus vFFR, now appears a more cost-effective strategy than strategies 3 and 4 based on QFRand is ranked second in terms of NHB, with FFR remaining the strategy with the highest NHB.
INDEPENDENT ECONOMIC ASSESSMENT: YORK MODEL
NIHR Journals Library www.journalslibrary.nihr.ac.uk
86
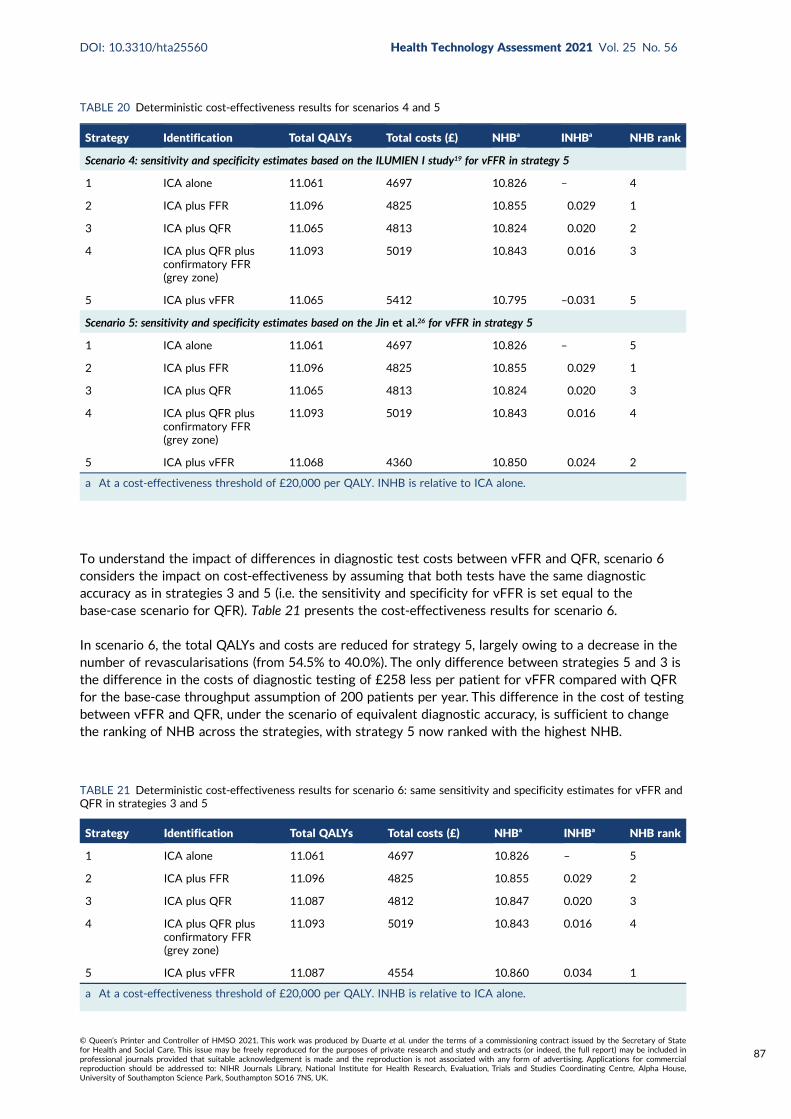
To understand the impact of differences in diagnostic test costs between vFFR and QFR, scenario 6considers the impact on cost-effectiveness by assuming that both tests have the same diagnosticaccuracy as in strategies 3 and 5 (i.e. the sensitivity and specificity for vFFR is set equal to thebase-case scenario for QFR). Table 21 presents the cost-effectiveness results for scenario 6.
In scenario 6, the total QALYs and costs are reduced for strategy 5, largely owing to a decrease in thenumber of revascularisations (from 54.5% to 40.0%). The only difference between strategies 5 and 3 isthe difference in the costs of diagnostic testing of £258 less per patient for vFFR compared with QFRfor the base-case throughput assumption of 200 patients per year. This difference in the cost of testingbetween vFFR and QFR, under the scenario of equivalent diagnostic accuracy, is sufficient to changethe ranking of NHB across the strategies, with strategy 5 now ranked with the highest NHB.
TABLE 20 Deterministic cost-effectiveness results for scenarios 4 and 5
Strategy Identification Total QALYs Total costs (£) NHBa INHBa NHB rank
Scenario 4: sensitivity and specificity estimates based on the ILUMIEN I study19 for vFFR in strategy 5
1 ICA alone 11.061 4697 10.826 – 4
2 ICA plus FFR 11.096 4825 10.855 0.029 1
3 ICA plus QFR 11.065 4813 10.824 0.020 2
4 ICA plus QFR plusconfirmatory FFR(grey zone)
11.093 5019 10.843 0.016 3
5 ICA plus vFFR 11.065 5412 10.795 –0.031 5
Scenario 5: sensitivity and specificity estimates based on the Jin et al.26 for vFFR in strategy 5
1 ICA alone 11.061 4697 10.826 – 5
2 ICA plus FFR 11.096 4825 10.855 0.029 1
3 ICA plus QFR 11.065 4813 10.824 0.020 3
4 ICA plus QFR plusconfirmatory FFR(grey zone)
11.093 5019 10.843 0.016 4
5 ICA plus vFFR 11.068 4360 10.850 0.024 2
a At a cost-effectiveness threshold of £20,000 per QALY. INHB is relative to ICA alone.
TABLE 21 Deterministic cost-effectiveness results for scenario 6: same sensitivity and specificity estimates for vFFR andQFR in strategies 3 and 5
Strategy Identification Total QALYs Total costs (£) NHBa INHBa NHB rank
1 ICA alone 11.061 4697 10.826 – 5
2 ICA plus FFR 11.096 4825 10.855 0.029 2
3 ICA plus QFR 11.087 4812 10.847 0.020 3
4 ICA plus QFR plusconfirmatory FFR(grey zone)
11.093 5019 10.843 0.016 4
5 ICA plus vFFR 11.087 4554 10.860 0.034 1
a At a cost-effectiveness threshold of £20,000 per QALY. INHB is relative to ICA alone.
DOI: 10.3310/hta25560 Health Technology Assessment 2021 Vol. 25 No. 56
© Queen’s Printer and Controller of HMSO 2021. This work was produced by Duarte et al. under the terms of a commissioning contract issued by the Secretary of Statefor Health and Social Care. This issue may be freely reproduced for the purposes of private research and study and extracts (or indeed, the full report) may be included inprofessional journals provided that suitable acknowledgement is made and the reproduction is not associated with any form of advertising. Applications for commercialreproduction should be addressed to: NIHR Journals Library, National Institute for Health Research, Evaluation, Trials and Studies Coordinating Centre, Alpha House,University of Southampton Science Park, Southampton SO16 7NS, UK.
87
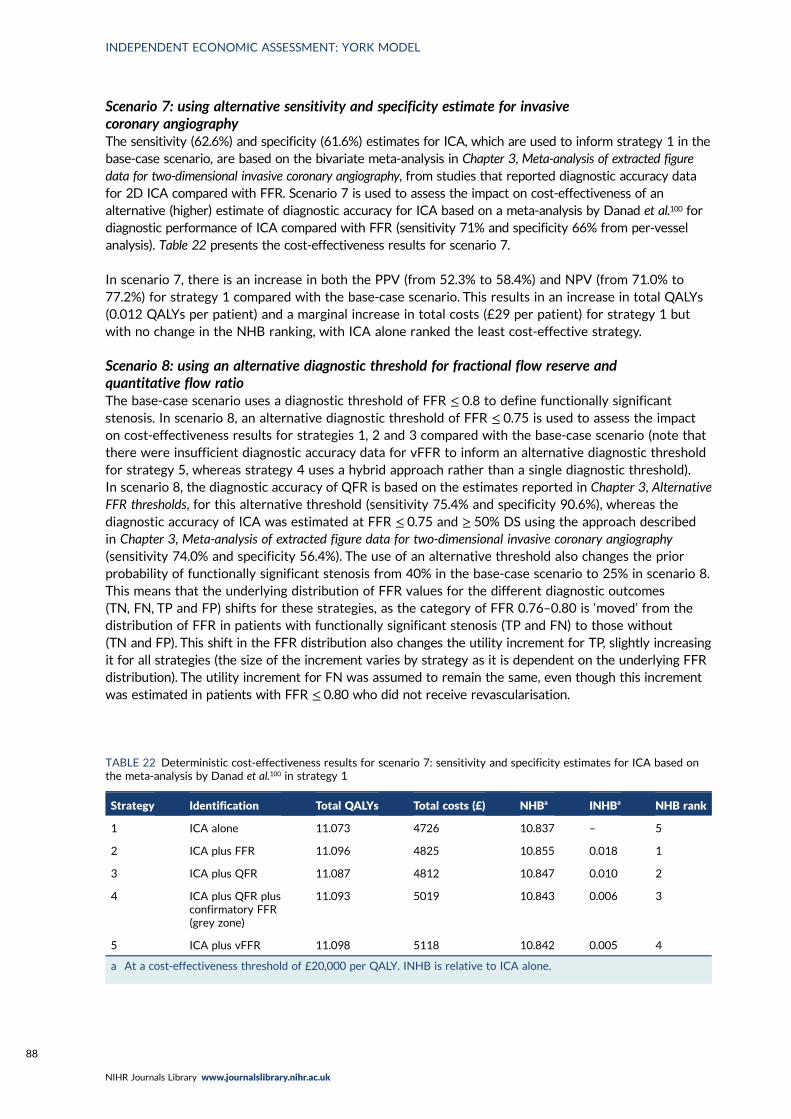
Scenario 7: using alternative sensitivity and specificity estimate for invasivecoronary angiographyThe sensitivity (62.6%) and specificity (61.6%) estimates for ICA, which are used to inform strategy 1 in thebase-case scenario, are based on the bivariate meta-analysis in Chapter 3, Meta-analysis of extracted figuredata for two-dimensional invasive coronary angiography, from studies that reported diagnostic accuracy datafor 2D ICA compared with FFR. Scenario 7 is used to assess the impact on cost-effectiveness of analternative (higher) estimate of diagnostic accuracy for ICA based on a meta-analysis by Danad et al.100 fordiagnostic performance of ICA compared with FFR (sensitivity 71% and specificity 66% from per-vesselanalysis). Table 22 presents the cost-effectiveness results for scenario 7.
In scenario 7, there is an increase in both the PPV (from 52.3% to 58.4%) and NPV (from 71.0% to77.2%) for strategy 1 compared with the base-case scenario. This results in an increase in total QALYs(0.012 QALYs per patient) and a marginal increase in total costs (£29 per patient) for strategy 1 butwith no change in the NHB ranking, with ICA alone ranked the least cost-effective strategy.
Scenario 8: using an alternative diagnostic threshold for fractional flow reserve andquantitative flow ratioThe base-case scenario uses a diagnostic threshold of FFR ≤ 0.8 to define functionally significantstenosis. In scenario 8, an alternative diagnostic threshold of FFR ≤ 0.75 is used to assess the impacton cost-effectiveness results for strategies 1, 2 and 3 compared with the base-case scenario (note thatthere were insufficient diagnostic accuracy data for vFFR to inform an alternative diagnostic thresholdfor strategy 5, whereas strategy 4 uses a hybrid approach rather than a single diagnostic threshold).In scenario 8, the diagnostic accuracy of QFR is based on the estimates reported in Chapter 3, AlternativeFFR thresholds, for this alternative threshold (sensitivity 75.4% and specificity 90.6%), whereas thediagnostic accuracy of ICA was estimated at FFR ≤ 0.75 and ≥ 50% DS using the approach describedin Chapter 3, Meta-analysis of extracted figure data for two-dimensional invasive coronary angiography(sensitivity 74.0% and specificity 56.4%). The use of an alternative threshold also changes the priorprobability of functionally significant stenosis from 40% in the base-case scenario to 25% in scenario 8.This means that the underlying distribution of FFR values for the different diagnostic outcomes(TN, FN, TP and FP) shifts for these strategies, as the category of FFR 0.76–0.80 is ‘moved’ from thedistribution of FFR in patients with functionally significant stenosis (TP and FN) to those without(TN and FP). This shift in the FFR distribution also changes the utility increment for TP, slightly increasingit for all strategies (the size of the increment varies by strategy as it is dependent on the underlying FFRdistribution). The utility increment for FN was assumed to remain the same, even though this incrementwas estimated in patients with FFR ≤ 0.80 who did not receive revascularisation.
TABLE 22 Deterministic cost-effectiveness results for scenario 7: sensitivity and specificity estimates for ICA based onthe meta-analysis by Danad et al.100 in strategy 1
Strategy Identification Total QALYs Total costs (£) NHBa INHBa NHB rank
1 ICA alone 11.073 4726 10.837 – 5
2 ICA plus FFR 11.096 4825 10.855 0.018 1
3 ICA plus QFR 11.087 4812 10.847 0.010 2
4 ICA plus QFR plusconfirmatory FFR(grey zone)
11.093 5019 10.843 0.006 3
5 ICA plus vFFR 11.098 5118 10.842 0.005 4
a At a cost-effectiveness threshold of £20,000 per QALY. INHB is relative to ICA alone.
INDEPENDENT ECONOMIC ASSESSMENT: YORK MODEL
NIHR Journals Library www.journalslibrary.nihr.ac.uk
88
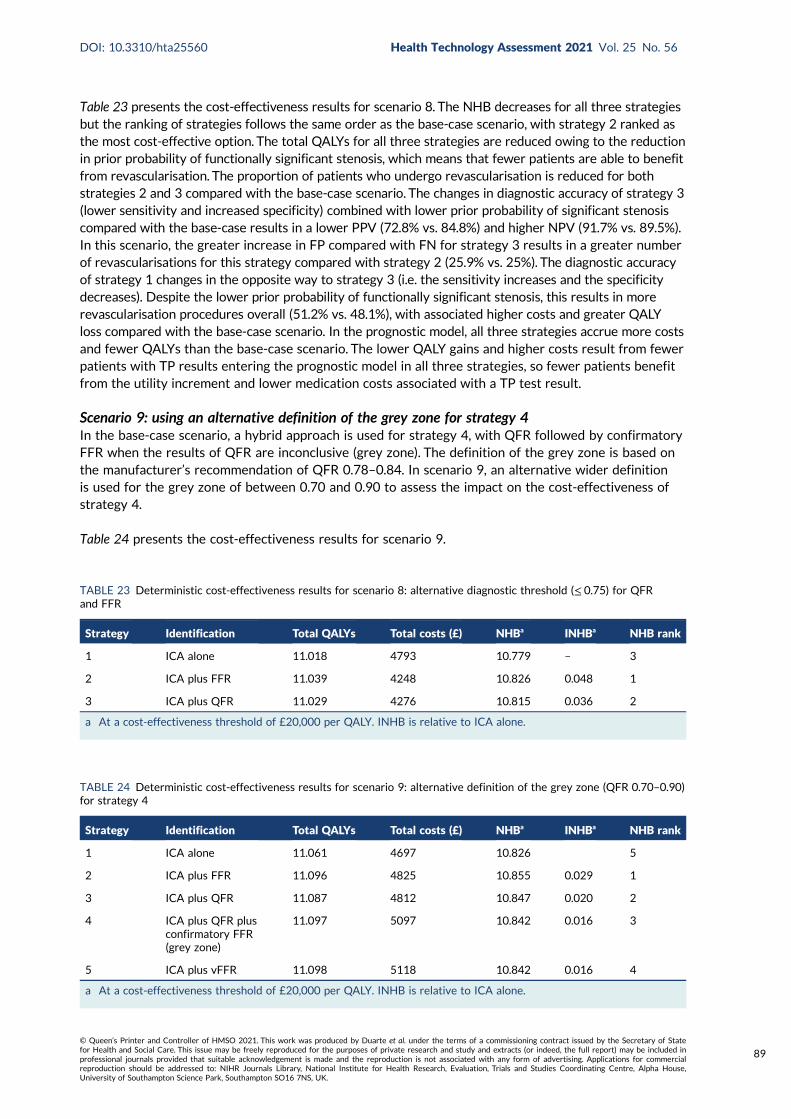
Table 23 presents the cost-effectiveness results for scenario 8. The NHB decreases for all three strategiesbut the ranking of strategies follows the same order as the base-case scenario, with strategy 2 ranked asthe most cost-effective option. The total QALYs for all three strategies are reduced owing to the reductionin prior probability of functionally significant stenosis, which means that fewer patients are able to benefitfrom revascularisation. The proportion of patients who undergo revascularisation is reduced for bothstrategies 2 and 3 compared with the base-case scenario. The changes in diagnostic accuracy of strategy 3(lower sensitivity and increased specificity) combined with lower prior probability of significant stenosiscompared with the base-case results in a lower PPV (72.8% vs. 84.8%) and higher NPV (91.7% vs. 89.5%).In this scenario, the greater increase in FP compared with FN for strategy 3 results in a greater numberof revascularisations for this strategy compared with strategy 2 (25.9% vs. 25%). The diagnostic accuracyof strategy 1 changes in the opposite way to strategy 3 (i.e. the sensitivity increases and the specificitydecreases). Despite the lower prior probability of functionally significant stenosis, this results in morerevascularisation procedures overall (51.2% vs. 48.1%), with associated higher costs and greater QALYloss compared with the base-case scenario. In the prognostic model, all three strategies accrue more costsand fewer QALYs than the base-case scenario. The lower QALY gains and higher costs result from fewerpatients with TP results entering the prognostic model in all three strategies, so fewer patients benefitfrom the utility increment and lower medication costs associated with a TP test result.
Scenario 9: using an alternative definition of the grey zone for strategy 4In the base-case scenario, a hybrid approach is used for strategy 4, with QFR followed by confirmatoryFFR when the results of QFR are inconclusive (grey zone). The definition of the grey zone is based onthe manufacturer’s recommendation of QFR 0.78–0.84. In scenario 9, an alternative wider definitionis used for the grey zone of between 0.70 and 0.90 to assess the impact on the cost-effectiveness ofstrategy 4.
Table 24 presents the cost-effectiveness results for scenario 9.
TABLE 23 Deterministic cost-effectiveness results for scenario 8: alternative diagnostic threshold (≤ 0.75) for QFRand FFR
Strategy Identification Total QALYs Total costs (£) NHBa INHBa NHB rank
1 ICA alone 11.018 4793 10.779 – 3
2 ICA plus FFR 11.039 4248 10.826 0.048 1
3 ICA plus QFR 11.029 4276 10.815 0.036 2
a At a cost-effectiveness threshold of £20,000 per QALY. INHB is relative to ICA alone.
TABLE 24 Deterministic cost-effectiveness results for scenario 9: alternative definition of the grey zone (QFR 0.70–0.90)for strategy 4
Strategy Identification Total QALYs Total costs (£) NHBa INHBa NHB rank
1 ICA alone 11.061 4697 10.826 5
2 ICA plus FFR 11.096 4825 10.855 0.029 1
3 ICA plus QFR 11.087 4812 10.847 0.020 2
4 ICA plus QFR plusconfirmatory FFR(grey zone)
11.097 5097 10.842 0.016 3
5 ICA plus vFFR 11.098 5118 10.842 0.016 4
a At a cost-effectiveness threshold of £20,000 per QALY. INHB is relative to ICA alone.
DOI: 10.3310/hta25560 Health Technology Assessment 2021 Vol. 25 No. 56
© Queen’s Printer and Controller of HMSO 2021. This work was produced by Duarte et al. under the terms of a commissioning contract issued by the Secretary of Statefor Health and Social Care. This issue may be freely reproduced for the purposes of private research and study and extracts (or indeed, the full report) may be included inprofessional journals provided that suitable acknowledgement is made and the reproduction is not associated with any form of advertising. Applications for commercialreproduction should be addressed to: NIHR Journals Library, National Institute for Health Research, Evaluation, Trials and Studies Coordinating Centre, Alpha House,University of Southampton Science Park, Southampton SO16 7NS, UK.
89
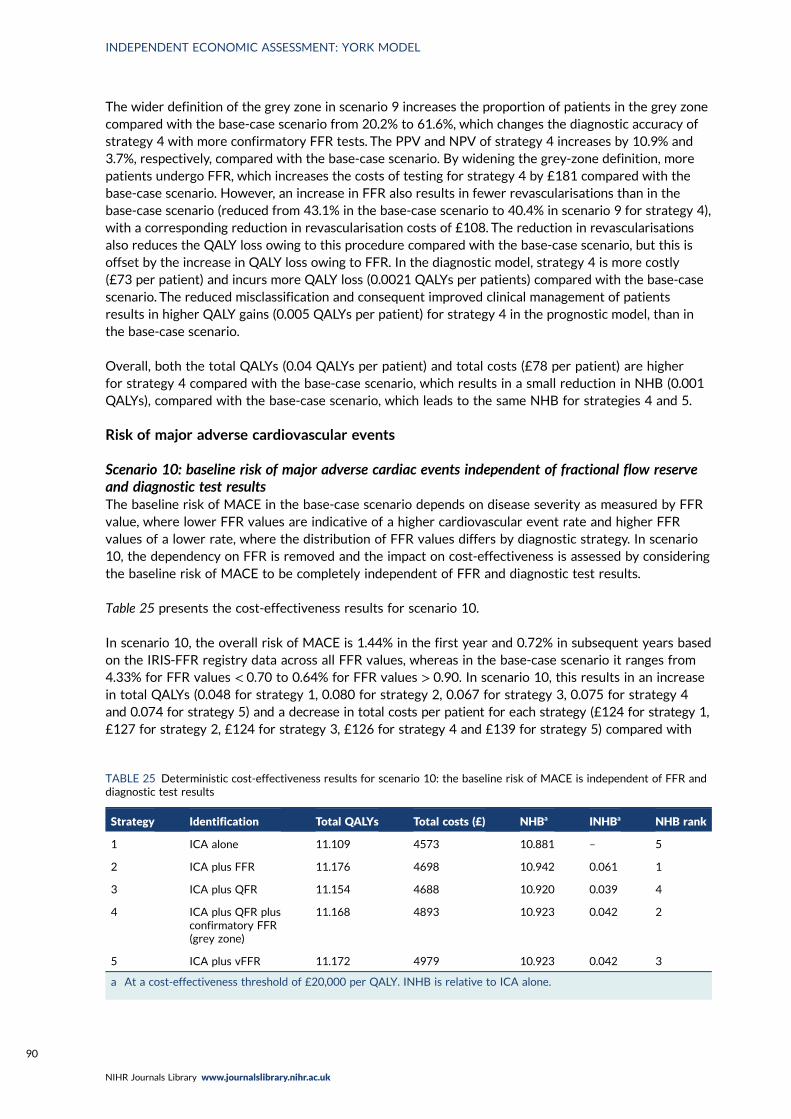
The wider definition of the grey zone in scenario 9 increases the proportion of patients in the grey zonecompared with the base-case scenario from 20.2% to 61.6%, which changes the diagnostic accuracy ofstrategy 4 with more confirmatory FFR tests. The PPV and NPV of strategy 4 increases by 10.9% and3.7%, respectively, compared with the base-case scenario. By widening the grey-zone definition, morepatients undergo FFR, which increases the costs of testing for strategy 4 by £181 compared with thebase-case scenario. However, an increase in FFR also results in fewer revascularisations than in thebase-case scenario (reduced from 43.1% in the base-case scenario to 40.4% in scenario 9 for strategy 4),with a corresponding reduction in revascularisation costs of £108. The reduction in revascularisationsalso reduces the QALY loss owing to this procedure compared with the base-case scenario, but this isoffset by the increase in QALY loss owing to FFR. In the diagnostic model, strategy 4 is more costly(£73 per patient) and incurs more QALY loss (0.0021 QALYs per patients) compared with the base-casescenario. The reduced misclassification and consequent improved clinical management of patientsresults in higher QALY gains (0.005 QALYs per patient) for strategy 4 in the prognostic model, than inthe base-case scenario.
Overall, both the total QALYs (0.04 QALYs per patient) and total costs (£78 per patient) are higherfor strategy 4 compared with the base-case scenario, which results in a small reduction in NHB (0.001QALYs), compared with the base-case scenario, which leads to the same NHB for strategies 4 and 5.
Risk of major adverse cardiovascular events
Scenario 10: baseline risk of major adverse cardiac events independent of fractional flow reserveand diagnostic test resultsThe baseline risk of MACE in the base-case scenario depends on disease severity as measured by FFRvalue, where lower FFR values are indicative of a higher cardiovascular event rate and higher FFRvalues of a lower rate, where the distribution of FFR values differs by diagnostic strategy. In scenario10, the dependency on FFR is removed and the impact on cost-effectiveness is assessed by consideringthe baseline risk of MACE to be completely independent of FFR and diagnostic test results.
Table 25 presents the cost-effectiveness results for scenario 10.
In scenario 10, the overall risk of MACE is 1.44% in the first year and 0.72% in subsequent years basedon the IRIS-FFR registry data across all FFR values, whereas in the base-case scenario it ranges from4.33% for FFR values < 0.70 to 0.64% for FFR values > 0.90. In scenario 10, this results in an increasein total QALYs (0.048 for strategy 1, 0.080 for strategy 2, 0.067 for strategy 3, 0.075 for strategy 4and 0.074 for strategy 5) and a decrease in total costs per patient for each strategy (£124 for strategy 1,£127 for strategy 2, £124 for strategy 3, £126 for strategy 4 and £139 for strategy 5) compared with
TABLE 25 Deterministic cost-effectiveness results for scenario 10: the baseline risk of MACE is independent of FFR anddiagnostic test results
Strategy Identification Total QALYs Total costs (£) NHBa INHBa NHB rank
1 ICA alone 11.109 4573 10.881 – 5
2 ICA plus FFR 11.176 4698 10.942 0.061 1
3 ICA plus QFR 11.154 4688 10.920 0.039 4
4 ICA plus QFR plusconfirmatory FFR(grey zone)
11.168 4893 10.923 0.042 2
5 ICA plus vFFR 11.172 4979 10.923 0.042 3
a At a cost-effectiveness threshold of £20,000 per QALY. INHB is relative to ICA alone.
INDEPENDENT ECONOMIC ASSESSMENT: YORK MODEL
NIHR Journals Library www.journalslibrary.nihr.ac.uk
90
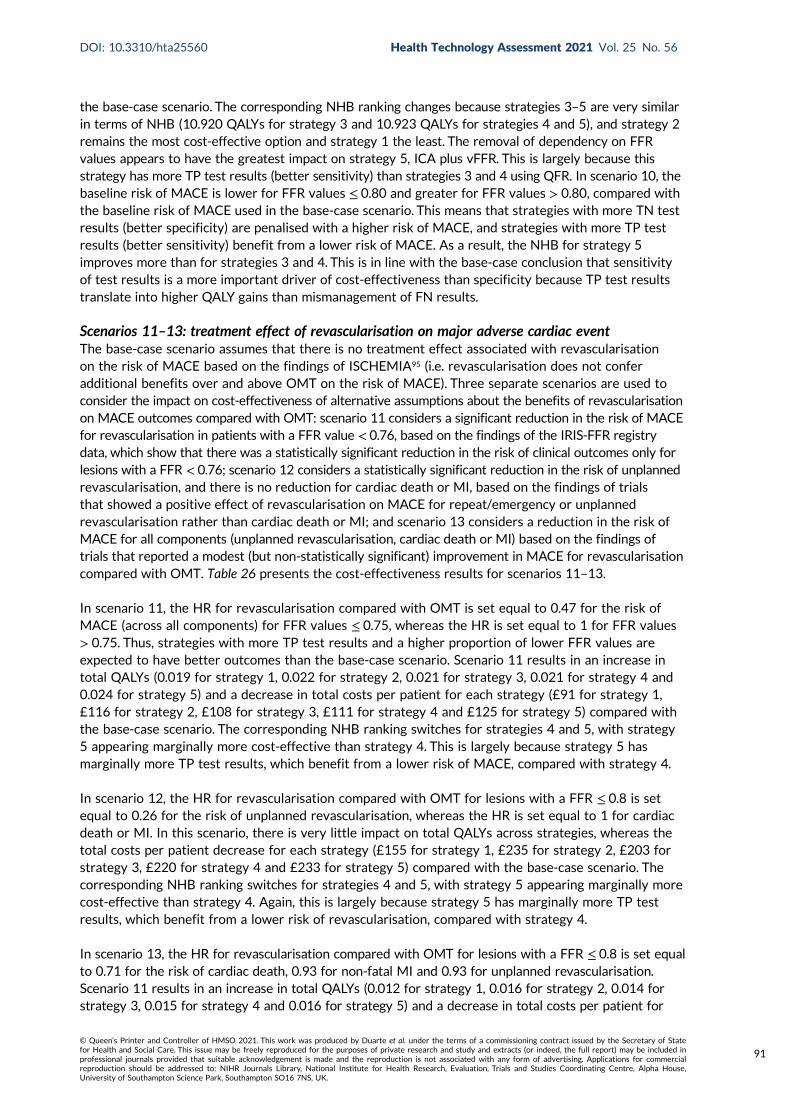
the base-case scenario. The corresponding NHB ranking changes because strategies 3–5 are very similarin terms of NHB (10.920 QALYs for strategy 3 and 10.923 QALYs for strategies 4 and 5), and strategy 2remains the most cost-effective option and strategy 1 the least. The removal of dependency on FFRvalues appears to have the greatest impact on strategy 5, ICA plus vFFR. This is largely because thisstrategy has more TP test results (better sensitivity) than strategies 3 and 4 using QFR. In scenario 10, thebaseline risk of MACE is lower for FFR values ≤ 0.80 and greater for FFR values > 0.80, compared withthe baseline risk of MACE used in the base-case scenario. This means that strategies with more TN testresults (better specificity) are penalised with a higher risk of MACE, and strategies with more TP testresults (better sensitivity) benefit from a lower risk of MACE. As a result, the NHB for strategy 5improves more than for strategies 3 and 4. This is in line with the base-case conclusion that sensitivityof test results is a more important driver of cost-effectiveness than specificity because TP test resultstranslate into higher QALY gains than mismanagement of FN results.
Scenarios 11–13: treatment effect of revascularisation on major adverse cardiac eventThe base-case scenario assumes that there is no treatment effect associated with revascularisationon the risk of MACE based on the findings of ISCHEMIA95 (i.e. revascularisation does not conferadditional benefits over and above OMT on the risk of MACE). Three separate scenarios are used toconsider the impact on cost-effectiveness of alternative assumptions about the benefits of revascularisationon MACE outcomes compared with OMT: scenario 11 considers a significant reduction in the risk of MACEfor revascularisation in patients with a FFR value < 0.76, based on the findings of the IRIS-FFR registrydata, which show that there was a statistically significant reduction in the risk of clinical outcomes only forlesions with a FFR < 0.76; scenario 12 considers a statistically significant reduction in the risk of unplannedrevascularisation, and there is no reduction for cardiac death or MI, based on the findings of trialsthat showed a positive effect of revascularisation on MACE for repeat/emergency or unplannedrevascularisation rather than cardiac death or MI; and scenario 13 considers a reduction in the risk ofMACE for all components (unplanned revascularisation, cardiac death or MI) based on the findings oftrials that reported a modest (but non-statistically significant) improvement in MACE for revascularisationcompared with OMT. Table 26 presents the cost-effectiveness results for scenarios 11–13.
In scenario 11, the HR for revascularisation compared with OMT is set equal to 0.47 for the risk ofMACE (across all components) for FFR values ≤ 0.75, whereas the HR is set equal to 1 for FFR values> 0.75. Thus, strategies with more TP test results and a higher proportion of lower FFR values areexpected to have better outcomes than the base-case scenario. Scenario 11 results in an increase intotal QALYs (0.019 for strategy 1, 0.022 for strategy 2, 0.021 for strategy 3, 0.021 for strategy 4 and0.024 for strategy 5) and a decrease in total costs per patient for each strategy (£91 for strategy 1,£116 for strategy 2, £108 for strategy 3, £111 for strategy 4 and £125 for strategy 5) compared withthe base-case scenario. The corresponding NHB ranking switches for strategies 4 and 5, with strategy5 appearing marginally more cost-effective than strategy 4. This is largely because strategy 5 hasmarginally more TP test results, which benefit from a lower risk of MACE, compared with strategy 4.
In scenario 12, the HR for revascularisation compared with OMT for lesions with a FFR ≤ 0.8 is setequal to 0.26 for the risk of unplanned revascularisation, whereas the HR is set equal to 1 for cardiacdeath or MI. In this scenario, there is very little impact on total QALYs across strategies, whereas thetotal costs per patient decrease for each strategy (£155 for strategy 1, £235 for strategy 2, £203 forstrategy 3, £220 for strategy 4 and £233 for strategy 5) compared with the base-case scenario. Thecorresponding NHB ranking switches for strategies 4 and 5, with strategy 5 appearing marginally morecost-effective than strategy 4. Again, this is largely because strategy 5 has marginally more TP testresults, which benefit from a lower risk of revascularisation, compared with strategy 4.
In scenario 13, the HR for revascularisation compared with OMT for lesions with a FFR ≤ 0.8 is set equalto 0.71 for the risk of cardiac death, 0.93 for non-fatal MI and 0.93 for unplanned revascularisation.Scenario 11 results in an increase in total QALYs (0.012 for strategy 1, 0.016 for strategy 2, 0.014 forstrategy 3, 0.015 for strategy 4 and 0.016 for strategy 5) and a decrease in total costs per patient for
DOI: 10.3310/hta25560 Health Technology Assessment 2021 Vol. 25 No. 56
© Queen’s Printer and Controller of HMSO 2021. This work was produced by Duarte et al. under the terms of a commissioning contract issued by the Secretary of Statefor Health and Social Care. This issue may be freely reproduced for the purposes of private research and study and extracts (or indeed, the full report) may be included inprofessional journals provided that suitable acknowledgement is made and the reproduction is not associated with any form of advertising. Applications for commercialreproduction should be addressed to: NIHR Journals Library, National Institute for Health Research, Evaluation, Trials and Studies Coordinating Centre, Alpha House,University of Southampton Science Park, Southampton SO16 7NS, UK.
91
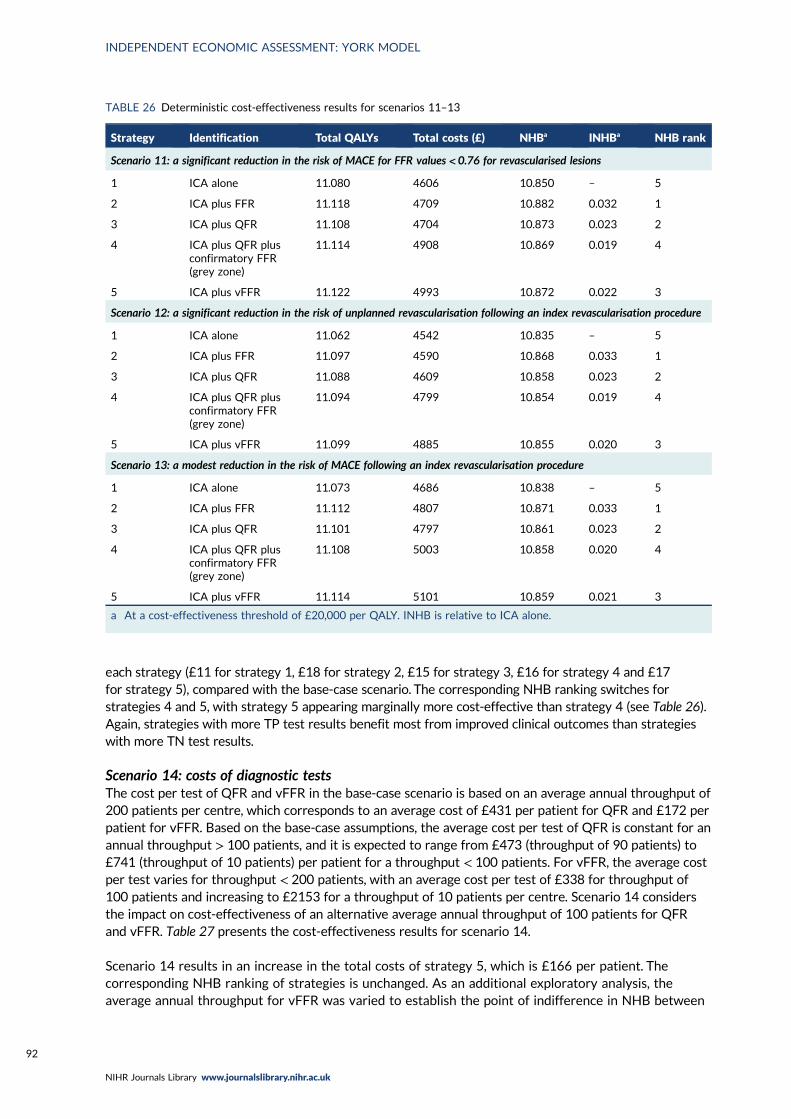
each strategy (£11 for strategy 1, £18 for strategy 2, £15 for strategy 3, £16 for strategy 4 and £17for strategy 5), compared with the base-case scenario. The corresponding NHB ranking switches forstrategies 4 and 5, with strategy 5 appearing marginally more cost-effective than strategy 4 (see Table 26).Again, strategies with more TP test results benefit most from improved clinical outcomes than strategieswith more TN test results.
Scenario 14: costs of diagnostic testsThe cost per test of QFR and vFFR in the base-case scenario is based on an average annual throughput of200 patients per centre, which corresponds to an average cost of £431 per patient for QFR and £172 perpatient for vFFR. Based on the base-case assumptions, the average cost per test of QFR is constant for anannual throughput > 100 patients, and it is expected to range from £473 (throughput of 90 patients) to£741 (throughput of 10 patients) per patient for a throughput < 100 patients. For vFFR, the average costper test varies for throughput < 200 patients, with an average cost per test of £338 for throughput of100 patients and increasing to £2153 for a throughput of 10 patients per centre. Scenario 14 considersthe impact on cost-effectiveness of an alternative average annual throughput of 100 patients for QFRand vFFR. Table 27 presents the cost-effectiveness results for scenario 14.
Scenario 14 results in an increase in the total costs of strategy 5, which is £166 per patient. Thecorresponding NHB ranking of strategies is unchanged. As an additional exploratory analysis, theaverage annual throughput for vFFR was varied to establish the point of indifference in NHB between
TABLE 26 Deterministic cost-effectiveness results for scenarios 11–13
Strategy Identification Total QALYs Total costs (£) NHBa INHBa NHB rank
Scenario 11: a significant reduction in the risk of MACE for FFR values < 0.76 for revascularised lesions
1 ICA alone 11.080 4606 10.850 – 5
2 ICA plus FFR 11.118 4709 10.882 0.032 1
3 ICA plus QFR 11.108 4704 10.873 0.023 2
4 ICA plus QFR plusconfirmatory FFR(grey zone)
11.114 4908 10.869 0.019 4
5 ICA plus vFFR 11.122 4993 10.872 0.022 3
Scenario 12: a significant reduction in the risk of unplanned revascularisation following an index revascularisation procedure
1 ICA alone 11.062 4542 10.835 – 5
2 ICA plus FFR 11.097 4590 10.868 0.033 1
3 ICA plus QFR 11.088 4609 10.858 0.023 2
4 ICA plus QFR plusconfirmatory FFR(grey zone)
11.094 4799 10.854 0.019 4
5 ICA plus vFFR 11.099 4885 10.855 0.020 3
Scenario 13: a modest reduction in the risk of MACE following an index revascularisation procedure
1 ICA alone 11.073 4686 10.838 – 5
2 ICA plus FFR 11.112 4807 10.871 0.033 1
3 ICA plus QFR 11.101 4797 10.861 0.023 2
4 ICA plus QFR plusconfirmatory FFR(grey zone)
11.108 5003 10.858 0.020 4
5 ICA plus vFFR 11.114 5101 10.859 0.021 3
a At a cost-effectiveness threshold of £20,000 per QALY. INHB is relative to ICA alone.
INDEPENDENT ECONOMIC ASSESSMENT: YORK MODEL
NIHR Journals Library www.journalslibrary.nihr.ac.uk
92
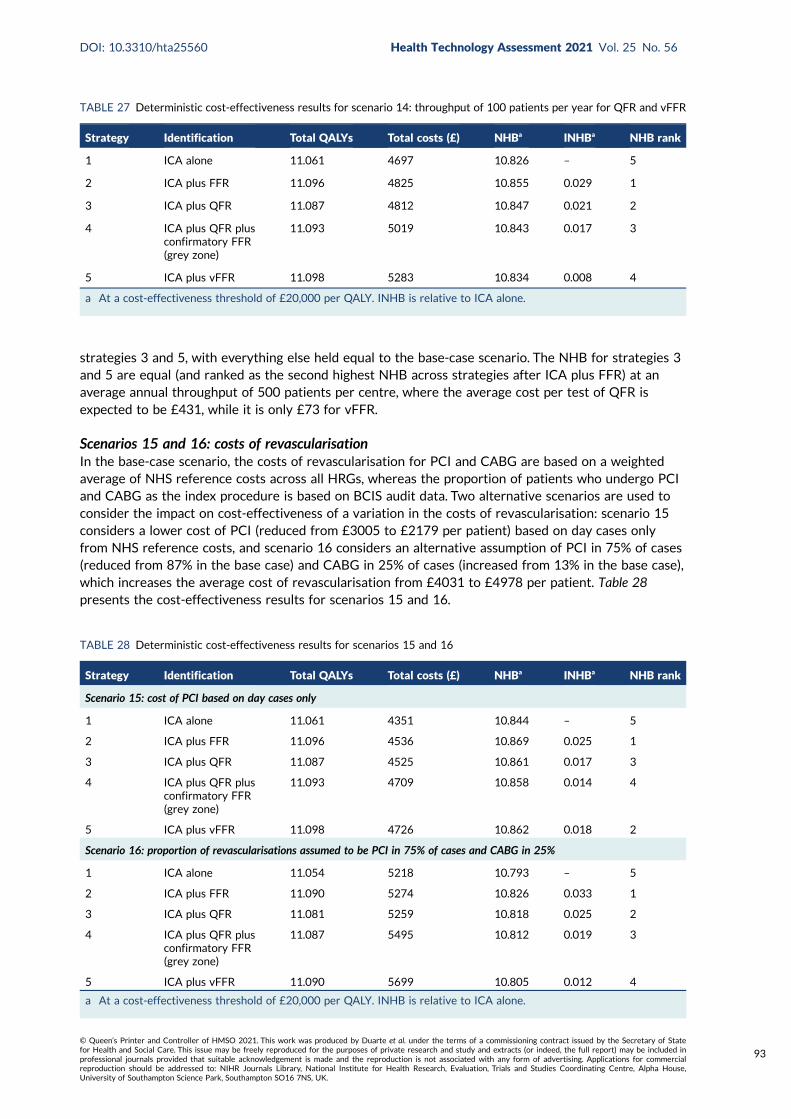
strategies 3 and 5, with everything else held equal to the base-case scenario. The NHB for strategies 3and 5 are equal (and ranked as the second highest NHB across strategies after ICA plus FFR) at anaverage annual throughput of 500 patients per centre, where the average cost per test of QFR isexpected to be £431, while it is only £73 for vFFR.
Scenarios 15 and 16: costs of revascularisationIn the base-case scenario, the costs of revascularisation for PCI and CABG are based on a weightedaverage of NHS reference costs across all HRGs, whereas the proportion of patients who undergo PCIand CABG as the index procedure is based on BCIS audit data. Two alternative scenarios are used toconsider the impact on cost-effectiveness of a variation in the costs of revascularisation: scenario 15considers a lower cost of PCI (reduced from £3005 to £2179 per patient) based on day cases onlyfrom NHS reference costs, and scenario 16 considers an alternative assumption of PCI in 75% of cases(reduced from 87% in the base case) and CABG in 25% of cases (increased from 13% in the base case),which increases the average cost of revascularisation from £4031 to £4978 per patient. Table 28presents the cost-effectiveness results for scenarios 15 and 16.
TABLE 28 Deterministic cost-effectiveness results for scenarios 15 and 16
Strategy Identification Total QALYs Total costs (£) NHBa INHBa NHB rank
Scenario 15: cost of PCI based on day cases only
1 ICA alone 11.061 4351 10.844 – 5
2 ICA plus FFR 11.096 4536 10.869 0.025 1
3 ICA plus QFR 11.087 4525 10.861 0.017 3
4 ICA plus QFR plusconfirmatory FFR(grey zone)
11.093 4709 10.858 0.014 4
5 ICA plus vFFR 11.098 4726 10.862 0.018 2
Scenario 16: proportion of revascularisations assumed to be PCI in 75% of cases and CABG in 25%
1 ICA alone 11.054 5218 10.793 – 5
2 ICA plus FFR 11.090 5274 10.826 0.033 1
3 ICA plus QFR 11.081 5259 10.818 0.025 2
4 ICA plus QFR plusconfirmatory FFR(grey zone)
11.087 5495 10.812 0.019 3
5 ICA plus vFFR 11.090 5699 10.805 0.012 4
a At a cost-effectiveness threshold of £20,000 per QALY. INHB is relative to ICA alone.
TABLE 27 Deterministic cost-effectiveness results for scenario 14: throughput of 100 patients per year for QFR and vFFR
Strategy Identification Total QALYs Total costs (£) NHBa INHBa NHB rank
1 ICA alone 11.061 4697 10.826 – 5
2 ICA plus FFR 11.096 4825 10.855 0.029 1
3 ICA plus QFR 11.087 4812 10.847 0.021 2
4 ICA plus QFR plusconfirmatory FFR(grey zone)
11.093 5019 10.843 0.017 3
5 ICA plus vFFR 11.098 5283 10.834 0.008 4
a At a cost-effectiveness threshold of £20,000 per QALY. INHB is relative to ICA alone.
DOI: 10.3310/hta25560 Health Technology Assessment 2021 Vol. 25 No. 56
© Queen’s Printer and Controller of HMSO 2021. This work was produced by Duarte et al. under the terms of a commissioning contract issued by the Secretary of Statefor Health and Social Care. This issue may be freely reproduced for the purposes of private research and study and extracts (or indeed, the full report) may be included inprofessional journals provided that suitable acknowledgement is made and the reproduction is not associated with any form of advertising. Applications for commercialreproduction should be addressed to: NIHR Journals Library, National Institute for Health Research, Evaluation, Trials and Studies Coordinating Centre, Alpha House,University of Southampton Science Park, Southampton SO16 7NS, UK.
93
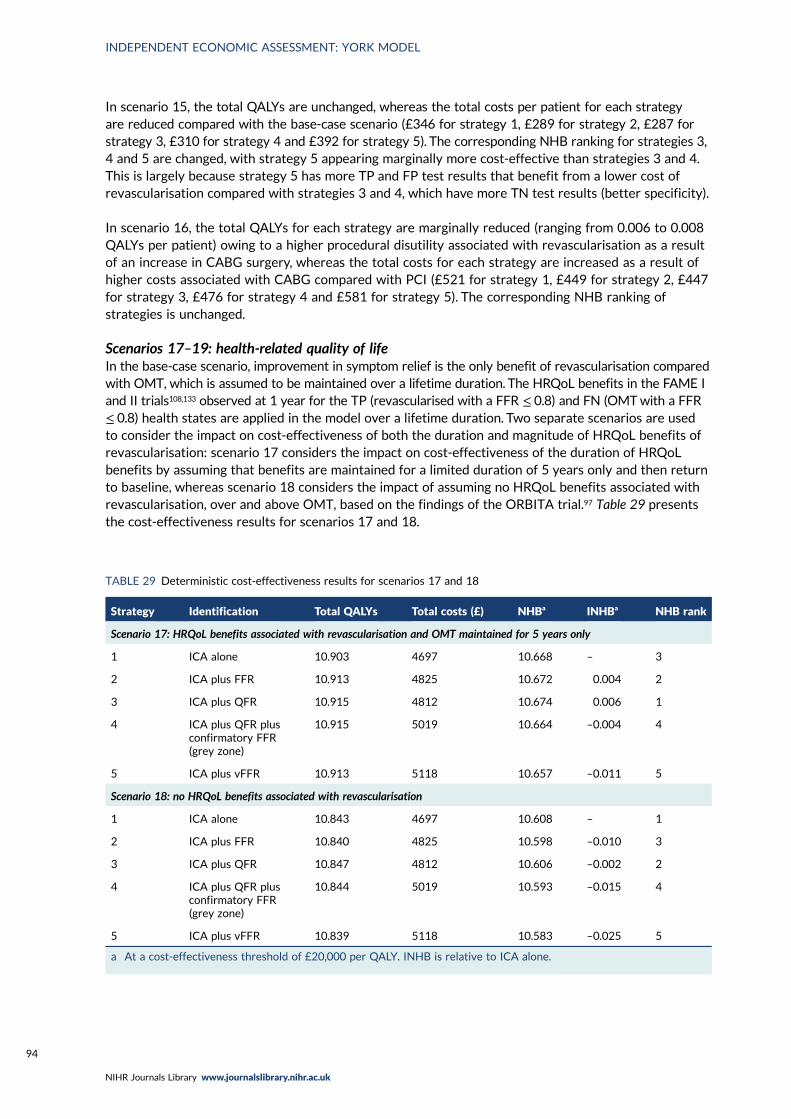
In scenario 15, the total QALYs are unchanged, whereas the total costs per patient for each strategyare reduced compared with the base-case scenario (£346 for strategy 1, £289 for strategy 2, £287 forstrategy 3, £310 for strategy 4 and £392 for strategy 5). The corresponding NHB ranking for strategies 3,4 and 5 are changed, with strategy 5 appearing marginally more cost-effective than strategies 3 and 4.This is largely because strategy 5 has more TP and FP test results that benefit from a lower cost ofrevascularisation compared with strategies 3 and 4, which have more TN test results (better specificity).
In scenario 16, the total QALYs for each strategy are marginally reduced (ranging from 0.006 to 0.008QALYs per patient) owing to a higher procedural disutility associated with revascularisation as a resultof an increase in CABG surgery, whereas the total costs for each strategy are increased as a result ofhigher costs associated with CABG compared with PCI (£521 for strategy 1, £449 for strategy 2, £447for strategy 3, £476 for strategy 4 and £581 for strategy 5). The corresponding NHB ranking ofstrategies is unchanged.
Scenarios 17–19: health-related quality of lifeIn the base-case scenario, improvement in symptom relief is the only benefit of revascularisation comparedwith OMT, which is assumed to be maintained over a lifetime duration. The HRQoL benefits in the FAME Iand II trials108,133 observed at 1 year for the TP (revascularised with a FFR ≤ 0.8) and FN (OMTwith a FFR≤ 0.8) health states are applied in the model over a lifetime duration. Two separate scenarios are usedto consider the impact on cost-effectiveness of both the duration and magnitude of HRQoL benefits ofrevascularisation: scenario 17 considers the impact on cost-effectiveness of the duration of HRQoLbenefits by assuming that benefits are maintained for a limited duration of 5 years only and then returnto baseline, whereas scenario 18 considers the impact of assuming no HRQoL benefits associated withrevascularisation, over and above OMT, based on the findings of the ORBITA trial.97 Table 29 presentsthe cost-effectiveness results for scenarios 17 and 18.
TABLE 29 Deterministic cost-effectiveness results for scenarios 17 and 18
Strategy Identification Total QALYs Total costs (£) NHBa INHBa NHB rank
Scenario 17: HRQoL benefits associated with revascularisation and OMT maintained for 5 years only
1 ICA alone 10.903 4697 10.668 – 3
2 ICA plus FFR 10.913 4825 10.672 0.004 2
3 ICA plus QFR 10.915 4812 10.674 0.006 1
4 ICA plus QFR plusconfirmatory FFR(grey zone)
10.915 5019 10.664 –0.004 4
5 ICA plus vFFR 10.913 5118 10.657 –0.011 5
Scenario 18: no HRQoL benefits associated with revascularisation
1 ICA alone 10.843 4697 10.608 – 1
2 ICA plus FFR 10.840 4825 10.598 –0.010 3
3 ICA plus QFR 10.847 4812 10.606 –0.002 2
4 ICA plus QFR plusconfirmatory FFR(grey zone)
10.844 5019 10.593 –0.015 4
5 ICA plus vFFR 10.839 5118 10.583 –0.025 5
a At a cost-effectiveness threshold of £20,000 per QALY. INHB is relative to ICA alone.
INDEPENDENT ECONOMIC ASSESSMENT: YORK MODEL
NIHR Journals Library www.journalslibrary.nihr.ac.uk
94
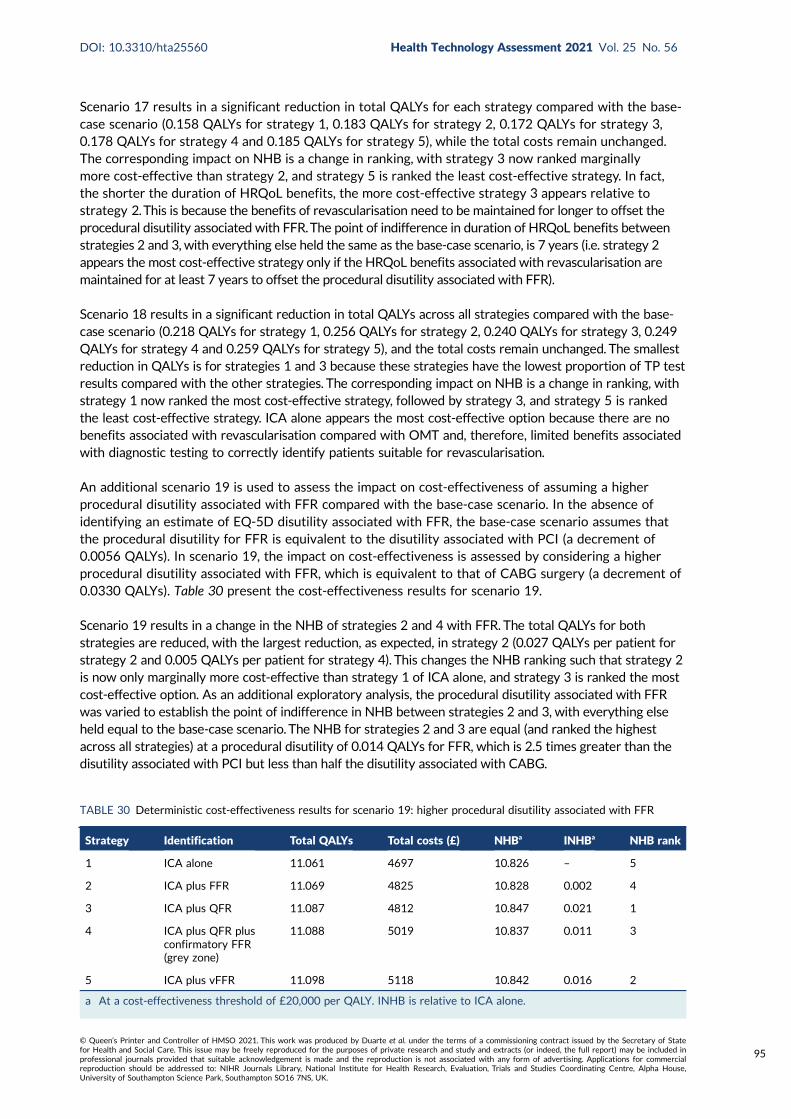
Scenario 17 results in a significant reduction in total QALYs for each strategy compared with the base-case scenario (0.158 QALYs for strategy 1, 0.183 QALYs for strategy 2, 0.172 QALYs for strategy 3,0.178 QALYs for strategy 4 and 0.185 QALYs for strategy 5), while the total costs remain unchanged.The corresponding impact on NHB is a change in ranking, with strategy 3 now ranked marginallymore cost-effective than strategy 2, and strategy 5 is ranked the least cost-effective strategy. In fact,the shorter the duration of HRQoL benefits, the more cost-effective strategy 3 appears relative tostrategy 2.This is because the benefits of revascularisation need to be maintained for longer to offset theprocedural disutility associated with FFR.The point of indifference in duration of HRQoL benefits betweenstrategies 2 and 3, with everything else held the same as the base-case scenario, is 7 years (i.e. strategy 2appears the most cost-effective strategy only if the HRQoL benefits associated with revascularisation aremaintained for at least 7 years to offset the procedural disutility associated with FFR).
Scenario 18 results in a significant reduction in total QALYs across all strategies compared with the base-case scenario (0.218 QALYs for strategy 1, 0.256 QALYs for strategy 2, 0.240 QALYs for strategy 3, 0.249QALYs for strategy 4 and 0.259 QALYs for strategy 5), and the total costs remain unchanged. The smallestreduction in QALYs is for strategies 1 and 3 because these strategies have the lowest proportion of TP testresults compared with the other strategies. The corresponding impact on NHB is a change in ranking, withstrategy 1 now ranked the most cost-effective strategy, followed by strategy 3, and strategy 5 is rankedthe least cost-effective strategy. ICA alone appears the most cost-effective option because there are nobenefits associated with revascularisation compared with OMT and, therefore, limited benefits associatedwith diagnostic testing to correctly identify patients suitable for revascularisation.
An additional scenario 19 is used to assess the impact on cost-effectiveness of assuming a higherprocedural disutility associated with FFR compared with the base-case scenario. In the absence ofidentifying an estimate of EQ-5D disutility associated with FFR, the base-case scenario assumes thatthe procedural disutility for FFR is equivalent to the disutility associated with PCI (a decrement of0.0056 QALYs). In scenario 19, the impact on cost-effectiveness is assessed by considering a higherprocedural disutility associated with FFR, which is equivalent to that of CABG surgery (a decrement of0.0330 QALYs). Table 30 present the cost-effectiveness results for scenario 19.
Scenario 19 results in a change in the NHB of strategies 2 and 4 with FFR. The total QALYs for bothstrategies are reduced, with the largest reduction, as expected, in strategy 2 (0.027 QALYs per patient forstrategy 2 and 0.005 QALYs per patient for strategy 4). This changes the NHB ranking such that strategy 2is now only marginally more cost-effective than strategy 1 of ICA alone, and strategy 3 is ranked the mostcost-effective option. As an additional exploratory analysis, the procedural disutility associated with FFRwas varied to establish the point of indifference in NHB between strategies 2 and 3, with everything elseheld equal to the base-case scenario. The NHB for strategies 2 and 3 are equal (and ranked the highestacross all strategies) at a procedural disutility of 0.014 QALYs for FFR, which is 2.5 times greater than thedisutility associated with PCI but less than half the disutility associated with CABG.
TABLE 30 Deterministic cost-effectiveness results for scenario 19: higher procedural disutility associated with FFR
Strategy Identification Total QALYs Total costs (£) NHBa INHBa NHB rank
1 ICA alone 11.061 4697 10.826 – 5
2 ICA plus FFR 11.069 4825 10.828 0.002 4
3 ICA plus QFR 11.087 4812 10.847 0.021 1
4 ICA plus QFR plusconfirmatory FFR(grey zone)
11.088 5019 10.837 0.011 3
5 ICA plus vFFR 11.098 5118 10.842 0.016 2
a At a cost-effectiveness threshold of £20,000 per QALY. INHB is relative to ICA alone.
DOI: 10.3310/hta25560 Health Technology Assessment 2021 Vol. 25 No. 56
© Queen’s Printer and Controller of HMSO 2021. This work was produced by Duarte et al. under the terms of a commissioning contract issued by the Secretary of Statefor Health and Social Care. This issue may be freely reproduced for the purposes of private research and study and extracts (or indeed, the full report) may be included inprofessional journals provided that suitable acknowledgement is made and the reproduction is not associated with any form of advertising. Applications for commercialreproduction should be addressed to: NIHR Journals Library, National Institute for Health Research, Evaluation, Trials and Studies Coordinating Centre, Alpha House,University of Southampton Science Park, Southampton SO16 7NS, UK.
95
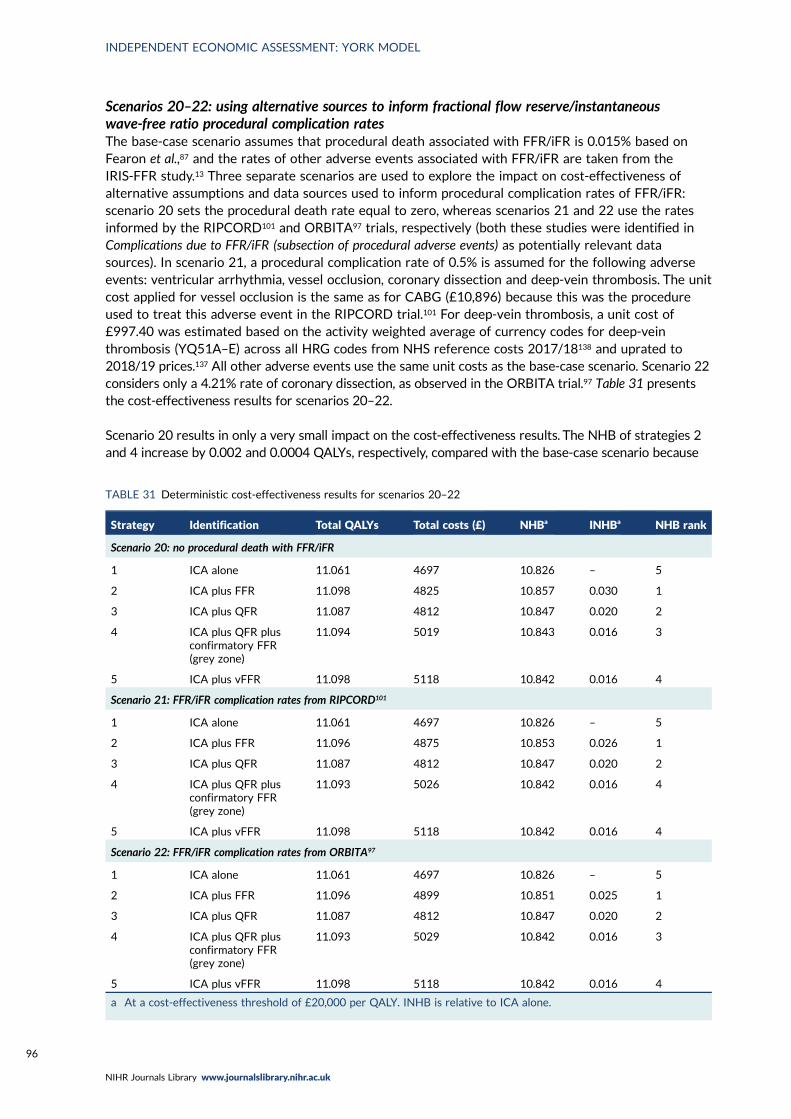
Scenarios 20–22: using alternative sources to inform fractional flow reserve/instantaneouswave-free ratio procedural complication ratesThe base-case scenario assumes that procedural death associated with FFR/iFR is 0.015% based onFearon et al.,87 and the rates of other adverse events associated with FFR/iFR are taken from theIRIS-FFR study.13 Three separate scenarios are used to explore the impact on cost-effectiveness ofalternative assumptions and data sources used to inform procedural complication rates of FFR/iFR:scenario 20 sets the procedural death rate equal to zero, whereas scenarios 21 and 22 use the ratesinformed by the RIPCORD101 and ORBITA97 trials, respectively (both these studies were identified inComplications due to FFR/iFR (subsection of procedural adverse events) as potentially relevant datasources). In scenario 21, a procedural complication rate of 0.5% is assumed for the following adverseevents: ventricular arrhythmia, vessel occlusion, coronary dissection and deep-vein thrombosis. The unitcost applied for vessel occlusion is the same as for CABG (£10,896) because this was the procedureused to treat this adverse event in the RIPCORD trial.101 For deep-vein thrombosis, a unit cost of£997.40 was estimated based on the activity weighted average of currency codes for deep-veinthrombosis (YQ51A–E) across all HRG codes from NHS reference costs 2017/18138 and uprated to2018/19 prices.137 All other adverse events use the same unit costs as the base-case scenario. Scenario 22considers only a 4.21% rate of coronary dissection, as observed in the ORBITA trial.97 Table 31 presentsthe cost-effectiveness results for scenarios 20–22.
Scenario 20 results in only a very small impact on the cost-effectiveness results. The NHB of strategies 2and 4 increase by 0.002 and 0.0004 QALYs, respectively, compared with the base-case scenario because
TABLE 31 Deterministic cost-effectiveness results for scenarios 20–22
Strategy Identification Total QALYs Total costs (£) NHBa INHBa NHB rank
Scenario 20: no procedural death with FFR/iFR
1 ICA alone 11.061 4697 10.826 – 5
2 ICA plus FFR 11.098 4825 10.857 0.030 1
3 ICA plus QFR 11.087 4812 10.847 0.020 2
4 ICA plus QFR plusconfirmatory FFR(grey zone)
11.094 5019 10.843 0.016 3
5 ICA plus vFFR 11.098 5118 10.842 0.016 4
Scenario 21: FFR/iFR complication rates from RIPCORD101
1 ICA alone 11.061 4697 10.826 – 5
2 ICA plus FFR 11.096 4875 10.853 0.026 1
3 ICA plus QFR 11.087 4812 10.847 0.020 2
4 ICA plus QFR plusconfirmatory FFR(grey zone)
11.093 5026 10.842 0.016 4
5 ICA plus vFFR 11.098 5118 10.842 0.016 4
Scenario 22: FFR/iFR complication rates from ORBITA97
1 ICA alone 11.061 4697 10.826 – 5
2 ICA plus FFR 11.096 4899 10.851 0.025 1
3 ICA plus QFR 11.087 4812 10.847 0.020 2
4 ICA plus QFR plusconfirmatory FFR(grey zone)
11.093 5029 10.842 0.016 3
5 ICA plus vFFR 11.098 5118 10.842 0.016 4
a At a cost-effectiveness threshold of £20,000 per QALY. INHB is relative to ICA alone.
INDEPENDENT ECONOMIC ASSESSMENT: YORK MODEL
NIHR Journals Library www.journalslibrary.nihr.ac.uk
96
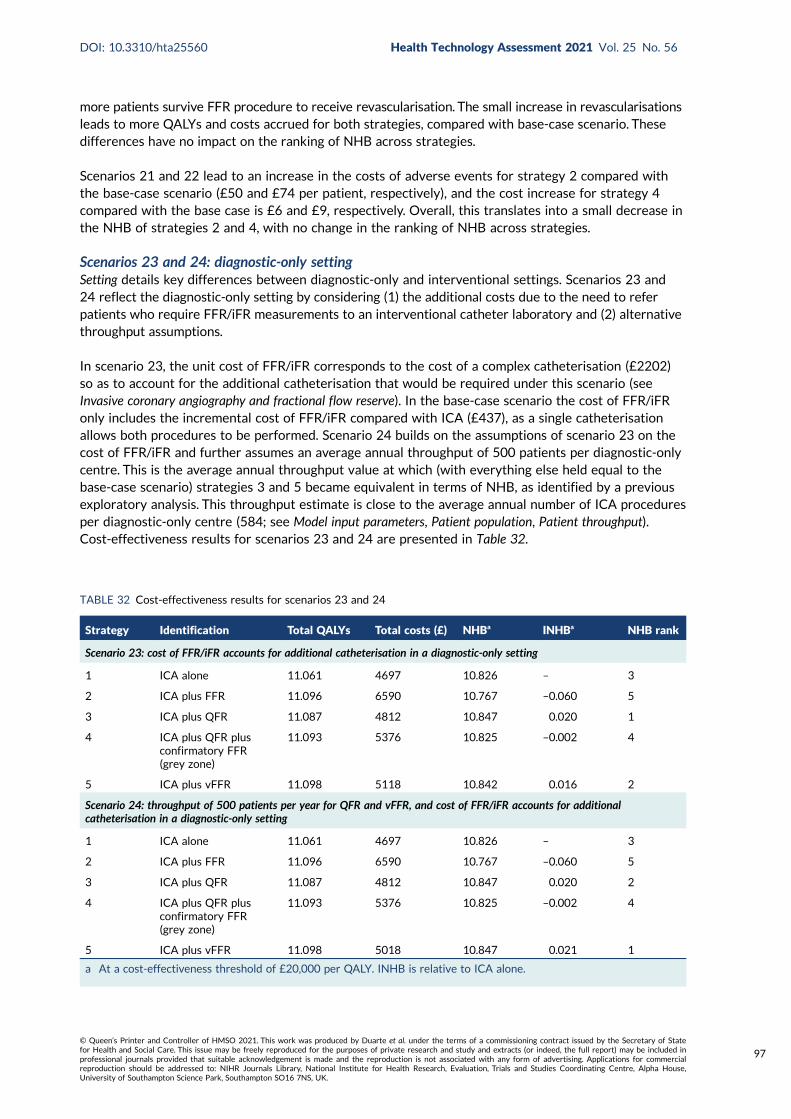
more patients survive FFR procedure to receive revascularisation. The small increase in revascularisationsleads to more QALYs and costs accrued for both strategies, compared with base-case scenario. Thesedifferences have no impact on the ranking of NHB across strategies.
Scenarios 21 and 22 lead to an increase in the costs of adverse events for strategy 2 compared withthe base-case scenario (£50 and £74 per patient, respectively), and the cost increase for strategy 4compared with the base case is £6 and £9, respectively. Overall, this translates into a small decrease inthe NHB of strategies 2 and 4, with no change in the ranking of NHB across strategies.
Scenarios 23 and 24: diagnostic-only settingSetting details key differences between diagnostic-only and interventional settings. Scenarios 23 and24 reflect the diagnostic-only setting by considering (1) the additional costs due to the need to referpatients who require FFR/iFR measurements to an interventional catheter laboratory and (2) alternativethroughput assumptions.
In scenario 23, the unit cost of FFR/iFR corresponds to the cost of a complex catheterisation (£2202)so as to account for the additional catheterisation that would be required under this scenario (seeInvasive coronary angiography and fractional flow reserve). In the base-case scenario the cost of FFR/iFRonly includes the incremental cost of FFR/iFR compared with ICA (£437), as a single catheterisationallows both procedures to be performed. Scenario 24 builds on the assumptions of scenario 23 on thecost of FFR/iFR and further assumes an average annual throughput of 500 patients per diagnostic-onlycentre. This is the average annual throughput value at which (with everything else held equal to thebase-case scenario) strategies 3 and 5 became equivalent in terms of NHB, as identified by a previousexploratory analysis. This throughput estimate is close to the average annual number of ICA proceduresper diagnostic-only centre (584; see Model input parameters, Patient population, Patient throughput).Cost-effectiveness results for scenarios 23 and 24 are presented in Table 32.
TABLE 32 Cost-effectiveness results for scenarios 23 and 24
Strategy Identification Total QALYs Total costs (£) NHBa INHBa NHB rank
Scenario 23: cost of FFR/iFR accounts for additional catheterisation in a diagnostic-only setting
1 ICA alone 11.061 4697 10.826 – 3
2 ICA plus FFR 11.096 6590 10.767 –0.060 5
3 ICA plus QFR 11.087 4812 10.847 0.020 1
4 ICA plus QFR plusconfirmatory FFR(grey zone)
11.093 5376 10.825 –0.002 4
5 ICA plus vFFR 11.098 5118 10.842 0.016 2
Scenario 24: throughput of 500 patients per year for QFR and vFFR, and cost of FFR/iFR accounts for additionalcatheterisation in a diagnostic-only setting
1 ICA alone 11.061 4697 10.826 – 3
2 ICA plus FFR 11.096 6590 10.767 –0.060 5
3 ICA plus QFR 11.087 4812 10.847 0.020 2
4 ICA plus QFR plusconfirmatory FFR(grey zone)
11.093 5376 10.825 –0.002 4
5 ICA plus vFFR 11.098 5018 10.847 0.021 1
a At a cost-effectiveness threshold of £20,000 per QALY. INHB is relative to ICA alone.
DOI: 10.3310/hta25560 Health Technology Assessment 2021 Vol. 25 No. 56
© Queen’s Printer and Controller of HMSO 2021. This work was produced by Duarte et al. under the terms of a commissioning contract issued by the Secretary of Statefor Health and Social Care. This issue may be freely reproduced for the purposes of private research and study and extracts (or indeed, the full report) may be included inprofessional journals provided that suitable acknowledgement is made and the reproduction is not associated with any form of advertising. Applications for commercialreproduction should be addressed to: NIHR Journals Library, National Institute for Health Research, Evaluation, Trials and Studies Coordinating Centre, Alpha House,University of Southampton Science Park, Southampton SO16 7NS, UK.
97
In scenario 23, the cost of testing increases considerably for strategies 2 (£1765) and 4 (£357)compared with the base-case scenario. The sharp increase in cost for these strategies reduces theirNHB, with strategy 1 now having the lowest NHB followed by strategy 4. In this scenario, strategy 3has the highest NHB across all strategies.
In scenario 24, in addition to the changes to the testing costs of strategy 2 and 4 found for scenario 23,the increase of annual patient throughput reduces the testing costs of strategy 5 (£99 less than in thebase-case scenario), and the testing costs of strategy 3 remain £431. The difference in total costs betweenstrategy 5 and strategy 3 is reduced to £206, which is offset by the QALY gains of strategy 5 comparedwith strategy 3 (0.011). In this scenario, strategy 5 has the highest NHB across all strategies, but thisresult needs to be interpreted cautiously given the uncertainties in the diagnostic accuracy of CAAS vFFR.
The deterministic cost-effectiveness results of the base-case and scenario analyses are summarised inAppendix 9, Table 74.
Discussion of the independent economic assessment
The decision problem addressed by the model relates to the cost-effectiveness of QAngio XA 3D/QFRand CAAS vFFR imaging software used during ICA for assessing the functional significance of coronarystenosis in patients with stable angina whose angiograms show intermediate stenosis. Five diagnosticstrategies were addressed: strategy 1 of ICA alone (visual interpretation of angiographic images withoutadditional testing to assess the functional significance of intermediate stenosis), strategy 2 of ICAfollowed by confirmatory FFR/iFR (reference standard), strategy 3 of ICA with QFR, strategy 4 of ICAwith QFR, followed by confirmatory FFR/iFR when QFR is inconclusive, and strategy 5 of ICA with vFFR.The decision model considered the diagnostic accuracy of the non-invasive functional tests (QAngio XA3D/QFR and CAAS vFFR) and ICA relative to the reference standard of pressure wire FFR/iFR todetermine whether or not patients were correctly identified as having functionally significant stenosisand should progress to revascularisation (in addition to OMT) or functionally non-significant stenosisand should receive OMTwithout the need for revascularisation. The short-term costs and consequencesassociated with diagnostic testing and revascularisation were considered. These short-term consequenceswere then linked to longer-term costs and consequences associated with the diagnostic outcomes andtreatment by modelling the risk of major adverse cardiovascular events (MI, sudden cardiac death andneed for urgent/unplanned revascularisation) over a lifetime horizon.
The cost-effectiveness of the diagnostic strategies was assessed by ranking the strategies in terms ofNHB from highest to lowest. The strategy with the highest NHB represents the cost-effective strategy,and the ranking is used to interpret the next best choice (second highest NHB) and so on. A cost-effectiveness threshold of £20,000 per additional QALY was used to determine cost-effectiveness. Thestrategy with the highest NHB was strategy 2, FFR, and the strategy ranked with the lowest NHB wasstrategy 1, ICA alone. The strategy with the second highest NHB was strategy 3, QFR, and the nextbest strategies were either strategy 4, QFR and confirmatory FFR, or strategy 5, vFFR. Strategy 2 wasalso the strategy with the highest probability of being cost-effective (27.8%) and strategy 1 had thelowest probability (10.0%), whereas strategies 3–5 had similar probabilities of cost-effectiveness(21.8% for strategy 3, 19.9% for strategy 4 and 20.4% for strategy 5).
The difference in NHB between strategies 2 (cost-effective) and 3 (next best strategy) was 0.007 QALYs,which is equivalent to £140 per patient diagnosed at a cost-effectiveness threshold of £20,000 per QALYgained. The diagnostic test costs for QFR and FFR were similar (£437 per test for FFR vs. £431 pertest for QFR). The difference between the two strategies was largely driven by the trade-off in HRQoLbetween the procedural disutility associated with FFR/iFR and the HRQoL benefits associated withrevascularisation. The procedural QALY loss associated with FFR/iFR was not sufficient to offsetthe higher QALY gains associated with revascularisation for FFR owing to more TP test results forstrategy 2 than for strategy 3.
INDEPENDENT ECONOMIC ASSESSMENT: YORK MODEL
NIHR Journals Library www.journalslibrary.nihr.ac.uk
98
The difference in NHB between strategies 3 and 4 was 0.005 QALYs, which is equivalent to £100 perpatient diagnosed at a cost-effectiveness threshold of £20,000 per QALY gained. This difference waslargely driven by the additional costs of testing for strategy 4 (£519 per patient tested, with QFRfollowed by confirmatory FFR when QFR is conclusive), compared with strategy 3 (£431 per test forQFR without additional testing). The higher QALY gains associated with more TP test results forstrategy 4 (due to the addition of confirmatory FFR in the inconclusive QFR test results) was notsufficient to offset the additional costs of testing with both QFR and FFR in strategy 4.
The difference in NHB between strategies 4 and 5 was minimal, at 0.001 QALYs (or equivalently£20 per patient diagnosed at a cost-effectiveness threshold of £20,000 per QALY gained), and thedifference in NHB between strategies 3 and 5 was 0.004 QALYs (or equivalently £80 per patientdiagnosed). The diagnostic test costs for vFFR were smaller than QFR (£172 per test for vFFR vs.£431 per test for QFR), and the PPV was lower and the NPV higher in strategy 5 than in strategy 3.The higher QALY gains associated with more TP test results, and the lower diagnostic testing costs, forstrategy 5, compared with strategy 3, was not sufficient to offset the additional costs associated withunnecessary revascularisations due to a greater number of FP test results in strategy 5. Therefore, thebenefits of improved test sensitivity of vFFR in strategy 5 are not sufficient to offset the better testspecificity with QFR.
The cost-effectiveness results for strategy 5 should be interpreted with caution because of the limitedavailability of diagnostic accuracy studies for vFFR. The estimates of sensitivity and specificity for vFFRin strategy 5 were based on one study with 303 patients, whereas the diagnostic accuracy estimatesfor QFR were based on 26 studies and > 3000 lesions, which was used to inform strategies 3 and 4.
A number of alternative scenarios were considered in which the assumptions used as part of the base-case results were varied. These analyses were undertaken to assess the robustness of the base-caseresults to variation in the sources of data used to populate the model and alternative assumptions.These alternative scenarios showed that the cost-effectiveness results for strategy 3 were robust tothe mode of flow used for QFR measurement, contrast-flow QFR or fixed-flow QFR. The results werealso robust to the use of an alternative diagnostic threshold of 0.75 for FFR and QFR in strategies 2and 3, and to a wider definition of the grey-zone region for confirmatory FFR in strategy 4. The use ofdifferent diagnostic accuracy estimates for vFFR based on two alternative studies highlighted thesubstantial uncertainty surrounding the cost-effectiveness of vFFR in strategy 5. In particular, thediagnostic accuracy results reported for vFFR in a conference abstract were much more favourablethan in the largest single study used in the base-case analysis, which resulted in strategy 5 beingranked the second best cost-effective strategy after strategy 2.
To understand the trade-off in costs and benefits associated with strategies 2 (cost-effective) and 3(next best strategy), a scenario was undertaken that considered both tests, FFR and QFR, to have thesame diagnostic accuracy (i.e. both tests perfect, with the same underlying distribution of FFR values).In this case, the total QALYs and costs for strategy 3 increased by 0.017 QALYs and £6 per patientfrom the base-case scenario. Strategy 3 became cost-effective with the highest NHB (an increase of0.008 QALYs per patient for strategy 3 compared with strategy 2). The increase in NHB was largelydue to greater total QALYs gained for strategy 3 compared with strategy 2, with the difference mainlydue to the procedural disutility associated with FFR/iFR and, to a lesser extent, the increased risk ofprocedural mortality for FFR/iFR.
In an additional exploratory scenario, the procedural disutility associated with FFR/iFR was also variedto establish the point of indifference in cost-effectiveness between strategies 2 and 3, with the diagnosticaccuracy for QFR the same as used in the base case (and all other parameters the same as base case).The NHB for strategies 2 and 3 were equal (and ranked the highest across all strategies) at a proceduraldisutility of 0.014 QALYs for FFR/iFR, which is 2.5 times greater than the procedural disutility associatedwith PCI but less than half the disutility associated with CABG surgery.
DOI: 10.3310/hta25560 Health Technology Assessment 2021 Vol. 25 No. 56
© Queen’s Printer and Controller of HMSO 2021. This work was produced by Duarte et al. under the terms of a commissioning contract issued by the Secretary of Statefor Health and Social Care. This issue may be freely reproduced for the purposes of private research and study and extracts (or indeed, the full report) may be included inprofessional journals provided that suitable acknowledgement is made and the reproduction is not associated with any form of advertising. Applications for commercialreproduction should be addressed to: NIHR Journals Library, National Institute for Health Research, Evaluation, Trials and Studies Coordinating Centre, Alpha House,University of Southampton Science Park, Southampton SO16 7NS, UK.
99
A scenario was also undertaken to assess the impact on cost-effectiveness of the duration of HRQoLbenefits associated with revascularisation. This scenario highlighted that the benefits need to last for atleast 7 years to offset the disutility associated with FFR/iFR in the base case for strategy 2 to remaincost-effective above strategy 3.
The benefits of revascularisation, in terms of improved HRQoL, suggest that the sensitivity of testresults is a more important driver of cost-effectiveness than specificity because TP test resultstranslate into higher QALY gains than mismanagement of FN test results. This was further supportedby scenario analyses that included a benefit of revascularisation on the risk of MACE. Furthermore,strategy 1 appeared cost-effective relative to the alternative strategies only when it was assumed thatthere were no benefits of revascularisation (i.e. no impact on risk of MACE or HRQoL gain).
When considering a diagnostic-only setting, the large additional costs of repeating diagnosticcatheterisation in a subsequent health-care contact in an interventional laboratory for strategiesinvolving a FFR/iFR measurement (strategies 2 and 4) favoured the cost-effectiveness of strategieswithout this testing component. Strategy 3 (QFR alone) became the strategy with the highest netbenefit, followed by strategy 5 (vFFR) alone.
Conclusions from cost-effectiveness results
The base-case cost-effectiveness results showed that the test strategy with the highest net benefit(most cost-effective strategy) was ICA followed by confirmatory FFR/iFR, for a cost-effectivenessthreshold of £20,000 per QALY gained. However, the difference in net benefit between this strategyand the next best strategies for the assessment of functional significance of coronary obstructions wasrelatively small at 0.007 QALYs (£140) for ICA with QFR, 0.012 QALYs (£240) for ICA with QFR,followed by confirmatory FFR/iFR when QFR is inconclusive, and 0.011 QALYs (£220) for ICA withvFFR. The cost-effectiveness results for the strategy of ICA with vFFR must be interpreted withcaution owing to very limited data available from diagnostic accuracy studies of vFFR. In addition,there was no diagnostic information available to inform a strategy of ICA with vFFR followed byconfirmatory FFR/iFR when vFFR is inconclusive.
The key drivers of cost-effectiveness were (1) the sensitivity (rather than specificity) of the testsbecause TP test results translated into higher QALY gains than mismanagement of FN test results,(2) the procedural QALY loss associated with FFR/iFR, (3) the magnitude and duration of the QALYgains associated with revascularisation and (4) the additional costs associated with confirmatorytesting with FFR/iFR.
INDEPENDENT ECONOMIC ASSESSMENT: YORK MODEL
NIHR Journals Library www.journalslibrary.nihr.ac.uk
100
Chapter 6 Discussion
Statement of principal findings
Diagnostic accuracyThe diagnostic accuracy of QFR has been widely studied, with 39 studies in this review, including5940 patients (over 7043 vessels or lesions). QFR, as measured using QAngio, is highly correlatedwith FFR measured with an invasive pressure wire. The average difference between FFR andQFR measurements is almost zero, and they rarely differ by more than 0.1, with about 50% ofmeasurements differing by less than 0.04.
QAngio XA 3D/QFR at a cut-off point of 0.8 has good diagnostic accuracy to predict FFR (also at acut-off point of 0.8), cQFR mode had a sensitivity of 85% (95% CI 78% to 90%) and a specificity of91% (95% CI 85% to 95%) and fQFR mode had a sensitivity of 82% (95% CI 68% to 91%) and aspecificity of 89% (95% CI 77% to 95%). Although there is some discordance between QFR andFFR, most FPs or FNs arise near the boundary (e.g. where one is 0.81 and the other 0.79), and thediscordance may not be clinically meaningful. Data on how this accuracy may vary by key patientcharacteristics was very limited, and no conclusive variation could be found.
The use of a ‘grey-zone’ strategy, where patients with a QFR between 0.78 and 0.84 receive confirmatoryFFR, improves diagnostic accuracy, compared with using QFR alone, to a sensitivity of 93.1% and aspecificity of 92.1%. However, this improvement is dependent on assuming that the exact FFR cut-offpoint of 0.8 is clinically meaningful. Most FFR and QFR values differ by 0.05 or less; therefore, thegrey-zone approach is mainly identifying discordant FFR and QFR results very close to the 0.8 boundary;30.4% of patients with QFR results in the grey zone have results that are discordant with their FFR.
Data on the diagnostic accuracy of CAAS vFFR were limited to only three studies. Owing to variablereporting of results and apparent substantial heterogeneity in results across studies, a full meta-analysis was not feasible.
Although assessing the diagnostic accuracy of using standard ICA alone was not the focus of thisreport, studies that reported data on ICA, and targeted searches for additional data, found that ICAalone had poor diagnostic accuracy when compared with FFR. All studies that compared QFR with ICAfound QFR to be superior in diagnostic accuracy.
Clinical value and implementationThis review found limited evidence on the clinical impact of using QFR. The use of a grey zone couldsignificantly reduce the proportion of adenosine and pressure-wire-free procedures compared withuniversal use of FFR, without significantly affecting diagnostic accuracy. Evidence on the applicability ofQAngio XA 3D/QFR suggests that the technology is applicable in a clinical context.
Given the limitations in the evidence, a simulation study was performed to investigate the impact ofusing QFR, with or without a grey zone, on future coronary events. The simulation found that usingQFR slightly increased the revascularisation rate compared with using FFR for all, from 40.2% to 42%.Using a grey-zone strategy increased it further to 43.2%. However, all three strategies had similarnumbers of resulting coronary events, suggesting that all have a broadly similar benefit when makingdecisions as to who should receive revascularisation.
Although CAAS vFFR appears promising, its clinical value is currently uncertain because of limitedevidence and a lack of on-site prospective studies.
DOI: 10.3310/hta25560 Health Technology Assessment 2021 Vol. 25 No. 56
© Queen’s Printer and Controller of HMSO 2021. This work was produced by Duarte et al. under the terms of a commissioning contract issued by the Secretary of Statefor Health and Social Care. This issue may be freely reproduced for the purposes of private research and study and extracts (or indeed, the full report) may be included inprofessional journals provided that suitable acknowledgement is made and the reproduction is not associated with any form of advertising. Applications for commercialreproduction should be addressed to: NIHR Journals Library, National Institute for Health Research, Evaluation, Trials and Studies Coordinating Centre, Alpha House,University of Southampton Science Park, Southampton SO16 7NS, UK.
101
Cost-effectivenessThe base-case cost-effectiveness results showed that the test strategy with the highest net benefit(most cost-effective strategy) was ICA followed by confirmatory FFR/iFR (strategy 2) at a cost-effectiveness threshold of £20,000 per QALY gained. However, the difference in net benefit betweenthis strategy and the next best strategies was relatively small at 0.007 QALYs (or equivalently £140)per patient diagnosed for ICA with QFR (strategy 3), 0.012 QALYs (or equivalently £240) per patientdiagnosed for ICA with QFR followed by confirmatory FFR/iFR when QFR is inconclusive (strategy 4)and 0.011 QALYs (or equivalently £220) per patient diagnosed for ICA with vFFR (strategy 5).
A number of alternative scenarios were considered in which the assumptions used as part of thebase-case results were varied. These alternative scenarios showed that the cost-effectiveness resultswere robust to the mode of QFR measurement (contrast-flow QFR or fixed-flow QFR), the use of analternative diagnostic threshold of 0.75 for FFR and QFR, the use of a wider definition of the grey-zone region for confirmatory FFR/iFR when QFR is inconclusive, throughput assumptions for QFR andvFFR, alternative estimates of procedural complication rates for FFR/iFR, and dependency of MACErisk on FFR. The scenarios were also used to identify the main drivers of cost-effectiveness. The keydrivers identified were (1) the sensitivity (rather than specificity) of test results because TP test resultstranslated into higher QALY gains than mismanagement of FN test results, (2) the procedural QALYloss associated with FFR/iFR, (3) the magnitude and duration of the QALY gains associated withrevascularisation and (4) the additional costs associated with confirmatory testing with FFR/iFR instrategy 4. Strategy 1 of ICA alone, without additional testing, appeared cost-effective relative tothe other strategies only when it was assumed that there were no benefits of revascularisation.
Overall, the differences in net benefit at a cost-effectiveness threshold of £20,000 per QALY betweenICA followed by confirmatory FFR/iFR (strategy 2), and ICA with QFR (strategy 3) are small in aninterventional setting. When considering a diagnostic-only setting, ICA with QFR may result in highernet benefit at a cost-effectiveness threshold of £20,000 per QALY than strategy 1, assuming QAngioXA 3D/QFR has similar diagnostic accuracy across settings.
Strengths and limitations of the assessment
StrengthsThis review includes a comprehensive systematic review of all the published literature on QFR asassessed by QAngio XA 3D/QFR and CAASS vFFR technologies, and has been conducted followingrecognised guidelines to ensure high quality.
The review identified a substantial literature on the diagnostic accuracy of QAngio XA 3D/QFR(37 studies and > 5000 patients) and, despite evidence of heterogeneity and variable quality in theevidence, future research is unlikely to significantly change the overall diagnostic accuracy reviewfindings. Study authors were contacted to provide additional data, and the review includes additionaldata from published studies and data from as yet unpublished studies.
This review has made best use of all available data, including extracting data from published figures,to maximise the range of analyses, including analysing the diagnostic impact of using a grey zone withQFR, and performing a simulation study to assess the clinical impact of QFR on future coronary events.To our knowledge, this goes beyond any previous review or meta-analysis in the field.
This is the first study, to our knowledge, to assess the cost-effectiveness of QAngio XA 3D/QFR andCAAS vFFR. The decision model comprehensively assessed both the short-term costs and consequencesassociated with diagnostic testing and the longer-term impact of treatment on both costs and consequencesto ensure that lifetime differences (e.g. the risk of major adverse cardiovascular events and HRQoLbenefits associated with revascularisations) were appropriately quantified.
DISCUSSION
NIHR Journals Library www.journalslibrary.nihr.ac.uk
102
LimitationsEvidence on the CAAS vFFR technology was limited to four studies, which varied in their reporting,and appeared to have heterogeneous results. This prevented any full meta-analyses of diagnosticaccuracy for CAAS vFFR or any assessment of its clinical effectiveness.
There were insufficient data allowing exploration of the impact of key patient characteristics (such asmultivessel disease or diabetes) on diagnostic accuracy or clinical effectiveness, so these could not befully investigated.
As is common in reviews of diagnostic tests, data beyond basic diagnostic accuracy, such data on theclinical impact of QAngio XA 3D/QFR, or its practical implementation, were extremely limited andcould not be fully reviewed. Although a simulation study was performed to address this, it was innatelylimited by having to make strong assumptions about the relevant population, and the risk of events,in that population.
The cost-effectiveness results for strategy 5 with vFFR must be interpreted with caution because ofvery limited data available from diagnostic accuracy studies of vFFR. The use of alternative diagnosticaccuracy estimates for vFFR highlighted the substantial uncertainty surrounding the cost-effectivenessof vFFR. The cost-effectiveness results were very sensitive to the procedural disutility assumed in themodel for FFR/iFR and the duration of HRQoL benefits associated with revascularisation.
Uncertainties
Although there is substantial evidence of the diagnostic accuracy of QFR assessment using QAngio, itremains largely unclear which patient or lesion characteristics might significantly affect the diagnosticaccuracy of QAngio XA 3D/QFR.
The clinical value of QAngio XA 3D/QFR to support decision-making on revascularisation remainsuncertain, particularly what impact it might have on preventing or causing future coronary events,and whether the 0.8 cut-off point, or the proposed grey zone, is clinically appropriate. However, itappears unlikely that its clinical value or use will differ substantially from widespread use of FFR.
Prospective evidence for the clinical benefit of QFR-guided PCI is lacking. Results from the large RCTsFAVOR III Europe–Japan142 (non-inferiority trial comparing QFR with standard FFR-guided PCI) andFAVOR III China143 (superiority trial comparing QFR with angiography-alone-guided PCI), with atarget recruitment of 2000 and 3860 and due to be completed in March 2022 and February 2023,respectively, will be informative.
Current evidence on CAAS vFFR is very limited, so its diagnostic accuracy, clinical value andcost-effectiveness are highly uncertain.
DOI: 10.3310/hta25560 Health Technology Assessment 2021 Vol. 25 No. 56
© Queen’s Printer and Controller of HMSO 2021. This work was produced by Duarte et al. under the terms of a commissioning contract issued by the Secretary of Statefor Health and Social Care. This issue may be freely reproduced for the purposes of private research and study and extracts (or indeed, the full report) may be included inprofessional journals provided that suitable acknowledgement is made and the reproduction is not associated with any form of advertising. Applications for commercialreproduction should be addressed to: NIHR Journals Library, National Institute for Health Research, Evaluation, Trials and Studies Coordinating Centre, Alpha House,University of Southampton Science Park, Southampton SO16 7NS, UK.
103

Chapter 7 Conclusions
Implications for health care
Clinical implicationsThe results of this review suggest that making revascularisation decisions using QFR as measured withQAngio XA 3D/QFR is preferable to making decisions based on DS assessment using standard ICA alone.
The high level of correlation between QFR and FFR, and the high level of diagnostic accuracy of QFR,suggest that QFR assessment could potentially replace FFR entirely, and hence remove the need forinvasive pressure wire and adenosine use. Simulations suggest that replacing FFR with QFR entirelymight slightly increase the number of patients who are revascularised, but would have minimal or noimpact on the incidence of coronary events.
The use of a grey zone, where patients with borderline QFR values proceed to a FFR assessment, wouldrequire around 20% of patients to have a FFR. However, for around 70% of these patients the FFRassessment would agree with the existing QFR assessment. The use of a grey zone might increase thenumber of patients being revascularised but would appear to have almost the same future incidence ofcoronary events as if FFR had been used in all patients.
The current evidence on CAAS vFFR appears to be too limited for it to be used in clinical practice atthis time.
Economic implicationsThe economic evidence suggests small differences in net benefit at a cost-effectiveness threshold of£20,000 per QALY between ICA followed by confirmatory FFR/iFR (strategy 2), and ICA with QFR(strategy 3) in an interventional setting. In a diagnostic-only setting, ICA with QFR may yield a highernet benefit at a cost-effectiveness threshold of £20,000 per QALY than ICA followed by confirmatoryFFR/iFR, provided that the diagnostic accuracy of QAngio XA 3D/QFR is comparable across settings.Therefore, the use of QAngio XA 3D/QFR in line with strategy 3 is potentially a good use of NHSresources, particularly in a diagnostic-only setting.
Suggested research priorities
The substantial existing evidence for diagnostic accuracy of QAngio XA 3D/QFR suggests that furtherstudies of diagnostic accuracy are not required. However, further prospective investigation of thediagnostic accuracy of QAngio XA 3D/QFR in patients with different lesion subtypes, includingbifurcation lesion and left main location stenoses, or with three-vessel disease, may be needed toconfirm trends reflected in existing evidence.
Large, prospective studies are required to assess the diagnostic accuracy and clinical feasibility ofCAAS vFFR. Ideally, these should compare CAAS vFFR with ICA assessment and, if possible, with QFR.
Randomised controlled trials are required to investigate whether or not the use of QFR-guided PCI (withor without a grey zone) results in improved clinical outcomes. Such studies should follow up patients forall key coronary events, including events caused by unnecessary revascularisation and report rates of andreasons for test failure in a clinical setting and in a wide range of patients with intermediate stenosis.Results from the FAVOR III Europe–Japan142 and FAVOR III China143 will be informative.
DOI: 10.3310/hta25560 Health Technology Assessment 2021 Vol. 25 No. 56
© Queen’s Printer and Controller of HMSO 2021. This work was produced by Duarte et al. under the terms of a commissioning contract issued by the Secretary of Statefor Health and Social Care. This issue may be freely reproduced for the purposes of private research and study and extracts (or indeed, the full report) may be included inprofessional journals provided that suitable acknowledgement is made and the reproduction is not associated with any form of advertising. Applications for commercialreproduction should be addressed to: NIHR Journals Library, National Institute for Health Research, Evaluation, Trials and Studies Coordinating Centre, Alpha House,University of Southampton Science Park, Southampton SO16 7NS, UK.
105

Acknowledgements
We would like to thank Dr Gerald Clesham for his helpful clinical advice during the project, andthe following authors of included studies for providing clarification or additional data: Professor
Andreas Baumbach, Dr Joost Daemen, Dr Tsunekazu Kakuta, Dr Paul Knaapen, Professor Jacek Legutko,Dr Catherine Liontou, Dr Ojas Mehta, Dr Kozo Okada and Dr Greta Žiubrytė. We would also like tothank Dr Marta Soares and Dr Robert Hodgson for providing valuable comments on aspects of theeconomic analysis.
Contributions of authors
Ana Duarte (https://orcid.org/0000-0002-0528-4773) (Research Fellow, Health Economist) developedthe economic model, contributed to the writing of the cost-effectiveness sections of the report and theeconomic analysis.
Alexis Llewellyn (https://orcid.org/0000-0003-4569-5136) (Research Fellow, Systematic Reviewer)contributed to the protocol, performed the systematic review and wrote most of the sections onclinical effectiveness.
Ruth Walker (https://orcid.org/0000-0003-2765-7363) (Research Fellow, Systematic Reviewer)contributed to the protocol, performed the systematic review and wrote the background andmethods sections.
Laetitia Schmitt (https://orcid.org/0000-0003-1052-488X) (Research Fellow, Health Economist)contributed to the development of the economic model and commented on drafts of the cost-effectiveness sections of the report.
Kath Wright (https://orcid.org/0000-0002-9020-1572) (Information Specialist) produced the databasesearch strategies and performed the searches.
Simon Walker (https://orcid.org/0000-0002-5750-3691) (Senior Research Fellow, Health Economist)contributed to the economic model development and commented on drafts of the cost-effectivenesssections of the report.
Claire Rothery (https://orcid.org/0000-0002-7759-4084) (Senior Research Fellow, Health Economist)contributed to the protocol, the writing of the cost-effectiveness sections, the economic analysis,economic model development and validation, and had overall responsibility for the cost-effectivenesssections of the report.
Mark Simmonds (https://orcid.org/0000-0002-1999-8515) (Senior Research Fellow, Statistician)contributed to the protocol, performed the meta-analyses and oversaw the conduct and writing of theclinical effectiveness sections and the report as a whole.
Data-sharing statement
This report does not include primary data. All data are taken from publications, as cited in the report.Full data extraction forms and the economic model are available from the corresponding author.
DOI: 10.3310/hta25560 Health Technology Assessment 2021 Vol. 25 No. 56
© Queen’s Printer and Controller of HMSO 2021. This work was produced by Duarte et al. under the terms of a commissioning contract issued by the Secretary of Statefor Health and Social Care. This issue may be freely reproduced for the purposes of private research and study and extracts (or indeed, the full report) may be included inprofessional journals provided that suitable acknowledgement is made and the reproduction is not associated with any form of advertising. Applications for commercialreproduction should be addressed to: NIHR Journals Library, National Institute for Health Research, Evaluation, Trials and Studies Coordinating Centre, Alpha House,University of Southampton Science Park, Southampton SO16 7NS, UK.
107

References
1. Brown L, Morris S, Neave A. Health Survey for England 2017: Adult Social Care. London: NHSDigital; 2018.
2. National Institute for Health and Care Excellence (NICE). Recent-onset Chest Pain of SuspectedCardiac Origin: Assessment and Diagnosis. Clinical Guideline [CG95]. URL: www.nice.org.uk/guidance/cg95 (accessed 26 May 2021).
3. National Institute for Health and Care Excellence (NICE). HeartFlow FFRCT for EstimatingFractional Flow Reserve from Coronary CT Angiography. Medical Technologies Guidance [MTG32].URL: www.nice.org.uk/guidance/mtg32 (accessed 26 May 2021).
4. Knuuti J, Wijns W, Saraste A, Capodanno D, Barbato E, Funck-Brentano C, et al. 2019 ESCGuidelines for the diagnosis and management of chronic coronary syndromes: the Task Forcefor the diagnosis and management of chronic coronary syndromes of the European Society ofCardiology (ESC). Eur Heart J 2020;41:407–77. https://doi.org/10.1093/eurheartj/ehz425
5. Fihn SD, Gardin JM, Abrams J, Berra K, Blankenship JC, Dallas AP, et al. 2012 ACCF/AHA/ACP/AATS/PCNA/SCAI/STS Guideline for the diagnosis and management of patients with stableischemic heart disease: a report of the American College of Cardiology Foundation/AmericanHeart Association Task Force on Practice Guidelines, and the American College of Physicians,American Association for Thoracic Surgery, Preventive Cardiovascular Nurses Association,Society for Cardiovascular Angiography and Interventions, and Society of Thoracic Surgeons.J Am Coll Cardiol 2012;60:e44–164. https://doi.org/10.1016/j.jacc.2012.07.013
6. National Institute for Health and Care Excellence (NICE). QAngio XA 3D/ QFR and CAAS vFFRImaging Software for Assessing the Functional Significance of Coronary Obstructions During InvasiveCoronary Angiography. Final Scope. London: NICE; 2019. URL: www.nice.org.uk/guidance/dg43/documents/final-scope (accessed 8 September 2021).
7. Moher D, Liberati A, Tetzlaff J, Altman DG, PRISMA Group. Preferred reporting items forsystematic reviews and meta-analyses: the PRISMA statement. PLOS Med 2009;6:e1000097.https://doi.org/10.1371/journal.pmed.1000097
8. Westra J, Tu S, Campo G, Qiao S, Matsuo H, Qu X, et al. Diagnostic performance of quantitativeflow ratio in prospectively enrolled patients: an individual patient-data meta-analysis. CatheterCardiovasc Interv 2019;94:693–701. https://doi.org/10.1002/ccd.28283
9. Götberg M, Christiansen EH, Gudmundsdottir IJ, Sandhall L, Danielewicz M, Jakobsen L, et al.Instantaneous wave-free ratio versus fractional flow reserve to guide PCI. N Engl J Med2017;376:1813–23. https://doi.org/10.1056/NEJMoa1616540
10. Reitsma JB, Glas AS, Rutjes AW, Scholten RJ, Bossuyt PM, Zwinderman AH. Bivariate analysisof sensitivity and specificity produces informative summary measures in diagnostic reviews.J Clin Epidemiol 2005;58:982–90. https://doi.org/10.1016/j.jclinepi.2005.02.022
11. Simmonds MC, Higgins JP. A general framework for the use of logistic regression modelsin meta-analysis. Stat Methods Med Res 2016;25:2858–77. https://doi.org/10.1177/0962280214534409
12. Rutter CM, Gatsonis CA. A hierarchical regression approach to meta-analysis of diagnostictest accuracy evaluations. Stat Med 2001;20:2865–84. https://doi.org/10.1002/sim.942
DOI: 10.3310/hta25560 Health Technology Assessment 2021 Vol. 25 No. 56
© Queen’s Printer and Controller of HMSO 2021. This work was produced by Duarte et al. under the terms of a commissioning contract issued by the Secretary of Statefor Health and Social Care. This issue may be freely reproduced for the purposes of private research and study and extracts (or indeed, the full report) may be included inprofessional journals provided that suitable acknowledgement is made and the reproduction is not associated with any form of advertising. Applications for commercialreproduction should be addressed to: NIHR Journals Library, National Institute for Health Research, Evaluation, Trials and Studies Coordinating Centre, Alpha House,University of Southampton Science Park, Southampton SO16 7NS, UK.
109
13. Ahn JM, Park DW, Shin ES, Koo BK, Nam CW, Doh JH, et al. Fractional flow reserve andcardiac events in coronary artery disease: data from a prospective IRIS-FFR Registry(Interventional Cardiology Research Incooperation Society Fractional Flow Reserve).Circulation 2017;135:2241–51. https://doi.org/10.1161/CIRCULATIONAHA.116.024433
14. Andersen BK, Vestergaard M-B, Andreasen LN, Tu S, Krusell L, Maeng M, et al. CRT-400.12Feasibility and diagnostic precision of in-procedure computed fractional flow reserve: thewire-free invasive functional imaging (WIFI) Study. JACC Cardiovasc Interv 2017;10:S51.https://doi.org/10.1016/j.jcin.2016.12.177
15. Asano T, Katagiri Y, Chang CC, Kogame N, Chichareon P, Takahashi K, et al. Angiography-derived fractional flow reserve in the SYNTAX II trial: feasibility, diagnostic performance ofquantitative flow ratio, and clinical prognostic value of functional SYNTAX score derivedfrom quantitative flow ratio in patients with 3-vessel disease. JACC Cardiovasc Interv2019;12:259–70. https://doi.org/10.1016/j.jcin.2018.09.023
16. Cliff Li KF, Ong PJL. TCTAP A-127 correlation of quantitative flow ratio assessment againstinstantaneous wave-free ratio in hemodynamic evaluation of coronary lesions. J Am CollCardiol 2019;73:S66. https://doi.org/10.1016/j.jacc.2019.03.173
17. Cortés C, Rodríguez-Gabella T, Gutiérrez H, Arnold R, Serrador AM, Ramos B, et al. Quantitativeflow ratio in myocardial infarction for the evaluation of non-infarct-related arteries. The QIMERApilot study. REC Interv Cardiol 2019;1:13–20 https://doi.org/10.24875/RECICE.M19000007
18. Daemen J, Masdjedi K, Balbi M, Nuis RJ, van Zandvoort L, Ligthart J, et al. Extended validationof novel 3-dimensional quantitative coronary angiography (3D-QCA) based software tocalculate vessel fractional flow reserve (vFFR): the FAST-EXTEND study. JACC CardiovascInterv 2019;12(Suppl.):S17. https://doi.org/10.1016/j.jcin.2019.01.066
19. Ely Pizzato P, Samdani AJ, Vergara-Martel A, Palma Dallan LA, Tensol Rodrigues Pereira G,Zago E, et al. Feasibility of coronary angiogram-derived vessel fractional flow reserve in thesetting of standard of care percutaneous coronary intervention and its correlation withinvasive FFR. Int J Cardiol 2019;301:45–9. https://doi.org/10.1016/j.ijcard.2019.10.054
20. Emori H, Kubo T, Kameyama T, Ino Y, Matsuo Y, Kitabata H, et al. Diagnostic accuracy ofquantitative flow ratio for assessing myocardial ischemia in prior myocardial infarction.Circ J 2018;82:807–14. https://doi.org/10.1253/circj.CJ-17-0949
21. Emori H, Kubo T, Kameyama T, Ino Y, Matsuo Y, Kitabata H, et al. Quantitative flow ratio andinstantaneous wave-free ratio for the assessment of the functional severity of intermediatecoronary artery stenosis. Coron Artery Dis 2018;29:611–17. https://doi.org/10.1097/MCA.0000000000000650
22. Goto S, Lauri F, Mejia-Renteria H, Liontou C, Lee H, Tanigaki T, et al. Angiography-DerivedFunctional Assessment of Left Main Coronary Stenoses. Paper presented at EuroPCR 2019,21–4 May 2019, Paris, France.
23. Hamaya R, Hoshino M, Kanno Y, Yamaguchi M, Ohya H, Sumino Y, et al. Prognosticimplication of three-vessel contrast-flow quantitative flow ratio in patients with stablecoronary artery disease. EuroIntervention 2019;15:180–8. https://doi.org/10.4244/EIJ-D-18-00896
24. Hwang D, Choi KH, Lee JM, Mejia-Renteria H, Kim J, Park J, et al. Diagnostic agreement ofquantitative flow ratio with fractional flow reserve and instantaneous wave-free ratio.J Am Heart Assoc 2019;8:e011605. https://doi.org/10.1161/JAHA.118.011605
25. Ishihara T, Takahara M, Tsujimura T, Kurata N, Iida O, Asai M, et al. Retrospective assessments ofintra- and inter-rater reliability of quantitative flow ratio. J Am Coll Cardiol 2019;73(Suppl. 1):1165.https://doi.org/10.1016/S0735-1097(19)31772-3
REFERENCES
NIHR Journals Library www.journalslibrary.nihr.ac.uk
110
26. Jin CY, Ramasamy A, Bourantas CV, Safi H, Kilic Y, Tufaro V, et al. Diagnostic accuracy ofquantitative flow ratio (QFR) and vessel fractional flow reserve (vFFR) compared withfractional flow reserve (FFR) based on 7.5 frames/second coronary angiography. Eur Heart J2019;40(Suppl. 1):1671. https://doi.org/10.1093/eurheartj/ehz748.1037
27. Kajita A, Bezerra CG, Ozaki Y, Dan K, Melaku GD, Pinton FA, et al. Comparison betweenfractional flow reserve (FFR) vs. computational fractional flow reserve derived fromthree-dimensional intravascular ultrasound (IVUSFR) and quantitative flow ratio (QFR).JACC Cardiovasc Interv 2019;12(Suppl.):S40. https://doi.org/10.1016/j.jcin.2019.01.146
28. Kameyama T, Kubo T, Emori H, Ino Y, Matsuo Y, Yamano T, et al. Usefulness of QFRmeasurement for non-culprit lesion of ACS patients. J Am Coll Cardiol 2016;68:B219.https://doi.org/10.1016/j.jacc.2016.09.679
29. Kanno Y, Hoshino M, Hamaya R, Sugiyama T, Kanaji Y, Usui E, et al. Functional classificationdiscordance in intermediate coronary stenoses between fractional flow reserve andangiography-based quantitative flow ratio. Open Heart 2020;7:e001179. https://doi.org/10.1136/openhrt-2019-001179
30. Kanno Y, Hoshino M, Sugano A, Kanaji Y, Yamaguchi M, Sumino Y, et al. Prognostic value ofcontrast-flow quantitative flow ratio in patients with revascularization deferral based onpreserved fractional flow reserve. J Am Coll Cardiol 2019;73(Suppl. 1):1171. https://doi.org/10.1016/S0735-1097(19)31778-4
31. Kirigaya H, Okada K, Hibi K, Akiyama E, Matsuzawa Y, Iwahashi N, et al. TCT-325 quantitativeflow ratio for assessment of nonculprit coronary lesions in patients with ST-segment elevationmyocardial infarction. J Am Coll Cardiol 2019;74(Suppl.):B323. https://doi.org/10.1016/j.jacc.2019.08.405
32. Kołtowski Ł, Zaleska M, Maksym J, Tomaniak M, Soliński M, Puchta D, et al. Quantitativeflow ratio derived from diagnostic coronary angiography in assessment of patients withintermediate coronary stenosis: a wire-free fractional flow reserve study. Clin Res Cardiol2018;107:858–67. https://doi.org/10.1007/s00392-018-1258-7
33. Kleczyński P, Dziewierz A, Rzeszutko L, Dudek D, Legutko J. Is quantitative flow ratio enoughto accurately assess intermediate coronary stenosis? A comparison study with fractional flowreserve. Cardiol J 2019;26:793–5. https://doi.org/10.5603/CJ.2019.0116
34. Liontou C, Mejía-Renteria H, Lauri FM, Goto S, Lee HJ, Nakayama M, et al. Quantitative flowratio for functional evaluation of in-stent restenosis. EuroIntervention 2021;17:e396–8.
35. Liu T, Somi S, Bleeker G, Gotte M. Functional Assessment of Coronary Stenoses by QuantitativeFlow Ratio: A Non-Invasive Alternative for Standard Fractional Flow Reserve. Paper presented atthe European Society of Cardiology Congress 2017, 20–26 August 2017, Barcelona, Spain.https://doi.org/10.1093/eurheartj/ehx502.P2375
36. Mehta O, Hay M, Ihdayhid AR, Cameron J, Wong D. TCT-333 Comparison of diagnosticaccuracy between quantitative flow ratio, instantaneous wave-free ratio and DILEMMA scoreagainst fractional flow reserve. J Am Coll Cardiol 2019;74(Suppl.):B331. https://doi.org/10.1016/j.jacc.2019.08.414
37. Mejia-Renteria H, Lauri FM, Lee JM, McInerney A, van der Hoeven NW, de Waard GA, et al.Interindividual variations in the adenosine-induced hemodynamics during fractional flow reserveevaluation: implications for the use of quantitative flow ratio in assessing intermediate coronarystenoses. J Am Heart Assoc 2019;8:e012906. https://doi.org/10.1161/JAHA.119.012906
38. Neylon A, Roy A, Hovasse T, Chevalier B, Garot P, Benamer H, et al. Novel non-invasivequantitative flow ratio for estimating fractional flow reserve. J Am Coll Cardiol2016;68(Suppl.):B210. https://doi.org/10.1016/j.jacc.2016.09.658
DOI: 10.3310/hta25560 Health Technology Assessment 2021 Vol. 25 No. 56
© Queen’s Printer and Controller of HMSO 2021. This work was produced by Duarte et al. under the terms of a commissioning contract issued by the Secretary of Statefor Health and Social Care. This issue may be freely reproduced for the purposes of private research and study and extracts (or indeed, the full report) may be included inprofessional journals provided that suitable acknowledgement is made and the reproduction is not associated with any form of advertising. Applications for commercialreproduction should be addressed to: NIHR Journals Library, National Institute for Health Research, Evaluation, Trials and Studies Coordinating Centre, Alpha House,University of Southampton Science Park, Southampton SO16 7NS, UK.
111
39. Sato Y, Tanaka T, Koseki K, Okuno T, Koike H, Sato K, et al. Comparison Between Quantitative FlowRatio and Fractional Flow Reserve in Intermediate Coronary Stenosis. Journal of the American Collegeof Cardiology Conference: 67th Annual Scientific Session of the American College of Cardiology,10–12 March 2018, Orlando, FL, USA. https://doi.org/10.1016/S0735-1097(18)31722-4
40. Smit JM, Koning G, van Rosendael AR, El Mahdiui M, Mertens BJ, Schalij MJ, et al. Referral ofpatients for fractional flow reserve using quantitative flow ratio. Eur Heart J Cardiovasc Imaging2019;20:1231–8. https://doi.org/10.1093/ehjci/jey187
41. Spitaleri G, Tebaldi M, Biscaglia S, Westra J, Brugaletta S, Erriquez A, et al. Quantitativeflow ratio identifies nonculprit coronary lesions requiring revascularization in patients withST-segment-elevation myocardial infarction and multivessel disease. Circ Cardiovasc Interv2018;11:e006023. https://doi.org/10.1161/CIRCINTERVENTIONS.117.006023
42. Stähli BE, Erbay A, Steiner J, Klotsche J, Mochmann HC, Skurk C, et al. Comparison of restingdistal to aortic coronary pressure with angiography-based quantitative flow ratio. Int J Cardiol2019;279:12–17. https://doi.org/10.1016/j.ijcard.2018.11.093
43. Ties D, van Dijk R, Pundziute G, Lipsic E, Vonck TE, van den Heuvel AFM, et al. Computationalquantitative flow ratio to assess functional severity of coronary artery stenosis. Int J Cardiol2018;271:36–41. https://doi.org/10.1016/j.ijcard.2018.05.002
44. Toi S, Iijima R, Hara H, Nakamura M. Usefulness of contrast FFR and Quantitative Flow Ratio(QFR) in intermediate coronary artery stenosis. Eur Heart J 2018;39(Suppl.):759–60.https://doi.org/10.1093/eurheartj/ehy563.P3653
45. Tu S, Barbato E, Köszegi Z, Yang J, Sun Z, Holm NR, et al. Fractional flow reserve calculationfrom 3-dimensional quantitative coronary angiography and TIMI frame count: a fast computermodel to quantify the functional significance of moderately obstructed coronary arteries.JACC Cardiovasc Interv 2014;7:768–77. https://doi.org/10.1016/j.jcin.2014.03.004
46. Tu S, Westra J, Yang J, von Birgelen C, Ferrara A, Pellicano M, et al. Diagnostic accuracy offast computational approaches to derive fractional flow reserve from diagnostic coronaryangiography: the international multicenter FAVOR pilot study. JACC Cardiovasc Interv2016;9:2024–35. https://doi.org/10.1016/j.jcin.2016.07.013
47. Van Diemen PAA, Driessen RS, Kooistra RA, Stuijfzand WJ, Raijmakers PG, Schumacher SP,et al. A comparison between the diagnostic performance of quantitative flow ratio andnon-invasive imaging modalities for diagnosing myocardial ischemia defined by FFR,a PACIFIC-trial interim analysis. Eur Heart J 2019;40(Suppl.):716. https://doi.org/10.1093/eurheartj/ehz748.0038
48. van Rosendael AR, Koning G, Dimitriu-Leen AC, Smit JM, Montero-Cabezas JM, van der Kley F,et al. Accuracy and reproducibility of fast fractional flow reserve computation from invasivecoronary angiography. Int J Cardiovasc Imaging 2017;33:1305–12. https://doi.org/10.1007/s10554-017-1190-3
49. Watarai M, Otsuka M, Yazaki K, Inagaki Y, Kahata M, Kumagai A, et al. Applicability of quantitativeflow ratio for rapid evaluation of intermediate coronary stenosis: comparison with instantaneouswave-free ratio in clinical practice. Int J Cardiovasc Imaging 2019;35:1963–9. https://doi.org/10.1007/s10554-019-01656-z
50. Westra J, Andersen BK, Campo G, Matsuo H, Koltowski L, Eftekhari A, et al. Diagnosticperformance of in-procedure angiography-derived quantitative flow reserve compared withpressure-derived fractional flow reserve: the FAVOR II Europe–Japan study. J Am Heart Assoc2018;7:e009603. https://doi.org/10.1161/JAHA.118.009603
REFERENCES
NIHR Journals Library www.journalslibrary.nihr.ac.uk
112
51. Westra J, Tu S, Winther S, Nissen L, Vestergaard MB, Andersen BK, et al. Evaluation ofcoronary artery stenosis by quantitative flow ratio during invasive coronary angiography:the WIFI II Study (Wire-Free Functional Imaging II). Circ Cardiovasc Imaging 2018;11:e007107.https://doi.org/10.1161/CIRCIMAGING.117.007107
52. Xu B, Tu S, Qiao S, Qu X, Chen Y, Yang J, et al. Diagnostic accuracy of angiography-basedquantitative flow ratio measurements for online assessment of coronary stenosis. J Am CollCardiol 2017;70:3077–87. https://doi.org/10.1016/j.jacc.2017.10.035
53. Yazaki K, Otsuka M, Kataoka S, Kahata M, Kumagai A, Inoue K, et al. Applicability of3-dimensional quantitative coronary angiography-derived computed fractional flow reservefor intermediate coronary stenosis. Circ J 2017;81:988–92. https://doi.org/10.1253/circj.CJ-16-1261
54. Ziubryte G, Jarusevicius G, Unikas R. Agreement between Quantitative Flow Ratio and FFR inAssessment of Functional Significance of Intermediate Coronary Artery Stenosis. Paper presentedat EuroPCR 2019, 21–24 May 2019, Paris, France.
55. Legutko J, Kleczynski P, Dziewierz A, Rzeszutko L, Bartus S, Bagienski M, et al. Correlationbetween quantitative flow ratio (QFR) and fractional flow reserve (FFR). Eur Heart J2017;38(Suppl.):481–2. https://doi.org/10.1093/eurheartj/ehx502.P2378
56. Masdjedi K, van Zandvoort LJC, Balbi MM, Gijsen FJH, Ligthart JMR, Rutten MCM, et al.Validation of 3-dimensional quantitative coronary angiography based software to calculatefractional flow reserve: fast assessment of stenosis severity (FAST)-study. EuroIntervention2020;16:591–9 https://doi.org/10.4244/EIJ-D-19-00466
57. Mejia-Renteria H, Lee JM, Lauri F, van der Hoeven NW, de Waard GA, Macaya F, et al. Influenceof microcirculatory dysfunction on angiography-based functional assessment of coronary stenoses.JACC Cardiovasc Interv 2018;11:741–53. https://doi.org/10.1016/j.jcin.2018.02.014
58. Smit JM, El Mahdiui M, van Rosendael AR, Jukema JW, Koning G, Reiber JHC, et al.Comparison of diagnostic performance of quantitative flow ratio in patients with versuswithout diabetes mellitus. Am J Cardiol 2019;123:1722–8. https://doi.org/10.1016/j.amjcard.2019.02.035
59. Kappetein AP, Feldman TE, Mack MJ, Morice MC, Holmes DR, Ståhle E, et al. Comparison ofcoronary bypass surgery with drug-eluting stenting for the treatment of left main and/orthree-vessel disease: 3-year follow-up of the SYNTAX trial. Eur Heart J 2011;32:2125–34.https://doi.org/10.1093/eurheartj/ehr213
60. Erbay A, Steiner J, Lauten A, Landmesser U, Leistner DM, Stahli BE. Assessment of intermediatecoronary lesions by fractional flow reserve and quantitative flow ratio in patients with small-vessel disease. Catheter Cardiovasc Interv 2020;96:743–51. https://doi.org/10.1002/ccd.28531
61. Kołtowski L, Maksym J, Zaleska M, Tomaniak M, Puchta D, Opolski G, et al. Diagnosticaccuracy of quantitative flow ratio – a wire-free fractional flow reserve derived fromdiagnostic coronary angiography. Circulation 2017;136:A20077.
62. Ding D, Yang J, Westra J, Chen Y, Chang Y, Sejr-Hansen M, et al. Accuracy of 3-dimensionaland 2-dimensional quantitative coronary angiography for predicting physiological significanceof coronary stenosis: a FAVOR II substudy. Cardiovasc Diagn Ther 2019;9:481–91. https://doi.org/10.21037/cdt.2019.09.07
63. Kim HY, Lim HS, Doh JH, Nam CW, Shin ES, Koo BK, et al. Physiological severity of coronaryartery stenosis depends on the amount of myocardial mass subtended by the coronary artery.JACC Cardiovasc Interv 2016;9:1548–60. https://doi.org/10.1016/j.jcin.2016.04.008
DOI: 10.3310/hta25560 Health Technology Assessment 2021 Vol. 25 No. 56
© Queen’s Printer and Controller of HMSO 2021. This work was produced by Duarte et al. under the terms of a commissioning contract issued by the Secretary of Statefor Health and Social Care. This issue may be freely reproduced for the purposes of private research and study and extracts (or indeed, the full report) may be included inprofessional journals provided that suitable acknowledgement is made and the reproduction is not associated with any form of advertising. Applications for commercialreproduction should be addressed to: NIHR Journals Library, National Institute for Health Research, Evaluation, Trials and Studies Coordinating Centre, Alpha House,University of Southampton Science Park, Southampton SO16 7NS, UK.
113
64. Mejia-Renteria H, Lauri F, Lee JM, Van Der Hoeven N, De Waard G, De Hoyos A, et al.Implementation of computational fluid dynamics increases the diagnostic performance ofangiography-derived indices of stenosis severity. J Am Coll Cardiol 2017;70(Suppl.):B74–5.https://doi.org/10.1016/j.jacc.2017.09.242
65. Sejr-Hansen M, Westra J, Winther S, Tu S, Nissen L, Gormsen L, et al. Comparison ofquantitative flow ratio and fractional flow reserve with myocardial perfusion scintigraphyand cardiovascular magnetic resonance as reference standard. A Dan-NICAD substudy.Int J Cardiovasc Imaging 2020;36:395–402. https://doi.org/10.1007/s10554-019-01737-z
66. Sabaté M, Brugaletta S, Cequier A, Iñiguez A, Serra A, Jiménez-Quevedo P, et al. Clinicaloutcomes in patients with ST-segment elevation myocardial infarction treated witheverolimus-eluting stents versus bare-metal stents (EXAMINATION): 5-year results of arandomised trial. Lancet 2016;387:357–66. https://doi.org/10.1016/S0140-6736(15)00548-6
67. van Diemen P, Driessen R, Stuijfzand W, Schumacher S, Bom M, Everaars H, et al. TCT-112comparison between the diagnostic performance of quantitative flow ratio and myocardialperfusion imaging for detecting myocardial ischemia. J Am Coll Cardiol 2019;74(Suppl.):B112.https://doi.org/10.1016/j.jacc.2019.08.158
68. Bertoldi EG, Stella SF, Rohde LE, Polanczyk CA. Long-term cost-effectiveness of diagnostictests for assessing stable chest pain: modeled analysis of anatomical and functional strategies.Clin Cardiol 2016;39:249–56. https://doi.org/10.1002/clc.22532
69. Amemiya S, Takao H. Computed tomographic coronary angiography for diagnosing stablecoronary artery disease: a cost-utility and cost-effectiveness analysis. Circ J 2009;73:1263–70.https://doi.org/10.1253/circj.CJ-08-1186
70. Min JK, Gilmore A, Jones EC, Berman DS, Stuijfzand WJ, Shaw LJ, et al. Cost-effectiveness ofdiagnostic evaluation strategies for individuals with stable chest pain syndrome and suspectedcoronary artery disease. Clin Imaging 2017;43:97–105. https://doi.org/10.1016/j.clinimag.2017.01.015
71. Burgers LT, Redekop WK, Al MJ, Lhachimi SK, Armstrong N, Walker S, et al. Cost-effectivenessanalysis of new generation coronary CT scanners for difficult-to-image patients. Eur J HealthEcon 2017;18:731–42. https://doi.org/10.1007/s10198-016-0824-z
72. Pletscher M, Walker S, Moschetti K, Pinget C, Wasserfallen JB, Greenwood JP, et al.Cost-effectiveness of functional cardiac imaging in the diagnostic work-up of coronaryheart disease. Eur Heart J Qual Care Clin Outcomes 2016;2:201–7. https://doi.org/10.1093/ehjqcco/qcw008
73. Lee SP, Jang EJ, Kim YJ, Cha MJ, Park SY, Song HJ, et al. Cost-effectiveness of coronary CTangiography in patients with chest pain: comparison with myocardial single photon emissiontomography. J Cardiovasc Comput Tomogr 2015;9:428–37. https://doi.org/10.1016/j.jcct.2015.02.008
74. Genders TS, Petersen SE, Pugliese F, Dastidar AG, Fleischmann KE, Nieman K, Hunink MG.The optimal imaging strategy for patients with stable chest pain: a cost-effectiveness analysis.Ann Intern Med 2015;162:474–84. https://doi.org/10.7326/M14-0027
75. Goeree R, Blackhouse G, Bowen JM, O’Reilly D, Sutherland S, Hopkins R, et al. Cost-effectivenessof 64-slice CT angiography compared with conventional coronary angiography based on acoverage with evidence development study in Ontario. Expert Rev Pharmacoecon Outcomes Res2013;13:675–90. https://doi.org/10.1586/14737167.2013.838079
76. Espinosa G, Annapragada A. Cost-effectiveness of a novel blood-pool contrast agent in thesetting of chest pain evaluation in an emergency department. AJR Am J Roentgenol2013;201:710–19. https://doi.org/10.2214/AJR.12.9946
REFERENCES
NIHR Journals Library www.journalslibrary.nihr.ac.uk
114
77. Walker S, Girardin F, McKenna C, Ball SG, Nixon J, Plein S, et al. Cost-effectiveness ofcardiovascular magnetic resonance in the diagnosis of coronary heart disease: an economicevaluation using data from the CE-MARC study. Heart 2013;99:873–81. https://doi.org/10.1136/heartjnl-2013-303624
78. Boldt J, Leber AW, Bonaventura K, Sohns C, Stula M, Huppertz A, et al. Cost-effectiveness ofcardiovascular magnetic resonance and single-photon emission computed tomography fordiagnosis of coronary artery disease in Germany. J Cardiovasc Magn Reson 2013;15:30.https://doi.org/10.1186/1532-429X-15-30
79. Westwood M, Al M, Burgers L, Redekop K, Lhachimi S, Armstrong N, et al. A systematicreview and economic evaluation of new-generation computed tomography scanners forimaging in coronary artery disease and congenital heart disease: Somatom Definition Flash,Aquilion ONE, Brilliance iCT and Discovery CT750 HD. Health Technol Assess 2013;17(9).https://doi.org/10.3310/hta17090
80. Priest VL, Scuffham PA, Hachamovitch R, Marwick TH. Cost-effectiveness of coronarycomputed tomography and cardiac stress imaging in the emergency department: a decisionanalytic model comparing diagnostic strategies for chest pain in patients at low risk of acutecoronary syndromes. JACC Cardiovasc Imaging 2011;4:549–56. https://doi.org/10.1016/j.jcmg.2011.03.008
81. Min JK, Gilmore A, Budoff MJ, Berman DS, O’Day K. Cost-effectiveness of coronary CT angiographyversus myocardial perfusion SPECT for evaluation of patients with chest pain and no knowncoronary artery disease. Radiology 2010;254:801–8. https://doi.org/10.1148/radiol.09090349
82. Ladapo JA, Jaffer FA, Hoffmann U, Thomson CC, Bamberg F, Dec W, et al. Clinical outcomesand cost-effectiveness of coronary computed tomography angiography in the evaluationof patients with chest pain. J Am Coll Cardiol 2009;54:2409–22. https://doi.org/10.1016/j.jacc.2009.10.012
83. Genders TS, Meijboom WB, Meijs MF, Schuijf JD, Mollet NR, Weustink AC, et al. CT coronaryangiography in patients suspected of having coronary artery disease: decision making fromvarious perspectives in the face of uncertainty. Radiology 2009;253:734–44. https://doi.org/10.1148/radiol.2533090507
84. Kreisz FP, Merlin T, Moss J, Atherton J, Hiller JE, Gericke CA. The pre-test risk stratifiedcost-effectiveness of 64-slice computed tomography coronary angiography in the detection ofsignificant obstructive coronary artery disease in patients otherwise referred to invasive coronaryangiography. Heart Lung Circ 2009;18:200–7. https://doi.org/10.1016/j.hlc.2008.10.013
85. Hernández R, Vale L. The value of myocardial perfusion scintigraphy in the diagnosis andmanagement of angina and myocardial infarction: a probabilistic economic analysis. Med DecisMaking 2007;27:772–88. https://doi.org/10.1177/0272989X07306111
86. Mowatt G, Vale L, Brazzelli M, Hernandez R, Murray A, Scott N, et al. Systematic review ofthe effectiveness and cost-effectiveness, and economic evaluation, of myocardial perfusionscintigraphy for the diagnosis and management of angina and myocardial infarction. HealthTechnol Assess 2004;8(30). https://doi.org/10.3310/hta8300
87. Fearon WF, Yeung AC, Lee DP, Yock PG, Heidenreich PA. Cost-effectiveness of measuringfractional flow reserve to guide coronary interventions. Am Heart J 2003;145:882–7.https://doi.org/10.1016/S0002-8703(03)00072-3
88. Hayashino Y, Nagata-Kobayashi S, Morimoto T, Maeda K, Shimbo T, Fukui T. Cost-effectivenessof screening for coronary artery disease in asymptomatic patients with type 2 diabetes andadditional atherogenic risk factors. J Gen Intern Med 2004;19:1181–91. https://doi.org/10.1111/j.1525-1497.2004.40012.x
DOI: 10.3310/hta25560 Health Technology Assessment 2021 Vol. 25 No. 56
© Queen’s Printer and Controller of HMSO 2021. This work was produced by Duarte et al. under the terms of a commissioning contract issued by the Secretary of Statefor Health and Social Care. This issue may be freely reproduced for the purposes of private research and study and extracts (or indeed, the full report) may be included inprofessional journals provided that suitable acknowledgement is made and the reproduction is not associated with any form of advertising. Applications for commercialreproduction should be addressed to: NIHR Journals Library, National Institute for Health Research, Evaluation, Trials and Studies Coordinating Centre, Alpha House,University of Southampton Science Park, Southampton SO16 7NS, UK.
115
89. Greenwood JP, Maredia N, Younger JF, Brown JM, Nixon J, Everett CC, et al. Cardiovascularmagnetic resonance and single-photon emission computed tomography for diagnosis of coronaryheart disease (CE-MARC): a prospective trial. Lancet 2012;379:453–60. https://doi.org/10.1016/S0140-6736(11)61335-4
90. Briggs A, Mihaylova B, Sculpher M, Hall A, Wolstenholme J, Simoons M, et al. Cost effectivenessof perindopril in reducing cardiovascular events in patients with stable coronary artery diseaseusing data from the EUROPA study. Heart 2007;93:1081–6. https://doi.org/10.1136/hrt.2005.086728
91. Boden WE, O’Rourke RA, Teo KK, Hartigan PM, Maron DJ, Kostuk WJ, et al. Optimal medicaltherapy with or without PCI for stable coronary disease. N Engl J Med 2007;356:1503–16.https://doi.org/10.1056/NEJMoa070829
92. National Institute for Health and Care Excellence (NICE). Guide to the Methods of TechnologyAppraisal. London: NICE; 2013.
93. Andrew B, Sculpher M, Claxton K. Decision Modelling for Health Economic Evaluation. Oxford:Oxford University Press; 2006.
94. National Institute for Health and Care Excellence. Chest Pain Overview. 2020. URL:http://pathways.nice.org.uk/pathways/chest-pain (accessed 6 April 2020).
95. Maron DJ, Hochman JS, Reynolds HR, Bangalore S, O’Brien SM, Boden WE, et al. Initial invasiveor conservative strategy for stable coronary disease. N Engl J Med 2020;382:1395–407.https://doi.org/10.1056/NEJMoa1915922
96. Mori Brooks M, Barsness G, Chaitman B, Chung S-C, Faxon D, Feit F, et al. Baseline characteristicsof patients with diabetes and coronary artery disease enrolled in the Bypass AngioplastyRevascularization Investigation 2 Diabetes (BARI 2D) trial. Am Heart J 2008;156:528–36,536.e1–5. https://doi.org/10.1016/j.ahj.2008.05.015
97. Al-Lamee R, Thompson D, Dehbi HM, Sen S, Tang K, Davies J, et al. Percutaneous coronaryintervention in stable angina (ORBITA): a double-blind, randomised controlled trial. Lancet2018;391:31–40. https://doi.org/10.1016/S0140-6736(17)32714-9
98. Ludman PF. BCIS National Audit. Adult Interventional Procedures 1st April 2018 to 31st March2019. Lutterworth; British Cardiovascular Intervention Society: 2020.
99. Ludman PF. BCIS Audit Returns Adult Interventional Procedures 2017–18. Lutterworth; BritishCardiovascular Intervention Society: 2019.
100. Danad I, Szymonifka J, Twisk JWR, Norgaard BL, Zarins CK, Knaapen P, Min JK. Diagnosticperformance of cardiac imaging methods to diagnose ischaemia-causing coronary arterydisease when directly compared with fractional flow reserve as a reference standard:a meta-analysis. Eur Heart J 2017;38:991–8. https://doi.org/10.1093/eurheartj/ehw095
101. Curzen N, Rana O, Nicholas Z, Golledge P, Zaman A, Oldroyd K, et al. Does routine pressurewire assessment influence management strategy at coronary angiography for diagnosis ofchest pain? The RIPCORD study. Circ Cardiovasc Interv 2014;7:248–55. https://doi.org/10.1161/CIRCINTERVENTIONS.113.000978
102. National Institute for Cardiovascular Outcomes Research. National Adult Cardiac Surgery Audit2019. Summary Report (2015/16–2017/18 Data). London: Healthcare Quality ImprovementProgramme; 2019.
103. National Institute for Cardiovascular Outcomes Research. 2019 NCAP Annual Report. ImprovingCardiovascular Outcomes: Timely, Specialist, Evidence-Based Care. London: Healthcare QualityImprovement Partnership; 2019.
REFERENCES
NIHR Journals Library www.journalslibrary.nihr.ac.uk
116
104. Johnson NP, Tóth GG, Lai D, Zhu H, Açar G, Agostoni P, et al. Prognostic value of fractional flowreserve: linking physiologic severity to clinical outcomes. J Am Coll Cardiol 2014;64:1641–54.https://doi.org/10.1016/j.jacc.2014.07.973
105. Bangalore S, Toklu B, Amoroso N, Fusaro M, Kumar S, Hannan EL, et al. Bare metal stents,durable polymer drug eluting stents, and biodegradable polymer drug eluting stents forcoronary artery disease: mixed treatment comparison meta-analysis. BMJ 2013;347:f6625.https://doi.org/10.1136/bmj.f6625
106. Pfisterer M. Trial of invasive versus medical therapy in the elderly (TIME). Heart Drug2001;1:144–47. https://doi.org/10.1159/000048951
107. Hueb W, Lopes NH, Gersh BJ, Soares P, Machado LA, Jatene FB, et al. Five-year follow-up ofthe Medicine, Angioplasty, or Surgery Study (MASS II): a randomized controlled clinical trial of3 therapeutic strategies for multivessel coronary artery disease. Circulation 2007;115:1082–9.https://doi.org/10.1161/CIRCULATIONAHA.106.625475
108. Frye RL, August P, Brooks MM, Hardison RM, Kelsey SF, MacGregor JM, et al. A randomized trialof therapies for type 2 diabetes and coronary artery disease. N Engl J Med 2009;360:2503–15.https://doi.org/10.1056/NEJMoa0805796
109. De Bruyne B, Fearon WF, Pijls NH, Barbato E, Tonino P, Piroth Z, et al. Fractional flowreserve-guided PCI for stable coronary artery disease. N Engl J Med 2014;371:1208–17.https://doi.org/10.1056/NEJMoa1408758
110. Bech GJ, De Bruyne B, Pijls NH, de Muinck ED, Hoorntje JC, Escaned J, et al. Fractional flowreserve to determine the appropriateness of angioplasty in moderate coronary stenosis:a randomized trial. Circulation 2001;103:2928–34. https://doi.org/10.1161/01.cir.103.24.2928
111. Nishigaki K, Yamazaki T, Kitabatake A, Yamaguchi T, Kanmatsuse K, Kodama I, et al.Percutaneous coronary intervention plus medical therapy reduces the incidence of acutecoronary syndrome more effectively than initial medical therapy only among patients withlow-risk coronary artery disease a randomized, comparative, multicenter study. JACCCardiovasc Interv 2008;1:469–79. https://doi.org/10.1016/j.jcin.2008.08.002
112. Schömig A, Mehilli J, de Waha A, Seyfarth M, Pache J, Kastrati A. A meta-analysis of 17randomized trials of a percutaneous coronary intervention-based strategy in patients withstable coronary artery disease. J Am Coll Cardiol 2008;52:894–904. https://doi.org/10.1016/j.jacc.2008.05.051
113. Jeremias A, Kaul S, Rosengart TK, Gruberg L, Brown DL. The impact of revascularization onmortality in patients with nonacute coronary artery disease. Am J Med 2009;122:152–61.https://doi.org/10.1016/j.amjmed.2008.07.027
114. Trikalinos TA, Alsheikh-Ali AA, Tatsioni A, Nallamothu BK, Kent DM. Percutaneous coronaryinterventions for non-acute coronary artery disease: a quantitative 20-year synopsis and a networkmeta-analysis. Lancet 2009;373:911–18. https://doi.org/10.1016/S0140-6736(09)60319-6
115. Thomas S, Gokhale R, Boden WE, Devereaux PJ. A meta-analysis of randomized controlledtrials comparing percutaneous coronary intervention with medical therapy in stable anginapectoris. Can J Cardiol 2013;29:472–82. https://doi.org/10.1016/j.cjca.2012.07.010
116. Chacko L, P Howard J, Rajkumar C, Nowbar AN, Kane C, Mahdi D, et al. Effects of percutaneouscoronary intervention on death and myocardial infarction stratified by stable and unstablecoronary artery disease: a meta-analysis of randomized controlled trials. Circ Cardiovasc QualOutcomes 2020;13:e006363. https://doi.org/10.1161/CIRCOUTCOMES.119.006363
DOI: 10.3310/hta25560 Health Technology Assessment 2021 Vol. 25 No. 56
© Queen’s Printer and Controller of HMSO 2021. This work was produced by Duarte et al. under the terms of a commissioning contract issued by the Secretary of Statefor Health and Social Care. This issue may be freely reproduced for the purposes of private research and study and extracts (or indeed, the full report) may be included inprofessional journals provided that suitable acknowledgement is made and the reproduction is not associated with any form of advertising. Applications for commercialreproduction should be addressed to: NIHR Journals Library, National Institute for Health Research, Evaluation, Trials and Studies Coordinating Centre, Alpha House,University of Southampton Science Park, Southampton SO16 7NS, UK.
117

117. Windecker S, Stortecky S, Stefanini GG, da Costa BR, daCosta BR, Rutjes AW, et al.Revascularisation versus medical treatment in patients with stable coronary artery disease:network meta-analysis. BMJ 2014;348:g3859. https://doi.org/10.1136/bmj.g3859
118. Stergiopoulos K, Boden WE, Hartigan P, Möbius-Winkler S, Hambrecht R, Hueb W, et al.Percutaneous coronary intervention outcomes in patients with stable obstructive coronaryartery disease and myocardial ischemia: a collaborative meta-analysis of contemporaryrandomized clinical trials. JAMA Intern Med 2014;174:232–40. https://doi.org/10.1001/jamainternmed.2013.12855
119. Pursnani S, Korley F, Gopaul R, Kanade P, Chandra N, Shaw RE, Bangalore S. Percutaneouscoronary intervention versus optimal medical therapy in stable coronary artery disease:a systematic review and meta-analysis of randomized clinical trials. Circ Cardiovasc Interv2012;5:476–90. https://doi.org/10.1161/CIRCINTERVENTIONS.112.970954
120. Office for National Statistics. National Life Tables: England and Wales. 2019. URL: www.ons.gov.uk/peoplepopulationandcommunity/birthsdeathsandmarriages/lifeexpectancies/datasets/nationallifetablesenglandandwalesreferencetables (accessed February 2020).
121. Office for National Statistics. Mortality Statistics – Underlying Cause, Sex and Age. URL: www.nomisweb.co.uk/query/construct/summary.asp?mode=construct%26version=0%26dataset=161(accessed February 2020).
122. McGeoch RJ, Oldroyd KG. Pharmacological options for inducing maximal hyperaemia duringstudies of coronary physiology. Catheter Cardiovasc Interv 2008;71:198–204. https://doi.org/10.1002/ccd.21307
123. Spicuzza L, Di Maria G, Polosa R. Adenosine in the airways: implications and applications.Eur J Pharmacol 2006;533:77–88. https://doi.org/10.1016/j.ejphar.2005.12.056
124. Schlundt C, Bietau C, Klinghammer L, Wiedemann R, Rittger H, Ludwig J, Achenbach S.Comparison of intracoronary versus intravenous administration of adenosine for measurementof coronary fractional flow reserve. Circ Cardiovasc Interv 2015;8:e001781. https://doi.org/10.1161/CIRCINTERVENTIONS.114.001781
125. Rudzinski W, Waller AH, Rusovici A, Dehnee A, Nasur A, Benz M, et al. Comparison of efficacyand safety of intracoronary sodium nitroprusside and intravenous adenosine for assessingfractional flow reserve. Catheter Cardiovasc Interv 2013;81:540–4. https://doi.org/10.1002/ccd.24652
126. Bagust A, Grayson AD, Palmer ND, Perry RA, Walley T. Cost effectiveness of drug elutingcoronary artery stenting in a UK setting: cost–utility study. Heart 2006;92:68–74.https://doi.org/10.1136/hrt.2004.053850
127. Favarato ME, Hueb W, Boden WE, Lopes N, Nogueira CR, Takiuti M, et al. Quality of life inpatients with symptomatic multivessel coronary artery disease: a comparative post hoc analysesof medical, angioplasty or surgical strategies – MASS II trial. Int J Cardiol 2007;116:364–70.https://doi.org/10.1016/j.ijcard.2006.06.001
128. Weintraub WS, Boden WE, Zhang Z, Kolm P, Zhang Z, Spertus JA, et al. Cost-effectiveness ofpercutaneous coronary intervention in optimally treated stable coronary patients. Circ CardiovascQual Outcomes 2008;1:12–20. https://doi.org/10.1161/CIRCOUTCOMES.108.798462
129. Brooks MM, Chung SC, Helmy T, Hillegass WB, Escobedo J, Melsop KA, et al. Health statusafter treatment for coronary artery disease and type 2 diabetes mellitus in the BypassAngioplasty Revascularization Investigation 2 Diabetes trial. Circulation 2010;122:1690–9.https://doi.org/10.1161/CIRCULATIONAHA.109.912642
REFERENCES
NIHR Journals Library www.journalslibrary.nihr.ac.uk
118
130. Nishi T, Piroth Z, De Bruyne B, Jagic N, Möbius-Winkler S, Kobayashi Y, et al. Fractional flowreserve and quality-of-life improvement after percutaneous coronary intervention in patientswith stable coronary artery disease. Circulation 2018;138:1797–804. https://doi.org/10.1161/CIRCULATIONAHA.118.035263
131. Spertus JA, Jones PG, Maron DJ, O’Brien SM, Reynolds HR, Rosenberg Y, et al. Health-statusoutcomes with invasive or conservative care in coronary disease. N Engl J Med 2020;382:1408–19.https://doi.org/10.1056/NEJMoa1916370
132. Takousi MG, Schmeer S, Manaras I, Olympios CD, Makos G, Troop NA. Health-related qualityof life after coronary revascularization: a systematic review with meta-analysis. Hellenic JCardiol 2016;57:223–37. https://doi.org/10.1016/j.hjc.2016.05.003
133. Tonino PA, Fearon WF, De Bruyne B, Oldroyd KG, Leesar MA, Ver Lee PN, et al. Angiographicversus functional severity of coronary artery stenoses in the FAME study fractional flowreserve versus angiography in multivessel evaluation. J Am Coll Cardiol 2010;55:2816–21.https://doi.org/10.1016/j.jacc.2009.11.096
134. Ara R, Brazier JE. Populating an economic model with health state utility values: movingtoward better practice. Value Health 2010;13:509–18. https://doi.org/10.1111/j.1524-4733.2010.00700.x
135. Sullivan PW, Slejko JF, Sculpher MJ, Ghushchyan V. Catalogue of EQ-5D scores for the UnitedKingdom. Med Decis Making 2011;31:800–4. https://doi.org/10.1177/0272989X11401031
136. Exchangerates.org.uk. Euro (EUR) to British Pound (GBP) Exchange Rate History. URL: www.exchangerates.org.uk/EUR-GBP-exchange-rate-history.html (accessed February 2020).
137. Curtis L, Burns A. Unit Costs of Health and Social Care 2019. Canterbury: Personal SocialServices Research Unit, University of Kent; 2020.
138. Department of Health and Social Care. National Schedule of NHS Costs 2017/18. 2020.URL: https://webarchive.nationalarchives.gov.uk/ukgwa/20200501111106/https://improvement.nhs.uk/resources/reference-costs/ (accessed February 2020).
139. National Institute for Cardiovascular Outcomes Research. National Audit for PercutaneousCoronary Intervention 2019 Summary Report (2017/18 Data). London: Healthcare QualityImprovement Programme; 2019.
140. National Institute for Health and Care Excellence (NICE). Stable Angina: Management. London:NICE; 2016.
141. BMJ Group and Pharmaceutical Press. British National Formulary (online). London: BMJ Group,Pharmaceutical Press, and RCPCH Publications. URL: https://bnf.nice.org.uk/ (accessedFebruary 2020).
142. Christiansen EH. Functional Assessment by Virtual Online Reconstruction. The FAVOR III EuropeJapan Study (FAVOR III EJ). 2018. URL: www.clinicaltrials.gov/ct2/show/NCT03729739(accessed June 2021).
143. Bo X. The FAVOR III China Study (FAVOR III). 2018. URL: https://clinicaltrials.gov/ct2/show/NCT03656848 (accessed June 2021).
144. Cliff Li KF, Chuang TH, Ong PJL. TCTAP A-131 First report on the use and repeatability ofquantitative flow ratio in a South East Asian population. J Am Coll Cardiol 2019;73(Suppl.):S68–9.https://doi.org/10.1016/j.jacc.2019.03.177
145. Cortes Villar C, Vera Vera S, Goncalves LR, Ramos B, Serrador A, Gutierrez H, et al. Functionalevolution of non-culprit lesions in acute myocardial infarction. A quantitative flow ratio study.Eur Heart J 2018;39(Suppl.):952. https://doi.org/10.1093/eurheartj/ehy563.P4625
DOI: 10.3310/hta25560 Health Technology Assessment 2021 Vol. 25 No. 56
© Queen’s Printer and Controller of HMSO 2021. This work was produced by Duarte et al. under the terms of a commissioning contract issued by the Secretary of Statefor Health and Social Care. This issue may be freely reproduced for the purposes of private research and study and extracts (or indeed, the full report) may be included inprofessional journals provided that suitable acknowledgement is made and the reproduction is not associated with any form of advertising. Applications for commercialreproduction should be addressed to: NIHR Journals Library, National Institute for Health Research, Evaluation, Trials and Studies Coordinating Centre, Alpha House,University of Southampton Science Park, Southampton SO16 7NS, UK.
119
146. Cortes C, Vera S, Catala P, Gutierrez H, Arnold R, Hinojosa W, et al. Quantitative flow ratio inmyocardial infarction for the evaluation of non-infart related arteries: the QIMERA pilot study.REC Interv Cardiol 2019;1:13–20.
147. Emori H, Kubo T, Kameyama T, Ino Y, Matsuo Y, Tanaka A, et al. The correlation betweenquantitative flow ratio (QFR) and fractional flow reserve (FFR). J Am Coll Cardiol2016;68(Suppl. 1):B213–14. https://doi.org/10.1016/j.jacc.2016.09.666
148. Emori H, Kubo T, Tanigaki T, Kawase Y, Shiono Y, Shimamura K, et al. TCT-328 diagnosticperformance of quantitative flow ratio from angiography versus fractional flow reserve fromcomputed tomography. J Am Coll Cardiol 2019;74(Suppl.):B326. https://doi.org/10.1016/j.jacc.2019.08.408
149. Tanigaki T, Emori H, Kawase Y, Kubo T, Omori H, Shiono Y, et al. QFR versus FFR derivedfrom computed tomography for functional assessment of coronary artery stenosis. JACCCardiovasc Interv 2019;12:2050–9. https://doi.org/10.1016/j.jcin.2019.06.043
150. Daemen J. Fast Assessment of STenosis Severity – FASTII Study. URL: https://clinicaltrials.gov/ct2/show/NCT03791320 (accessed June 2021).
151. Chang Y, Chen L, Westra J, Sun Z, Guan C, Zhang Y, et al. Reproducibility of quantitative flowratio: an inter-core laboratory variability study. Cardiol J 2018;20:20.
152. Fuwai Hospital. The FAVOR II China Study. 2017. URL: https://clinicaltrials.gov/ct2/show/NCT03191708 (accessed June 2021).
153. Zhang Y, Zhang S, Westra J, Ding D, Zhao Q, Yang J, et al. Automatic coronary blood flowcomputation: validation in quantitative flow ratio from coronary angiography. Int J CardiovascImaging 2019;35:587–95. https://doi.org/10.1007/s10554-018-1506-y
154. Holm NR. Diagnostic Accuracy of On-line Quantitative Flow Ratio (QFR). FAVOR II Europe–Japan(FAVOR II EJ). 2016. URL: https://clinicaltrials.gov/ct2/show/NCT02959814 (accessed June 2021).
155. Tu S, Westra J, Yang J, Birgelen Cv, Ferrara A, Pellicano M, et al. Diagnostic accuracy of fastcomputational approaches to derive fractional flow reserve from diagnostic coronary X-rayangiography in the international multicenter FAVOR (Functional Assessment by Various FlOwReconstructions) pilot study. J Am Coll Cardiol Intv 2016;9:2024–35.
156. Hamaya R, Hoshino M, Kanno Y, Yamaguchi M, Fukuda T, Ohya H, et al. Prognostic implicationof three-vessel three-dimensional quantitative coronary angiography-based contrast-flowquantitative flow ratio in patients with stable coronary artery disease. Eur Heart J2018;39(Suppl.):943. https://doi.org/10.1093/eurheartj/ehy563.P4596
157. Choi KH. Clinical Relevance of Functional Angiography for Non-culprit Stenosis in Patients withAcute Myocardial Infarction. Paper presented at EuroPCR, 21–4 May 2019, Paris, France.
158. Palma Dallan LA, Pizzato P, Rodrigues Pereira GT, Vergara-Martel A, Zago E, Zimin V, et al.Application of virtual fractional flow reserve analysis in real world invasive procedures:insights from ILUMIEN-I Trial. JACC Cardiovasc Interv 2019;12(Suppl.):S1–2. https://doi.org/10.1016/j.jcin.2019.01.005
159. Hideo-Kajita A, Ozaki Y, Bezerra C, Dan K, Melaku GD, Waksman R, et al. Quantitative flowratio (QFR) inter- and intra-observer reproducibility assessed at baseline and after 1 week.JACC Cardiovasc Interv 2019;12(Suppl.):S32. https://doi.org/10.1016/j.jcin.2019.01.118
160. Sugiyama T, Kanno Y, Hamaya R, Hoshino M, Usui E, Kanaji Y, et al. Determinants of visual-functional mismatches as assessed by coronary angiography and 3-D angiography-basedquantitative flow ratio. Eur Heart J 2019;40(Suppl. 1):2185. https://doi.org/10.1093/eurheartj/ehz745.0439
REFERENCES
NIHR Journals Library www.journalslibrary.nihr.ac.uk
120
161. Kanno Y, Hoshio M, Sugiyama T, Kanaji Y, Yamaguchi M, Hada M, et al. Hybrid QFR-FFRdecision making strategy for revascularization. Eur Heart J 2019;40(Suppl. 1):1656.https://doi.org/10.1093/eurheartj/ehz748.1022
162. Kanno Y, Yonetsu T, Kanaji Y, Usui E, Hoshino M, Hada M, et al. Accuracy of QuantitativeFlow Ratio Obtained from 3D Computational Quantitative Coronary Angiography in Comparisonwith Invasive Fractional Flow Reserve as a Reference. Journal of the American College ofCardiology Conference: 67th Annual Scientific Session of the American College of Cardiology,10–12 March 2018, Orlando, FL, USA. https://doi.org/10.1016/S0735-1097(18)31529-8
163. Zaleska M, Koltowski L, Maksym J, Chabior AK, Pohadajło A, Soliński M, et al. Quantitative flowratio and fractional flow reserve mismatch – clinical and biochemical predictors of measurementdiscrepancy. Postepy Kardiol Interwencyjnej 2019;15:301–7. https://doi.org/10.5114/aic.2019.87883
164. Zaleska M, Koltowski L, Maksym J, Tomaniak M, Chabior A, Pohadajlo A, et al. Influence ofdiabetes mellitus and chronic kidney disease on diagnostic accuracy of quantitative flow ratio(QFR). J Am Coll Cardiol 2018;72:B248. https://doi.org/10.1016/j.jacc.2018.08.1821
165. Mehta O, Lim R, Hay M, Ildayhid A, Zhang M, Cameron J, et al. Diagnostic accuracy ofquantitative flow ratio (QFR) compared with instantaneous flow wave free ratio (iFR)and DILEMMA score to predict fractional flow reserve (FFR). Heart Lung Circ2019;28(Suppl. 4):S394. https://doi.org/10.1016/j.hlc.2019.06.607
166. Liontou C, Mejia-Renteria H, Goto S, Lee H, Lauri F, Macaya F, et al. Functional assessment ofin-stent restenosis with quantitative flow ratio (QFR). A comparison with de novo coronarystenoses. J Am Coll Cardiol 2018;72(Suppl. B):B18. https://doi.org/10.1016/j.jacc.2018.08.1122
167. Mejia-Renteria H, Lauri F, Lee JM, Van Der Hoeven N, De Waard G, De Hoyos A, et al.Influence of microcirculatory resistance on the assessment of coronary stenosis severity withquantitative flow ratio (QFR): results of an international multicentre study. J Am Coll Cardiol2017;70(Suppl.):B30–1. https://doi.org/10.1016/j.jacc.2017.09.121
168. Mejia-Renteria H, Lauri F, Macaya F, Liontou C, Lee JM, van der Hoeven N, et al. Evaluation ofthe diagnostic performance of the quantitative flow ratio (QFR) according to the inter-individualvariations in the adenosine response during fractional flow reserve (FFR) measurement. J AmColl Cardiol 2018;72(Suppl.):B232 https://doi.org/10.1016/j.jacc.2018.08.1773
169. Mejia-Renteria H, Lauri F, Macaya F, Ryan N, Nombela-Franco L, Gonzalo N, et al. Diagnosticperformance of the novel quantitative flow ratio to predict significant coronary stenoses.Eur Heart J 2017;38(Suppl. 1):482. https://doi.org/10.1093/eurheartj/ehx502.P2380
170. Macaya F, Lauri F, Mejia-Renteria H, Pareek N, Goto S, Liontou C, et al. Angiography-derivedfunctional assessment of non-culprit stenoses with quantitative flow ratio at the time ofST-elevation myocardial infarction. J Am Coll Cardiol 2018;72(Suppl.):B126. https://doi.org/10.1016/j.jacc.2018.08.1446
171. Lauri FM, Mejia-Renteria H, Lee JM, Van Der Hoeven N, De Waard G, MacAya F, et al.Improving the diagnostic accuracy of quantitative flow ratio (QFR): a proposal of QFR-fractionalflow reserve (FFR) hybrid approach. Eur Heart J 2018;39(Suppl. 1):1144. https://doi.org/10.1093/eurheartj/ehy566.P5511
172. Smit J, Koning G, van Rosendael A, El Mahdiui M, Mertens B, Jukema J, et al. Referral ofPatients for Fractional Flow Reserve Using Coronary Contrast-Flow Quantitative Flow Ratio.Journal of the American College of Cardiology Conference: 67th Annual Scientific Session ofthe American College of Cardiology, 10–12 March 2018, Orlando, FL, USA. https://doi.org/10.1016/S0735-1097(18)32118-1
DOI: 10.3310/hta25560 Health Technology Assessment 2021 Vol. 25 No. 56
© Queen’s Printer and Controller of HMSO 2021. This work was produced by Duarte et al. under the terms of a commissioning contract issued by the Secretary of Statefor Health and Social Care. This issue may be freely reproduced for the purposes of private research and study and extracts (or indeed, the full report) may be included inprofessional journals provided that suitable acknowledgement is made and the reproduction is not associated with any form of advertising. Applications for commercialreproduction should be addressed to: NIHR Journals Library, National Institute for Health Research, Evaluation, Trials and Studies Coordinating Centre, Alpha House,University of Southampton Science Park, Southampton SO16 7NS, UK.
121
173. Smit JM, El Mahdiui M, van Rosendael AR, Jukema JW, Koning G, Reiber JH, et al. Diagnosticperformance of quantitative flow ratio in diabetic and non-diabetic patients. Circulation2018;138:A14594.
174. Smit JM, Koning G, van Rosendael AR, El Mahdiui M, Jukema JW, Reiber JHC, et al. Diagnosticperformance of quantitative flow ratio in diabetic and non-diabetic patients. Eur Heart J2018;39(Suppl. 1):446.
175. Erbay A, Steiner J, Lauten A, Landmesser U, Leistner D, Stahli BE. Assessment of intermediatecoronary lesions by fractional flow reserve and quantitative flow ratio in patients withsmall-vessel disease. Eur Heart J 2018;39(Suppl. 1):948. https://doi.org/10.1093/eurheartj/ehy563.P4611
176. Erbay A, Steiner J, Fröhlich G, Lauten A, Landmesser U, Leistner D, et al. Quantitative FlowRatio in the Evaluation of Intermediate Coronary Lesions in Diabetic Versus Non-diabetic Patients.Paper presented at German Society of Cardiology, Mannheim, Germany.
177. Leistner DM, Erbay A, Steiner J, Lauten A, Landmesser U, Stahli B. Diagnostic performanceof quantitative fow ratio in intermediate coronary artery lesions: a real-world single-centreexperience. Kardiovask Medizin 2018;21:117.
178. Kobayashi Y, Fearon WF. Simultaneous anatomic and physiologic assessment of coronaryartery disease with coronary angiography alone. JACC Cardiovasc Interv 2019;12:271–3.https://doi.org/10.1016/j.jcin.2018.10.032
179. Asano T, Katagiri Y, Chang CC, Kogame N, Chichareon P, Takahashi K, et al. Angiography-derivedfractional flow reserve in the SYNTAX II trial: diagnostic accuracy of QFR and clinical prognosticvalue of functional SYNTAX score derived from QFR. J Am Coll Cardiol 2018;72(Suppl.):B127.https://doi.org/10.1016/j.jacc.2018.08.1449
180. Kogame N, Takahashi K, Tomaniak M, Chichareon P, Modolo R, Chang CC, et al. Clinicalimplication of quantitative flow ratio after percutaneous coronary intervention for 3-vesseldisease. JACC Cardiovasc Interv 2019;12:2064–75. https://doi.org/10.1016/j.jcin.2019.08.009
181. Kogame N, Takahashi K, Tomaniak M, Chichareon P, Modolo R, Katagiri Y, et al. TCT-111clinical implication of quantitative flow ratio after percutaneous coronary intervention forthree vessel disease. J Am Coll Cardiol 2019;74(Suppl.):B111. https://doi.org/10.1016/j.jacc.2019.08.157
182. Westra JS, Andersen BK, Vestergaard MB, Winther S, Nissen L, Boetker HE, et al. RestingPd/Pa and FFR discordance: effect on the diagnostic performance of quantitative flow ratio(QFR) with FFR as reference standard. Eur Heart J 2017;38(Suppl. 1):482. https://doi.org/10.1093/eurheartj/ehx502.P2381
183. Westra J, Tu S, Nissen L, Winther S, Britt M, Andersen BK, et al. Physiological testing ofcoronary artery stenosis by computation of invasive coronary angiography. The wire-freefunctional imaging (WIFI-II) study. J Am Coll Cardiol 2016;68(Suppl.):B4–5. https://doi.org/10.1016/j.jacc.2016.09.887
184. Andreasen LN, Andersen BK, Vestergaard MB, Tu S, Westra JS, Reiber JHC, et al. Feasibilityand diagnostic precision of in-procedure computed FFR: the wire-free invasive functionalimaging (WIFI) study. EuroIntervention 2016;France:176.
185. Holm NR. The Wire-free Invasive Functional Imaging (WIFI) Study. 2016. URL: https://clinicaltrials.gov/ct2/show/NCT02795585 (accessed June 2021).
186. Otsuka M, Goto M, Kataoka S, Kahata M, Kumagai A, Inoue K, et al. FFRQCA: FFR ComputationDerived from 3-dimensional Quantitative Coronary Angiography. Paper presented at the CVITmeeting, Tokyo, Japan.
REFERENCES
NIHR Journals Library www.journalslibrary.nihr.ac.uk
122
187. Hueb W, Lopes N, Gersh BJ, Soares PR, Ribeiro EE, Pereira AC, et al. Ten-year follow-upsurvival of the Medicine, Angioplasty, or Surgery Study (MASS II): a randomized controlledclinical trial of 3 therapeutic strategies for multivessel coronary artery disease. Circulation2010;122:949–57. https://doi.org/10.1161/CIRCULATIONAHA.109.911669
188. Dagenais GR, Lu J, Faxon DP, Kent K, Lago RM, Lezama C, et al. Effects of optimal medicaltreatment with or without coronary revascularization on angina and subsequentrevascularizations in patients with type 2 diabetes mellitus and stable ischemic heart disease.Circulation 2011;123:1492–500. https://doi.org/10.1161/CIRCULATIONAHA.110.978247
189. Hochman JS. International Study Of Comparative Health Effectiveness With Medical And InvasiveApproaches (ISCHEMIA): Primary report of the Clinical Outcomes. Paper presented at theAmerican Heart Association, Philadelphia, PA, USA.
190. Spertus JA. International Study of Comparative Health Effectiveness with Medical and InvasiveApproaches. Primary Report of Quality of Life Outcomes. Paper presented at the American HeartAssociation, Philadelphia, PA, USA.
DOI: 10.3310/hta25560 Health Technology Assessment 2021 Vol. 25 No. 56
© Queen’s Printer and Controller of HMSO 2021. This work was produced by Duarte et al. under the terms of a commissioning contract issued by the Secretary of Statefor Health and Social Care. This issue may be freely reproduced for the purposes of private research and study and extracts (or indeed, the full report) may be included inprofessional journals provided that suitable acknowledgement is made and the reproduction is not associated with any form of advertising. Applications for commercialreproduction should be addressed to: NIHR Journals Library, National Institute for Health Research, Evaluation, Trials and Studies Coordinating Centre, Alpha House,University of Southampton Science Park, Southampton SO16 7NS, UK.
123

Appendix 1 Clinical review literaturesearch strategies
MEDLINE (via OVID)
Date searched: 1 October 2019.
Date range searched: 1946 to 25 September 2019.
Search strategy
1. QANGIO$.ti,ab,kw. (8)2. quantitative flow ratio$.ti,ab,kw. (36)3. QFR.ti,ab,kw. (82)4. “3D/QFR”.ti,ab,kw. (1)5. aQFR.ti,ab,kw. (2)6. adenosine-flow QFR.ti,ab,kw. (2)7. cQFR.ti,ab,kw. (6)8. contrast-flow QFR.ti,ab,kw. (7)9. fQFR.ti,ab,kw. (5)
10. fixed-flow QFR.ti,ab,kw. (5)11. iQFR.ti,ab,kw. (1)12. index QFR.ti,ab,kw. (1)13. LQFR.ti,ab,kw. (4)14. lesion QFR.ti,ab,kw. (1)15. vQFR.ti,ab,kw. (1)16. vessel QFR.ti,ab,kw. (1)17. 1 or 2 or 3 or 4 or 5 or 6 or 7 or 8 or 9 or 10 or 11 or 12 or 13 or 14 or 15 or 16 (99)18. vessel FFR.ti,ab,kw. (11)19. vFFR.ti,ab,kw. (8)20. CAAS vFFR.ti,ab,kw. (0)21. 18 or 19 or 20 (19)22. 17 or 21 (118)23. animals/not (humans/and animals/) (4,586,208)24. 22 not 23 (107)25. “quinol:fumarate reductase”.ti,ab. (29)26. 24 not 25 (88).
DOI: 10.3310/hta25560 Health Technology Assessment 2021 Vol. 25 No. 56
© Queen’s Printer and Controller of HMSO 2021. This work was produced by Duarte et al. under the terms of a commissioning contract issued by the Secretary of Statefor Health and Social Care. This issue may be freely reproduced for the purposes of private research and study and extracts (or indeed, the full report) may be included inprofessional journals provided that suitable acknowledgement is made and the reproduction is not associated with any form of advertising. Applications for commercialreproduction should be addressed to: NIHR Journals Library, National Institute for Health Research, Evaluation, Trials and Studies Coordinating Centre, Alpha House,University of Southampton Science Park, Southampton SO16 7NS, UK.
125

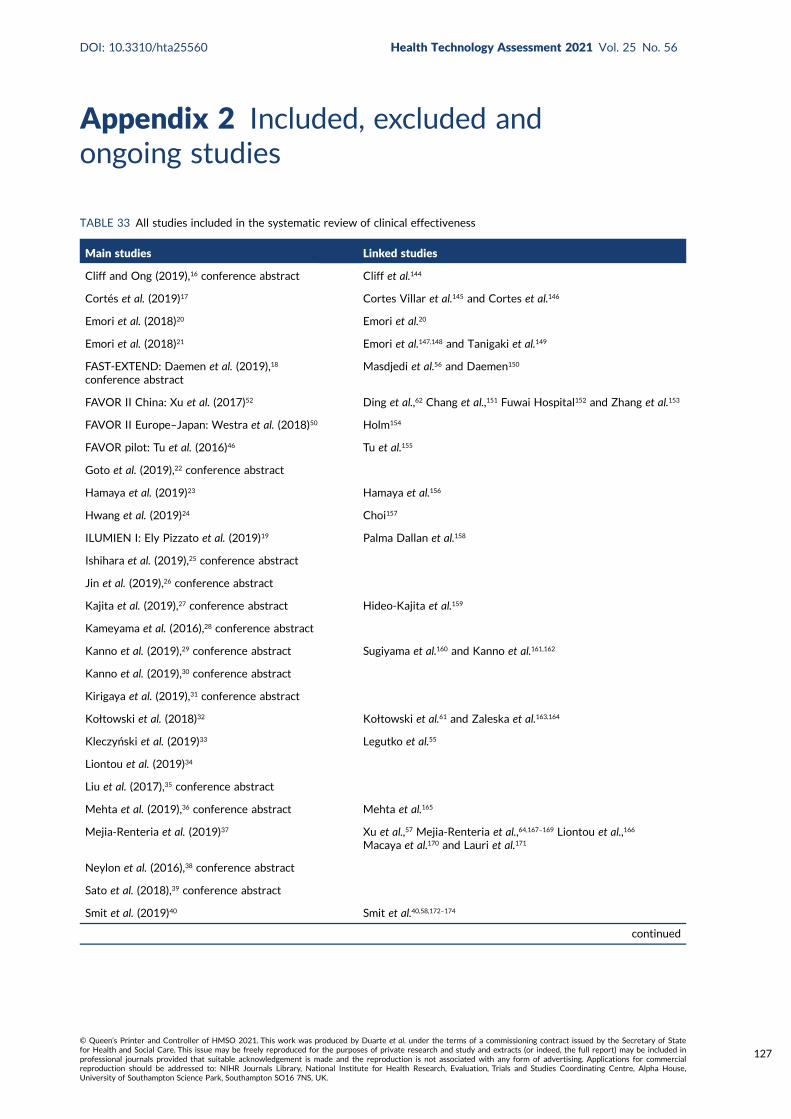
Appendix 2 Included, excluded andongoing studies
TABLE 33 All studies included in the systematic review of clinical effectiveness
Main studies Linked studies
Cliff and Ong (2019),16 conference abstract Cliff et al.144
Cortés et al. (2019)17 Cortes Villar et al.145 and Cortes et al.146
Emori et al. (2018)20 Emori et al.20
Emori et al. (2018)21 Emori et al.147,148 and Tanigaki et al.149
FAST-EXTEND: Daemen et al. (2019),18
conference abstractMasdjedi et al.56 and Daemen150
FAVOR II China: Xu et al. (2017)52 Ding et al.,62 Chang et al.,151 Fuwai Hospital152 and Zhang et al.153
FAVOR II Europe–Japan: Westra et al. (2018)50 Holm154
FAVOR pilot: Tu et al. (2016)46 Tu et al.155
Goto et al. (2019),22 conference abstract
Hamaya et al. (2019)23 Hamaya et al.156
Hwang et al. (2019)24 Choi157
ILUMIEN I: Ely Pizzato et al. (2019)19 Palma Dallan et al.158
Ishihara et al. (2019),25 conference abstract
Jin et al. (2019),26 conference abstract
Kajita et al. (2019),27 conference abstract Hideo-Kajita et al.159
Kameyama et al. (2016),28 conference abstract
Kanno et al. (2019),29 conference abstract Sugiyama et al.160 and Kanno et al.161,162
Kanno et al. (2019),30 conference abstract
Kirigaya et al. (2019),31 conference abstract
Kołtowski et al. (2018)32 Kołtowski et al.61 and Zaleska et al.163,164
Kleczyński et al. (2019)33 Legutko et al.55
Liontou et al. (2019)34
Liu et al. (2017),35 conference abstract
Mehta et al. (2019),36 conference abstract Mehta et al.165
Mejia-Renteria et al. (2019)37 Xu et al.,57 Mejia-Renteria et al.,64,167–169 Liontou et al.,166
Macaya et al.170 and Lauri et al.171
Neylon et al. (2016),38 conference abstract
Sato et al. (2018),39 conference abstract
Smit et al. (2019)40 Smit et al.40,58,172–174
continued
DOI: 10.3310/hta25560 Health Technology Assessment 2021 Vol. 25 No. 56
© Queen’s Printer and Controller of HMSO 2021. This work was produced by Duarte et al. under the terms of a commissioning contract issued by the Secretary of Statefor Health and Social Care. This issue may be freely reproduced for the purposes of private research and study and extracts (or indeed, the full report) may be included inprofessional journals provided that suitable acknowledgement is made and the reproduction is not associated with any form of advertising. Applications for commercialreproduction should be addressed to: NIHR Journals Library, National Institute for Health Research, Evaluation, Trials and Studies Coordinating Centre, Alpha House,University of Southampton Science Park, Southampton SO16 7NS, UK.
127
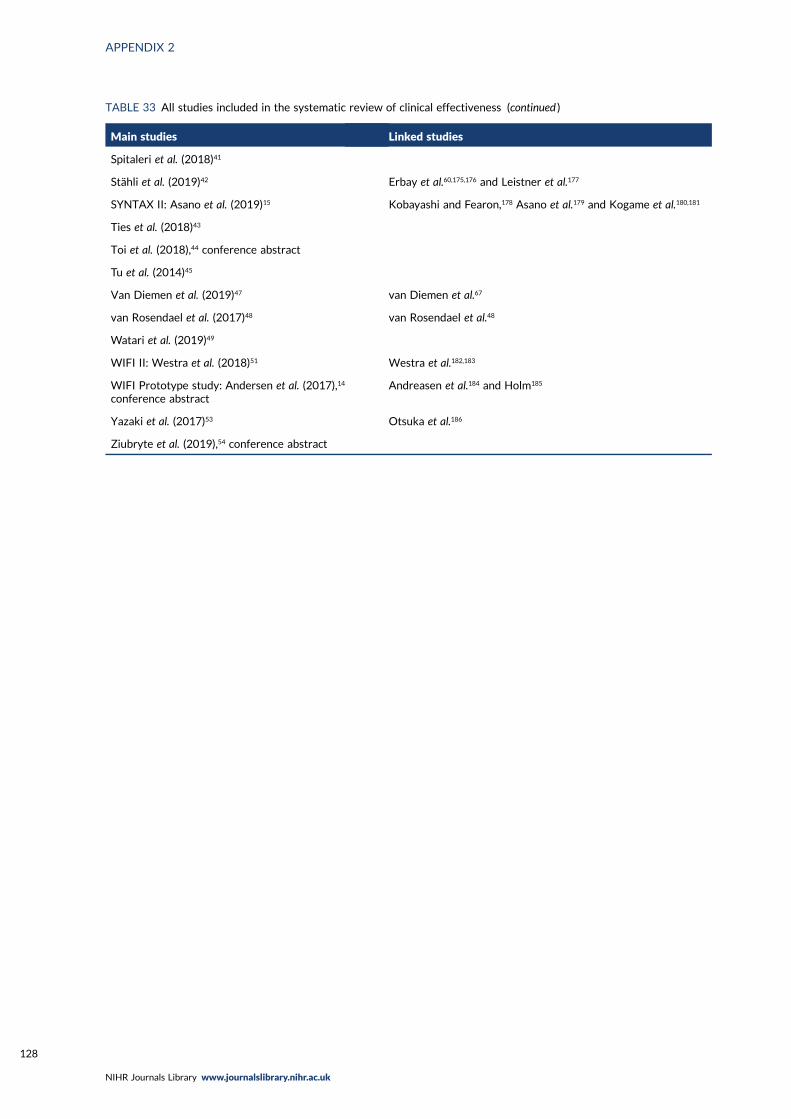
TABLE 33 All studies included in the systematic review of clinical effectiveness (continued )
Main studies Linked studies
Spitaleri et al. (2018)41
Stähli et al. (2019)42 Erbay et al.60,175,176 and Leistner et al.177
SYNTAX II: Asano et al. (2019)15 Kobayashi and Fearon,178 Asano et al.179 and Kogame et al.180,181
Ties et al. (2018)43
Toi et al. (2018),44 conference abstract
Tu et al. (2014)45
Van Diemen et al. (2019)47 van Diemen et al.67
van Rosendael et al. (2017)48 van Rosendael et al.48
Watari et al. (2019)49
WIFI II: Westra et al. (2018)51 Westra et al.182,183
WIFI Prototype study: Andersen et al. (2017),14
conference abstractAndreasen et al.184 and Holm185
Yazaki et al. (2017)53 Otsuka et al.186
Ziubryte et al. (2019),54 conference abstract
APPENDIX 2
NIHR Journals Library www.journalslibrary.nihr.ac.uk
128
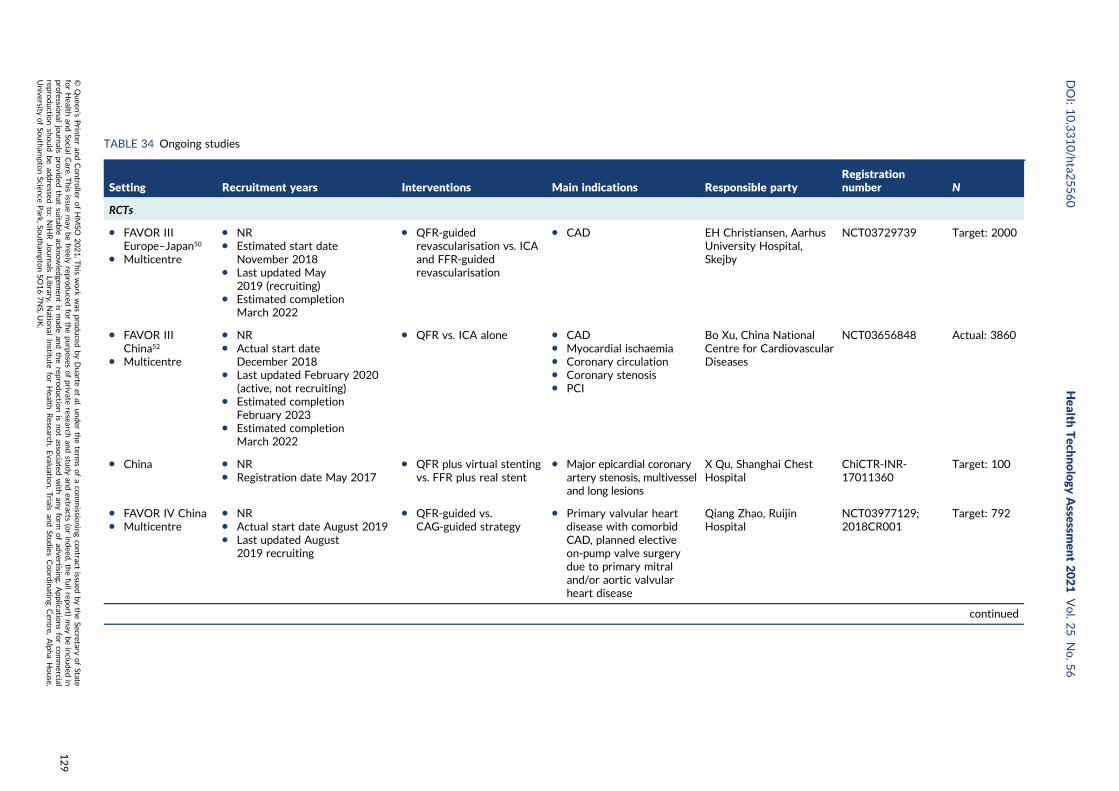
TABLE 34 Ongoing studies
Setting Recruitment years Interventions Main indications Responsible partyRegistrationnumber N
RCTs
l FAVOR IIIEurope–Japan50
l Multicentre
l NRl Estimated start date
November 2018l Last updated May
2019 (recruiting)l Estimated completion
March 2022
l QFR-guidedrevascularisation vs. ICAand FFR-guidedrevascularisation
l CAD EH Christiansen, AarhusUniversity Hospital,Skejby
NCT03729739 Target: 2000
l FAVOR IIIChina52
l Multicentre
l NRl Actual start date
December 2018l Last updated February 2020
(active, not recruiting)l Estimated completion
February 2023l Estimated completion
March 2022
l QFR vs. ICA alone l CADl Myocardial ischaemial Coronary circulationl Coronary stenosisl PCI
Bo Xu, China NationalCentre for CardiovascularDiseases
NCT03656848 Actual: 3860
l China l NRl Registration date May 2017
l QFR plus virtual stentingvs. FFR plus real stent
l Major epicardial coronaryartery stenosis, multivesseland long lesions
X Qu, Shanghai ChestHospital
ChiCTR-INR-17011360
Target: 100
l FAVOR IV Chinal Multicentre
l NRl Actual start date August 2019l Last updated August
2019 recruiting
l QFR-guided vs.CAG-guided strategy
l Primary valvular heartdisease with comorbidCAD, planned electiveon-pump valve surgerydue to primary mitraland/or aortic valvularheart disease
Qiang Zhao, RuijinHospital
NCT03977129;2018CR001
Target: 792
continued
DOI:10.3310/hta2
5560
Health
Tech
nology
Assessm
ent2021
Vol.2
5No.5
6
©Queen
’sPrin
teran
dContro
llerofHMSO
2021.T
his
work
was
produced
byDuarte
etal.
under
theterm
sofaco
mmissio
ningco
ntract
issued
bytheSecretary
ofState
forHealth
andSo
cialCare.T
his
issuemay
befreely
reproduced
forthepu
rposes
ofprivate
researchan
dstu
dyan
dextracts
(orindeed
,thefullrepo
rt)may
beinclu
ded
inpro
fessional
journals
provid
edthat
suitab
leackn
owled
gemen
tis
mad
ean
dtherepro
ductio
nis
notasso
ciatedwith
anyform
ofad
vertising.
Applicatio
nsforco
mmercial
reproductio
nshould
bead
dressed
to:NIH
RJournals
Library,
Natio
nal
Institu
teforHealth
Research
,Evalu
ation,Trials
and
Studies
Coordinatin
gCen
tre,Alph
aHouse,
University
ofSo
utham
ptonScien
cePark,So
utham
ptonSO
167NS,U
K.
129
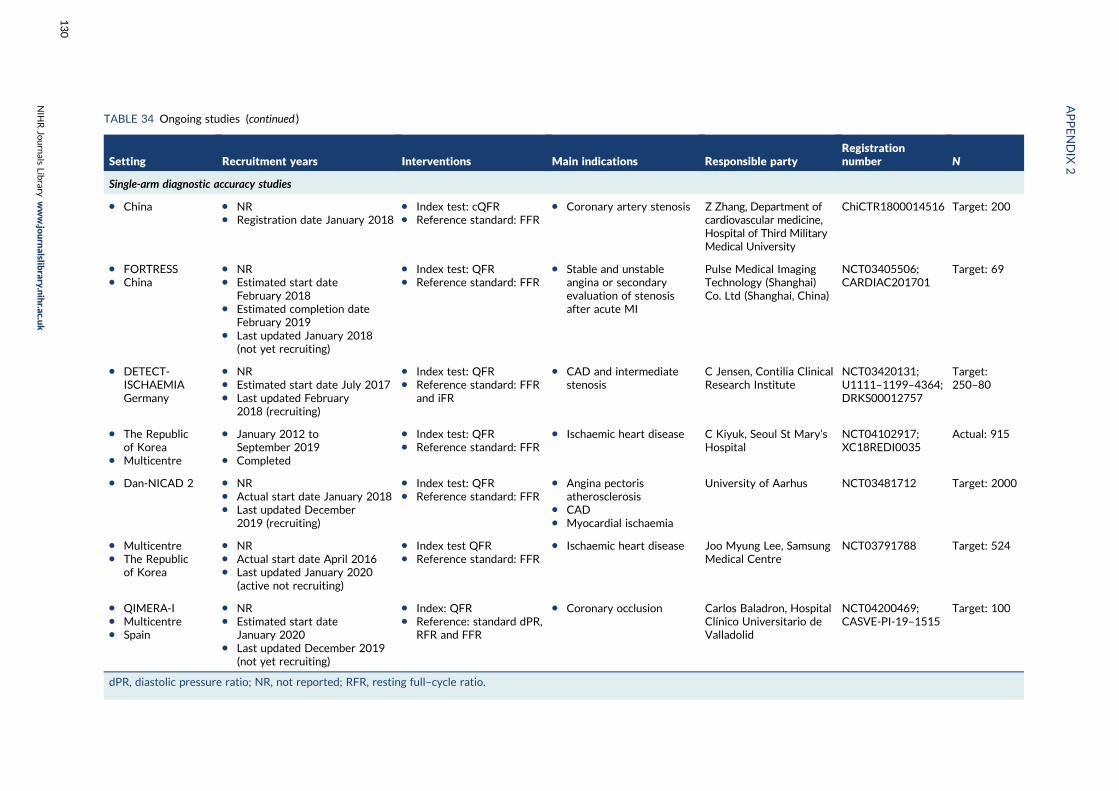
TABLE 34 Ongoing studies (continued )
Setting Recruitment years Interventions Main indications Responsible partyRegistrationnumber N
Single-arm diagnostic accuracy studies
l China l NRl Registration date January 2018
l Index test: cQFRl Reference standard: FFR
l Coronary artery stenosis Z Zhang, Department ofcardiovascular medicine,Hospital of Third MilitaryMedical University
ChiCTR1800014516 Target: 200
l FORTRESSl China
l NRl Estimated start date
February 2018l Estimated completion date
February 2019l Last updated January 2018
(not yet recruiting)
l Index test: QFRl Reference standard: FFR
l Stable and unstableangina or secondaryevaluation of stenosisafter acute MI
Pulse Medical ImagingTechnology (Shanghai)Co. Ltd (Shanghai, China)
NCT03405506;CARDIAC201701
Target: 69
l DETECT-ISCHAEMIAGermany
l NRl Estimated start date July 2017l Last updated February
2018 (recruiting)
l Index test: QFRl Reference standard: FFR
and iFR
l CAD and intermediatestenosis
C Jensen, Contilia ClinicalResearch Institute
NCT03420131;U1111–1199–4364;DRKS00012757
Target:250–80
l The Republicof Korea
l Multicentre
l January 2012 toSeptember 2019
l Completed
l Index test: QFRl Reference standard: FFR
l Ischaemic heart disease C Kiyuk, Seoul St Mary’sHospital
NCT04102917;XC18REDI0035
Actual: 915
l Dan-NICAD 2 l NRl Actual start date January 2018l Last updated December
2019 (recruiting)
l Index test: QFRl Reference standard: FFR
l Angina pectorisatherosclerosis
l CADl Myocardial ischaemia
University of Aarhus NCT03481712 Target: 2000
l Multicentrel The Republic
of Korea
l NRl Actual start date April 2016l Last updated January 2020
(active not recruiting)
l Index test QFRl Reference standard: FFR
l Ischaemic heart disease Joo Myung Lee, SamsungMedical Centre
NCT03791788 Target: 524
l QIMERA-Il Multicentrel Spain
l NRl Estimated start date
January 2020l Last updated December 2019
(not yet recruiting)
l Index: QFRl Reference: standard dPR,
RFR and FFR
l Coronary occlusion Carlos Baladron, HospitalClínico Universitario deValladolid
NCT04200469;CASVE-PI-19–1515
Target: 100
dPR, diastolic pressure ratio; NR, not reported; RFR, resting full–cycle ratio.
APPENDIX
2
NIH
RJournals
Library
www.jo
urnalslib
rary.nihr.ac.u
k
130
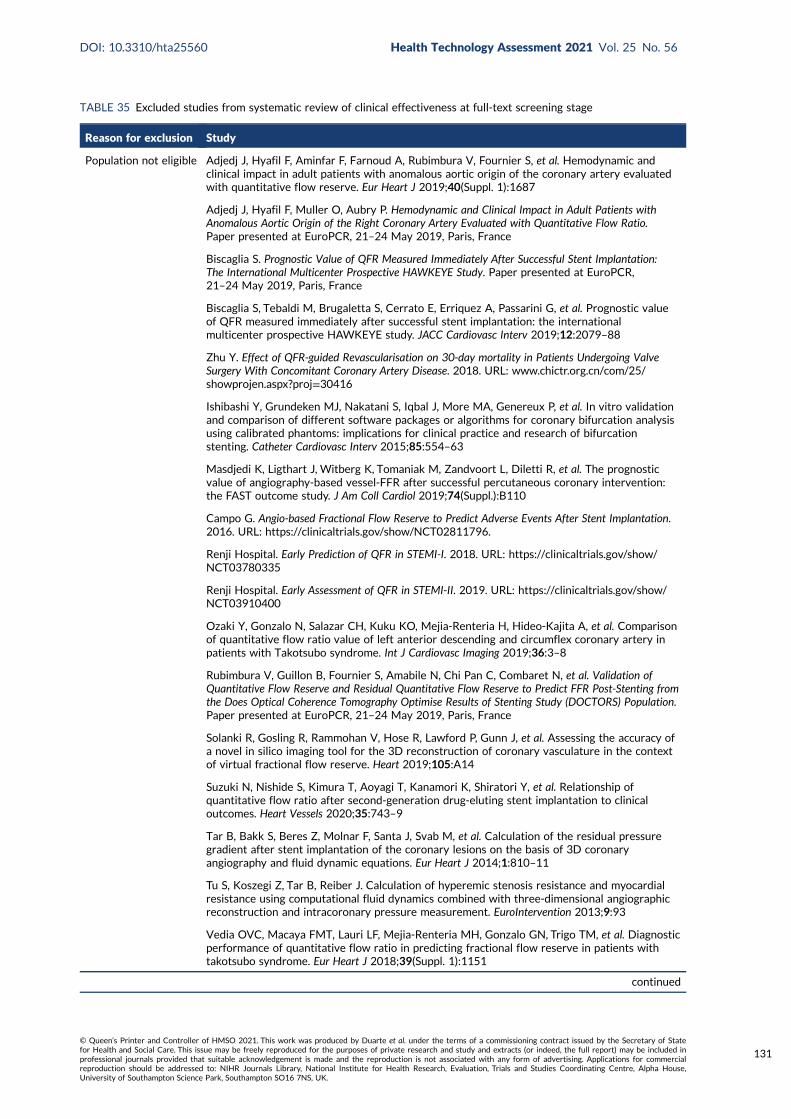
TABLE 35 Excluded studies from systematic review of clinical effectiveness at full-text screening stage
Reason for exclusion Study
Population not eligible Adjedj J, Hyafil F, Aminfar F, Farnoud A, Rubimbura V, Fournier S, et al. Hemodynamic andclinical impact in adult patients with anomalous aortic origin of the coronary artery evaluatedwith quantitative flow reserve. Eur Heart J 2019;40(Suppl. 1):1687
Adjedj J, Hyafil F, Muller O, Aubry P. Hemodynamic and Clinical Impact in Adult Patients withAnomalous Aortic Origin of the Right Coronary Artery Evaluated with Quantitative Flow Ratio.Paper presented at EuroPCR, 21–24 May 2019, Paris, France
Biscaglia S. Prognostic Value of QFR Measured Immediately After Successful Stent Implantation:The International Multicenter Prospective HAWKEYE Study. Paper presented at EuroPCR,21–24 May 2019, Paris, France
Biscaglia S, Tebaldi M, Brugaletta S, Cerrato E, Erriquez A, Passarini G, et al. Prognostic valueof QFR measured immediately after successful stent implantation: the internationalmulticenter prospective HAWKEYE study. JACC Cardiovasc Interv 2019;12:2079–88
Zhu Y. Effect of QFR-guided Revascularisation on 30-day mortality in Patients Undergoing ValveSurgery With Concomitant Coronary Artery Disease. 2018. URL: www.chictr.org.cn/com/25/showprojen.aspx?proj=30416
Ishibashi Y, Grundeken MJ, Nakatani S, Iqbal J, More MA, Genereux P, et al. In vitro validationand comparison of different software packages or algorithms for coronary bifurcation analysisusing calibrated phantoms: implications for clinical practice and research of bifurcationstenting. Catheter Cardiovasc Interv 2015;85:554–63
Masdjedi K, Ligthart J, Witberg K, Tomaniak M, Zandvoort L, Diletti R, et al. The prognosticvalue of angiography-based vessel-FFR after successful percutaneous coronary intervention:the FAST outcome study. J Am Coll Cardiol 2019;74(Suppl.):B110
Campo G. Angio-based Fractional Flow Reserve to Predict Adverse Events After Stent Implantation.2016. URL: https://clinicaltrials.gov/show/NCT02811796.
Renji Hospital. Early Prediction of QFR in STEMI-I. 2018. URL: https://clinicaltrials.gov/show/NCT03780335
Renji Hospital. Early Assessment of QFR in STEMI-II. 2019. URL: https://clinicaltrials.gov/show/NCT03910400
Ozaki Y, Gonzalo N, Salazar CH, Kuku KO, Mejia-Renteria H, Hideo-Kajita A, et al. Comparisonof quantitative flow ratio value of left anterior descending and circumflex coronary artery inpatients with Takotsubo syndrome. Int J Cardiovasc Imaging 2019;36:3–8
Rubimbura V, Guillon B, Fournier S, Amabile N, Chi Pan C, Combaret N, et al. Validation ofQuantitative Flow Reserve and Residual Quantitative Flow Reserve to Predict FFR Post-Stenting fromthe Does Optical Coherence Tomography Optimise Results of Stenting Study (DOCTORS) Population.Paper presented at EuroPCR, 21–24 May 2019, Paris, France
Solanki R, Gosling R, Rammohan V, Hose R, Lawford P, Gunn J, et al. Assessing the accuracy ofa novel in silico imaging tool for the 3D reconstruction of coronary vasculature in the contextof virtual fractional flow reserve. Heart 2019;105:A14
Suzuki N, Nishide S, Kimura T, Aoyagi T, Kanamori K, Shiratori Y, et al. Relationship ofquantitative flow ratio after second-generation drug-eluting stent implantation to clinicaloutcomes. Heart Vessels 2020;35:743–9
Tar B, Bakk S, Beres Z, Molnar F, Santa J, Svab M, et al. Calculation of the residual pressuregradient after stent implantation of the coronary lesions on the basis of 3D coronaryangiography and fluid dynamic equations. Eur Heart J 2014;1:810–11
Tu S, Koszegi Z, Tar B, Reiber J. Calculation of hyperemic stenosis resistance and myocardialresistance using computational fluid dynamics combined with three-dimensional angiographicreconstruction and intracoronary pressure measurement. EuroIntervention 2013;9:93
Vedia OVC, Macaya FMT, Lauri LF, Mejia-Renteria MH, Gonzalo GN, Trigo TM, et al. Diagnosticperformance of quantitative flow ratio in predicting fractional flow reserve in patients withtakotsubo syndrome. Eur Heart J 2018;39(Suppl. 1):1151
continued
DOI: 10.3310/hta25560 Health Technology Assessment 2021 Vol. 25 No. 56
© Queen’s Printer and Controller of HMSO 2021. This work was produced by Duarte et al. under the terms of a commissioning contract issued by the Secretary of Statefor Health and Social Care. This issue may be freely reproduced for the purposes of private research and study and extracts (or indeed, the full report) may be included inprofessional journals provided that suitable acknowledgement is made and the reproduction is not associated with any form of advertising. Applications for commercialreproduction should be addressed to: NIHR Journals Library, National Institute for Health Research, Evaluation, Trials and Studies Coordinating Centre, Alpha House,University of Southampton Science Park, Southampton SO16 7NS, UK.
131
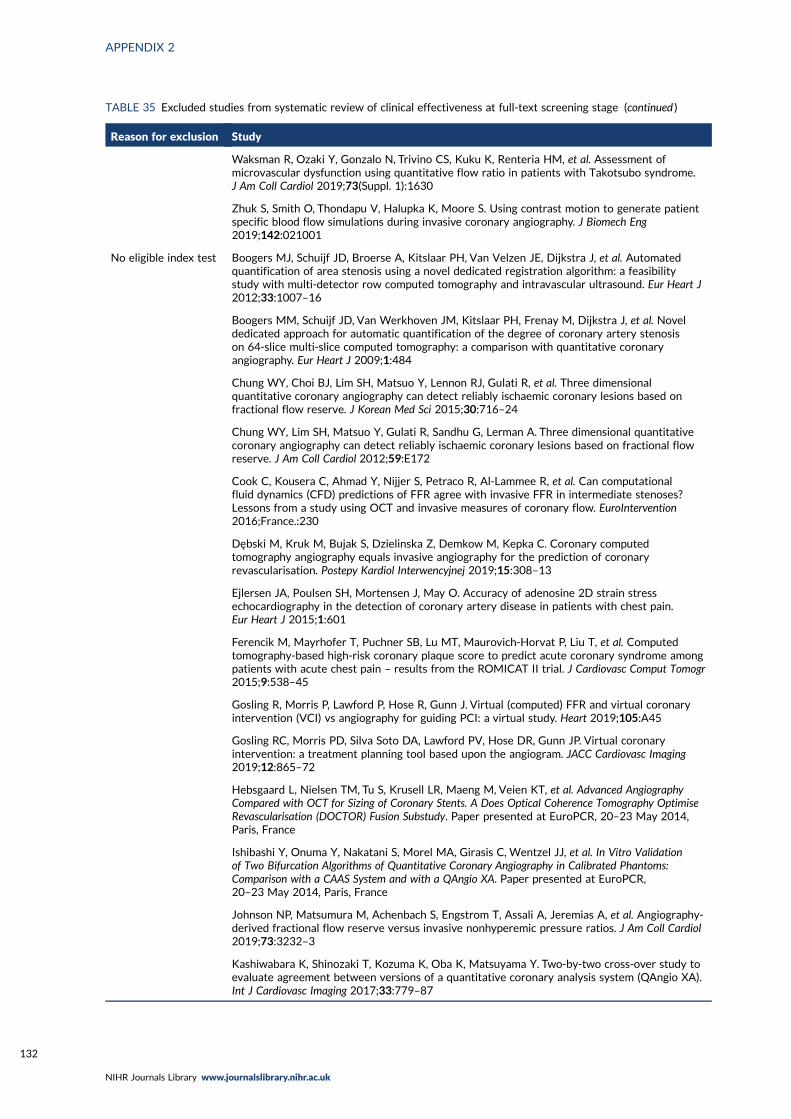
TABLE 35 Excluded studies from systematic review of clinical effectiveness at full-text screening stage (continued )
Reason for exclusion Study
Waksman R, Ozaki Y, Gonzalo N, Trivino CS, Kuku K, Renteria HM, et al. Assessment ofmicrovascular dysfunction using quantitative flow ratio in patients with Takotsubo syndrome.J Am Coll Cardiol 2019;73(Suppl. 1):1630
Zhuk S, Smith O, Thondapu V, Halupka K, Moore S. Using contrast motion to generate patientspecific blood flow simulations during invasive coronary angiography. J Biomech Eng2019;142:021001
No eligible index test Boogers MJ, Schuijf JD, Broerse A, Kitslaar PH, Van Velzen JE, Dijkstra J, et al. Automatedquantification of area stenosis using a novel dedicated registration algorithm: a feasibilitystudy with multi-detector row computed tomography and intravascular ultrasound. Eur Heart J2012;33:1007–16
Boogers MM, Schuijf JD, Van Werkhoven JM, Kitslaar PH, Frenay M, Dijkstra J, et al. Noveldedicated approach for automatic quantification of the degree of coronary artery stenosison 64-slice multi-slice computed tomography: a comparison with quantitative coronaryangiography. Eur Heart J 2009;1:484
Chung WY, Choi BJ, Lim SH, Matsuo Y, Lennon RJ, Gulati R, et al. Three dimensionalquantitative coronary angiography can detect reliably ischaemic coronary lesions based onfractional flow reserve. J Korean Med Sci 2015;30:716–24
Chung WY, Lim SH, Matsuo Y, Gulati R, Sandhu G, Lerman A. Three dimensional quantitativecoronary angiography can detect reliably ischaemic coronary lesions based on fractional flowreserve. J Am Coll Cardiol 2012;59:E172
Cook C, Kousera C, Ahmad Y, Nijjer S, Petraco R, Al-Lammee R, et al. Can computationalfluid dynamics (CFD) predictions of FFR agree with invasive FFR in intermediate stenoses?Lessons from a study using OCT and invasive measures of coronary flow. EuroIntervention2016;France.:230
Dębski M, Kruk M, Bujak S, Dzielinska Z, Demkow M, Kepka C. Coronary computedtomography angiography equals invasive angiography for the prediction of coronaryrevascularisation. Postepy Kardiol Interwencyjnej 2019;15:308–13
Ejlersen JA, Poulsen SH, Mortensen J, May O. Accuracy of adenosine 2D strain stressechocardiography in the detection of coronary artery disease in patients with chest pain.Eur Heart J 2015;1:601
Ferencik M, Mayrhofer T, Puchner SB, Lu MT, Maurovich-Horvat P, Liu T, et al. Computedtomography-based high-risk coronary plaque score to predict acute coronary syndrome amongpatients with acute chest pain – results from the ROMICAT II trial. J Cardiovasc Comput Tomogr2015;9:538–45
Gosling R, Morris P, Lawford P, Hose R, Gunn J. Virtual (computed) FFR and virtual coronaryintervention (VCI) vs angiography for guiding PCI: a virtual study. Heart 2019;105:A45
Gosling RC, Morris PD, Silva Soto DA, Lawford PV, Hose DR, Gunn JP. Virtual coronaryintervention: a treatment planning tool based upon the angiogram. JACC Cardiovasc Imaging2019;12:865–72
Hebsgaard L, Nielsen TM, Tu S, Krusell LR, Maeng M, Veien KT, et al. Advanced AngiographyCompared with OCT for Sizing of Coronary Stents. A Does Optical Coherence Tomography OptimiseRevascularisation (DOCTOR) Fusion Substudy. Paper presented at EuroPCR, 20–23 May 2014,Paris, France
Ishibashi Y, Onuma Y, Nakatani S, Morel MA, Girasis C, Wentzel JJ, et al. In Vitro Validationof Two Bifurcation Algorithms of Quantitative Coronary Angiography in Calibrated Phantoms:Comparison with a CAAS System and with a QAngio XA. Paper presented at EuroPCR,20–23 May 2014, Paris, France
Johnson NP, Matsumura M, Achenbach S, Engstrom T, Assali A, Jeremias A, et al. Angiography-derived fractional flow reserve versus invasive nonhyperemic pressure ratios. J Am Coll Cardiol2019;73:3232–3
Kashiwabara K, Shinozaki T, Kozuma K, Oba K, Matsuyama Y. Two-by-two cross-over study toevaluate agreement between versions of a quantitative coronary analysis system (QAngio XA).Int J Cardiovasc Imaging 2017;33:779–87
APPENDIX 2
NIHR Journals Library www.journalslibrary.nihr.ac.uk
132

TABLE 35 Excluded studies from systematic review of clinical effectiveness at full-text screening stage (continued )
Reason for exclusion Study
Kornowski R, Vaknin-Assa H, Assali A, Greenberg G, Valtzer O, Lavi I. Online angiographyimage-based FFR assessment during coronary catheterization: a single-center study. J InvasiveCardiol 2018;30:224–9
Lal K, Gunn J, Morris P, Gosling R, Lawford P, Hose R, et al. Computational modelling offractional flow reserve from coronary angiography: expert training required. Heart2019;105:A15–16
Lee JH, Yoon MH, Tahk SJ, Shin JH, Hwang GS, Choi SY, et al. Comparision of 3-dimensionalquantitative coronary angiography and intravascular ultrasound for detecting functionallysignificant coronary lesions. Eur Heart J 2018;39(Suppl. 1):525
Lee JM, Koo BK, Shin ES, Nam CW, Doh JH, Hu X, et al. Clinical outcomes of deferred lesionswith angiographically insignificant stenosis but low fractional flow reserve. J Am Heart Assoc2017;6:e006071
Lee JM, Koo BK, Shin ES, Nam CW, Doh JH, Hwang D, et al. Clinical implications of 3-vesselfractional flow reserve measurement in patients with coronary artery disease. J Am Coll Cardiol2017;70(Suppl. 1):B137–8
Lee JM, Koo BK, Shin ES, Nam CW, Doh JH, Hwang D, et al. Clinical implications ofthree-vessel fractional flow reserve measurement in patients with coronary artery disease.Eur Heart J 2018;39:945–51
Leone AM, De Caterina AR, De Maria GL, Scalone G, Tagliaferro F, Gardi A, et al. Three-dimensional quantitative coronary angiography and quantification of jeopardised myocardiumto predict functional significance of intermediate coronary artery stenosis. EuroIntervention2015;11:308–18
Li J, Gong Y, Yi T, Hong T, Liu Z, Zheng B, et al. TCT-323 angiography-derived contrastfractional flow reserve from a specially designed computational fluid dynamic method. J AmColl Cardiol 2019;74(Suppl.):B321
Li S, Chin C, Thondapu V, Poon EKW, Monty JP, Li Y, et al. Numerical and experimentalinvestigations of the flow-pressure relation in multiple sequential stenoses coronary artery.Int J Cardiovasc Imaging 2017;33:1083–8
Mangiacapra F, Conte M, Tu S, Peace AJ, Di Serafino L, Ntarladinias I, et al. Performance ofthree-dimensional vs. two-dimensional quantitative coronary angiography in discriminatingfunctionally significant coronary stenoses according to fractional flow reserve. EuroIntervention2011;M:M144
Matar F, Falasiri S, Caruncho C, Leung C, Glover C, Sullebarger JT. When should FFR be usedduring coronary angiography? The importance of left anterior descending artery and minimallumen diameter measurement. Catheter Cardiovasc Interv 2015;2:S67–8
Mohee K, Mynard J, Dhunnoo G, Halcox J, Obaid D. Diagnostic performance of virtual FFRderived from routine coronary angiography using 1D flow modelling: validation againstfractional flow reserve. J Am Coll Cardiol 2017;70(Suppl. 1):B306–7
Morris PD, Ryan D, Morton AC, Lycett R, Lawford PV, Hose DR, et al. Virtual fractional flowreserve from coronary angiography: modelling the significance of coronary lesions: resultsfrom the VIRTU-1 (VIRTUal Fractional Flow Reserve From Coronary Angiography) study.JACC Cardiovasc Interv 2013;6:149–57
Morris PD, Silva Soto DA, Feher JFA, Rafiroiu D, Lungu A, Varma S, et al. Fast virtual fractionalflow reserve based upon steady-state computational fluid dynamics analysis: results from theVIRTU-Fast study. JACC Basic Transl Sci 2017;2:434–46
Koo BK. Clinical Implication of 3-vessel Fractional Flow Reserve (FFR). URL: https://clinicaltrials.gov/ct2/show/NCT01621438 (accessed June 2021)
Newcombe R, Gosling R, Gunn J, Narracott A, Hose R, Morris P, et al. An atlas of computedFFR in common patterns of coronary artery disease. Heart 2019;105:A51–2
continued
DOI: 10.3310/hta25560 Health Technology Assessment 2021 Vol. 25 No. 56
© Queen’s Printer and Controller of HMSO 2021. This work was produced by Duarte et al. under the terms of a commissioning contract issued by the Secretary of Statefor Health and Social Care. This issue may be freely reproduced for the purposes of private research and study and extracts (or indeed, the full report) may be included inprofessional journals provided that suitable acknowledgement is made and the reproduction is not associated with any form of advertising. Applications for commercialreproduction should be addressed to: NIHR Journals Library, National Institute for Health Research, Evaluation, Trials and Studies Coordinating Centre, Alpha House,University of Southampton Science Park, Southampton SO16 7NS, UK.
133
TABLE 35 Excluded studies from systematic review of clinical effectiveness at full-text screening stage (continued )
Reason for exclusion Study
Nishi T, Kitahara H, Fujimoto Y, Nakayama T, Sugimoto K, Takahara M, et al. Comparison of3-dimensional and 2-dimensional quantitative coronary angiography and intravascularultrasound for functional assessment of coronary lesions. J Cardiol 2017;69:280–6
Nishi T, Nakayama T, Fujimoto Y, Kobayashi Y. Comparison of three-dimensional andtwo-dimensional quantitative coronary angiography and intravascular ultrasound for thefunctional assessment of coronary lesions. Circulation 2014;130:A17712
Papafaklis M, Muramatsu T, Ishibashi Y, Tsirka G, Bourantas C, Fotiadis D, et al. Virtual restingPd/Pa from 3-dimensional quantitative coronary angiography and flow modelling: comparisonagainst fractional flow reserve in real-world patients. J Am Coll Cardiol 2016;67:370
Papafaklis MI, Muramatsu T, Ishibashi Y, Bourantas CV, Fotiadis DI, Brilakis ES, et al. Virtualresting Pd/Pa from coronary angiography and blood flow modelling: diagnostic performanceagainst fractional flow reserve. Heart Lung Circ 2018;27:377–80
Papafaklis MI, Muramatsu T, Ishibashi Y, Lakkas LS, Nakatani S, Bourantas CV, et al. Fastvirtual functional assessment of intermediate coronary lesions using routine angiographic dataand blood flow simulation in humans: comparison with pressure wire – fractional flow reserve.EuroIntervention 2014;10:574–83
Peña J, Shaw L, Lin F, Andreini D, Cademartiri F, Chinnaiyan K, et al. The association of acutecoronary syndrome and coronary plaque features by sex: the iconic study. J Am Coll Cardiol2018;71(Suppl.):A1632
Piroth Z, Toth GG, Tonino PAL, Barbato E, Aghlmandi S, Curzen N, et al. Prognostic valueof fractional flow reserve measured immediately after drug-eluting stent implantation.Circ Cardiovasc Interv 2017;10:e005233
Pyxaras SA, Tu S, Barbati G, Barbato E, Di Serafino L, De Vroey F, et al. Quantitativeangiography and OCT for the functional assessment of mild-to-moderate coronary stenoses:comparison with FFR. EuroIntervention 2013;9:144
Pyxaras SA, Tu S, Barbati G, Barbato E, Di Serafino L, Toth G, et al. Quantitative angiographyand optical coherence tomography for the functional assessment of mild-to-moderate coronarystenoses: comparison with fractional flow reserve. Eur Heart J 2013;34(Suppl. 1):706
Pyxaras SA, Tu S, Barbato E, Barbati G, Di Serafino L, De Vroey F, et al. Quantitative angiographyand optical coherence tomography for the functional assessment of nonobstructive coronarystenoses: comparison with fractional flow reserve. Am Heart J 2013;166:1010–18.e1
Saad M, Toelg R, Khattab AA, Kassner G, Abdel-Wahab M, Richardt G. Determination ofhaemodynamic significance of intermediate coronary lesions using three-dimensional coronaryreconstruction. EuroIntervention 2009;5:573–9
Tar B, Koszegi Z. Smart calculation of the virtual functional assessment index with separatedetermination of the laminar and turbulent flow resistance. EuroIntervention 2016;France:297
Tu S, Echavarria-Pinto M, von Birgelen C, Holm NR, Pyxaras SA, Kumsars I, et al. Fractionalflow reserve and coronary bifurcation anatomy: a novel quantitative model to assess andreport the stenosis severity of bifurcation lesions. JACC Cardiovasc Interv 2015;8:564–74
Yong AS, Ng AC, Brieger D, Lowe HC, Ng MK, Kritharides L. Three-dimensional and two-dimensional quantitative coronary angiography, and their prediction of reduced fractional flowreserve. Eur Heart J 2011;32:345–53
Yu W, Huang JY, Jia D, Chen SL, Raffel C, Ding DX, et al. Diagnostic accuracy of intracoronaryoptical coherence tomography-based quantitative flow ratio for assessment of coronarystenosis. J Am Coll Cardiol 2018;72(Suppl.):B18
Zhang J, Wu W, Zou H, Fam J, Luo T, Lomarda A, et al. Diagnostic performance of fractionalflow reserve derived from simplified modelling and computed tomography coronaryangiography on discriminating ischaemic coronary lesions. J Cardiovasc Comp Tomogr2017;11(Suppl. 1):S36–7
Zhang JM, Zhong L, Luo T, Lomarda AM, Huo Y, Yap J, et al. Simplified models of non-invasivefractional flow reserve based on CT images. PLOS ONE 2016;11:e0153070
APPENDIX 2
NIHR Journals Library www.journalslibrary.nihr.ac.uk
134
TABLE 35 Excluded studies from systematic review of clinical effectiveness at full-text screening stage (continued )
Reason for exclusion Study
No eligible referencestandard
Adjedj J, Hyafil F, Muller O, Aubry P. Hemodynamic and Clinical Impact in Adult Patients withAnomalous Aortic Origin of the Right Coronary Artery Evaluated with Quantitative Flow Ratio.Paper presented at EuroPCR, 21–24 May 2019, Paris, France
Erbay A, Penzel L, Heuberger A, Steiner J, Lauten A, Skurk C, et al. The Diagnostic Reliabilityof Quantitative Flow Ratio (QFR) for Assessment of Non-Culprit Lesions in ACS Patients. Paperpresented at the Annual Meeting of the German Society of Cardiology, 24–27 April 2019,Mannheim, Germany
Hamaya R, Horie T, Yonetsu T, Sugano A, Kanaji Y, Usui E, et al. High-sensitivity cardiactroponin decrease after percutaneous coronary intervention in patients with stable coronaryartery disease. Heart Vessels 2019;34:948–56
Lauri F, Macaya F, Mejia-Renteria H, Goto S, Yeoh J, Nakayama M, et al. Angiography-derivedfunctional assessment of non-culprit coronary stenoses in primary percutaneous coronaryintervention. EuroIntervention 2020;15:e1594–601
Liu L, Yang W, Nagahara Y, Li Y, Lamooki SR, Muramatsu T, et al. The impact of imageresolution on computation of fractional flow reserve: coronary computed tomographyangiography versus 3-dimensional quantitative coronary angiography. Int J Cardiovasc Imaging2016;32:513–23
Di Girolamo D. Non Culprit Functional Evaluation With 3D Angio QFR in STEMI PCI Procedure.2016. URL: https://clinicaltrials.gov/show/NCT02998853 (accessed June 2021)
Okamoto H, Kume T, Yamada R, Imai K, Neishi Y, Uemura S. Comparison of optical coherencetomography measurements with 3-dimensional quantitative coronary angiography-derivedquantitative flow ratio. Eur Heart J 2018;39(Suppl. 1):1379–80
Okamoto H, Kume T, Yamada R, Neishi Y, Uemura S. Comparison of Optical CoherenceTomography Measurements with 3-Dimensional Quantitative Coronary Angiography – DerivedComputed Fractional Flow Reserve. Journal of the American College of Cardiology. Conference:67th Annual Scientific Session of the American College of Cardiology, 10–12 March 2018,Orlando, FL, USA
Qi Q, Liu G, Yuan Z, Liu L, Tu S, Zhao Q. Quantitative Flow Ratio-guided surgical interventionin symptomatic myocardial bridging. Cardiol J 2020;27:685–92
Sejr-Hansen M, Westra J, Thim T, Christiansen E, Eftekhari A, Kristensen SD, et al. Comparisonof quantitative flow ratio and instantaneous wave-free ratio for immediate assessment ofnon-culprit lesions in patients with ST-segment elevation myocardial infarction an iSTEMIsubstudy. J Am Coll Cardiol 2018;72(Suppl.):B248–9
Sejr-Hansen M, Westra J, Winther S, Tu S, Nissen L, Gormsen L, et al. Comparison of QFR andFFR with myocardial perfusion scintigraphy and cardiovascular magnetic resonance asreference standard. A Dan-NICAD substudy. Int J Cardiovasc Imaging 2020;36:395–402
Smit JM, Koning G, van Rosendael AR, Dibbets-Schneider P, Mertens BJ, Delgado V, et al. Therelationship between contrast-flow quantitative flow ratio and ischaemia assessed by SPECTMPI. Eur Heart J 2017;38(Suppl. 1):825
Smit JM, Koning G, van Rosendael AR, Dibbets-Schneider P, Mertens BJ, Jukema JW, et al.Relationship between coronary contrast-flow quantitative flow ratio and myocardial ischaemiaassessed by SPECT MPI. Eur J Nucl Med Mol Imaging 2017;44:1888–96
Smit JM, van Rosendael AR, Koning G, Reiber JH, Dibbets-Schneider P, Mertens BJ, et al. Therelationship between contrast-flow QFR and ischaemia assessed by SPECT MPI. Eur Heart JCardiovasc Imaging 2017;18(Suppl. 1):i45–6
continued
DOI: 10.3310/hta25560 Health Technology Assessment 2021 Vol. 25 No. 56
© Queen’s Printer and Controller of HMSO 2021. This work was produced by Duarte et al. under the terms of a commissioning contract issued by the Secretary of Statefor Health and Social Care. This issue may be freely reproduced for the purposes of private research and study and extracts (or indeed, the full report) may be included inprofessional journals provided that suitable acknowledgement is made and the reproduction is not associated with any form of advertising. Applications for commercialreproduction should be addressed to: NIHR Journals Library, National Institute for Health Research, Evaluation, Trials and Studies Coordinating Centre, Alpha House,University of Southampton Science Park, Southampton SO16 7NS, UK.
135
TABLE 35 Excluded studies from systematic review of clinical effectiveness at full-text screening stage (continued )
Reason for exclusion Study
Suetomi T, Okamura T, Nakao F, Yamada J, Oda T, Mochizuki M, et al. Impact of JailingConfiguration and Bifurcation Angle on Incomplete Stent Apposition After Single Crossover Stentingwith Final Kissing Balloon Dilatation, Assessed by Three-Dimensional OCT. Paper presented atEuroPCR, 19–22 May 2015, Paris, France
Takahashi K, Kogame N, Tomaniak M, Chichareon P, Chang CC, Modolo R, et al. TCT-326diagnostic performance of angiography-based quantitative flow ratio with respect to fractionalflow reserve derived from computed tomography angiography: insight from the SYNTAX IIItrial. J Am Coll Cardiol 2019;74(Suppl.):B324
Tomaniak M, Masdjedi K, Zandvoort L, Neleman T, Tovar M, Vermaire A, et al. TCT-331correlation between 3D-QCA-based FFR and quantitative lumen assessment by IVUS for leftmain coronary stenoses: the FAST Left Main study. J Am Coll Cardiol 2019;74(Suppl.):B329
Westra J, Winther S, Tu S, Nissen L, Gormsen L, Petersen S, et al. Comparison of quantitativeflow ratio and fractional flow reserve to identify myocardial ischaemia: validation withmyocardial perfusion scintigraphy and cardiovascular magnetic resonance. J Am Coll Cardiol2017;70(Suppl. 1):B30
No eligible outcome Kanno Y, Hoshino M, Sugano A, Kanaji Y, Yamaguchi M, Sumino Y, et al. Optical coherencetomography-defined plaque vulnerability in relation to functional stenosis severity stratifiedby fractional flow reserve and contrast quantitative flow ratio. J Am Coll Cardiol2019;73(Suppl. 1):1172
Kanno Y, Hoshino M, Sugiyama T, Kanaji Y, Yamaguchi M, Hada M, et al. Impact of subtendedmyocardial mass on the assessment of functional ischaemia as evaluated by FFR and QFR.Eur Heart J 2019;40(Suppl. 1):1654
Kleczyński P, Dziewierz A, Wiktorowicz A, Bartus S, Rzeszutko L, Bagienski M, et al. Contrastmedium Pd/Pa ratio in comparison to fractional flow reserve, quantitative flow ratio andinstantaneous wave-free ratio – a comprehensive assessment. Postepy w KardiologiiInterwencyjnej 2017;13:356
Sejr-Hansen M,Westra J, Thim T, Christiansen EH, Eftekhari A, Kristensen SD, et al. Quantitativeflow ratio for immediate assessment of nonculprit lesions in patients with ST-segment elevationmyocardial infarction – an iSTEMI substudy. Catheter Cardiovasc Interv 2019;94:686–92
Yamaguchi M, Hoshino M, Horie T, Yuki H, Kanno Y, Hirano H, et al. Evaluation of non-culpritlesions in acute coronary syndromes using quantitative flow ratio. J Am Coll Cardiol2019;73(Suppl. 1):1473
Study design noteligible
Accuracy of angiography-derived fractional flow reserve: a systematic review and meta-analysis. PROSPERO 2017 CRD42017084512 Available from: www.crd.york.ac.uk/prospero/display_record.php?ID=CRD42017084512
Anonymous. Corrigendum to: diagnostic performance of angiography-derived fractional flowreserve: a systematic review and Bayesian meta-analysis. Eur Heart J 2019;40:356
Asano T, Katagiri Y, Collet C, Tenekecioglu E, Miyazaki Y, Sotomi Y, et al. Functionalcomparison between BuMA Supreme biodegradable polymer sirolimus-eluting and durablepolymer zotarolimus-eluting coronary stents using quantitative flow ratio: PIONEER QFRSubstudy. EuroIntervention 2018;14:e570–9
Chahour K, Aboulaich R, Habbal A, Abdelkhirane C, Zemzeme N. Numerical simulation of thefractional flow reserve (FFR). Math Model Nat Phenom 2018;13
Collet C, Onuma Y, Sonck J, Asano T, Vandeloo B, Kornowski R, et al. Diagnostic performanceof angiography-derived fractional flow reserve: a systematic review and Bayesian meta-analysis.Eur Heart J 2018;39:3314–21
Dan K, Shinoda A, Tsuzura D, Garcia-Garcia HM. Triple coronary vessel disease includingdouble vessel chronic total occlusion: quantitative flow ratio minimises injury of the singlevessel that provides collaterals. Cardiol J 2019;26:407–9
Collet C, Onuma Y, Sonck J, Asano T, Vandeloo B et al. Corrigendum to: Diagnostic performanceof angiography-derived fractional flow reserve: a systematic review and Bayesian meta-analysis.Eur Heart J 2019;40:356–56
APPENDIX 2
NIHR Journals Library www.journalslibrary.nihr.ac.uk
136
TABLE 35 Excluded studies from systematic review of clinical effectiveness at full-text screening stage (continued )
Reason for exclusion Study
Erbay A, Abdelwahed YS, Stahli BE, Landmesser U, Leistner DM. The danger lurks dastardly inthe coronary vessel wall: spotlight on patients’ vulnerability. Eur Heart J 2018;39:1656
Cesaro A, Gragnano F, Di Girolamo D, Moscarella E, Diana V, Pariggiano I, et al. Functionalassessment of coronary stenosis: an overview of available techniques. Is quantitative flow ratioa step to the future? Expert Rev Cardiovasc Ther 2018;16:951–62
Giddens DP. Computing fractional flow reserve during coronary angiography: how good is goodenough? JACC Cardiovasc Interv 2016;9:2036–8
Guillon B, Rubimbura V, Fournier S, Eeckhout E, Schiele F, Muller O, et al. Validation ofQuantitative Flow Reserve and Residual Quantitative Flow Reserve To Predict Fractional FlowReserve Post Stenting from the DOCTORS (Does Optical Coherence Tomography Optimise Results ofStenting) Study Population. Paper presented at the Joint Annual Meeting of the Swiss Society ofCardiology and the Swiss Society of Cardiac Surgery, 19–21 June 2019, Interlaken, Switzerland
Hirshfeld Jr JW, Nathan AS. QFR and FFRCT: accurate enough? JACC Cardiovasc Interv2019;12:2060–3
Howard JP, Murthy VL. A song of pressure and flow, or there and back again. JACC CardiovascInterv 2018;11:754–6
Lansky AJ, Pietras C. Fractional flow reserve from 3-dimensional quantitative coronaryangiography: fresh light through an old window. JACC Cardiovasc Interv 2014;7:778–80
Mejia-Renteria H, Tu S, Macaya F, Escaned J. Influence of coronary microcirculatorydysfunction on FFR calculation based on computational fluid dynamics. Eur Heart J CardiovascImaging 2017;18:1066
Morris PD, van de Vosse FN, Lawford PV, Hose DR, Gunn JP. ‘Virtual’ (computed) fractionalflow reserve: current challenges and limitations. JACC Cardiovasc Interv 2015;8:1009–17
Nørgaard BL, Ko B. Angiography based quantitative flow ratio in coronary artery disease:mimic of FFR – ready for clinical use? Int J Cardiol 2019;279:29–30
Rasmussen LD, Winther S, Westra J, Isaksen C, Ejlersen JA, Brix L, et al. Danish study ofNon-Invasive testing in Coronary Artery Disease 2 (Dan-NICAD 2): study design for acontrolled study of diagnostic accuracy. Am Heart J 2019;215:114–28
Rubimbura V, Guillon B, Fournier S, Amabile N, Chi Pan C, Combaret N, et al. Validation ofQuantitative Flow Reserve and Residual Quantitative Flow Reserve to Predict FFR Post-stenting fromthe Does Optical Coherence Tomography Optimise Results of Stenting Study (DOCTORS) Population.Paper presented at EuroPCR, 21–24 May 2019, Paris, France.
Tang CX, Wang YN, Zhou F, Schoepf UJ, Assen MV, Stroud RE, et al. Diagnostic performance offractional flow reserve derived from coronary CT angiography for detection of lesion-specificischemia: a multi-center study and meta-analysis. Eur J Radiol 2019;116:90–7
Tu S, Bourantas C, Nørgaard B, Kassab G, Koo B-K, Reiber J. Image-based assessment offractional flow reserve. EuroIntervention 2015;11(Suppl. V):V50–4
Tu S, Westra J, Yang J, Li Y, Holm N, Reiber J. Functional Coronary Assessment Based onThree-Dimensional Quantitative Coronary Angiography. In Escaned J, Serruys PW, editors.Coronary Stenosis Imaging, Structure and Physiology, Part IV. London: PCR Publishing; 2010
Vestergaard MB, Andersen BK, Westra JS, Christiansen EH, Holm NR. Optimal assessment oflesion severity in the left anterior descending artery by quantitative flow ratio. The wire-freeinvasive functional imaging WIFI LAD study. JACCCardiovasc Interv 2017;10(Suppl.):S50–1
Westra J, Tu S, Campo G, Qiao S, Matsuo H, Qu X, et al. Diagnostic performance of quantitativeflow ratio in prospectively enrolled patients: an individual patient-data meta-analysis. CatheterCardiovasc Interv 2019;94:693–701
Xing Z, Pei J, Huang J, Hu X, Gao S. Diagnostic performance of QFR for the evaluation ofintermediate coronary artery stenosis confirmed by fractional flow reserve. Braz J CardiovascSurg 2019;34:165–72
continued
DOI: 10.3310/hta25560 Health Technology Assessment 2021 Vol. 25 No. 56
© Queen’s Printer and Controller of HMSO 2021. This work was produced by Duarte et al. under the terms of a commissioning contract issued by the Secretary of Statefor Health and Social Care. This issue may be freely reproduced for the purposes of private research and study and extracts (or indeed, the full report) may be included inprofessional journals provided that suitable acknowledgement is made and the reproduction is not associated with any form of advertising. Applications for commercialreproduction should be addressed to: NIHR Journals Library, National Institute for Health Research, Evaluation, Trials and Studies Coordinating Centre, Alpha House,University of Southampton Science Park, Southampton SO16 7NS, UK.
137

TABLE 35 Excluded studies from systematic review of clinical effectiveness at full-text screening stage (continued )
Reason for exclusion Study
Zaleska M, Koltowski L, Maksym J, Tomaniak M, Opolski M, Kochman J. Alternative methodsfor functional assessment of intermediate coronary lesions. Cardiol J 2019;27:825–35
Zhang J, Zhang R, Guo L. Diagnostic potency of contrast induced fractional flow reserve versusquantitative flow ratio for assessing the functional significance of coronary stenosis: a meta-analysis. J Interv Cardiol 2020;2020:7352150
Zhenhua X. Diagnostic performance of quantitative flow ratio (QFR) for the evaluation ofintermediate coronary stenosis severity confirmed by fractional flow reserve. 2018
Zuo W, Yang M, Chen Y, Xie A, Chen L, Ma G. Meta-analysis of diagnostic performance ofinstantaneous wave-free ratio versus quantitative flow ratio for detecting the functionalsignificance of coronary stenosis. BioMed Res Int 2019;2019:5828931
APPENDIX 2
NIHR Journals Library www.journalslibrary.nihr.ac.uk
138
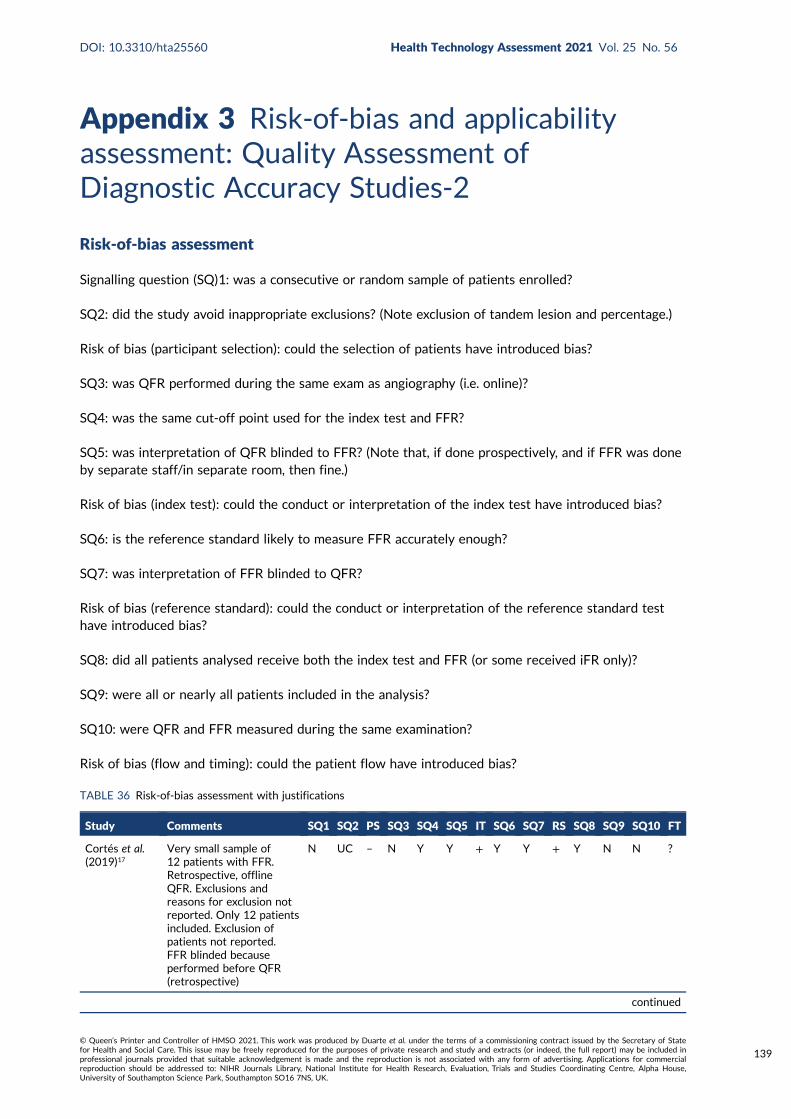
Appendix 3 Risk-of-bias and applicabilityassessment: Quality Assessment ofDiagnostic Accuracy Studies-2
Risk-of-bias assessment
Signalling question (SQ)1: was a consecutive or random sample of patients enrolled?
SQ2: did the study avoid inappropriate exclusions? (Note exclusion of tandem lesion and percentage.)
Risk of bias (participant selection): could the selection of patients have introduced bias?
SQ3: was QFR performed during the same exam as angiography (i.e. online)?
SQ4: was the same cut-off point used for the index test and FFR?
SQ5: was interpretation of QFR blinded to FFR? (Note that, if done prospectively, and if FFR was doneby separate staff/in separate room, then fine.)
Risk of bias (index test): could the conduct or interpretation of the index test have introduced bias?
SQ6: is the reference standard likely to measure FFR accurately enough?
SQ7: was interpretation of FFR blinded to QFR?
Risk of bias (reference standard): could the conduct or interpretation of the reference standard testhave introduced bias?
SQ8: did all patients analysed receive both the index test and FFR (or some received iFR only)?
SQ9: were all or nearly all patients included in the analysis?
SQ10: were QFR and FFR measured during the same examination?
Risk of bias (flow and timing): could the patient flow have introduced bias?
TABLE 36 Risk-of-bias assessment with justifications
Study Comments SQ1 SQ2 PS SQ3 SQ4 SQ5 IT SQ6 SQ7 RS SQ8 SQ9 SQ10 FT
Cortés et al.(2019)17
Very small sample of12 patients with FFR.Retrospective, offlineQFR. Exclusions andreasons for exclusion notreported. Only 12 patientsincluded. Exclusion ofpatients not reported.FFR blinded becauseperformed before QFR(retrospective)
N UC – N Y Y + Y Y + Y N N ?
continued
DOI: 10.3310/hta25560 Health Technology Assessment 2021 Vol. 25 No. 56
© Queen’s Printer and Controller of HMSO 2021. This work was produced by Duarte et al. under the terms of a commissioning contract issued by the Secretary of Statefor Health and Social Care. This issue may be freely reproduced for the purposes of private research and study and extracts (or indeed, the full report) may be included inprofessional journals provided that suitable acknowledgement is made and the reproduction is not associated with any form of advertising. Applications for commercialreproduction should be addressed to: NIHR Journals Library, National Institute for Health Research, Evaluation, Trials and Studies Coordinating Centre, Alpha House,University of Southampton Science Park, Southampton SO16 7NS, UK.
139
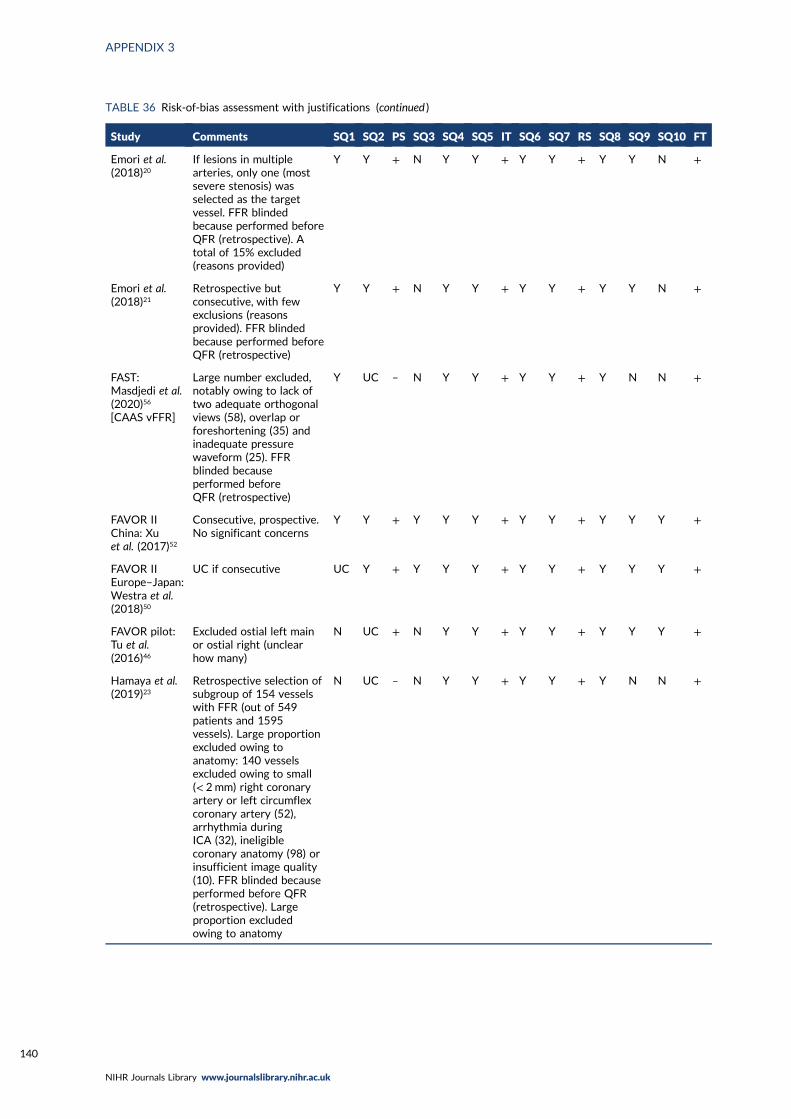
TABLE 36 Risk-of-bias assessment with justifications (continued )
Study Comments SQ1 SQ2 PS SQ3 SQ4 SQ5 IT SQ6 SQ7 RS SQ8 SQ9 SQ10 FT
Emori et al.(2018)20
If lesions in multiplearteries, only one (mostsevere stenosis) wasselected as the targetvessel. FFR blindedbecause performed beforeQFR (retrospective). Atotal of 15% excluded(reasons provided)
Y Y + N Y Y + Y Y + Y Y N +
Emori et al.(2018)21
Retrospective butconsecutive, with fewexclusions (reasonsprovided). FFR blindedbecause performed beforeQFR (retrospective)
Y Y + N Y Y + Y Y + Y Y N +
FAST:Masdjedi et al.(2020)56
[CAAS vFFR]
Large number excluded,notably owing to lack oftwo adequate orthogonalviews (58), overlap orforeshortening (35) andinadequate pressurewaveform (25). FFRblinded becauseperformed beforeQFR (retrospective)
Y UC – N Y Y + Y Y + Y N N +
FAVOR IIChina: Xuet al. (2017)52
Consecutive, prospective.No significant concerns
Y Y + Y Y Y + Y Y + Y Y Y +
FAVOR IIEurope–Japan:Westra et al.(2018)50
UC if consecutive UC Y + Y Y Y + Y Y + Y Y Y +
FAVOR pilot:Tu et al.(2016)46
Excluded ostial left mainor ostial right (unclearhow many)
N UC + N Y Y + Y Y + Y Y Y +
Hamaya et al.(2019)23
Retrospective selection ofsubgroup of 154 vesselswith FFR (out of 549patients and 1595vessels). Large proportionexcluded owing toanatomy: 140 vesselsexcluded owing to small(< 2 mm) right coronaryartery or left circumflexcoronary artery (52),arrhythmia duringICA (32), ineligiblecoronary anatomy (98) orinsufficient image quality(10). FFR blinded becauseperformed before QFR(retrospective). Largeproportion excludedowing to anatomy
N UC – N Y Y + Y Y + Y N N +
APPENDIX 3
NIHR Journals Library www.journalslibrary.nihr.ac.uk
140
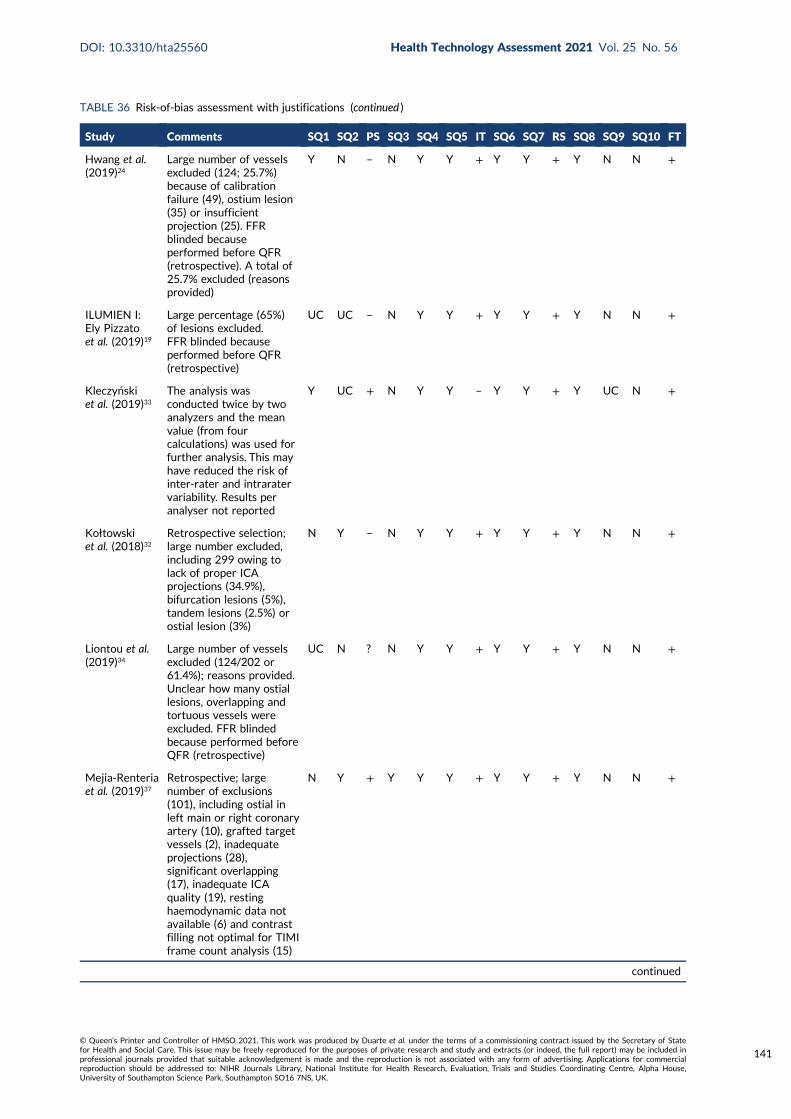
TABLE 36 Risk-of-bias assessment with justifications (continued )
Study Comments SQ1 SQ2 PS SQ3 SQ4 SQ5 IT SQ6 SQ7 RS SQ8 SQ9 SQ10 FT
Hwang et al.(2019)24
Large number of vesselsexcluded (124; 25.7%)because of calibrationfailure (49), ostium lesion(35) or insufficientprojection (25). FFRblinded becauseperformed before QFR(retrospective). A total of25.7% excluded (reasonsprovided)
Y N – N Y Y + Y Y + Y N N +
ILUMIEN I:Ely Pizzatoet al. (2019)19
Large percentage (65%)of lesions excluded.FFR blinded becauseperformed before QFR(retrospective)
UC UC – N Y Y + Y Y + Y N N +
Kleczyńskiet al. (2019)33
The analysis wasconducted twice by twoanalyzers and the meanvalue (from fourcalculations) was used forfurther analysis. This mayhave reduced the risk ofinter-rater and intraratervariability. Results peranalyser not reported
Y UC + N Y Y – Y Y + Y UC N +
Kołtowskiet al. (2018)32
Retrospective selection;large number excluded,including 299 owing tolack of proper ICAprojections (34.9%),bifurcation lesions (5%),tandem lesions (2.5%) orostial lesion (3%)
N Y – N Y Y + Y Y + Y N N +
Liontou et al.(2019)34
Large number of vesselsexcluded (124/202 or61.4%); reasons provided.Unclear how many ostiallesions, overlapping andtortuous vessels wereexcluded. FFR blindedbecause performed beforeQFR (retrospective)
UC N ? N Y Y + Y Y + Y N N +
Mejia-Renteriaet al. (2019)37
Retrospective; largenumber of exclusions(101), including ostial inleft main or right coronaryartery (10), grafted targetvessels (2), inadequateprojections (28),significant overlapping(17), inadequate ICAquality (19), restinghaemodynamic data notavailable (6) and contrastfilling not optimal for TIMIframe count analysis (15)
N Y + Y Y Y + Y Y + Y N N +
continued
DOI: 10.3310/hta25560 Health Technology Assessment 2021 Vol. 25 No. 56
© Queen’s Printer and Controller of HMSO 2021. This work was produced by Duarte et al. under the terms of a commissioning contract issued by the Secretary of Statefor Health and Social Care. This issue may be freely reproduced for the purposes of private research and study and extracts (or indeed, the full report) may be included inprofessional journals provided that suitable acknowledgement is made and the reproduction is not associated with any form of advertising. Applications for commercialreproduction should be addressed to: NIHR Journals Library, National Institute for Health Research, Evaluation, Trials and Studies Coordinating Centre, Alpha House,University of Southampton Science Park, Southampton SO16 7NS, UK.
141
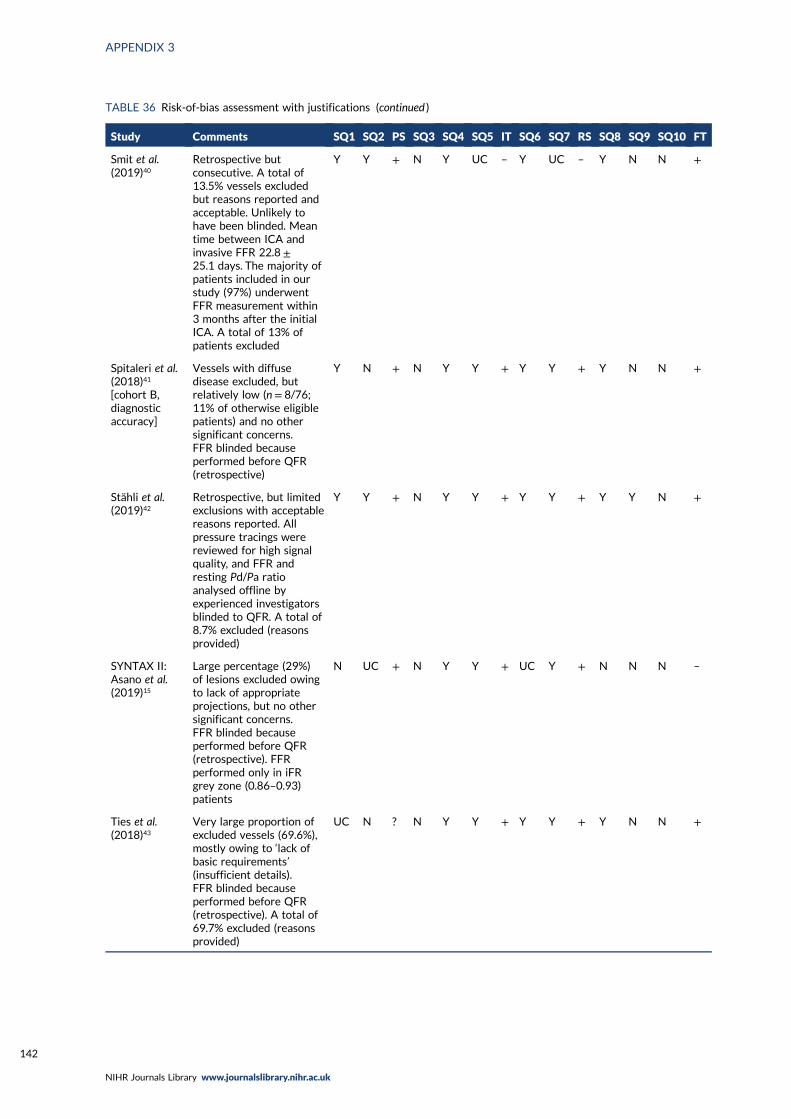
TABLE 36 Risk-of-bias assessment with justifications (continued )
Study Comments SQ1 SQ2 PS SQ3 SQ4 SQ5 IT SQ6 SQ7 RS SQ8 SQ9 SQ10 FT
Smit et al.(2019)40
Retrospective butconsecutive. A total of13.5% vessels excludedbut reasons reported andacceptable. Unlikely tohave been blinded. Meantime between ICA andinvasive FFR 22.8 ±25.1 days. The majority ofpatients included in ourstudy (97%) underwentFFR measurement within3 months after the initialICA. A total of 13% ofpatients excluded
Y Y + N Y UC – Y UC – Y N N +
Spitaleri et al.(2018)41
[cohort B,diagnosticaccuracy]
Vessels with diffusedisease excluded, butrelatively low (n= 8/76;11% of otherwise eligiblepatients) and no othersignificant concerns.FFR blinded becauseperformed before QFR(retrospective)
Y N + N Y Y + Y Y + Y N N +
Stähli et al.(2019)42
Retrospective, but limitedexclusions with acceptablereasons reported. Allpressure tracings werereviewed for high signalquality, and FFR andresting Pd/Pa ratioanalysed offline byexperienced investigatorsblinded to QFR. A total of8.7% excluded (reasonsprovided)
Y Y + N Y Y + Y Y + Y Y N +
SYNTAX II:Asano et al.(2019)15
Large percentage (29%)of lesions excluded owingto lack of appropriateprojections, but no othersignificant concerns.FFR blinded becauseperformed before QFR(retrospective). FFRperformed only in iFRgrey zone (0.86–0.93)patients
N UC + N Y Y + UC Y + N N N –
Ties et al.(2018)43
Very large proportion ofexcluded vessels (69.6%),mostly owing to ‘lack ofbasic requirements’(insufficient details).FFR blinded becauseperformed before QFR(retrospective). A total of69.7% excluded (reasonsprovided)
UC N ? N Y Y + Y Y + Y N N +
APPENDIX 3
NIHR Journals Library www.journalslibrary.nihr.ac.uk
142
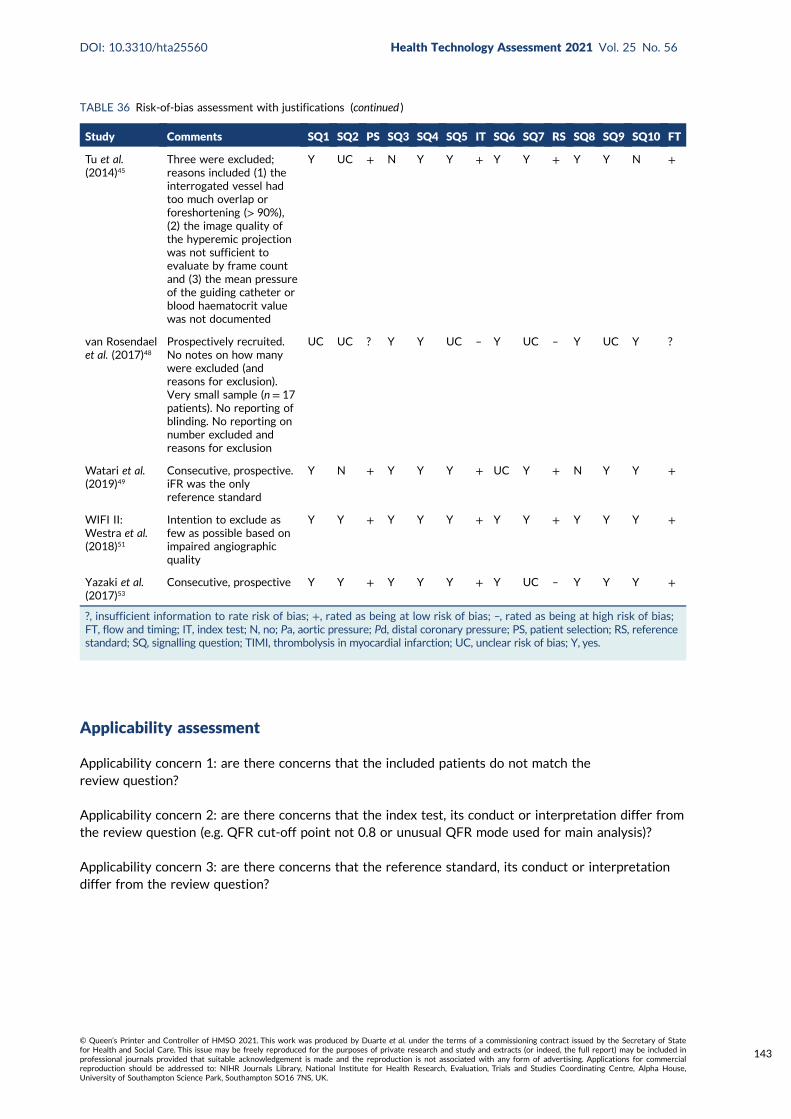
Applicability assessment
Applicability concern 1: are there concerns that the included patients do not match thereview question?
Applicability concern 2: are there concerns that the index test, its conduct or interpretation differ fromthe review question (e.g. QFR cut-off point not 0.8 or unusual QFR mode used for main analysis)?
Applicability concern 3: are there concerns that the reference standard, its conduct or interpretationdiffer from the review question?
TABLE 36 Risk-of-bias assessment with justifications (continued )
Study Comments SQ1 SQ2 PS SQ3 SQ4 SQ5 IT SQ6 SQ7 RS SQ8 SQ9 SQ10 FT
Tu et al.(2014)45
Three were excluded;reasons included (1) theinterrogated vessel hadtoo much overlap orforeshortening (> 90%),(2) the image quality ofthe hyperemic projectionwas not sufficient toevaluate by frame countand (3) the mean pressureof the guiding catheter orblood haematocrit valuewas not documented
Y UC + N Y Y + Y Y + Y Y N +
van Rosendaelet al. (2017)48
Prospectively recruited.No notes on how manywere excluded (andreasons for exclusion).Very small sample (n = 17patients). No reporting ofblinding. No reporting onnumber excluded andreasons for exclusion
UC UC ? Y Y UC – Y UC – Y UC Y ?
Watari et al.(2019)49
Consecutive, prospective.iFR was the onlyreference standard
Y N + Y Y Y + UC Y + N Y Y +
WIFI II:Westra et al.(2018)51
Intention to exclude asfew as possible based onimpaired angiographicquality
Y Y + Y Y Y + Y Y + Y Y Y +
Yazaki et al.(2017)53
Consecutive, prospective Y Y + Y Y Y + Y UC – Y Y Y +
?, insufficient information to rate risk of bias; +, rated as being at low risk of bias; –, rated as being at high risk of bias;FT, flow and timing; IT, index test; N, no; Pa, aortic pressure; Pd, distal coronary pressure; PS, patient selection; RS, referencestandard; SQ, signalling question; TIMI, thrombolysis in myocardial infarction; UC, unclear risk of bias; Y, yes.
DOI: 10.3310/hta25560 Health Technology Assessment 2021 Vol. 25 No. 56
© Queen’s Printer and Controller of HMSO 2021. This work was produced by Duarte et al. under the terms of a commissioning contract issued by the Secretary of Statefor Health and Social Care. This issue may be freely reproduced for the purposes of private research and study and extracts (or indeed, the full report) may be included inprofessional journals provided that suitable acknowledgement is made and the reproduction is not associated with any form of advertising. Applications for commercialreproduction should be addressed to: NIHR Journals Library, National Institute for Health Research, Evaluation, Trials and Studies Coordinating Centre, Alpha House,University of Southampton Science Park, Southampton SO16 7NS, UK.
143
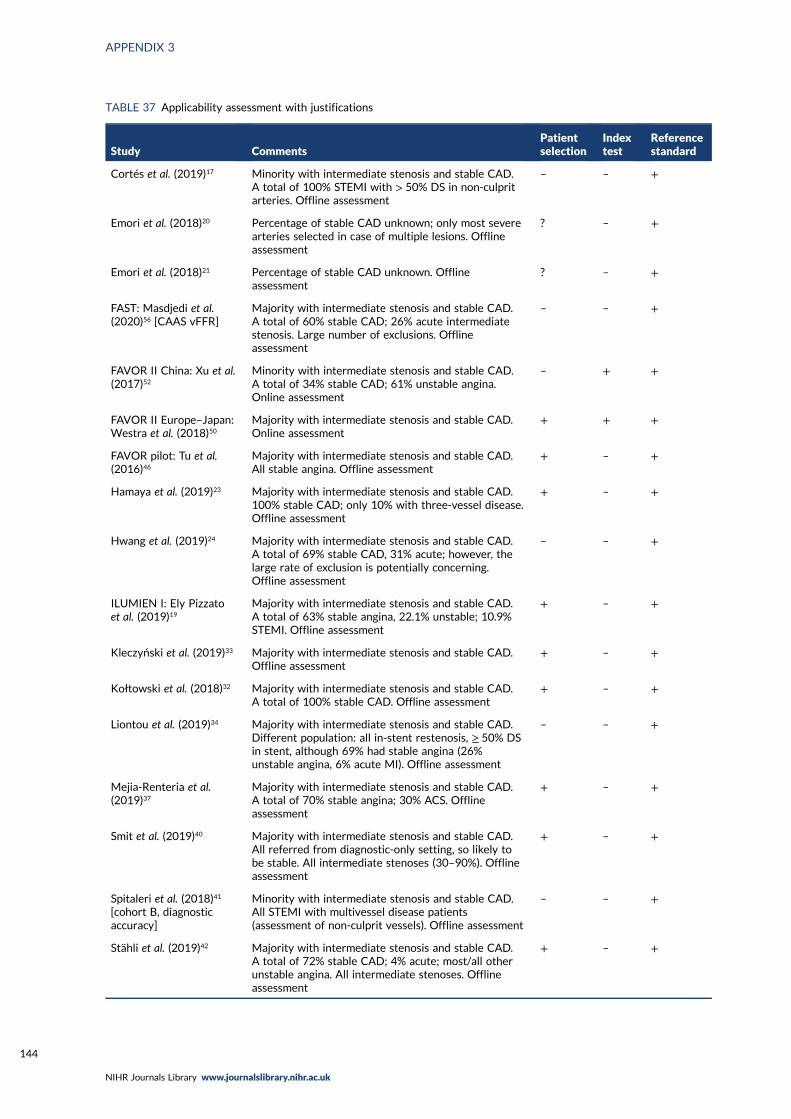
TABLE 37 Applicability assessment with justifications
Study CommentsPatientselection
Indextest
Referencestandard
Cortés et al. (2019)17 Minority with intermediate stenosis and stable CAD.A total of 100% STEMI with > 50% DS in non-culpritarteries. Offline assessment
– – +
Emori et al. (2018)20 Percentage of stable CAD unknown; only most severearteries selected in case of multiple lesions. Offlineassessment
? – +
Emori et al. (2018)21 Percentage of stable CAD unknown. Offlineassessment
? – +
FAST: Masdjedi et al.(2020)56 [CAAS vFFR]
Majority with intermediate stenosis and stable CAD.A total of 60% stable CAD; 26% acute intermediatestenosis. Large number of exclusions. Offlineassessment
– – +
FAVOR II China: Xu et al.(2017)52
Minority with intermediate stenosis and stable CAD.A total of 34% stable CAD; 61% unstable angina.Online assessment
– + +
FAVOR II Europe–Japan:Westra et al. (2018)50
Majority with intermediate stenosis and stable CAD.Online assessment
+ + +
FAVOR pilot: Tu et al.(2016)46
Majority with intermediate stenosis and stable CAD.All stable angina. Offline assessment
+ – +
Hamaya et al. (2019)23 Majority with intermediate stenosis and stable CAD.100% stable CAD; only 10% with three-vessel disease.Offline assessment
+ – +
Hwang et al. (2019)24 Majority with intermediate stenosis and stable CAD.A total of 69% stable CAD, 31% acute; however, thelarge rate of exclusion is potentially concerning.Offline assessment
– – +
ILUMIEN I: Ely Pizzatoet al. (2019)19
Majority with intermediate stenosis and stable CAD.A total of 63% stable angina, 22.1% unstable; 10.9%STEMI. Offline assessment
+ – +
Kleczyński et al. (2019)33 Majority with intermediate stenosis and stable CAD.Offline assessment
+ – +
Kołtowski et al. (2018)32 Majority with intermediate stenosis and stable CAD.A total of 100% stable CAD. Offline assessment
+ – +
Liontou et al. (2019)34 Majority with intermediate stenosis and stable CAD.Different population: all in-stent restenosis, ≥ 50% DSin stent, although 69% had stable angina (26%unstable angina, 6% acute MI). Offline assessment
– – +
Mejia-Renteria et al.(2019)37
Majority with intermediate stenosis and stable CAD.A total of 70% stable angina; 30% ACS. Offlineassessment
+ – +
Smit et al. (2019)40 Majority with intermediate stenosis and stable CAD.All referred from diagnostic-only setting, so likely tobe stable. All intermediate stenoses (30–90%). Offlineassessment
+ – +
Spitaleri et al. (2018)41
[cohort B, diagnosticaccuracy]
Minority with intermediate stenosis and stable CAD.All STEMI with multivessel disease patients(assessment of non-culprit vessels). Offline assessment
– – +
Stähli et al. (2019)42 Majority with intermediate stenosis and stable CAD.A total of 72% stable CAD; 4% acute; most/all otherunstable angina. All intermediate stenoses. Offlineassessment
+ – +
APPENDIX 3
NIHR Journals Library www.journalslibrary.nihr.ac.uk
144
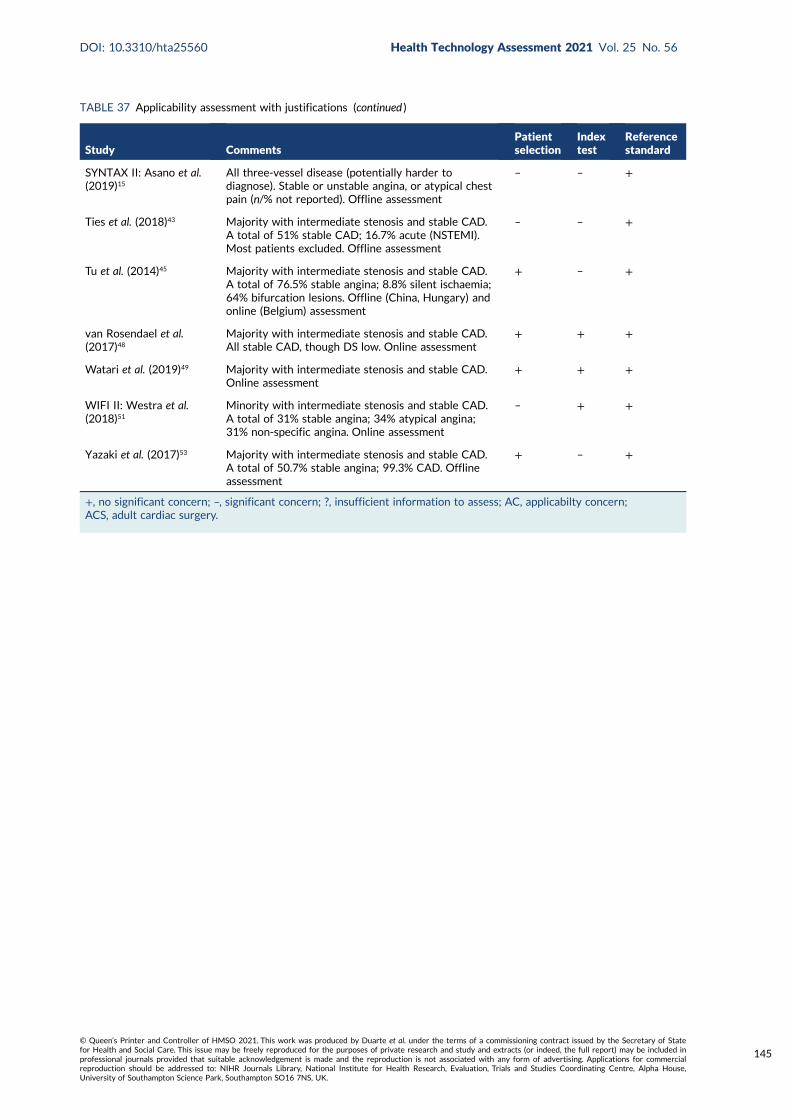
TABLE 37 Applicability assessment with justifications (continued )
Study CommentsPatientselection
Indextest
Referencestandard
SYNTAX II: Asano et al.(2019)15
All three-vessel disease (potentially harder todiagnose). Stable or unstable angina, or atypical chestpain (n/% not reported). Offline assessment
– – +
Ties et al. (2018)43 Majority with intermediate stenosis and stable CAD.A total of 51% stable CAD; 16.7% acute (NSTEMI).Most patients excluded. Offline assessment
– – +
Tu et al. (2014)45 Majority with intermediate stenosis and stable CAD.A total of 76.5% stable angina; 8.8% silent ischaemia;64% bifurcation lesions. Offline (China, Hungary) andonline (Belgium) assessment
+ – +
van Rosendael et al.(2017)48
Majority with intermediate stenosis and stable CAD.All stable CAD, though DS low. Online assessment
+ + +
Watari et al. (2019)49 Majority with intermediate stenosis and stable CAD.Online assessment
+ + +
WIFI II: Westra et al.(2018)51
Minority with intermediate stenosis and stable CAD.A total of 31% stable angina; 34% atypical angina;31% non-specific angina. Online assessment
– + +
Yazaki et al. (2017)53 Majority with intermediate stenosis and stable CAD.A total of 50.7% stable angina; 99.3% CAD. Offlineassessment
+ – +
+, no significant concern; –, significant concern; ?, insufficient information to assess; AC, applicabilty concern;ACS, adult cardiac surgery.
DOI: 10.3310/hta25560 Health Technology Assessment 2021 Vol. 25 No. 56
© Queen’s Printer and Controller of HMSO 2021. This work was produced by Duarte et al. under the terms of a commissioning contract issued by the Secretary of Statefor Health and Social Care. This issue may be freely reproduced for the purposes of private research and study and extracts (or indeed, the full report) may be included inprofessional journals provided that suitable acknowledgement is made and the reproduction is not associated with any form of advertising. Applications for commercialreproduction should be addressed to: NIHR Journals Library, National Institute for Health Research, Evaluation, Trials and Studies Coordinating Centre, Alpha House,University of Southampton Science Park, Southampton SO16 7NS, UK.
145

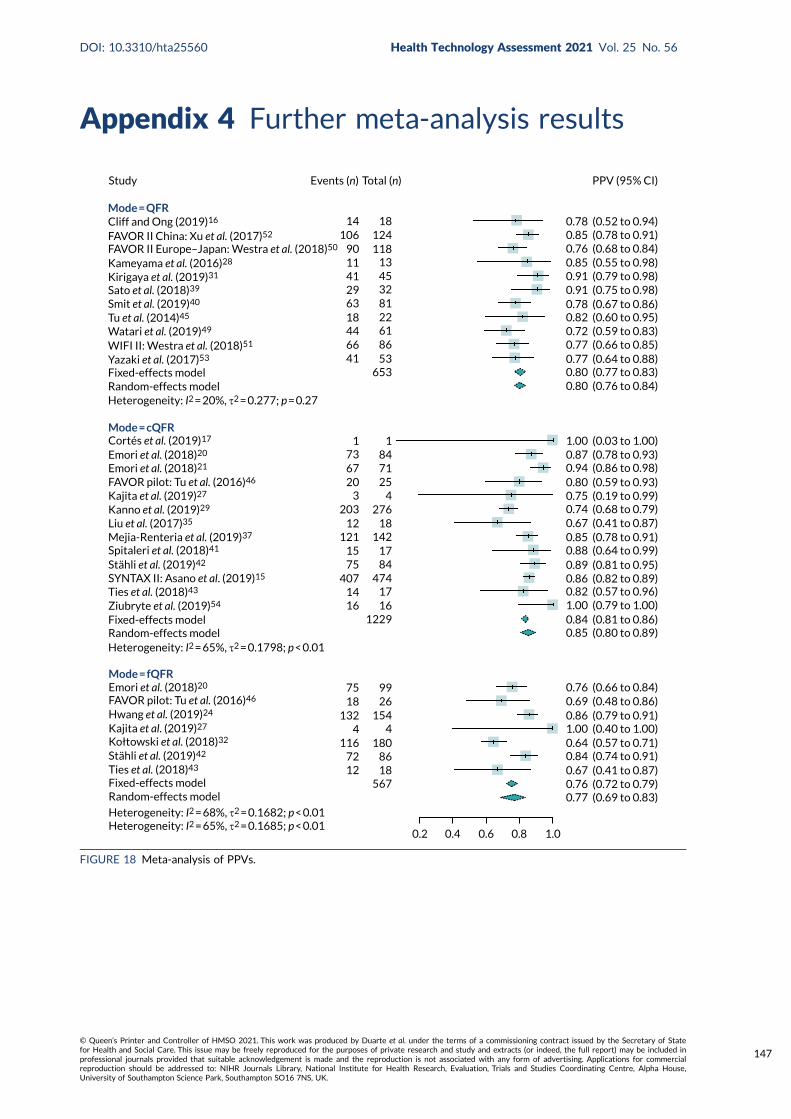
Appendix 4 Further meta-analysis results
Study
Mode = QFR
Heterogeneity: I2 = 20%, τ2 = 0.277; p = 0.27
Mode = cQFR
Heterogeneity: I2 = 65%, τ2 = 0.1798; p < 0.01
Mode = fQFR
Heterogeneity: I2 = 68%, τ2 = 0.1682; p < 0.01Heterogeneity: I2 = 65%, τ2 = 0.1685; p < 0.01
Events (n) Total (n) PPV (95% CI)
14106
901141296318446641 53
86
653
612281324513
118124
18
1 173 84
716720 25
3 4203
12 18276
121 1421715
75407
84474
171416 16
1229
75 9918
1324 4
15426
1801167212 18
86
567
0.2 0.4 0.6 0.8 1.0
0.78 (0.52 to 0.94)0.85 (0.78 to 0.91)0.76 (0.68 to 0.84)0.85 (0.55 to 0.98)0.91 (0.79 to 0.98)0.91 (0.75 to 0.98)0.78 (0.67 to 0.86)0.82 (0.60 to 0.95)0.72 (0.59 to 0.83)0.77 (0.66 to 0.85)0.77 (0.64 to 0.88)0.80 (0.77 to 0.83)0.80 (0.76 to 0.84)
0.87 (0.78 to 0.93)0.94 (0.86 to 0.98)0.80 (0.59 to 0.93)0.75 (0.19 to 0.99)0.74 (0.68 to 0.79)0.67 (0.41 to 0.87)0.85 (0.78 to 0.91)0.88 (0.64 to 0.99)0.89 (0.81 to 0.95)0.86 (0.82 to 0.89)0.82 (0.57 to 0.96)
0.84 (0.81 to 0.86)0.85 (0.80 to 0.89)
0.76 (0.66 to 0.84)0.69 (0.48 to 0.86)0.86 (0.79 to 0.91)1.00 (0.40 to 1.00)0.64 (0.57 to 0.71)0.84 (0.74 to 0.91)0.67 (0.41 to 0.87)0.76 (0.72 to 0.79)0.77 (0.69 to 0.83)
1.00 (0.79 to 1.00)
1.00 (0.03 to 1.00)
Cliff and Ong (2019)16
FAVOR II China: Xu et al. (2017)52
FAVOR II Europe–Japan: Westra et al. (2018)50
Kameyama et al. (2016)28
Kirigaya et al. (2019)31
Sato et al. (2018)39
Smit et al. (2019)40
Tu et al. (2014)45
Watari et al. (2019)49
WIFI II: Westra et al. (2018)51
Yazaki et al. (2017)53
Fixed-effects modelRandom-effects model
Cortés et al. (2019)17
Emori et al. (2018)20
Emori et al. (2018)21
FAVOR pilot: Tu et al. (2016)46
Kajita et al. (2019)27
Kanno et al. (2019)29
Liu et al. (2017)35
Mejia-Renteria et al. (2019)37
Spitaleri et al. (2018)41
Stähli et al. (2019)42
SYNTAX II: Asano et al. (2019)15
Ties et al. (2018)43
Ziubryte et al. (2019)54
Fixed-effects modelRandom-effects model
Emori et al. (2018)20
FAVOR pilot: Tu et al. (2016)46
Fixed-effects modelRandom-effects model
Hwang et al. (2019)24
Kajita et al. (2019)27
Stähli et al. (2019)42
Ties et al. (2018)43
Kołtowski et al. (2018)32
FIGURE 18 Meta-analysis of PPVs.
DOI: 10.3310/hta25560 Health Technology Assessment 2021 Vol. 25 No. 56
© Queen’s Printer and Controller of HMSO 2021. This work was produced by Duarte et al. under the terms of a commissioning contract issued by the Secretary of Statefor Health and Social Care. This issue may be freely reproduced for the purposes of private research and study and extracts (or indeed, the full report) may be included inprofessional journals provided that suitable acknowledgement is made and the reproduction is not associated with any form of advertising. Applications for commercialreproduction should be addressed to: NIHR Journals Library, National Institute for Health Research, Evaluation, Trials and Studies Coordinating Centre, Alpha House,University of Southampton Science Park, Southampton SO16 7NS, UK.
147
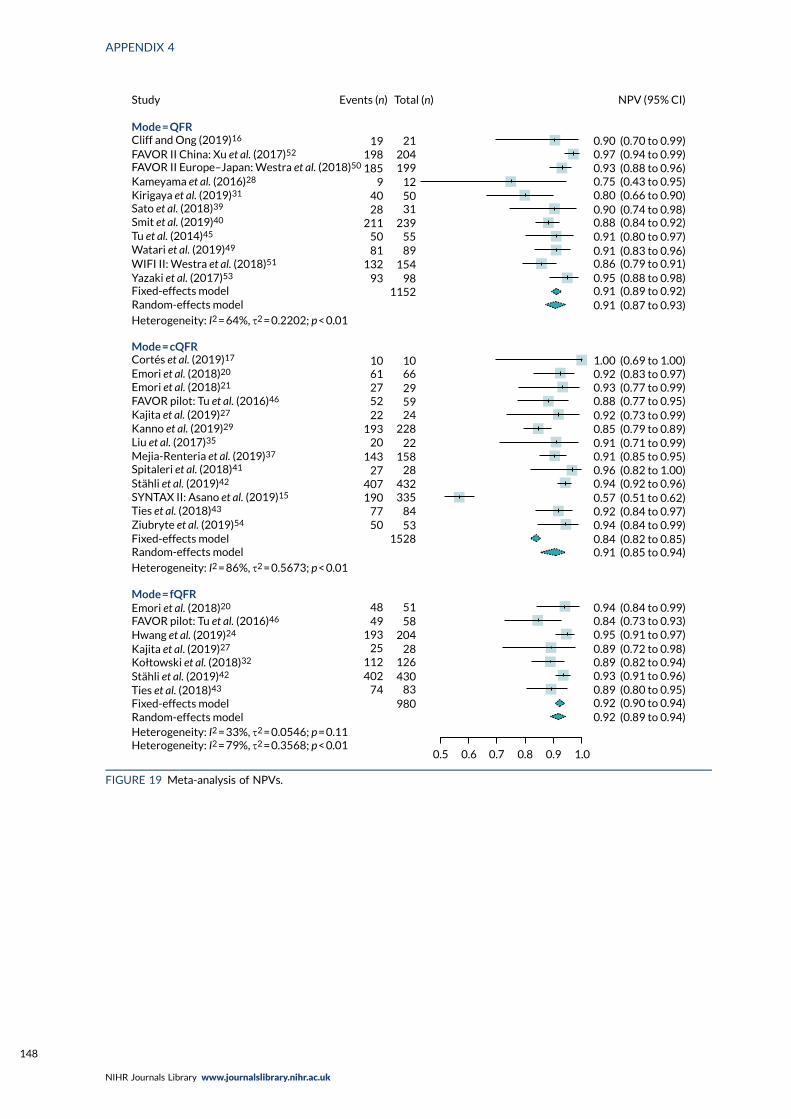
Mode = fQFR
Mode = cQFR
Study
Mode = QFR
5158
20428
126430
83980
74402112
25
4948
193
1528
10 10
Events (n) Total (n)
19 21198185
94028
2115081
13293
1152
NPV (95% CI)
0.5 0.6 0.7 0.8 0.9 1.0
61 66275222
19320
14327
407190
7750 53
84335
28432
15822
228245929
98154
8955
239315012
199204
0.90 (0.70 to 0.99)0.97 (0.94 to 0.99)0.93 (0.88 to 0.96)0.75 (0.43 to 0.95)0.80 (0.66 to 0.90)0.90 (0.74 to 0.98)0.88 (0.84 to 0.92)0.91 (0.80 to 0.97)0.91 (0.83 to 0.96)0.86 (0.79 to 0.91)0.95 (0.88 to 0.98)0.91 (0.89 to 0.92)0.91 (0.87 to 0.93)
1.00 (0.69 to 1.00)0.92 (0.83 to 0.97)0.93 (0.77 to 0.99)0.88 (0.77 to 0.95)0.92 (0.73 to 0.99)0.85 (0.79 to 0.89)0.91 (0.71 to 0.99)0.91 (0.85 to 0.95)0.96 (0.82 to 1.00)0.94 (0.92 to 0.96)0.57 (0.51 to 0.62)0.92 (0.84 to 0.97)0.94 (0.84 to 0.99)0.84 (0.82 to 0.85)0.91 (0.85 to 0.94)
0.94 (0.84 to 0.99)0.84 (0.73 to 0.93)0.95 (0.91 to 0.97)0.89 (0.72 to 0.98)0.89 (0.82 to 0.94)0.93 (0.91 to 0.96)0.89 (0.80 to 0.95)0.92 (0.90 to 0.94)0.92 (0.89 to 0.94)
Heterogeneity: I2 = 64%, τ2 = 0.2202; p < 0.01
Heterogeneity: I2 = 86%, τ2 = 0.5673; p < 0.01
Heterogeneity: I2 = 33%, τ2 = 0.0546; p = 0.11Heterogeneity: I2 = 79%, τ2 = 0.3568; p < 0.01
Cliff and Ong (2019)16
FAVOR II China: Xu et al. (2017)52
FAVOR II Europe–Japan: Westra et al. (2018)50
Kameyama et al. (2016)28
Kirigaya et al. (2019)31
Sato et al. (2018)39
Smit et al. (2019)40
Tu et al. (2014)45
Watari et al. (2019)49
WIFI II: Westra et al. (2018)51
Yazaki et al. (2017)53
Fixed-effects modelRandom-effects model
Cortés et al. (2019)17
Emori et al. (2018)20
Emori et al. (2018)21
FAVOR pilot: Tu et al. (2016)46
Kajita et al. (2019)27
Kanno et al. (2019)29
Liu et al. (2017)35
Mejia-Renteria et al. (2019)37
Spitaleri et al. (2018)41
Stähli et al. (2019)42
SYNTAX II: Asano et al. (2019)15
Ties et al. (2018)43
Ziubryte et al. (2019)54
Fixed-effects modelRandom-effects model
Emori et al. (2018)20
FAVOR pilot: Tu et al. (2016)46
Fixed-effects modelRandom-effects model
Hwang et al. (2019)24
Kajita et al. (2019)27
Stähli et al. (2019)42
Ties et al. (2018)43
Kołtowski et al. (2018)32
FIGURE 19 Meta-analysis of NPVs.
APPENDIX 4
NIHR Journals Library www.journalslibrary.nihr.ac.uk
148
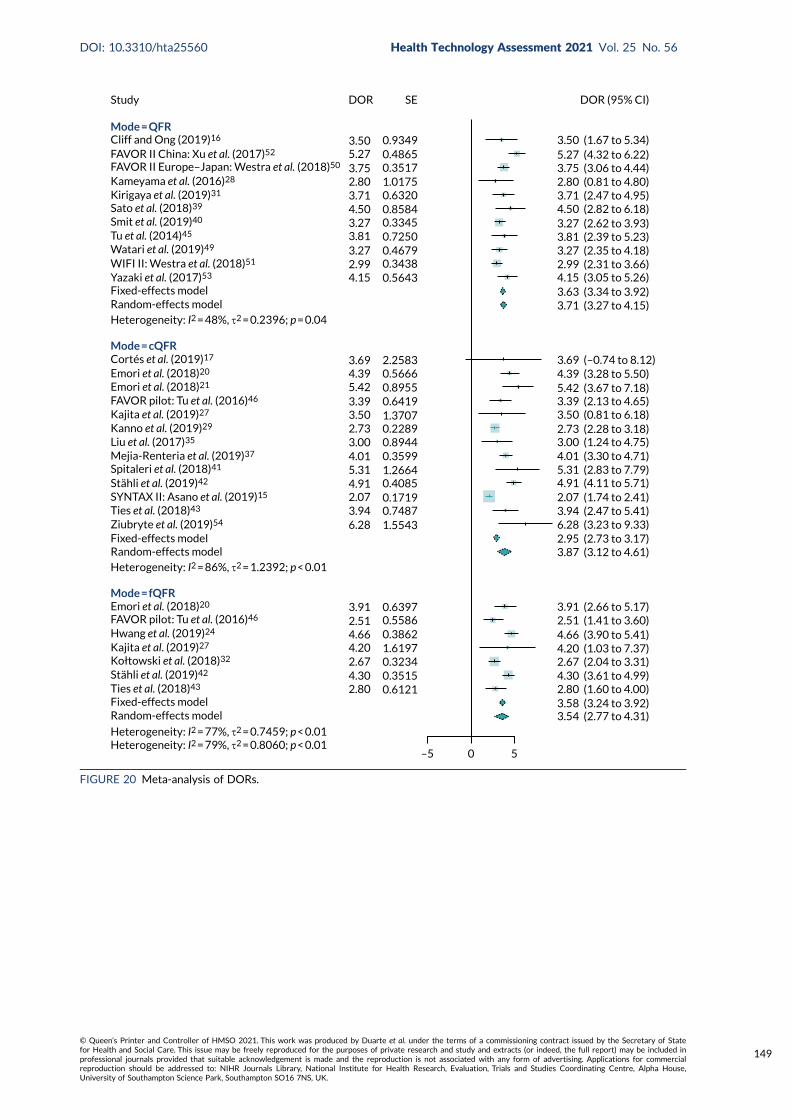
Study
Mode = QFR
Mode = cQFR
Mode = fQFR
0 5–5
DOR (95% CI)
3.50 (1.67 to 5.34)5.27 (4.32 to 6.22)3.75 (3.06 to 4.44)2.80 (0.81 to 4.80)3.71 (2.47 to 4.95)4.50 (2.82 to 6.18)3.27 (2.62 to 3.93)3.81 (2.39 to 5.23)3.27 (2.35 to 4.18)2.99 (2.31 to 3.66)4.15 (3.05 to 5.26)3.63 (3.34 to 3.92)3.71 (3.27 to 4.15)
4.39 (3.28 to 5.50)5.42 (3.67 to 7.18)3.39 (2.13 to 4.65)3.50 (0.81 to 6.18)2.73 (2.28 to 3.18)3.00 (1.24 to 4.75)4.01 (3.30 to 4.71)5.31 (2.83 to 7.79)4.91 (4.11 to 5.71)2.07 (1.74 to 2.41)3.94 (2.47 to 5.41)6.28 (3.23 to 9.33)2.95 (2.73 to 3.17)3.87 (3.12 to 4.61)
3.91 (2.66 to 5.17)2.51 (1.41 to 3.60)4.66 (3.90 to 5.41)4.20 (1.03 to 7.37)2.67 (2.04 to 3.31)4.30 (3.61 to 4.99)2.80 (1.60 to 4.00)3.58 (3.24 to 3.92)3.54 (2.77 to 4.31)
3.69 (–0.74 to 8.12)
DOR SE
3.50 0.93495.273.752.803.71
0.48650.35171.01750.6320
4.503.273.813.272.994.15
0.85840.33450.72500.46790.34380.5643
3.694.395.423.393.502.733.004.015.314.912.073.946.28 1.5543
0.74870.17190.40851.26640.35990.89440.22891.37070.64190.89550.56662.2583
3.912.514.664.202.674.302.80 0.6121
0.35150.32341.61970.38620.55860.6397
Heterogeneity: I2 = 48%, τ2 = 0.2396; p = 0.04
Heterogeneity: I2 = 86%, τ2 = 1.2392; p < 0.01
Heterogeneity: I2 = 77%, τ2 = 0.7459; p < 0.01Heterogeneity: I2 = 79%, τ2 = 0.8060; p < 0.01
Cliff and Ong (2019)16
FAVOR II China: Xu et al. (2017)52
FAVOR II Europe–Japan: Westra et al. (2018)50
Kameyama et al. (2016)28
Kirigaya et al. (2019)31
Sato et al. (2018)39
Smit et al. (2019)40
Tu et al. (2014)45
Watari et al. (2019)49
WIFI II: Westra et al. (2018)51
Yazaki et al. (2017)53
Fixed-effects modelRandom-effects model
Cortés et al. (2019)17
Emori et al. (2018)20
Emori et al. (2018)21
FAVOR pilot: Tu et al. (2016)46
Kajita et al. (2019)27
Kanno et al. (2019)29
Liu et al. (2017)35
Mejia-Renteria et al. (2019)37
Spitaleri et al. (2018)41
Stähli et al. (2019)42
SYNTAX II: Asano et al. (2019)15
Ties et al. (2018)43
Ziubryte et al. (2019)54
Fixed-effects modelRandom-effects model
Emori et al. (2018)20
FAVOR pilot: Tu et al. (2016)46
Fixed-effects modelRandom-effects model
Hwang et al. (2019)24
Kajita et al. (2019)27
Stähli et al. (2019)42
Ties et al. (2018)43
Kołtowski et al. (2018)32
FIGURE 20 Meta-analysis of DORs.
DOI: 10.3310/hta25560 Health Technology Assessment 2021 Vol. 25 No. 56
© Queen’s Printer and Controller of HMSO 2021. This work was produced by Duarte et al. under the terms of a commissioning contract issued by the Secretary of Statefor Health and Social Care. This issue may be freely reproduced for the purposes of private research and study and extracts (or indeed, the full report) may be included inprofessional journals provided that suitable acknowledgement is made and the reproduction is not associated with any form of advertising. Applications for commercialreproduction should be addressed to: NIHR Journals Library, National Institute for Health Research, Evaluation, Trials and Studies Coordinating Centre, Alpha House,University of Southampton Science Park, Southampton SO16 7NS, UK.
149
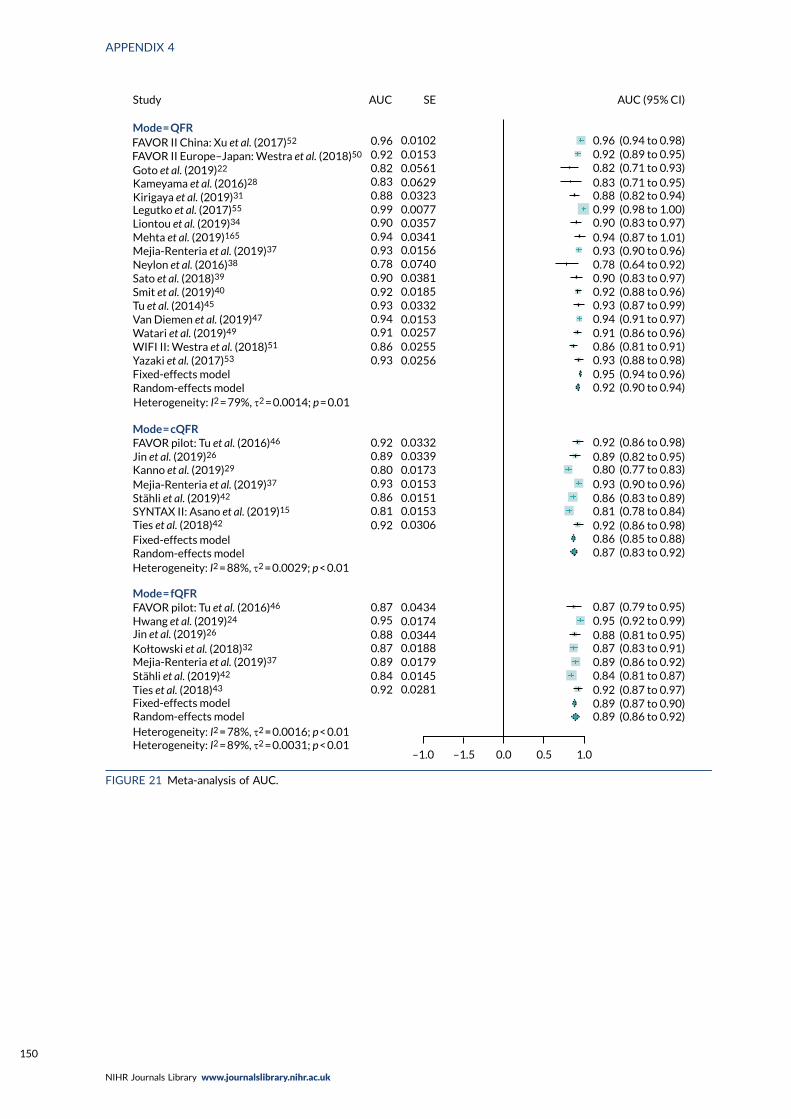
–1.0 –1.5 0.0 0.5 1.0
Mode = QFR
Study AUC SE AUC (95% CI)
Fixed-effects modelRandom-effects model
Fixed-effects modelRandom-effects model
Fixed-effects modelRandom-effects model
Mejia-Renteria et al. (2019)37
Stähli et al. (2019)42
SYNTAX II: Asano et al. (2019)15
Ties et al. (2018)42
Sato et al. (2018)39
Smit et al. (2019)40
Tu et al. (2014)45
Watari et al. (2019)49Van Diemen et al. (2019)47
WIFI II: Westra et al. (2018)51
Yazaki et al. (2017)53
Goto et al. (2019)22
Legutko et al. (2017)55
Liontou et al. (2019)34
Mehta et al. (2019)165
Mejia-Renteria et al. (2019)37
Neylon et al. (2016)38
Mode = cQFR
Mode = fQFR
FAVOR pilot: Tu et al. (2016)46
FAVOR pilot: Tu et al. (2016)46
Jin et al. (2019)26
Jin et al. (2019)26
Kołtowski et al. (2018)32
Ties et al. (2018)43Stähli et al. (2019)42Mejia-Renteria et al. (2019)37
Hwang et al. (2019)24
Kanno et al. (2019)29
0.920.840.890.870.88
0.870.95
0.920.810.860.930.800.890.92
0.930.860.910.940.930.920.900.780.930.940.900.990.880.830.820.920.96 0.0102
0.01530.05610.06290.03230.00770.03570.03410.01560.07400.03810.01850.03320.01530.02570.02550.0256
0.03320.03390.01730.01530.01510.01530.0306
0.04340.01740.03440.01880.01790.01450.0281
0.96 (0.94 to 0.98)0.92 (0.89 to 0.95)0.82 (0.71 to 0.93)0.83 (0.71 to 0.95)0.88 (0.82 to 0.94)0.99 (0.98 to 1.00)0.90 (0.83 to 0.97)0.94 (0.87 to 1.01)0.93 (0.90 to 0.96)0.78 (0.64 to 0.92)0.90 (0.83 to 0.97)0.92 (0.88 to 0.96)0.93 (0.87 to 0.99)0.94 (0.91 to 0.97)0.91 (0.86 to 0.96)0.86 (0.81 to 0.91)0.93 (0.88 to 0.98)0.95 (0.94 to 0.96)0.92 (0.90 to 0.94)
0.92 (0.86 to 0.98)0.89 (0.82 to 0.95)0.80 (0.77 to 0.83)0.93 (0.90 to 0.96)0.86 (0.83 to 0.89)0.81 (0.78 to 0.84)0.92 (0.86 to 0.98)0.86 (0.85 to 0.88)0.87 (0.83 to 0.92)
0.87 (0.79 to 0.95)0.95 (0.92 to 0.99)0.88 (0.81 to 0.95)0.87 (0.83 to 0.91)0.89 (0.86 to 0.92)0.84 (0.81 to 0.87)0.92 (0.87 to 0.97)0.89 (0.87 to 0.90)0.89 (0.86 to 0.92)
FAVOR II China: Xu et al. (2017)52
FAVOR II Europe–Japan: Westra et al. (2018)50
Kameyama et al. (2016)28
Kirigaya et al. (2019)31
Heterogeneity: I2 = 79%, τ2 = 0.0014; p = 0.01
Heterogeneity: I2 = 88%, τ2 = 0.0029; p < 0.01
Heterogeneity: I2 = 78%, τ2 = 0.0016; p < 0.01Heterogeneity: I2 = 89%, τ2 = 0.0031; p < 0.01
FIGURE 21 Meta-analysis of AUC.
APPENDIX 4
NIHR Journals Library www.journalslibrary.nihr.ac.uk
150
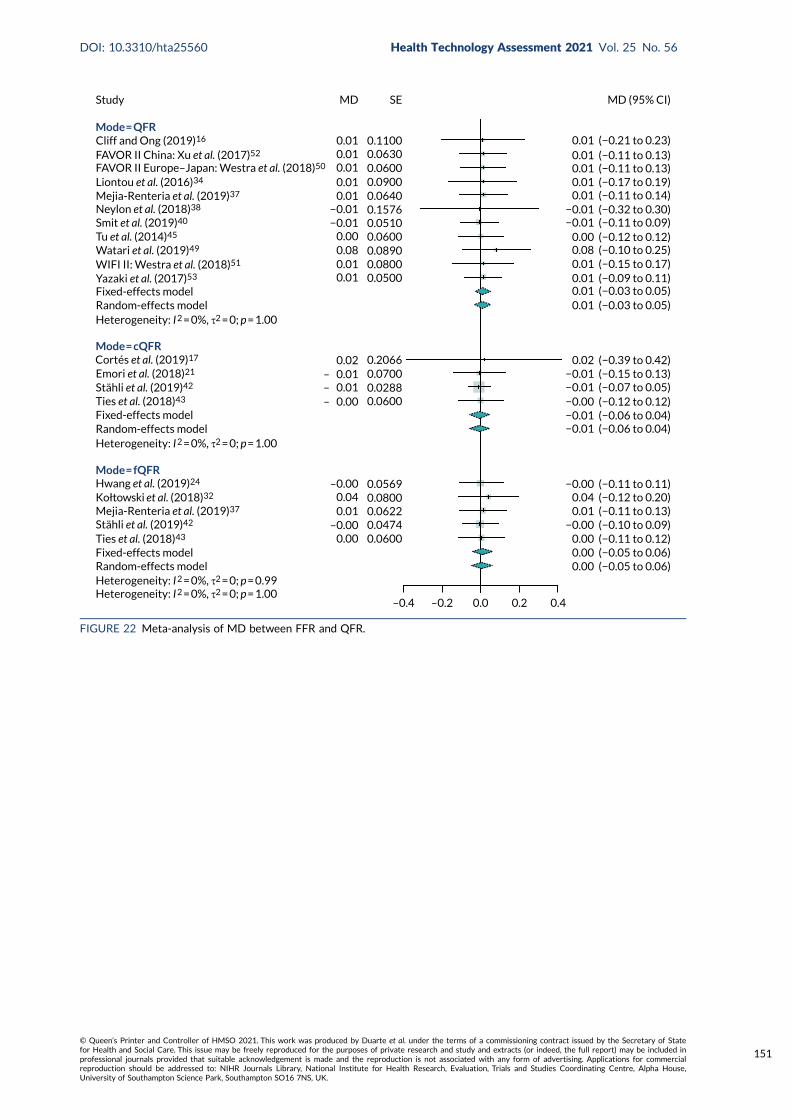
–0.4 –0.2 0.0 0.2 0.4
Study MD SE
Mode = QFR0.010.010.010.010.01
0.000.080.010.01
0.02– 0.01– 0.01– 0.00
−0.01−0.01
0.05000.08000.08900.06000.05100.15760.06400.09000.06000.06300.1100
Fixed-effects model
Fixed-effects model
Random-effects model
Random-effects model
Heterogeneity: I 2 = 0%, τ2 = 0; p = 1.00
Heterogeneity: I 2 = 0%, τ2 = 0; p = 1.00
Heterogeneity: I 2 = 0%, τ2 = 0; p = 0.99Heterogeneity: I 2 = 0%, τ2 = 0; p = 1.00
Mode = cQFR
Stähli et al. (2019)42
Stähli et al. (2019)42
Ties et al. (2018)43
Ties et al. (2018)43
Mode = fQFRHwang et al. (2019)24
Kołtowski et al. (2018)32
Mejia-Renteria et al. (2019)37
0.00
0.010.04
0.0600–0.00
–0.00
0.04740.06220.08000.0569
0.20660.07000.02880.0600
0.00 (−0.05 to 0.06)0.00 (−0.05 to 0.06)0.00 (−0.11 to 0.12)
0.01 (−0.11 to 0.13)
−0.01 (−0.06 to 0.04)−0.01 (−0.06 to 0.04)−0.00 (−0.12 to 0.12)−0.01 (−0.07 to 0.05)−0.01 (−0.15 to 0.13)
0.02 (−0.39 to 0.42)
0.01 (−0.03 to 0.05)0.01 (−0.03 to 0.05)0.01 (−0.09 to 0.11)0.01 (−0.15 to 0.17)0.08 (−0.10 to 0.25)0.00 (−0.12 to 0.12)
−0.01 (−0.11 to 0.09)−0.01 (−0.32 to 0.30)
0.01 (−0.11 to 0.14)0.01 (−0.17 to 0.19)0.01 (−0.11 to 0.13)0.01 (−0.11 to 0.13)0.01 (−0.21 to 0.23)
0.04 (−0.12 to 0.20)
−0.00 (−0.10 to 0.09)
−0.00 (−0.11 to 0.11)
MD (95% CI)
Cliff and Ong (2019)16
FAVOR II China: Xu et al. (2017)52
FAVOR II Europe–Japan: Westra et al. (2018)50
Liontou et al. (2016)34
Mejia-Renteria et al. (2019)37
Neylon et al. (2018)38
Smit et al. (2019)40
Tu et al. (2014)45
Watari et al. (2019)49
WIFI II: Westra et al. (2018)51
Yazaki et al. (2017)53
Fixed-effects modelRandom-effects model
Cortés et al. (2019)17
Emori et al. (2018)21
FIGURE 22 Meta-analysis of MD between FFR and QFR.
DOI: 10.3310/hta25560 Health Technology Assessment 2021 Vol. 25 No. 56
© Queen’s Printer and Controller of HMSO 2021. This work was produced by Duarte et al. under the terms of a commissioning contract issued by the Secretary of Statefor Health and Social Care. This issue may be freely reproduced for the purposes of private research and study and extracts (or indeed, the full report) may be included inprofessional journals provided that suitable acknowledgement is made and the reproduction is not associated with any form of advertising. Applications for commercialreproduction should be addressed to: NIHR Journals Library, National Institute for Health Research, Evaluation, Trials and Studies Coordinating Centre, Alpha House,University of Southampton Science Park, Southampton SO16 7NS, UK.
151
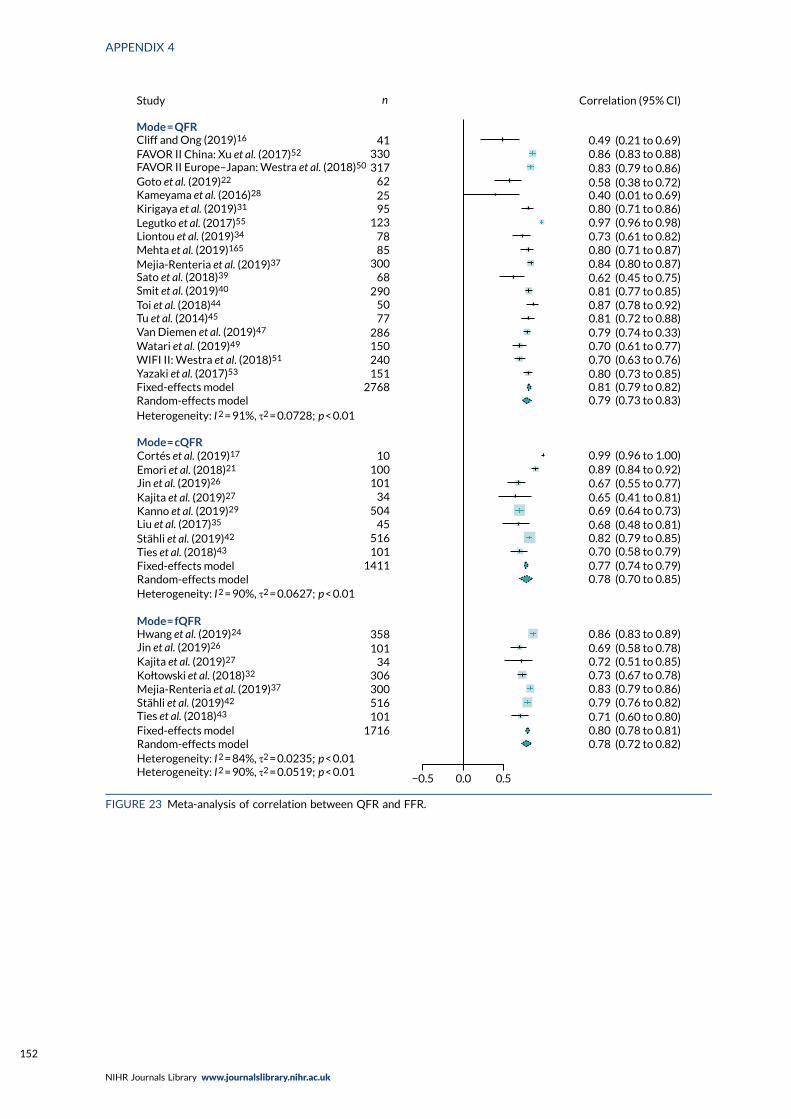
Study n Correlation (95% CI)
41330317
622595
1237885
30068
2905077
286150240151
2768
10100
Mode = QFR
Fixed-effects modelRandom-effects model
Fixed-effects modelRandom-effects model
Fixed-effects modelRandom-effects model
Heterogeneity: I 2 = 90%, τ2 = 0.0627; p < 0.01
Heterogeneity: I 2 = 91%, τ2 = 0.0728; p < 0.01
Heterogeneity: I 2 = 90%, τ2 = 0.0519; p < 0.01Heterogeneity: I 2 = 84%, τ2 = 0.0235; p < 0.01
Mode = cQFRCortés et al. (2019)17
Emori et al. (2018)21
Stähli et al. (2019)42
Ties et al. (2018)43
101
Mode = fQFRHwang et al. (2019)24
Kajita et al. (2019)27
Kajita et al. (2019)27
Stähli et al. (2019)42
Ties et al. (2018)43
Kołtowski et al. (2018)32
Sato et al. (2018)39
Smit et al. (2019)40
Tu et al. (2014)45Toi et al. (2018)44
Van Diemen et al. (2019)47
Watari et al. (2019)49
WIFI II: Westra et al. (2018)51
Yazaki et al. (2017)53
Kanno et al. (2019)29
Liu et al. (2017)35
Mejia-Renteria et al. (2019)37
Goto et al. (2019)22
Legutko et al. (2017)55
Liontou et al. (2019)34
Mehta et al. (2019)165
Jin et al. (2019)26
Jin et al. (2019)26
Mejia-Renteria et al. (2019)37
358101
34306300516101
1716
−0.5 0.0 0.5
0.49 (0.21 to 0.69)0.86 (0.83 to 0.88)0.83 (0.79 to 0.86)0.58 (0.38 to 0.72)0.40 (0.01 to 0.69)0.80 (0.71 to 0.86)0.97 (0.96 to 0.98)0.73 (0.61 to 0.82)0.80 (0.71 to 0.87)0.84 (0.80 to 0.87)0.62 (0.45 to 0.75)0.81 (0.77 to 0.85)0.87 (0.78 to 0.92)0.81 (0.72 to 0.88)0.79 (0.74 to 0.33)0.70 (0.61 to 0.77)0.70 (0.63 to 0.76)
0.79 (0.73 to 0.83)
0.99 (0.96 to 1.00)0.89 (0.84 to 0.92)0.67 (0.55 to 0.77)0.65 (0.41 to 0.81)0.69 (0.64 to 0.73)0.68 (0.48 to 0.81)0.82 (0.79 to 0.85)
0.77 (0.74 to 0.79)0.78 (0.70 to 0.85)
0.70 (0.58 to 0.79)
0.86 (0.83 to 0.89)0.69 (0.58 to 0.78)0.72 (0.51 to 0.85)0.73 (0.67 to 0.78)0.83 (0.79 to 0.86)0.79 (0.76 to 0.82)0.71 (0.60 to 0.80)
0.78 (0.72 to 0.82)0.80 (0.78 to 0.81)
0.80 (0.73 to 0.85)0.81 (0.79 to 0.82)
1411101516
45504
34
Cliff and Ong (2019)16
FAVOR II China: Xu et al. (2017)52
FAVOR II Europe–Japan: Westra et al. (2018)50
Kameyama et al. (2016)28
Kirigaya et al. (2019)31
FIGURE 23 Meta-analysis of correlation between QFR and FFR.
APPENDIX 4
NIHR Journals Library www.journalslibrary.nihr.ac.uk
152
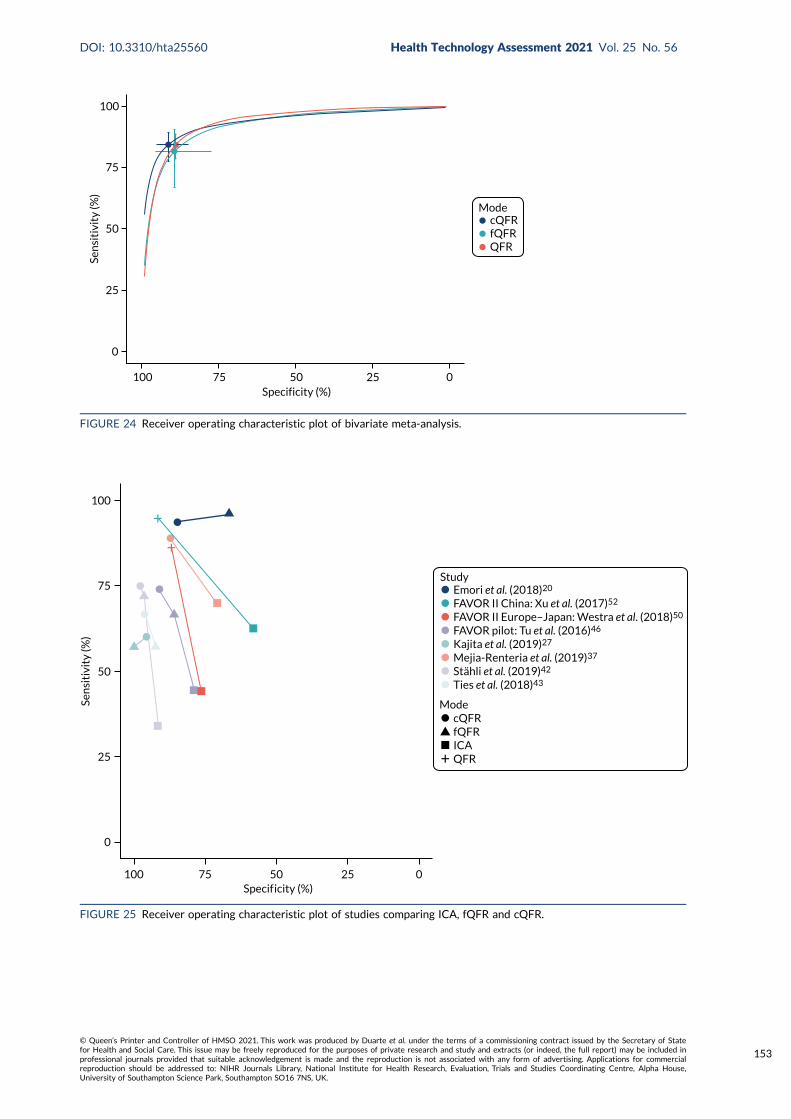
100
75
50
25
0
Sen
siti
vity
(%)
100 75 50 25 0Specificity (%)
cQFRfQFRQFR
Mode
FIGURE 24 Receiver operating characteristic plot of bivariate meta-analysis.
Study
Mode
Emori et al. (2018)20
FAVOR II China: Xu et al. (2017)52
FAVOR II Europe–Japan: Westra et al. (2018)50
FAVOR pilot: Tu et al. (2016)46
Kajita et al. (2019)27
Mejia-Renteria et al. (2019)37
Stähli et al. (2019)42
Ties et al. (2018)43
cQFRfQFRICAQFR
100 75 50 25 0Specif icity (%)
Sen
siti
vity
(%)
0
25
50
75
100
FIGURE 25 Receiver operating characteristic plot of studies comparing ICA, fQFR and cQFR.
DOI: 10.3310/hta25560 Health Technology Assessment 2021 Vol. 25 No. 56
© Queen’s Printer and Controller of HMSO 2021. This work was produced by Duarte et al. under the terms of a commissioning contract issued by the Secretary of Statefor Health and Social Care. This issue may be freely reproduced for the purposes of private research and study and extracts (or indeed, the full report) may be included inprofessional journals provided that suitable acknowledgement is made and the reproduction is not associated with any form of advertising. Applications for commercialreproduction should be addressed to: NIHR Journals Library, National Institute for Health Research, Evaluation, Trials and Studies Coordinating Centre, Alpha House,University of Southampton Science Park, Southampton SO16 7NS, UK.
153
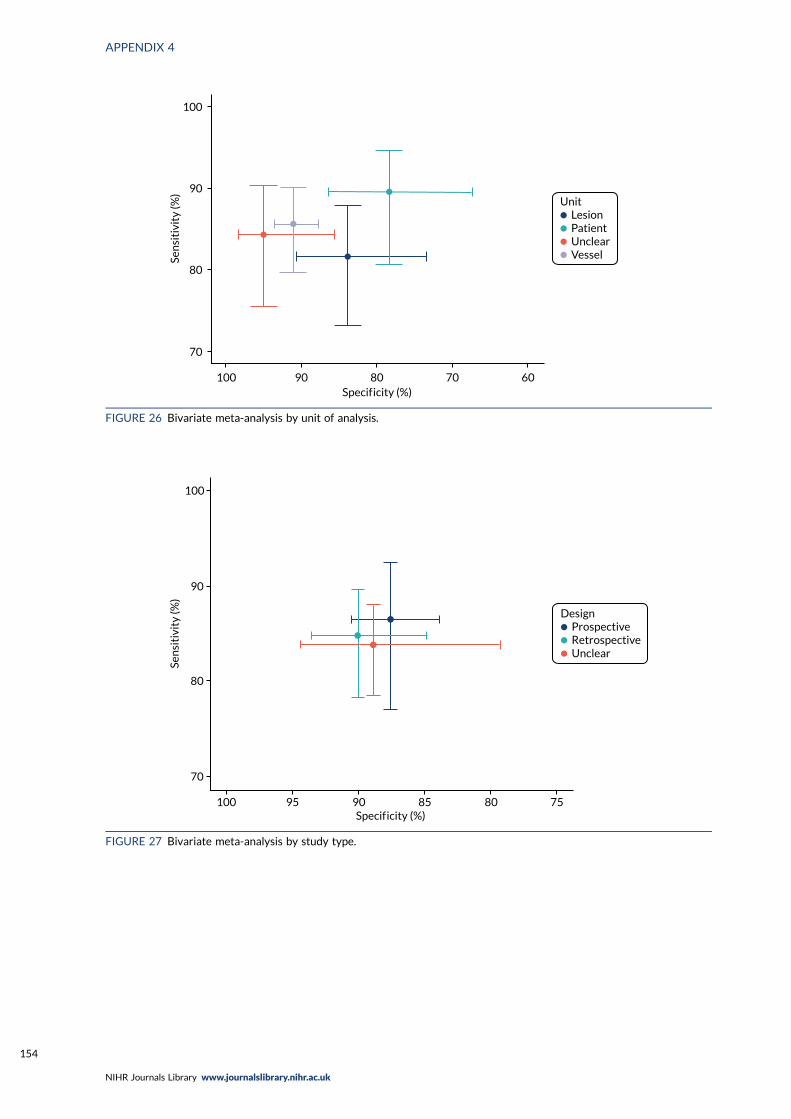
LesionPatientUnclearVessel
Unit
100
90
80
70
Sen
siti
vity
(%)
100 90 80 70 60Specif icity (%)
FIGURE 26 Bivariate meta-analysis by unit of analysis.
ProspectiveRetrospectiveUnclear
Design
Sen
siti
vity
(%)
100
90
80
70
100 95 90 85 80 75Specif icity (%)
FIGURE 27 Bivariate meta-analysis by study type.
APPENDIX 4
NIHR Journals Library www.journalslibrary.nihr.ac.uk
154
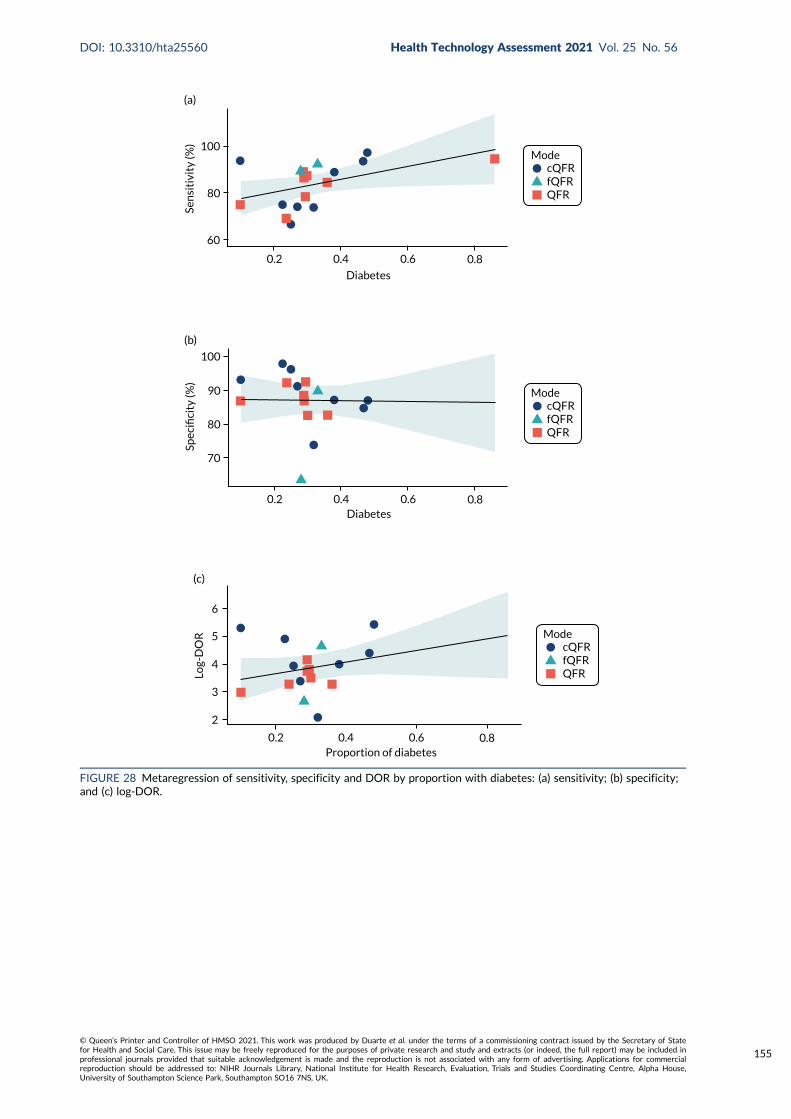
ModecQFRfQFRQFR
0.80.2 0.4 0.6
100
80
60
Sen
siti
vity
(%)
(a)
Diabetes
ModecQFRfQFRQFR
0.80.2 0.4 0.6Diabetes
100
80
Spec
ifici
ty (%
)
(b)
90
70
ModecQFRfQFRQFR
0.80.2 0.4 0.6Proportion of diabetes
6
5
4
3
2
Log-
DO
R
(c)
FIGURE 28 Metaregression of sensitivity, specificity and DOR by proportion with diabetes: (a) sensitivity; (b) specificity;and (c) log-DOR.
DOI: 10.3310/hta25560 Health Technology Assessment 2021 Vol. 25 No. 56
© Queen’s Printer and Controller of HMSO 2021. This work was produced by Duarte et al. under the terms of a commissioning contract issued by the Secretary of Statefor Health and Social Care. This issue may be freely reproduced for the purposes of private research and study and extracts (or indeed, the full report) may be included inprofessional journals provided that suitable acknowledgement is made and the reproduction is not associated with any form of advertising. Applications for commercialreproduction should be addressed to: NIHR Journals Library, National Institute for Health Research, Evaluation, Trials and Studies Coordinating Centre, Alpha House,University of Southampton Science Park, Southampton SO16 7NS, UK.
155
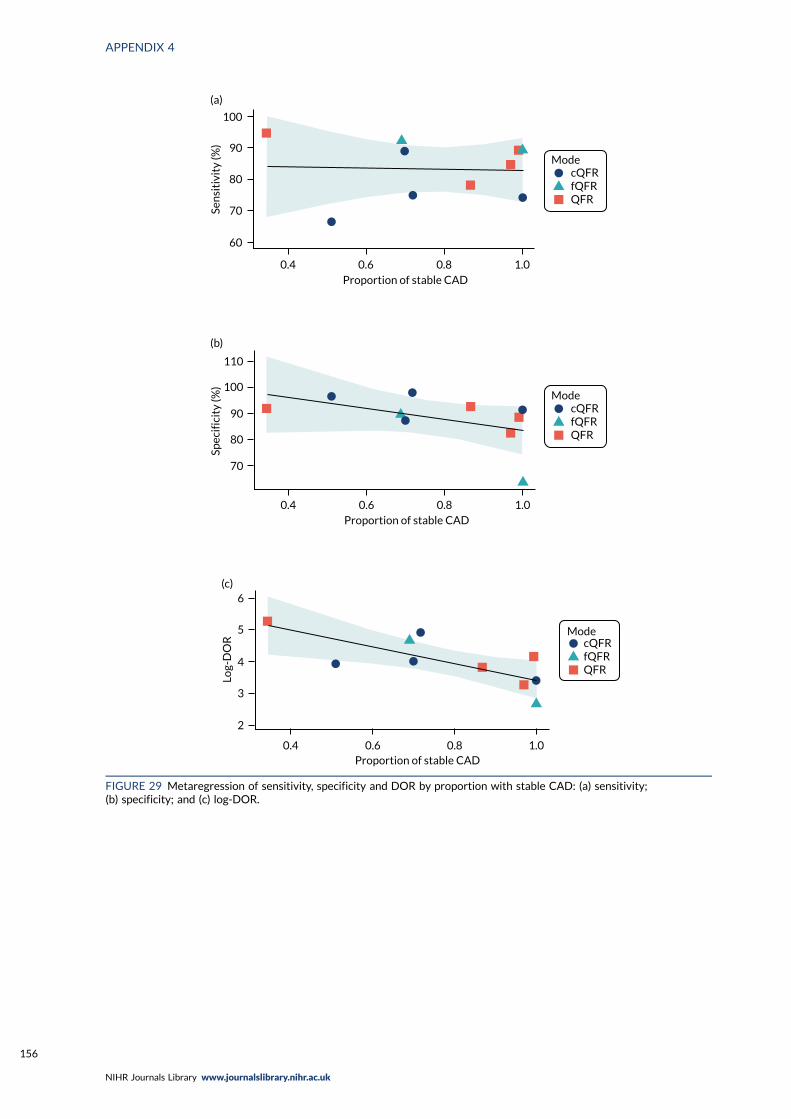
ModecQFRfQFRQFR
Proportion of stable CAD
(a)
Sen
siti
vity
(%)
1.00.80.60.4
100
90
80
70
60
ModecQFRfQFRQFR
Proportion of stable CAD
(b)
Spec
ific
ity
(%)
70
80
90
100
110
0.4 0.6 0.8 1.0
ModecQFRfQFRQFR
(c)
Log-
DO
R
6
5
4
3
2
0.4 0.6 0.8 1.0Proportion of stable CAD
FIGURE 29 Metaregression of sensitivity, specificity and DOR by proportion with stable CAD: (a) sensitivity;(b) specificity; and (c) log-DOR.
APPENDIX 4
NIHR Journals Library www.journalslibrary.nihr.ac.uk
156
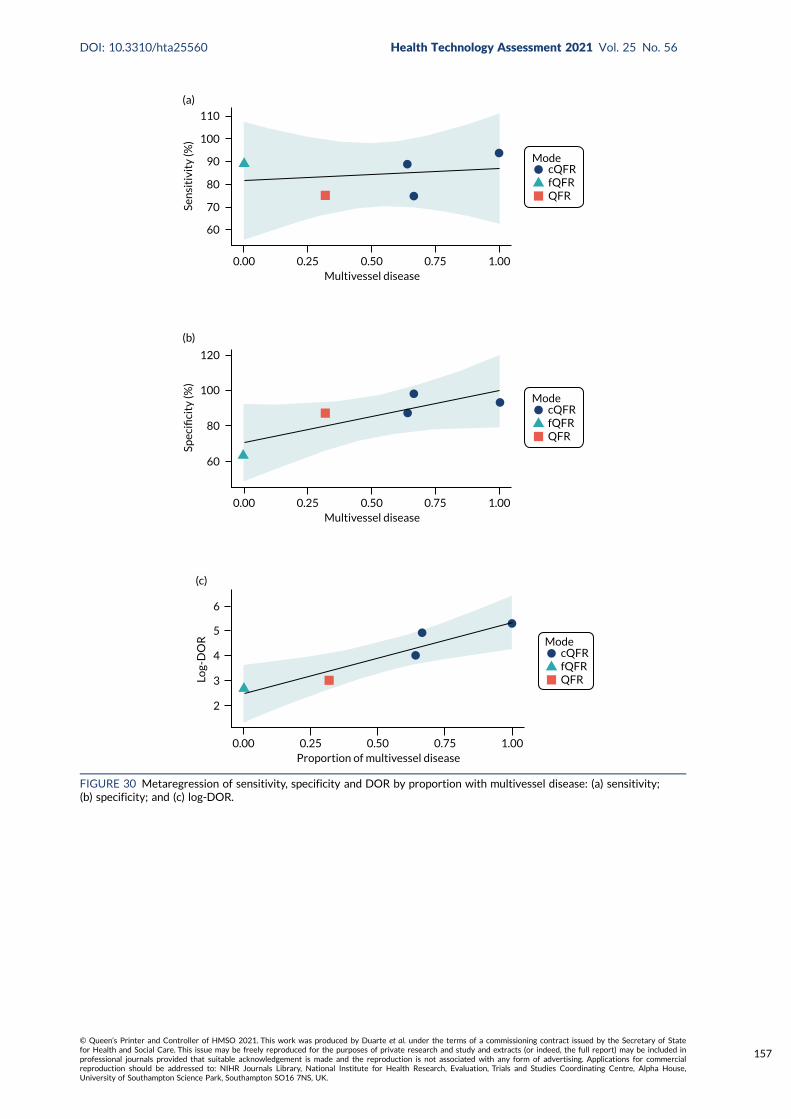
ModecQFRfQFRQFR
Multivessel disease0.00 0.25 0.50 0.75 1.00
60
70
80
90
100
110
Sen
siti
vity
(%)
(a)
ModecQFRfQFRQFR
Multivessel disease0.00 0.25 0.50 0.75 1.00
120
100
80
60
Spec
ifici
ty (%
)
(b)
ModecQFRfQFRQFR
Proportion of multivessel disease0.00 0.25 0.50 0.75 1.00
6
5
4
3
2
Log-
DO
R
(c)
FIGURE 30 Metaregression of sensitivity, specificity and DOR by proportion with multivessel disease: (a) sensitivity;(b) specificity; and (c) log-DOR.
DOI: 10.3310/hta25560 Health Technology Assessment 2021 Vol. 25 No. 56
© Queen’s Printer and Controller of HMSO 2021. This work was produced by Duarte et al. under the terms of a commissioning contract issued by the Secretary of Statefor Health and Social Care. This issue may be freely reproduced for the purposes of private research and study and extracts (or indeed, the full report) may be included inprofessional journals provided that suitable acknowledgement is made and the reproduction is not associated with any form of advertising. Applications for commercialreproduction should be addressed to: NIHR Journals Library, National Institute for Health Research, Evaluation, Trials and Studies Coordinating Centre, Alpha House,University of Southampton Science Park, Southampton SO16 7NS, UK.
157
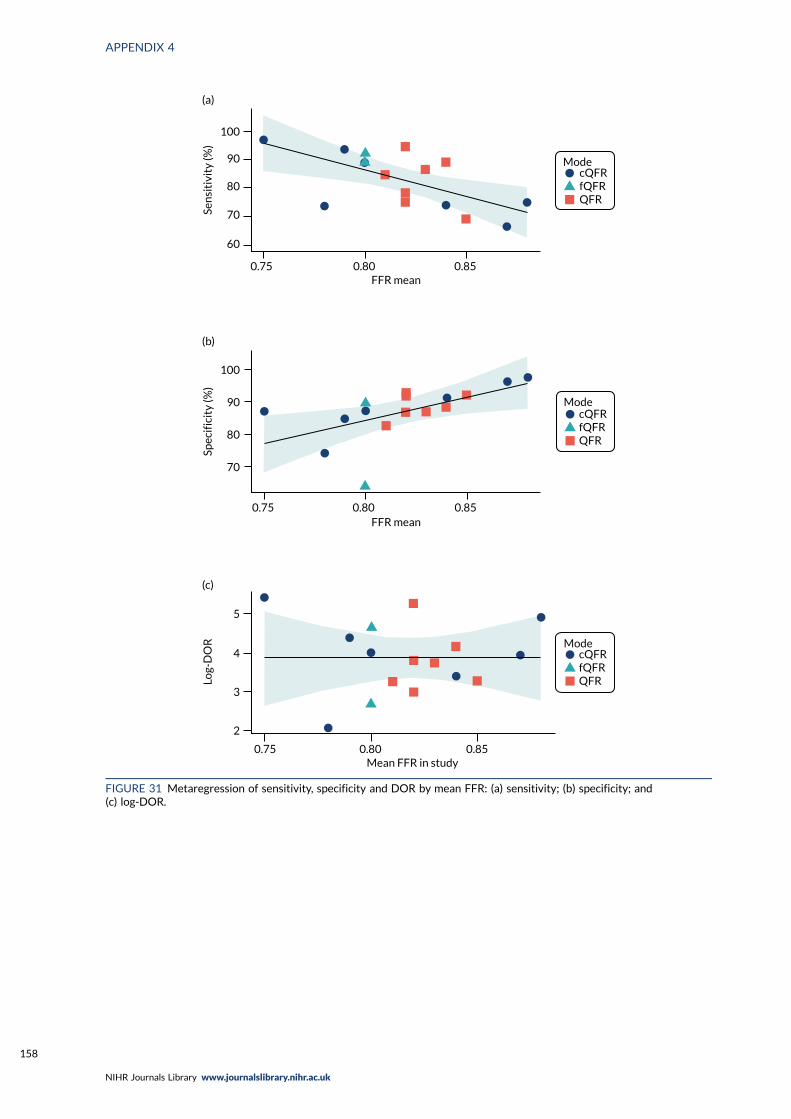
ModecQFRfQFRQFR
FFR mean0.75 0.80 0.85
100
90
80
70
60
Sen
siti
vity
(%)
(a)
ModecQFRfQFRQFR
FFR mean0.75 0.80 0.85
100
90
80
70
Spec
ific
ity
(%)
(b)
ModecQFRfQFRQFR
Mean FFR in study0.75 0.80 0.85
5
4
3
2
Log-
DO
R
(c)
FIGURE 31 Metaregression of sensitivity, specificity and DOR by mean FFR: (a) sensitivity; (b) specificity; and(c) log-DOR.
APPENDIX 4
NIHR Journals Library www.journalslibrary.nihr.ac.uk
158
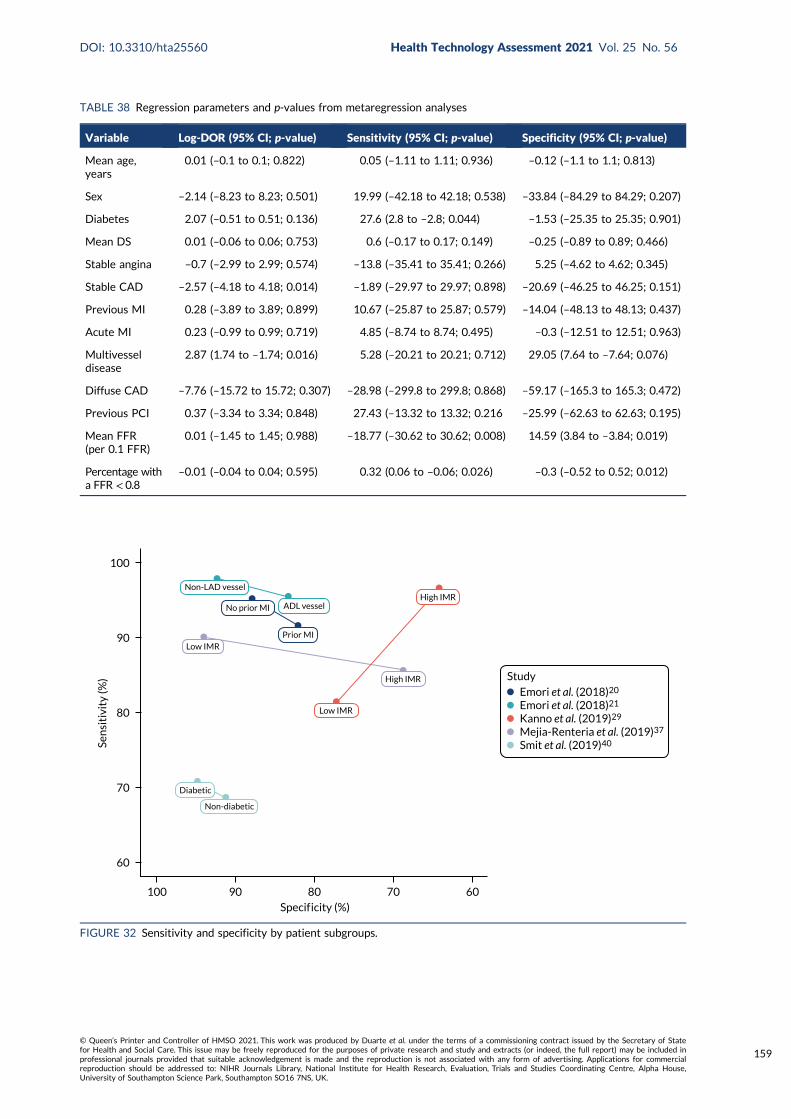
TABLE 38 Regression parameters and p-values from metaregression analyses
Variable Log-DOR (95% CI; p-value) Sensitivity (95% CI; p-value) Specificity (95% CI; p-value)
Mean age,years
0.01 (–0.1 to 0.1; 0.822) 0.05 (–1.11 to 1.11; 0.936) –0.12 (–1.1 to 1.1; 0.813)
Sex –2.14 (–8.23 to 8.23; 0.501) 19.99 (–42.18 to 42.18; 0.538) –33.84 (–84.29 to 84.29; 0.207)
Diabetes 2.07 (–0.51 to 0.51; 0.136) 27.6 (2.8 to –2.8; 0.044) –1.53 (–25.35 to 25.35; 0.901)
Mean DS 0.01 (–0.06 to 0.06; 0.753) 0.6 (–0.17 to 0.17; 0.149) –0.25 (–0.89 to 0.89; 0.466)
Stable angina –0.7 (–2.99 to 2.99; 0.574) –13.8 (–35.41 to 35.41; 0.266) 5.25 (–4.62 to 4.62; 0.345)
Stable CAD –2.57 (–4.18 to 4.18; 0.014) –1.89 (–29.97 to 29.97; 0.898) –20.69 (–46.25 to 46.25; 0.151)
Previous MI 0.28 (–3.89 to 3.89; 0.899) 10.67 (–25.87 to 25.87; 0.579) –14.04 (–48.13 to 48.13; 0.437)
Acute MI 0.23 (–0.99 to 0.99; 0.719) 4.85 (–8.74 to 8.74; 0.495) –0.3 (–12.51 to 12.51; 0.963)
Multivesseldisease
2.87 (1.74 to –1.74; 0.016) 5.28 (–20.21 to 20.21; 0.712) 29.05 (7.64 to –7.64; 0.076)
Diffuse CAD –7.76 (–15.72 to 15.72; 0.307) –28.98 (–299.8 to 299.8; 0.868) –59.17 (–165.3 to 165.3; 0.472)
Previous PCI 0.37 (–3.34 to 3.34; 0.848) 27.43 (–13.32 to 13.32; 0.216 –25.99 (–62.63 to 62.63; 0.195)
Mean FFR(per 0.1 FFR)
0.01 (–1.45 to 1.45; 0.988) –18.77 (–30.62 to 30.62; 0.008) 14.59 (3.84 to –3.84; 0.019)
Percentage witha FFR < 0.8
–0.01 (–0.04 to 0.04; 0.595) 0.32 (0.06 to –0.06; 0.026) –0.3 (–0.52 to 0.52; 0.012)
Emori et al. (2018)20
Emori et al. (2018)21
Kanno et al. (2019)29
Mejia-Renteria et al. (2019)37
Smit et al. (2019)40
Study
Prior MI
High IMR
ADL vessel
Non-LAD vessel
No prior MI
Low IMR
High IMR
Low IMR
Diabetic
Non-diabetic
100
90
Sen
siti
vity
(%)
80
70
60
100 90 80 70 60Specif icity (%)
FIGURE 32 Sensitivity and specificity by patient subgroups.
DOI: 10.3310/hta25560 Health Technology Assessment 2021 Vol. 25 No. 56
© Queen’s Printer and Controller of HMSO 2021. This work was produced by Duarte et al. under the terms of a commissioning contract issued by the Secretary of Statefor Health and Social Care. This issue may be freely reproduced for the purposes of private research and study and extracts (or indeed, the full report) may be included inprofessional journals provided that suitable acknowledgement is made and the reproduction is not associated with any form of advertising. Applications for commercialreproduction should be addressed to: NIHR Journals Library, National Institute for Health Research, Evaluation, Trials and Studies Coordinating Centre, Alpha House,University of Southampton Science Park, Southampton SO16 7NS, UK.
159
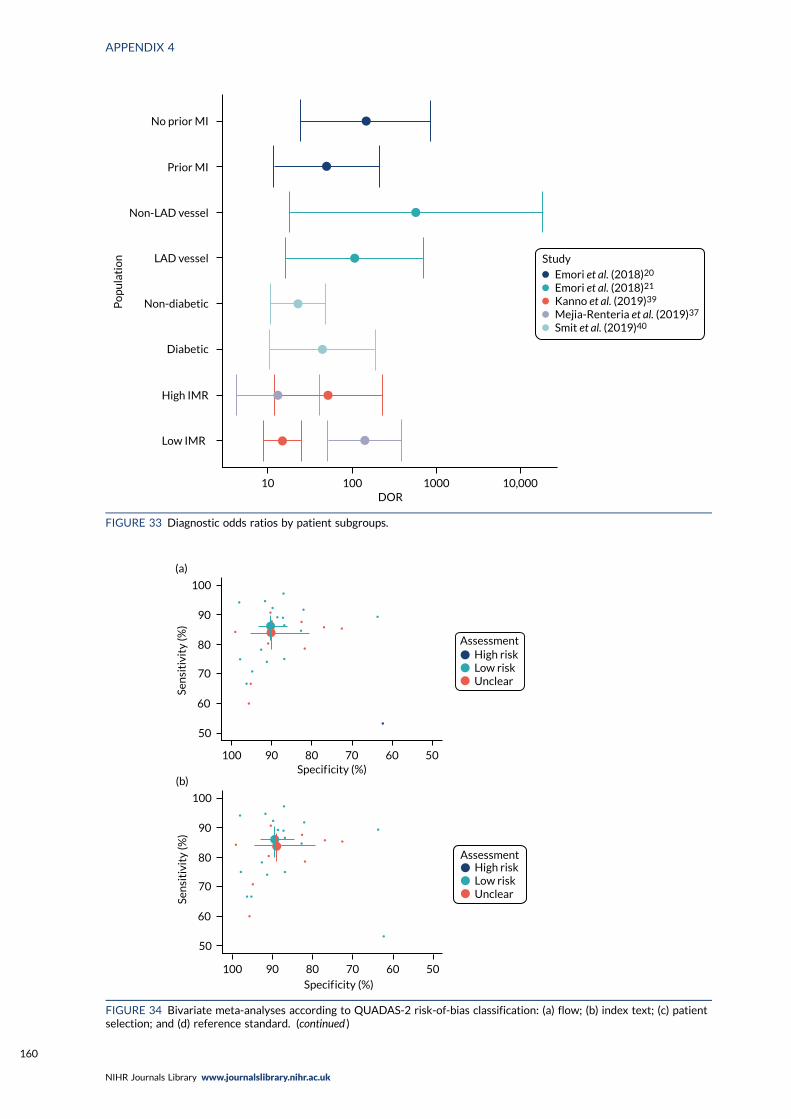
No prior MI
Prior MI
Non-LAD vessel
Non-diabetic
Diabetic
High IMR
Low IMR
LAD vessel
Emori et al. (2018)20
Emori et al. (2018)21
Kanno et al. (2019)39
Mejia-Renteria et al. (2019)37
Smit et al. (2019)40
Study
Po
pu
lati
on
10 100 1000 10,000DOR
FIGURE 33 Diagnostic odds ratios by patient subgroups.
AssessmentHigh riskLow riskUnclear
50
60
70
80
90
100
Sen
siti
vity
(%)
Specif icity (%)100 90 80 70 60 50
(a)
AssessmentHigh riskLow riskUnclear
Specif icity (%)100 90 80 70 60 50
50
60
70
80
90
100
Sen
siti
vity
(%)
(b)
FIGURE 34 Bivariate meta-analyses according to QUADAS-2 risk-of-bias classification: (a) flow; (b) index text; (c) patientselection; and (d) reference standard. (continued )
APPENDIX 4
NIHR Journals Library www.journalslibrary.nihr.ac.uk
160
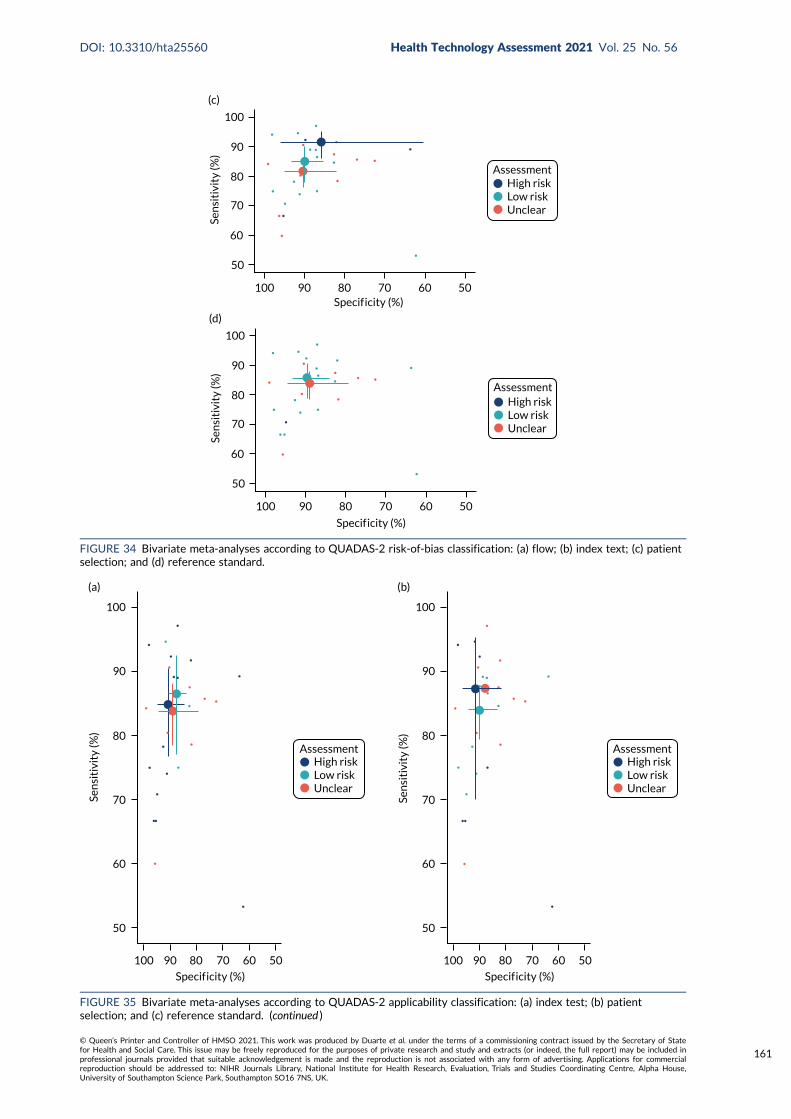
AssessmentHigh riskLow riskUnclear
Specif icity (%)
50
60
70
80
90
100
Sen
siti
vity
(%)
100 90 80 70 60 50
(c)
AssessmentHigh riskLow riskUnclear
Specif icity (%)
100 90 80 70 60 50
50
60
70
80
90
100
Sen
siti
vity
(%)
(d)
FIGURE 34 Bivariate meta-analyses according to QUADAS-2 risk-of-bias classification: (a) flow; (b) index text; (c) patientselection; and (d) reference standard.
AssessmentHigh riskLow riskUnclear
Sen
siti
vity
(%)
100
90
80
70
60
50
100 90 80 70 60 50
Specif icity (%)
(a)
AssessmentHigh riskLow riskUnclear
Sen
siti
vity
(%)
100
90
80
70
60
50
100 90 80 70 60 50
Specif icity (%)
(b)
FIGURE 35 Bivariate meta-analyses according to QUADAS-2 applicability classification: (a) index test; (b) patientselection; and (c) reference standard. (continued )
DOI: 10.3310/hta25560 Health Technology Assessment 2021 Vol. 25 No. 56
© Queen’s Printer and Controller of HMSO 2021. This work was produced by Duarte et al. under the terms of a commissioning contract issued by the Secretary of Statefor Health and Social Care. This issue may be freely reproduced for the purposes of private research and study and extracts (or indeed, the full report) may be included inprofessional journals provided that suitable acknowledgement is made and the reproduction is not associated with any form of advertising. Applications for commercialreproduction should be addressed to: NIHR Journals Library, National Institute for Health Research, Evaluation, Trials and Studies Coordinating Centre, Alpha House,University of Southampton Science Park, Southampton SO16 7NS, UK.
161
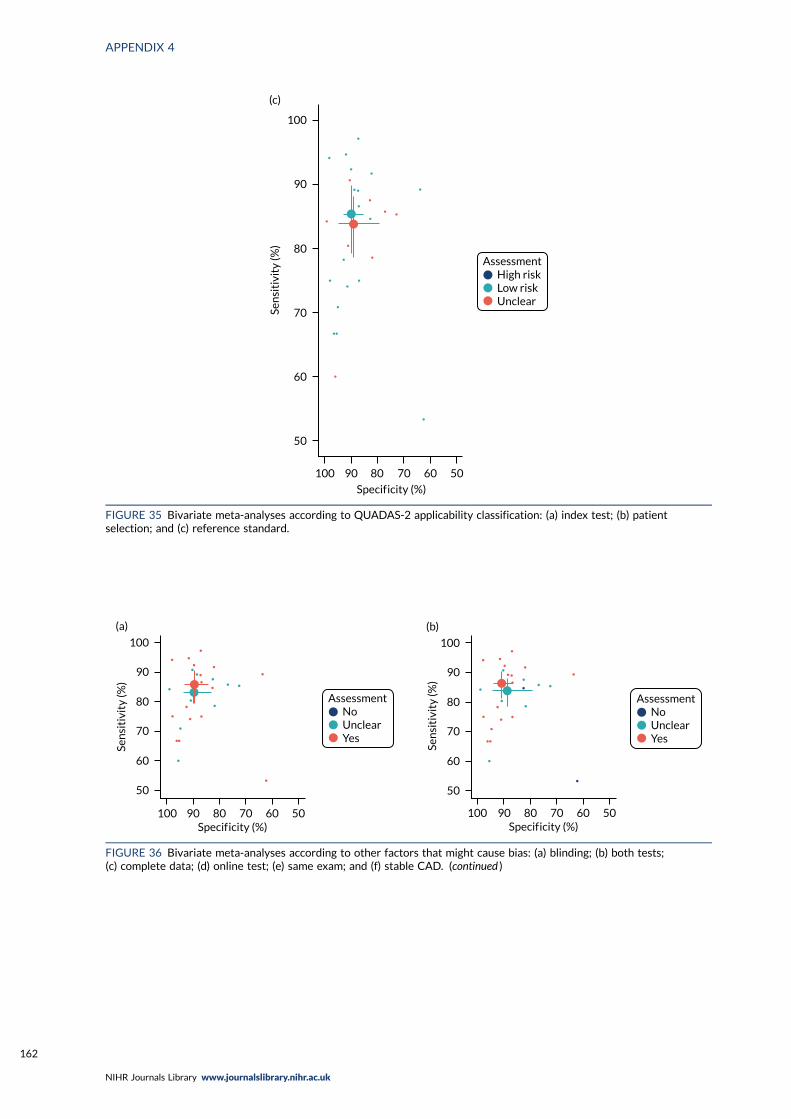
AssessmentHigh riskLow riskUnclear
Sen
siti
vity
(%)
100
90
80
70
60
50
100 90 80 70 60 50
Specif icity (%)
(c)
FIGURE 35 Bivariate meta-analyses according to QUADAS-2 applicability classification: (a) index test; (b) patientselection; and (c) reference standard.
AssessmentNoUnclearYes
100
90
80
70
60
50
Sen
siti
vity
(%)
Specif icity (%)100 90 80 70 60 50
(a)
AssessmentNoUnclearYes
100
90
80
70
60
50
Sen
siti
vity
(%)
100Specif icity (%)
90 80 70 60 50
(b)
FIGURE 36 Bivariate meta-analyses according to other factors that might cause bias: (a) blinding; (b) both tests;(c) complete data; (d) online test; (e) same exam; and (f) stable CAD. (continued )
APPENDIX 4
NIHR Journals Library www.journalslibrary.nihr.ac.uk
162
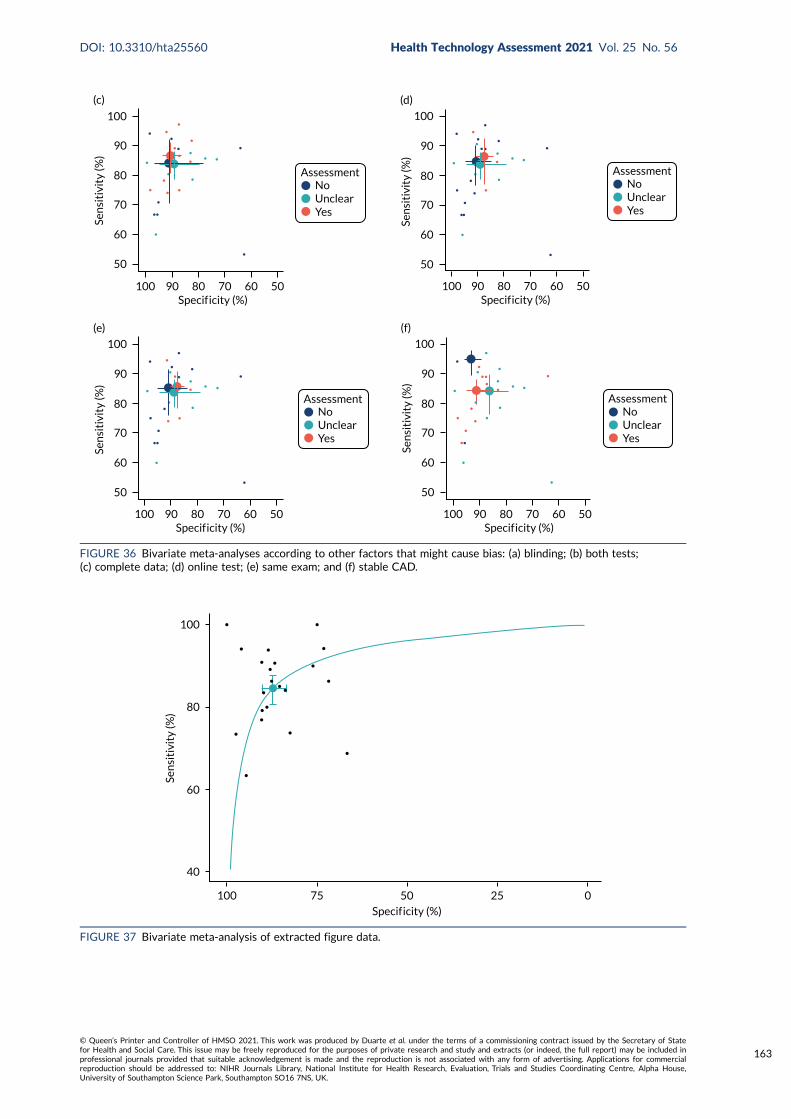
AssessmentNoUnclearYes
100
90
80
70
60
50
Sen
siti
vity
(%)
100Specif icity (%)
90 80 70 60 50
(c)
AssessmentNoUnclearYes
Specif icity (%)
100
90
80
70
60
50
Sen
siti
vity
(%)
100 90 80 70 60 50
(d)
AssessmentNoUnclearYes
100
90
80
70
60
50
Sen
siti
vity
(%)
100Specif icity (%)
90 80 70 60 50
(e)
AssessmentNoUnclearYes
100
90
80
70
60
50
Sen
siti
vity
(%)
100Specif icity (%)
90 80 70 60 50
(f)
FIGURE 36 Bivariate meta-analyses according to other factors that might cause bias: (a) blinding; (b) both tests;(c) complete data; (d) online test; (e) same exam; and (f) stable CAD.
100
80
60
40
100 75
Sen
siti
vity
(%)
50 25 0
Specif icity (%)
FIGURE 37 Bivariate meta-analysis of extracted figure data.
DOI: 10.3310/hta25560 Health Technology Assessment 2021 Vol. 25 No. 56
© Queen’s Printer and Controller of HMSO 2021. This work was produced by Duarte et al. under the terms of a commissioning contract issued by the Secretary of Statefor Health and Social Care. This issue may be freely reproduced for the purposes of private research and study and extracts (or indeed, the full report) may be included inprofessional journals provided that suitable acknowledgement is made and the reproduction is not associated with any form of advertising. Applications for commercialreproduction should be addressed to: NIHR Journals Library, National Institute for Health Research, Evaluation, Trials and Studies Coordinating Centre, Alpha House,University of Southampton Science Park, Southampton SO16 7NS, UK.
163
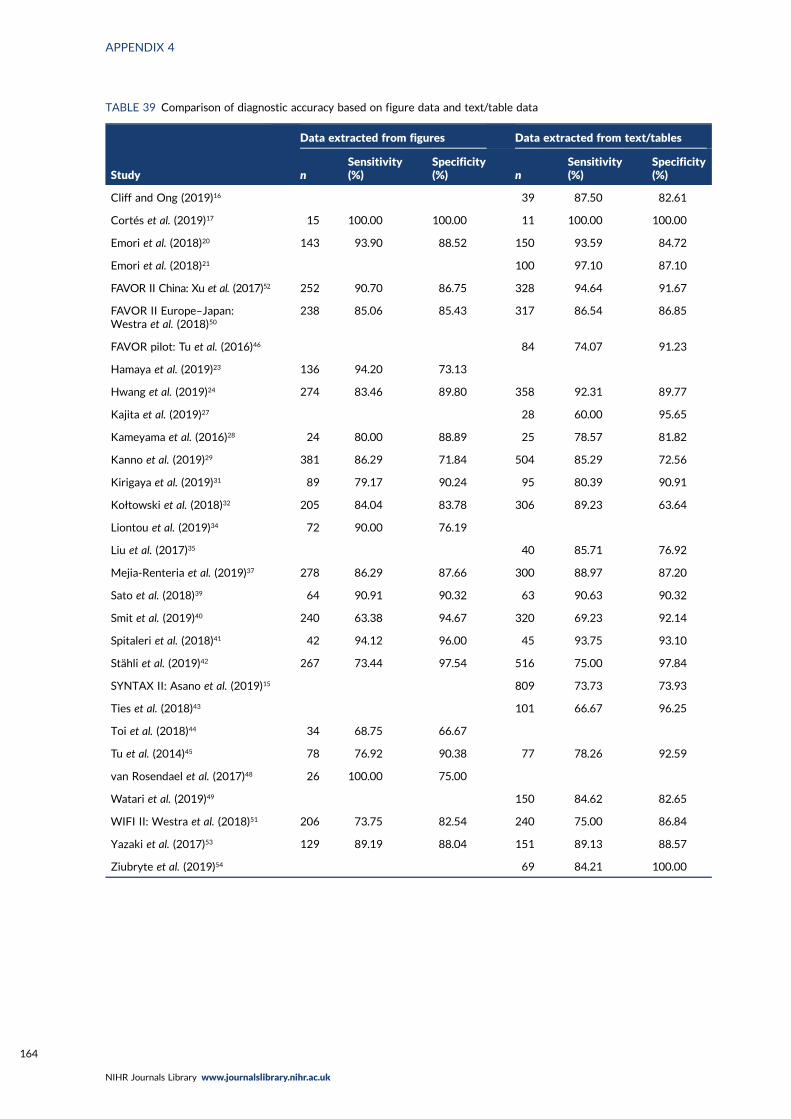
TABLE 39 Comparison of diagnostic accuracy based on figure data and text/table data
Study
Data extracted from figures Data extracted from text/tables
nSensitivity(%)
Specificity(%) n
Sensitivity(%)
Specificity(%)
Cliff and Ong (2019)16 39 87.50 82.61
Cortés et al. (2019)17 15 100.00 100.00 11 100.00 100.00
Emori et al. (2018)20 143 93.90 88.52 150 93.59 84.72
Emori et al. (2018)21 100 97.10 87.10
FAVOR II China: Xu et al. (2017)52 252 90.70 86.75 328 94.64 91.67
FAVOR II Europe–Japan:Westra et al. (2018)50
238 85.06 85.43 317 86.54 86.85
FAVOR pilot: Tu et al. (2016)46 84 74.07 91.23
Hamaya et al. (2019)23 136 94.20 73.13
Hwang et al. (2019)24 274 83.46 89.80 358 92.31 89.77
Kajita et al. (2019)27 28 60.00 95.65
Kameyama et al. (2016)28 24 80.00 88.89 25 78.57 81.82
Kanno et al. (2019)29 381 86.29 71.84 504 85.29 72.56
Kirigaya et al. (2019)31 89 79.17 90.24 95 80.39 90.91
Kołtowski et al. (2018)32 205 84.04 83.78 306 89.23 63.64
Liontou et al. (2019)34 72 90.00 76.19
Liu et al. (2017)35 40 85.71 76.92
Mejia-Renteria et al. (2019)37 278 86.29 87.66 300 88.97 87.20
Sato et al. (2018)39 64 90.91 90.32 63 90.63 90.32
Smit et al. (2019)40 240 63.38 94.67 320 69.23 92.14
Spitaleri et al. (2018)41 42 94.12 96.00 45 93.75 93.10
Stähli et al. (2019)42 267 73.44 97.54 516 75.00 97.84
SYNTAX II: Asano et al. (2019)15 809 73.73 73.93
Ties et al. (2018)43 101 66.67 96.25
Toi et al. (2018)44 34 68.75 66.67
Tu et al. (2014)45 78 76.92 90.38 77 78.26 92.59
van Rosendael et al. (2017)48 26 100.00 75.00
Watari et al. (2019)49 150 84.62 82.65
WIFI II: Westra et al. (2018)51 206 73.75 82.54 240 75.00 86.84
Yazaki et al. (2017)53 129 89.19 88.04 151 89.13 88.57
Ziubryte et al. (2019)54 69 84.21 100.00
APPENDIX 4
NIHR Journals Library www.journalslibrary.nihr.ac.uk
164
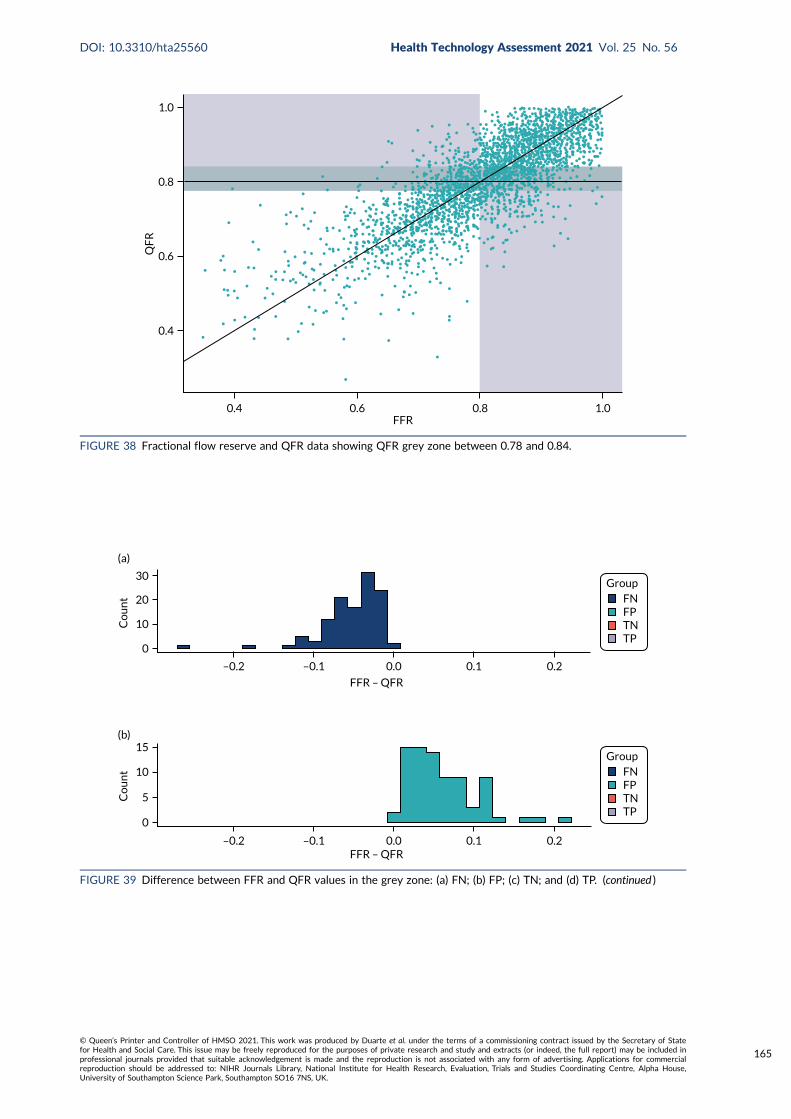
0.8
0.6
0.4
0.4
1.0
QF
R
0.6 0.8 1.0FFR
FIGURE 38 Fractional flow reserve and QFR data showing QFR grey zone between 0.78 and 0.84.
30Group
FNFPTNTP
Co
un
t 20
10
0
–0.2 –0.1 0.0 0.1 0.2
FFR – QFR
(a)
GroupFNFPTNTP
Co
un
t 10
15
5
0
–0.2 –0.1 0.0 0.1 0.2FFR – QFR
(b)
FIGURE 39 Difference between FFR and QFR values in the grey zone: (a) FN; (b) FP; (c) TN; and (d) TP. (continued )
DOI: 10.3310/hta25560 Health Technology Assessment 2021 Vol. 25 No. 56
© Queen’s Printer and Controller of HMSO 2021. This work was produced by Duarte et al. under the terms of a commissioning contract issued by the Secretary of Statefor Health and Social Care. This issue may be freely reproduced for the purposes of private research and study and extracts (or indeed, the full report) may be included inprofessional journals provided that suitable acknowledgement is made and the reproduction is not associated with any form of advertising. Applications for commercialreproduction should be addressed to: NIHR Journals Library, National Institute for Health Research, Evaluation, Trials and Studies Coordinating Centre, Alpha House,University of Southampton Science Park, Southampton SO16 7NS, UK.
165
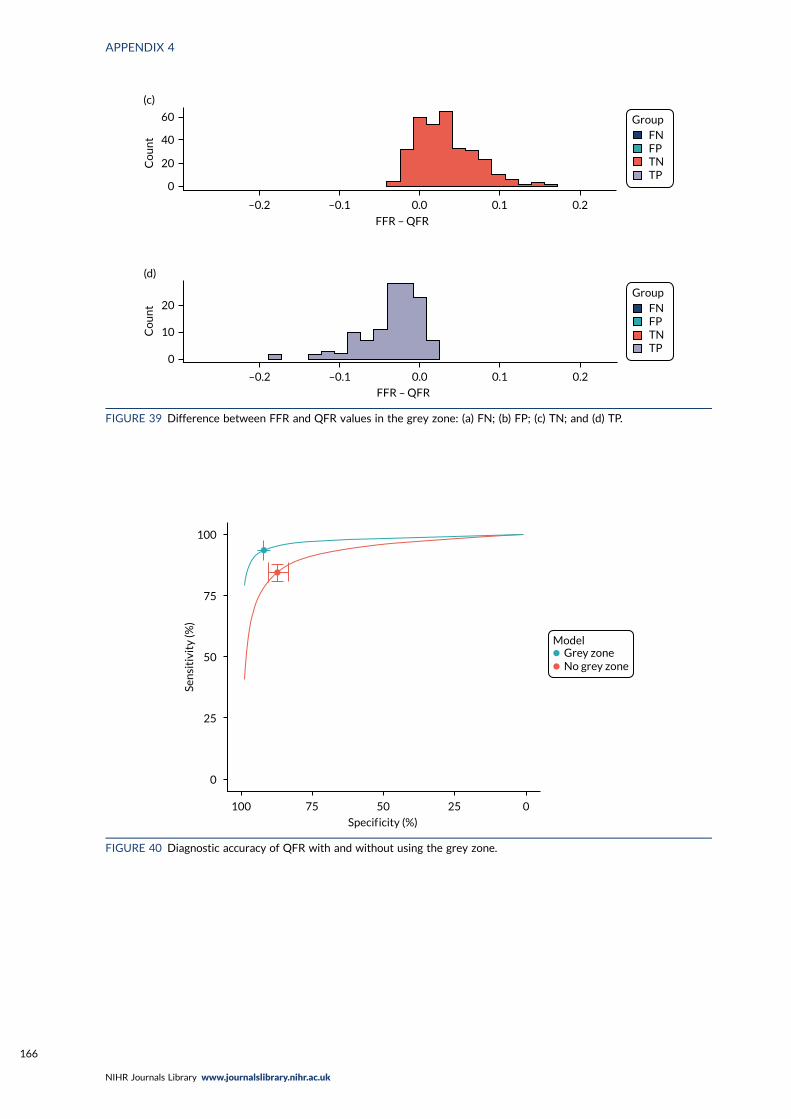
GroupFNFPTNTP
Co
un
t
60
40
20
0
–0.2 –0.1 0.0 0.1 0.2
FFR – QFR
(c)
GroupFNFPTNTP
Co
un
t 20
10
0
–0.2 –0.1 0.0 0.1 0.2
FFR – QFR
(d)
FIGURE 39 Difference between FFR and QFR values in the grey zone: (a) FN; (b) FP; (c) TN; and (d) TP.
Grey zoneNo grey zone
Model
100
75
Sen
siti
vity
(%)
50
25
0
100 75 50 25 0
Specif icity (%)
FIGURE 40 Diagnostic accuracy of QFR with and without using the grey zone.
APPENDIX 4
NIHR Journals Library www.journalslibrary.nihr.ac.uk
166
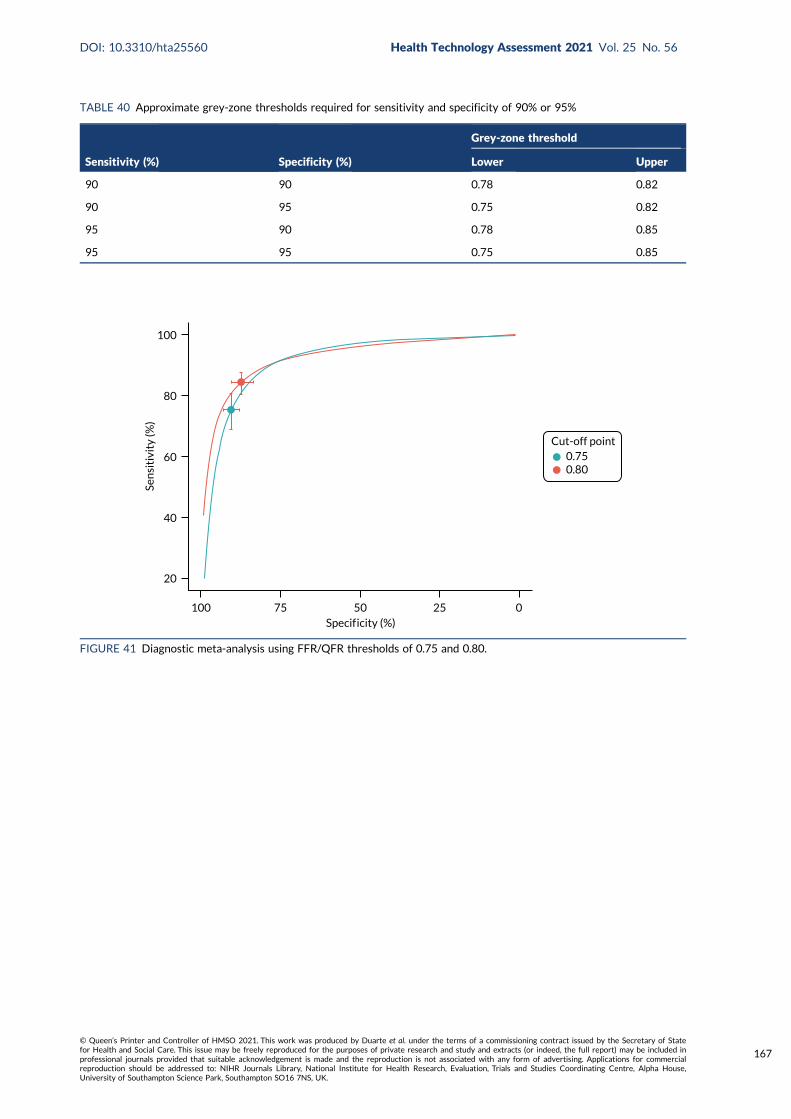
TABLE 40 Approximate grey-zone thresholds required for sensitivity and specificity of 90% or 95%
Sensitivity (%) Specificity (%)
Grey-zone threshold
Lower Upper
90 90 0.78 0.82
90 95 0.75 0.82
95 90 0.78 0.85
95 95 0.75 0.85
Specif icity (%)5075100
20
40
60
80
100
25 0
Sen
siti
vity
(%)
Cut-off point0.750.80
FIGURE 41 Diagnostic meta-analysis using FFR/QFR thresholds of 0.75 and 0.80.
DOI: 10.3310/hta25560 Health Technology Assessment 2021 Vol. 25 No. 56
© Queen’s Printer and Controller of HMSO 2021. This work was produced by Duarte et al. under the terms of a commissioning contract issued by the Secretary of Statefor Health and Social Care. This issue may be freely reproduced for the purposes of private research and study and extracts (or indeed, the full report) may be included inprofessional journals provided that suitable acknowledgement is made and the reproduction is not associated with any form of advertising. Applications for commercialreproduction should be addressed to: NIHR Journals Library, National Institute for Health Research, Evaluation, Trials and Studies Coordinating Centre, Alpha House,University of Southampton Science Park, Southampton SO16 7NS, UK.
167
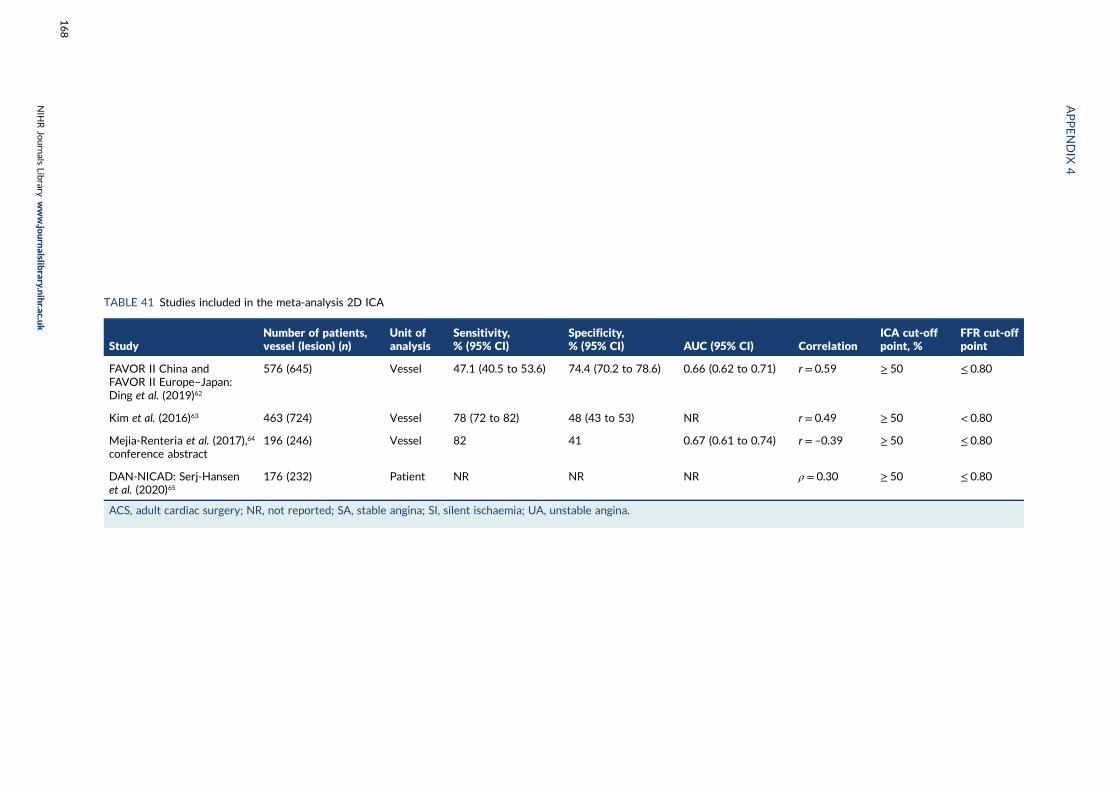
TABLE 41 Studies included in the meta-analysis 2D ICA
StudyNumber of patients,vessel (lesion) (n)
Unit ofanalysis
Sensitivity,% (95% CI)
Specificity,% (95% CI) AUC (95% CI) Correlation
ICA cut-offpoint, %
FFR cut-offpoint
FAVOR II China andFAVOR II Europe–Japan:Ding et al. (2019)62
576 (645) Vessel 47.1 (40.5 to 53.6) 74.4 (70.2 to 78.6) 0.66 (0.62 to 0.71) r = 0.59 ≥ 50 ≤ 0.80
Kim et al. (2016)63 463 (724) Vessel 78 (72 to 82) 48 (43 to 53) NR r = 0.49 ≥ 50 < 0.80
Mejia-Renteria et al. (2017),64
conference abstract196 (246) Vessel 82 41 0.67 (0.61 to 0.74) r = –0.39 ≥ 50 ≤ 0.80
DAN-NICAD: Serj-Hansenet al. (2020)65
176 (232) Patient NR NR NR ρ = 0.30 ≥ 50 ≤ 0.80
ACS, adult cardiac surgery; NR, not reported; SA, stable angina; SI, silent ischaemia; UA, unstable angina.
APPENDIX
4
NIH
RJournals
Library
www.jo
urnalslib
rary.nihr.ac.u
k
168

Appendix 5 Further narrative synthesis results
DOI: 10.3310/hta25560 Health Technology Assessment 2021 Vol. 25 No. 56
© Queen’s Printer and Controller of HMSO 2021. This work was produced by Duarte et al. under the terms of a commissioning contract issued by the Secretary of Statefor Health and Social Care. This issue may be freely reproduced for the purposes of private research and study and extracts (or indeed, the full report) may be included inprofessional journals provided that suitable acknowledgement is made and the reproduction is not associated with any form of advertising. Applications for commercialreproduction should be addressed to: NIHR Journals Library, National Institute for Health Research, Evaluation, Trials and Studies Coordinating Centre, Alpha House,University of Southampton Science Park, Southampton SO16 7NS, UK.
169
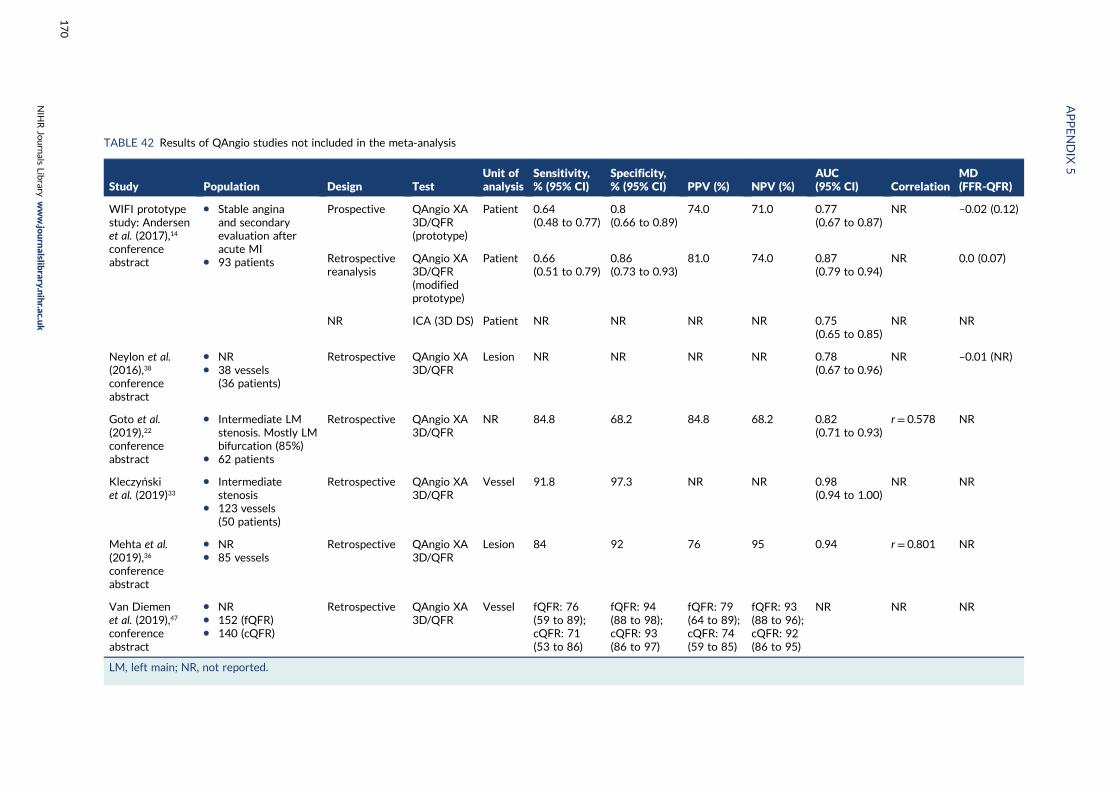
TABLE 42 Results of QAngio studies not included in the meta-analysis
Study Population Design TestUnit ofanalysis
Sensitivity,% (95% CI)
Specificity,% (95% CI) PPV (%) NPV (%)
AUC(95% CI) Correlation
MD(FFR-QFR)
WIFI prototypestudy: Andersenet al. (2017),14
conferenceabstract
l Stable anginaand secondaryevaluation afteracute MI
l 93 patients
Prospective QAngio XA3D/QFR(prototype)
Patient 0.64(0.48 to 0.77)
0.8(0.66 to 0.89)
74.0 71.0 0.77(0.67 to 0.87)
NR –0.02 (0.12)
Retrospectivereanalysis
QAngio XA3D/QFR(modifiedprototype)
Patient 0.66(0.51 to 0.79)
0.86(0.73 to 0.93)
81.0 74.0 0.87(0.79 to 0.94)
NR 0.0 (0.07)
NR ICA (3D DS) Patient NR NR NR NR 0.75(0.65 to 0.85)
NR NR
Neylon et al.(2016),38
conferenceabstract
l NRl 38 vessels
(36 patients)
Retrospective QAngio XA3D/QFR
Lesion NR NR NR NR 0.78(0.67 to 0.96)
NR –0.01 (NR)
Goto et al.(2019),22
conferenceabstract
l Intermediate LMstenosis. Mostly LMbifurcation (85%)
l 62 patients
Retrospective QAngio XA3D/QFR
NR 84.8 68.2 84.8 68.2 0.82(0.71 to 0.93)
r = 0.578 NR
Kleczyńskiet al. (2019)33
l Intermediatestenosis
l 123 vessels(50 patients)
Retrospective QAngio XA3D/QFR
Vessel 91.8 97.3 NR NR 0.98(0.94 to 1.00)
NR NR
Mehta et al.(2019),36
conferenceabstract
l NRl 85 vessels
Retrospective QAngio XA3D/QFR
Lesion 84 92 76 95 0.94 r = 0.801 NR
Van Diemenet al. (2019),47
conferenceabstract
l NRl 152 (fQFR)l 140 (cQFR)
Retrospective QAngio XA3D/QFR
Vessel fQFR: 76(59 to 89);cQFR: 71(53 to 86)
fQFR: 94(88 to 98);cQFR: 93(86 to 97)
fQFR: 79(64 to 89);cQFR: 74(59 to 85)
fQFR: 93(88 to 96);cQFR: 92(86 to 95)
NR NR NR
LM, left main; NR, not reported.
APPENDIX
5
NIH
RJournals
Library
www.jo
urnalslib
rary.nihr.ac.u
k
170
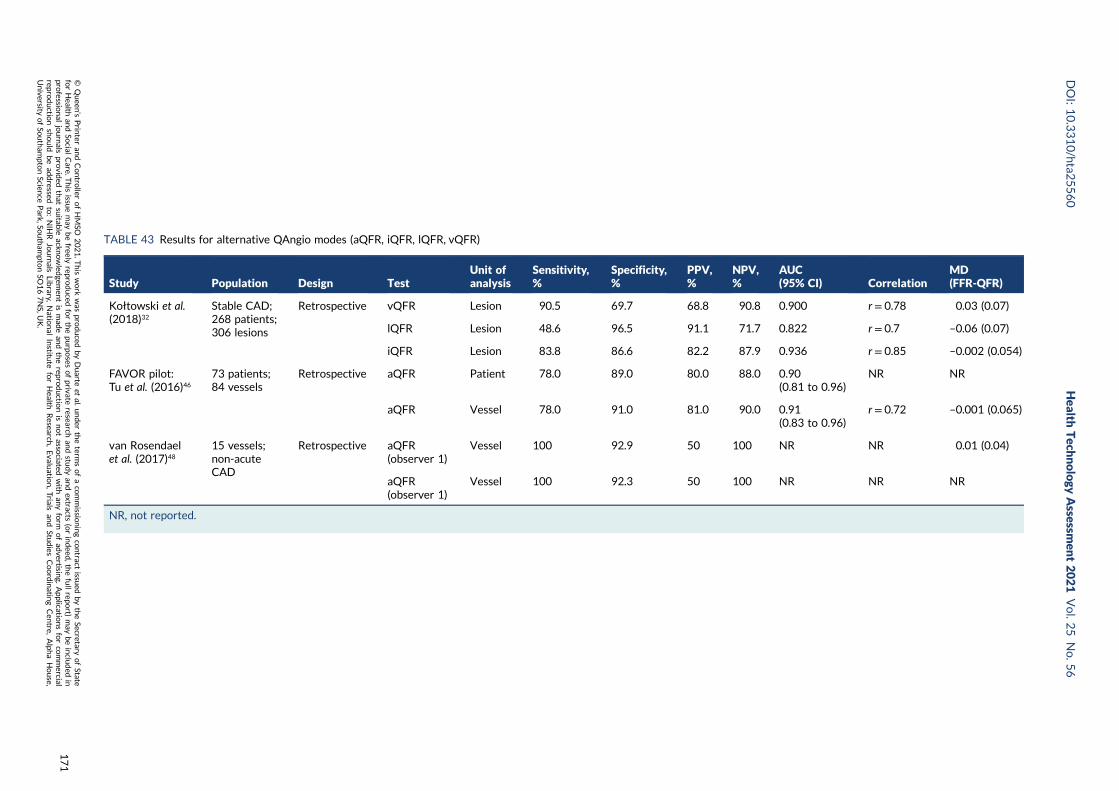
TABLE 43 Results for alternative QAngio modes (aQFR, iQFR, lQFR, vQFR)
Study Population Design TestUnit ofanalysis
Sensitivity,%
Specificity,%
PPV,%
NPV,%
AUC(95% CI) Correlation
MD(FFR-QFR)
Kołtowski et al.(2018)32
Stable CAD;268 patients;306 lesions
Retrospective vQFR Lesion 90.5 69.7 68.8 90.8 0.900 r = 0.78 0.03 (0.07)
lQFR Lesion 48.6 96.5 91.1 71.7 0.822 r = 0.7 –0.06 (0.07)
iQFR Lesion 83.8 86.6 82.2 87.9 0.936 r = 0.85 –0.002 (0.054)
FAVOR pilot:Tu et al. (2016)46
73 patients;84 vessels
Retrospective aQFR Patient 78.0 89.0 80.0 88.0 0.90(0.81 to 0.96)
NR NR
aQFR Vessel 78.0 91.0 81.0 90.0 0.91(0.83 to 0.96)
r = 0.72 –0.001 (0.065)
van Rosendaelet al. (2017)48
15 vessels;non-acuteCAD
Retrospective aQFR(observer 1)
Vessel 100 92.9 50 100 NR NR 0.01 (0.04)
aQFR(observer 1)
Vessel 100 92.3 50 100 NR NR NR
NR, not reported.
DOI:10.3310/hta2
5560
Health
Tech
nology
Assessm
ent2021
Vol.2
5No.5
6
©Queen
’sPrin
teran
dContro
llerofHMSO
2021.T
his
work
was
produced
byDuarte
etal.
under
theterm
sofaco
mmissio
ningco
ntract
issued
bytheSecretary
ofState
forHealth
andSo
cialCare.T
his
issuemay
befreely
reproduced
forthepu
rposes
ofprivate
researchan
dstu
dyan
dextracts
(orindeed
,thefullrepo
rt)may
beinclu
ded
inpro
fessional
journals
provid
edthat
suitab
leackn
owled
gemen
tis
mad
ean
dtherepro
ductio
nis
notasso
ciatedwith
anyform
ofad
vertising.
Applicatio
nsforco
mmercial
reproductio
nshould
bead
dressed
to:NIH
RJournals
Library,
Natio
nal
Institu
teforHealth
Research
,Evalu
ation,Trials
and
Studies
Coordinatin
gCen
tre,Alph
aHouse,
University
ofSo
utham
ptonScien
cePark,So
utham
ptonSO
167NS,U
K.
171
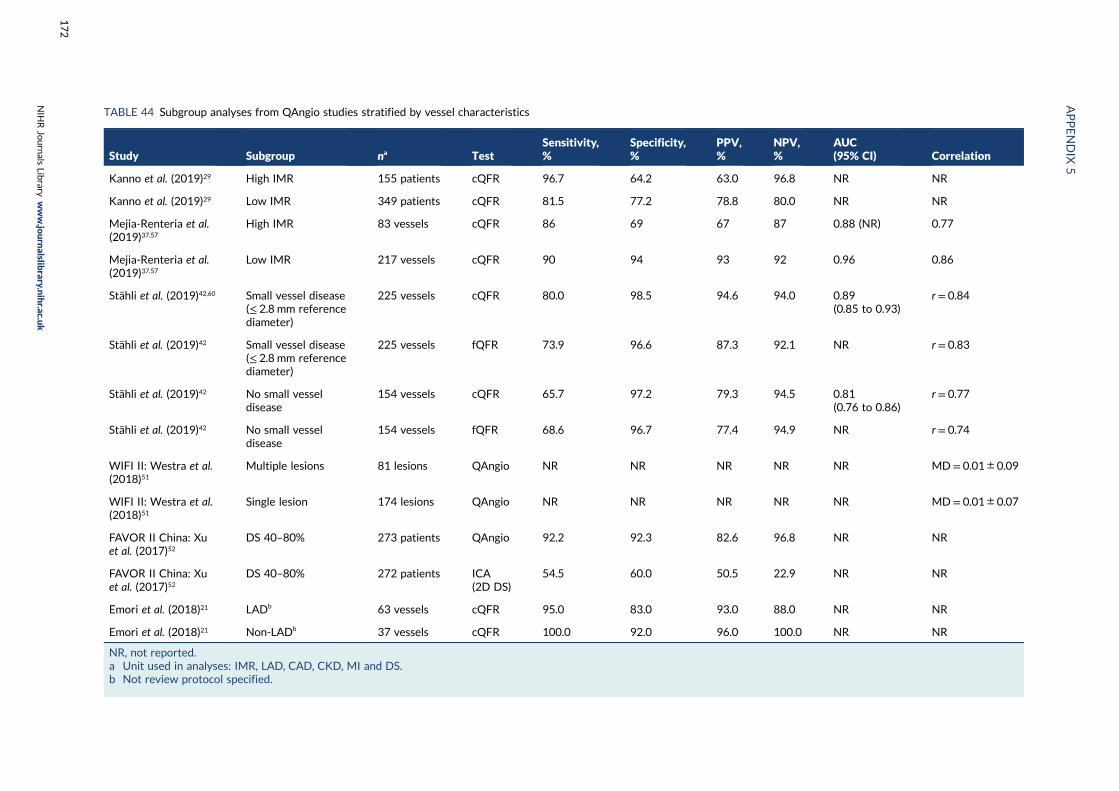
TABLE 44 Subgroup analyses from QAngio studies stratified by vessel characteristics
Study Subgroup na TestSensitivity,%
Specificity,%
PPV,%
NPV,%
AUC(95% CI) Correlation
Kanno et al. (2019)29 High IMR 155 patients cQFR 96.7 64.2 63.0 96.8 NR NR
Kanno et al. (2019)29 Low IMR 349 patients cQFR 81.5 77.2 78.8 80.0 NR NR
Mejia-Renteria et al.(2019)37,57
High IMR 83 vessels cQFR 86 69 67 87 0.88 (NR) 0.77
Mejia-Renteria et al.(2019)37,57
Low IMR 217 vessels cQFR 90 94 93 92 0.96 0.86
Stähli et al. (2019)42,60 Small vessel disease(≤ 2.8 mm referencediameter)
225 vessels cQFR 80.0 98.5 94.6 94.0 0.89(0.85 to 0.93)
r = 0.84
Stähli et al. (2019)42 Small vessel disease(≤ 2.8 mm referencediameter)
225 vessels fQFR 73.9 96.6 87.3 92.1 NR r = 0.83
Stähli et al. (2019)42 No small vesseldisease
154 vessels cQFR 65.7 97.2 79.3 94.5 0.81(0.76 to 0.86)
r = 0.77
Stähli et al. (2019)42 No small vesseldisease
154 vessels fQFR 68.6 96.7 77.4 94.9 NR r = 0.74
WIFI II: Westra et al.(2018)51
Multiple lesions 81 lesions QAngio NR NR NR NR NR MD= 0.01 ± 0.09
WIFI II: Westra et al.(2018)51
Single lesion 174 lesions QAngio NR NR NR NR NR MD= 0.01 ± 0.07
FAVOR II China: Xuet al. (2017)52
DS 40–80% 273 patients QAngio 92.2 92.3 82.6 96.8 NR NR
FAVOR II China: Xuet al. (2017)52
DS 40–80% 272 patients ICA(2D DS)
54.5 60.0 50.5 22.9 NR NR
Emori et al. (2018)21 LADb 63 vessels cQFR 95.0 83.0 93.0 88.0 NR NR
Emori et al. (2018)21 Non-LADb 37 vessels cQFR 100.0 92.0 96.0 100.0 NR NR
NR, not reported.a Unit used in analyses: IMR, LAD, CAD, CKD, MI and DS.b Not review protocol specified.
APPENDIX
5
NIH
RJournals
Library
www.jo
urnalslib
rary.nihr.ac.u
k
172
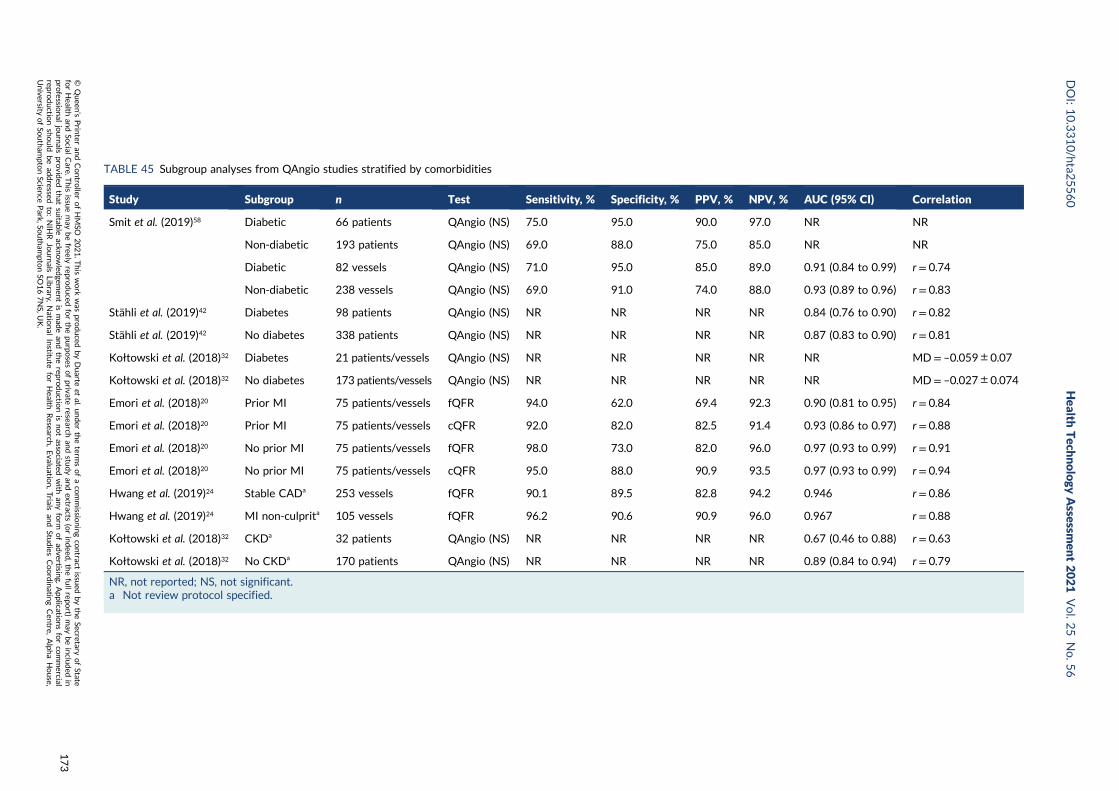
TABLE 45 Subgroup analyses from QAngio studies stratified by comorbidities
Study Subgroup n Test Sensitivity, % Specificity, % PPV, % NPV, % AUC (95% CI) Correlation
Smit et al. (2019)58 Diabetic 66 patients QAngio (NS) 75.0 95.0 90.0 97.0 NR NR
Non-diabetic 193 patients QAngio (NS) 69.0 88.0 75.0 85.0 NR NR
Diabetic 82 vessels QAngio (NS) 71.0 95.0 85.0 89.0 0.91 (0.84 to 0.99) r = 0.74
Non-diabetic 238 vessels QAngio (NS) 69.0 91.0 74.0 88.0 0.93 (0.89 to 0.96) r = 0.83
Stähli et al. (2019)42 Diabetes 98 patients QAngio (NS) NR NR NR NR 0.84 (0.76 to 0.90) r = 0.82
Stähli et al. (2019)42 No diabetes 338 patients QAngio (NS) NR NR NR NR 0.87 (0.83 to 0.90) r = 0.81
Kołtowski et al. (2018)32 Diabetes 21 patients/vessels QAngio (NS) NR NR NR NR NR MD= –0.059 ± 0.07
Kołtowski et al. (2018)32 No diabetes 173 patients/vessels QAngio (NS) NR NR NR NR NR MD= –0.027 ± 0.074
Emori et al. (2018)20 Prior MI 75 patients/vessels fQFR 94.0 62.0 69.4 92.3 0.90 (0.81 to 0.95) r = 0.84
Emori et al. (2018)20 Prior MI 75 patients/vessels cQFR 92.0 82.0 82.5 91.4 0.93 (0.86 to 0.97) r = 0.88
Emori et al. (2018)20 No prior MI 75 patients/vessels fQFR 98.0 73.0 82.0 96.0 0.97 (0.93 to 0.99) r = 0.91
Emori et al. (2018)20 No prior MI 75 patients/vessels cQFR 95.0 88.0 90.9 93.5 0.97 (0.93 to 0.99) r = 0.94
Hwang et al. (2019)24 Stable CADa 253 vessels fQFR 90.1 89.5 82.8 94.2 0.946 r = 0.86
Hwang et al. (2019)24 MI non-culprita 105 vessels fQFR 96.2 90.6 90.9 96.0 0.967 r = 0.88
Kołtowski et al. (2018)32 CKDa 32 patients QAngio (NS) NR NR NR NR 0.67 (0.46 to 0.88) r = 0.63
Kołtowski et al. (2018)32 No CKDa 170 patients QAngio (NS) NR NR NR NR 0.89 (0.84 to 0.94) r = 0.79
NR, not reported; NS, not significant.a Not review protocol specified.
DOI:10.3310/hta2
5560
Health
Tech
nology
Assessm
ent2021
Vol.2
5No.5
6
©Queen
’sPrin
teran
dContro
llerofHMSO
2021.T
his
work
was
produced
byDuarte
etal.
under
theterm
sofaco
mmissio
ningco
ntract
issued
bytheSecretary
ofState
forHealth
andSo
cialCare.T
his
issuemay
befreely
reproduced
forthepu
rposes
ofprivate
researchan
dstu
dyan
dextracts
(orindeed
,thefullrepo
rt)may
beinclu
ded
inpro
fessional
journals
provid
edthat
suitab
leackn
owled
gemen
tis
mad
ean
dtherepro
ductio
nis
notasso
ciatedwith
anyform
ofad
vertising.
Applicatio
nsforco
mmercial
reproductio
nshould
bead
dressed
to:NIH
RJournals
Library,
Natio
nal
Institu
teforHealth
Research
,Evalu
ation,Trials
and
Studies
Coordinatin
gCen
tre,Alph
aHouse,
University
ofSo
utham
ptonScien
cePark,So
utham
ptonSO
167NS,U
K.
173
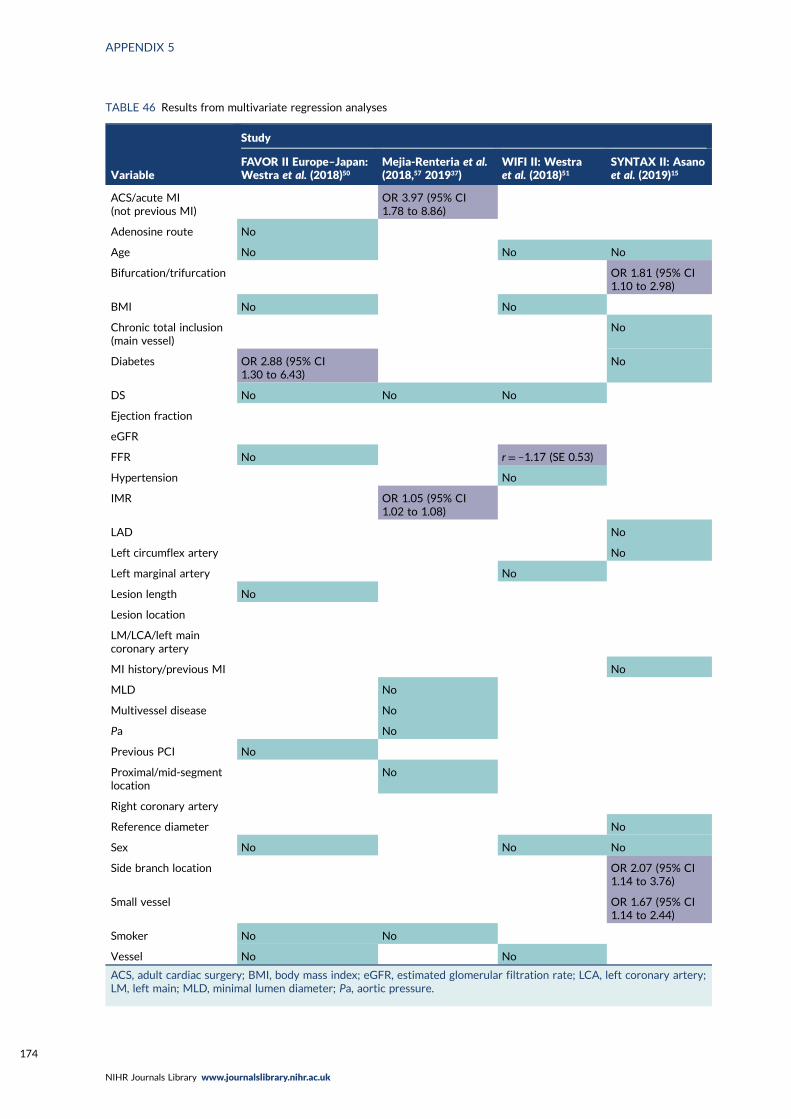
TABLE 46 Results from multivariate regression analyses
Variable
Study
FAVOR II Europe–Japan:Westra et al. (2018)50
Mejia-Renteria et al.(2018,57 201937)
WIFI II: Westraet al. (2018)51
SYNTAX II: Asanoet al. (2019)15
ACS/acute MI(not previous MI)
OR 3.97 (95% CI1.78 to 8.86)
Adenosine route No
Age No No No
Bifurcation/trifurcation OR 1.81 (95% CI1.10 to 2.98)
BMI No No
Chronic total inclusion(main vessel)
No
Diabetes OR 2.88 (95% CI1.30 to 6.43)
No
DS No No No
Ejection fraction
eGFR
FFR No r = –1.17 (SE 0.53)
Hypertension No
IMR OR 1.05 (95% CI1.02 to 1.08)
LAD No
Left circumflex artery No
Left marginal artery No
Lesion length No
Lesion location
LM/LCA/left maincoronary artery
MI history/previous MI No
MLD No
Multivessel disease No
Pa No
Previous PCI No
Proximal/mid-segmentlocation
No
Right coronary artery
Reference diameter No
Sex No No No
Side branch location OR 2.07 (95% CI1.14 to 3.76)
Small vessel OR 1.67 (95% CI1.14 to 2.44)
Smoker No No
Vessel No No
ACS, adult cardiac surgery; BMI, body mass index; eGFR, estimated glomerular filtration rate; LCA, left coronary artery;LM, left main; MLD, minimal lumen diameter; Pa, aortic pressure.
APPENDIX 5
NIHR Journals Library www.journalslibrary.nihr.ac.uk
174
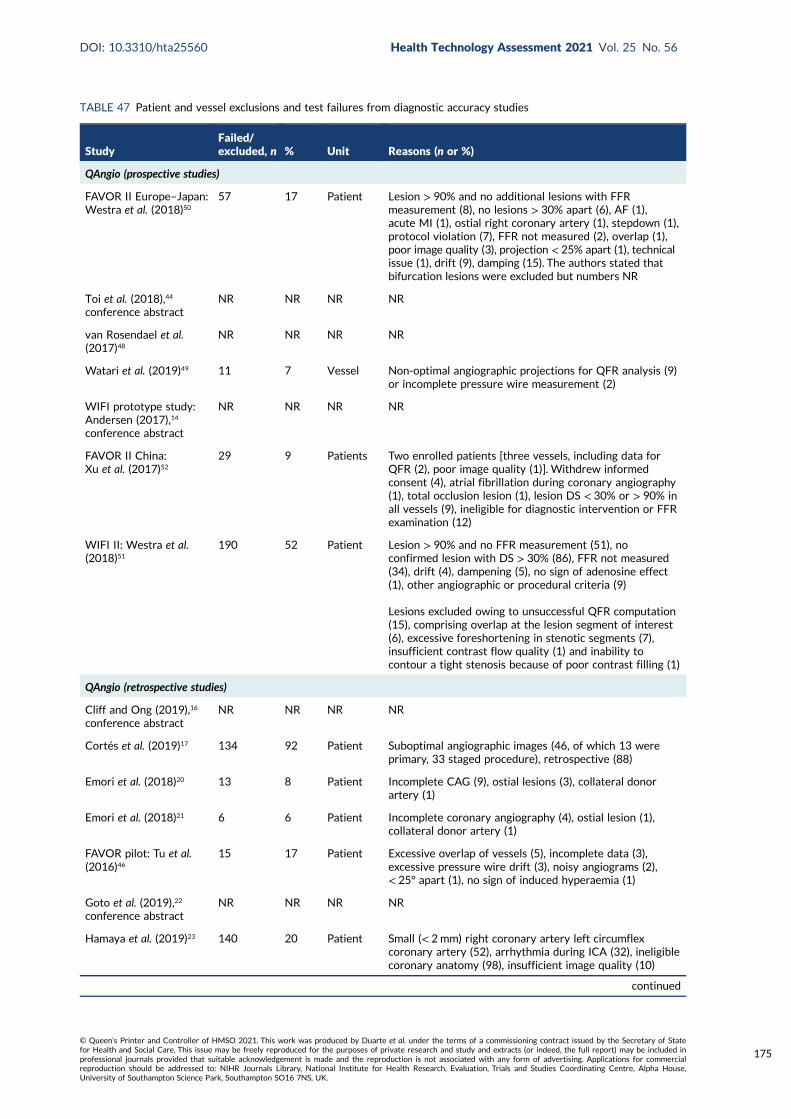
TABLE 47 Patient and vessel exclusions and test failures from diagnostic accuracy studies
StudyFailed/excluded, n % Unit Reasons (n or %)
QAngio (prospective studies)
FAVOR II Europe–Japan:Westra et al. (2018)50
57 17 Patient Lesion > 90% and no additional lesions with FFRmeasurement (8), no lesions > 30% apart (6), AF (1),acute MI (1), ostial right coronary artery (1), stepdown (1),protocol violation (7), FFR not measured (2), overlap (1),poor image quality (3), projection < 25% apart (1), technicalissue (1), drift (9), damping (15). The authors stated thatbifurcation lesions were excluded but numbers NR
Toi et al. (2018),44
conference abstractNR NR NR NR
van Rosendael et al.(2017)48
NR NR NR NR
Watari et al. (2019)49 11 7 Vessel Non-optimal angiographic projections for QFR analysis (9)or incomplete pressure wire measurement (2)
WIFI prototype study:Andersen (2017),14
conference abstract
NR NR NR NR
FAVOR II China:Xu et al. (2017)52
29 9 Patients Two enrolled patients [three vessels, including data forQFR (2), poor image quality (1)]. Withdrew informedconsent (4), atrial fibrillation during coronary angiography(1), total occlusion lesion (1), lesion DS < 30% or > 90% inall vessels (9), ineligible for diagnostic intervention or FFRexamination (12)
WIFI II: Westra et al.(2018)51
190 52 Patient Lesion > 90% and no FFR measurement (51), noconfirmed lesion with DS > 30% (86), FFR not measured(34), drift (4), dampening (5), no sign of adenosine effect(1), other angiographic or procedural criteria (9)
Lesions excluded owing to unsuccessful QFR computation(15), comprising overlap at the lesion segment of interest(6), excessive foreshortening in stenotic segments (7),insufficient contrast flow quality (1) and inability tocontour a tight stenosis because of poor contrast filling (1)
QAngio (retrospective studies)
Cliff and Ong (2019),16
conference abstractNR NR NR NR
Cortés et al. (2019)17 134 92 Patient Suboptimal angiographic images (46, of which 13 wereprimary, 33 staged procedure), retrospective (88)
Emori et al. (2018)20 13 8 Patient Incomplete CAG (9), ostial lesions (3), collateral donorartery (1)
Emori et al. (2018)21 6 6 Patient Incomplete coronary angiography (4), ostial lesion (1),collateral donor artery (1)
FAVOR pilot: Tu et al.(2016)46
15 17 Patient Excessive overlap of vessels (5), incomplete data (3),excessive pressure wire drift (3), noisy angiograms (2),< 25° apart (1), no sign of induced hyperaemia (1)
Goto et al. (2019),22
conference abstractNR NR NR NR
Hamaya et al. (2019)23 140 20 Patient Small (< 2mm) right coronary artery left circumflexcoronary artery (52), arrhythmia during ICA (32), ineligiblecoronary anatomy (98), insufficient image quality (10)
continued
DOI: 10.3310/hta25560 Health Technology Assessment 2021 Vol. 25 No. 56
© Queen’s Printer and Controller of HMSO 2021. This work was produced by Duarte et al. under the terms of a commissioning contract issued by the Secretary of Statefor Health and Social Care. This issue may be freely reproduced for the purposes of private research and study and extracts (or indeed, the full report) may be included inprofessional journals provided that suitable acknowledgement is made and the reproduction is not associated with any form of advertising. Applications for commercialreproduction should be addressed to: NIHR Journals Library, National Institute for Health Research, Evaluation, Trials and Studies Coordinating Centre, Alpha House,University of Southampton Science Park, Southampton SO16 7NS, UK.
175
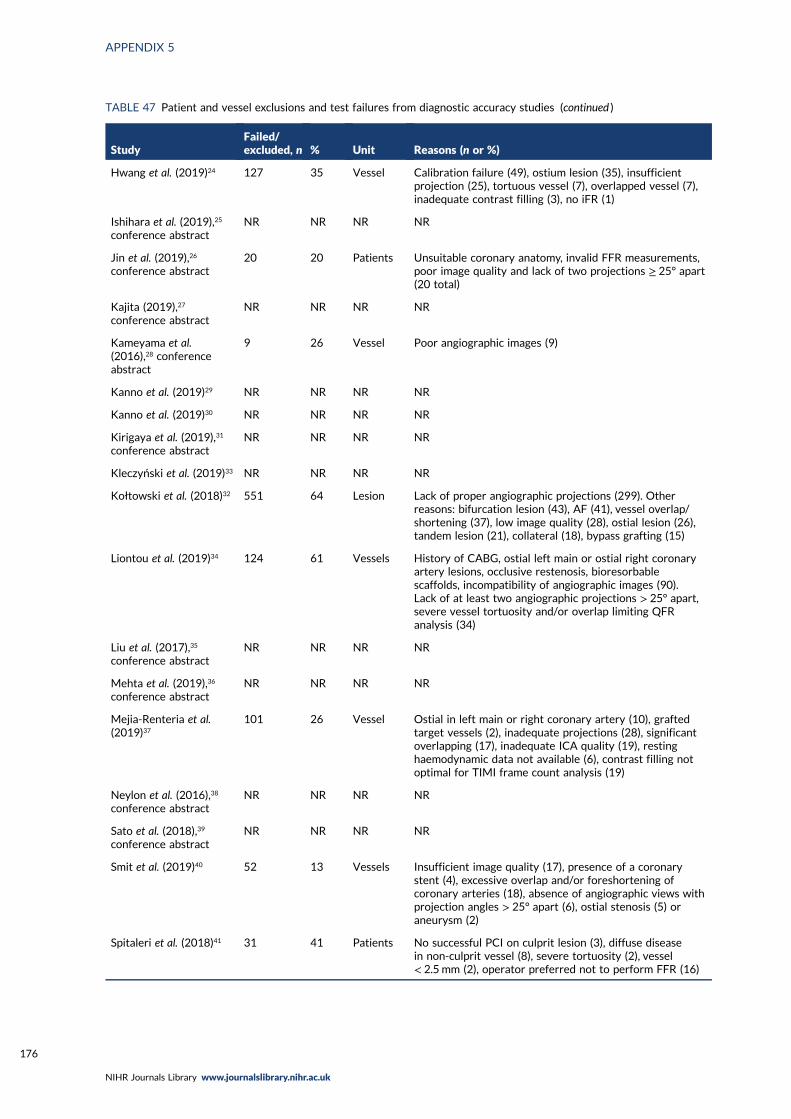
TABLE 47 Patient and vessel exclusions and test failures from diagnostic accuracy studies (continued )
StudyFailed/excluded, n % Unit Reasons (n or %)
Hwang et al. (2019)24 127 35 Vessel Calibration failure (49), ostium lesion (35), insufficientprojection (25), tortuous vessel (7), overlapped vessel (7),inadequate contrast filling (3), no iFR (1)
Ishihara et al. (2019),25
conference abstractNR NR NR NR
Jin et al. (2019),26
conference abstract20 20 Patients Unsuitable coronary anatomy, invalid FFR measurements,
poor image quality and lack of two projections ≥ 25° apart(20 total)
Kajita (2019),27
conference abstractNR NR NR NR
Kameyama et al.(2016),28 conferenceabstract
9 26 Vessel Poor angiographic images (9)
Kanno et al. (2019)29 NR NR NR NR
Kanno et al. (2019)30 NR NR NR NR
Kirigaya et al. (2019),31
conference abstractNR NR NR NR
Kleczyński et al. (2019)33 NR NR NR NR
Kołtowski et al. (2018)32 551 64 Lesion Lack of proper angiographic projections (299). Otherreasons: bifurcation lesion (43), AF (41), vessel overlap/shortening (37), low image quality (28), ostial lesion (26),tandem lesion (21), collateral (18), bypass grafting (15)
Liontou et al. (2019)34 124 61 Vessels History of CABG, ostial left main or ostial right coronaryartery lesions, occlusive restenosis, bioresorbablescaffolds, incompatibility of angiographic images (90).Lack of at least two angiographic projections > 25° apart,severe vessel tortuosity and/or overlap limiting QFRanalysis (34)
Liu et al. (2017),35
conference abstractNR NR NR NR
Mehta et al. (2019),36
conference abstractNR NR NR NR
Mejia-Renteria et al.(2019)37
101 26 Vessel Ostial in left main or right coronary artery (10), graftedtarget vessels (2), inadequate projections (28), significantoverlapping (17), inadequate ICA quality (19), restinghaemodynamic data not available (6), contrast filling notoptimal for TIMI frame count analysis (19)
Neylon et al. (2016),38
conference abstractNR NR NR NR
Sato et al. (2018),39
conference abstractNR NR NR NR
Smit et al. (2019)40 52 13 Vessels Insufficient image quality (17), presence of a coronarystent (4), excessive overlap and/or foreshortening ofcoronary arteries (18), absence of angiographic views withprojection angles > 25° apart (6), ostial stenosis (5) oraneurysm (2)
Spitaleri et al. (2018)41 31 41 Patients No successful PCI on culprit lesion (3), diffuse diseasein non-culprit vessel (8), severe tortuosity (2), vessel< 2.5 mm (2), operator preferred not to perform FFR (16)
APPENDIX 5
NIHR Journals Library www.journalslibrary.nihr.ac.uk
176
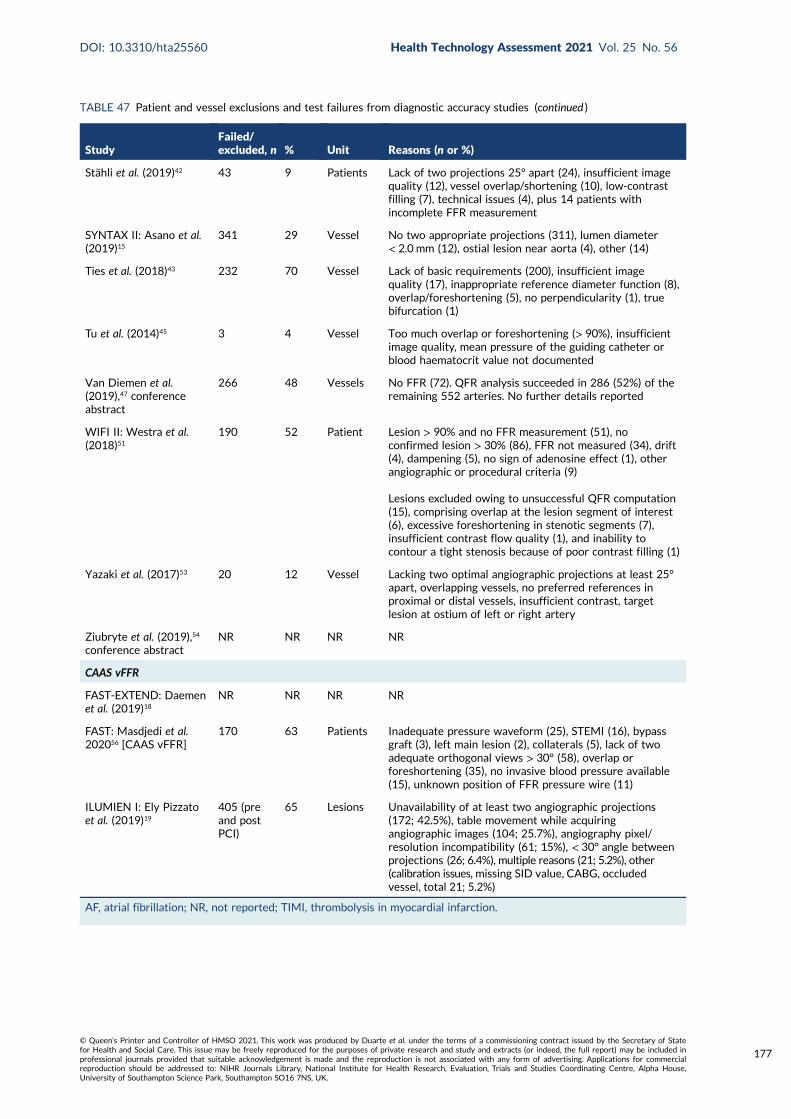
TABLE 47 Patient and vessel exclusions and test failures from diagnostic accuracy studies (continued )
StudyFailed/excluded, n % Unit Reasons (n or %)
Stähli et al. (2019)42 43 9 Patients Lack of two projections 25° apart (24), insufficient imagequality (12), vessel overlap/shortening (10), low-contrastfilling (7), technical issues (4), plus 14 patients withincomplete FFR measurement
SYNTAX II: Asano et al.(2019)15
341 29 Vessel No two appropriate projections (311), lumen diameter< 2.0 mm (12), ostial lesion near aorta (4), other (14)
Ties et al. (2018)43 232 70 Vessel Lack of basic requirements (200), insufficient imagequality (17), inappropriate reference diameter function (8),overlap/foreshortening (5), no perpendicularity (1), truebifurcation (1)
Tu et al. (2014)45 3 4 Vessel Too much overlap or foreshortening (> 90%), insufficientimage quality, mean pressure of the guiding catheter orblood haematocrit value not documented
Van Diemen et al.(2019),47 conferenceabstract
266 48 Vessels No FFR (72). QFR analysis succeeded in 286 (52%) of theremaining 552 arteries. No further details reported
WIFI II: Westra et al.(2018)51
190 52 Patient Lesion > 90% and no FFR measurement (51), noconfirmed lesion > 30% (86), FFR not measured (34), drift(4), dampening (5), no sign of adenosine effect (1), otherangiographic or procedural criteria (9)
Lesions excluded owing to unsuccessful QFR computation(15), comprising overlap at the lesion segment of interest(6), excessive foreshortening in stenotic segments (7),insufficient contrast flow quality (1), and inability tocontour a tight stenosis because of poor contrast filling (1)
Yazaki et al. (2017)53 20 12 Vessel Lacking two optimal angiographic projections at least 25°apart, overlapping vessels, no preferred references inproximal or distal vessels, insufficient contrast, targetlesion at ostium of left or right artery
Ziubryte et al. (2019),54
conference abstractNR NR NR NR
CAAS vFFR
FAST-EXTEND: Daemenet al. (2019)18
NR NR NR NR
FAST: Masdjedi et al.202056 [CAAS vFFR]
170 63 Patients Inadequate pressure waveform (25), STEMI (16), bypassgraft (3), left main lesion (2), collaterals (5), lack of twoadequate orthogonal views > 30° (58), overlap orforeshortening (35), no invasive blood pressure available(15), unknown position of FFR pressure wire (11)
ILUMIEN I: Ely Pizzatoet al. (2019)19
405 (preand postPCI)
65 Lesions Unavailability of at least two angiographic projections(172; 42.5%), table movement while acquiringangiographic images (104; 25.7%), angiography pixel/resolution incompatibility (61; 15%), < 30° angle betweenprojections (26; 6.4%), multiple reasons (21; 5.2%), other(calibration issues, missing SID value, CABG, occludedvessel, total 21; 5.2%)
AF, atrial fibrillation; NR, not reported; TIMI, thrombolysis in myocardial infarction.
DOI: 10.3310/hta25560 Health Technology Assessment 2021 Vol. 25 No. 56
© Queen’s Printer and Controller of HMSO 2021. This work was produced by Duarte et al. under the terms of a commissioning contract issued by the Secretary of Statefor Health and Social Care. This issue may be freely reproduced for the purposes of private research and study and extracts (or indeed, the full report) may be included inprofessional journals provided that suitable acknowledgement is made and the reproduction is not associated with any form of advertising. Applications for commercialreproduction should be addressed to: NIHR Journals Library, National Institute for Health Research, Evaluation, Trials and Studies Coordinating Centre, Alpha House,University of Southampton Science Park, Southampton SO16 7NS, UK.
177
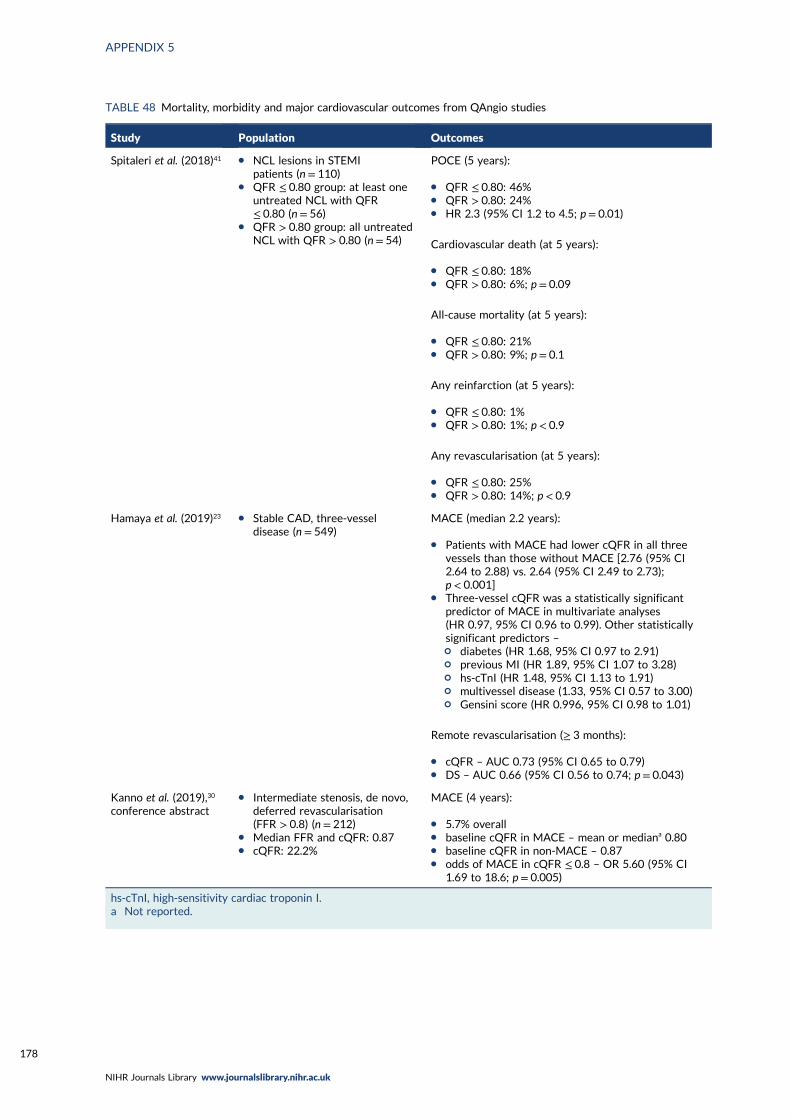
TABLE 48 Mortality, morbidity and major cardiovascular outcomes from QAngio studies
Study Population Outcomes
Spitaleri et al. (2018)41 l NCL lesions in STEMIpatients (n= 110)
l QFR ≤ 0.80 group: at least oneuntreated NCL with QFR≤ 0.80 (n= 56)
l QFR > 0.80 group: all untreatedNCL with QFR > 0.80 (n= 54)
POCE (5 years):
l QFR ≤ 0.80: 46%l QFR > 0.80: 24%l HR 2.3 (95% CI 1.2 to 4.5; p = 0.01)
Cardiovascular death (at 5 years):
l QFR ≤ 0.80: 18%l QFR > 0.80: 6%; p = 0.09
All-cause mortality (at 5 years):
l QFR ≤ 0.80: 21%l QFR > 0.80: 9%; p = 0.1
Any reinfarction (at 5 years):
l QFR ≤ 0.80: 1%l QFR > 0.80: 1%; p < 0.9
Any revascularisation (at 5 years):
l QFR ≤ 0.80: 25%l QFR > 0.80: 14%; p < 0.9
Hamaya et al. (2019)23 l Stable CAD, three-vesseldisease (n = 549)
MACE (median 2.2 years):
l Patients with MACE had lower cQFR in all threevessels than those without MACE [2.76 (95% CI2.64 to 2.88) vs. 2.64 (95% CI 2.49 to 2.73);p < 0.001]
l Three-vessel cQFR was a statistically significantpredictor of MACE in multivariate analyses(HR 0.97, 95% CI 0.96 to 0.99). Other statisticallysignificant predictors –¢ diabetes (HR 1.68, 95% CI 0.97 to 2.91)¢ previous MI (HR 1.89, 95% CI 1.07 to 3.28)¢ hs-cTnI (HR 1.48, 95% CI 1.13 to 1.91)¢ multivessel disease (1.33, 95% CI 0.57 to 3.00)¢ Gensini score (HR 0.996, 95% CI 0.98 to 1.01)
Remote revascularisation (≥ 3 months):
l cQFR – AUC 0.73 (95% CI 0.65 to 0.79)l DS – AUC 0.66 (95% CI 0.56 to 0.74; p = 0.043)
Kanno et al. (2019),30
conference abstractl Intermediate stenosis, de novo,
deferred revascularisation(FFR > 0.8) (n = 212)
l Median FFR and cQFR: 0.87l cQFR: 22.2%
MACE (4 years):
l 5.7% overalll baseline cQFR in MACE – mean or mediana 0.80l baseline cQFR in non-MACE – 0.87l odds of MACE in cQFR ≤ 0.8 – OR 5.60 (95% CI
1.69 to 18.6; p = 0.005)
hs-cTnI, high-sensitivity cardiac troponin I.a Not reported.
APPENDIX 5
NIHR Journals Library www.journalslibrary.nihr.ac.uk
178
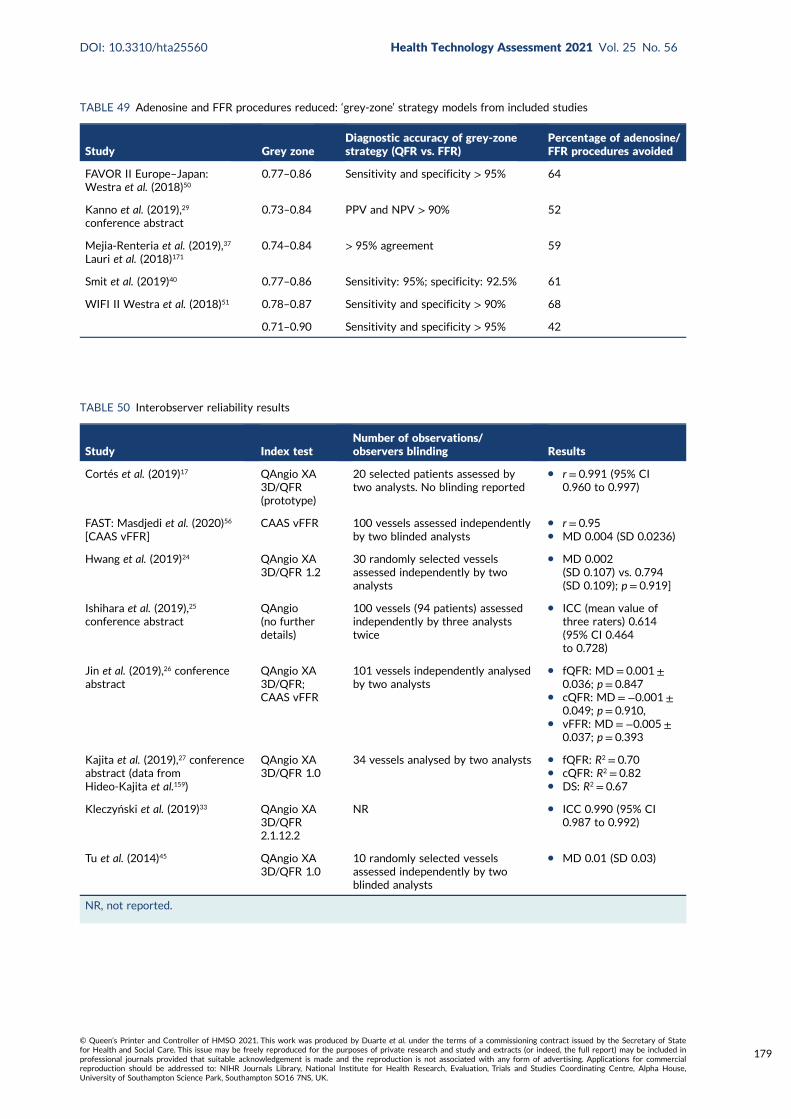
TABLE 49 Adenosine and FFR procedures reduced: ‘grey-zone’ strategy models from included studies
Study Grey zoneDiagnostic accuracy of grey-zonestrategy (QFR vs. FFR)
Percentage of adenosine/FFR procedures avoided
FAVOR II Europe–Japan:Westra et al. (2018)50
0.77–0.86 Sensitivity and specificity > 95% 64
Kanno et al. (2019),29
conference abstract0.73–0.84 PPV and NPV > 90% 52
Mejia-Renteria et al. (2019),37
Lauri et al. (2018)1710.74–0.84 > 95% agreement 59
Smit et al. (2019)40 0.77–0.86 Sensitivity: 95%; specificity: 92.5% 61
WIFI II Westra et al. (2018)51 0.78–0.87 Sensitivity and specificity > 90% 68
0.71–0.90 Sensitivity and specificity > 95% 42
TABLE 50 Interobserver reliability results
Study Index testNumber of observations/observers blinding Results
Cortés et al. (2019)17 QAngio XA3D/QFR(prototype)
20 selected patients assessed bytwo analysts. No blinding reported
l r = 0.991 (95% CI0.960 to 0.997)
FAST: Masdjedi et al. (2020)56
[CAAS vFFR]CAAS vFFR 100 vessels assessed independently
by two blinded analystsl r = 0.95l MD 0.004 (SD 0.0236)
Hwang et al. (2019)24 QAngio XA3D/QFR 1.2
30 randomly selected vesselsassessed independently by twoanalysts
l MD 0.002(SD 0.107) vs. 0.794(SD 0.109); p = 0.919]
Ishihara et al. (2019),25
conference abstractQAngio(no furtherdetails)
100 vessels (94 patients) assessedindependently by three analyststwice
l ICC (mean value ofthree raters) 0.614(95% CI 0.464to 0.728)
Jin et al. (2019),26 conferenceabstract
QAngio XA3D/QFR;CAAS vFFR
101 vessels independently analysedby two analysts
l fQFR: MD= 0.001 ±0.036; p = 0.847
l cQFR: MD =−0.001 ±0.049; p = 0.910,
l vFFR: MD=−0.005 ±0.037; p = 0.393
Kajita et al. (2019),27 conferenceabstract (data fromHideo-Kajita et al.159)
QAngio XA3D/QFR 1.0
34 vessels analysed by two analysts l fQFR: R2 = 0.70l cQFR: R2 = 0.82l DS: R2 = 0.67
Kleczyński et al. (2019)33 QAngio XA3D/QFR2.1.12.2
NR l ICC 0.990 (95% CI0.987 to 0.992)
Tu et al. (2014)45 QAngio XA3D/QFR 1.0
10 randomly selected vesselsassessed independently by twoblinded analysts
l MD 0.01 (SD 0.03)
NR, not reported.
DOI: 10.3310/hta25560 Health Technology Assessment 2021 Vol. 25 No. 56
© Queen’s Printer and Controller of HMSO 2021. This work was produced by Duarte et al. under the terms of a commissioning contract issued by the Secretary of Statefor Health and Social Care. This issue may be freely reproduced for the purposes of private research and study and extracts (or indeed, the full report) may be included inprofessional journals provided that suitable acknowledgement is made and the reproduction is not associated with any form of advertising. Applications for commercialreproduction should be addressed to: NIHR Journals Library, National Institute for Health Research, Evaluation, Trials and Studies Coordinating Centre, Alpha House,University of Southampton Science Park, Southampton SO16 7NS, UK.
179
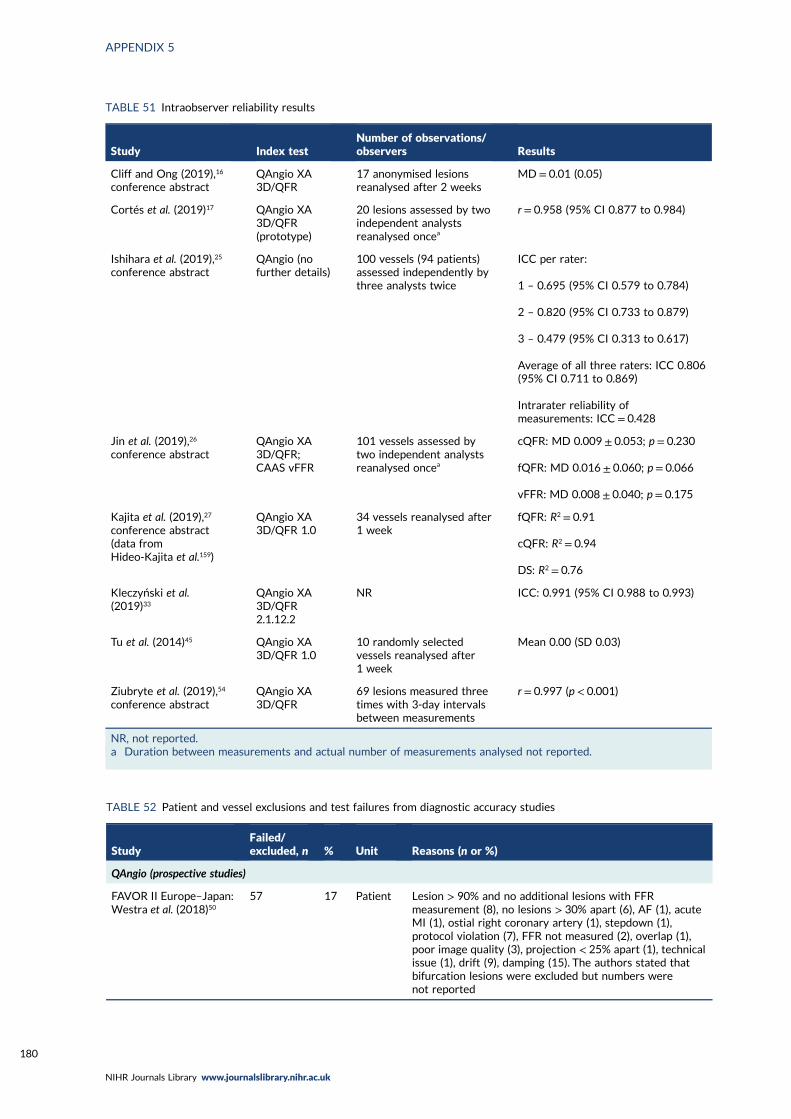
TABLE 51 Intraobserver reliability results
Study Index testNumber of observations/observers Results
Cliff and Ong (2019),16
conference abstractQAngio XA3D/QFR
17 anonymised lesionsreanalysed after 2 weeks
MD = 0.01 (0.05)
Cortés et al. (2019)17 QAngio XA3D/QFR(prototype)
20 lesions assessed by twoindependent analystsreanalysed oncea
r = 0.958 (95% CI 0.877 to 0.984)
Ishihara et al. (2019),25
conference abstractQAngio (nofurther details)
100 vessels (94 patients)assessed independently bythree analysts twice
ICC per rater:
1 – 0.695 (95% CI 0.579 to 0.784)
2 – 0.820 (95% CI 0.733 to 0.879)
3 – 0.479 (95% CI 0.313 to 0.617)
Average of all three raters: ICC 0.806(95% CI 0.711 to 0.869)
Intrarater reliability ofmeasurements: ICC = 0.428
Jin et al. (2019),26
conference abstractQAngio XA3D/QFR;CAAS vFFR
101 vessels assessed bytwo independent analystsreanalysed oncea
cQFR: MD 0.009 ± 0.053; p = 0.230
fQFR: MD 0.016 ± 0.060; p = 0.066
vFFR: MD 0.008 ± 0.040; p = 0.175
Kajita et al. (2019),27
conference abstract(data fromHideo-Kajita et al.159)
QAngio XA3D/QFR 1.0
34 vessels reanalysed after1 week
fQFR: R2 = 0.91
cQFR: R2 = 0.94
DS: R2 = 0.76
Kleczyński et al.(2019)33
QAngio XA3D/QFR2.1.12.2
NR ICC: 0.991 (95% CI 0.988 to 0.993)
Tu et al. (2014)45 QAngio XA3D/QFR 1.0
10 randomly selectedvessels reanalysed after1 week
Mean 0.00 (SD 0.03)
Ziubryte et al. (2019),54
conference abstractQAngio XA3D/QFR
69 lesions measured threetimes with 3-day intervalsbetween measurements
r = 0.997 (p < 0.001)
NR, not reported.a Duration between measurements and actual number of measurements analysed not reported.
TABLE 52 Patient and vessel exclusions and test failures from diagnostic accuracy studies
StudyFailed/excluded, n % Unit Reasons (n or %)
QAngio (prospective studies)
FAVOR II Europe–Japan:Westra et al. (2018)50
57 17 Patient Lesion > 90% and no additional lesions with FFRmeasurement (8), no lesions > 30% apart (6), AF (1), acuteMI (1), ostial right coronary artery (1), stepdown (1),protocol violation (7), FFR not measured (2), overlap (1),poor image quality (3), projection < 25% apart (1), technicalissue (1), drift (9), damping (15). The authors stated thatbifurcation lesions were excluded but numbers werenot reported
APPENDIX 5
NIHR Journals Library www.journalslibrary.nihr.ac.uk
180
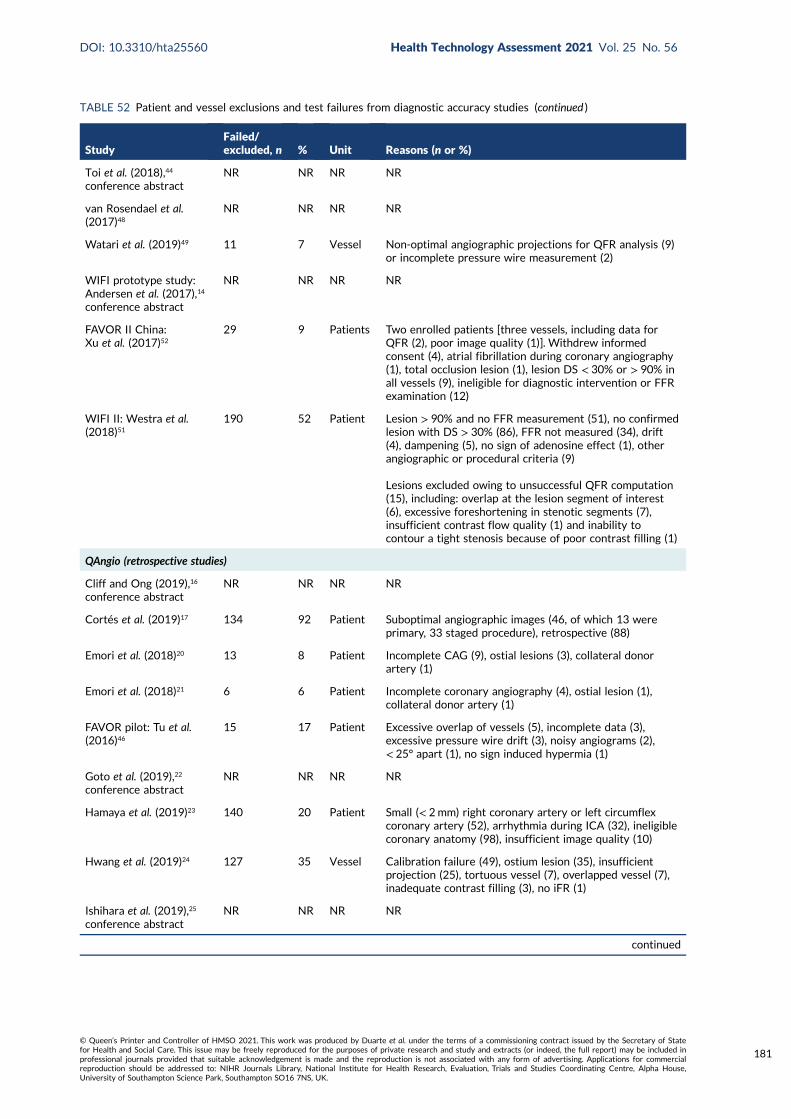
TABLE 52 Patient and vessel exclusions and test failures from diagnostic accuracy studies (continued )
StudyFailed/excluded, n % Unit Reasons (n or %)
Toi et al. (2018),44
conference abstractNR NR NR NR
van Rosendael et al.(2017)48
NR NR NR NR
Watari et al. (2019)49 11 7 Vessel Non-optimal angiographic projections for QFR analysis (9)or incomplete pressure wire measurement (2)
WIFI prototype study:Andersen et al. (2017),14
conference abstract
NR NR NR NR
FAVOR II China:Xu et al. (2017)52
29 9 Patients Two enrolled patients [three vessels, including data forQFR (2), poor image quality (1)]. Withdrew informedconsent (4), atrial fibrillation during coronary angiography(1), total occlusion lesion (1), lesion DS < 30% or > 90% inall vessels (9), ineligible for diagnostic intervention or FFRexamination (12)
WIFI II: Westra et al.(2018)51
190 52 Patient Lesion > 90% and no FFR measurement (51), no confirmedlesion with DS > 30% (86), FFR not measured (34), drift(4), dampening (5), no sign of adenosine effect (1), otherangiographic or procedural criteria (9)
Lesions excluded owing to unsuccessful QFR computation(15), including: overlap at the lesion segment of interest(6), excessive foreshortening in stenotic segments (7),insufficient contrast flow quality (1) and inability tocontour a tight stenosis because of poor contrast filling (1)
QAngio (retrospective studies)
Cliff and Ong (2019),16
conference abstractNR NR NR NR
Cortés et al. (2019)17 134 92 Patient Suboptimal angiographic images (46, of which 13 wereprimary, 33 staged procedure), retrospective (88)
Emori et al. (2018)20 13 8 Patient Incomplete CAG (9), ostial lesions (3), collateral donorartery (1)
Emori et al. (2018)21 6 6 Patient Incomplete coronary angiography (4), ostial lesion (1),collateral donor artery (1)
FAVOR pilot: Tu et al.(2016)46
15 17 Patient Excessive overlap of vessels (5), incomplete data (3),excessive pressure wire drift (3), noisy angiograms (2),< 25° apart (1), no sign induced hypermia (1)
Goto et al. (2019),22
conference abstractNR NR NR NR
Hamaya et al. (2019)23 140 20 Patient Small (< 2mm) right coronary artery or left circumflexcoronary artery (52), arrhythmia during ICA (32), ineligiblecoronary anatomy (98), insufficient image quality (10)
Hwang et al. (2019)24 127 35 Vessel Calibration failure (49), ostium lesion (35), insufficientprojection (25), tortuous vessel (7), overlapped vessel (7),inadequate contrast filling (3), no iFR (1)
Ishihara et al. (2019),25
conference abstractNR NR NR NR
continued
DOI: 10.3310/hta25560 Health Technology Assessment 2021 Vol. 25 No. 56
© Queen’s Printer and Controller of HMSO 2021. This work was produced by Duarte et al. under the terms of a commissioning contract issued by the Secretary of Statefor Health and Social Care. This issue may be freely reproduced for the purposes of private research and study and extracts (or indeed, the full report) may be included inprofessional journals provided that suitable acknowledgement is made and the reproduction is not associated with any form of advertising. Applications for commercialreproduction should be addressed to: NIHR Journals Library, National Institute for Health Research, Evaluation, Trials and Studies Coordinating Centre, Alpha House,University of Southampton Science Park, Southampton SO16 7NS, UK.
181
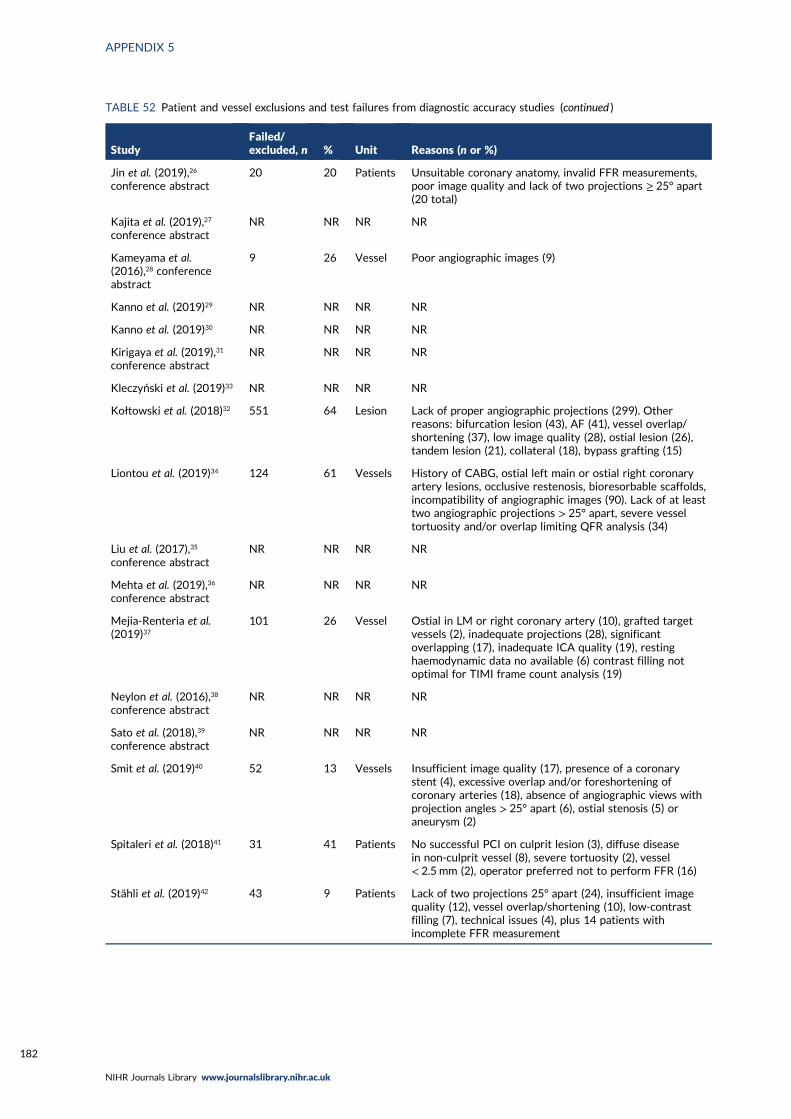
TABLE 52 Patient and vessel exclusions and test failures from diagnostic accuracy studies (continued )
StudyFailed/excluded, n % Unit Reasons (n or %)
Jin et al. (2019),26
conference abstract20 20 Patients Unsuitable coronary anatomy, invalid FFR measurements,
poor image quality and lack of two projections ≥ 25° apart(20 total)
Kajita et al. (2019),27
conference abstractNR NR NR NR
Kameyama et al.(2016),28 conferenceabstract
9 26 Vessel Poor angiographic images (9)
Kanno et al. (2019)29 NR NR NR NR
Kanno et al. (2019)30 NR NR NR NR
Kirigaya et al. (2019),31
conference abstractNR NR NR NR
Kleczyński et al. (2019)33 NR NR NR NR
Kołtowski et al. (2018)32 551 64 Lesion Lack of proper angiographic projections (299). Otherreasons: bifurcation lesion (43), AF (41), vessel overlap/shortening (37), low image quality (28), ostial lesion (26),tandem lesion (21), collateral (18), bypass grafting (15)
Liontou et al. (2019)34 124 61 Vessels History of CABG, ostial left main or ostial right coronaryartery lesions, occlusive restenosis, bioresorbable scaffolds,incompatibility of angiographic images (90). Lack of at leasttwo angiographic projections > 25° apart, severe vesseltortuosity and/or overlap limiting QFR analysis (34)
Liu et al. (2017),35
conference abstractNR NR NR NR
Mehta et al. (2019),36
conference abstractNR NR NR NR
Mejia-Renteria et al.(2019)37
101 26 Vessel Ostial in LM or right coronary artery (10), grafted targetvessels (2), inadequate projections (28), significantoverlapping (17), inadequate ICA quality (19), restinghaemodynamic data no available (6) contrast filling notoptimal for TIMI frame count analysis (19)
Neylon et al. (2016),38
conference abstractNR NR NR NR
Sato et al. (2018),39
conference abstractNR NR NR NR
Smit et al. (2019)40 52 13 Vessels Insufficient image quality (17), presence of a coronarystent (4), excessive overlap and/or foreshortening ofcoronary arteries (18), absence of angiographic views withprojection angles > 25° apart (6), ostial stenosis (5) oraneurysm (2)
Spitaleri et al. (2018)41 31 41 Patients No successful PCI on culprit lesion (3), diffuse diseasein non-culprit vessel (8), severe tortuosity (2), vessel< 2.5 mm (2), operator preferred not to perform FFR (16)
Stähli et al. (2019)42 43 9 Patients Lack of two projections 25° apart (24), insufficient imagequality (12), vessel overlap/shortening (10), low-contrastfilling (7), technical issues (4), plus 14 patients withincomplete FFR measurement
APPENDIX 5
NIHR Journals Library www.journalslibrary.nihr.ac.uk
182
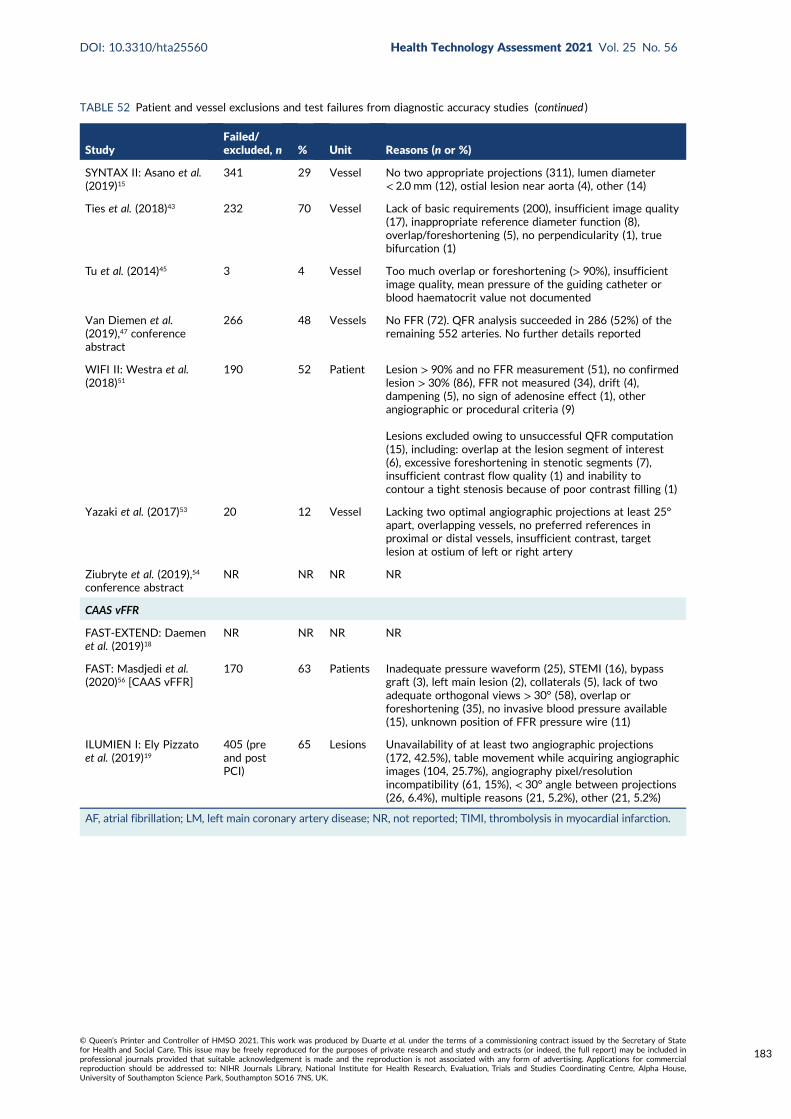
TABLE 52 Patient and vessel exclusions and test failures from diagnostic accuracy studies (continued )
StudyFailed/excluded, n % Unit Reasons (n or %)
SYNTAX II: Asano et al.(2019)15
341 29 Vessel No two appropriate projections (311), lumen diameter< 2.0 mm (12), ostial lesion near aorta (4), other (14)
Ties et al. (2018)43 232 70 Vessel Lack of basic requirements (200), insufficient image quality(17), inappropriate reference diameter function (8),overlap/foreshortening (5), no perpendicularity (1), truebifurcation (1)
Tu et al. (2014)45 3 4 Vessel Too much overlap or foreshortening (> 90%), insufficientimage quality, mean pressure of the guiding catheter orblood haematocrit value not documented
Van Diemen et al.(2019),47 conferenceabstract
266 48 Vessels No FFR (72). QFR analysis succeeded in 286 (52%) of theremaining 552 arteries. No further details reported
WIFI II: Westra et al.(2018)51
190 52 Patient Lesion > 90% and no FFR measurement (51), no confirmedlesion > 30% (86), FFR not measured (34), drift (4),dampening (5), no sign of adenosine effect (1), otherangiographic or procedural criteria (9)
Lesions excluded owing to unsuccessful QFR computation(15), including: overlap at the lesion segment of interest(6), excessive foreshortening in stenotic segments (7),insufficient contrast flow quality (1) and inability tocontour a tight stenosis because of poor contrast filling (1)
Yazaki et al. (2017)53 20 12 Vessel Lacking two optimal angiographic projections at least 25°apart, overlapping vessels, no preferred references inproximal or distal vessels, insufficient contrast, targetlesion at ostium of left or right artery
Ziubryte et al. (2019),54
conference abstractNR NR NR NR
CAAS vFFR
FAST-EXTEND: Daemenet al. (2019)18
NR NR NR NR
FAST: Masdjedi et al.(2020)56 [CAAS vFFR]
170 63 Patients Inadequate pressure waveform (25), STEMI (16), bypassgraft (3), left main lesion (2), collaterals (5), lack of twoadequate orthogonal views > 30° (58), overlap orforeshortening (35), no invasive blood pressure available(15), unknown position of FFR pressure wire (11)
ILUMIEN I: Ely Pizzatoet al. (2019)19
405 (preand postPCI)
65 Lesions Unavailability of at least two angiographic projections(172, 42.5%), table movement while acquiring angiographicimages (104, 25.7%), angiography pixel/resolutionincompatibility (61, 15%), < 30° angle between projections(26, 6.4%), multiple reasons (21, 5.2%), other (21, 5.2%)
AF, atrial fibrillation; LM, left main coronary artery disease; NR, not reported; TIMI, thrombolysis in myocardial infarction.
DOI: 10.3310/hta25560 Health Technology Assessment 2021 Vol. 25 No. 56
© Queen’s Printer and Controller of HMSO 2021. This work was produced by Duarte et al. under the terms of a commissioning contract issued by the Secretary of Statefor Health and Social Care. This issue may be freely reproduced for the purposes of private research and study and extracts (or indeed, the full report) may be included inprofessional journals provided that suitable acknowledgement is made and the reproduction is not associated with any form of advertising. Applications for commercialreproduction should be addressed to: NIHR Journals Library, National Institute for Health Research, Evaluation, Trials and Studies Coordinating Centre, Alpha House,University of Southampton Science Park, Southampton SO16 7NS, UK.
183
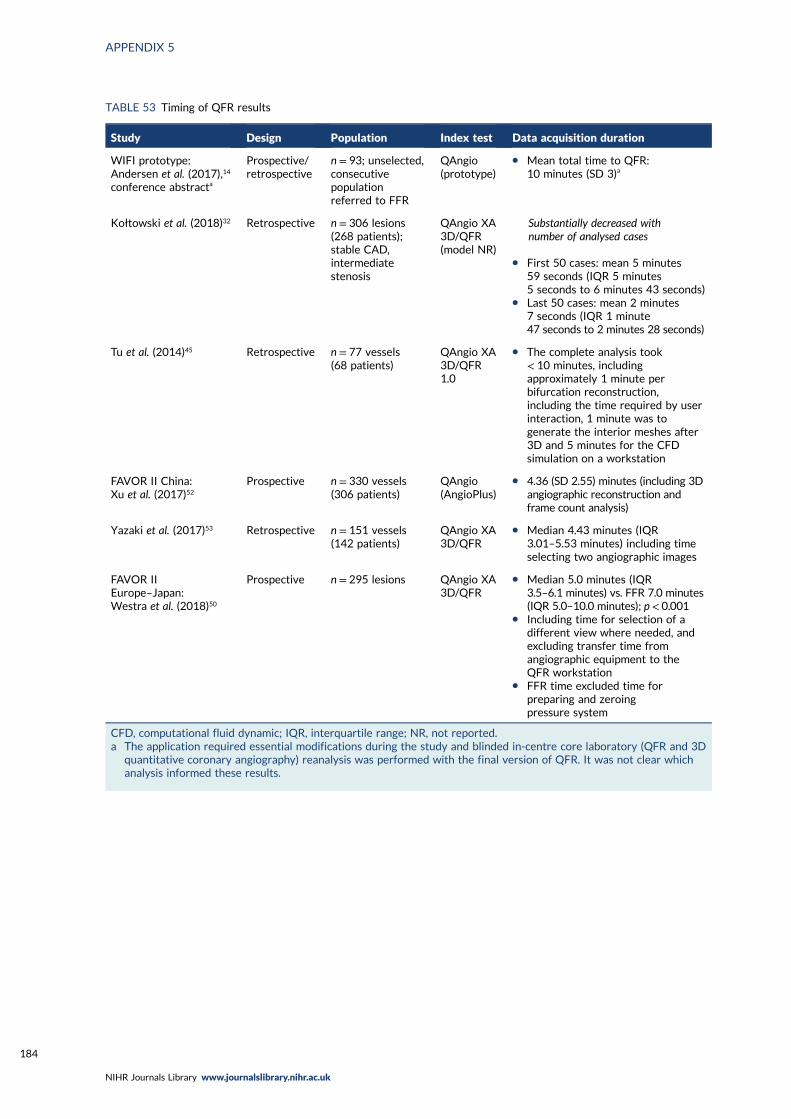
TABLE 53 Timing of QFR results
Study Design Population Index test Data acquisition duration
WIFI prototype:Andersen et al. (2017),14
conference abstracta
Prospective/retrospective
n = 93; unselected,consecutivepopulationreferred to FFR
QAngio(prototype)
l Mean total time to QFR:10 minutes (SD 3)a
Kołtowski et al. (2018)32 Retrospective n = 306 lesions(268 patients);stable CAD,intermediatestenosis
QAngio XA3D/QFR(model NR)
Substantially decreased withnumber of analysed cases
l First 50 cases: mean 5 minutes59 seconds (IQR 5 minutes5 seconds to 6 minutes 43 seconds)
l Last 50 cases: mean 2 minutes7 seconds (IQR 1 minute47 seconds to 2 minutes 28 seconds)
Tu et al. (2014)45 Retrospective n = 77 vessels(68 patients)
QAngio XA3D/QFR1.0
l The complete analysis took< 10 minutes, includingapproximately 1 minute perbifurcation reconstruction,including the time required by userinteraction, 1 minute was togenerate the interior meshes after3D and 5 minutes for the CFDsimulation on a workstation
FAVOR II China:Xu et al. (2017)52
Prospective n = 330 vessels(306 patients)
QAngio(AngioPlus)
l 4.36 (SD 2.55) minutes (including 3Dangiographic reconstruction andframe count analysis)
Yazaki et al. (2017)53 Retrospective n = 151 vessels(142 patients)
QAngio XA3D/QFR
l Median 4.43 minutes (IQR3.01–5.53 minutes) including timeselecting two angiographic images
FAVOR IIEurope–Japan:Westra et al. (2018)50
Prospective n = 295 lesions QAngio XA3D/QFR
l Median 5.0 minutes (IQR3.5–6.1 minutes) vs. FFR 7.0 minutes(IQR 5.0–10.0 minutes); p< 0.001
l Including time for selection of adifferent view where needed, andexcluding transfer time fromangiographic equipment to theQFR workstation
l FFR time excluded time forpreparing and zeroingpressure system
CFD, computational fluid dynamic; IQR, interquartile range; NR, not reported.a The application required essential modifications during the study and blinded in-centre core laboratory (QFR and 3D
quantitative coronary angiography) reanalysis was performed with the final version of QFR. It was not clear whichanalysis informed these results.
APPENDIX 5
NIHR Journals Library www.journalslibrary.nihr.ac.uk
184
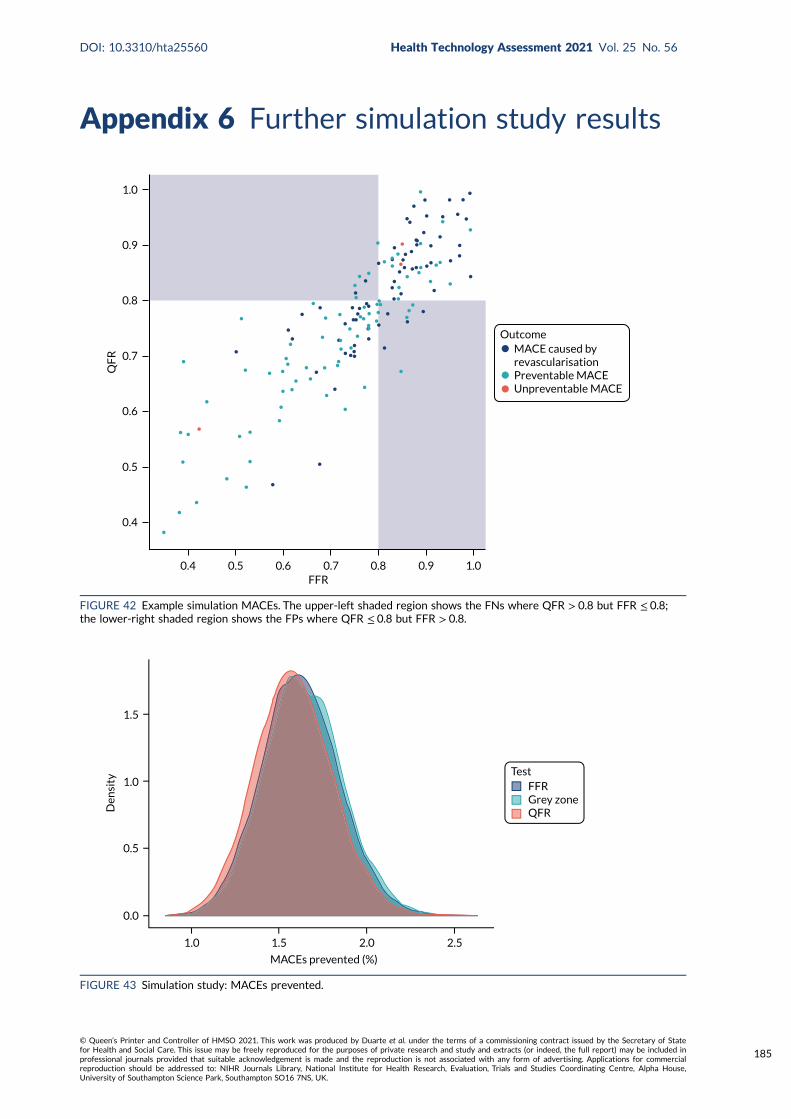
Appendix 6 Further simulation study results
1.5
1.0
0.5
0.0
Den
sity
1.0 1.5 2.0 2.5
MACEs prevented (%)
TestFFRGrey zoneQFR
FIGURE 43 Simulation study: MACEs prevented.
OutcomeMACE caused byrevascularisationPreventable MACEUnpreventable MACE
QF
R
FFR1.00.90.80.70.60.50.4
0.4
0.5
0.6
0.7
0.8
0.9
1.0
FIGURE 42 Example simulation MACEs. The upper-left shaded region shows the FNs where QFR > 0.8 but FFR ≤ 0.8;the lower-right shaded region shows the FPs where QFR ≤ 0.8 but FFR > 0.8.
DOI: 10.3310/hta25560 Health Technology Assessment 2021 Vol. 25 No. 56
© Queen’s Printer and Controller of HMSO 2021. This work was produced by Duarte et al. under the terms of a commissioning contract issued by the Secretary of Statefor Health and Social Care. This issue may be freely reproduced for the purposes of private research and study and extracts (or indeed, the full report) may be included inprofessional journals provided that suitable acknowledgement is made and the reproduction is not associated with any form of advertising. Applications for commercialreproduction should be addressed to: NIHR Journals Library, National Institute for Health Research, Evaluation, Trials and Studies Coordinating Centre, Alpha House,University of Southampton Science Park, Southampton SO16 7NS, UK.
185
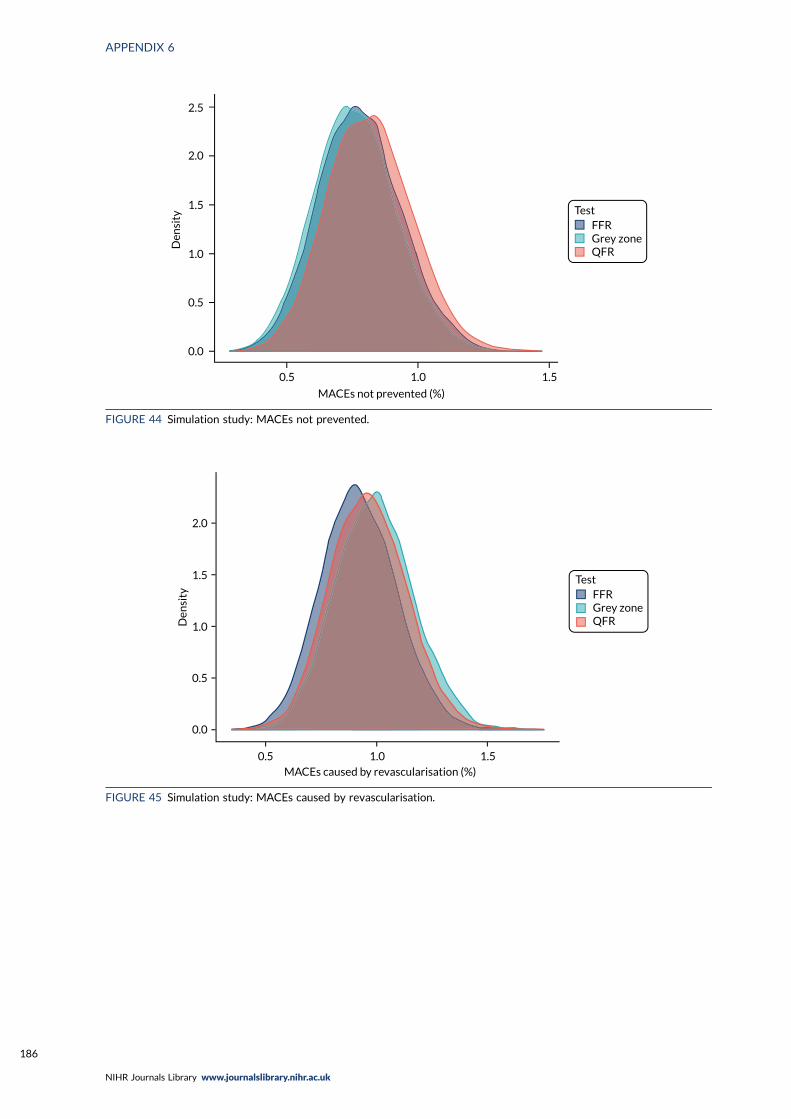
TestFFRGrey zoneQFR
Den
sity
2.5
2.0
1.5
1.0
0.5
0.0
0.5 1.0 1.5
MACEs not prevented (%)
FIGURE 44 Simulation study: MACEs not prevented.
TestFFRGrey zoneQFR
MACEs caused by revascularisation (%)
Den
sity
0.5 1.0 1.5
2.0
1.5
1.0
0.5
0.0
FIGURE 45 Simulation study: MACEs caused by revascularisation.
APPENDIX 6
NIHR Journals Library www.journalslibrary.nihr.ac.uk
186
Appendix 7 Review of decision modelsevaluating invasive coronary angiography
Search strategies
QAngio literature: cost-effectiveness 18 October 2019
Database search strategiesDatabase searches were carried out to identify cost-effectiveness studies in which ICA (alone and/orwith FFR) was one of the interventions under comparison.
Databases searched: EconLit (via Ovid), EMBASE (via Ovid), HTA database (via CRD), MEDLINE, NHSEED (via CRD).
Total number of records identified: 1740.
Total number of records identified after deduplication in EndNote X.9.2 (Clarivate Analytics)bibliographic software: 1264.
EconLit (via Ovid)Search date: 18 October 2019.
Date range searched: 1886 to 3 October 2019.
Records retrieved: 2.
Search strategy1 coronary angiograph$.mp. (2).
EMBASE (via Ovid)Search date: 18 October 2019.
Date range searched: 1974 to 17 October 2019.
Records retrieved: 858.
Search strategy
1. *Coronary Angiography/ (3060)2. coronary angiography.ti,ab. (50,830)3. 1 or 2 (51,869)4. Economics/ (234,606)5. Cost/ (57,396)6. exp Health Economics/ (818,928)7. Budget/ (27,893)8. budget*.ti,ab,kw. (37,185)9. (economic* or cost or costs or costly or costing or price or prices or pricing or pharmacoeconomic*
or pharmaco-economic* or expenditure or expenditures or expense or expenses or financial orfinance or finances or financed).ti,kw. (268,523)
DOI: 10.3310/hta25560 Health Technology Assessment 2021 Vol. 25 No. 56
© Queen’s Printer and Controller of HMSO 2021. This work was produced by Duarte et al. under the terms of a commissioning contract issued by the Secretary of Statefor Health and Social Care. This issue may be freely reproduced for the purposes of private research and study and extracts (or indeed, the full report) may be included inprofessional journals provided that suitable acknowledgement is made and the reproduction is not associated with any form of advertising. Applications for commercialreproduction should be addressed to: NIHR Journals Library, National Institute for Health Research, Evaluation, Trials and Studies Coordinating Centre, Alpha House,University of Southampton Science Park, Southampton SO16 7NS, UK.
187
10. (economic* or cost or costs or costly or costing or price or prices or pricing or pharmacoeconomic*or pharmaco-economic* or expenditure or expenditures or expense or expenses or financial orfinance or finances or financed).ab./freq = 2 (382,513)
11. (cost* adj2 (effective* or utilit* or benefit* or minimi* or analy* or outcome or outcomes)).ab,kw.(216,418)
12. (value adj2 (money or monetary)).ti,ab,kw. (3124)13. Statistical Model/ (157,315)14. economic model*.ab,kw. (4585)15. Probability/ (97,263)16. markov.ti,ab,kw. (27,735)17. monte carlo method/ (37,601)18. monte carlo.ti,ab,kw. (46,807)19. Decision Theory/ (1711)20. Decision Tree/ (11,762)21. (decision* adj2 (tree* or analy* or model*)).ti,ab,kw. (31,964)22. or/4-21 (1,560,379)23. 3 and 22 (1858)24. limit 23 to yr = “2000 -Current” (1596)25. limit 24 to embase (858).
Health Technology Assessment databaseSearched via the CRD’s website (URL: www.crd.york.ac.uk/CRDWeb).
Search date: 18 October 2019.
Date range searched: inception to 1 October 2019.
Records identified: 62.
Search strategy
MEDLINE (via Ovid)Search date: 18 October 2019.
Records identified: 665.
Date range searched: 1946 to 17 October 2019.
Search strategy
1. *Coronary Angiography/ (18,583)2. coronary angiography.ti,ab. (30,052)3. 1 or 2 (41,395)4. Economics/ (27,093)5. exp “Costs and Cost Analysis”/ (229,217)6. Economics, Nursing/ (3994)7. Economics, Medical/ (9035)8. Economics, Pharmaceutical/ (2894)9. exp Economics, Hospital/ (23,942)
10. Economics, Dental/ (1908)11. exp “Fees and Charges”/ (29,932)12. exp Budgets/ (13,585)13. budget*.ti,ab,kf. (28,234)
APPENDIX 7
NIHR Journals Library www.journalslibrary.nihr.ac.uk
188
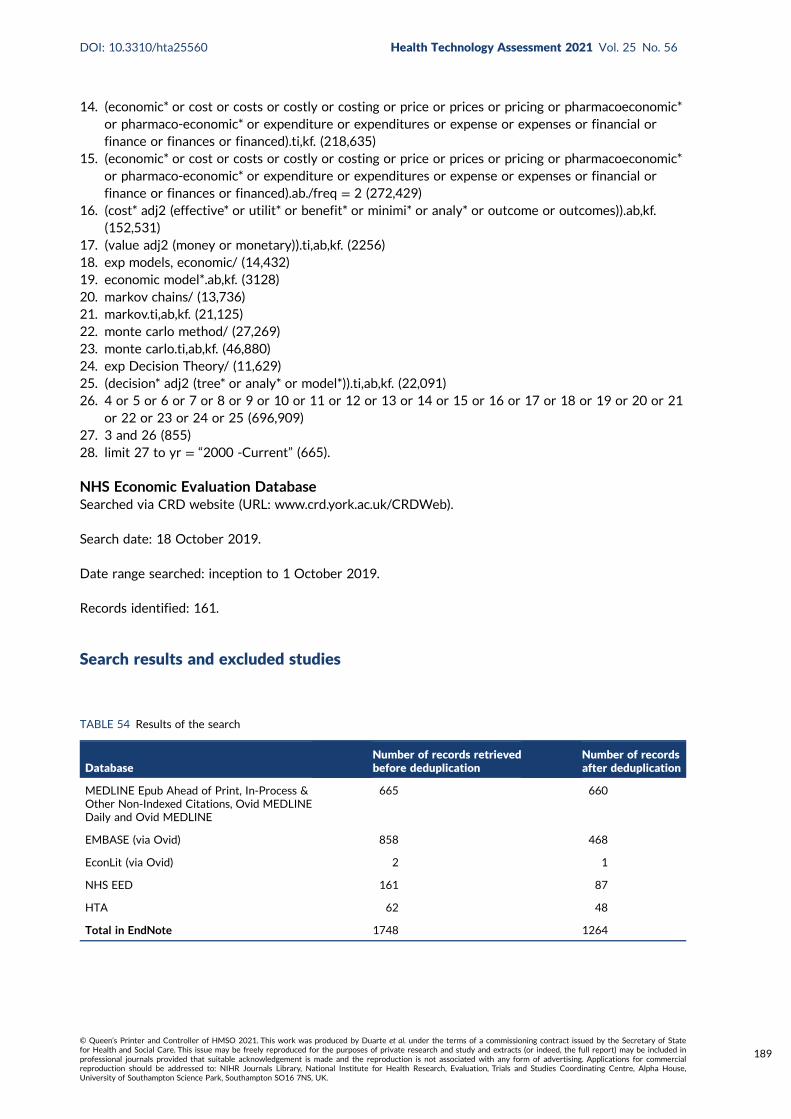
14. (economic* or cost or costs or costly or costing or price or prices or pricing or pharmacoeconomic*or pharmaco-economic* or expenditure or expenditures or expense or expenses or financial orfinance or finances or financed).ti,kf. (218,635)
15. (economic* or cost or costs or costly or costing or price or prices or pricing or pharmacoeconomic*or pharmaco-economic* or expenditure or expenditures or expense or expenses or financial orfinance or finances or financed).ab./freq = 2 (272,429)
16. (cost* adj2 (effective* or utilit* or benefit* or minimi* or analy* or outcome or outcomes)).ab,kf.(152,531)
17. (value adj2 (money or monetary)).ti,ab,kf. (2256)18. exp models, economic/ (14,432)19. economic model*.ab,kf. (3128)20. markov chains/ (13,736)21. markov.ti,ab,kf. (21,125)22. monte carlo method/ (27,269)23. monte carlo.ti,ab,kf. (46,880)24. exp Decision Theory/ (11,629)25. (decision* adj2 (tree* or analy* or model*)).ti,ab,kf. (22,091)26. 4 or 5 or 6 or 7 or 8 or 9 or 10 or 11 or 12 or 13 or 14 or 15 or 16 or 17 or 18 or 19 or 20 or 21
or 22 or 23 or 24 or 25 (696,909)27. 3 and 26 (855)28. limit 27 to yr = “2000 -Current” (665).
NHS Economic Evaluation DatabaseSearched via CRD website (URL: www.crd.york.ac.uk/CRDWeb).
Search date: 18 October 2019.
Date range searched: inception to 1 October 2019.
Records identified: 161.
Search results and excluded studies
TABLE 54 Results of the search
DatabaseNumber of records retrievedbefore deduplication
Number of recordsafter deduplication
MEDLINE Epub Ahead of Print, In-Process &Other Non-Indexed Citations, Ovid MEDLINEDaily and Ovid MEDLINE
665 660
EMBASE (via Ovid) 858 468
EconLit (via Ovid) 2 1
NHS EED 161 87
HTA 62 48
Total in EndNote 1748 1264
DOI: 10.3310/hta25560 Health Technology Assessment 2021 Vol. 25 No. 56
© Queen’s Printer and Controller of HMSO 2021. This work was produced by Duarte et al. under the terms of a commissioning contract issued by the Secretary of Statefor Health and Social Care. This issue may be freely reproduced for the purposes of private research and study and extracts (or indeed, the full report) may be included inprofessional journals provided that suitable acknowledgement is made and the reproduction is not associated with any form of advertising. Applications for commercialreproduction should be addressed to: NIHR Journals Library, National Institute for Health Research, Evaluation, Trials and Studies Coordinating Centre, Alpha House,University of Southampton Science Park, Southampton SO16 7NS, UK.
189

TABLE 55 Summary of excluded studies
Study Reason for rejection
Bosch et al. (2005) Different patient population (acute coronary syndrome)
Goehler et al. (2011) Different patient population (acute chest pain) and does not include long-term outcomes
Kent et al. (2013) Different patient population (NSTEMI)
Nam et al. (2015) Different patient population (NSTEMI)
Full references of the excluded studies are available on request.
APPENDIX 7
NIHR Journals Library www.journalslibrary.nihr.ac.uk
190
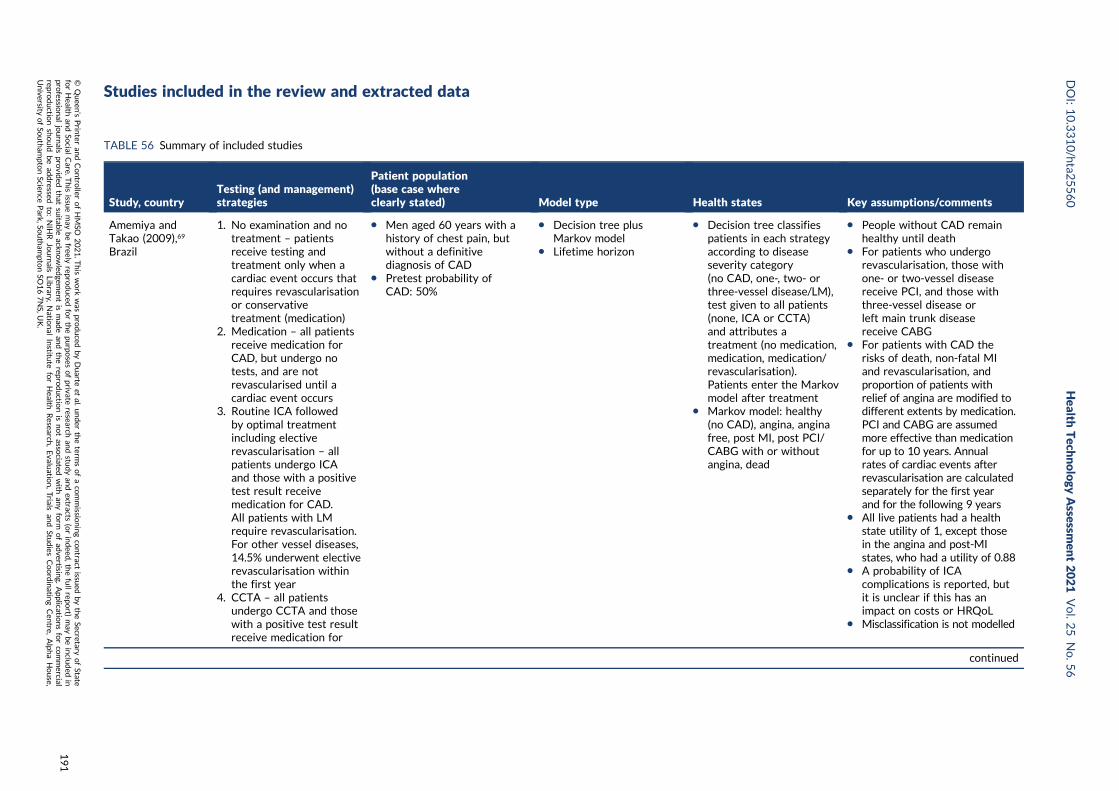
Studies included in the review and extracted data
TABLE 56 Summary of included studies
Study, countryTesting (and management)strategies
Patient population(base case whereclearly stated) Model type Health states Key assumptions/comments
Amemiya andTakao (2009),69
Brazil
1. No examination and notreatment – patientsreceive testing andtreatment only when acardiac event occurs thatrequires revascularisationor conservativetreatment (medication)
2. Medication – all patientsreceive medication forCAD, but undergo notests, and are notrevascularised until acardiac event occurs
3. Routine ICA followedby optimal treatmentincluding electiverevascularisation – allpatients undergo ICAand those with a positivetest result receivemedication for CAD.All patients with LMrequire revascularisation.For other vessel diseases,14.5% underwent electiverevascularisation withinthe first year
4. CCTA – all patientsundergo CCTA and thosewith a positive test resultreceive medication for
l Men aged 60 years with ahistory of chest pain, butwithout a definitivediagnosis of CAD
l Pretest probability ofCAD: 50%
l Decision tree plusMarkov model
l Lifetime horizon
l Decision tree classifiespatients in each strategyaccording to diseaseseverity category(no CAD, one-, two- orthree-vessel disease/LM),test given to all patients(none, ICA or CCTA)and attributes atreatment (no medication,medication, medication/revascularisation).Patients enter the Markovmodel after treatment
l Markov model: healthy(no CAD), angina, anginafree, post MI, post PCI/CABG with or withoutangina, dead
l People without CAD remainhealthy until death
l For patients who undergorevascularisation, those withone- or two-vessel diseasereceive PCI, and those withthree-vessel disease orleft main trunk diseasereceive CABG
l For patients with CAD therisks of death, non-fatal MIand revascularisation, andproportion of patients withrelief of angina are modified todifferent extents by medication.PCI and CABG are assumedmore effective than medicationfor up to 10 years. Annualrates of cardiac events afterrevascularisation are calculatedseparately for the first yearand for the following 9 years
l All live patients had a healthstate utility of 1, except thosein the angina and post-MIstates, who had a utility of 0.88
l A probability of ICAcomplications is reported, butit is unclear if this has animpact on costs or HRQoL
l Misclassification is not modelled
continued
DOI:10.3310/hta2
5560
Health
Tech
nology
Assessm
ent2021
Vol.2
5No.5
6
©Queen
’sPrin
teran
dContro
llerofHMSO
2021.T
his
work
was
produced
byDuarte
etal.
under
theterm
sofaco
mmissio
ningco
ntract
issued
bytheSecretary
ofState
forHealth
andSo
cialCare.T
his
issuemay
befreely
reproduced
forthepu
rposes
ofprivate
researchan
dstu
dyan
dextracts
(orindeed
,thefullrepo
rt)may
beinclu
ded
inpro
fessional
journals
provid
edthat
suitab
leackn
owled
gemen
tis
mad
ean
dtherepro
ductio
nis
notasso
ciatedwith
anyform
ofad
vertising.
Applicatio
nsforco
mmercial
reproductio
nshould
bead
dressed
to:NIH
RJournals
Library,
Natio
nal
Institu
teforHealth
Research
,Evalu
ation,Trials
and
Studies
Coordinatin
gCen
tre,Alph
aHouse,
University
ofSo
utham
ptonScien
cePark,So
utham
ptonSO
167NS,U
K.
191
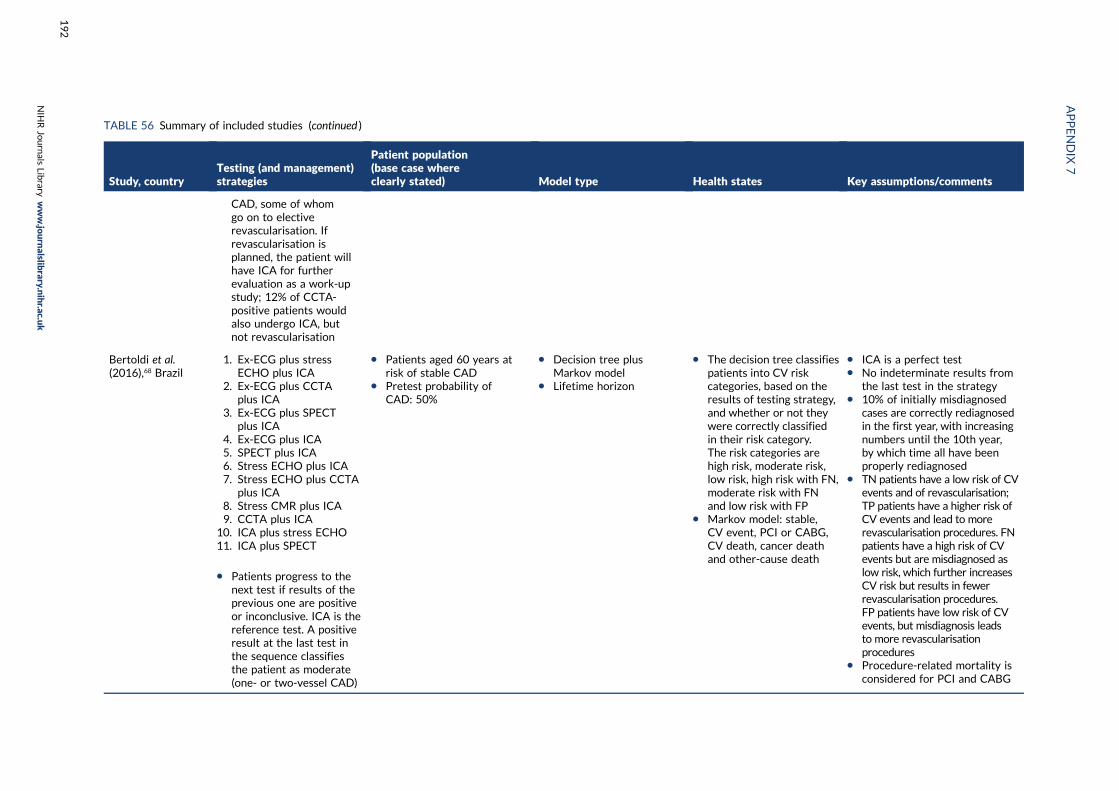
TABLE 56 Summary of included studies (continued )
Study, countryTesting (and management)strategies
Patient population(base case whereclearly stated) Model type Health states Key assumptions/comments
CAD, some of whomgo on to electiverevascularisation. Ifrevascularisation isplanned, the patient willhave ICA for furtherevaluation as a work-upstudy; 12% of CCTA-positive patients wouldalso undergo ICA, butnot revascularisation
Bertoldi et al.(2016),68 Brazil
1. Ex-ECG plus stressECHO plus ICA
2. Ex-ECG plus CCTAplus ICA
3. Ex-ECG plus SPECTplus ICA
4. Ex-ECG plus ICA5. SPECT plus ICA6. Stress ECHO plus ICA7. Stress ECHO plus CCTA
plus ICA8. Stress CMR plus ICA9. CCTA plus ICA
10. ICA plus stress ECHO11. ICA plus SPECT
l Patients progress to thenext test if results of theprevious one are positiveor inconclusive. ICA is thereference test. A positiveresult at the last test inthe sequence classifiesthe patient as moderate(one- or two-vessel CAD)
l Patients aged 60 years atrisk of stable CAD
l Pretest probability ofCAD: 50%
l Decision tree plusMarkov model
l Lifetime horizon
l The decision tree classifiespatients into CV riskcategories, based on theresults of testing strategy,and whether or not theywere correctly classifiedin their risk category.The risk categories arehigh risk, moderate risk,low risk, high risk with FN,moderate risk with FNand low risk with FP
l Markov model: stable,CV event, PCI or CABG,CV death, cancer deathand other-cause death
l ICA is a perfect testl No indeterminate results from
the last test in the strategyl 10% of initially misdiagnosed
cases are correctly rediagnosedin the first year, with increasingnumbers until the 10th year,by which time all have beenproperly rediagnosed
l TN patients have a low risk of CVevents and of revascularisation;TP patients have a higher risk ofCV events and lead to morerevascularisation procedures. FNpatients have a high risk of CVevents but are misdiagnosed aslow risk, which further increasesCV risk but results in fewerrevascularisation procedures.FP patients have low risk of CVevents, but misdiagnosis leadsto more revascularisationprocedures
l Procedure-related mortality isconsidered for PCI and CABG
APPENDIX
7
NIH
RJournals
Library
www.jo
urnalslib
rary.nihr.ac.u
k
192
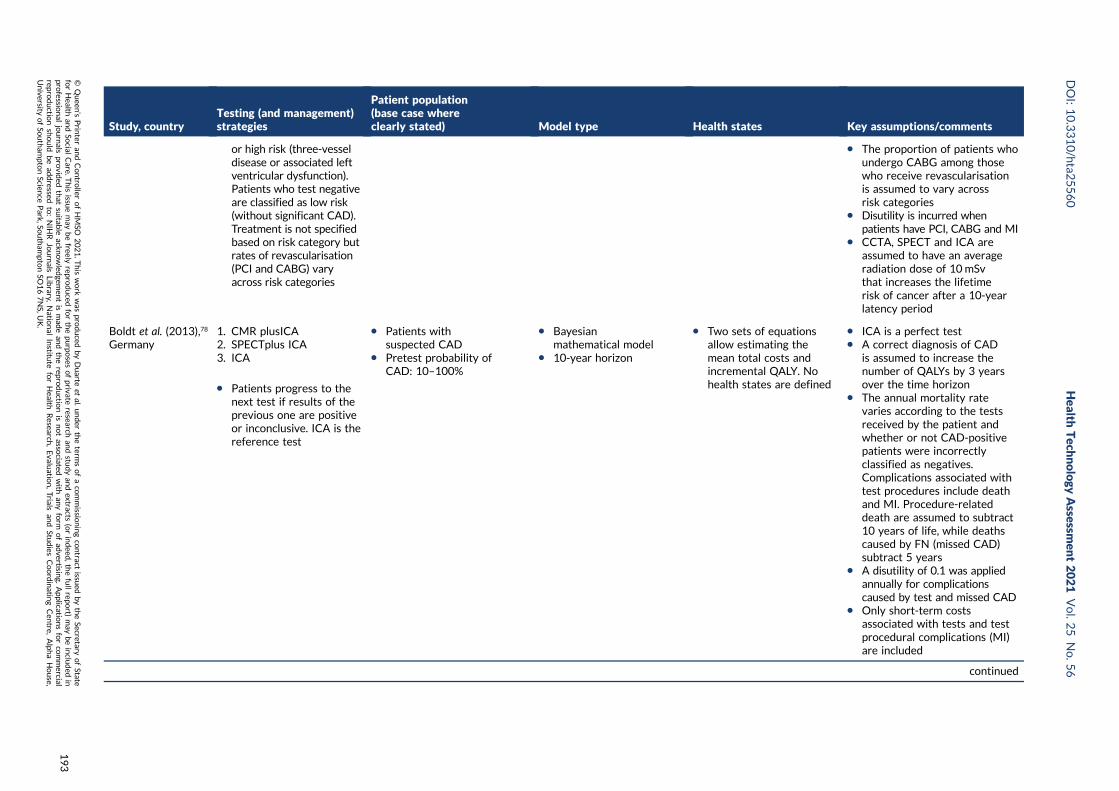
Study, countryTesting (and management)strategies
Patient population(base case whereclearly stated) Model type Health states Key assumptions/comments
or high risk (three-vesseldisease or associated leftventricular dysfunction).Patients who test negativeare classified as low risk(without significant CAD).Treatment is not specifiedbased on risk category butrates of revascularisation(PCI and CABG) varyacross risk categories
l The proportion of patients whoundergo CABG among thosewho receive revascularisationis assumed to vary acrossrisk categories
l Disutility is incurred whenpatients have PCI, CABG and MI
l CCTA, SPECT and ICA areassumed to have an averageradiation dose of 10 mSvthat increases the lifetimerisk of cancer after a 10-yearlatency period
Boldt et al. (2013),78
Germany1. CMR plusICA2. SPECTplus ICA3. ICA
l Patients progress to thenext test if results of theprevious one are positiveor inconclusive. ICA is thereference test
l Patients withsuspected CAD
l Pretest probability ofCAD: 10–100%
l Bayesianmathematical model
l 10-year horizon
l Two sets of equationsallow estimating themean total costs andincremental QALY. Nohealth states are defined
l ICA is a perfect testl A correct diagnosis of CAD
is assumed to increase thenumber of QALYs by 3 yearsover the time horizon
l The annual mortality ratevaries according to the testsreceived by the patient andwhether or not CAD-positivepatients were incorrectlyclassified as negatives.Complications associated withtest procedures include deathand MI. Procedure-relateddeath are assumed to subtract10 years of life, while deathscaused by FN (missed CAD)subtract 5 years
l A disutility of 0.1 was appliedannually for complicationscaused by test and missed CAD
l Only short-term costsassociated with tests and testprocedural complications (MI)are included
continued
DOI:10.3310/hta2
5560
Health
Tech
nology
Assessm
ent2021
Vol.2
5No.5
6
©Queen
’sPrin
teran
dContro
llerofHMSO
2021.T
his
work
was
produced
byDuarte
etal.
under
theterm
sofaco
mmissio
ningco
ntract
issued
bytheSecretary
ofState
forHealth
andSo
cialCare.T
his
issuemay
befreely
reproduced
forthepu
rposes
ofprivate
researchan
dstu
dyan
dextracts
(orindeed
,thefullrepo
rt)may
beinclu
ded
inpro
fessional
journals
provid
edthat
suitab
leackn
owled
gemen
tis
mad
ean
dtherepro
ductio
nis
notasso
ciatedwith
anyform
ofad
vertising.
Applicatio
nsforco
mmercial
reproductio
nshould
bead
dressed
to:NIH
RJournals
Library,
Natio
nal
Institu
teforHealth
Research
,Evalu
ation,Trials
and
Studies
Coordinatin
gCen
tre,Alph
aHouse,
University
ofSo
utham
ptonScien
cePark,So
utham
ptonSO
167NS,U
K.
193
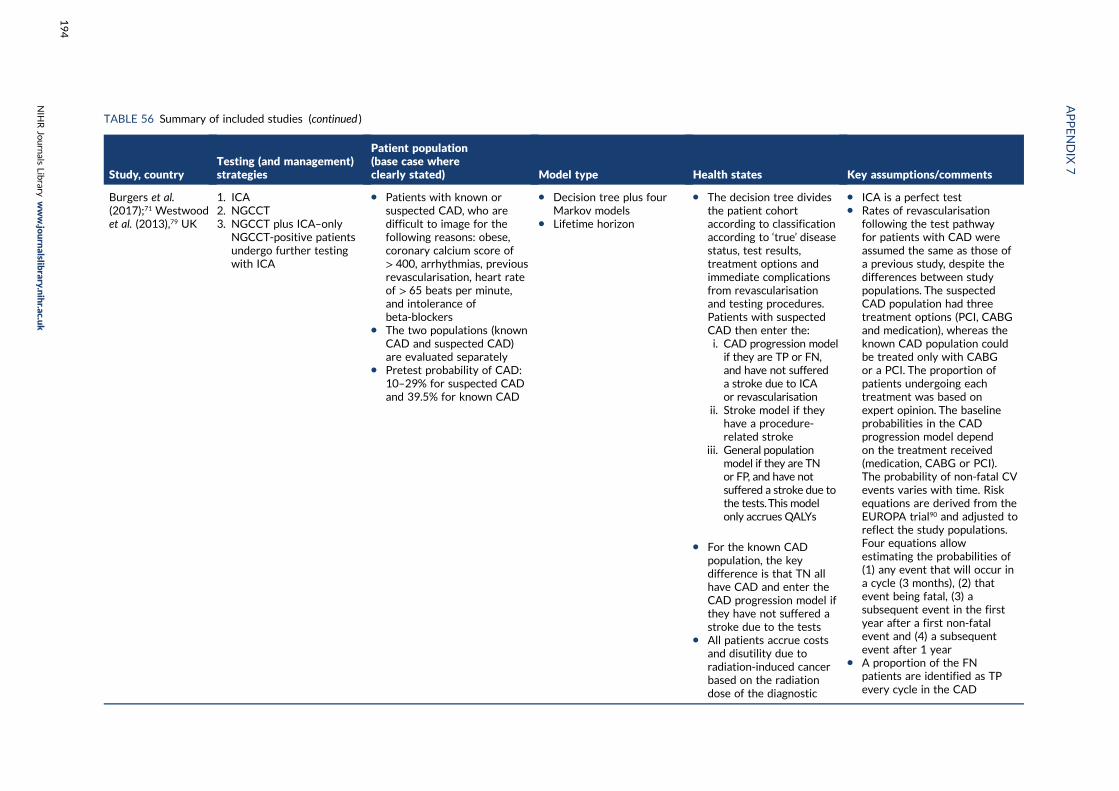
TABLE 56 Summary of included studies (continued )
Study, countryTesting (and management)strategies
Patient population(base case whereclearly stated) Model type Health states Key assumptions/comments
Burgers et al.(2017);71 Westwoodet al. (2013),79 UK
1. ICA2. NGCCT3. NGCCT plus ICA–only
NGCCT-positive patientsundergo further testingwith ICA
l Patients with known orsuspected CAD, who aredifficult to image for thefollowing reasons: obese,coronary calcium score of> 400, arrhythmias, previousrevascularisation, heart rateof > 65 beats per minute,and intolerance ofbeta-blockers
l The two populations (knownCAD and suspected CAD)are evaluated separately
l Pretest probability of CAD:10–29% for suspected CADand 39.5% for known CAD
l Decision tree plus fourMarkov models
l Lifetime horizon
l The decision tree dividesthe patient cohortaccording to classificationaccording to ‘true’ diseasestatus, test results,treatment options andimmediate complicationsfrom revascularisationand testing procedures.Patients with suspectedCAD then enter the:i. CAD progression modelif they are TP or FN,and have not suffereda stroke due to ICAor revascularisation
ii. Stroke model if theyhave a procedure-related stroke
iii. General populationmodel if they are TNor FP, and have notsuffered a stroke due tothe tests.This modelonly accrues QALYs
l For the known CADpopulation, the keydifference is that TN allhave CAD and enter theCAD progression model ifthey have not suffered astroke due to the tests
l All patients accrue costsand disutility due toradiation-induced cancerbased on the radiationdose of the diagnostic
l ICA is a perfect testl Rates of revascularisation
following the test pathwayfor patients with CAD wereassumed the same as those ofa previous study, despite thedifferences between studypopulations. The suspectedCAD population had threetreatment options (PCI, CABGand medication), whereas theknown CAD population couldbe treated only with CABGor a PCI. The proportion ofpatients undergoing eachtreatment was based onexpert opinion. The baselineprobabilities in the CADprogression model dependon the treatment received(medication, CABG or PCI).The probability of non-fatal CVevents varies with time. Riskequations are derived from theEUROPA trial90 and adjusted toreflect the study populations.Four equations allowestimating the probabilities of(1) any event that will occur ina cycle (3 months), (2) thatevent being fatal, (3) asubsequent event in the firstyear after a first non-fatalevent and (4) a subsequentevent after 1 year
l A proportion of the FNpatients are identified as TPevery cycle in the CAD
APPENDIX
7
NIH
RJournals
Library
www.jo
urnalslib
rary.nihr.ac.u
k
194
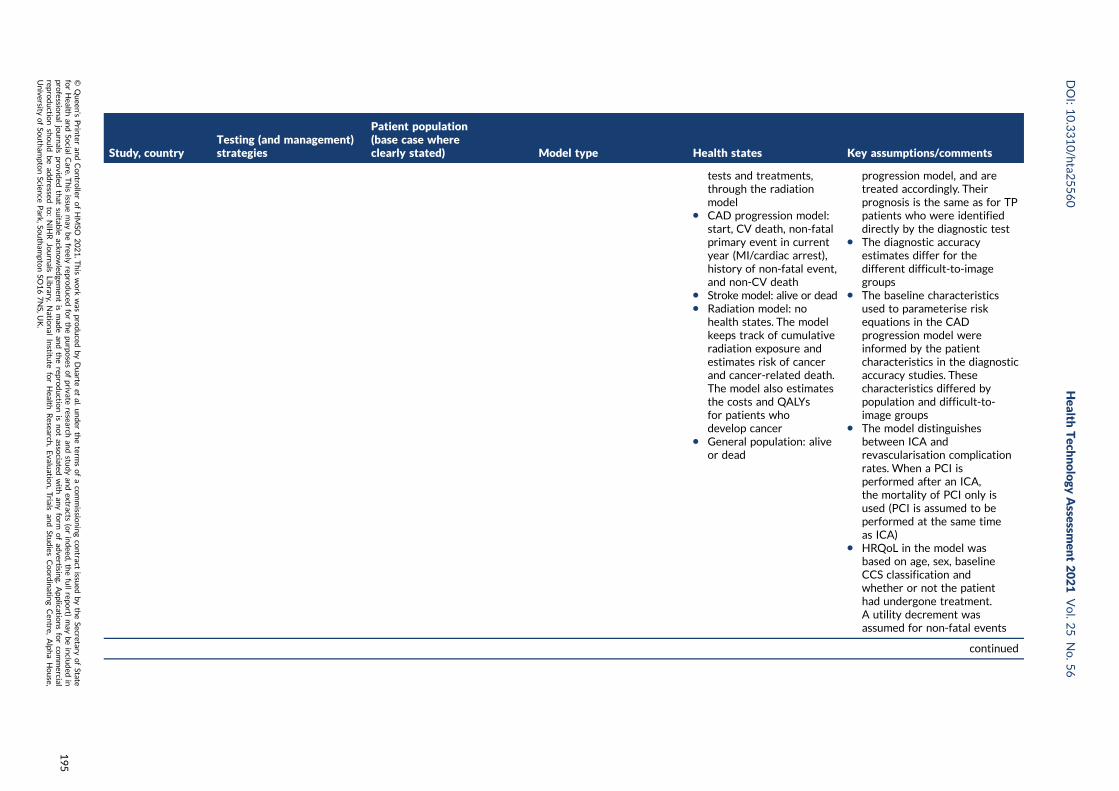
Study, countryTesting (and management)strategies
Patient population(base case whereclearly stated) Model type Health states Key assumptions/comments
tests and treatments,through the radiationmodel
l CAD progression model:start, CV death, non-fatalprimary event in currentyear (MI/cardiac arrest),history of non-fatal event,and non-CV death
l Stroke model: alive or deadl Radiation model: no
health states. The modelkeeps track of cumulativeradiation exposure andestimates risk of cancerand cancer-related death.The model also estimatesthe costs and QALYsfor patients whodevelop cancer
l General population: aliveor dead
progression model, and aretreated accordingly. Theirprognosis is the same as for TPpatients who were identifieddirectly by the diagnostic test
l The diagnostic accuracyestimates differ for thedifferent difficult-to-imagegroups
l The baseline characteristicsused to parameterise riskequations in the CADprogression model wereinformed by the patientcharacteristics in the diagnosticaccuracy studies. Thesecharacteristics differed bypopulation and difficult-to-image groups
l The model distinguishesbetween ICA andrevascularisation complicationrates. When a PCI isperformed after an ICA,the mortality of PCI only isused (PCI is assumed to beperformed at the same timeas ICA)
l HRQoL in the model wasbased on age, sex, baselineCCS classification andwhether or not the patienthad undergone treatment.A utility decrement wasassumed for non-fatal events
continued
DOI:10.3310/hta2
5560
Health
Tech
nology
Assessm
ent2021
Vol.2
5No.5
6
©Queen
’sPrin
teran
dContro
llerofHMSO
2021.T
his
work
was
produced
byDuarte
etal.
under
theterm
sofaco
mmissio
ningco
ntract
issued
bytheSecretary
ofState
forHealth
andSo
cialCare.T
his
issuemay
befreely
reproduced
forthepu
rposes
ofprivate
researchan
dstu
dyan
dextracts
(orindeed
,thefullrepo
rt)may
beinclu
ded
inpro
fessional
journals
provid
edthat
suitab
leackn
owled
gemen
tis
mad
ean
dtherepro
ductio
nis
notasso
ciatedwith
anyform
ofad
vertising.
Applicatio
nsforco
mmercial
reproductio
nshould
bead
dressed
to:NIH
RJournals
Library,
Natio
nal
Institu
teforHealth
Research
,Evalu
ation,Trials
and
Studies
Coordinatin
gCen
tre,Alph
aHouse,
University
ofSo
utham
ptonScien
cePark,So
utham
ptonSO
167NS,U
K.
195
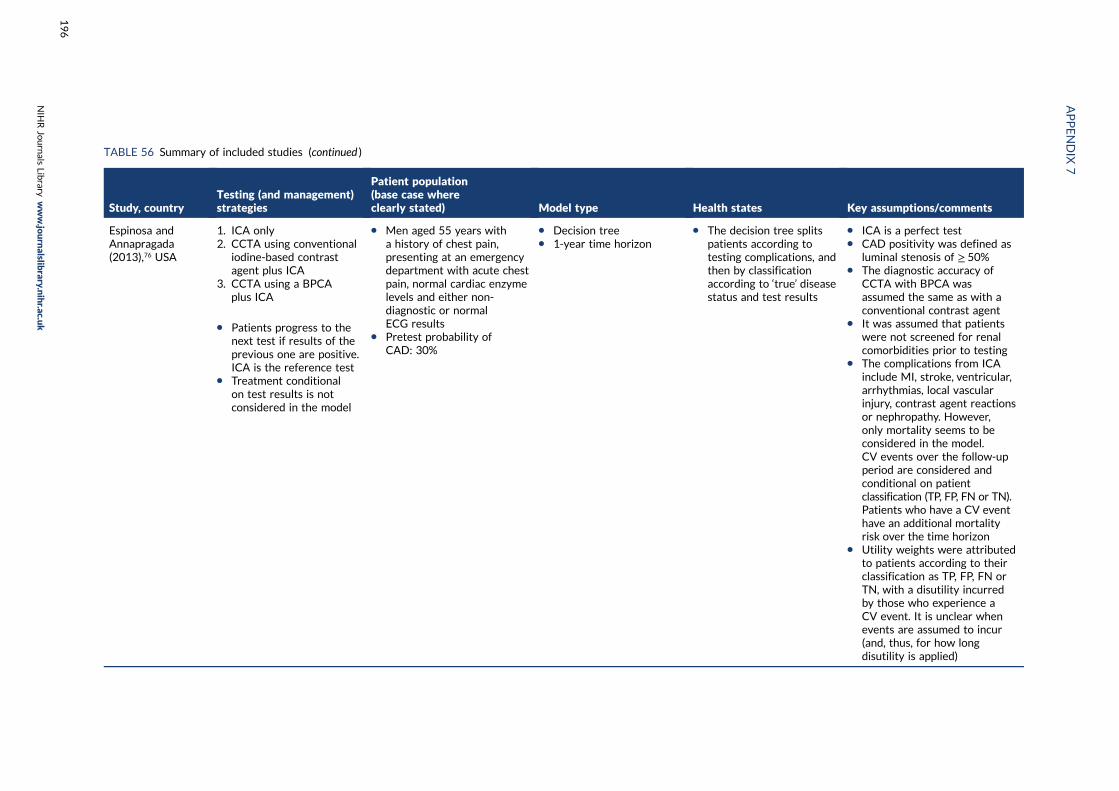
TABLE 56 Summary of included studies (continued )
Study, countryTesting (and management)strategies
Patient population(base case whereclearly stated) Model type Health states Key assumptions/comments
Espinosa andAnnapragada(2013),76 USA
1. ICA only2. CCTA using conventional
iodine-based contrastagent plus ICA
3. CCTA using a BPCAplus ICA
l Patients progress to thenext test if results of theprevious one are positive.ICA is the reference test
l Treatment conditionalon test results is notconsidered in the model
l Men aged 55 years witha history of chest pain,presenting at an emergencydepartment with acute chestpain, normal cardiac enzymelevels and either non-diagnostic or normalECG results
l Pretest probability ofCAD: 30%
l Decision treel 1-year time horizon
l The decision tree splitspatients according totesting complications, andthen by classificationaccording to ‘true’ diseasestatus and test results
l ICA is a perfect testl CAD positivity was defined as
luminal stenosis of ≥ 50%l The diagnostic accuracy of
CCTA with BPCA wasassumed the same as with aconventional contrast agent
l It was assumed that patientswere not screened for renalcomorbidities prior to testing
l The complications from ICAinclude MI, stroke, ventricular,arrhythmias, local vascularinjury, contrast agent reactionsor nephropathy. However,only mortality seems to beconsidered in the model.CV events over the follow-upperiod are considered andconditional on patientclassification (TP, FP, FN or TN).Patients who have a CV eventhave an additional mortalityrisk over the time horizon
l Utility weights were attributedto patients according to theirclassification as TP, FP, FN orTN, with a disutility incurredby those who experience aCV event. It is unclear whenevents are assumed to incur(and, thus, for how longdisutility is applied)
APPENDIX
7
NIH
RJournals
Library
www.jo
urnalslib
rary.nihr.ac.u
k
196
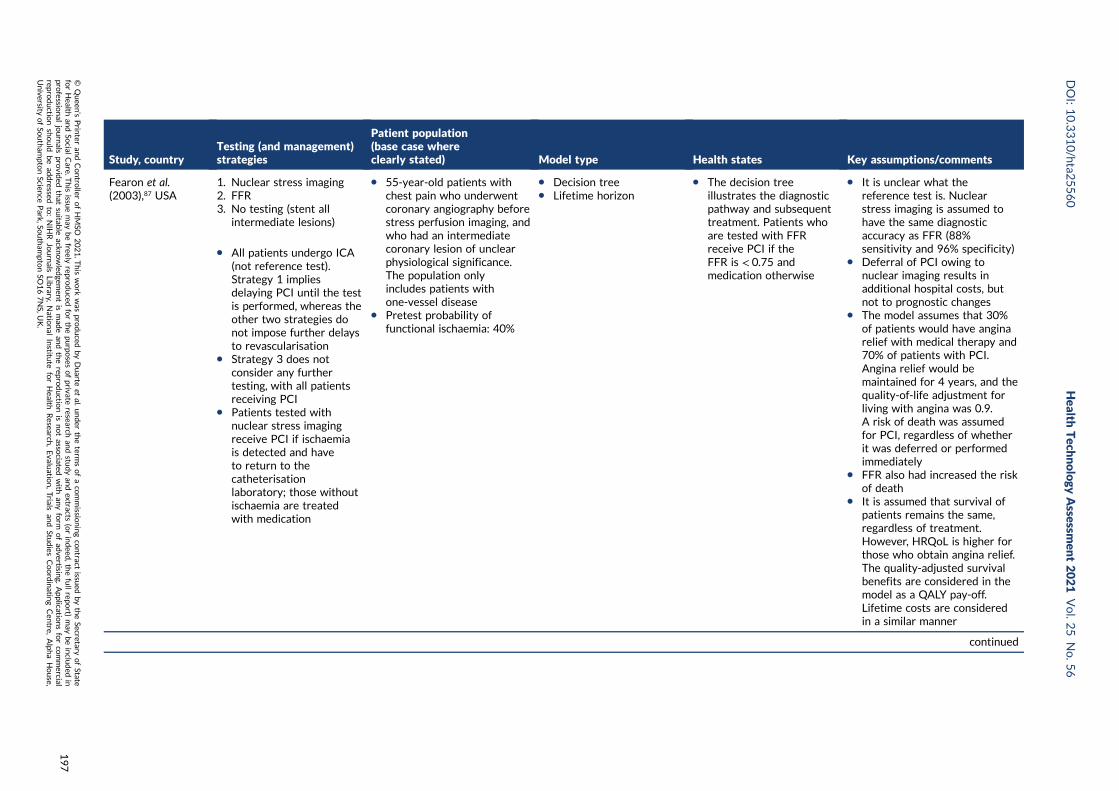
Study, countryTesting (and management)strategies
Patient population(base case whereclearly stated) Model type Health states Key assumptions/comments
Fearon et al.(2003),87 USA
1. Nuclear stress imaging2. FFR3. No testing (stent all
intermediate lesions)
l All patients undergo ICA(not reference test).Strategy 1 impliesdelaying PCI until the testis performed, whereas theother two strategies donot impose further delaysto revascularisation
l Strategy 3 does notconsider any furthertesting, with all patientsreceiving PCI
l Patients tested withnuclear stress imagingreceive PCI if ischaemiais detected and haveto return to thecatheterisationlaboratory; those withoutischaemia are treatedwith medication
l 55-year-old patients withchest pain who underwentcoronary angiography beforestress perfusion imaging, andwho had an intermediatecoronary lesion of unclearphysiological significance.The population onlyincludes patients withone-vessel disease
l Pretest probability offunctional ischaemia: 40%
l Decision treel Lifetime horizon
l The decision treeillustrates the diagnosticpathway and subsequenttreatment. Patients whoare tested with FFRreceive PCI if theFFR is < 0.75 andmedication otherwise
l It is unclear what thereference test is. Nuclearstress imaging is assumed tohave the same diagnosticaccuracy as FFR (88%sensitivity and 96% specificity)
l Deferral of PCI owing tonuclear imaging results inadditional hospital costs, butnot to prognostic changes
l The model assumes that 30%of patients would have anginarelief with medical therapy and70% of patients with PCI.Angina relief would bemaintained for 4 years, and thequality-of-life adjustment forliving with angina was 0.9.A risk of death was assumedfor PCI, regardless of whetherit was deferred or performedimmediately
l FFR also had increased the riskof death
l It is assumed that survival ofpatients remains the same,regardless of treatment.However, HRQoL is higher forthose who obtain angina relief.The quality-adjusted survivalbenefits are considered in themodel as a QALY pay-off.Lifetime costs are consideredin a similar manner
continued
DOI:10.3310/hta2
5560
Health
Tech
nology
Assessm
ent2021
Vol.2
5No.5
6
©Queen
’sPrin
teran
dContro
llerofHMSO
2021.T
his
work
was
produced
byDuarte
etal.
under
theterm
sofaco
mmissio
ningco
ntract
issued
bytheSecretary
ofState
forHealth
andSo
cialCare.T
his
issuemay
befreely
reproduced
forthepu
rposes
ofprivate
researchan
dstu
dyan
dextracts
(orindeed
,thefullrepo
rt)may
beinclu
ded
inpro
fessional
journals
provid
edthat
suitab
leackn
owled
gemen
tis
mad
ean
dtherepro
ductio
nis
notasso
ciatedwith
anyform
ofad
vertising.
Applicatio
nsforco
mmercial
reproductio
nshould
bead
dressed
to:NIH
RJournals
Library,
Natio
nal
Institu
teforHealth
Research
,Evalu
ation,Trials
and
Studies
Coordinatin
gCen
tre,Alph
aHouse,
University
ofSo
utham
ptonScien
cePark,So
utham
ptonSO
167NS,U
K.
197
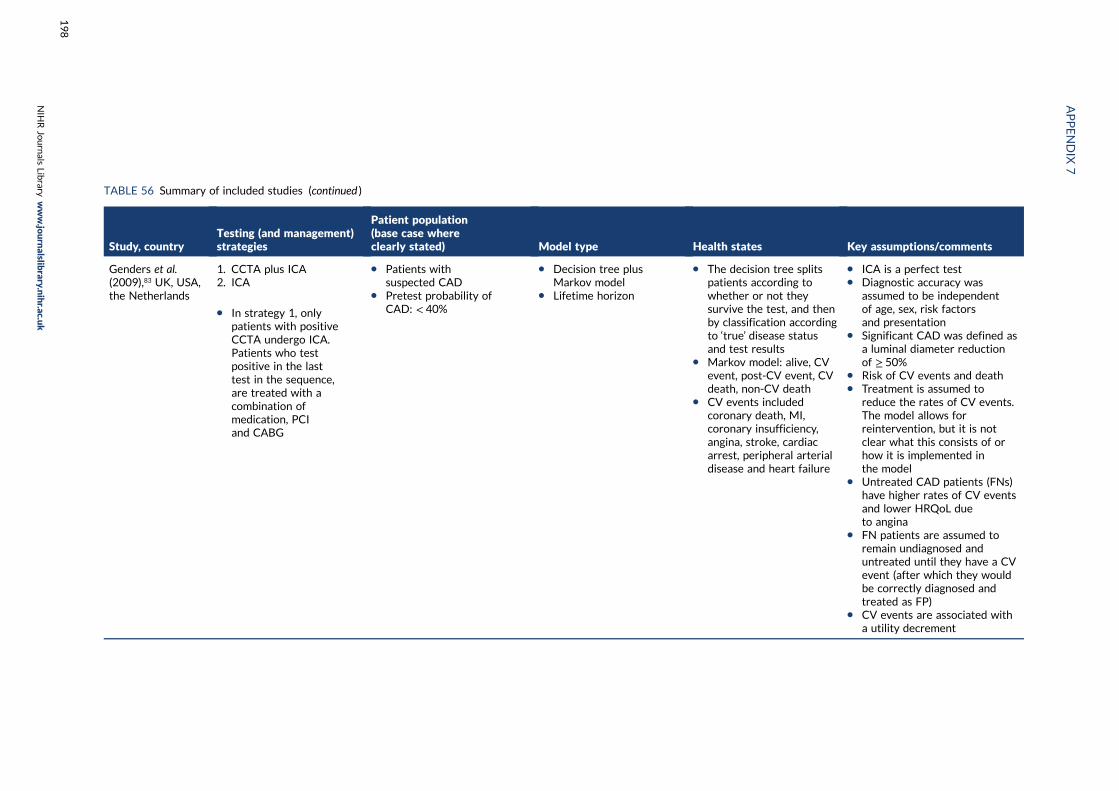
TABLE 56 Summary of included studies (continued )
Study, countryTesting (and management)strategies
Patient population(base case whereclearly stated) Model type Health states Key assumptions/comments
Genders et al.(2009),83 UK, USA,the Netherlands
1. CCTA plus ICA2. ICA
l In strategy 1, onlypatients with positiveCCTA undergo ICA.Patients who testpositive in the lasttest in the sequence,are treated with acombination ofmedication, PCIand CABG
l Patients withsuspected CAD
l Pretest probability ofCAD: < 40%
l Decision tree plusMarkov model
l Lifetime horizon
l The decision tree splitspatients according towhether or not theysurvive the test, and thenby classification accordingto ‘true’ disease statusand test results
l Markov model: alive, CVevent, post-CV event, CVdeath, non-CV death
l CV events includedcoronary death, MI,coronary insufficiency,angina, stroke, cardiacarrest, peripheral arterialdisease and heart failure
l ICA is a perfect testl Diagnostic accuracy was
assumed to be independentof age, sex, risk factorsand presentation
l Significant CAD was defined asa luminal diameter reductionof ≥ 50%
l Risk of CV events and deathl Treatment is assumed to
reduce the rates of CV events.The model allows forreintervention, but it is notclear what this consists of orhow it is implemented inthe model
l Untreated CAD patients (FNs)have higher rates of CV eventsand lower HRQoL dueto angina
l FN patients are assumed toremain undiagnosed anduntreated until they have a CVevent (after which they wouldbe correctly diagnosed andtreated as FP)
l CV events are associated witha utility decrement
APPENDIX
7
NIH
RJournals
Library
www.jo
urnalslib
rary.nihr.ac.u
k
198
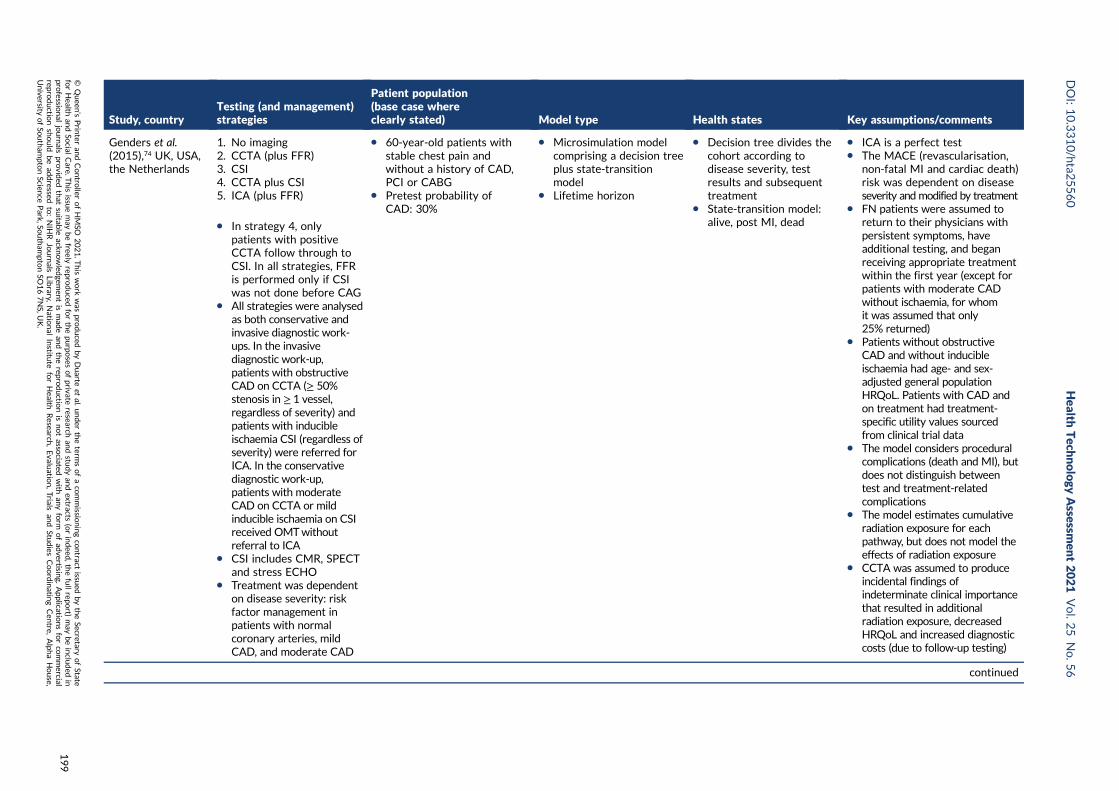
Study, countryTesting (and management)strategies
Patient population(base case whereclearly stated) Model type Health states Key assumptions/comments
Genders et al.(2015),74 UK, USA,the Netherlands
1. No imaging2. CCTA (plus FFR)3. CSI4. CCTA plus CSI5. ICA (plus FFR)
l In strategy 4, onlypatients with positiveCCTA follow through toCSI. In all strategies, FFRis performed only if CSIwas not done before CAG
l All strategies were analysedas both conservative andinvasive diagnostic work-ups. In the invasivediagnostic work-up,patients with obstructiveCAD on CCTA (≥ 50%stenosis in ≥ 1 vessel,regardless of severity) andpatients with inducibleischaemia CSI (regardless ofseverity) were referred forICA. In the conservativediagnostic work-up,patients with moderateCAD on CCTA or mildinducible ischaemia on CSIreceived OMTwithoutreferral to ICA
l CSI includes CMR, SPECTand stress ECHO
l Treatment was dependenton disease severity: riskfactor management inpatients with normalcoronary arteries, mildCAD, and moderate CAD
l 60-year-old patients withstable chest pain andwithout a history of CAD,PCI or CABG
l Pretest probability ofCAD: 30%
l Microsimulation modelcomprising a decision treeplus state-transitionmodel
l Lifetime horizon
l Decision tree divides thecohort according todisease severity, testresults and subsequenttreatment
l State-transition model:alive, post MI, dead
l ICA is a perfect testl The MACE (revascularisation,
non-fatal MI and cardiac death)risk was dependent on diseaseseverity and modified by treatment
l FN patients were assumed toreturn to their physicians withpersistent symptoms, haveadditional testing, and beganreceiving appropriate treatmentwithin the first year (except forpatients with moderate CADwithout ischaemia, for whomit was assumed that only25% returned)
l Patients without obstructiveCAD and without inducibleischaemia had age- and sex-adjusted general populationHRQoL. Patients with CAD andon treatment had treatment-specific utility values sourcedfrom clinical trial data
l The model considers proceduralcomplications (death and MI), butdoes not distinguish betweentest and treatment-relatedcomplications
l The model estimates cumulativeradiation exposure for eachpathway, but does not model theeffects of radiation exposure
l CCTA was assumed to produceincidental findings ofindeterminate clinical importancethat resulted in additionalradiation exposure, decreasedHRQoL and increased diagnosticcosts (due to follow-up testing)
continued
DOI:10.3310/hta2
5560
Health
Tech
nology
Assessm
ent2021
Vol.2
5No.5
6
©Queen
’sPrin
teran
dContro
llerofHMSO
2021.T
his
work
was
produced
byDuarte
etal.
under
theterm
sofaco
mmissio
ningco
ntract
issued
bytheSecretary
ofState
forHealth
andSo
cialCare.T
his
issuemay
befreely
reproduced
forthepu
rposes
ofprivate
researchan
dstu
dyan
dextracts
(orindeed
,thefullrepo
rt)may
beinclu
ded
inpro
fessional
journals
provid
edthat
suitab
leackn
owled
gemen
tis
mad
ean
dtherepro
ductio
nis
notasso
ciatedwith
anyform
ofad
vertising.
Applicatio
nsforco
mmercial
reproductio
nshould
bead
dressed
to:NIH
RJournals
Library,
Natio
nal
Institu
teforHealth
Research
,Evalu
ation,Trials
and
Studies
Coordinatin
gCen
tre,Alph
aHouse,
University
ofSo
utham
ptonScien
cePark,So
utham
ptonSO
167NS,U
K.
199
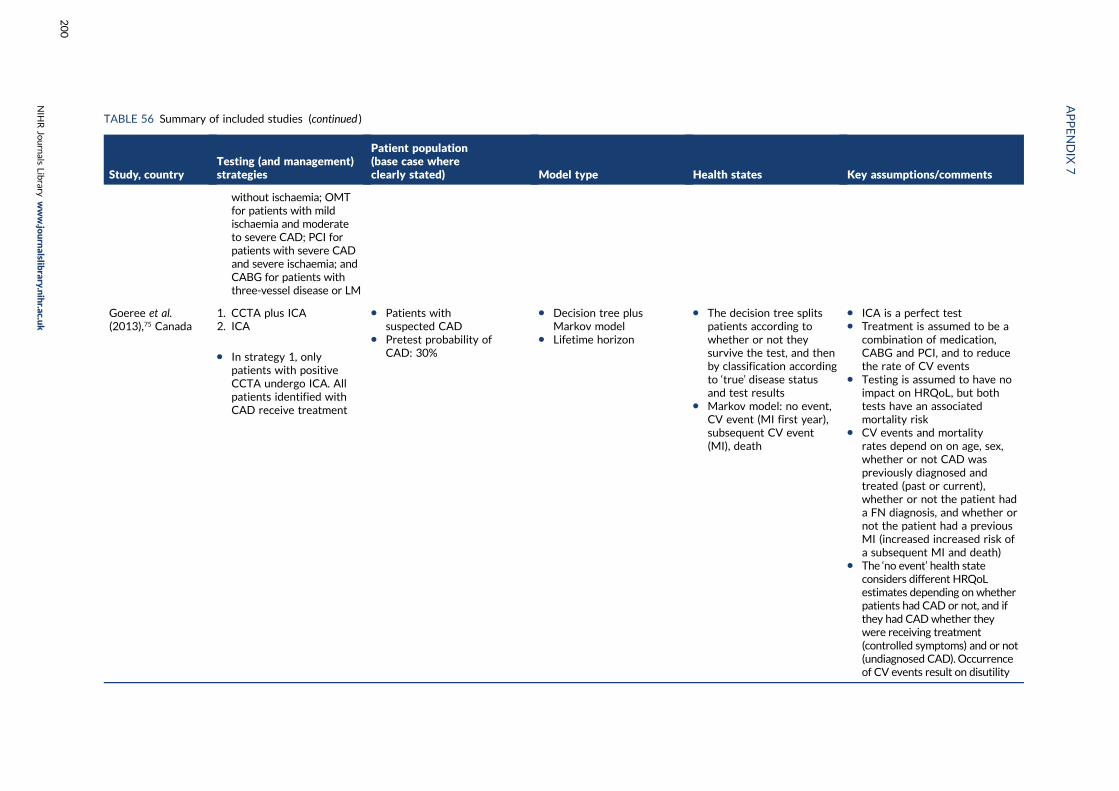
TABLE 56 Summary of included studies (continued )
Study, countryTesting (and management)strategies
Patient population(base case whereclearly stated) Model type Health states Key assumptions/comments
without ischaemia; OMTfor patients with mildischaemia and moderateto severe CAD; PCI forpatients with severe CADand severe ischaemia; andCABG for patients withthree-vessel disease or LM
Goeree et al.(2013),75 Canada
1. CCTA plus ICA2. ICA
l In strategy 1, onlypatients with positiveCCTA undergo ICA. Allpatients identified withCAD receive treatment
l Patients withsuspected CAD
l Pretest probability ofCAD: 30%
l Decision tree plusMarkov model
l Lifetime horizon
l The decision tree splitspatients according towhether or not theysurvive the test, and thenby classification accordingto ‘true’ disease statusand test results
l Markov model: no event,CV event (MI first year),subsequent CV event(MI), death
l ICA is a perfect testl Treatment is assumed to be a
combination of medication,CABG and PCI, and to reducethe rate of CV events
l Testing is assumed to have noimpact on HRQoL, but bothtests have an associatedmortality risk
l CV events and mortalityrates depend on on age, sex,whether or not CAD waspreviously diagnosed andtreated (past or current),whether or not the patient hada FN diagnosis, and whether ornot the patient had a previousMI (increased increased risk ofa subsequent MI and death)
l The ‘no event’ health stateconsiders different HRQoLestimates depending on whetherpatients had CAD or not, and ifthey had CADwhether theywere receiving treatment(controlled symptoms) and or not(undiagnosed CAD). Occurrenceof CV events result on disutility
APPENDIX
7
NIH
RJournals
Library
www.jo
urnalslib
rary.nihr.ac.u
k
200
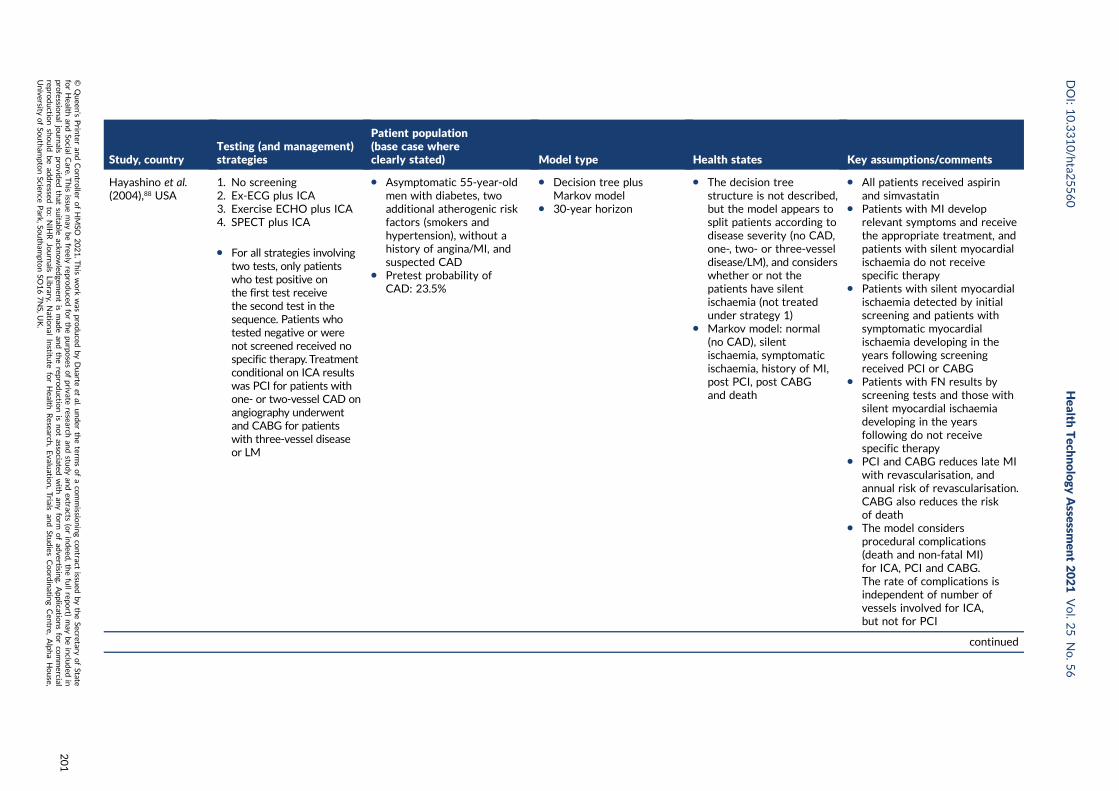
Study, countryTesting (and management)strategies
Patient population(base case whereclearly stated) Model type Health states Key assumptions/comments
Hayashino et al.(2004),88 USA
1. No screening2. Ex-ECG plus ICA3. Exercise ECHO plus ICA4. SPECT plus ICA
l For all strategies involvingtwo tests, only patientswho test positive onthe first test receivethe second test in thesequence. Patients whotested negative or werenot screened received nospecific therapy. Treatmentconditional on ICA resultswas PCI for patients withone- or two-vessel CAD onangiography underwentand CABG for patientswith three-vessel diseaseor LM
l Asymptomatic 55-year-oldmen with diabetes, twoadditional atherogenic riskfactors (smokers andhypertension), without ahistory of angina/MI, andsuspected CAD
l Pretest probability ofCAD: 23.5%
l Decision tree plusMarkov model
l 30-year horizon
l The decision treestructure is not described,but the model appears tosplit patients according todisease severity (no CAD,one-, two- or three-vesseldisease/LM), and considerswhether or not thepatients have silentischaemia (not treatedunder strategy 1)
l Markov model: normal(no CAD), silentischaemia, symptomaticischaemia, history of MI,post PCI, post CABGand death
l All patients received aspirinand simvastatin
l Patients with MI developrelevant symptoms and receivethe appropriate treatment, andpatients with silent myocardialischaemia do not receivespecific therapy
l Patients with silent myocardialischaemia detected by initialscreening and patients withsymptomatic myocardialischaemia developing in theyears following screeningreceived PCI or CABG
l Patients with FN results byscreening tests and those withsilent myocardial ischaemiadeveloping in the yearsfollowing do not receivespecific therapy
l PCI and CABG reduces late MIwith revascularisation, andannual risk of revascularisation.CABG also reduces the riskof death
l The model considersprocedural complications(death and non-fatal MI)for ICA, PCI and CABG.The rate of complications isindependent of number ofvessels involved for ICA,but not for PCI
continued
DOI:10.3310/hta2
5560
Health
Tech
nology
Assessm
ent2021
Vol.2
5No.5
6
©Queen
’sPrin
teran
dContro
llerofHMSO
2021.T
his
work
was
produced
byDuarte
etal.
under
theterm
sofaco
mmissio
ningco
ntract
issued
bytheSecretary
ofState
forHealth
andSo
cialCare.T
his
issuemay
befreely
reproduced
forthepu
rposes
ofprivate
researchan
dstu
dyan
dextracts
(orindeed
,thefullrepo
rt)may
beinclu
ded
inpro
fessional
journals
provid
edthat
suitab
leackn
owled
gemen
tis
mad
ean
dtherepro
ductio
nis
notasso
ciatedwith
anyform
ofad
vertising.
Applicatio
nsforco
mmercial
reproductio
nshould
bead
dressed
to:NIH
RJournals
Library,
Natio
nal
Institu
teforHealth
Research
,Evalu
ation,Trials
and
Studies
Coordinatin
gCen
tre,Alph
aHouse,
University
ofSo
utham
ptonScien
cePark,So
utham
ptonSO
167NS,U
K.
201
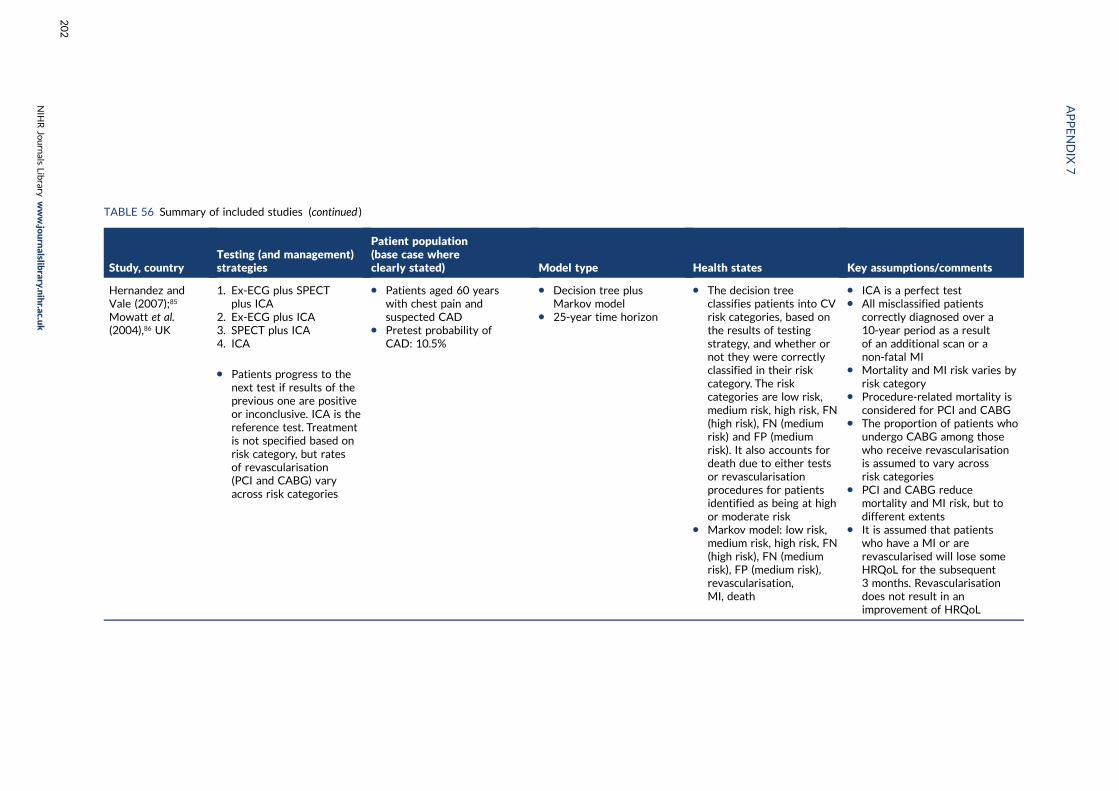
TABLE 56 Summary of included studies (continued )
Study, countryTesting (and management)strategies
Patient population(base case whereclearly stated) Model type Health states Key assumptions/comments
Hernandez andVale (2007);85
Mowatt et al.(2004),86 UK
1. Ex-ECG plus SPECTplus ICA
2. Ex-ECG plus ICA3. SPECT plus ICA4. ICA
l Patients progress to thenext test if results of theprevious one are positiveor inconclusive. ICA is thereference test. Treatmentis not specified based onrisk category, but ratesof revascularisation(PCI and CABG) varyacross risk categories
l Patients aged 60 yearswith chest pain andsuspected CAD
l Pretest probability ofCAD: 10.5%
l Decision tree plusMarkov model
l 25-year time horizon
l The decision treeclassifies patients into CVrisk categories, based onthe results of testingstrategy, and whether ornot they were correctlyclassified in their riskcategory. The riskcategories are low risk,medium risk, high risk, FN(high risk), FN (mediumrisk) and FP (mediumrisk). It also accounts fordeath due to either testsor revascularisationprocedures for patientsidentified as being at highor moderate risk
l Markov model: low risk,medium risk, high risk, FN(high risk), FN (mediumrisk), FP (medium risk),revascularisation,MI, death
l ICA is a perfect testl All misclassified patients
correctly diagnosed over a10-year period as a resultof an additional scan or anon-fatal MI
l Mortality and MI risk varies byrisk category
l Procedure-related mortality isconsidered for PCI and CABG
l The proportion of patients whoundergo CABG among thosewho receive revascularisationis assumed to vary acrossrisk categories
l PCI and CABG reducemortality and MI risk, but todifferent extents
l It is assumed that patientswho have a MI or arerevascularised will lose someHRQoL for the subsequent3 months. Revascularisationdoes not result in animprovement of HRQoL
APPENDIX
7
NIH
RJournals
Library
www.jo
urnalslib
rary.nihr.ac.u
k
202
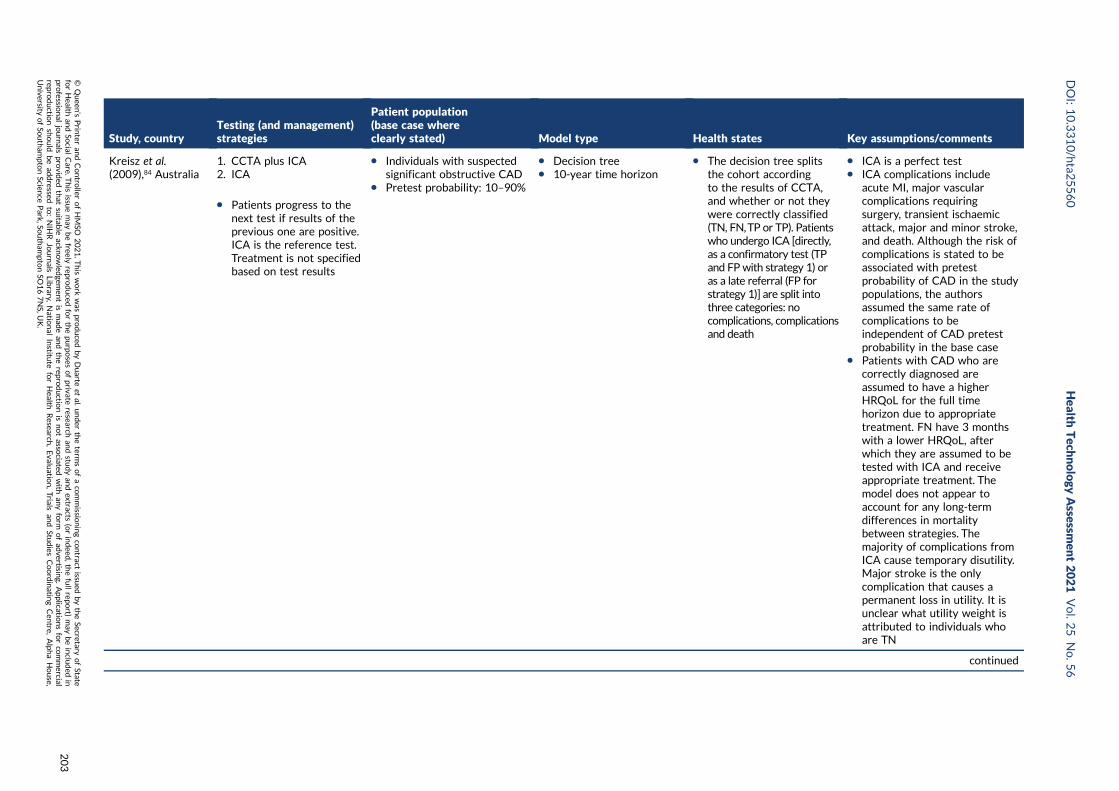
Study, countryTesting (and management)strategies
Patient population(base case whereclearly stated) Model type Health states Key assumptions/comments
Kreisz et al.(2009),84 Australia
1. CCTA plus ICA2. ICA
l Patients progress to thenext test if results of theprevious one are positive.ICA is the reference test.Treatment is not specifiedbased on test results
l Individuals with suspectedsignificant obstructive CAD
l Pretest probability: 10–90%
l Decision treel 10-year time horizon
l The decision tree splitsthe cohort accordingto the results of CCTA,and whether or not theywere correctly classified(TN, FN,TP or TP). Patientswho undergo ICA [directly,as a confirmatory test (TPand FPwith strategy 1) oras a late referral (FP forstrategy 1)] are split intothree categories: nocomplications, complicationsand death
l ICA is a perfect testl ICA complications include
acute MI, major vascularcomplications requiringsurgery, transient ischaemicattack, major and minor stroke,and death. Although the risk ofcomplications is stated to beassociated with pretestprobability of CAD in the studypopulations, the authorsassumed the same rate ofcomplications to beindependent of CAD pretestprobability in the base case
l Patients with CAD who arecorrectly diagnosed areassumed to have a higherHRQoL for the full timehorizon due to appropriatetreatment. FN have 3 monthswith a lower HRQoL, afterwhich they are assumed to betested with ICA and receiveappropriate treatment. Themodel does not appear toaccount for any long-termdifferences in mortalitybetween strategies. Themajority of complications fromICA cause temporary disutility.Major stroke is the onlycomplication that causes apermanent loss in utility. It isunclear what utility weight isattributed to individuals whoare TN
continued
DOI:10.3310/hta2
5560
Health
Tech
nology
Assessm
ent2021
Vol.2
5No.5
6
©Queen
’sPrin
teran
dContro
llerofHMSO
2021.T
his
work
was
produced
byDuarte
etal.
under
theterm
sofaco
mmissio
ningco
ntract
issued
bytheSecretary
ofState
forHealth
andSo
cialCare.T
his
issuemay
befreely
reproduced
forthepu
rposes
ofprivate
researchan
dstu
dyan
dextracts
(orindeed
,thefullrepo
rt)may
beinclu
ded
inpro
fessional
journals
provid
edthat
suitab
leackn
owled
gemen
tis
mad
ean
dtherepro
ductio
nis
notasso
ciatedwith
anyform
ofad
vertising.
Applicatio
nsforco
mmercial
reproductio
nshould
bead
dressed
to:NIH
RJournals
Library,
Natio
nal
Institu
teforHealth
Research
,Evalu
ation,Trials
and
Studies
Coordinatin
gCen
tre,Alph
aHouse,
University
ofSo
utham
ptonScien
cePark,So
utham
ptonSO
167NS,U
K.
203
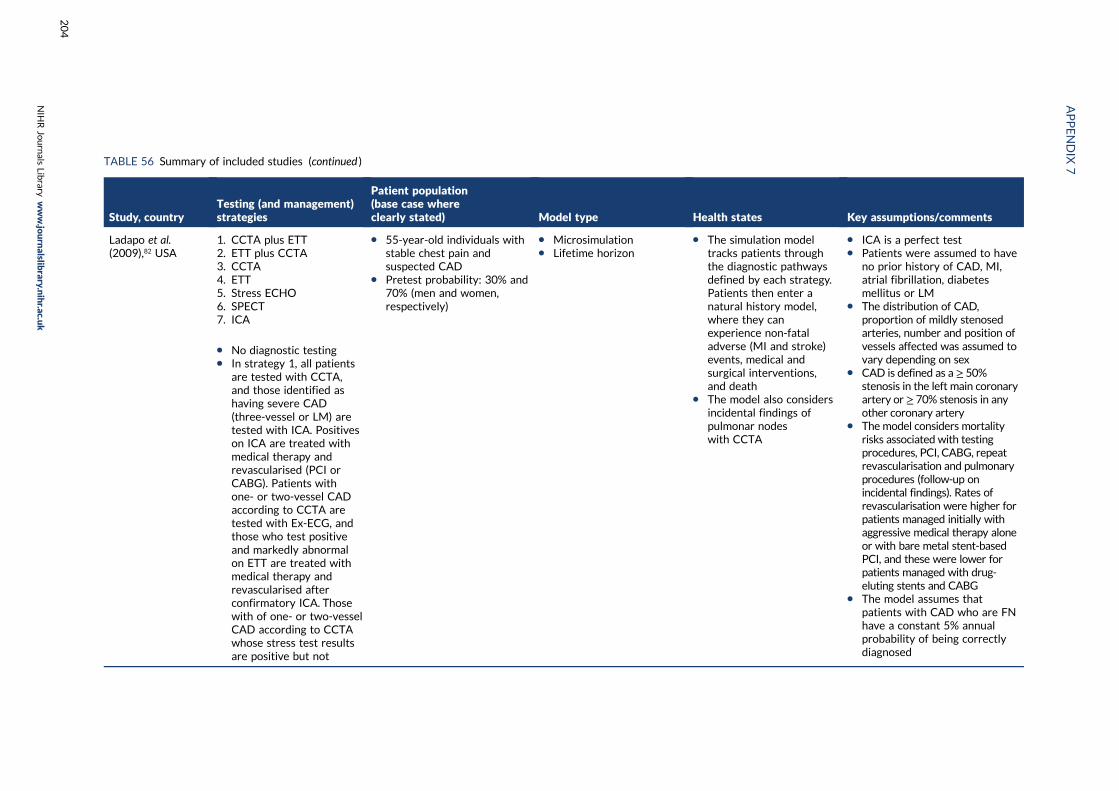
TABLE 56 Summary of included studies (continued )
Study, countryTesting (and management)strategies
Patient population(base case whereclearly stated) Model type Health states Key assumptions/comments
Ladapo et al.(2009),82 USA
1. CCTA plus ETT2. ETT plus CCTA3. CCTA4. ETT5. Stress ECHO6. SPECT7. ICA
l No diagnostic testingl In strategy 1, all patients
are tested with CCTA,and those identified ashaving severe CAD(three-vessel or LM) aretested with ICA. Positiveson ICA are treated withmedical therapy andrevascularised (PCI orCABG). Patients withone- or two-vessel CADaccording to CCTA aretested with Ex-ECG, andthose who test positiveand markedly abnormalon ETT are treated withmedical therapy andrevascularised afterconfirmatory ICA. Thosewith of one- or two-vesselCAD according to CCTAwhose stress test resultsare positive but not
l 55-year-old individuals withstable chest pain andsuspected CAD
l Pretest probability: 30% and70% (men and women,respectively)
l Microsimulationl Lifetime horizon
l The simulation modeltracks patients throughthe diagnostic pathwaysdefined by each strategy.Patients then enter anatural history model,where they canexperience non-fataladverse (MI and stroke)events, medical andsurgical interventions,and death
l The model also considersincidental findings ofpulmonar nodeswith CCTA
l ICA is a perfect testl Patients were assumed to have
no prior history of CAD, MI,atrial fibrillation, diabetesmellitus or LM
l The distribution of CAD,proportion of mildly stenosedarteries, number and position ofvessels affected was assumed tovary depending on sex
l CAD is defined as a ≥ 50%stenosis in the left main coronaryartery or ≥ 70% stenosis in anyother coronary artery
l The model considers mortalityrisks associated with testingprocedures, PCI, CABG, repeatrevascularisation and pulmonaryprocedures (follow-up onincidental findings). Rates ofrevascularisation were higher forpatients managed initially withaggressive medical therapy aloneor with bare metal stent-basedPCI, and these were lower forpatients managed with drug-eluting stents and CABG
l The model assumes thatpatients with CAD who are FNhave a constant 5% annualprobability of being correctlydiagnosed
APPENDIX
7
NIH
RJournals
Library
www.jo
urnalslib
rary.nihr.ac.u
k
204
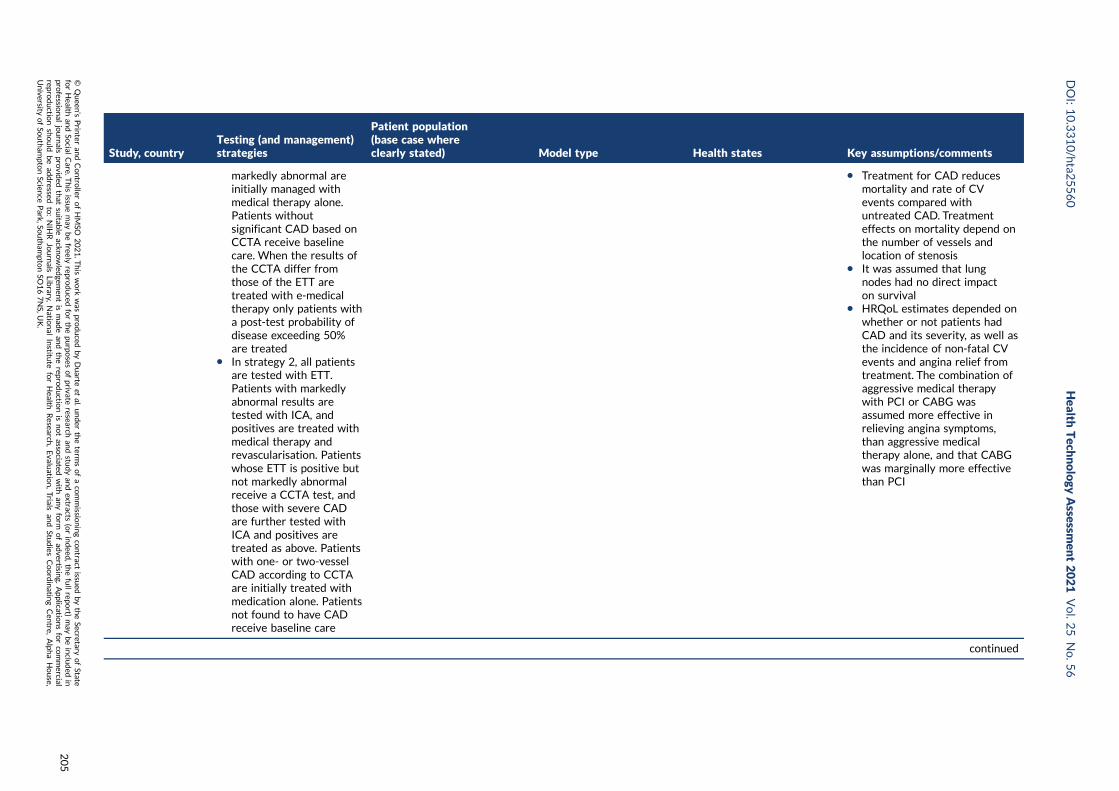
Study, countryTesting (and management)strategies
Patient population(base case whereclearly stated) Model type Health states Key assumptions/comments
markedly abnormal areinitially managed withmedical therapy alone.Patients withoutsignificant CAD based onCCTA receive baselinecare. When the results ofthe CCTA differ fromthose of the ETT aretreated with e-medicaltherapy only patients witha post-test probability ofdisease exceeding 50%are treated
l In strategy 2, all patientsare tested with ETT.Patients with markedlyabnormal results aretested with ICA, andpositives are treated withmedical therapy andrevascularisation. Patientswhose ETT is positive butnot markedly abnormalreceive a CCTA test, andthose with severe CADare further tested withICA and positives aretreated as above. Patientswith one- or two-vesselCAD according to CCTAare initially treated withmedication alone. Patientsnot found to have CADreceive baseline care
l Treatment for CAD reducesmortality and rate of CVevents compared withuntreated CAD. Treatmenteffects on mortality depend onthe number of vessels andlocation of stenosis
l It was assumed that lungnodes had no direct impacton survival
l HRQoL estimates depended onwhether or not patients hadCAD and its severity, as well asthe incidence of non-fatal CVevents and angina relief fromtreatment. The combination ofaggressive medical therapywith PCI or CABG wasassumed more effective inrelieving angina symptoms,than aggressive medicaltherapy alone, and that CABGwas marginally more effectivethan PCI
continued
DOI:10.3310/hta2
5560
Health
Tech
nology
Assessm
ent2021
Vol.2
5No.5
6
©Queen
’sPrin
teran
dContro
llerofHMSO
2021.T
his
work
was
produced
byDuarte
etal.
under
theterm
sofaco
mmissio
ningco
ntract
issued
bytheSecretary
ofState
forHealth
andSo
cialCare.T
his
issuemay
befreely
reproduced
forthepu
rposes
ofprivate
researchan
dstu
dyan
dextracts
(orindeed
,thefullrepo
rt)may
beinclu
ded
inpro
fessional
journals
provid
edthat
suitab
leackn
owled
gemen
tis
mad
ean
dtherepro
ductio
nis
notasso
ciatedwith
anyform
ofad
vertising.
Applicatio
nsforco
mmercial
reproductio
nshould
bead
dressed
to:NIH
RJournals
Library,
Natio
nal
Institu
teforHealth
Research
,Evalu
ation,Trials
and
Studies
Coordinatin
gCen
tre,Alph
aHouse,
University
ofSo
utham
ptonScien
cePark,So
utham
ptonSO
167NS,U
K.
205
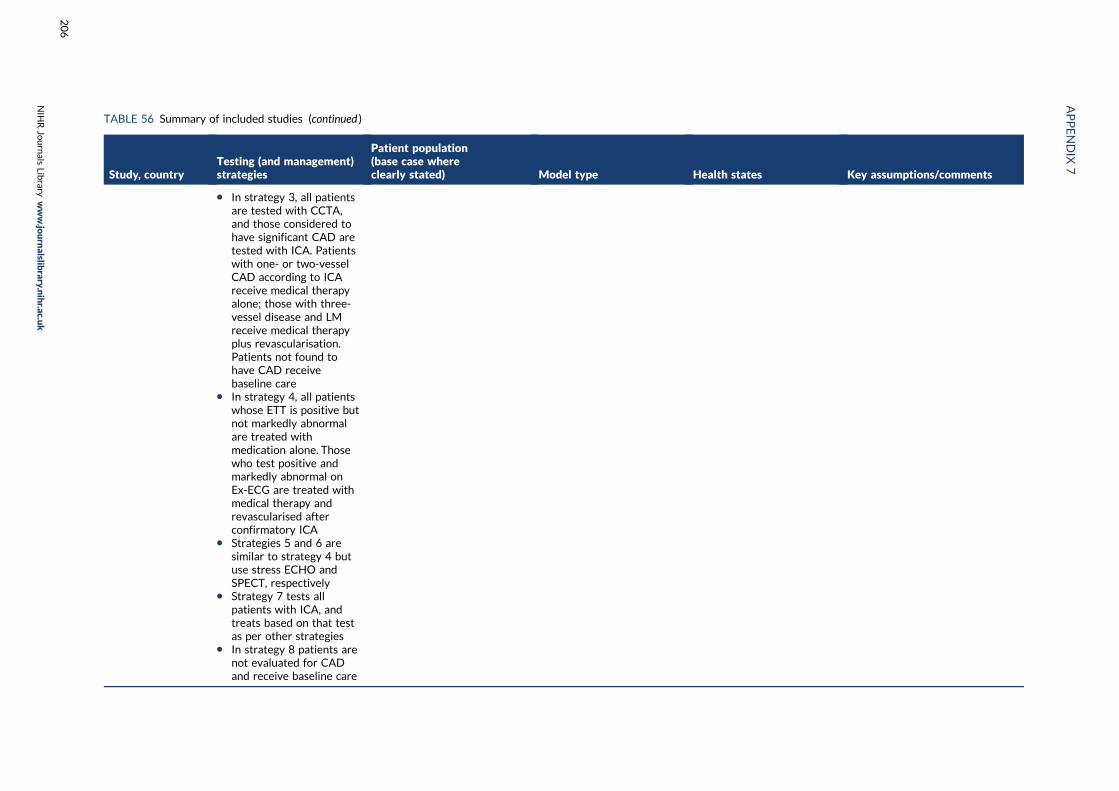
TABLE 56 Summary of included studies (continued )
Study, countryTesting (and management)strategies
Patient population(base case whereclearly stated) Model type Health states Key assumptions/comments
l In strategy 3, all patientsare tested with CCTA,and those considered tohave significant CAD aretested with ICA. Patientswith one- or two-vesselCAD according to ICAreceive medical therapyalone; those with three-vessel disease and LMreceive medical therapyplus revascularisation.Patients not found tohave CAD receivebaseline care
l In strategy 4, all patientswhose ETT is positive butnot markedly abnormalare treated withmedication alone. Thosewho test positive andmarkedly abnormal onEx-ECG are treated withmedical therapy andrevascularised afterconfirmatory ICA
l Strategies 5 and 6 aresimilar to strategy 4 butuse stress ECHO andSPECT, respectively
l Strategy 7 tests allpatients with ICA, andtreats based on that testas per other strategies
l In strategy 8 patients arenot evaluated for CADand receive baseline care
APPENDIX
7
NIH
RJournals
Library
www.jo
urnalslib
rary.nihr.ac.u
k
206
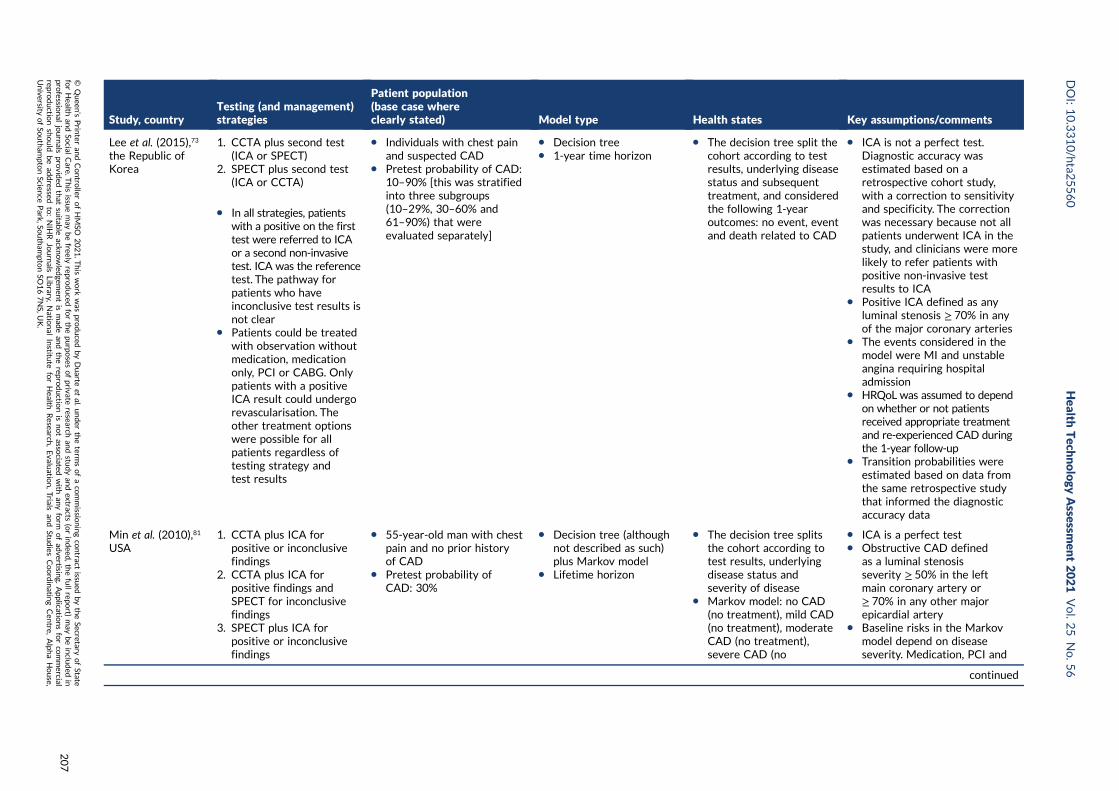
Study, countryTesting (and management)strategies
Patient population(base case whereclearly stated) Model type Health states Key assumptions/comments
Lee et al. (2015),73
the Republic ofKorea
1. CCTA plus second test(ICA or SPECT)
2. SPECT plus second test(ICA or CCTA)
l In all strategies, patientswith a positive on the firsttest were referred to ICAor a second non-invasivetest. ICA was the referencetest. The pathway forpatients who haveinconclusive test results isnot clear
l Patients could be treatedwith observation withoutmedication, medicationonly, PCI or CABG. Onlypatients with a positiveICA result could undergorevascularisation. Theother treatment optionswere possible for allpatients regardless oftesting strategy andtest results
l Individuals with chest painand suspected CAD
l Pretest probability of CAD:10–90% [this was stratifiedinto three subgroups(10–29%, 30–60% and61–90%) that wereevaluated separately]
l Decision treel 1-year time horizon
l The decision tree split thecohort according to testresults, underlying diseasestatus and subsequenttreatment, and consideredthe following 1-yearoutcomes: no event, eventand death related to CAD
l ICA is not a perfect test.Diagnostic accuracy wasestimated based on aretrospective cohort study,with a correction to sensitivityand specificity. The correctionwas necessary because not allpatients underwent ICA in thestudy, and clinicians were morelikely to refer patients withpositive non-invasive testresults to ICA
l Positive ICA defined as anyluminal stenosis ≥ 70% in anyof the major coronary arteries
l The events considered in themodel were MI and unstableangina requiring hospitaladmission
l HRQoL was assumed to dependon whether or not patientsreceived appropriate treatmentand re-experienced CAD duringthe 1-year follow-up
l Transition probabilities wereestimated based on data fromthe same retrospective studythat informed the diagnosticaccuracy data
Min et al. (2010),81
USA1. CCTA plus ICA for
positive or inconclusivefindings
2. CCTA plus ICA forpositive findings andSPECT for inconclusivefindings
3. SPECT plus ICA forpositive or inconclusivefindings
l 55-year-old man with chestpain and no prior historyof CAD
l Pretest probability ofCAD: 30%
l Decision tree (althoughnot described as such)plus Markov model
l Lifetime horizon
l The decision tree splitsthe cohort according totest results, underlyingdisease status andseverity of disease
l Markov model: no CAD(no treatment), mild CAD(no treatment), moderateCAD (no treatment),severe CAD (no
l ICA is a perfect testl Obstructive CAD defined
as a luminal stenosisseverity ≥ 50% in the leftmain coronary artery or≥ 70% in any other majorepicardial artery
l Baseline risks in the Markovmodel depend on diseaseseverity. Medication, PCI and
continued
DOI:10.3310/hta2
5560
Health
Tech
nology
Assessm
ent2021
Vol.2
5No.5
6
©Queen
’sPrin
teran
dContro
llerofHMSO
2021.T
his
work
was
produced
byDuarte
etal.
under
theterm
sofaco
mmissio
ningco
ntract
issued
bytheSecretary
ofState
forHealth
andSo
cialCare.T
his
issuemay
befreely
reproduced
forthepu
rposes
ofprivate
researchan
dstu
dyan
dextracts
(orindeed
,thefullrepo
rt)may
beinclu
ded
inpro
fessional
journals
provid
edthat
suitab
leackn
owled
gemen
tis
mad
ean
dtherepro
ductio
nis
notasso
ciatedwith
anyform
ofad
vertising.
Applicatio
nsforco
mmercial
reproductio
nshould
bead
dressed
to:NIH
RJournals
Library,
Natio
nal
Institu
teforHealth
Research
,Evalu
ation,Trials
and
Studies
Coordinatin
gCen
tre,Alph
aHouse,
University
ofSo
utham
ptonScien
cePark,So
utham
ptonSO
167NS,U
K.
207
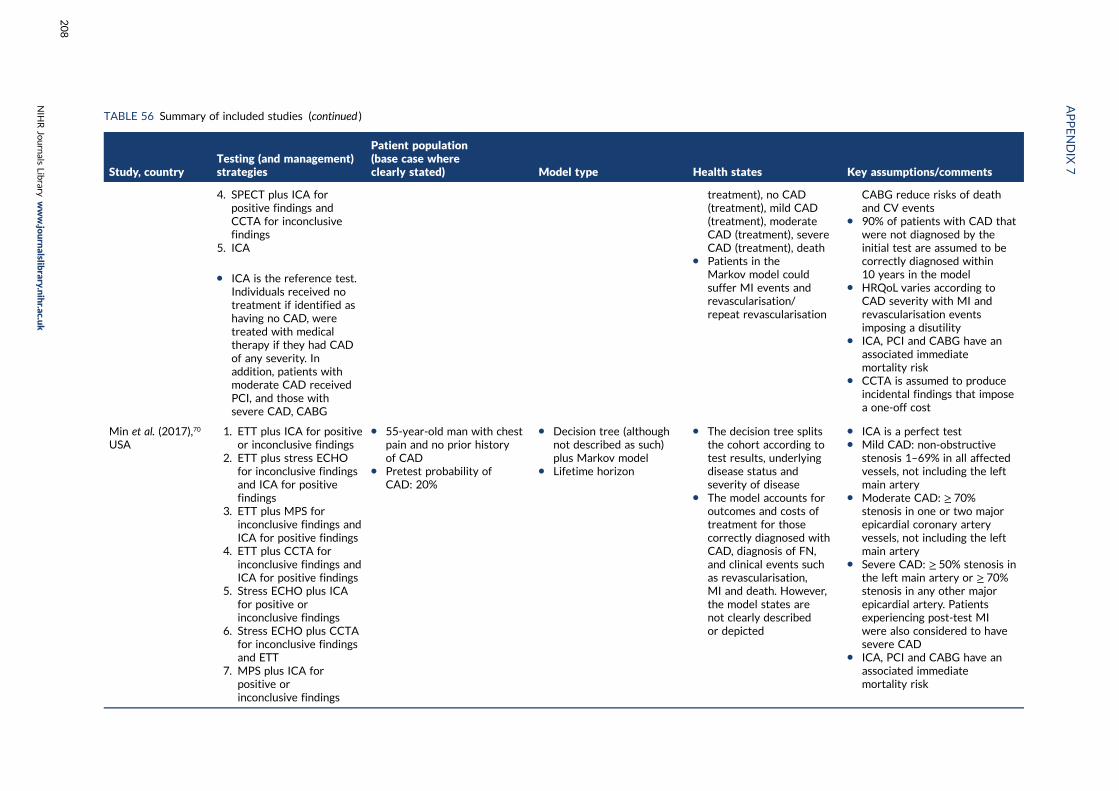
TABLE 56 Summary of included studies (continued )
Study, countryTesting (and management)strategies
Patient population(base case whereclearly stated) Model type Health states Key assumptions/comments
4. SPECT plus ICA forpositive findings andCCTA for inconclusivefindings
5. ICA
l ICA is the reference test.Individuals received notreatment if identified ashaving no CAD, weretreated with medicaltherapy if they had CADof any severity. Inaddition, patients withmoderate CAD receivedPCI, and those withsevere CAD, CABG
treatment), no CAD(treatment), mild CAD(treatment), moderateCAD (treatment), severeCAD (treatment), death
l Patients in theMarkov model couldsuffer MI events andrevascularisation/repeat revascularisation
CABG reduce risks of deathand CV events
l 90% of patients with CAD thatwere not diagnosed by theinitial test are assumed to becorrectly diagnosed within10 years in the model
l HRQoL varies according toCAD severity with MI andrevascularisation eventsimposing a disutility
l ICA, PCI and CABG have anassociated immediatemortality risk
l CCTA is assumed to produceincidental findings that imposea one-off cost
Min et al. (2017),70
USA1. ETT plus ICA for positive
or inconclusive findings2. ETT plus stress ECHO
for inconclusive findingsand ICA for positivefindings
3. ETT plus MPS forinconclusive findings andICA for positive findings
4. ETT plus CCTA forinconclusive findings andICA for positive findings
5. Stress ECHO plus ICAfor positive orinconclusive findings
6. Stress ECHO plus CCTAfor inconclusive findingsand ETT
7. MPS plus ICA forpositive orinconclusive findings
l 55-year-old man with chestpain and no prior historyof CAD
l Pretest probability ofCAD: 20%
l Decision tree (althoughnot described as such)plus Markov model
l Lifetime horizon
l The decision tree splitsthe cohort according totest results, underlyingdisease status andseverity of disease
l The model accounts foroutcomes and costs oftreatment for thosecorrectly diagnosed withCAD, diagnosis of FN,and clinical events suchas revascularisation,MI and death. However,the model states arenot clearly describedor depicted
l ICA is a perfect testl Mild CAD: non-obstructive
stenosis 1–69% in all affectedvessels, not including the leftmain artery
l Moderate CAD: ≥ 70%stenosis in one or two majorepicardial coronary arteryvessels, not including the leftmain artery
l Severe CAD: ≥ 50% stenosis inthe left main artery or ≥ 70%stenosis in any other majorepicardial artery. Patientsexperiencing post-test MIwere also considered to havesevere CAD
l ICA, PCI and CABG have anassociated immediatemortality risk
APPENDIX
7
NIH
RJournals
Library
www.jo
urnalslib
rary.nihr.ac.u
k
208
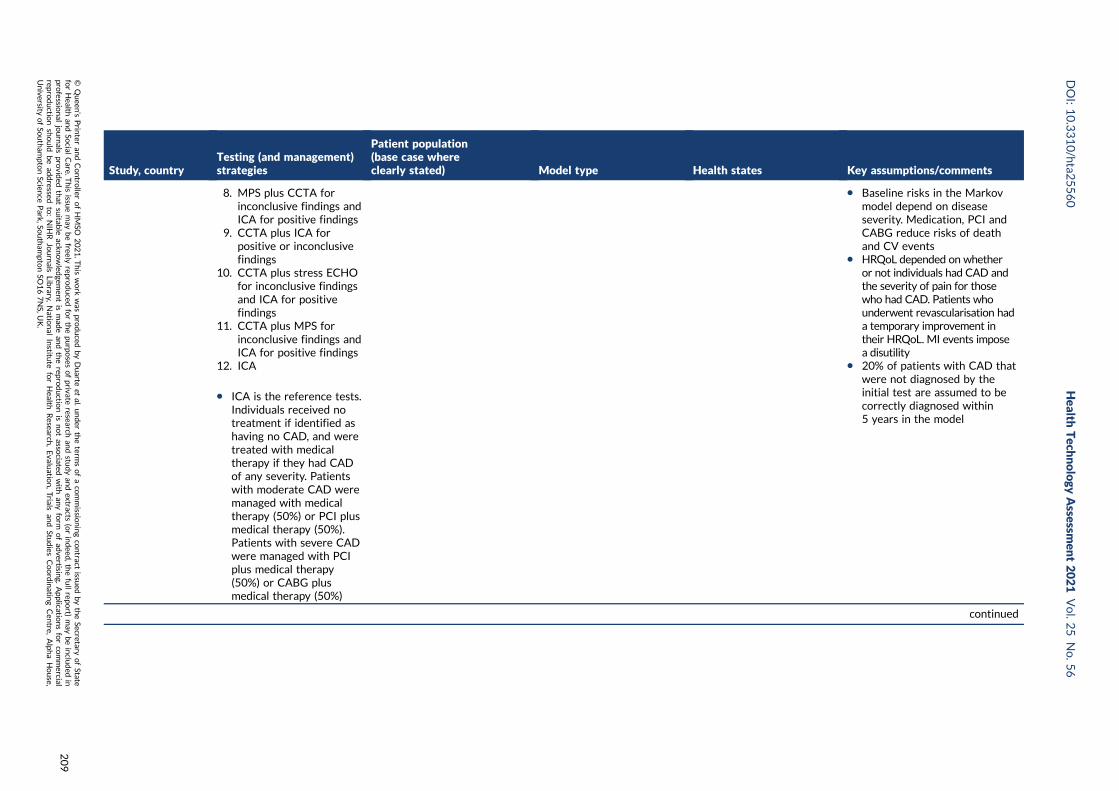
Study, countryTesting (and management)strategies
Patient population(base case whereclearly stated) Model type Health states Key assumptions/comments
8. MPS plus CCTA forinconclusive findings andICA for positive findings
9. CCTA plus ICA forpositive or inconclusivefindings
10. CCTA plus stress ECHOfor inconclusive findingsand ICA for positivefindings
11. CCTA plus MPS forinconclusive findings andICA for positive findings
12. ICA
l ICA is the reference tests.Individuals received notreatment if identified ashaving no CAD, and weretreated with medicaltherapy if they had CADof any severity. Patientswith moderate CAD weremanaged with medicaltherapy (50%) or PCI plusmedical therapy (50%).Patients with severe CADwere managed with PCIplus medical therapy(50%) or CABG plusmedical therapy (50%)
l Baseline risks in the Markovmodel depend on diseaseseverity. Medication, PCI andCABG reduce risks of deathand CV events
l HRQoL depended on whetheror not individuals had CAD andthe severity of pain for thosewho had CAD. Patients whounderwent revascularisation hada temporary improvement intheir HRQoL. MI events imposea disutility
l 20% of patients with CAD thatwere not diagnosed by theinitial test are assumed to becorrectly diagnosed within5 years in the model
continued
DOI:10.3310/hta2
5560
Health
Tech
nology
Assessm
ent2021
Vol.2
5No.5
6
©Queen
’sPrin
teran
dContro
llerofHMSO
2021.T
his
work
was
produced
byDuarte
etal.
under
theterm
sofaco
mmissio
ningco
ntract
issued
bytheSecretary
ofState
forHealth
andSo
cialCare.T
his
issuemay
befreely
reproduced
forthepu
rposes
ofprivate
researchan
dstu
dyan
dextracts
(orindeed
,thefullrepo
rt)may
beinclu
ded
inpro
fessional
journals
provid
edthat
suitab
leackn
owled
gemen
tis
mad
ean
dtherepro
ductio
nis
notasso
ciatedwith
anyform
ofad
vertising.
Applicatio
nsforco
mmercial
reproductio
nshould
bead
dressed
to:NIH
RJournals
Library,
Natio
nal
Institu
teforHealth
Research
,Evalu
ation,Trials
and
Studies
Coordinatin
gCen
tre,Alph
aHouse,
University
ofSo
utham
ptonScien
cePark,So
utham
ptonSO
167NS,U
K.
209
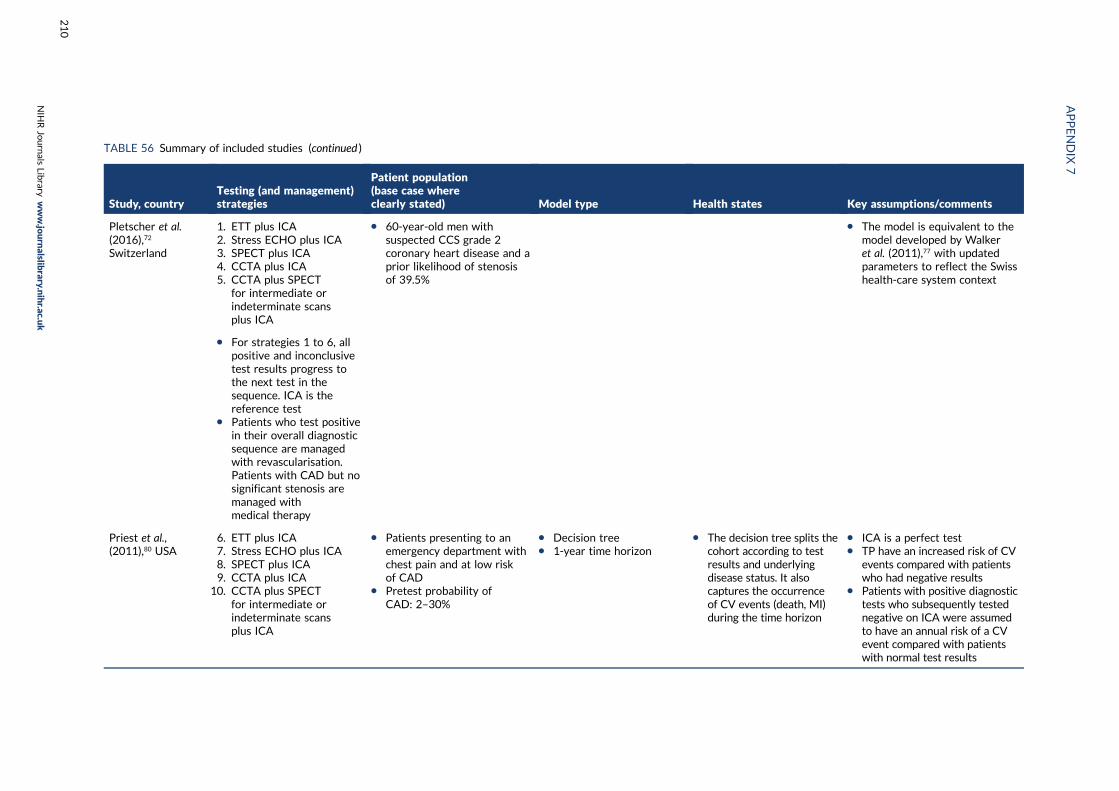
TABLE 56 Summary of included studies (continued )
Study, countryTesting (and management)strategies
Patient population(base case whereclearly stated) Model type Health states Key assumptions/comments
Pletscher et al.(2016),72
Switzerland
1. ETT plus ICA2. Stress ECHO plus ICA3. SPECT plus ICA4. CCTA plus ICA5. CCTA plus SPECT
for intermediate orindeterminate scansplus ICA
l 60-year-old men withsuspected CCS grade 2coronary heart disease and aprior likelihood of stenosisof 39.5%
l The model is equivalent to themodel developed by Walkeret al. (2011),77 with updatedparameters to reflect the Swisshealth-care system context
l For strategies 1 to 6, allpositive and inconclusivetest results progress tothe next test in thesequence. ICA is thereference test
l Patients who test positivein their overall diagnosticsequence are managedwith revascularisation.Patients with CAD but nosignificant stenosis aremanaged withmedical therapy
Priest et al.,(2011),80 USA
6. ETT plus ICA7. Stress ECHO plus ICA8. SPECT plus ICA9. CCTA plus ICA
10. CCTA plus SPECTfor intermediate orindeterminate scansplus ICA
l Patients presenting to anemergency department withchest pain and at low riskof CAD
l Pretest probability ofCAD: 2–30%
l Decision treel 1-year time horizon
l The decision tree splits thecohort according to testresults and underlyingdisease status. It alsocaptures the occurrenceof CV events (death, MI)during the time horizon
l ICA is a perfect testl TP have an increased risk of CV
events compared with patientswho had negative results
l Patients with positive diagnostictests who subsequently testednegative on ICA were assumedto have an annual risk of a CVevent compared with patientswith normal test results
APPENDIX
7
NIH
RJournals
Library
www.jo
urnalslib
rary.nihr.ac.u
k
210
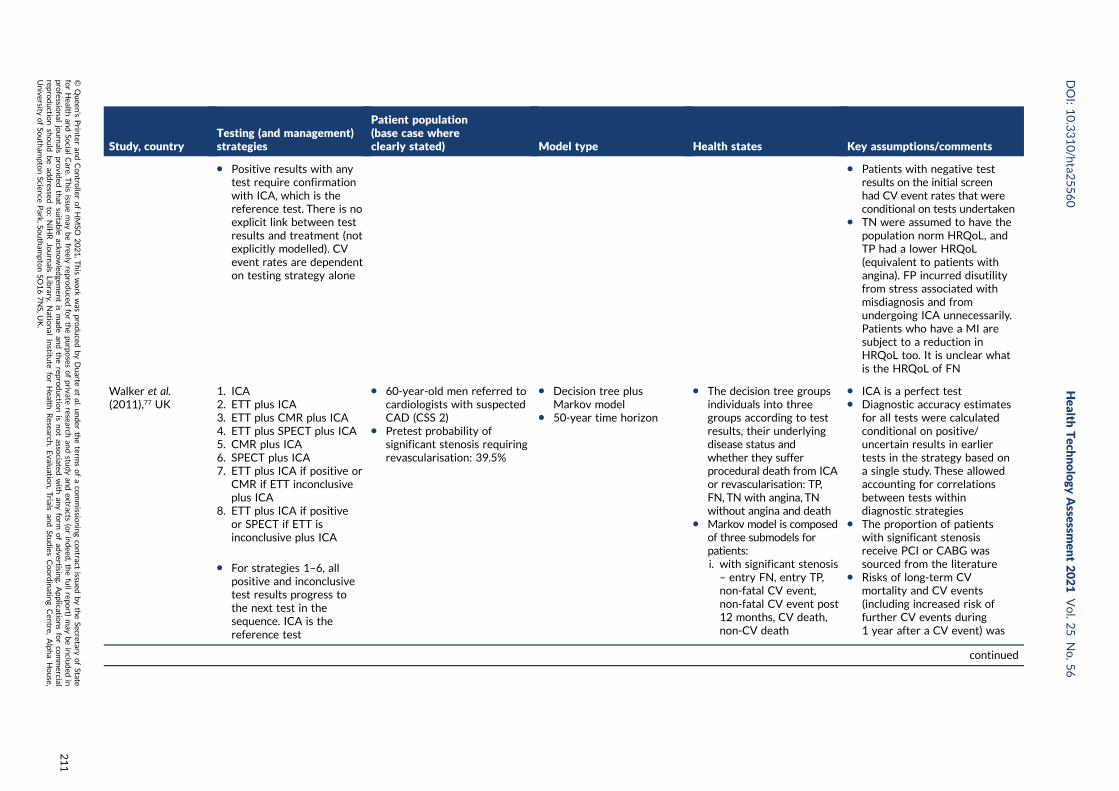
Study, countryTesting (and management)strategies
Patient population(base case whereclearly stated) Model type Health states Key assumptions/comments
l Positive results with anytest require confirmationwith ICA, which is thereference test. There is noexplicit link between testresults and treatment (notexplicitly modelled). CVevent rates are dependenton testing strategy alone
l Patients with negative testresults on the initial screenhad CV event rates that wereconditional on tests undertaken
l TN were assumed to have thepopulation norm HRQoL, andTP had a lower HRQoL(equivalent to patients withangina). FP incurred disutilityfrom stress associated withmisdiagnosis and fromundergoing ICA unnecessarily.Patients who have a MI aresubject to a reduction inHRQoL too. It is unclear whatis the HRQoL of FN
Walker et al.(2011),77 UK
1. ICA2. ETT plus ICA3. ETT plus CMR plus ICA4. ETT plus SPECT plus ICA5. CMR plus ICA6. SPECT plus ICA7. ETT plus ICA if positive or
CMR if ETT inconclusiveplus ICA
8. ETT plus ICA if positiveor SPECT if ETT isinconclusive plus ICA
l For strategies 1–6, allpositive and inconclusivetest results progress tothe next test in thesequence. ICA is thereference test
l 60-year-old men referred tocardiologists with suspectedCAD (CSS 2)
l Pretest probability ofsignificant stenosis requiringrevascularisation: 39.5%
l Decision tree plusMarkov model
l 50-year time horizon
l The decision tree groupsindividuals into threegroups according to testresults, their underlyingdisease status andwhether they sufferprocedural death from ICAor revascularisation: TP,FN, TN with angina, TNwithout angina and death
l Markov model is composedof three submodels forpatients:i. with significant stenosis– entry FN, entry TP,non-fatal CV event,non-fatal CV event post12 months, CV death,non-CV death
l ICA is a perfect testl Diagnostic accuracy estimates
for all tests were calculatedconditional on positive/uncertain results in earliertests in the strategy based ona single study. These allowedaccounting for correlationsbetween tests withindiagnostic strategies
l The proportion of patientswith significant stenosisreceive PCI or CABG wassourced from the literature
l Risks of long-term CVmortality and CV events(including increased risk offurther CV events during1 year after a CV event) was
continued
DOI:10.3310/hta2
5560
Health
Tech
nology
Assessm
ent2021
Vol.2
5No.5
6
©Queen
’sPrin
teran
dContro
llerofHMSO
2021.T
his
work
was
produced
byDuarte
etal.
under
theterm
sofaco
mmissio
ningco
ntract
issued
bytheSecretary
ofState
forHealth
andSo
cialCare.T
his
issuemay
befreely
reproduced
forthepu
rposes
ofprivate
researchan
dstu
dyan
dextracts
(orindeed
,thefullrepo
rt)may
beinclu
ded
inpro
fessional
journals
provid
edthat
suitab
leackn
owled
gemen
tis
mad
ean
dtherepro
ductio
nis
notasso
ciatedwith
anyform
ofad
vertising.
Applicatio
nsforco
mmercial
reproductio
nshould
bead
dressed
to:NIH
RJournals
Library,
Natio
nal
Institu
teforHealth
Research
,Evalu
ation,Trials
and
Studies
Coordinatin
gCen
tre,Alph
aHouse,
University
ofSo
utham
ptonScien
cePark,So
utham
ptonSO
167NS,U
K.
211
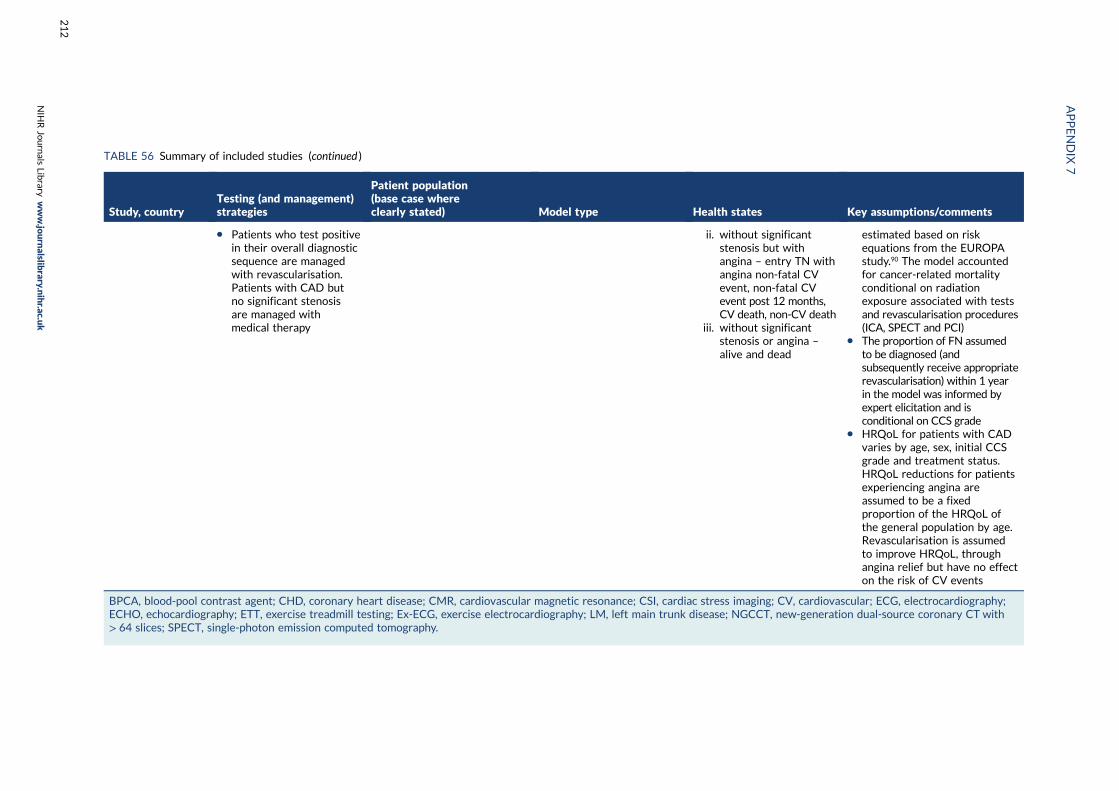
TABLE 56 Summary of included studies (continued )
Study, countryTesting (and management)strategies
Patient population(base case whereclearly stated) Model type Health states Key assumptions/comments
l Patients who test positivein their overall diagnosticsequence are managedwith revascularisation.Patients with CAD butno significant stenosisare managed withmedical therapy
ii. without significantstenosis but withangina – entry TN withangina non-fatal CVevent, non-fatal CVevent post 12 months,CV death, non-CV death
iii. without significantstenosis or angina –
alive and dead
estimated based on riskequations from the EUROPAstudy.90 The model accountedfor cancer-related mortalityconditional on radiationexposure associated with testsand revascularisation procedures(ICA, SPECT and PCI)
l The proportion of FN assumedto be diagnosed (andsubsequently receive appropriaterevascularisation) within 1 yearin the model was informed byexpert elicitation and isconditional on CCS grade
l HRQoL for patients with CADvaries by age, sex, initial CCSgrade and treatment status.HRQoL reductions for patientsexperiencing angina areassumed to be a fixedproportion of the HRQoL ofthe general population by age.Revascularisation is assumedto improve HRQoL, throughangina relief but have no effecton the risk of CV events
BPCA, blood-pool contrast agent; CHD, coronary heart disease; CMR, cardiovascular magnetic resonance; CSI, cardiac stress imaging; CV, cardiovascular; ECG, electrocardiography;ECHO, echocardiography; ETT, exercise treadmill testing; Ex-ECG, exercise electrocardiography; LM, left main trunk disease; NGCCT, new-generation dual-source coronary CT with> 64 slices; SPECT, single-photon emission computed tomography.
APPENDIX
7
NIH
RJournals
Library
www.jo
urnalslib
rary.nihr.ac.u
k
212
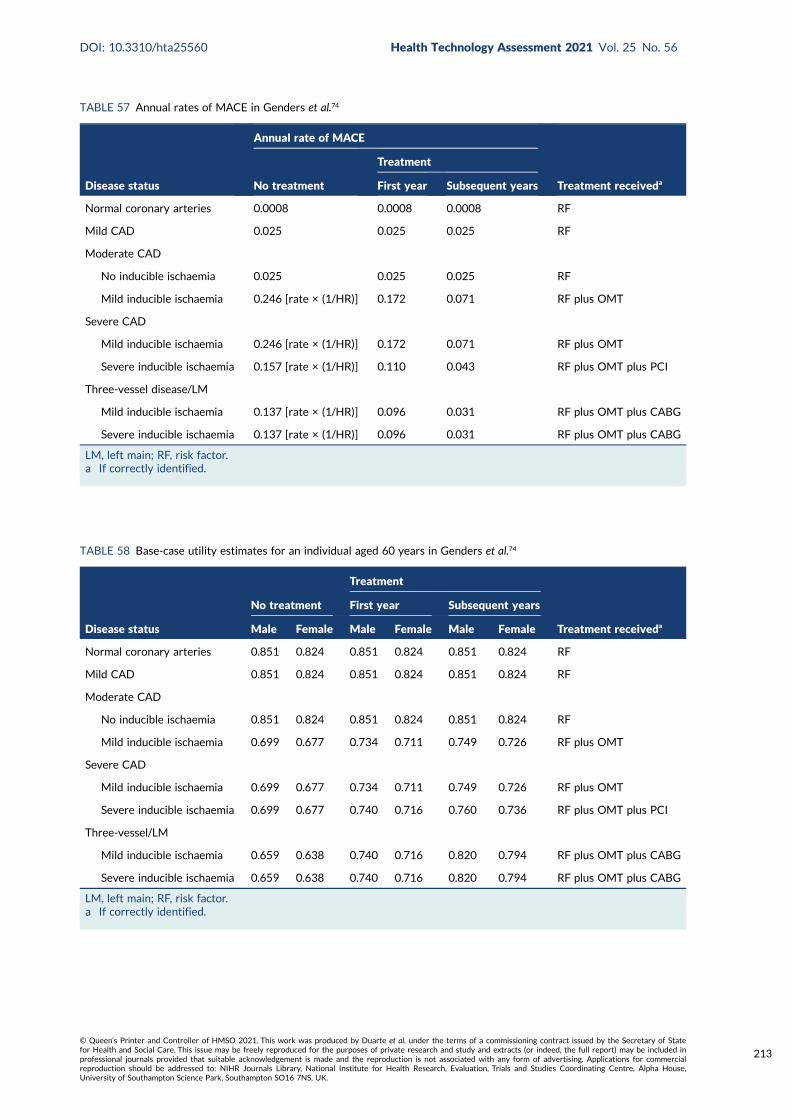
TABLE 57 Annual rates of MACE in Genders et al.74
Disease status
Annual rate of MACE
Treatment receivedaNo treatment
Treatment
First year Subsequent years
Normal coronary arteries 0.0008 0.0008 0.0008 RF
Mild CAD 0.025 0.025 0.025 RF
Moderate CAD
No inducible ischaemia 0.025 0.025 0.025 RF
Mild inducible ischaemia 0.246 [rate × (1/HR)] 0.172 0.071 RF plus OMT
Severe CAD
Mild inducible ischaemia 0.246 [rate × (1/HR)] 0.172 0.071 RF plus OMT
Severe inducible ischaemia 0.157 [rate × (1/HR)] 0.110 0.043 RF plus OMT plus PCI
Three-vessel disease/LM
Mild inducible ischaemia 0.137 [rate × (1/HR)] 0.096 0.031 RF plus OMT plus CABG
Severe inducible ischaemia 0.137 [rate × (1/HR)] 0.096 0.031 RF plus OMT plus CABG
LM, left main; RF, risk factor.a If correctly identified.
TABLE 58 Base-case utility estimates for an individual aged 60 years in Genders et al.74
Disease status
No treatment
Treatment
Treatment receiveda
First year Subsequent years
Male Female Male Female Male Female
Normal coronary arteries 0.851 0.824 0.851 0.824 0.851 0.824 RF
Mild CAD 0.851 0.824 0.851 0.824 0.851 0.824 RF
Moderate CAD
No inducible ischaemia 0.851 0.824 0.851 0.824 0.851 0.824 RF
Mild inducible ischaemia 0.699 0.677 0.734 0.711 0.749 0.726 RF plus OMT
Severe CAD
Mild inducible ischaemia 0.699 0.677 0.734 0.711 0.749 0.726 RF plus OMT
Severe inducible ischaemia 0.699 0.677 0.740 0.716 0.760 0.736 RF plus OMT plus PCI
Three-vessel/LM
Mild inducible ischaemia 0.659 0.638 0.740 0.716 0.820 0.794 RF plus OMT plus CABG
Severe inducible ischaemia 0.659 0.638 0.740 0.716 0.820 0.794 RF plus OMT plus CABG
LM, left main; RF, risk factor.a If correctly identified.
DOI: 10.3310/hta25560 Health Technology Assessment 2021 Vol. 25 No. 56
© Queen’s Printer and Controller of HMSO 2021. This work was produced by Duarte et al. under the terms of a commissioning contract issued by the Secretary of Statefor Health and Social Care. This issue may be freely reproduced for the purposes of private research and study and extracts (or indeed, the full report) may be included inprofessional journals provided that suitable acknowledgement is made and the reproduction is not associated with any form of advertising. Applications for commercialreproduction should be addressed to: NIHR Journals Library, National Institute for Health Research, Evaluation, Trials and Studies Coordinating Centre, Alpha House,University of Southampton Science Park, Southampton SO16 7NS, UK.
213
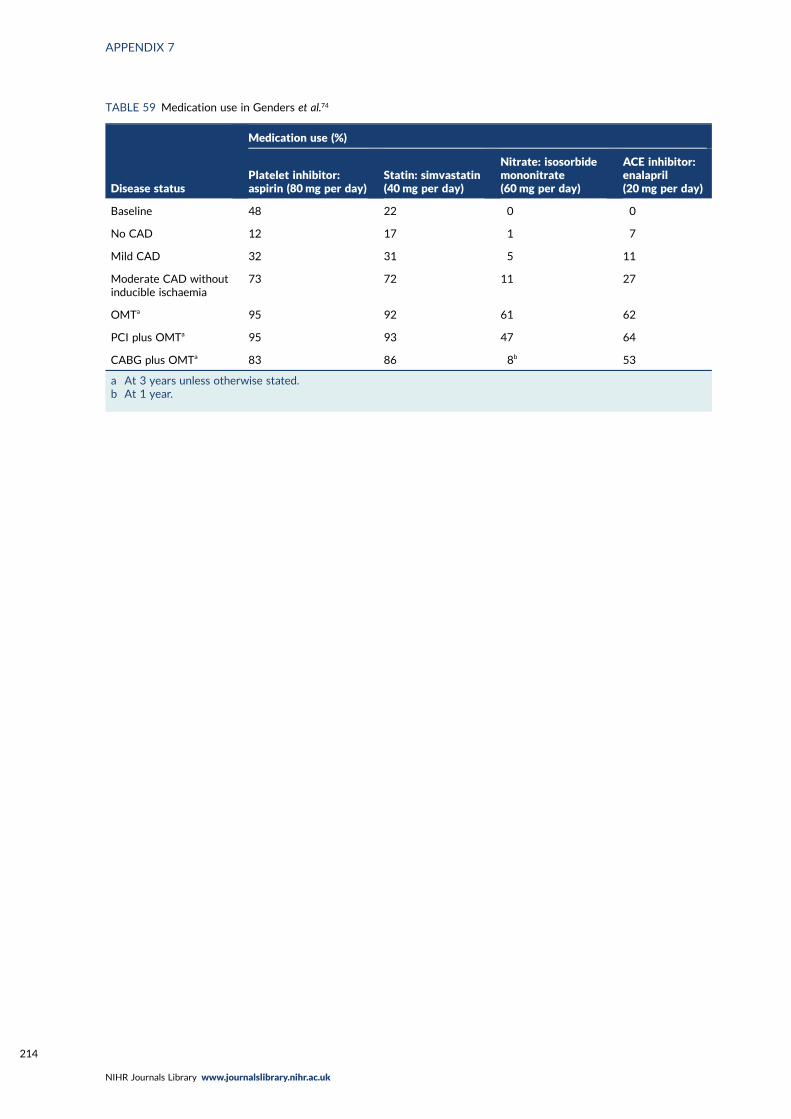
TABLE 59 Medication use in Genders et al.74
Disease status
Medication use (%)
Platelet inhibitor:aspirin (80mg per day)
Statin: simvastatin(40mg per day)
Nitrate: isosorbidemononitrate(60mg per day)
ACE inhibitor:enalapril(20 mg per day)
Baseline 48 22 0 0
No CAD 12 17 1 7
Mild CAD 32 31 5 11
Moderate CAD withoutinducible ischaemia
73 72 11 27
OMTa 95 92 61 62
PCI plus OMTa 95 93 47 64
CABG plus OMTa 83 86 8b 53
a At 3 years unless otherwise stated.b At 1 year.
APPENDIX 7
NIHR Journals Library www.journalslibrary.nihr.ac.uk
214
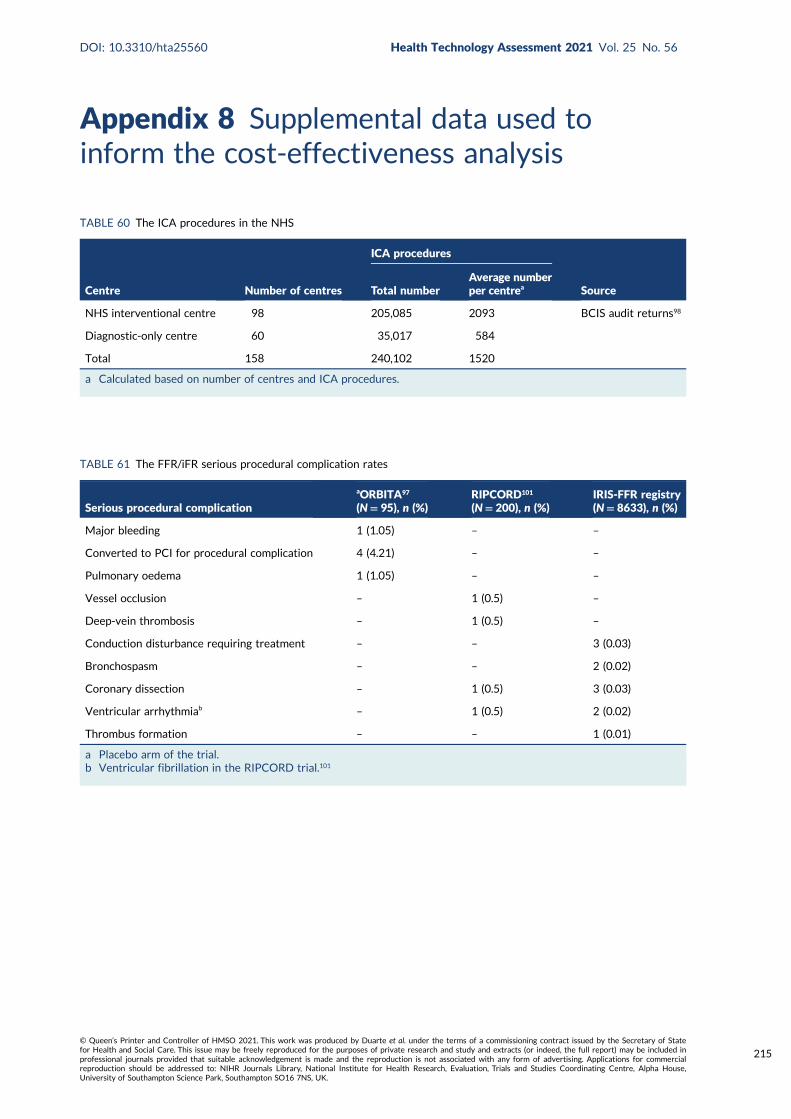
Appendix 8 Supplemental data used toinform the cost-effectiveness analysis
TABLE 60 The ICA procedures in the NHS
Centre Number of centres
ICA procedures
SourceTotal numberAverage numberper centrea
NHS interventional centre 98 205,085 2093 BCIS audit returns98
Diagnostic-only centre 60 35,017 584
Total 158 240,102 1520
a Calculated based on number of centres and ICA procedures.
TABLE 61 The FFR/iFR serious procedural complication rates
Serious procedural complication
aORBITA97
(N= 95), n (%)RIPCORD101
(N= 200), n (%)IRIS-FFR registry(N= 8633), n (%)
Major bleeding 1 (1.05) – –
Converted to PCI for procedural complication 4 (4.21) – –
Pulmonary oedema 1 (1.05) – –
Vessel occlusion – 1 (0.5) –
Deep-vein thrombosis – 1 (0.5) –
Conduction disturbance requiring treatment – – 3 (0.03)
Bronchospasm – – 2 (0.02)
Coronary dissection – 1 (0.5) 3 (0.03)
Ventricular arrhythmiab – 1 (0.5) 2 (0.02)
Thrombus formation – – 1 (0.01)
a Placebo arm of the trial.b Ventricular fibrillation in the RIPCORD trial.101
DOI: 10.3310/hta25560 Health Technology Assessment 2021 Vol. 25 No. 56
© Queen’s Printer and Controller of HMSO 2021. This work was produced by Duarte et al. under the terms of a commissioning contract issued by the Secretary of Statefor Health and Social Care. This issue may be freely reproduced for the purposes of private research and study and extracts (or indeed, the full report) may be included inprofessional journals provided that suitable acknowledgement is made and the reproduction is not associated with any form of advertising. Applications for commercialreproduction should be addressed to: NIHR Journals Library, National Institute for Health Research, Evaluation, Trials and Studies Coordinating Centre, Alpha House,University of Southampton Science Park, Southampton SO16 7NS, UK.
215
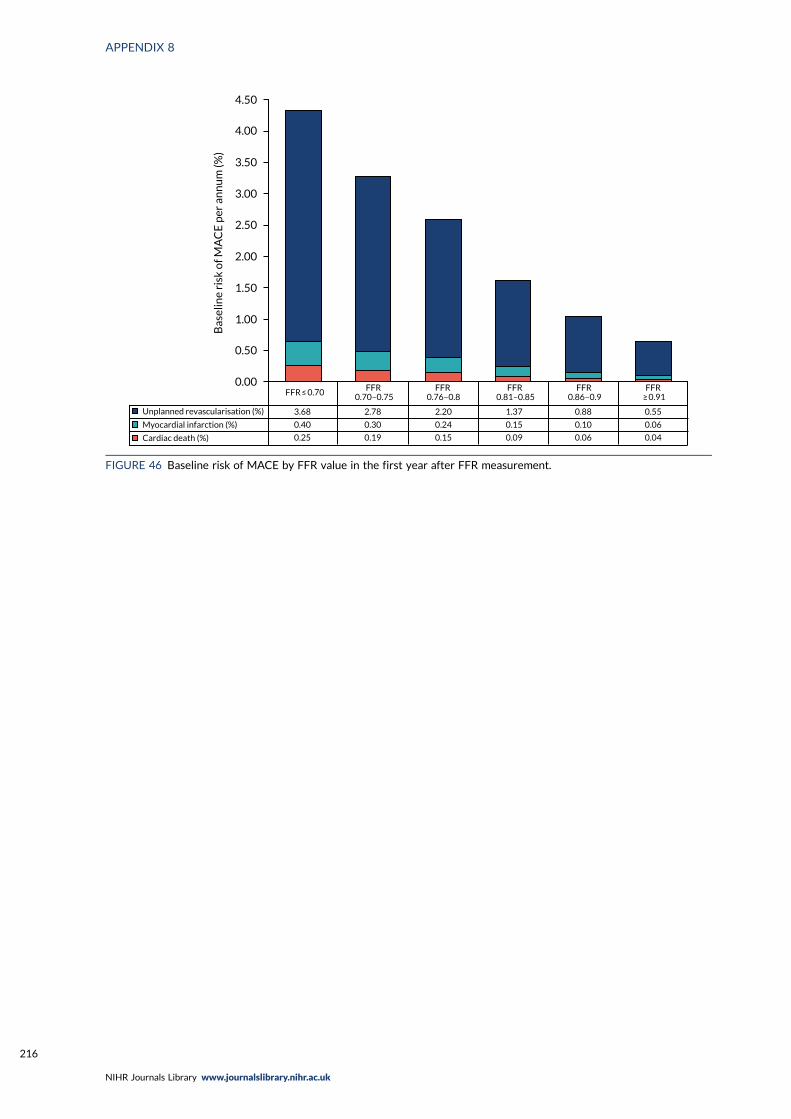
4.50
4.00
3.50
3.00
2.50
2.00
1.50
1.00
0.50
0.00
Bas
elin
e ri
sk o
f MA
CE
per
an
nu
m (%
)
Unplanned revascularisation (%)
Myocardial infarction (%)
Cardiac death (%)
3.68
0.40
0.25
2.78
0.30
0.19
2.20
0.24
0.15
1.37
0.15
0.09
0.88
0.10
0.06
0.55
0.06
0.04
FFR ≤ 0.70 FFR0.70–0.75
FFR0.76–0.8
FFR0.81–0.85
FFR0.86–0.9
FFR≥�0.91
FIGURE 46 Baseline risk of MACE by FFR value in the first year after FFR measurement.
APPENDIX 8
NIHR Journals Library www.journalslibrary.nihr.ac.uk
216
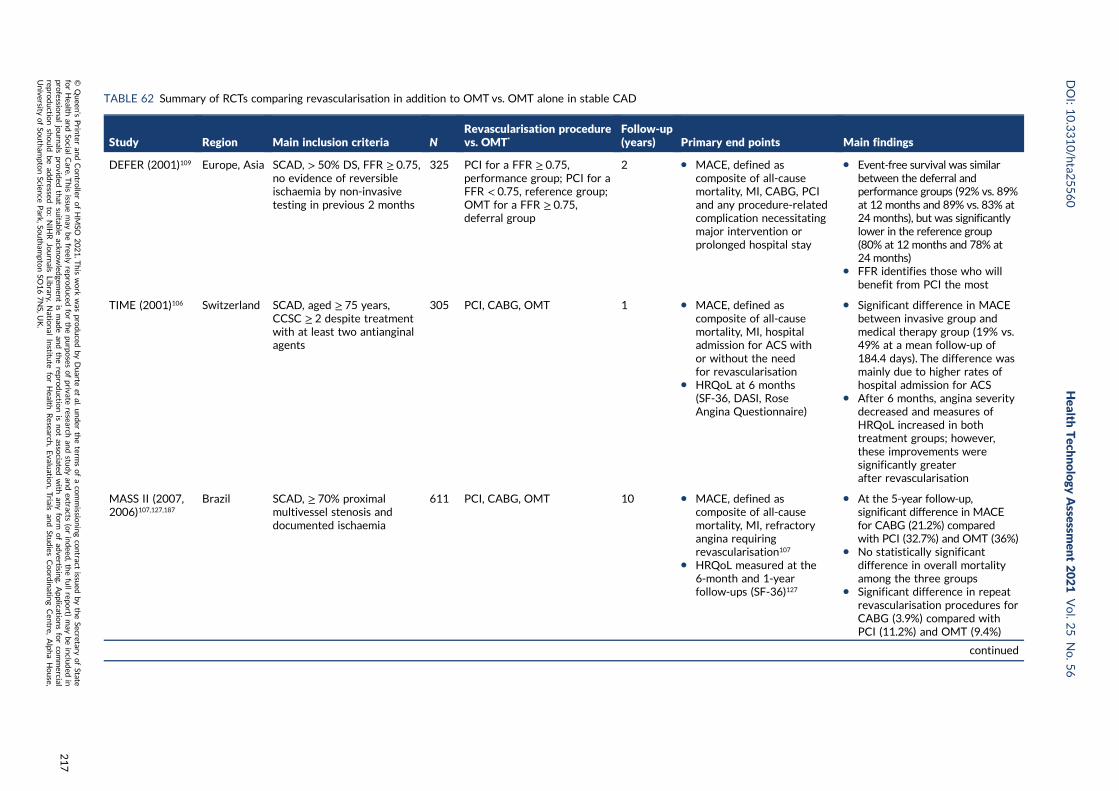
TABLE 62 Summary of RCTs comparing revascularisation in addition to OMT vs. OMT alone in stable CAD
Study Region Main inclusion criteria NRevascularisation procedurevs. OMT*
Follow-up(years) Primary end points Main findings
DEFER (2001)109 Europe, Asia SCAD, > 50% DS, FFR ≥ 0.75,no evidence of reversibleischaemia by non-invasivetesting in previous 2 months
325 PCI for a FFR ≥ 0.75,performance group; PCI for aFFR < 0.75, reference group;OMT for a FFR ≥ 0.75,deferral group
2 l MACE, defined ascomposite of all-causemortality, MI, CABG, PCIand any procedure-relatedcomplication necessitatingmajor intervention orprolonged hospital stay
l Event-free survival was similarbetween the deferral andperformance groups (92% vs. 89%at 12 months and 89% vs. 83% at24 months), but was significantlylower in the reference group(80% at 12 months and 78% at24 months)
l FFR identifies those who willbenefit from PCI the most
TIME (2001)106 Switzerland SCAD, aged ≥ 75 years,CCSC ≥ 2 despite treatmentwith at least two antianginalagents
305 PCI, CABG, OMT 1 l MACE, defined ascomposite of all-causemortality, MI, hospitaladmission for ACS withor without the needfor revascularisation
l HRQoL at 6 months(SF-36, DASI, RoseAngina Questionnaire)
l Significant difference in MACEbetween invasive group andmedical therapy group (19% vs.49% at a mean follow-up of184.4 days). The difference wasmainly due to higher rates ofhospital admission for ACS
l After 6 months, angina severitydecreased and measures ofHRQoL increased in bothtreatment groups; however,these improvements weresignificantly greaterafter revascularisation
MASS II (2007,2006)107,127,187
Brazil SCAD, ≥ 70% proximalmultivessel stenosis anddocumented ischaemia
611 PCI, CABG, OMT 10 l MACE, defined ascomposite of all-causemortality, MI, refractoryangina requiringrevascularisation107
l HRQoL measured at the6-month and 1-yearfollow-ups (SF-36)127
l At the 5-year follow-up,significant difference in MACEfor CABG (21.2%) comparedwith PCI (32.7%) and OMT (36%)
l No statistically significantdifference in overall mortalityamong the three groups
l Significant difference in repeatrevascularisation procedures forCABG (3.9%) compared withPCI (11.2%) and OMT (9.4%)
continued
DOI:10.3310/hta2
5560
Health
Tech
nology
Assessm
ent2021
Vol.2
5No.5
6
©Queen
’sPrin
teran
dContro
llerofHMSO
2021.T
his
work
was
produced
byDuarte
etal.
under
theterm
sofaco
mmissio
ningco
ntract
issued
bytheSecretary
ofState
forHealth
andSo
cialCare.T
his
issuemay
befreely
reproduced
forthepu
rposes
ofprivate
researchan
dstu
dyan
dextracts
(orindeed
,thefullrepo
rt)may
beinclu
ded
inpro
fessional
journals
provid
edthat
suitab
leackn
owled
gemen
tis
mad
ean
dtherepro
ductio
nis
notasso
ciatedwith
anyform
ofad
vertising.
Applicatio
nsforco
mmercial
reproductio
nshould
bead
dressed
to:NIH
RJournals
Library,
Natio
nal
Institu
teforHealth
Research
,Evalu
ation,Trials
and
Studies
Coordinatin
gCen
tre,Alph
aHouse,
University
ofSo
utham
ptonScien
cePark,So
utham
ptonSO
167NS,U
K.
217
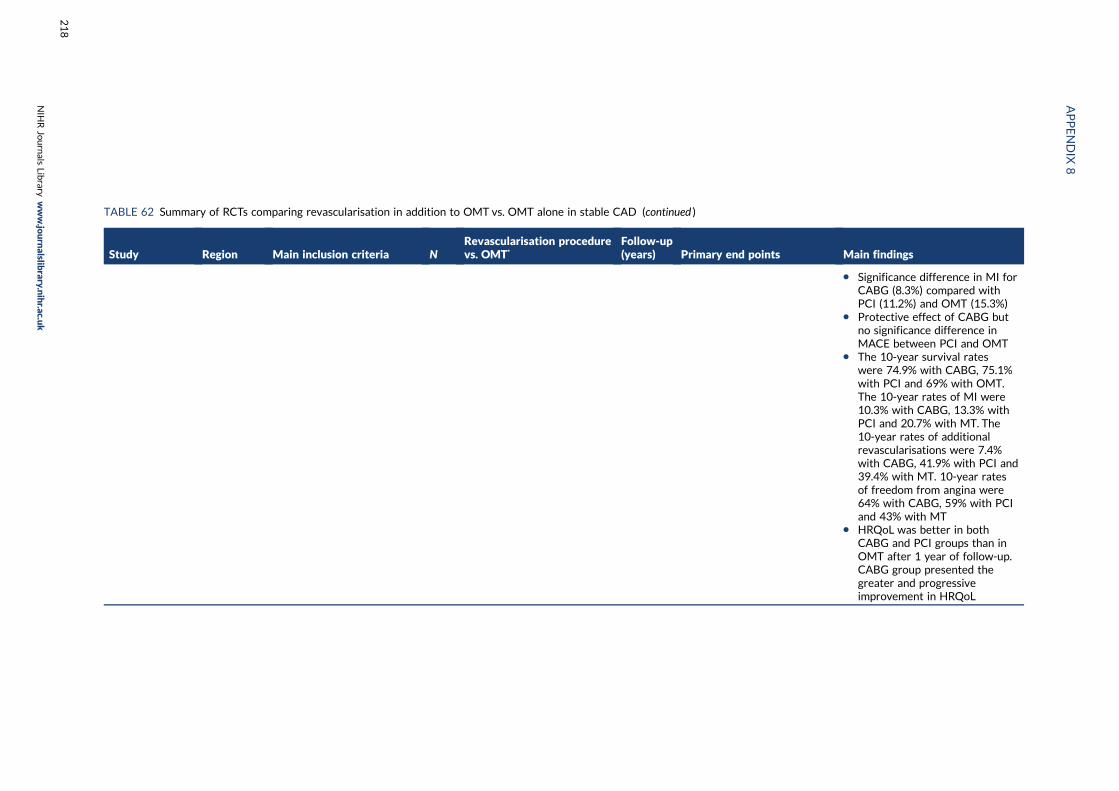
TABLE 62 Summary of RCTs comparing revascularisation in addition to OMT vs. OMT alone in stable CAD (continued )
Study Region Main inclusion criteria NRevascularisation procedurevs. OMT*
Follow-up(years) Primary end points Main findings
l Significance difference in MI forCABG (8.3%) compared withPCI (11.2%) and OMT (15.3%)
l Protective effect of CABG butno significance difference inMACE between PCI and OMT
l The 10-year survival rateswere 74.9% with CABG, 75.1%with PCI and 69% with OMT.The 10-year rates of MI were10.3% with CABG, 13.3% withPCI and 20.7% with MT. The10-year rates of additionalrevascularisations were 7.4%with CABG, 41.9% with PCI and39.4% with MT. 10-year ratesof freedom from angina were64% with CABG, 59% with PCIand 43% with MT
l HRQoL was better in bothCABG and PCI groups than inOMT after 1 year of follow-up.CABG group presented thegreater and progressiveimprovement in HRQoL
APPENDIX
8
NIH
RJournals
Library
www.jo
urnalslib
rary.nihr.ac.u
k
218
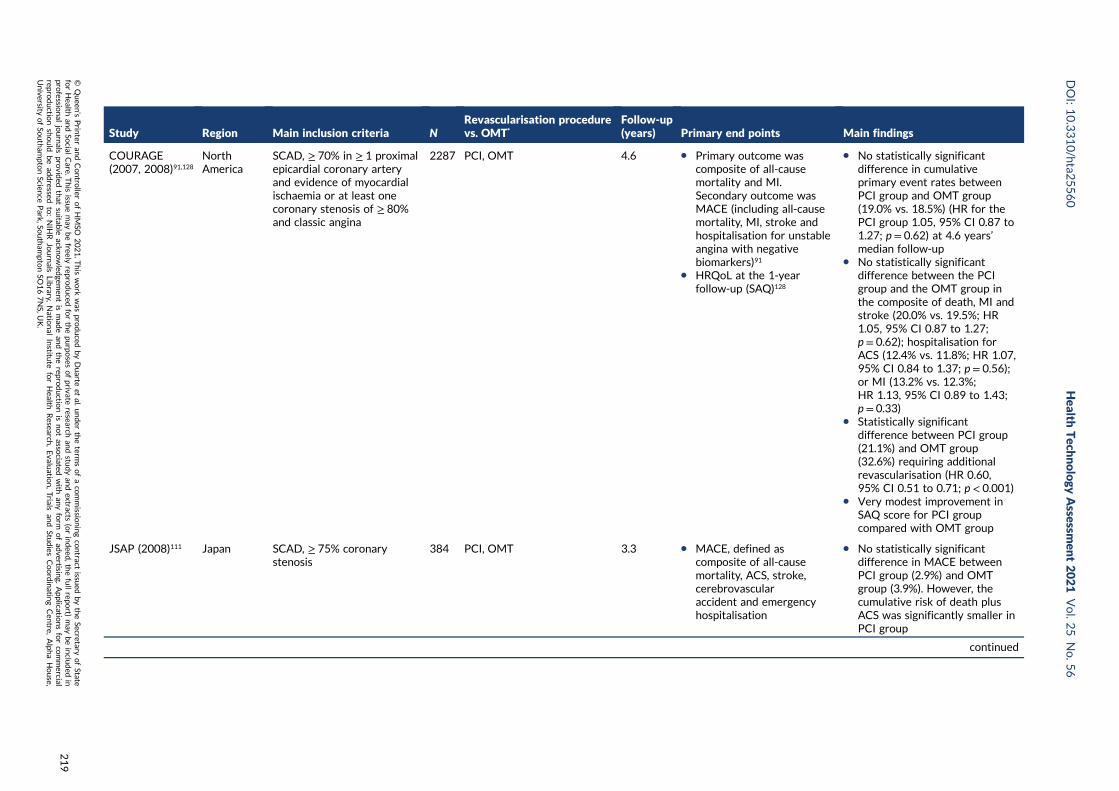
Study Region Main inclusion criteria NRevascularisation procedurevs. OMT*
Follow-up(years) Primary end points Main findings
COURAGE(2007, 2008)91,128
NorthAmerica
SCAD, ≥ 70% in ≥ 1 proximalepicardial coronary arteryand evidence of myocardialischaemia or at least onecoronary stenosis of ≥ 80%and classic angina
2287 PCI, OMT 4.6 l Primary outcome wascomposite of all-causemortality and MI.Secondary outcome wasMACE (including all-causemortality, MI, stroke andhospitalisation for unstableangina with negativebiomarkers)91
l HRQoL at the 1-yearfollow-up (SAQ)128
l No statistically significantdifference in cumulativeprimary event rates betweenPCI group and OMT group(19.0% vs. 18.5%) (HR for thePCI group 1.05, 95% CI 0.87 to1.27; p = 0.62) at 4.6 years’median follow-up
l No statistically significantdifference between the PCIgroup and the OMT group inthe composite of death, MI andstroke (20.0% vs. 19.5%; HR1.05, 95% CI 0.87 to 1.27;p = 0.62); hospitalisation forACS (12.4% vs. 11.8%; HR 1.07,95% CI 0.84 to 1.37; p = 0.56);or MI (13.2% vs. 12.3%;HR 1.13, 95% CI 0.89 to 1.43;p = 0.33)
l Statistically significantdifference between PCI group(21.1%) and OMT group(32.6%) requiring additionalrevascularisation (HR 0.60,95% CI 0.51 to 0.71; p < 0.001)
l Very modest improvement inSAQ score for PCI groupcompared with OMT group
JSAP (2008)111 Japan SCAD, ≥ 75% coronarystenosis
384 PCI, OMT 3.3 l MACE, defined ascomposite of all-causemortality, ACS, stroke,cerebrovascularaccident and emergencyhospitalisation
l No statistically significantdifference in MACE betweenPCI group (2.9%) and OMTgroup (3.9%). However, thecumulative risk of death plusACS was significantly smaller inPCI group
continued
DOI:10.3310/hta2
5560
Health
Tech
nology
Assessm
ent2021
Vol.2
5No.5
6
©Queen
’sPrin
teran
dContro
llerofHMSO
2021.T
his
work
was
produced
byDuarte
etal.
under
theterm
sofaco
mmissio
ningco
ntract
issued
bytheSecretary
ofState
forHealth
andSo
cialCare.T
his
issuemay
befreely
reproduced
forthepu
rposes
ofprivate
researchan
dstu
dyan
dextracts
(orindeed
,thefullrepo
rt)may
beinclu
ded
inpro
fessional
journals
provid
edthat
suitab
leackn
owled
gemen
tis
mad
ean
dtherepro
ductio
nis
notasso
ciatedwith
anyform
ofad
vertising.
Applicatio
nsforco
mmercial
reproductio
nshould
bead
dressed
to:NIH
RJournals
Library,
Natio
nal
Institu
teforHealth
Research
,Evalu
ation,Trials
and
Studies
Coordinatin
gCen
tre,Alph
aHouse,
University
ofSo
utham
ptonScien
cePark,So
utham
ptonSO
167NS,U
K.
219
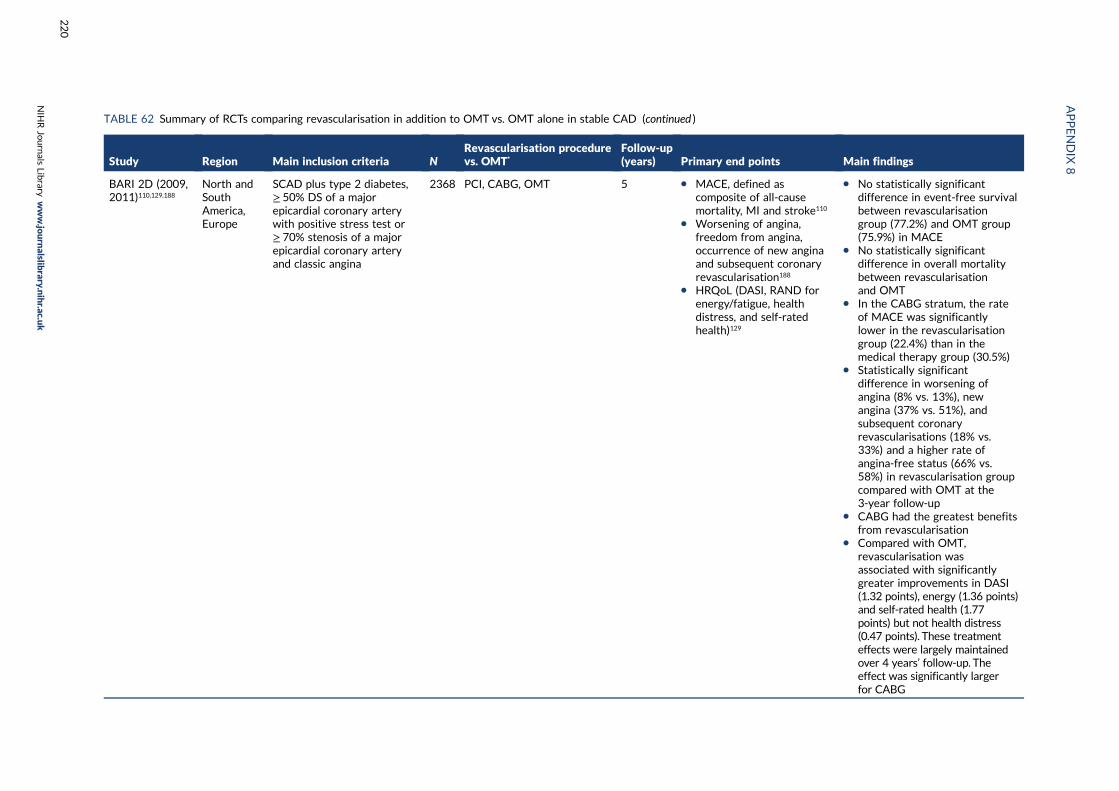
TABLE 62 Summary of RCTs comparing revascularisation in addition to OMT vs. OMT alone in stable CAD (continued )
Study Region Main inclusion criteria NRevascularisation procedurevs. OMT*
Follow-up(years) Primary end points Main findings
BARI 2D (2009,2011)110,129,188
North andSouthAmerica,Europe
SCAD plus type 2 diabetes,≥ 50% DS of a majorepicardial coronary arterywith positive stress test or≥ 70% stenosis of a majorepicardial coronary arteryand classic angina
2368 PCI, CABG, OMT 5 l MACE, defined ascomposite of all-causemortality, MI and stroke110
l Worsening of angina,freedom from angina,occurrence of new anginaand subsequent coronaryrevascularisation188
l HRQoL (DASI, RAND forenergy/fatigue, healthdistress, and self-ratedhealth)129
l No statistically significantdifference in event-free survivalbetween revascularisationgroup (77.2%) and OMT group(75.9%) in MACE
l No statistically significantdifference in overall mortalitybetween revascularisationand OMT
l In the CABG stratum, the rateof MACE was significantlylower in the revascularisationgroup (22.4%) than in themedical therapy group (30.5%)
l Statistically significantdifference in worsening ofangina (8% vs. 13%), newangina (37% vs. 51%), andsubsequent coronaryrevascularisations (18% vs.33%) and a higher rate ofangina-free status (66% vs.58%) in revascularisation groupcompared with OMT at the3-year follow-up
l CABG had the greatest benefitsfrom revascularisation
l Compared with OMT,revascularisation wasassociated with significantlygreater improvements in DASI(1.32 points), energy (1.36 points)and self-rated health (1.77points) but not health distress(0.47 points). These treatmenteffects were largely maintainedover 4 years’ follow-up. Theeffect was significantly largerfor CABG
APPENDIX
8
NIH
RJournals
Library
www.jo
urnalslib
rary.nihr.ac.u
k
220
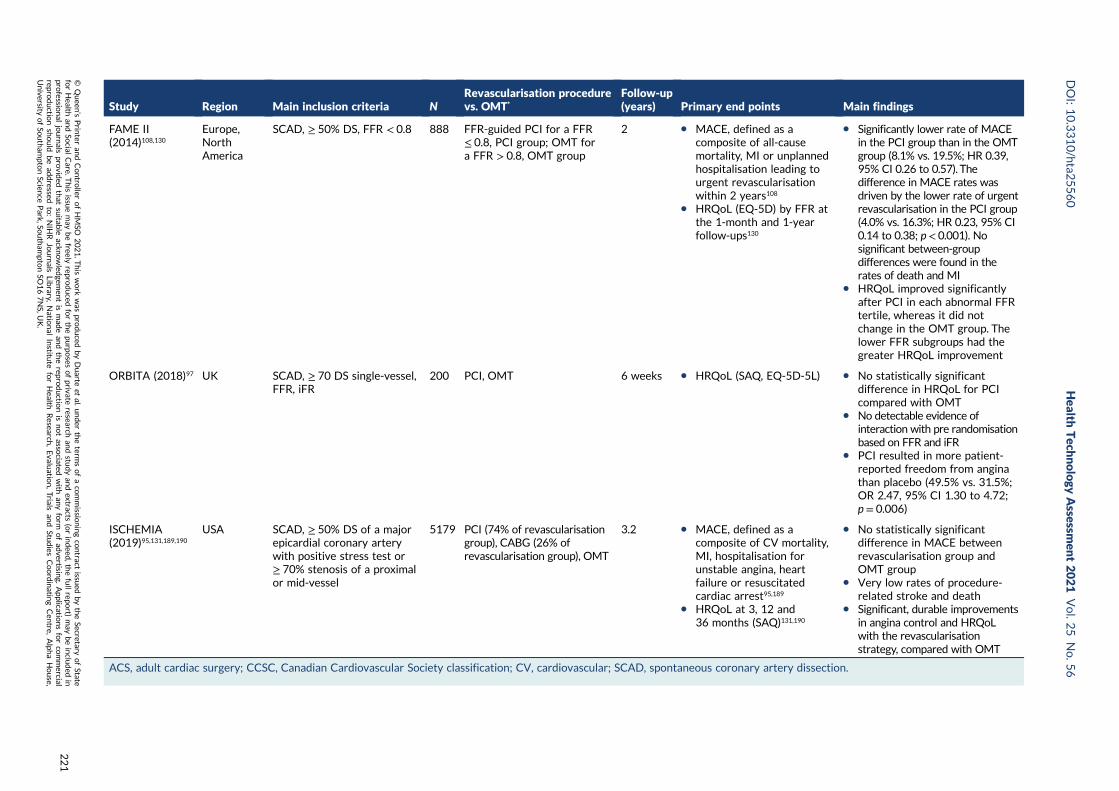
Study Region Main inclusion criteria NRevascularisation procedurevs. OMT*
Follow-up(years) Primary end points Main findings
FAME II(2014)108,130
Europe,NorthAmerica
SCAD, ≥ 50% DS, FFR < 0.8 888 FFR-guided PCI for a FFR≤ 0.8, PCI group; OMT fora FFR > 0.8, OMT group
2 l MACE, defined as acomposite of all-causemortality, MI or unplannedhospitalisation leading tourgent revascularisationwithin 2 years108
l HRQoL (EQ-5D) by FFR atthe 1-month and 1-yearfollow-ups130
l Significantly lower rate of MACEin the PCI group than in the OMTgroup (8.1% vs. 19.5%; HR 0.39,95% CI 0.26 to 0.57). Thedifference in MACE rates wasdriven by the lower rate of urgentrevascularisation in the PCI group(4.0% vs. 16.3%; HR 0.23, 95% CI0.14 to 0.38; p< 0.001). Nosignificant between-groupdifferences were found in therates of death and MI
l HRQoL improved significantlyafter PCI in each abnormal FFRtertile, whereas it did notchange in the OMT group. Thelower FFR subgroups had thegreater HRQoL improvement
ORBITA (2018)97 UK SCAD, ≥ 70 DS single-vessel,FFR, iFR
200 PCI, OMT 6 weeks l HRQoL (SAQ, EQ-5D-5L) l No statistically significantdifference in HRQoL for PCIcompared with OMT
l No detectable evidence ofinteraction with pre randomisationbased on FFR and iFR
l PCI resulted in more patient-reported freedom from anginathan placebo (49.5% vs. 31.5%;OR 2.47, 95% CI 1.30 to 4.72;p = 0.006)
ISCHEMIA(2019)95,131,189,190
USA SCAD, ≥ 50% DS of a majorepicardial coronary arterywith positive stress test or≥ 70% stenosis of a proximalor mid-vessel
5179 PCI (74% of revascularisationgroup), CABG (26% ofrevascularisation group), OMT
3.2 l MACE, defined as acomposite of CV mortality,MI, hospitalisation forunstable angina, heartfailure or resuscitatedcardiac arrest95,189
l HRQoL at 3, 12 and36 months (SAQ)131,190
l No statistically significantdifference in MACE betweenrevascularisation group andOMT group
l Very low rates of procedure-related stroke and death
l Significant, durable improvementsin angina control and HRQoLwith the revascularisationstrategy, compared with OMT
ACS, adult cardiac surgery; CCSC, Canadian Cardiovascular Society classification; CV, cardiovascular; SCAD, spontaneous coronary artery dissection.
DOI:10.3310/hta2
5560
Health
Tech
nology
Assessm
ent2021
Vol.2
5No.5
6
©Queen
’sPrin
teran
dContro
llerofHMSO
2021.T
his
work
was
produced
byDuarte
etal.
under
theterm
sofaco
mmissio
ningco
ntract
issued
bytheSecretary
ofState
forHealth
andSo
cialCare.T
his
issuemay
befreely
reproduced
forthepu
rposes
ofprivate
researchan
dstu
dyan
dextracts
(orindeed
,thefullrepo
rt)may
beinclu
ded
inpro
fessional
journals
provid
edthat
suitab
leackn
owled
gemen
tis
mad
ean
dtherepro
ductio
nis
notasso
ciatedwith
anyform
ofad
vertising.
Applicatio
nsforco
mmercial
reproductio
nshould
bead
dressed
to:NIH
RJournals
Library,
Natio
nal
Institu
teforHealth
Research
,Evalu
ation,Trials
and
Studies
Coordinatin
gCen
tre,Alph
aHouse,
University
ofSo
utham
ptonScien
cePark,So
utham
ptonSO
167NS,U
K.
221
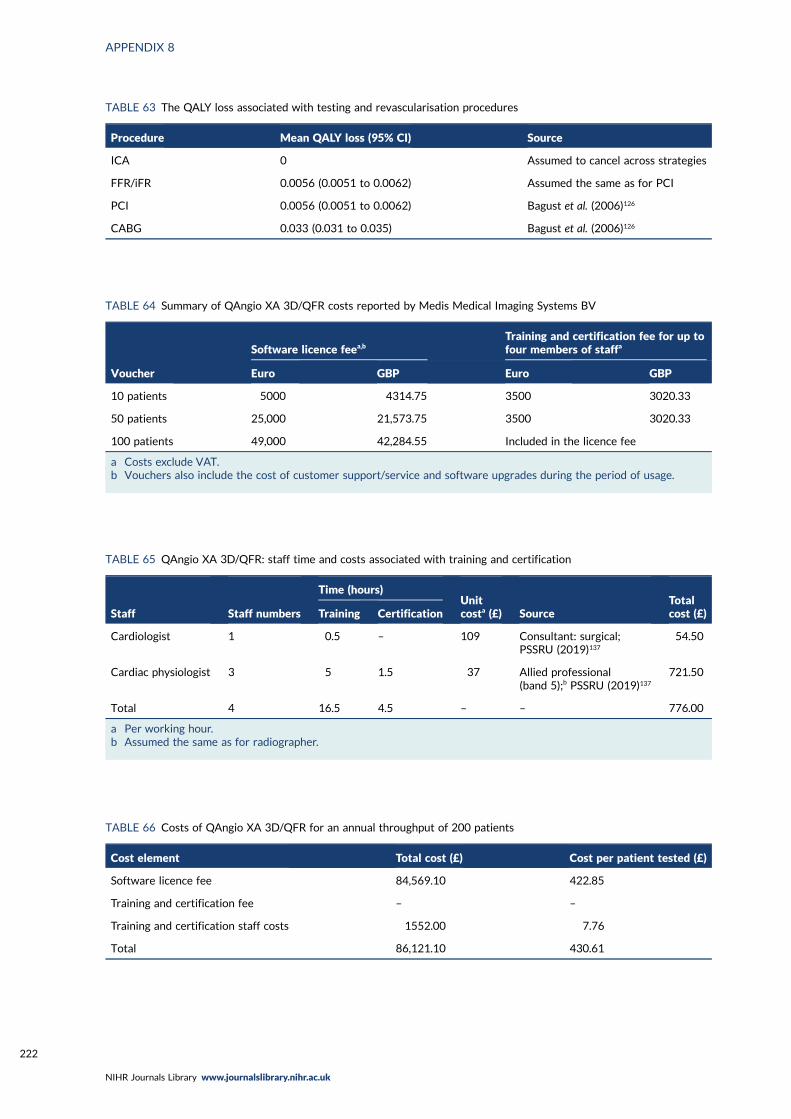
TABLE 63 The QALY loss associated with testing and revascularisation procedures
Procedure Mean QALY loss (95% CI) Source
ICA 0 Assumed to cancel across strategies
FFR/iFR 0.0056 (0.0051 to 0.0062) Assumed the same as for PCI
PCI 0.0056 (0.0051 to 0.0062) Bagust et al. (2006)126
CABG 0.033 (0.031 to 0.035) Bagust et al. (2006)126
TABLE 64 Summary of QAngio XA 3D/QFR costs reported by Medis Medical Imaging Systems BV
Voucher
Software licence feea,bTraining and certification fee for up tofour members of staffa
Euro GBP Euro GBP
10 patients 5000 4314.75 3500 3020.33
50 patients 25,000 21,573.75 3500 3020.33
100 patients 49,000 42,284.55 Included in the licence fee
a Costs exclude VAT.b Vouchers also include the cost of customer support/service and software upgrades during the period of usage.
TABLE 65 QAngio XA 3D/QFR: staff time and costs associated with training and certification
Staff Staff numbers
Time (hours)Unitcosta (£) Source
Totalcost (£)Training Certification
Cardiologist 1 0.5 – 109 Consultant: surgical;PSSRU (2019)137
54.50
Cardiac physiologist 3 5 1.5 37 Allied professional(band 5);b PSSRU (2019)137
721.50
Total 4 16.5 4.5 – – 776.00
a Per working hour.b Assumed the same as for radiographer.
TABLE 66 Costs of QAngio XA 3D/QFR for an annual throughput of 200 patients
Cost element Total cost (£) Cost per patient tested (£)
Software licence fee 84,569.10 422.85
Training and certification fee – –
Training and certification staff costs 1552.00 7.76
Total 86,121.10 430.61
APPENDIX 8
NIHR Journals Library www.journalslibrary.nihr.ac.uk
222
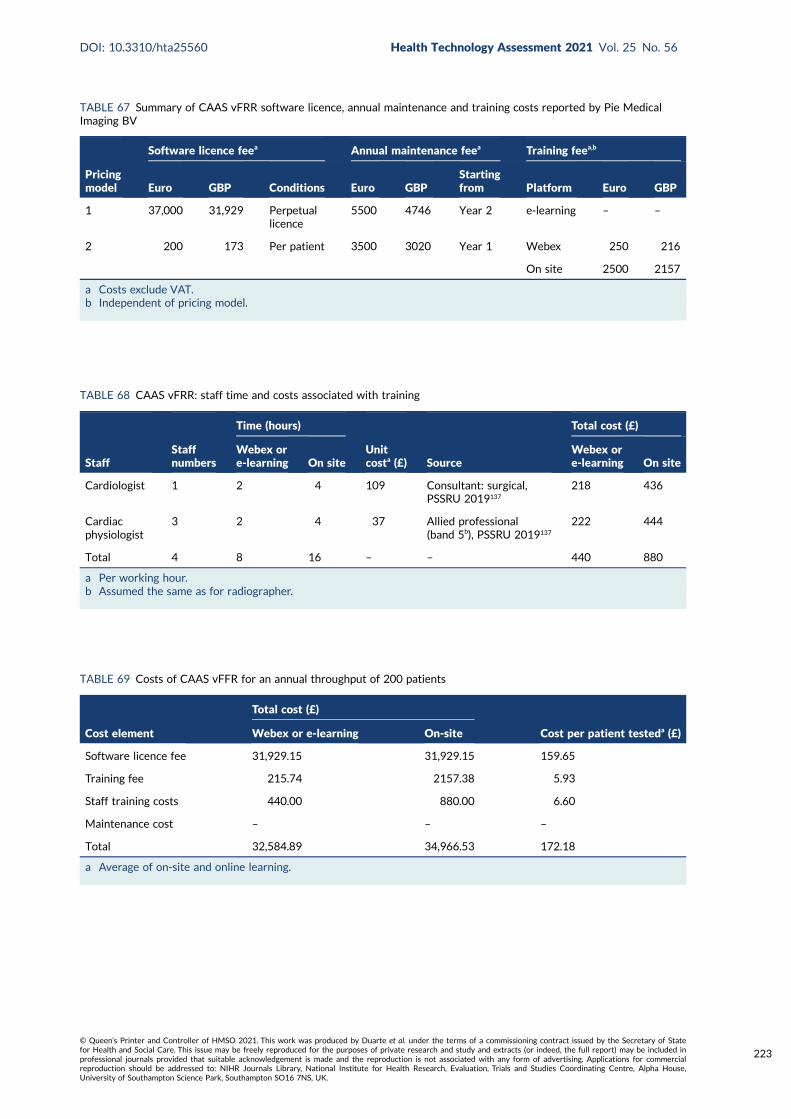
TABLE 67 Summary of CAAS vFRR software licence, annual maintenance and training costs reported by Pie MedicalImaging BV
Pricingmodel
Software licence feea Annual maintenance feea Training feea,b
Euro GBP Conditions Euro GBPStartingfrom Platform Euro GBP
1 37,000 31,929 Perpetuallicence
5500 4746 Year 2 e-learning – –
2 200 173 Per patient 3500 3020 Year 1 Webex 250 216
On site 2500 2157
a Costs exclude VAT.b Independent of pricing model.
TABLE 68 CAAS vFRR: staff time and costs associated with training
StaffStaffnumbers
Time (hours)
Unitcosta (£) Source
Total cost (£)
Webex ore-learning On site
Webex ore-learning On site
Cardiologist 1 2 4 109 Consultant: surgical,PSSRU 2019137
218 436
Cardiacphysiologist
3 2 4 37 Allied professional(band 5b), PSSRU 2019137
222 444
Total 4 8 16 – – 440 880
a Per working hour.b Assumed the same as for radiographer.
TABLE 69 Costs of CAAS vFFR for an annual throughput of 200 patients
Cost element
Total cost (£)
Cost per patient testeda (£)Webex or e-learning On-site
Software licence fee 31,929.15 31,929.15 159.65
Training fee 215.74 2157.38 5.93
Staff training costs 440.00 880.00 6.60
Maintenance cost – – –
Total 32,584.89 34,966.53 172.18
a Average of on-site and online learning.
DOI: 10.3310/hta25560 Health Technology Assessment 2021 Vol. 25 No. 56
© Queen’s Printer and Controller of HMSO 2021. This work was produced by Duarte et al. under the terms of a commissioning contract issued by the Secretary of Statefor Health and Social Care. This issue may be freely reproduced for the purposes of private research and study and extracts (or indeed, the full report) may be included inprofessional journals provided that suitable acknowledgement is made and the reproduction is not associated with any form of advertising. Applications for commercialreproduction should be addressed to: NIHR Journals Library, National Institute for Health Research, Evaluation, Trials and Studies Coordinating Centre, Alpha House,University of Southampton Science Park, Southampton SO16 7NS, UK.
223
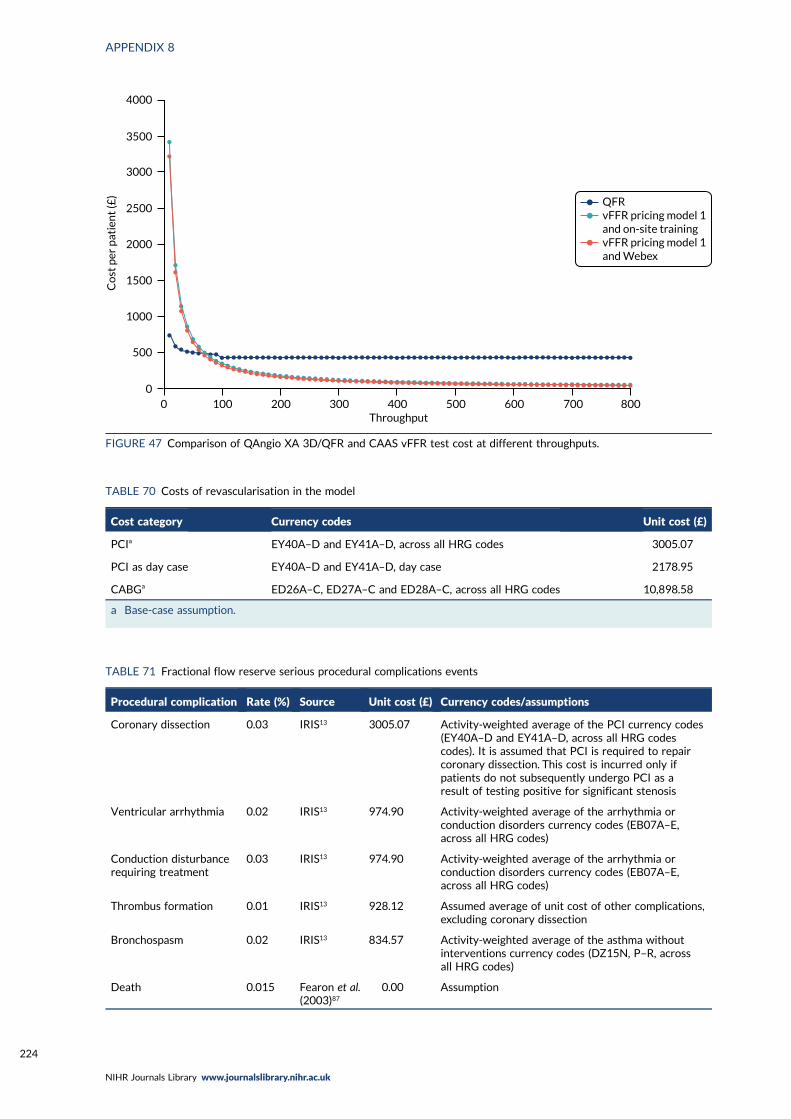
QFRvFFR pricing model 1and on-site trainingvFFR pricing model 1and Webex
4000
3500
3000
2500
2000
1500
1000
500
00
Co
st p
er p
atie
nt
(£)
100 200 300 400 500 600 700 800Throughput
FIGURE 47 Comparison of QAngio XA 3D/QFR and CAAS vFFR test cost at different throughputs.
TABLE 70 Costs of revascularisation in the model
Cost category Currency codes Unit cost (£)
PCIa EY40A–D and EY41A–D, across all HRG codes 3005.07
PCI as day case EY40A–D and EY41A–D, day case 2178.95
CABGa ED26A–C, ED27A–C and ED28A–C, across all HRG codes 10,898.58
a Base-case assumption.
TABLE 71 Fractional flow reserve serious procedural complications events
Procedural complication Rate (%) Source Unit cost (£) Currency codes/assumptions
Coronary dissection 0.03 IRIS13 3005.07 Activity-weighted average of the PCI currency codes(EY40A–D and EY41A–D, across all HRG codescodes). It is assumed that PCI is required to repaircoronary dissection. This cost is incurred only ifpatients do not subsequently undergo PCI as aresult of testing positive for significant stenosis
Ventricular arrhythmia 0.02 IRIS13 974.90 Activity-weighted average of the arrhythmia orconduction disorders currency codes (EB07A–E,across all HRG codes)
Conduction disturbancerequiring treatment
0.03 IRIS13 974.90 Activity-weighted average of the arrhythmia orconduction disorders currency codes (EB07A–E,across all HRG codes)
Thrombus formation 0.01 IRIS13 928.12 Assumed average of unit cost of other complications,excluding coronary dissection
Bronchospasm 0.02 IRIS13 834.57 Activity-weighted average of the asthma withoutinterventions currency codes (DZ15N, P–R, acrossall HRG codes)
Death 0.015 Fearon et al.(2003)87
0.00 Assumption
APPENDIX 8
NIHR Journals Library www.journalslibrary.nihr.ac.uk
224
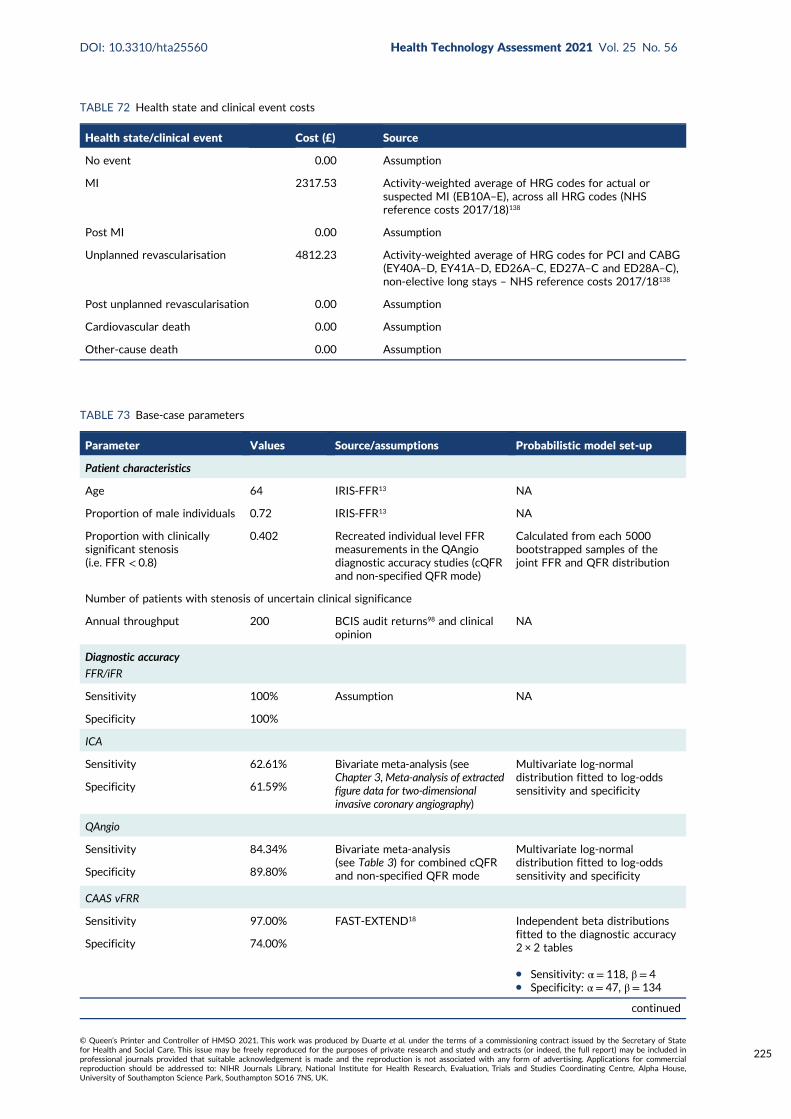
TABLE 72 Health state and clinical event costs
Health state/clinical event Cost (£) Source
No event 0.00 Assumption
MI 2317.53 Activity-weighted average of HRG codes for actual orsuspected MI (EB10A–E), across all HRG codes (NHSreference costs 2017/18)138
Post MI 0.00 Assumption
Unplanned revascularisation 4812.23 Activity-weighted average of HRG codes for PCI and CABG(EY40A–D, EY41A–D, ED26A–C, ED27A–C and ED28A–C),non-elective long stays – NHS reference costs 2017/18138
Post unplanned revascularisation 0.00 Assumption
Cardiovascular death 0.00 Assumption
Other-cause death 0.00 Assumption
TABLE 73 Base-case parameters
Parameter Values Source/assumptions Probabilistic model set-up
Patient characteristics
Age 64 IRIS-FFR13 NA
Proportion of male individuals 0.72 IRIS-FFR13 NA
Proportion with clinicallysignificant stenosis(i.e. FFR < 0.8)
0.402 Recreated individual level FFRmeasurements in the QAngiodiagnostic accuracy studies (cQFRand non-specified QFR mode)
Calculated from each 5000bootstrapped samples of thejoint FFR and QFR distribution
Number of patients with stenosis of uncertain clinical significance
Annual throughput 200 BCIS audit returns98 and clinicalopinion
NA
Diagnostic accuracy
FFR/iFR
Sensitivity 100% Assumption NA
Specificity 100%
ICA
Sensitivity 62.61% Bivariate meta-analysis (seeChapter 3,Meta-analysis of extractedfigure data for two-dimensionalinvasive coronary angiography)
Multivariate log-normaldistribution fitted to log-oddssensitivity and specificitySpecificity 61.59%
QAngio
Sensitivity 84.34% Bivariate meta-analysis(see Table 3) for combined cQFRand non-specified QFR mode
Multivariate log-normaldistribution fitted to log-oddssensitivity and specificitySpecificity 89.80%
CAAS vFRR
Sensitivity 97.00% FAST-EXTEND18 Independent beta distributionsfitted to the diagnostic accuracy2 × 2 tables
l Sensitivity: α = 118, β = 4l Specificity: α = 47, β = 134
Specificity 74.00%
continued
DOI: 10.3310/hta25560 Health Technology Assessment 2021 Vol. 25 No. 56
© Queen’s Printer and Controller of HMSO 2021. This work was produced by Duarte et al. under the terms of a commissioning contract issued by the Secretary of Statefor Health and Social Care. This issue may be freely reproduced for the purposes of private research and study and extracts (or indeed, the full report) may be included inprofessional journals provided that suitable acknowledgement is made and the reproduction is not associated with any form of advertising. Applications for commercialreproduction should be addressed to: NIHR Journals Library, National Institute for Health Research, Evaluation, Trials and Studies Coordinating Centre, Alpha House,University of Southampton Science Park, Southampton SO16 7NS, UK.
225
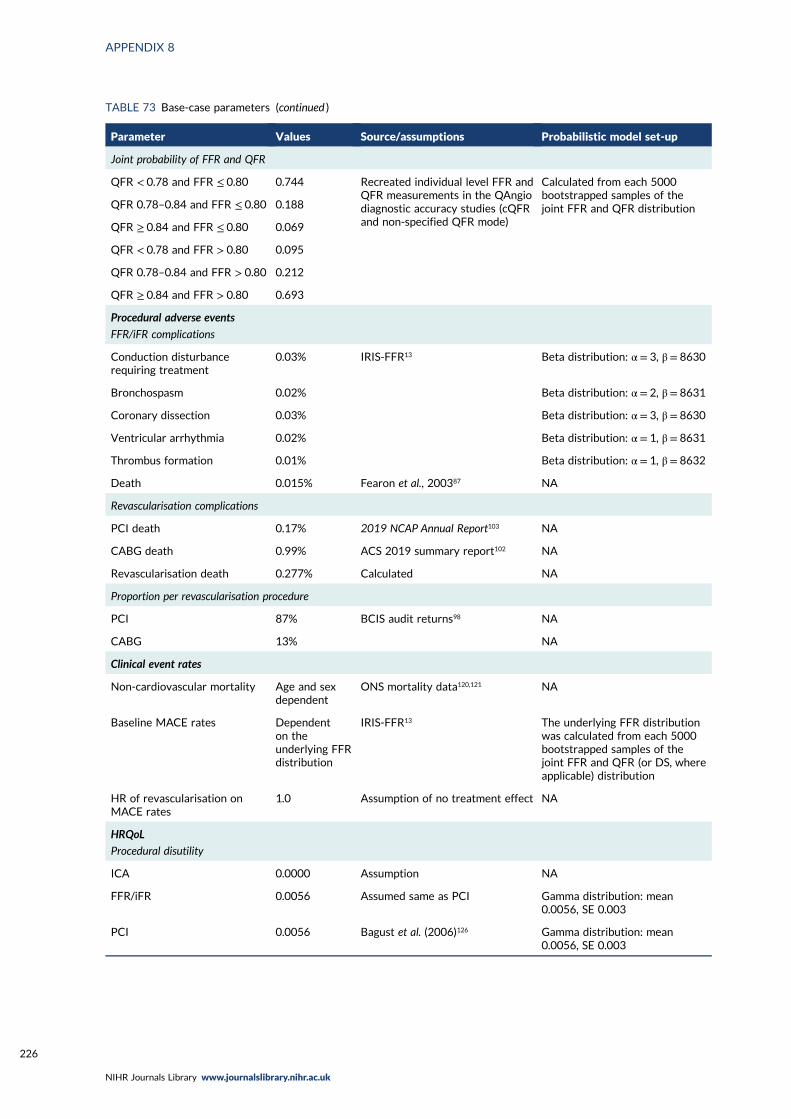
TABLE 73 Base-case parameters (continued )
Parameter Values Source/assumptions Probabilistic model set-up
Joint probability of FFR and QFR
QFR < 0.78 and FFR ≤ 0.80 0.744 Recreated individual level FFR andQFR measurements in the QAngiodiagnostic accuracy studies (cQFRand non-specified QFR mode)
Calculated from each 5000bootstrapped samples of thejoint FFR and QFR distributionQFR 0.78–0.84 and FFR ≤ 0.80 0.188
QFR ≥ 0.84 and FFR ≤ 0.80 0.069
QFR < 0.78 and FFR > 0.80 0.095
QFR 0.78–0.84 and FFR > 0.80 0.212
QFR ≥ 0.84 and FFR > 0.80 0.693
Procedural adverse events
FFR/iFR complications
Conduction disturbancerequiring treatment
0.03% IRIS-FFR13 Beta distribution: α = 3, β = 8630
Bronchospasm 0.02% Beta distribution: α = 2, β = 8631
Coronary dissection 0.03% Beta distribution: α = 3, β = 8630
Ventricular arrhythmia 0.02% Beta distribution: α = 1, β = 8631
Thrombus formation 0.01% Beta distribution: α = 1, β = 8632
Death 0.015% Fearon et al., 200387 NA
Revascularisation complications
PCI death 0.17% 2019 NCAP Annual Report103 NA
CABG death 0.99% ACS 2019 summary report102 NA
Revascularisation death 0.277% Calculated NA
Proportion per revascularisation procedure
PCI 87% BCIS audit returns98 NA
CABG 13% NA
Clinical event rates
Non-cardiovascular mortality Age and sexdependent
ONS mortality data120,121 NA
Baseline MACE rates Dependenton theunderlying FFRdistribution
IRIS-FFR13 The underlying FFR distributionwas calculated from each 5000bootstrapped samples of thejoint FFR and QFR (or DS, whereapplicable) distribution
HR of revascularisation onMACE rates
1.0 Assumption of no treatment effect NA
HRQoL
Procedural disutility
ICA 0.0000 Assumption NA
FFR/iFR 0.0056 Assumed same as PCI Gamma distribution: mean0.0056, SE 0.003
PCI 0.0056 Bagust et al. (2006)126 Gamma distribution: mean0.0056, SE 0.003
APPENDIX 8
NIHR Journals Library www.journalslibrary.nihr.ac.uk
226
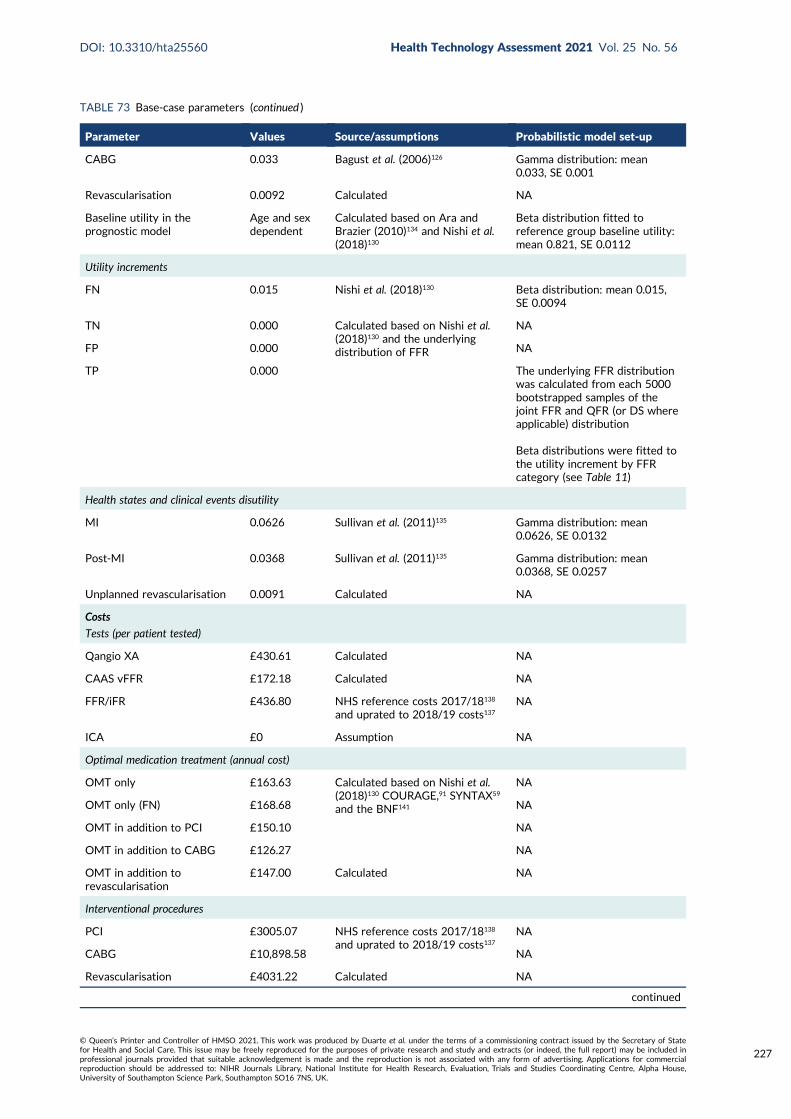
TABLE 73 Base-case parameters (continued )
Parameter Values Source/assumptions Probabilistic model set-up
CABG 0.033 Bagust et al. (2006)126 Gamma distribution: mean0.033, SE 0.001
Revascularisation 0.0092 Calculated NA
Baseline utility in theprognostic model
Age and sexdependent
Calculated based on Ara andBrazier (2010)134 and Nishi et al.(2018)130
Beta distribution fitted toreference group baseline utility:mean 0.821, SE 0.0112
Utility increments
FN 0.015 Nishi et al. (2018)130 Beta distribution: mean 0.015,SE 0.0094
TN 0.000 Calculated based on Nishi et al.(2018)130 and the underlyingdistribution of FFR
NA
FP 0.000 NA
TP 0.000 The underlying FFR distributionwas calculated from each 5000bootstrapped samples of thejoint FFR and QFR (or DS whereapplicable) distribution
Beta distributions were fitted tothe utility increment by FFRcategory (see Table 11)
Health states and clinical events disutility
MI 0.0626 Sullivan et al. (2011)135 Gamma distribution: mean0.0626, SE 0.0132
Post-MI 0.0368 Sullivan et al. (2011)135 Gamma distribution: mean0.0368, SE 0.0257
Unplanned revascularisation 0.0091 Calculated NA
Costs
Tests (per patient tested)
Qangio XA £430.61 Calculated NA
CAAS vFFR £172.18 Calculated NA
FFR/iFR £436.80 NHS reference costs 2017/18138
and uprated to 2018/19 costs137NA
ICA £0 Assumption NA
Optimal medication treatment (annual cost)
OMT only £163.63 Calculated based on Nishi et al.(2018)130 COURAGE,91 SYNTAX59
and the BNF141
NA
OMT only (FN) £168.68 NA
OMT in addition to PCI £150.10 NA
OMT in addition to CABG £126.27 NA
OMT in addition torevascularisation
£147.00 Calculated NA
Interventional procedures
PCI £3005.07 NHS reference costs 2017/18138
and uprated to 2018/19 costs137NA
CABG £10,898.58 NA
Revascularisation £4031.22 Calculated NA
continued
DOI: 10.3310/hta25560 Health Technology Assessment 2021 Vol. 25 No. 56
© Queen’s Printer and Controller of HMSO 2021. This work was produced by Duarte et al. under the terms of a commissioning contract issued by the Secretary of Statefor Health and Social Care. This issue may be freely reproduced for the purposes of private research and study and extracts (or indeed, the full report) may be included inprofessional journals provided that suitable acknowledgement is made and the reproduction is not associated with any form of advertising. Applications for commercialreproduction should be addressed to: NIHR Journals Library, National Institute for Health Research, Evaluation, Trials and Studies Coordinating Centre, Alpha House,University of Southampton Science Park, Southampton SO16 7NS, UK.
227
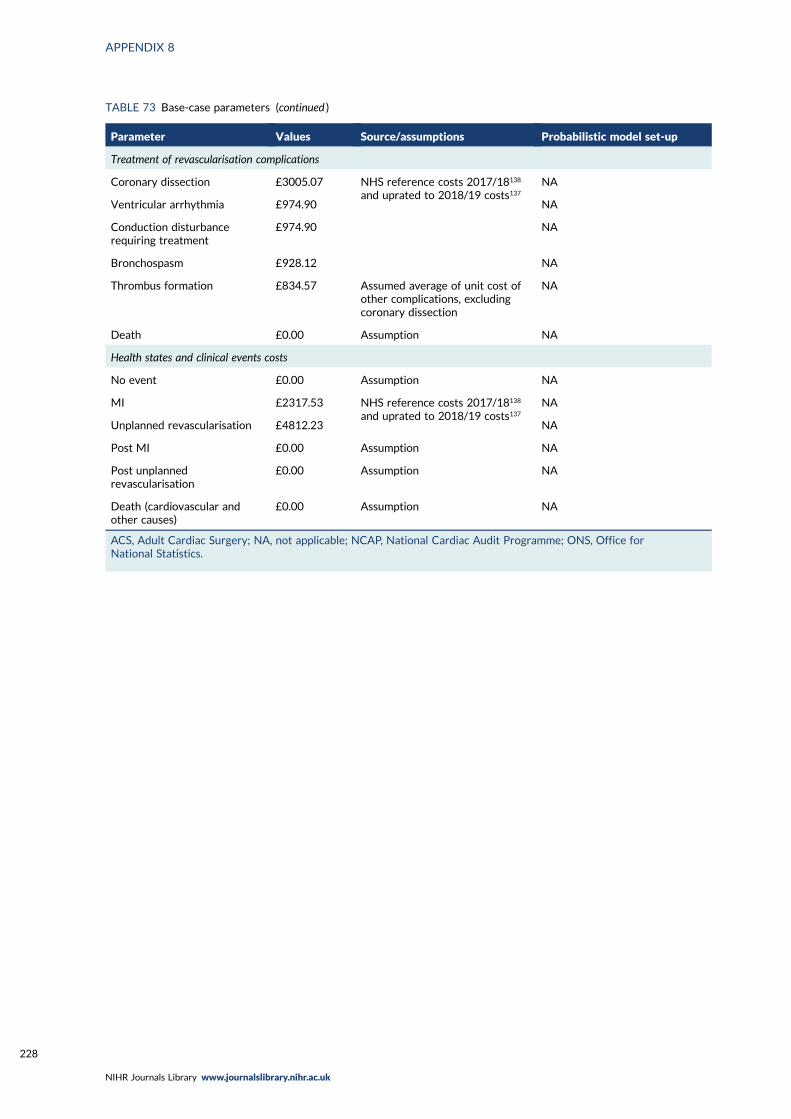
TABLE 73 Base-case parameters (continued )
Parameter Values Source/assumptions Probabilistic model set-up
Treatment of revascularisation complications
Coronary dissection £3005.07 NHS reference costs 2017/18138
and uprated to 2018/19 costs137NA
Ventricular arrhythmia £974.90 NA
Conduction disturbancerequiring treatment
£974.90 NA
Bronchospasm £928.12 NA
Thrombus formation £834.57 Assumed average of unit cost ofother complications, excludingcoronary dissection
NA
Death £0.00 Assumption NA
Health states and clinical events costs
No event £0.00 Assumption NA
MI £2317.53 NHS reference costs 2017/18138
and uprated to 2018/19 costs137NA
Unplanned revascularisation £4812.23 NA
Post MI £0.00 Assumption NA
Post unplannedrevascularisation
£0.00 Assumption NA
Death (cardiovascular andother causes)
£0.00 Assumption NA
ACS, Adult Cardiac Surgery; NA, not applicable; NCAP, National Cardiac Audit Programme; ONS, Office forNational Statistics.
APPENDIX 8
NIHR Journals Library www.journalslibrary.nihr.ac.uk
228
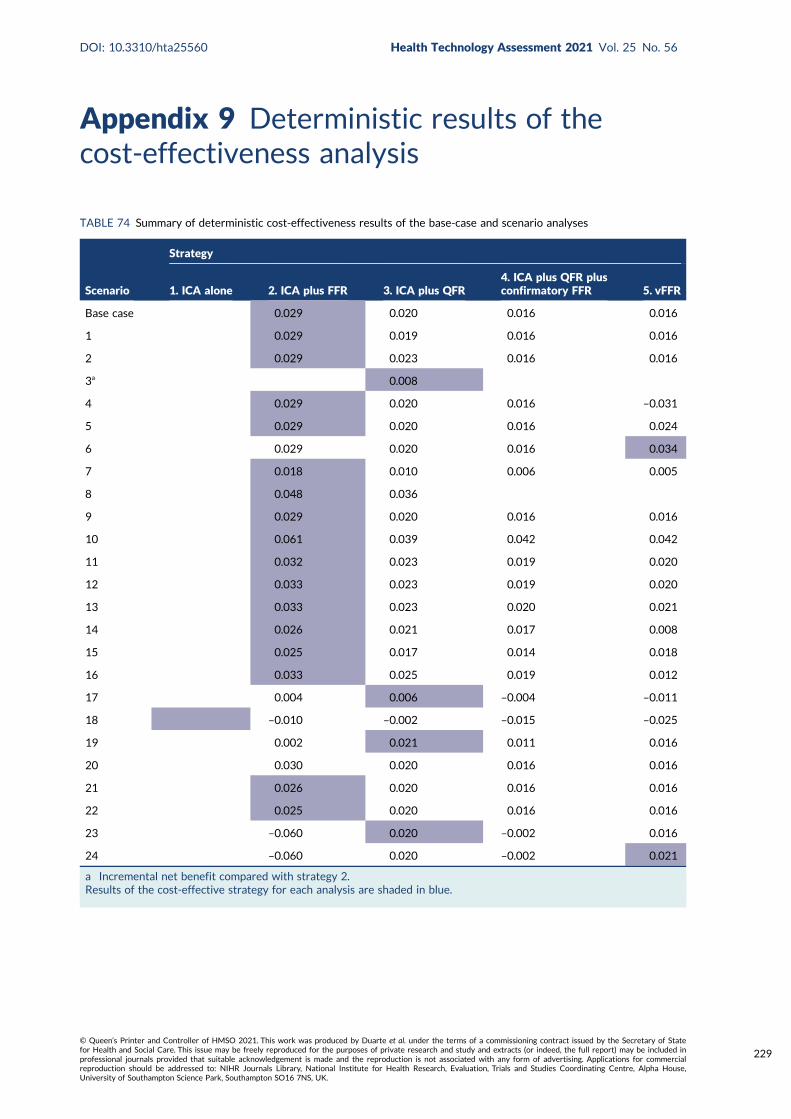
Appendix 9 Deterministic results of thecost-effectiveness analysis
TABLE 74 Summary of deterministic cost-effectiveness results of the base-case and scenario analyses
Scenario
Strategy
1. ICA alone 2. ICA plus FFR 3. ICA plus QFR4. ICA plus QFR plusconfirmatory FFR 5. vFFR
Base case 0.029 0.020 0.016 0.016
1 0.029 0.019 0.016 0.016
2 0.029 0.023 0.016 0.016
3a 0.008
4 0.029 0.020 0.016 –0.031
5 0.029 0.020 0.016 0.024
6 0.029 0.020 0.016 0.034
7 0.018 0.010 0.006 0.005
8 0.048 0.036
9 0.029 0.020 0.016 0.016
10 0.061 0.039 0.042 0.042
11 0.032 0.023 0.019 0.020
12 0.033 0.023 0.019 0.020
13 0.033 0.023 0.020 0.021
14 0.026 0.021 0.017 0.008
15 0.025 0.017 0.014 0.018
16 0.033 0.025 0.019 0.012
17 0.004 0.006 –0.004 –0.011
18 –0.010 –0.002 –0.015 –0.025
19 0.002 0.021 0.011 0.016
20 0.030 0.020 0.016 0.016
21 0.026 0.020 0.016 0.016
22 0.025 0.020 0.016 0.016
23 –0.060 0.020 –0.002 0.016
24 –0.060 0.020 –0.002 0.021
a Incremental net benefit compared with strategy 2.Results of the cost-effective strategy for each analysis are shaded in blue.
DOI: 10.3310/hta25560 Health Technology Assessment 2021 Vol. 25 No. 56
© Queen’s Printer and Controller of HMSO 2021. This work was produced by Duarte et al. under the terms of a commissioning contract issued by the Secretary of Statefor Health and Social Care. This issue may be freely reproduced for the purposes of private research and study and extracts (or indeed, the full report) may be included inprofessional journals provided that suitable acknowledgement is made and the reproduction is not associated with any form of advertising. Applications for commercialreproduction should be addressed to: NIHR Journals Library, National Institute for Health Research, Evaluation, Trials and Studies Coordinating Centre, Alpha House,University of Southampton Science Park, Southampton SO16 7NS, UK.
229


EMEHS&DRHTAPGfARPHRPart of the NIHR Journals Librarywww.journalslibrary.nihr.ac.uk
This report presents independent research funded by the National Institute for Health Research (NIHR). The views expressed are those of the author(s) and not necessarily those of the NHS, the NIHR or the Department of Health and Social Care
Published by the NIHR Journals Library
Related Documents