Non-intrusive Performance Profiling for Entire Software Stacks based on The Flow Reconstruction Principle Xu Zhao, Kirk Rodrigues, Yu Luo, Ding Yuan, Michael Stumm

Welcome message from author
This document is posted to help you gain knowledge. Please leave a comment to let me know what you think about it! Share it to your friends and learn new things together.
Transcript
Non-intrusive Performance Profiling for
Entire Software Stacks based on
The Flow Reconstruction Principle
Xu Zhao, Kirk Rodrigues, Yu Luo, Ding Yuan, Michael Stumm

Motivations
► Debugging distributed system stacks is difficult
► Existing tools are limited
► Intrusive: manually built-in domain knowledge
► Machine learning on logs: unable to reconstruct execution flow
► Static analysis [Zhao OSDI’14]: cannot cross different software components
► Use programmers’ intuition in postmortem execution analysis
2
The Flow Reconstruction Principle
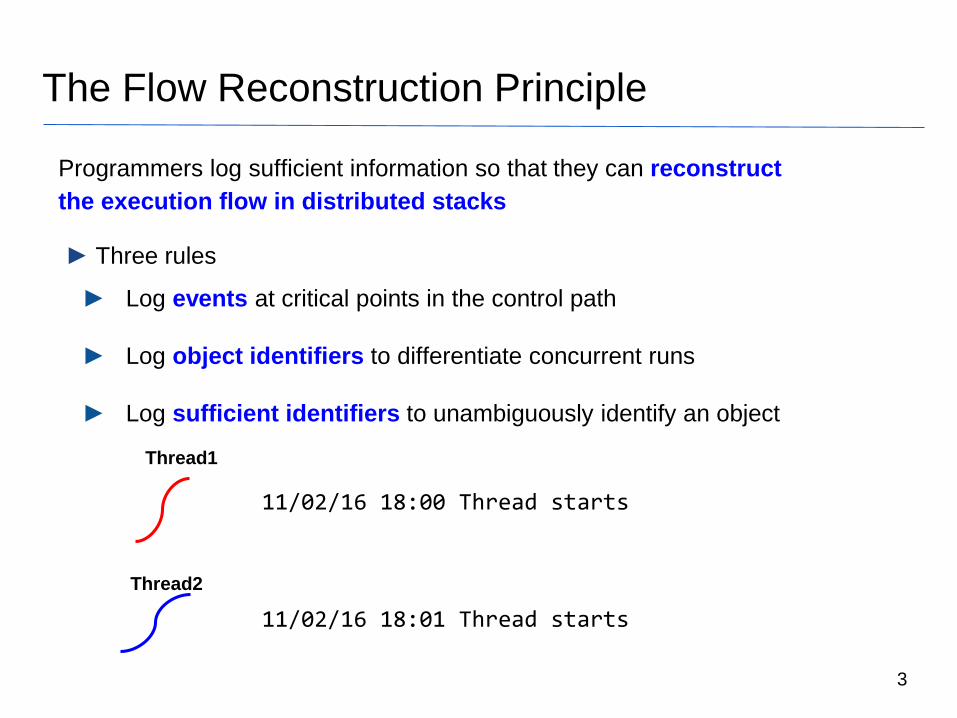
Programmers log sufficient information so that they can reconstruct
the execution flow in distributed stacks
► Three rules
3
11/02/16 18:00 Thread starts
► Log events at critical points in the control path
► Log object identifiers to differentiate concurrent runs
► Log sufficient identifiers to unambiguously identify an object
Thread1
Thread2
11/02/16 18:01 Thread starts

The Flow Reconstruction Principle
Programmers log sufficient information so that they can reconstruct
the execution flow in distributed stacks
► Three rules
4
► Log events at critical points in the control path
► Log object identifiers to differentiate concurrent runs
► Log sufficient identifiers to unambiguously identify an object
Thread1
Thread2
11/02/16 18:00 Thread 1 starts
11/02/16 18:01 Thread 2 starts

The Flow Reconstruction Principle
Programmers log sufficient information so that they can reconstruct
the execution flow in distributed stacks
► Three rules
5
► Log events at critical points in the control path
► Log object identifiers to differentiate concurrent runs
► Log sufficient identifiers to unambiguously identify an object
Thread1
Thread2
11/02/16 18:00 [Process 2355] Thread 1 starts
11/02/16 18:01 [Process 1224] Thread 2 starts

The Flow Reconstruction Principle
Programmers log sufficient information so that they can reconstruct
the execution flow in distributed stacks
► Three rules
6
► Log events at critical points in the control path
► Log object identifiers to differentiate concurrent runs
► Log sufficient identifiers to unambiguously identify an object
Thread1
Thread2
11/02/16 18:01 Thread 2 starts
11/02/16 18:01 Process 1224 starts a Thread
11/02/16 18:02 Thread 1 starts
11/02/16 18:01 Process 2355 starts a Thread

Stitch: A Non-intrusive Profiler for Entire Server Stacks
7
► Works without any built-in domain knowledge
► Purely based on IDs, throws away constant text
► Reconstructs objects, infers their lifetimes and hierarchies
Node 12016-05-02 23:23:00,762 INFO
org.apache.hadoop.yarn.server.resour
cemanager.ResourceManager:
registered UNIX signal handlers for
[TERM, HUP, INT]
2016-05-02 23:23:01,186 INFO
org.apache.hadoop.conf.Configuration:
found resource core-site.xml at
file:/home/dev/hadoop/hadoop-
2.7.1/etc/hadoop/core-site.xml
2016-05-02 23:23:01,374 INFO
Node 22016-05-02 23:27:00,792 INFO
org.apache.hadoop.yarn.server.resour
cemanager.ResourceManager:
registered UNIX signal handlers for
[TERM, HUP, INT]
2016-05-02 23:28:01,189 INFO
org.apache.hadoop.conf.Configuration:
found resource core-site.xml at
file:/home/dev/hadoop/hadoop-
2.7.1/etc/hadoop/core-site.xml
2016-05-02 23:23:01,374 INFO
Centralized Server
Visualization
User_Alice
Query 1
Query 2

Outline
► Real world example
► Design of Stitch
► User study and correctness evaluation
8

Real World Example
► User study on 14 programmers
► We reproduced a real world performance anomaly: YARN-4610
► Symptom: user Alice reports her Hive query takes longer than expected
► Separate programmers into 2 groups: debug using raw log or with Stitch
► 45 mins time limit
9
Debugging with Raw Log
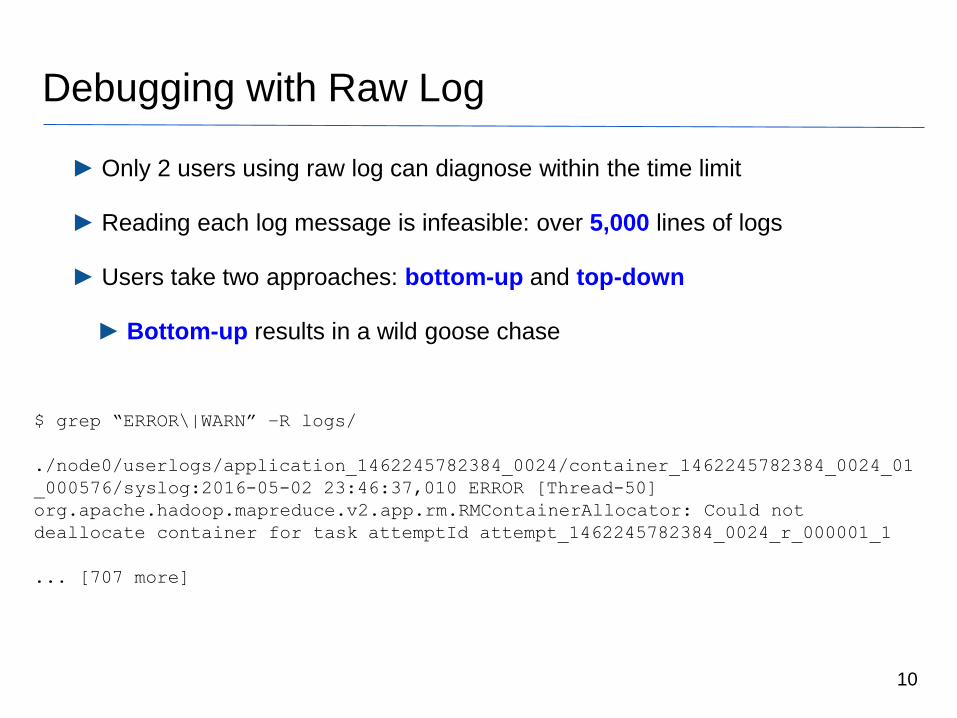
► Only 2 users using raw log can diagnose within the time limit
► Reading each log message is infeasible: over 5,000 lines of logs
► Users take two approaches: bottom-up and top-down
► Bottom-up results in a wild goose chase
10
$ grep “ERROR\|WARN” –R logs/
./node0/userlogs/application_1462245782384_0024/container_1462245782384_0024_01
_000576/syslog:2016-05-02 23:46:37,010 ERROR [Thread-50]
org.apache.hadoop.mapreduce.v2.app.rm.RMContainerAllocator: Could not
deallocate container for task attemptId attempt_1462245782384_0024_r_000001_1
... [707 more]

Debugging with Raw Log
► Only 2 users using raw log can diagnose within the time limit
► Reading each log message is infeasible: over 5,000 lines of logs
► Users take two approaches: bottom-up and top-down
► Bottom-up results in a wild goose chase
11
► Top-down gets closer, but still cannot diagnose failure within time limit
► Determine slowest map task
Debugging with Stitch
► All 7 Stitch users succeeded, spending 13 mins on average
► Stitch speeds-up debugging time by a factor of 3.5
► Demo
12

Outline
► Real world example
► Design of Stitch
► User study and correctness evaluation
13

Client: Log Parsing
► Detect log printing processes and log files
► Periodically read /proc
► Log parsing: separate dynamic and constant parts of the raw log
► Extract string constants from binaries, match against the log
► Filter non-identifiers using a blacklist (“memsize”, “ms”, “progress”, etc.)
14
16/04/02 00:58 MongoDB starting: pid=22925 port=27017 dbpath=/var/lib/mongodb
// Code that prints this msg:
l << "MongoDB starting : pid=" << pid << " port=" <<
serverGlobalParams.port << " dbpath=" << storageGlobalParams.dbpath;
Parsed Log
Timestamp Identifier Type
16/04/02 00:58
22925 pid
27017 port
/var/lib/mongodb filePath

Server: Identifier Relations
► 1:1 relation
► Can be used interchangeably
► 1:n relation
► Hierarchical relationship
► m:n relation
► Combination is required to unambiguously identify an object
15
Host1 IP 192.168.0.100
Process 42 Thread 1
Thread 2Process 43
Query 20161102_0001
User Bob
Query 20161102_0002
m:n Relation
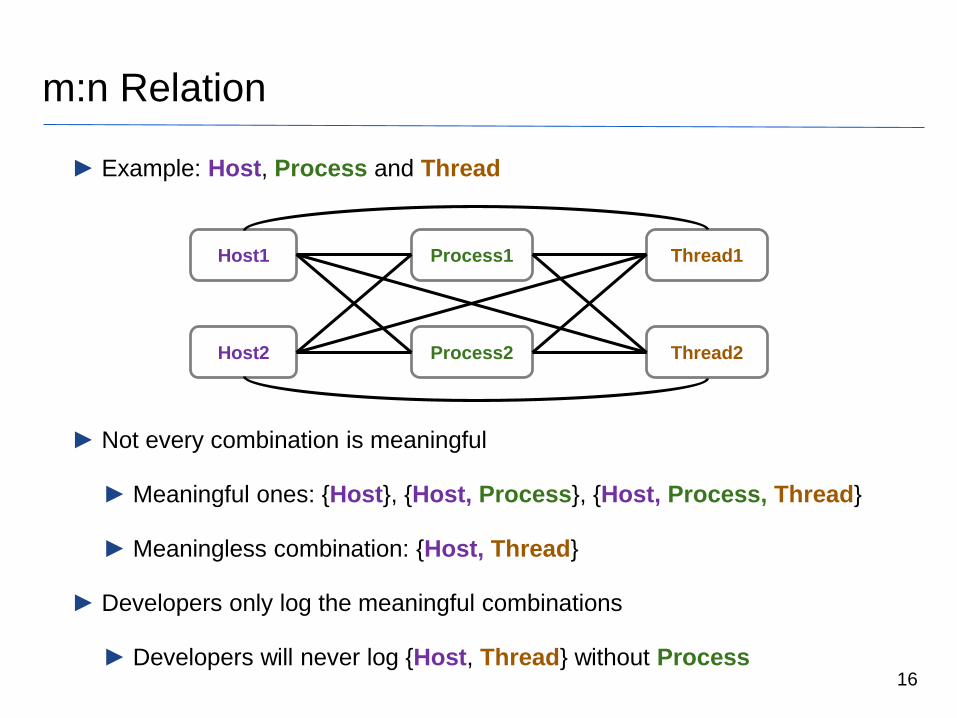
► Example: Host, Process and Thread
► Not every combination is meaningful
► Meaningful ones: {Host}, {Host, Process}, {Host, Process, Thread}
► Meaningless combination: {Host, Thread}
► Developers only log the meaningful combinations
► Developers will never log {Host, Thread} without Process 16
Host1
Host2 Process2
Process1 Thread1
Thread2

Lifetime and Hierarchy
► Lifetime of objects inferred from event timestamps
► Hierarchy is inferred from 1:n relation
17
User_Bob
Query 20161102_0001
Query 20161102_0002
OBJECT EVENT TIMELINE
1 16/04/02 00:58 User Bob creates Hive query: Query 20161102_00012 16/04/02 01:03 User Bob creates Hive query: Query 20161102_00023 16/04/02 01:06 User Bob Hive query Query 20161102_0001 finishes4 16/04/02 01:10 User Bob Hive query Query 20161102_0002 finishes
Outline
► Real world example
► Design of Stitch
► User study and correctness evaluation
18

Evaluation
► How much time does Stitch save in debugging?
► How accurate is Stitch in identifying objects?
► Do real-world systems follow the Flow Reconstruction Principle?
19
User Study Evaluation
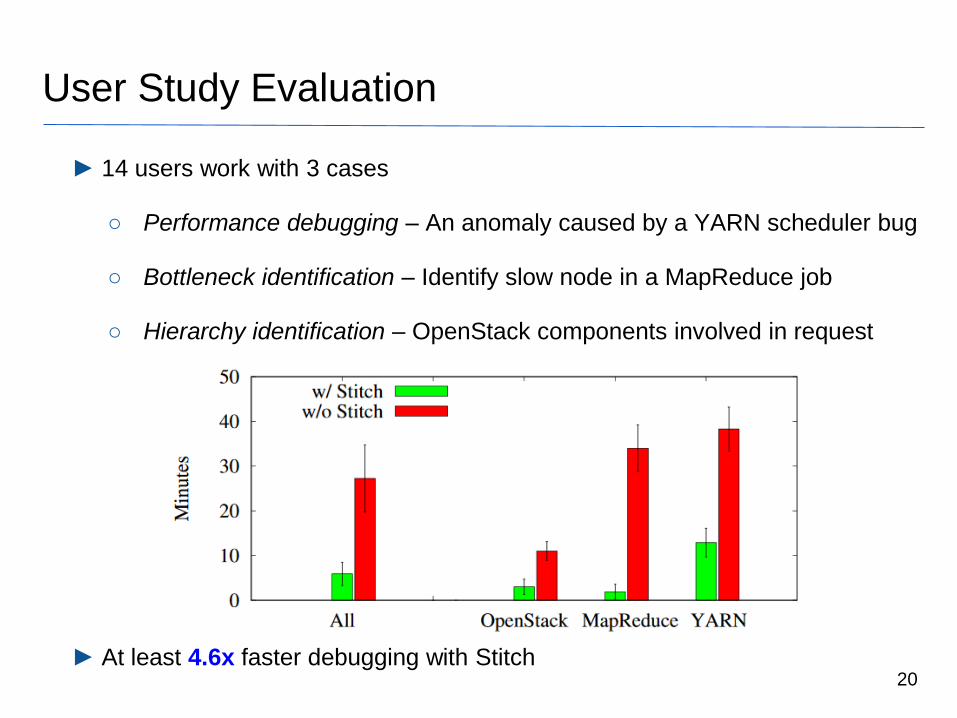
► 14 users work with 3 cases
○ Performance debugging – An anomaly caused by a YARN scheduler bug
○ Bottleneck identification – Identify slow node in a MapReduce job
○ Hierarchy identification – OpenStack components involved in request
► At least 4.6x faster debugging with Stitch20

Correctness Evaluation
► Hive, Spark and OpenStack workload: 200 nodes run for 24 hours
► Production workload: 24-node cluster running for four months
► Together there are 19 software components
► Stitch correctly identifies 96% of all objects in four software stacks21
System Objects Object Types Object Accuracy
Hive 295,042 32 90%
Spark 192,969 31 94%
OpenStack 214,882 14 100%
Production 8,141 24 100%
Total 711,034 101 96%

Limitations
► Stitch does not capture causal relations
► Stitch’s efficacy relies on developers following the Flow Reconstruction
Principle
► Violations of the principle will mislead human debugging
► Stitch’s accuracy is sensitive to the quality of identifiers and type-extraction
► Log parsing is a solved problem
► Industrial solutions exist, e.g., Splunk, VMWare LogInsight, LogStash
22
Related Work
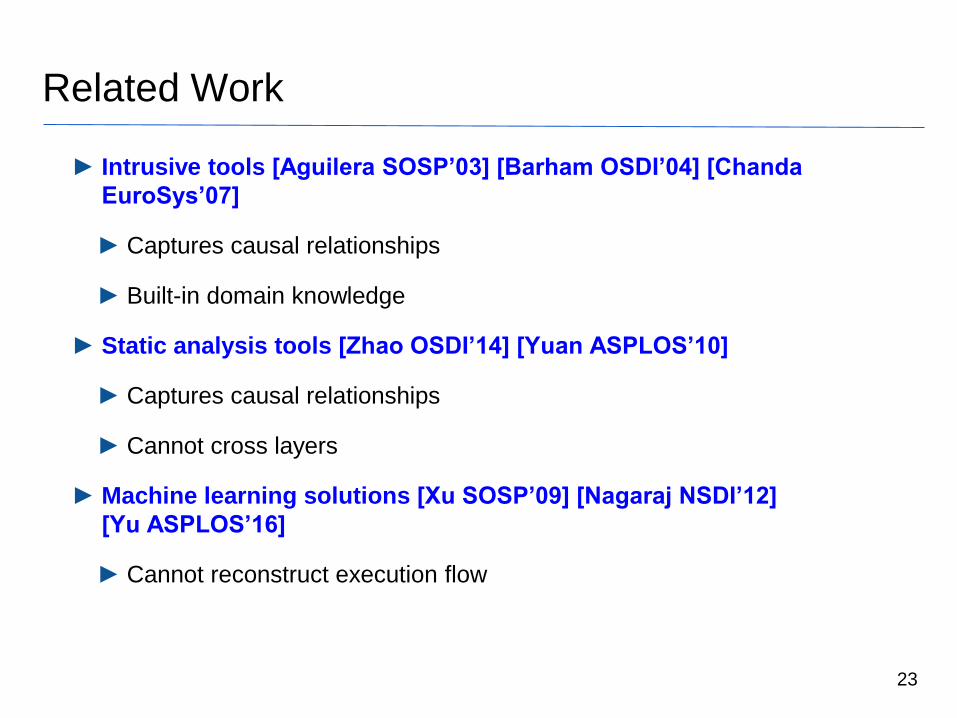
► Intrusive tools [Aguilera SOSP’03] [Barham OSDI’04] [Chanda
EuroSys’07]
► Captures causal relationships
► Built-in domain knowledge
► Static analysis tools [Zhao OSDI’14] [Yuan ASPLOS’10]
► Captures causal relationships
► Cannot cross layers
► Machine learning solutions [Xu SOSP’09] [Nagaraj NSDI’12]
[Yu ASPLOS’16]
► Cannot reconstruct execution flow
23

Conclusions
The Flow Reconstruction Principle
► Log events at critical points in the control path
► Log object identifiers to differentiate concurrent runs
► Log sufficient identifiers to unambiguously identify an object
24
Node 12016-05-02 23:23:00,762 INFO
org.apache.hadoop.yarn.server.resource
manager.ResourceManager: registered
UNIX signal handlers for [TERM, HUP,
INT]
2016-05-02 23:23:01,186 INFO
org.apache.hadoop.conf.Configuration:
found resource core-site.xml at
file:/home/dev/hadoop/hadoop-
2.7.1/etc/hadoop/core-site.xml
2016-05-02 23:23:01,374 INFO
org.apache.hadoop.security.Groups:
clearing userToGroupsMap cache
2016-05-02 23:23:01,486 INFO
org.apache.hadoop.conf.Configuration:
Node 22016-05-02 23:23:00,762 INFO
org.apache.hadoop.yarn.server.resource
manager.ResourceManager: registered
UNIX signal handlers for [TERM, HUP,
INT]
2016-05-02 23:23:01,186 INFO
org.apache.hadoop.conf.Configuration:
found resource core-site.xml at
file:/home/dev/hadoop/hadoop-
2.7.1/etc/hadoop/core-site.xml
2016-05-02 23:23:01,374 INFO
org.apache.hadoop.security.Groups:
clearing userToGroupsMap cache
2016-05-02 23:23:01,486 INFO
org.apache.hadoop.conf.Configuration:
Stitch
Stitch: non-intrusive profiler for distributed stacks
Visualization
User_Alice
Query 1
Query 2

Q & A
25

Source of Inaccuracy
► Hive ID: Stage- : violating Flow Reconstruction Principle
► Stage- and Query ID in separate log messages
► Spark ID: inode and HostName - small scale of workload
► inode and HostName are 1:1 instead of m:n
► Appear together in an error log message
26
Related Documents


![Alle Filter und AGC am TRX ausschalten · 2015. 9. 25. · a JT65-HF Version I.O.9.3-Comfort-3.7.2 LOG: [ DLITHB QRV] Setup RigControI Raw Decoder Transmit Log Statistic Waterfallsetup](https://static.cupdf.com/doc/110x72/5fee7b0a6a9381103223e8c9/alle-filter-und-agc-am-trx-ausschalten-2015-9-25-a-jt65-hf-version-io93-comfort-372.jpg)