Lincoln University Digital Thesis Copyright Statement The digital copy of this thesis is protected by the Copyright Act 1994 (New Zealand). This thesis may be consulted by you, provided you comply with the provisions of the Act and the following conditions of use: you will use the copy only for the purposes of research or private study you will recognise the author's right to be identified as the author of the thesis and due acknowledgement will be made to the author where appropriate you will obtain the author's permission before publishing any material from the thesis.

Welcome message from author
This document is posted to help you gain knowledge. Please leave a comment to let me know what you think about it! Share it to your friends and learn new things together.
Transcript

Lincoln University Digital Thesis
Copyright Statement
The digital copy of this thesis is protected by the Copyright Act 1994 (New Zealand).
This thesis may be consulted by you, provided you comply with the provisions of the Act and the following conditions of use:
you will use the copy only for the purposes of research or private study you will recognise the author's right to be identified as the author of the thesis and
due acknowledgement will be made to the author where appropriate you will obtain the author's permission before publishing any material from the
thesis.
Non-Financial Information Disclosures and Firm Risk
A thesis
submitted in partial fulfilment
of the requirements for the Degree of
Doctor of Philosophy
at
Lincoln University
by
Muhammad Arif
Lincoln University
2020

I dedicate this work to my daughter Amsah, parents, wife, siblings,
friends, colleagues and all the teachers who supported and
encouraged me to reach this point in my life

i
Abstract of a thesis submitted in partial fulfilment of the requirements for the Degree of Doctor of Philosophy
Non-Financial Information Disclosures and Firm Risk
By
Muhammad Arif
Abstract
Recently, world leaders and organisations have realised the seriousness of unsustainable
production practices, ethical misconduct and governance failures by businesses that have
caused severe environmental hazards, employees’ and customers’ rights violations and
financial fraud. As a result, there have been increasing calls by regulators and stakeholders,
including firms’ shareholders, to improve the quantity and quality of information disclosures
vis-à-vis a firm’s business operations, financial transactions, governance structures, work
ethics, environmental and social ramifications. Besides, organisational theories such as the
agency, stakeholder and legitimacy theories highlight the importance of a transparent
information environment in mitigating concerns such as agency conflicts and legitimacy
issues.
Generally, firms use conventional financial statements and reports that offer limited
information about the firm’s activities. However, more recently, firms started to supplement
conventional financial statements with non-financial information (NFI) that encompasses
information related to their policies and activities for a sustainable environment, societal
well-being, work ethics and governance. This additional disclosure provides opportunities to
explore the impact of additional such information disclosure on a firm’s information
environment, future performance and risk.
Recognizing this opportunity and the knowledge gap in the literature, this study uses the S&P
1200 index firms’ environmental, social and governance (ESG) disclosures for 2008-2018 to
investigate their contribution to reducing the uncertainty surrounding firms’ future earnings.
The results show that ESG disclosures have a significant negative impact on earnings risk,

ii
signifying that the additional disclosures relating to ESG issues reduce the uncertainty
surrounding firms’ future earnings risk. The disaggregated analysis of ESG disclosure scores
shows a more pronounced effect of the social and environmental dimensions on earnings risk.
The results are robust to various sub-sample analyses and endogeneity controls.
This study also explores how sensitive industry status augments the extent of a firm’s NFI
disclosures as well as the association between NFI disclosures and earnings risk. The results
show that sensitive industry firms make higher NFI disclosures and, as a result, have a lower
earnings risk than non-sensitive industry firms. This study provides novel evidence concerning
the causal impact of the European Union’s NFI reporting regulations on the level of ESG
disclosures of regulated firms and the changes in NFI disclosures and earnings risk association
after the mandating NFI reporting. The results show that the mandatory NFI reporting regime
has not only increased the extent of NFI disclosures for European firms, but has also improved
the efficiency of NFI disclosures in alleviating the uncertainty surrounding the future earnings
of the sample firms.
Our findings provide important implications for corporate managers, stakeholders and
regulators. Specifically, the findings suggest that corporate managers can alleviate agency
conflicts and legitimacy issues by reporting information regarding firms’ policies and efforts
to manage ESG issues. Our finding regarding the efficiency of the EU directive to increase the
quantity of NFI disclosures further suggests that regulators from other parts of the world
should shift towards mandatory NFI reporting. We propose that mandatory NFI regimes
would improve the adoption of sustainable business practices that are necessary to achieve
long-term targets such as sustainable development and the Paris Agreement’s targets.
Keywords: Non-financial information disclosures, earnings risk, sensitive industries, non-
financial reporting regulations, directive 2014/95/EU

iii
Table of Contents
Abstract ……………………………………………………………………………………………………………………………….i
Table of Contents ...................................................................................................................... iii
List of Tables ............................................................................................................................. vi
List of Figure ............................................................................................................................. vii
Acknowledgements ................................................................................................................. viii
Chapter 1 Introduction………………………………………………………………………………………………………..1
1.1. Introduction ............................................................................................................................ 1
1.2. Knowledge Gaps...................................................................................................................... 5
1.3. Research Questions ................................................................................................................ 6
1.4. Purpose of the Research ......................................................................................................... 7
1.5. Significance of the Research ................................................................................................... 8
1.6. Research Findings ................................................................................................................. 10
1.7. Organisation of the Thesis .................................................................................................... 11
Chapter 2 Literature Review .................................................................................................. 13
2.1. Introduction .......................................................................................................................... 13
2.2. Theoretical Foundations ....................................................................................................... 14
2.2.1. Agency Theory ............................................................................................................... 15
2.2.2. Legitimacy Theory ......................................................................................................... 16
2.2.3. Stakeholder Theory ....................................................................................................... 18
2.3. Definition Evolution of Non-financial Information ............................................................... 19
2.3.1. Institutional contribution to the definition evolution of Non-financial Information ..... 20
2.4. Evolution of Non-financial Information Reporting Research ................................................ 22
2.4.1. Initial studies on the measurement of NFI information disclosures .............................. 22
2.4.2. The development of improved NFI disclosure databases .............................................. 23
2.5. Empirical Studies on the Impact of NFI Disclosures .............................................................. 24
2.5.1. NFI disclosures and the firm performance link .............................................................. 25
2.5.2. The NFI and information asymmetry link ...................................................................... 25
2.5.3. NFI disclosures and the firm risk link ............................................................................. 27
2.5.4. The linkage between NFI disclosures and firms’ earnings risk (the case of sensitive
industry firms) ............................................................................................................................... 30
2.6. NFI Disclosures Regulations .................................................................................................. 32

iv
2.6.1. NFI disclosures regulations in Europe Directive 2014/95/EU ........................................ 33
2.6.2. The consequences of the NFI disclosure regulations ..................................................... 34
2.7. Chapter Summary ................................................................................................................. 36
Chapter 3 Sample, Data and Methodology ............................................................................ 38
3.1. Introduction ......................................................................................................................... 38
3.2. Sample .................................................................................................................................. 38
3.3. Dependent and Independent Variables ................................................................................ 40
3.3.1. Analysts’ earnings forecasts dispersion – earnings risk relationship ............................ 40
3.3.2. Non-Financial Information disclosures .......................................................................... 41
3.3.3. Sensitive industries ........................................................................................................ 42
3.3.4. Non-Financial Information disclosure regulations ........................................................ 42
3.4. Control Variables ................................................................................................................... 43
3.4.1. Firm size ........................................................................................................................ 43
3.4.2. The number of analysts following a firm ...................................................................... 44
3.4.3. Financial leverage ......................................................................................................... 44
3.4.4. Loss ................................................................................................................................ 45
3.4.5. Earnings volatility .......................................................................................................... 45
3.4.6. Financial opaqueness .................................................................................................... 45
3.4.7. Firm growth ................................................................................................................... 46
3.4.8. Firm profitability ........................................................................................................... 46
3.4.9. Industry and index dummies ......................................................................................... 46
3.5. Basic Diagnostic Test ............................................................................................................. 47
3.5.1. Pairwise correlation ...................................................................................................... 48
3.6. Regression models ................................................................................................................ 48
3.7. Robustness and Endogeneity ................................................................................................ 52
3.8. Chapter Summary ................................................................................................................. 53
Chapter 4 Results and Discussion ........................................................................................... 54
4.1. Introduction .......................................................................................................................... 54
4.2. Descriptive Statistics ............................................................................................................. 54
4.3. Diagnostics Test .................................................................................................................... 57
4.3.1. Pairwise correlation analysis ............................................................................................... 57
4.4. The Impact of NFI Disclosures on Earnings Risk .................................................................... 61
4.4.1. Baseline results ................................................................................................................... 61
4.4.2. NFI quartile results .............................................................................................................. 64
4.4.3. Subsample analysis ............................................................................................................. 67

v
4.4.4. Robustness tests .................................................................................................................. 70
4.5. Sensitive Industries Analysis ................................................................................................ 77
4.5.1. Level of NFI disclosure: Sensitive v/s non-sensitive industry firms ...................................... 78
4.5.2 NFI disclosures and future earnings risk: Sensitive versus non-sensitive industry firms ...... 81
4.5.3 NFI disclosures and future earnings risk: Interaction approach........................................... 82
4.6. Chapter Summary ................................................................................................................. 85
Chapter 5 Mandatory NFI Disclosures and Firm Risk ......................................................... 87
5.1. Introduction ......................................................................................................................... 87
5.2. The European Union’s NFI Directive 2014/95/EU ................................................................ 87
5.3. The Impact of Directive 2014/95/EU on NFI Disclosures ...................................................... 88
5.4. The Impact of the EU Directive on Future Earnings Risk ...................................................... 93
5.5. Chapter Summary ................................................................................................................ 97
Chapter 6 Summary and Conclusions ................................................................................ 99
6.1. Introduction ......................................................................................................................... 99
6.2. Research Background and Objectives ................................................................................... 99
6.3. Study Sample, Data and Empirical Models ........................................................................ 100
6.4. Summary of Findings ........................................................................................................... 100
6.4.1. NFI disclosures and earnings risk ...................................................................................... 101
6.4.2. Sensitive industries and NFI disclosures ............................................................................ 102
6.4.3. NFI disclosures and earnings risk (sensitive vs non-sensitive industry firms) ................... 102
6.4.4. The impact of mandatory NFI regulations ........................................................................ 103
6.4.5. The impact of mandatory NFI regulations on the NFI and earnings risk link .................... 103
6.5. Practical and Policy implications ......................................................................................... 104
6.5.1. Implications for corporate managers................................................................................ 104
6.5.2. Implications for firm stakeholders .................................................................................... 104
6.5.3. Implications for regulators ................................................................................................ 105
6.6. Research Contribution ........................................................................................................ 106
6.7. Research Limitations ........................................................................................................... 107
6.8. Future Research ................................................................................................................. 108
Appendix A ............................................................................................................................. 109
Appendix B ............................................................................................................................. 115
Appendix C ............................................................................................................................. 117
References ………………………………………………………………………………………………………………………139

vi
List of Tables
Table 3. 1. Index and industry-wide companies that comprise the study sample ............................... 39
Table 3. 2. A summary of the study variables and expected signs ....................................................... 47
Table 4. 1. The descriptive statistics of the study variables ................................................................. 56
Table 4. 2. Pairwise correlation matrix of the study variables ............................................................. 60
Table 4. 3. The impact of NFI disclosures on firms’ earnings risk ......................................................... 62
Table 4. 4. The impact of NFI disclosure quartiles on firms’ earnings risk ........................................... 66
Table 4. 5. The impact of NFI disclosures on stock return volatility ..................................................... 70
Table 4. 6. The impact of NFI disclosures on firms’ earnings risk (Alternative proxies) ....................... 71
Table 4. 7. The impact of NFI disclosures on firms’ earnings risk (Alternative proxies) ....................... 72
Table 4. 8. The impact of NFI disclosure on firms’ earnings risk (Lagged variables) ............................ 74
Table 4. 9. The impact of NFI disclosure on firms’ earnings risk (System GMM estimator) ................. 76
Table 4. 10. Balance table of ES statistic comparison ........................................................................... 80
Table 4. 11. The effect of sensitive industry membership on NFI disclosure levels ............................. 81
Table 4. 12. The impact of NFI disclosures on firms’ earnings risk – Split sample approach ............... 83
Table 4. 13. The impact of NFI disclosures on firms’ earnings risk – Interaction approach ................. 84
Table 5. 1. The balance table of ES statistics ........................................................................................ 90
Table 5. 2. The impact of the EU directive on NFI disclosures .............................................................. 92
Table 5. 3. The impact of NFI disclosures on firms’ earnings risk (pre and post EU directive) ............. 95
Table 5. 4. The impact of NFI disclosures on firms’ earnings risk (Australian sample) ......................... 96
Table A.1. The Hausman test estimates of the study variables .......................................................... 109
Table A.2. The impact of NFI disclosures on firms’ earnings risk ....................................................... 110
Table A.3. The impact of NFI disclosures on firms’ earnings risk ....................................................... 111
Table A. 4. The impact of NFI disclosures on firms’ earnings risk ....................................................... 112
Table A.5. The impact of NFI disclosures on firms’ earnings risk ....................................................... 113
Table A.6. The impact of NFI disclosures on firms’ earnings risk (non-financial firms) ..................... 114

vii
List of Figure
Figure 4.1. Evolution of NFI disclosures ................................................................................................ 57
Figure B.1. Overlap plot of propensity scores between sensitive and non-sensitive firms ................ 115
Figure B.2. Overlap plot of propensity scores between regulated and unregulated firms ................ 116

viii
Acknowledgements
All the praises and thanks be to Allah Almighty, Who guided me and gave me the strength to
complete my PhD studies. May the peace and blessing of Allah Almighty be upon Muhammad
(peace be upon him), who is the perfect mentor.
Firstl, I express my utmost gratitude to Prof. Christopher Gan for his guidance, support and
motivation throughout this journey. He did not only guide and support me to complete the
PhD thesis but also provided many opportunities to learn and grow in the academic field. He
has always been a source of motivation and inspiration throughout my time at Lincoln
University. I would also sincerely thank my asscociate supervisor, Dr Muhammad Nadeem
(Senior Lecture at Otago Business School, Otago University), for his valuable guidance and
contribution to my PhD research thesis.
I thank my employer Shaheed Benazir Bhutto University (SBBU), Shaheed Benazirabad,
Pakistan, and the Higher Education Commission, Pakistan, for the provision of funds for my
PhD studies without which this journey would not have been possible. Notably, I thank Mr
Najam Ud din Sohu, Akhtar Hussain Mangi and Qurban Farooqi for their continuous support
during my PhD tenure at Lincoln University. I would also like to thank Nicos Tescos who
ensured my employment at Lincoln University.
The completion of my PhD studies and my stay in New Zealand would not have been possible
without continuous support from my family, especially my parents, wife, siblings and in-laws.
They have always encouraged and supported me during this time. I pay special thanks to my
father and mentor, Muhammad Ramzan. He has always been a source of inspiration and
motivation to achieve higher standards of education throughout my life.
I also thank all my friends who supported me to this point in my life. Notably, my sincere
gratitude goes to Mudassar Hasan, Abu Bakr Naeem, Aon Waqas, Javed Ali, Rashid Waheed,
Sanaullah, Raheel Khan, Tauseef Khan Babar and Mabruk Billah for their support and guidance
throughout my life. Lastly but most importantly, I extend sincere gratitude to all my teachers
and alma maters. They nurtured my skills and abilities to achieve the ultimate goal in my
academic career, the completion of my PhD studies.

1
Chapter 1
Introduction
1.1. Introduction
Today’s world is overloaded with an abundance of information and there has never been
more demand for data. Similarly, businesses are increasingly required to report information
related to all aspects of their operations and activities. Requests for such information not only
come from the firms’ shareholders but also other stakeholders such as suppliers, regulators,
NGOs and creditors, who demand information about firms’ business processes, products,
policies and impacts on society (Camilleri, 2015).
Stakeholders, including the firms’ shareholders, seek information to make informed
decisions. For example, shareholders and creditors make investment decisions; suppliers
make decisions to conduct business with a firm and customers make purchase decisions. All
these stakeholders need information to make the best decisions and narrow the information
gap between themselves and corporate managers, better known as the information
asymmetry problem in the finance literature (Bhattacharya & Singh, 2018; Cui, Jo, & Na, 2018;
Easley & O'hara, 2004).
To satisfy their stakholders’ information needs, historically, firms have provided information
mainly on their financial matters using conventional financial statements such as the
statement of financial position, income statement and statement of stakeholders’ equity.
However, these statements mainly cater to the information needs of stakeholders with a
financial interest in the firm, i.e., shareholders and creditors. The information needs of
stakeholders seeking data about a firm’s policies and activities for a sustainable environment,
society well-being, work ethics and governance issues, remain unnswered (Bozzolan, Favotto,
& Ricceri, 2003; Manes-Rossi, Tiron-Tudor, Nicolò, & Zanellato, 2018).
As a result, corporate managers started to report more information in their business
communications to cater for the needs of the broad range of stakeholders. This information
is mainly non-financial and includes details of a firm’s policies and practices concerning
governance, environmental sustainability, society, and employees (Burgman, Roos, Boldt-
Christmas, & Pike, 2007; Cortesi & Vena, 2019; Felber, Campos, & Sanchis, 2019). Firms use

2
several reports and statements to make non-financial information (NFI) disclosures. The most
common statements are: corporate social responsibility (CSR) reports, statements of the code
of ethics and conduct, statements from the senior decision-maker (CEO, President),
statements of corporate intent, corporate governance reports, and, more recently, integrated
reports. Some of the NFI disclosure reports such as CSR and sustainability reports are used
interchangeably in this study.
Historically, NFI disclosures have had a long journey, starting with the concept of social
responsibility (Bowen, 1953) and stakeholder concerns (Davis, 1960). Sethi (1975)
emphasised the need to link social responsibility with corporate strategy and actions.
Progressively, Carroll (1979) provided a detailed framework of corporate social performance
consisting of four stages of customer social responsibility (CSR) development: economic, legal,
ethical, and philanthropic obligations. These ground-breaking studies laid the foundations for
issues that business managers should address in their corporate communications. There has
been a steady increase in NFI disclosures and many third party organisations have started to
develop NFI databases1 that measure the extent of corporate disclosures and performance in
the areas of environmental, social, economic and governance issues. Given the availability of
comprehensive NFI databases, NFI disclosures are also available in disaggregated components
as environmental, social and governance (ESG) disclosures.
Although there has been a recent noteworthy increase in the quantity and quality of NFI
reporting (Arvidsson, 2011; Coluccia, Fontana, & Solimene, 2016; Jain, Keneley, & Thomson,
2015; Sethi, Martell, & Demir, 2017) around the world, these disclosures have been largely
voluntary (Hoffmann, Dietsche, & Hobelsberger, 2018; Muslu, Mutlu, Radhakrishnan, &
Tsang, 2019). Because of their voluntary nature and a lack of accounting standards and
frameworks, the format and content of NFI disclosures have generally been unstandardized
and inconsistent (Demir & Min, 2019; Muslu et al., 2019; Sethi et al., 2017). Additionally, rapid
growth and changes in the content and methodology of sustainability reporting tools
complicate the use of NFI disclosures for organisational stakeholders (Siew, 2015).
Consequently, there has been a lack of interest from academics, analysts and practitioners
1 Kinder, Lydenberg and Domini (KLD), Thomson Reuters ESG, Refinitiv ESG, Bloomberg ESG database and others.
3
about using the information content of these statements and reports in their efforts to
comprehend organisations’ NFI disclosures and their quality.
Nevertheless, after the establishment of international standards and organisations such as
ISO 26000, the Global Reporting Initiative (GRI), Sustainability Accounting Standards Board
(SASB) and the International Integrated Reporting Council (IIRC), firms now have more
knowledge and better guidance available to develop their NFI disclosures. Therefore,
organisations adopting the improved reporting frameworks produce standardised, coherent
NFI disclosures that are useful to measure the quantity and quality of NFI reporting across a
large variety of organisations (Bhattacharyya & Yang, 2019; Crisóstomo, de Azevedo
Prudêncio, & Forte, 2017; Demir & Min, 2019). Additionally, countries and economic regions2
are enacting NFI disclosure regulations and developing reporting frameworks to provide
consistent, mandatory guidelines for firms’ NFI disclosures. These regulations3 mainly target
achieving sustainable, accountable, responsible and transparent business practice targets set
by relevant governments, the United Nations’ sustainable development goals (SDGs), and the
United Nations Paris Climate Change Agreement (Nations, 2015).
In this vein, (Directives, 2014) enacted by the European Parliament, provides a detailed
framework for mandatory NFI reporting by large4 organisations and required all member
states to adopt the framework by the end of 2016. This directive amends the non-mandatory
Directive 2013/34/EU and Regulation (EC) No 562/2006 that were in place in the EU for
disclosure of NFI. This recent directive requires firms to report information on six broad
topics: 1) environmental, 2) social, 3) employee matters, 4) respect for human rights, 5) anti-
corruption, and 6) bribery matters, as the minimum mandatory requirement of NFI
disclosures. Firms are also required to report how their business model, policies, policy
outcomes, potential risks and key performance indicators (KPIs) synchronise with the six
broad topics in NFI disclosures.
2 An economic region is a group of countries that have geographical proximity and share similar economic and
financial patterns and regulations e,g,. ASEAN, the EU, South Asian Association for Regional Cooperation
(SAARC). 3 NFI reporting is a stock exchange listing requirement in Malaysia and South Africa. China and Denmark made ESG
reporting mandatory for large organisations in 2008 and 2009, respectively. 4 Companies with a total balance sheet, net turnover and average number of employees over EUR 400,000, EUR
800,000 and 500, respectively.

4
Significant developments in the reporting and regulatory frameworks provide opportunities
to explore the impact of NFI disclosure regulations on the quantity and quality of corporate
NFI disclosures. Notably, the recent NFI reporting regulation by the EU is vital for two reasons.
First, it has to be adopted by all EU member countries, so it has considerable implications in
its scope. Secondly, it affects some of the largest corporations in the world.
The literature also reports the impact of NFI reporting regulations on the extent of NFI
disclosures and how such regulations affect firm risk and value. For example, Ioannou and
Serafeim (2017) report increased ESG disclosures following the enforcement of mandatory
NFI disclosure regulations in China, Denmark, Malaysia, and South Africa. They also report an
increase in firm value for reporting firms. Similarly, using South Africa’s integrated reporting
regulation, Bernardi and Stark (2018) report an increased level of ESG disclosures that, in turn,
results in increased analysts’ forecast accuracy. These findings show NFI regulations not only
increase the level of CSR disclosures, but also moderate the link between CSR disclosures and
information asymmetry and firm value. Given the recent NFI regulation enacted by the
European parliament in 2014, it is pertinent to investigate how the enforcement of this
regulation affects the disclosure practices of the regulated organisations.
Potential improvements in the quality of NFI disclosures under a mandatory reporting regime
can serve as a channel to reduce information asymmetry among a range of stakeholders. The
improved quality of disclosed information serves as a legitimacy enhancing tool and offers
potential benefits. For example, using South Africa’s mandated integrated reporting case, Lee
and Yeo (2016) suggest that integrated reporting mitigates the information asymmetry
among managers and creditors. It serves as a tool for enhancing firm value. Similarly, Bernardi
and Stark (2018) report an increase in analysts’ earnings forecast accuracy after the
mandating of integrated reporting in South Africa. Their results suggest that the mandated
disclosure regime prompted higher quality of information disclosures, resulting in reduced
information asymmetry among financial analysts. Therefore, it is important to explore
whether improved disclosure helps regulated organisations to reduce their risk.
In a broader context, the literature reports a significant negative relationship between NFI
disclosures and firm risk. Prior studies use standard measures of firm risk such as cost of
capital, bid-ask spread, idiosyncratic risk, systematic risk and analysts’ forecasts. Studies on

5
the relationship between NFI disclosure and analysts’ forecasts dispersion provide evidence
of a significant negative relationship (Bouslah, Kryzanowski, & M’Zali, 2013; Chien & Lu, 2015;
Dhaliwal, Li, Tsang, & Yang, 2011; Jo & Na, 2012; Kothari, Li, & Short, 2009). Some studies use
analysts’ forecasts dispersion as a measure of information asymmetry (Dhaliwal,
Radhakrishnan, Tsang, & Yang, 2012; Schulz, 2017) and others as a measure of risk (Chien &
Lu, 2015; Kothari et al., 2009) because of different underlying assumptions. Nevertheless,
Barron, Stanford, and Yu (2009) reconcile the contradictory evidence of analysts forecasts
dispersion as a measure of information asymmetry or uncertainty. They conclude that the
dispersion level of analysts’ forecasts represents uncertainty, which is negatively associated
with firms’ future stock returns. Consequently, we apply this explanation to use analysts’
forecasts dispersion as a measure a firm’s future earnings risk. We maintain that analysts’
forecasts dispersion is a better measure for analysing the complexity of a firm’s information
environment than traditional risk proxies such as systematic, idiosyncratic and total risk.
1.2. Knowledge Gaps
The availability of comprehensive NFI disclosure datasets and their division into
environmental, social and governance components provides promising avenues to
understand which dimensions of NFI disclosures are most valued by the market participants
such as financial analysts, investors and regulators. Therefore, it is worthwhile to investigate
how the total and different dimensions of NFI disclosures affect an organisation’s information
environment and influence its future earnings’ risk. This enquiry becomes more important for
firms operating in sensitive industries5. Given the environmental and social sensitivity of their
operations, firms in sensitive industries face stringent scrutiny from stakeholders to keep their
communications transparent and provide all the relevant information to stakeholders (Emma
& Jennifer, 2021; Sethi, Martell, & Demir, 2016; Yusoff, Yusoff, Abd Rahman, & Darus, 2019).
Previous empirical studies on NFI disclosure and the firm risk relationship report economically
valuable, statistically significant findings for a diverse collection of samples and periods. For
example, (see Benlemlih et al., 2018; Oikonomou, Brooks and Pavelin, 2012; Sassen, Hinze
and Hardeck, 2016). However, to the best of our knowledge, no previous study explores the
5 Following Baron et al. (2011) and Garcia et al. (2017), we treat a firm as a sensitive industry firm if it belongs to
the alcohol, tobacco, gambling, weapon production, adult entertainment, oil, gas, and consumable fuels, metals
and mining, paper and forest products, chemicals, construction materials, or energy businesses.

6
disaggregated6 effect of NFI disclosures on earnings risk. The literature is also silent on the
impact of NFI disclosures on earnings risk for sensitive industries, i.e., industries that need to
make higher NFI disclosures to maintain the legitimacy of their operations.
Because of increasing pressure from stakeholders and regulators, NFI disclosures are shifting
from voluntary to mandatory. This change in the status of NFI disclosures has significant
implications for corporate disclosure policies. Prior studies report the effect of NFI regulation
on the extent of a firm’s disclosures and its mediating impact on firm value (Ioannou &
Serafeim, 2017) and analysts’ forecasts accuracy (Bernardi & Stark, 2018) at country level.
Similarly, recent NFI regulations in the EU provide a unique opportunity to examine the effect
of mandatory NFI regulations on the magnitude of firms’ disclosures at a regional level. It is
also worthwhile investigating the mediating impact of mandatory NFI reporting regulations
on firms’ earnings risk and the NFI disclosure relationship.
1.3. Research Questions
Based on the research gaps identified from the literature review, this study aims to address
the following research questions:
i. What is the impact of cumulative and disaggregated NFI disclosure scores on the
earnings risk for S&P1200 index firms?
ii. What is the impact of sensitive industry status on the level of overall and
disaggregated NFI disclosures for S&P1200 index firms?
iii. Does the impact of total and disaggregated NFI disclosure scores on earning risk vary
between sensitive and non-sensitive industry firms included in the S&P 1200 index?
iv. How did the enforcement of mandatory NFI disclosure requirements change the
degree of NFI disclosures at the total and disaggregated levels for S&P 350 EU index
firms?
v. Did the enforcement of mandatory NFI disclosure requirements strengthen the
relationship between NFI disclosure and earnings risk for S&P 350 EU index firms?
6 NFI disclosures are commonly disaggregated into environmental, social and governance (ESG) components.

7
1.4. Purpose of the Research
As discussed earlier, organisations increasingly make NFI disclosures to provide much-needed
information to market participants so they can make informed decisions. Using NFI
disclosures, organisations aim to send positive signals to stakeholders and market participants
to enhance organisational legitimacy (Ochi, 2018). The purpose of these signals is two-fold;
first, these signals improve firms’ legitimacy. Secondly, they improve firms’ information
environment, which results in better forecasts of their future earnings.
To test this idea, this study first explores the nature and magnitude of NFI disclosures’ impact
on future earnings risk for S&P1200 index companies. The proxy for NFI disclosure is ESG
disclosure scores reported in the Bloomberg ESG database and the proposed proxy for
earnings risk is analysts’ earnings forecasts dispersion. We adopt Barron et al. (2009)
definition to measure the dispersion of analysts’ earnings forecast for a firm, which represents
a firm’s earnings risk. This study also explores the impact of individual components of ESG,
environmental, social and governance disclosures, on earnings risk. The disaggregated
analysis aims to ascertain whether different categories of ESG disclosure have varying
importance in improving a firm’s information environment.
Secondly, this study aims to measure the impact of sensitive industry status on firms NFI
disclosures and the resulting impact of NFI disclosure scores on firm risk for sensitive industry
firms. We aim to confirm and extend the evidence in the literature that sensitive industry
firms make higher NFI disclosures because of higher environmental and social risk exposure
(Du & Vieira, 2012; Garcia, Mendes-Da-Silva, & Orsato, 2017; Kilian & Hennigs, 2014; Vollero,
Conte, Siano, & Covucci, 2019). Following (Baron, Harjoto, & Jo, 2011; Garcia et al., 2017), we
treat a firm as a sensitive firm if it belongs to the alcohol, tobacco, gambling, weapon
production, adult entertainment, oil, gas, and consumable fuels, metal and mining, paper and
forest products, chemicals, construction materials, or energy businesses.
Thirdly, this study explores the impact of NFI reporting regulations on the quantity of firms’
NFI disclosures. To test this relationship, we use the recent NFI disclosure regulations enacted
by the European parliament as an exogenous shock for the disclosure practices of
organisations domiciled in the EU. Lastly, this study investigates the changes in the
relationship between earnings risk and NFI disclosures after the enforcement of mandatory

8
disclosure regulations. To that end, this study uses difference in differences (DID) analysis to
investigate the enforcement impact of NFI reporting regulations on the relationship between
NFI disclosures and earnings risk for European firms. For the DID method, the treatment group
includes constituents of the S&P Europe 350 Index, which is a sub-index of the S&P Global
1200 Index. We include S&P Europe 350 index companies in the treatment group as the
(Directives, 2014) applies only to companies domiciled in the EU. The other companies in the
S&P Global 1200 Index constitute the control group.
1.5. Significance of the Research
Recently, business organisations have not only faced increased pressure from legislators and
international standards organisations to include NFI disclosures in their corporate
communications, but investors and professional fund managers also assign a higher weight to
NFI disclosures in their investment decisions. A 2018 report7 documents professionally
managed investments of US$20 trillion are tied exclusively to socially responsible investment
(SRI) funds, which have increased from $7.6 trillion in 2010, a growth of 163% in just eight
years. Similarly, signatories to the United Nations-backed Principles of Responsible
Investments (UNPRI) have increased from 850 to 1600. McKinsey and Company (2002) reveal
that investors are willing to pay an average of a 25% premium for rightly governed company
shares. Additionally, consumers are willing to pay higher prices for eco-friendly products
(Fanasch & Frick, 2020; Mostafa, 2016). These findings suggest that socially responsible
investments are gaining momentum so investors and other stakeholders will assign a higher
weight to firms’ NFI disclosures in making investment decisions and assessing financial
performance and risk. Consequently, firms will improve their NFI disclosures to attract more
socially responsible investors and also avoid information the information asymmetry problem
between different stakeholder groups.
However, given the nature of the information and the lack of homogeneous reporting
frameworks, the use of broader NFI disclosure proxies such as stand-alone sustainability/CSR
reports is not a suitable approach. Thus, comprehensive, well-developed NFI disclosure
proxies are required to capture the real effect of NFI disclosures on firms’ earnings risk.
7 Report on US Sustainable, Responsible and Impact Investing Trends
https://www.ussif.org/files/Trends/Trends%202018%20executive%20summary%20FINAL.pdf

9
Consequently, this study uses the Bloomberg ESG disclosure score as a proxy of a firm’s NFI
disclosures. The Bloomberg ESG database provides data for over 11,500 companies across 70
countries. Bloomberg analysts construct ESG disclosure scores by using an over 900 data field
across a variety of NFI indicators, such as air quality, water and energy management, human
capital, waste management, compensation, diversity, shareholders rights. Bloomberg uses
company reported data from CSR reports, annual reports, company websites and other
company sources to maintain accuracy and consistency in their database8.
Given the depth and breadth of data used, Bloomberg ESG disclosure scores serve as a better
proxy than broader proxies of NFI disclosures such as stand-alone CSR reports, and inclusion
in sustainability indices. Additionally, the availability of individual scores for the ESG
dimensions is useful to measure the disaggregated impact of each component of ESG
disclosures on a firm’s risk. The disaggregated analysis will help to identify which aspects of
ESG disclosures drive the association between firm risk and NFI disclosures.
This study uses analysts’ earnings forecasts dispersion as a proxy for a firm’s earnings risk. We
use this proxy for two reasons. First, the accuracy of analysts’ earnings forecasts for a firm
mainly depends on the availability of public information. Secondly, this proxy better captures
the risk inherent in the information environment of a firm compared with conventional risk
proxies such as stock return volatility, systemic risk and idiosyncratic risk.
The arguments presented above suggest the use of precise, well developed NFI disclosures
and firm risk proxies to capture true nature and magnitude of the relationship between firm
risk and NFI disclosures. To the best of our knowledge, no prior study provides categorical
evidence of a relationship between firm risk and NFI disclosures at the international level.
Hence, this study’s results promise to add new insights to existing NFI disclosure literature.
Further, the use of analysts’ forecasts dispersion as an earnings risk proxy is a novel, valuable
contribution to the current knowledge concerning the effects of NFI disclosures on firms’ risk
profile. This study also presents evidence about sensitive industry firms that face stringent
scrutiny because of the nature of their business.
8 https://data.bloomberglp.com/professional/sites/10/1148330431.pdf

10
This study’s findings provide useful suggestions for corporate managers and decision makers
about reducing the uncertainty surrounding future earnings of a firm through the information
channel. This study’s results can potentially be used to mitigate agency problems and
legitimacy issues that are critical for modern firms, especially sensitive industry ones.
Addressing the agency and legitimacy issues have become essential because of ever-
increasing governance and sustainability issues, stakeholder pressures and shifting investors’
preferences towards socially responsible investment. Thus, this study is a timely enquiry to
answer pressing questions that corporate managers face regarding their efforts to minimise
the adverse environmental and social effects of business operations and practices.
Prior studies, e.g., (Schulz, 2017; Siew, Balatbat, & Carmichael, 2016), investigating the
relationship between information asymmetry and firm risk indicate the need for the
enactment and enforcement of mandatory NFI disclosure regulations to improve timeliness
and standardisation of NFI disclosures. Those studies also suggest standardisation and
timeliness of NFI disclosures would enhance analysts’ information processing efficiency.
Given the importance of NFI regulations, this study investigates the impact of mandatory NFI
regulations on the extent of NFI disclosures and determines the changes in the relationship
between firms’ earnings risk and NFI disclosures after the enforcement of such regulations.
Importantly, this study investigates the impact of the NFI regulations enacted by the EU. This
regulation provides the opportunity to investigate the impact of NFI reporting regulations at
a regional level. Exploring the impact of mandatory NFI regulations at a regional level is a
valuable contribution to the literature since current evidence is limited to country-level
(Bernardi & Stark, 2018; Ioannou & Serafeim, 2017) regulations. To the best of our knowledge,
this is the first study that attempts to ascertain the impact of a legislative change in this
research area at an international level.
1.6. Research Findings
This study’s results reveal important insights regarding the relationship between NFI
disclosures and firms’ earnings risk. First, this study shows that cumulative and disaggregated
NFI disclosures exhibit a strong negative impact on firms’ earnings risk. Notably, the social
and environmental dimensions of NFI disclosures exhibit negative impact on firms’ earnings
risk. However, governance disclosures do not reduce earnings risk for our sample firms. The

11
quartile-based analysis reveals that higher quartiles of overall and disaggregated NFI
disclosures have a more substantial negative impact than lower quartiles. These results are
robust for alternative measures of firm risk and firm characteristics, sub-sample analyses, and
endogeneity problems.
Second, using a propensity score weighted sample, this study shows that sensitive industry
firms report higher overall and disaggregated NFI disclosures than non-sensitive firms. This
difference is more pronounced for the environmental and social dimensions. Using the
interaction term and split-sample approaches, this study confirms that the disclosure of
environmental information provides more benefit to sensitive industry firms in reducing
earnings risk than for non-sensitive industry firms. Governance disclosures benefit non-
sensitive industry firms only with regard to reducing uncertainty surrounding future earnings.
This study offers significant evidence that sensitive industry firms may increase the legitimacy
of their operations and reduce earnings risk by improving their NFI disclosures, especially the
disclosure of environmental information.
Finally, this study uses a recently enacted EU NFI reporting directive to quantify its impact on
the NFI disclosures level and the resulting impact on the earnings risk of European firms in
the study sample. Using a propensity weighted sample, this study finds a significant positive
impact of the EU directive on the level of cumulative and disaggregated disclosure scores of
the treated firms compared with the control group firms. The difference-in-differences
analysis results confirm that the post-directive cumulative and disaggregated NFI disclosures
have a more pronounced impact on earnings risk than pre-directive disclosures. These
findings provide decisive evidence to conclude that mandating NFI disclosures results in
higher disclosures that in turn, increase the efficiency of reported information in reducing
uncertainty surrounding a firm’s future earnings.
1.7. Organisation of the Thesis
The rest of the thesis is as follows: Chapter 2 presents a literature review related to NFI
disclosures, the theoretical foundations of NFI disclosures, the relationship between NFI
disclosures and firm risk. The literature on the impact of NFI disclosure regulations on the
degree of disclosures and firm risk is discussed. Chapter 3 discusses the data collection,
measurement of data variables and the study’s research methodology. Chapter 4 separately

12
presents the descriptive and empirical results on the impact of NFI disclosures on firm risk for
the S&P 1200 companies and sensitive industries firms. Chapter 5 presents the evidence on
the impact of NFI disclosure regulations on the degree of NFI disclosures and the mediating
impact on the firm earnings risk and NFI disclosures relationship. Chapter 6 discusses the
policy and market implications of the findings and concludes the thesis. Finally, the study’s
limitations and future directions for NFI disclosures research are discussed.

13
Chapter 2
Literature Review
2.1. Introduction
Business organisations have long been recognised for their influential role in economic, social
and legal systems around the world. As a result, the activities and operations of business
entities come under scrutiny from different stakeholders such as shareholders, creditors,
government agencies and non-governmental organizations (NGOs). Additionally, because of
increasing stakeholder demands, media pressure and consumer awareness, firms now face
immense pressures to be more transparent, sustainable and ethical in their communications
regarding their business practices and operations. Therefore, to legitimise their actions and
meet the information needs of the stakeholders, businesses publish information related to
their policies, operations and business outcomes. Traditionally, the information content of
corporate communications has been investor and creditor centric; mostly financial. However,
because of increased awareness and concerns about social, environmental and governance
issues among stakeholders, firms have started to integrate NFI disclosures in their
communications. NFI disclosures contain information about business policies, processes,
work ethics, concern for employees, and contribution to environment and society, i.e., mostly
non-financial information.
Although businesses have started to make more NFI disclosures, these disclosures have been
mostly voluntary and unstandardized. Given the voluntary nature of non-financial
information and the lack of reporting standards, the content and presentation of such
information have been very diverse and inconsistent (Demir & Min, 2019; Muslu et al., 2019;
Sethi et al., 2017). However, there have been enormous developments such as establishment
NFI reporting frameworks, e.g., the global reporting initiative (GRI), the International
Integrated Reporting Council (IIRC), and the Sustainability Accounting Standards Board (SASB)
frameworks. The evolution of mandatory NFI reporting regulations in different countries has
changed and improved the quantity and quality of NFI disclosures over the years.
Given the broad nature of information covered under NFI disclosures, the literature on this
topic uses a variety of terms to characterize seemingly similar information. Therefore, terms
like corporate social responsibility (CSR), environmental, social and governance (ESG), and

14
sustainability disclosures are used interchangeably. Similarly, there are various reports that
firms use to report NFI disclosures such as CSR reports, sustainability reports, statement of
the code of ethics and conduct, the statement from senior decision-maker (CEO, President),
statement of corporate intent, corporate governance reports, and, more recently, integrated
reports. As NFI disclosures contain diverse information, more recently, data providers9,
practitioners and academics have started to divide NFI disclosures into three broad
categories: environmental, social and governance disclosures to empirically measure the
effect of NFI disclosures on the various factors of firm profitability and risk.
Although studies on NFI disclosures and their implications entail a very diverse, detailed
knowledge base in the finance and accounting literature, the following sections review the
literature that is most relevant to this study’s scope. The review starts from the theoretical
foundations that conceptualize the needs and consequences of NFI disclosures and follows
the historical development of definitional constructs and NFI reporting. The subsequent
sections present the literature regarding the impact of NFI disclosures on firm performance,
information asymmetry and firm risk. The last section discusses the literature on the
developments of NFI disclosure regulations and their impact and mediating effect on the
extent of disclosures, firm value and information asymmetry.
2.2. Theoretical Foundations
Given the far-reaching effect of NFI disclosures, there are several motivations for a firm to
disclose NFI in its corporate communications. Prior studies use several theories to address the
issue of the social responsibilities of firms and identify sources that require firms to be more
transparent in their business conduct and information disclosures. For example, using the
well-known agency cost framework (Borghei, Leung, & Guthrie, 2018; Garcia et al., 2017)
provides evidence of reduced information asymmetry for firms with improved ESG related
disclosures. These studies show NFI disclosures help firms resolve the information asymmetry
problem that has multiple adverse effects on the organization-stakeholder relationship. For
example, information asymmetry could result in lower investor confidence, mispricing of firm
value and higher cost of capital.
9 Bloomberg ESG database, MSCI ESG research, Refinitiv ESG score and others.

15
Studies also provide evidence of comparatively higher ESG related disclosures from
sensitive/controversial industry firms (Gamerschlag, Möller, & Verbeeten, 2011; Garcia et al.,
2017). These authors maintain that sensitive industry firms go through strict scrutiny by
stakeholders so they make higher ESG disclosures to maintain the legitimacy of their business
operation. The literature on NFI disclosures identifies three main theories that fundamentally
identify the motives and grounds for managers to disclose NFI. These theories are: 1) the
Agency Theory; 2) the Legitimacy Theory; and 3) the Stakeholder Theory.
2.2.1. Agency Theory
Jensen and Meckling (1976) define the agency relationship as “a contract under which one or
more persons (the principal(s)) engage another person (the agent) to perform some service
on their behalf which involves delegating some decision making authority to the agent. If both
parties to the relationship are utility maximisers there is a good reason to believe that the
agent will not always act in the best interests of the principal” (p. 5). They also introduce the
concept of agency cost as a combination of three elements: “1) the monitoring expenditures
by the principal; 2) the bonding expenditures by the agent; and 3) the residual loss” (p.5).
They define “residual loss” as the decrease in the market value of a firm arising from a poor
agency relationship between principals and agents. On the other hand, the conflict of interest
between principals and agents generates an information gap, because the agents, being in-
charge of the business, possess first-hand information about the firm and principals depend
on agents to get access to this information. Principals not only pay incentives to the agents to
align their objectives with them but also provide more incentives to keep the information gap
as small as possible (Shapiro, 2005). These foundational works on agency theory provide the
rationale for NFI disclosures by corporate managers to align principal-agent objectives and
reduce agency costs via a reduction in information asymmetry.
Many researchers have used agency theory to conceptualize the relationship between NFI
disclosures and information asymmetry, firm performance and risk. For example, Borghei et
al. (2018) maintain that corporate managers make extra efforts to disclose more NFI to
resolve agency problems arising from information asymmetry. They report a decrease in
information asymmetry following carbon disclosures for non-greenhouse gas registered
companies in Australia. Similarly, (Garcia et al., 2017; Ness & Mirza, 1991) find a reduction in

16
information asymmetry because of the adoption of integrated reporting. Jo and Harjoto
(2012) reject the “CSR over-investment” argument of agency theory since they find a positive
relationship between firms’ CSR and financial performance. They argue that disclosure of CSR
information plays an important role in increasing a firm’s financial performance. Further, ESG
disclosure transparency increases firm value through the information asymmetry and agency
cost reduction channel (Yu, Guo, & Luu, 2018). Looking from the lense of agency theory, Velte
(2020) report a two-way association between institutional shareholders and corporate ESG
disclosures.
Studies also report that NFI disclosures are more prevalent in economies that promote higher
levels of stakeholder protection. For example, Martínez‐Ferrero, Ruiz‐Cano, and García‐
Sánchez (2016) report that additional, voluntary NFI disclosures can help reduce agency
problems. They also suggest that environments with a higher social responsibility
commitment reduce agency conflict by increased voluntary disclosures. Conversely,
Kartadjumena and Rodgers (2019) report a negative impact of climate and environmental
reporting by managers on financial performance and market value of Indonesian banks. They
argue that banking firms in Indonesia are practising sustainability reporting as an altruistic
rather than a strategic motive. Recognizing the importance of NFI disclosures in risk
optimization for shareholders, this study uses agency theory concepts to ascertain a reduction
in the agency problem as a result of lower future earnings risk.
2.2.2. Legitimacy Theory
Legitimacy theory considers business organizations as part of a larger social system, hence
firms are required to abide by the social and ethical norms of the society where they operate.
A comprehensive, straightforward definition of legitimacy theory is given by (Kaplan &
Ruland, 1991) as “organizational legitimacy is a process, legitimation, by which an
organization seeks approval (or avoidance of sanction) from groups in society” (p. 370).
Legitimacy theory comprehends organizational efforts to be more transparent and provide
additional information as a way to legitimize firms’ existence in society and avoid adverse
outcomes of their operations and actions. Additionally, organizations pursue business
legitimacy objectives to abide by the social contract that they have with society. These social
contracts can be macro- or micro-social contracts as explained by the integrative social

17
contract theory. According to (Donaldson & Dunfee, 1999), macrosocial contracts are hyper
norms that are acceptable at the level of society as a whole like anti-bribery policies,
employees’ rights protection, and sustainable use of natural resources. Microsocial contracts
are specific to a particular society or culture like religious and cultural sensitivities. For
example, multinational organizations operating in Muslim countries cannot use an obscene
advertisement to promote their products. With macrosocial contracts, organizations make
more NFI disclosures as a result of regulations introduced by governments and international
standard organizations to maintain and enhance their legitimacy (Arena, Liong, & Vourvachis,
2018; Bernardi & Stark, 2018).
Similarly, firms operating in countries that promote higher levels of stakeholder protection,
make more environmental and social disclosures to meet the socially acceptable standards of
business conduct (Martínez‐Ferrero et al., 2016). Additionally, to establish legitimacy and
maintain a balance between corporate objectives, firms carefully trade-off between voluntary
and mandatory corporate disclosures. For instance, Fallan and Fallan (2019) maintain that
firms make a trade-off between corporate tax behaviour and environmental performance
disclosures. Although both are essential elements of NFI disclosures, they cater to the needs
of different stakeholders and have different reporting requirements. Hence, firms must
decide an optimum focus level on such elements to maintain legitimacy from the perspectives
of different stakeholders. These social contracts are influenced by organizational
characteristics. For example, large firms are considered more liable to practice socially
acceptable practices because of their more significant impact on society. Similarly, firms
working in the natural resources sector are considered more accountable to practice
sustainable business practices than other firms.
Prior studies report the influence of firms’ characteristics on their legitimacy seeking
behaviour. For example, Reverte (2009) reports firms’ media exposure, size and industry to
be the main determinants of their CSR disclosures. Hence, the author claims disclosures of
NFI as legitimacy seeking behaviour. Similarly, Khan, Muttakin, and Siddiqui (2013) find
corporate governance indicators, such as foreign ownership, board independence, and
presence of an audit committee, as major determinants of CSR disclosures that strengthen
the view of the corporate legitimacy theory. Firms operating in environmentally sensitive

18
and/or socially controversial industries face more scrutiny from society. Hence, they need to
make more significant NFI disclosures to maintain their legitimacy. Consequently, several
studies report evidence of higher NFI disclosures for sensitive industry firms compared with
other industry firms, e.g., (Gamerschlag et al., 2011; Garcia et al., 2017).
Overall, firms have to make careful choices when deciding the level of NFI disclosures because
the nature and importance of NFI disclosure elements differ significantly and proper
understanding of such differences is required to establish legitimacy. This study uses the
legitimacy concept to understand how firms use different dimensions of NFI disclosures to
address changing stakeholder information needs and regulatory pressures, which can
enhance organizational legitimacy measured by the transparency of the information
environment.
2.2.3. Stakeholder Theory
The seminal work Strategic Management: A Stakeholder Approach (Freeman, 1984) lays the
foundations of stakeholder theory. In more recent work, Freeman (2010) defines
stakeholders as: “any group or individual that can affect or be affected by the realization of
the organization’s purpose” (p. 26). According to his definition, stakeholders consist of a
variety of individuals and groups that might be internal to a firm like employees and
shareholders or external like suppliers, customers, competitors and governments. These
individuals and groups seek information related to firms’ processes and performance to make
informed decisions. Hence, firms disclose additional information to meet the informational
needs of their stakeholders and so reduce any potential information asymmetry between
different stakeholders (Garcia et al., 2017).
Though large amounts of NFI disclosures are voluntary; stakeholder theory provides the
perspecptive for firms’ voluntary disclosures. Mukherjee and Nuñez (2019) maintain that
firms make voluntary disclosures alongside mandatory disclosures to address the concerns of
the diverse group of stakeholders. Firms also make voluntary disclosures to meet the
demands of different pressure groups such as environmental and climate change
organizations. Stakeholder-oriented countries and regions increase stakeholder bargaining
power and force firms to make voluntary disclosures. As a result, studies report a higher level
19
of NFI in stakeholder-oriented countries than in their counterparts (García-Sánchez, Suárez-
Fernández, & Martínez-Ferrero, 2019; Landi & Sciarelli, 2019).
The stakeholder theory justifies increased information disclosures by corporation managers
(Ullmann, 1985). Ratnatunga & Jones (2012) describe the practicality of stakeholder theory
to justify the motivations of corporate managers to disclose additional information. Branco
and Rodrigues (2007) state that firms’ NFI (CSR) disclosures should be capable of addressing
firms’ contributions to satisfy the long-run needs of their stakeholders and convey the efforts
undertaken by a firm to minimise their social and environmental concerns. In other words, to
satisfy stakeholders’ information needs and address concerns about environmental and social
impacts of a firm, NFI disclosures are the most suitable approach that managers can use
(Huang & Kung, 2010).
A financial analyst is an important stakeholder of firms. Financial analysts use company
reported information with market information to forecast firms’ future earnings and market
price. Studies show NFI disclosures could improve (reduce) the accuracy (dispersion) of
analysts earnings forecasts (Bernardi & Stark, 2018; Dhaliwal, Radhakrishnan, Tsang, & Yang,
2012). Other studies also show analysts forecast accuracy is value relevant (Wei & Xue, 2015)
and cost-effective (Park & Park, 2019) for investors. This study uses stakeholder theory to test
whether higher NFI disclosures improve the accuracy of analysts’ earnings forecasts that
ultimately relate to lower earnings risk for firms. The precision of analysts earnings forecasts
for a firm may influence many other stakeholders such as investors, creditors and suppliers
since these stakeholders use analysts’ forecasts to make decisions about firms.
2.3. Definition Evolution of Non-financial Information
The idea of businesses being responsible towards society and the demands to include non-
financial information in corporate disclosures dates back more than a half-century when H. R.
Bowen (1953) introduced the concept of social responsibility (SR) in his book Social
Responsibilities of the Businessman. He proposed an initial definition of social responsibility
for businesses as: “It refers to the obligations of businessmen to pursue those policies, to
make those decisions, or to follow those lines of action which are desirable in terms of the
objectives and values of our society” (p. 6). Davis (1960) presents the managerial perspective
of socially responsible behaviour and argues that a socially responsible stance by a firm could

20
bear fruit in the long-run. Davis also argues that because of the possession of resources,
organizations have social power and, to avoid gradual erosion of this power, it should be
coupled with social responsibility (pp. 70-73).
Though the initial definition of CSR pointed towards the responsibility of businesses towards
society as a whole, Johnson (1971), for the first time, presented CSR from the stakeholder’s
perspective. He states that organizations should not only be concerned about the wealth
maximisation of their stockholders but also consider the interests of employees, suppliers,
dealers and the local community (p. 50). Sethi (1975) introduced the progressive concept of
corporate social performance (CSP) by linking CSR with a company’s strategy and actions. The
author argues that organizations must be socially responsive rather than just being merely
socially obliging. Taking things further, Carroll (1979) defines CSR as a process consisting of
four stages of CSR development: economic, legal, ethical, and philanthropic obligations.
In the early 1980s, Peter Drucker gave a new dimension to the CSR concept by emphasizing
the idea of compatibility between firms’ responsibilities and business opportunities (Drucker,
1984). Following Drucker’s work, several studies have focussed on the marketing aspect of
CSR, such as cause-related marketing, social sponsorship, environmental marketing,
communicating with consumers concerning CSR issues and corporate reputation (Barone,
Miyazaki, & Taylor, 2000; Brown & Dacin, 1997; Caruana & Crane, 2008; Crouch, 2006;
Handelman & Arnold, 1999; Varadarajan & Menon, 1988; Wagner, Lutz, & Weitz, 2009).
From the early 1980s onwards, there has been less focus on the development of a CSR
definition. Instead, researchers and practitioners started to focus more on the measurement
of CSR disclosures and how such disclosures can affect different aspects of firms’ business.
Wang (2015) describes the period 1980-1989 as the exploration stage of CSR development,
where researchers started to explore the content of CSR information reported in firms’
communications and ascertain the impact of such information on the financial performance
of the reporting firms.
2.3.1. Institutional contribution to the definition evolution of Non-financial
Information
Apart from individual researchers who contributed to the evolution of CSR definitions and
frameworks, various institutions have played a vital role in developing CSR frameworks for
21
the firms to understand their social responsibilities and understand how to incorporate such
information in their communications. In 1971, the Committee for Economic Development
(CED) presented a broader view of CSR based on the reasoning that the social contract
between business and society is changing very substantially. The CED framework for CSR
includes three circles of responsibility for business entities: the inner circle of responsibility
asks the firms to be responsible for their economics functions such as production, economic
growth, and shareholder wealth maximisation. The intermediate circle relates to social
responsibility towards the environment, employees’ relationships and the provision of
accurate information about products and processes to customers. Finally, the outer circle
covers the broader role of the firms, such as the well-being of society and improving the social
environment (CED, 1971). Manne and Wallich (1972) in a debate organized by the American
Enterprise Institute expressed the view that firms’ acts of responsibility should be considered
socially responsible only when it is done purely for the benefit of society or any stakeholder
group, and it is not bound by any legal obligations.
In the aftermath of Exxon Valdez oil spill10, environmental protection groups and socially
responsible investment (SRI) funds pushed for more NFI disclosures. Several social investment
professionals formed the Coalition for Environmentally Responsible Economies (CERES). In
1989, CERES put forth its “Valdez principles” for better management of environmental issues
and disclosure of information related to firms’ environmental and social impact. Continuing
their work, CERES and the Tellus Institute, with the support of United Nations Environment
Programme (UNEP), launched the Global Reporting Initiative (GRI) in 1997 to establish a
universal reporting framework that incorporates economic, governance and CSR information
in a single report framework (Gilbert, 2002). Major world organizations such as the United
Nations (UN) and the Organization for Economic Co-operation and Development (OECD)
extended their efforts to develop NFI disclosure frameworks to promote sustainable business
practices. The then UN president, Kofi Annan, launched the UN global compact initiative on
July 26, 2000, based on 10 principles divided into four major components: 1) Human rights,
2) Labour, 3) Environment, and 4) Corruption to promote responsible business practices. This
10 The Exxon Valdez oil spill was the worst oil spill in the history of U.S. It resulted in an oil spill of over 11
million gallons of crude oil when an Exxon shipping company owned oil tanker faced an accident near Tatitlek,
Alaska, on March 24, 1989. See https://www.history.com/topics/1980s/exxon-valdez-oil-spill

22
initiative is the largest global effort, with over 13000 corporate participants and other
stakeholders from around 170 countries. The OCED issued guidelines for multinational
enterprises that provided recommendations and standards for the promotion of responsible
business practices among multinational corporations based on a few basic principles11. More
recently, in 2011, the OECD guidelines were published and endorsed by both OCED and non-
OECD countries for firms operating in their legal territories.
In 2009, participants in Prince’s accounting for sustainability forum discussed the formation
of the International Integrated Reporting Council (IIRC), which was subsequently established
on 2 August 2010. After its formation, IIRC formulated a framework for reporting a wide range
of corporate information. According to IIRC’s reporting framework, integrated reporting (IR)
includes: i) strategic focus; ii) connectivity of information; iii) future orientation; iv)
responsiveness and stakeholder inclusiveness; and v) conciseness, reliability, and materiality
(IIRC, 2011). In 2013, IIRC presented its international IR framework, which is considered the
most detailed NFI reporting framework. Similarly, the Sustainability Accounting Standard
Board (SASB) founded in 2011 developed and circulated sustainability accounting standards.
Contrary to the other frameworks, SASB’s objective is to incorporate its standards into Form
10-K that is a compulsory filling requirement for companies registered with the U.S. Securities
and Exchange Commission.
2.4. Evolution of Non-financial Information Reporting Research
After the initial development of NFI disclosure concepts and definitions, interest in measuring
the extent of NFI disclosures practised by organizations started to develop in academic circles.
This led to the development of NFI reporting research using content analysis because this was
the most appropriate, unbiased method to measure the extent of NFI disclosures practised
by firms then. Later, with the development of NFI databases, the focus shifted to measuring
the impact of NFI disclosures on firms’ financial performance, market value, information
asymmetry and risk measures.
2.4.1. Initial studies on the measurement of NFI information disclosures
11 “Employment and industrial relations, human rights, environment, information disclosures, combating
bribery, consumer interests, science and technology, competition, and taxation”.

23
Preliminary study on NFI reporting in the 1970s by (Bowman & Haire, 1975) tried to explore
the extent of CSR related NFI reported in annual reports of food processing firms in the United
States (U.S.). They used search criteria such as “social responsibility”, “corporate citizenship”,
“social action” and “social responsiveness”. Similarly, using a list of six NFI categories:
community involvement, personnel, environment, equal opportunity, products and others,
developed by Ernst & Ernst (1978), Abbott and Monsen (1979) developed a social
involvement disclosures (SID) index for a sample of Fortune 500 companies to measure the
extent of NFI disclosed in their annual reports. (Cochran & Wood, 1984) used a reputation
index develop by (Moskowitz, 1972) as a proxy for NFI disclosures. It categorizes firms into
“outstanding”, “honourable mention” and “worst” categories depending upon their CSR
related disclosures. Although initial studies tried to measure the extent of NFI disclosures,
they lack a common framework for defining the scope and meaning of CSR activities. Sethi
(1975) suggests focussing on “stable classification” and “stable meaning” of CSR activities and
proposes a framework to operationalise the extent of CSR activities by introducing the
concept of CSP. Preston (1982), using Fortune 500 firms’ annual reports, proposes an
analytical format to summarize a variety of CSR disclosures into a more concise, meaningful
report. These studies made operationalisation of CSR information easier and motivated
researchers to pursue empirical research in the domain.
However, the preliminary studies on the relationship between firms’ CSR disclosures and
financial performance did not find a consistently significant association because of poor
operationalisation of CSR disclosures and deficiencies in available datasets (Ullmann, 1985),
model misspecifications (McGuire, Sundgren, & Schneeweis, 1988), behavioural and
perceptual measures used (Wokutch & McKinney, 1991), and the use of unidimensional
indices of CSR (Chen & Metcalf, 1980; McGuire et al., 1988; O'Bannon & Preston, 1993; Shane
& Spicer, 1983). These issues led to the development of NFI disclosure databases that provide
standardised, reliable measures of ESG related activities practised by the firms.
2.4.2. The development of improved NFI disclosure databases
24
In 1991, Kinder, Lydenberg and Domini (KLD) introduced their database that rates companies
on eight attributes12 of NFI disclosures. Based on these attributes, analysts assign
performance scores to each company. In 2010, KLD was acquired by MSCI and re-named it as
MSCI ESG research. According to Waddock and Graves (1997), the KLD database provided an
improved, detailed source of CSP. The Thomson Reuters ESG database provides data for over
5000 publicly listed companies using over 400 data points provided in corporate
communications. Another important database that provides ESG related data is the Refinitiv
ESG Scores that gathers data on ESG disclosures and ESG controversies13 to make combined
ESG scores for companies. This database covers over 6500 companies around the globe. Some
indices are developed by grouping companies into a benchmark index based on their NFI
disclosures. Some commonly used indices are MSCI KLD 400 Social Index (1990), Dow Jones
Sustainability index (1999), Calvert social index (2000) and FTSE4GOOD series.
These databases provide in-depth knowledge about ESG performance and disclosure scores
of sample companies; this study uses recent, more comprehensive databases that specifically
report ESG disclosure scores rather than performance scores (Eccles, Serafeim, & Krzus, 2011;
Tamimi & Sebastianelli, 2017). The Bloomberg ESG database provides data for over 11,500
companies across 70 countries. Bloomberg analysts construct ESG disclosures scores using
over 900 data field across a variety of NFI indicators, such as air quality, water and energy
management, human capital, waste management, compensation, diversity, and shareholders
rights. Bloomberg uses company reported data from CSR reports, annual reports, company
websites and other company sources to maintain accuracy and consistency in their
database14.
2.5. Empirical Studies on the Impact of NFI Disclosures
Given the availability of better measures of NFI disclosures, recent studies have started to
focus on the empirical domains in NFI disclosures research. Various strands of the NFI
disclosures literature provide evidence of the impact of NFI disclosures and CSP on firms’
12 The five attributes directly related to stakeholders are community relations, employee relations, performance
with respect to the environment, product characteristics, and treatment of women and minorities. Three
attributes related to the external environment are military contracting, participation in nuclear power and
involvement in South Africa. 13 There are 23 ESG controversies. Anti-competition, business ethics, and Intellectual property are examples of
ESG controversies. 14 https://data.bloomberglp.com/professional/sites/10/1148330431.pdf

25
financial performance, market value, cost of equity, information asymmetry and firm risk. Of
these strands, the most studied topic is the impact of a firm’s NFI disclosures on financial
performance, followed by information asymmetry and firm risk. Even though this study
focuses on NFI disclosures and the risk firm risk link, a brief review of other strands highlights
the importance of NFI disclosures.
2.5.1. NFI disclosures and the firm performance link
Studies on firms’ NFI disclosures or CSP and the financial performance link concentrate on the
causal relationship between a firm’s performance on ESG issues and its impact on financial
performance. Various researchers provide evidence of a significant positive relationship
between a firm’s CSP and accounting-based financial performance measures (Chopra & Wu,
2016; Greening & Turban, 2000; Kassinis & Soteriou, 2003; Russo & Fouts, 1997) and market
based financial performance (Bauer & Hann, 2010; Graham & Maher, 2006; Graham, Maher,
& Northcut, 2001; Konar & Cohen, 2001; Thomas, 2001). Rettab, Brik, & Mellahi (2009) report
CSR to be positively associated with three elements of firm performance: financial
performance, corporate reputation and employee commitment. Frank and Obloj (2014) argue
that a firm’s commitment to employee-related issues like a safe working environment, health
facilities, employee empowerment and equal opportunities, result in enhanced firm
productivity. Similarly, CSR engagement and its disclosures support attaining increased
employee commitment and a higher level of legitimacy from the community and government
(Nguyen & Nguyen, 2015). Yoon and Chung (2018) report external CSR practices are positively
related to market share and internal CSR practices help to improve the operating profits of
firms. Thus, employment of CSR in organizational processes improves sustainability in
organizational performance that enhances firms’ effectiveness.
2.5.2. The NFI and information asymmetry link
There is a literature strand that focuses on the role of NFI disclosures as a tool that may reduce
the opaqueness of a firm’s information environment. Kim and Verrecchia (1994) define
information asymmetry as “a trading situation where some market participants have better
access to relevant information than others”. According to Diamond and Verrecchia (1991) and
Lambert, Leuz, and Verrecchia (2007), a lack of publicly available information creates an
incentive for some investors to obtain privately held information, which results in information

26
asymmetry among investors. Thus, transparency in information disclosures is a mechanism
that reduces the information gap between market participants and between managers and
stakeholders. As a result, investors can make accurate investment decisions and stakeholders
are protected from exploitation by managers’ conflicting incentives (Martínez-Ferrero,
Rodríguez-Ariza, García-Sánchez, & Cuadrado-Ballesteros, 2017). Moreover, corporate
managers may disclose more information to investors to increase favourable assessment of
their firms when the overall information environment suffers from asymmetric information
(Elliott & Jacobson, 1994). Studies exploring the link between NFI disclosures and information
asymmetry use different proxies for information asymmetry, such as bid-ask spread (Cho, Lee,
& Pfeiffer Jr, 2013; Cui et al., 2018; Michaels & Grüning, 2017), analysts forecasts dispersion
(Martínez-Ferrero et al., 2017; Michaels & Grüning, 2017), share price volatility and liquidity
(Cormier, Ledoux, & Magnan, 2011; Xu & Liu, 2018).
Most studies in this strand provide evidence of a significant negative relationship between
firms’ NFI disclosures and proxies of information asymmetry. For example, using KLD
performance scores, Cho et al. (2013) provide evidence of a significant reduction in
information asymmetry through a company’s KLD performance scores. They find both
positive and negative CSR performance scores reduce the bid-ask spread and the greater
presence of institutional investors attenuates this link. Nguyen, Agbola, and Choi (2016) use
ASSET415 CSR performance scores to proxy for Australian firms’ CSR performance and report
a negative relationship between CSR performance scores and the bid-ask spread. Their
findings suggest that firm size and market power strengthen the CSR-information asymmetry
link. Similarly, but using analyst forecast dispersion and transaction cost as a proxy for
information asymmetry, Cui et al. (2018) report a negative association between a firm’s CSR
performance scores and information asymmetry. They also report the information
asymmetry and CSR negative relationship is strengthened in high-risk industries. (Xu & Liu,
2018) report a negative relationship between social and environmental disclosures and a
firm’s information asymmetry. Benjamin, Regasa, Wellalage, and M Marathamuthu (2020)
and Lu, Shailer, and Yu (2017) report positive influence of voluntary environment disclosure
15 ASSET4 is a Thomson Reuters ESG database that provide CSR information in four broad pillars: economic,
environmental, social and corporate governance performance. It uses over 750 data points to calculate
performance scores.

27
on corporate cash holding in firms opearating in sensitive industries and opaque
environment. They argue that environmental disclosures mitigate negative effects of
corporate cash holdings, which lowers information asymmetry problem. Differing from above
mentioned findings, Martínez‐Ferrero et al. (2016) emphasize a causal link between
information asymmetry and NFI reporting because there is evidence of reverse causality
(Cormier et al., 2011).
2.5.3. NFI disclosures and the firm risk link
In addition to the information asymmetry domain of CSP research, studies have explored the
link between a firm’s CSP performance and risk. Essentially, the reasoning behind the CSP,
firm risk link relates to NFI disclosures that strengthen a firm’s moral capital and goodwill that,
in return, provide an “insurance-like” shelter to preserve financial performance (Godfrey,
2005; Godfrey, Merrill, & Hansen, 2009). Similarly, Benlemlih, Shaukat, Qiu, and Trojanowski
(2018) suggest firms promote corporate transparency by making broad, objective social and
environmental disclosures that, in turn, reduce their idiosyncratic and total risk. Firms that
actively invest in CSR initiatives build moral and social capital that results in increased trust in
stakeholders and shareholders. Such firms perform better in terms of market returns and
growth in times of market downturn when the corporate environment generally lacks the
trust of market participants (Lins, Servaes, & Tamayo, 2017).
Firm risk is a broad concept that entails different concepts; therefore, different proxies are
used in the literature to measure firm risk. Previous studies used various measures of firm risk
such as idiosyncratic risk, systematic risk, total risk and default risk, to explore NFI disclosures
and firm risk association. The most used proxies for systematic risk are CAPM beta and Fama-
French four-factor model beta. The commonly used proxies for total risk and idiosyncratic risk
are the standard deviation of daily stock returns and standard deviation of residuals from the
Fama-French four-factor model, respectively. Using a meta-analysis of previous studies,
Orlitzky and Benjamin (2001) report evidence of a significant negative relationship between
a firm’s CSP performance and risk. Because of the use of meta-analysis, their study provides
measurable, generalised and reliable proof of the CSP-firm risk link that was missing in the
literature then. According to their findings, the negative relationship between a firm’s CSP
and market risk is more robust than accounting risk. They subdivided market risk into total
risk (return volatility of stock returns – diversifiable risk) and systematic risk (market beta –

28
non-diversifiable risk) and report that CSP has a substantial effect on diversifiable risk and a
moderate effect on non-diversifiable risk.
Oikonomou, Brooks, and Pavelin (2012) explore the CSP – systematic risk relationship using a
longitudinal study of S&P 500 firms. According to their findings, the CSP-firm risk link is
stronger for firms that better address social and environmental concerns than firms that
possess strengths related to social and environmental factors. Their findings suggest market
participants assign more weight to the management of social and environmental concerns
than possession of strengths related to social and environmental factors. Similarly, using a
longitudinal study of S&P500 firms, Chang, Kim, and Li (2014) report a heterogeneous impact
of institutional CSR activities that target secondary stakeholders and technical CSR activities
that target primary stakeholders. According to their findings, only CSR strengths that target
secondary stakeholders are negatively related with firm risk; strengths that target primary
stakeholders are positively associated only with a firm’s financial performance. Another study
on S&P500 firms reveals that the impact of CSR concerns on firm risk is stronger than CSR
strengths. They also maintain that CSR engagement may not affect the current performance
of the firm, but it may adversely affect future performance (Nguyen & A. Nguyen, 2015).
These findings show firms’ engagement in CSR activities is not just window-dressing; it helps
reduce their risk. The results of such a relationship are more pronounced for firms in
environmentally sensitive industries (Jo & Na, 2012).
More recently, academics and practitioners have started using the concept of ESG
performance/disclosures in place of CSP because of the extensive information included in
firms’ NFI disclosures. Moreover, the availability of improved, detailed databases, such as
ASSET4 and Bloomberg ESG disclosures scores, have made access to NFI disclosures easier.
These databases use numerous data points16 to form firms’ ESG scores and rank each ESG
factor on a scale ranging from 0 to 100. These databases are superior to other databases
because they provide a quantitative score that ranges between 0-100, which makes
quantification easier, whereas other databases such as KLD use a limited score range (-2 to
2). These databases provide a way to explore the disaggregated impact of each ESG factor,
16 This score is based on 100 of 219 raw data points that Bloomberg collects, and is weighted to emphasize the
most commonly disclosed data fields.

29
namely, environmental, social and governance. For instance, using ASSET4 ESG performance
scores, Sassen, Hinze, and Hardeck (2016) report the disaggregated effect of ESG factors on
total, idiosyncratic and systematic risks. According to their results, the social component of
ESG performance has a significant negative effect on all three proxies of risk, but only the
environmental component negatively affects idiosyncratic risk. They did not find any effect of
the governance factor on firm risk. Similarly, using environmental and social disclosures
scores from Bloomberg ESG database, Benlemlih et al. (2018) report a significant negative
effect of social and environmental disclosures on a firm’s total and idiosyncratic risk.
However, these disclosure scores do not show any effect on a firm’s systematic risk, a finding
that is consistent with prior studies. These studies show that disaggregated disclosures show
varying effects on firms’ risk measures. Thus, it is essential to use a data source that provides
the flexibility of using the individual dimensions of ESG disclosures.
Using website traffic data as a measure of adequate information disclosures and investor
recognition, Chien and Lu (2015) suggest higher website traffic reduces information
asymmetry and, as a result, reduces firm risk. They report a significant negative relationship
between website traffic and firm risk measured by analysts’ forecast dispersion, cost of equity
and return volatility. Similarly, Kothari et al. (2009) report a significant negative relationship
between firm risk measures (analysts’ forecast dispersion, stock return volatility, and cost of
capital) and favourable disclosures reported by a corporation, analysts and the business press.
They also report an increase in firm risk following unfavourable disclosures.
In terms of risk measures, the literature on the relationship of NFI and firm risk commonly
focusses on traditional firm risk proxies such as total risk (measured as the volatility of stock
returns), idiosyncratic risk and systemic risk. However, another risk measure that is more
relevant to a firm’s information environment and captures risk associated with information
disclosures more profoundly than traditional risk proxies, is less investigated in the existing
literature. This measure is commonly referred to as analysts’ forecast dispersion. It is used
interchangeably as a proxy for information asymmetry and earnings uncertainty. However,
Barron et al. (2009) reconcile the contradictory evidence of (Diether, Malloy, & Scherbina,
2002; Johnson, 2004) of analysts’ forecast dispersion being a measure of uncertainty or

30
information asymmetry. They maintain that the dispersion in analysts’ forecast represents
uncertainty, which is negatively associate with firms’ future stock returns.
Based on these explanations and supporting evidence from the literature, we use analysts’
earnings forecast dispersion as a measure of firms’ future earning uncertainty and propose it
as a better risk measure than traditional risk proxies in the context of NFI disclosures and firm
risk link. We hypothesize the association between NFI disclosures and firms’ earnings risk as:
H1: NFI disclosure scores are negatively associated with firms’ future earnings risk.
Disaggregated NFI disclosure factors can affect financial analysts’ earnings forecasts
differently. To account for the impact of individual ESG components, we propose three
supplementary testable hypotheses:
Hypothesis 1a. Environmental disclosure scores are negatively associated with firms’ future
earnings risk.
Hypothesis 1b. Social disclosure scores are negatively associated with firms’ future earnings
risk.
Hypothesis 1c. Governance disclosure scores are negatively associated with firms’ future
earnings risk.
2.5.4. The linkage between NFI disclosures and firms’ earnings risk (the case of
sensitive industry firms)
The corporate finance literature, in general, and the NFI disclosure literature, in particular,
pay special attention to firms operating in environmentally or socially sensitive industries.
Firms that operate in the extractive and energy sectors are categorised as environmentally
sensitive and firms that operate in alcohol, tobacco, gambling, weapon production, and adult
entertainment are classified as socially sensitive firms. These firms are inherently prone to
higher stakeholder pressures because of the sensitive nature of their business operations. As
a result, these firms are required to report higher NFI disclosures than firms operating in non-
sensitive sectors. The literature provides some evidence regarding the impact of being in a
sensitive industry on a firms’ disclosure practices. For example, using a sample of sensitive
industry firms from BRICS countries, Garcia et al. (2017) report higher environmental
performance of sensitive industry firms than non-sensitive counterparts.

31
Previous studies also show a relationship between sensitive industry firms’ NFI disclosures
and their risk profile. For instance, using a sample of European firms, Sassen et al. (2016)
report a negative relationship between environmental performance and firm risk factors such
as idiosyncratic, systemic and total risks for environmentally sensitive firms. Similarly, using a
sample of U.S. based socially sensitive firms, Jo and Na (2012) report that CSR engagement
reduces firm risk more profoundly for socially sensitive firms than for non-sensitive
counterparts. These studies show that the sensitive nature of a firm’s operation could impact
its NFI disclosures and affect the relationship between NFI disclosures and earnings risk. As a
result, we hypothesise that the NFI disclosures of sensitive industry firms differ from non-
sensitive firms because sensitive industry firms face greater scrutiny from stakeholders
because of the nature of their operation. Thus, we hypothesise the following relationship:
H2: Sensitive industry firms report higher ESG disclosures than non-sensitive firms.
Similarly, we hypothesise that the disaggregated disclosures of sensitive industry firms are
higher than for non-sensitive firms. Thus we hypothesise the following relationships:
Hypothesis 2a. Sensitive industry firms report higher environmental disclosures than non-
sensitive firms.
Hypothesis 2b. Sensitive industry firms report higher social disclosures than non-sensitive
firms.
Hypothesis 2c. Sensitive industry firms report higher governance disclosures than non-
sensitive firms.
Moreover, based on the evidence reported by (Jo & Na, 2012) and (Sassen et al., 2016), we
hypothesise that the negative relationship between NFI disclosures and earnings risk will be
more pronounced for sensitive industry firms than for other industries. To test this
relationship, we hypothesise that:
H3: NFI disclosure scores are negatively related to firms’ future earnings risk for sensitive
industry firms.
Disaggregated NFI disclosures can affect firms’ earnings risk differently. To account for the
individual impact of ESG components, we propose three supplementary testable hypotheses.

32
Hypothesis 3a. Environmental disclosure scores are negatively associated with firms’ future
earnings risk for sensitive industry firms.
Hypothesis 3b. Social disclosure scores are negatively associated with firms’ future earnings
risk for sensitive industry firms.
Hypothesis 3c. Governance disclosure scores are negatively associated with firms’ future
earnings risk for sensitive industry firms.
2.6. NFI Disclosures Regulations
NFI reporting has been mainly voluntary, but some countries/regions have developed NFI
reporting frameworks or enforced international NFI reporting frameworks for firms operating
within their legal system. Many countries mandated CSR reporting in the past, but the most
recent regulations on NFI reporting come from Malaysia, China, Denmark, South Africa and
the European Union (EU). In Malaysia, CSR reporting has been made a listing requirement by
the stock exchange Bursa Malaysia for all firms from December 2017. Under the
requirements, companies are required to disclose their CSR activities and explain any failure
to comply with CSR reporting requirements. The Shanghai stock Exchange (SHSE) and the
Shenzhen Stock Exchange (SZSE) directed particular17 companies to disclose NFI by the end of
the financial year 2008. In the same year, state council commissions issued the opinion
guidelines on CSR reporting for state-owned corporations after the revision of Article 5 of
company law.
In Denmark, large companies18 were mandated to disclose their CSR activities in a
supplementary report or explain the absence of any CSR activity in the management review
report. This regulation was enacted by an amendment to the Danish Financial Statements Act
in October, 2008, and came into force on 1 January, 2009. The Johannesburg Stock Exchange
(JSE) mandated CSR reporting for listed companies following the issuance of the King III report
on corporate governance. JSE mandated integrated reporting from the start of the 2011
financial year. Companies in both those countries were mandated to disclose their ESG
17 SHSE mandated CSR reporting for companies from the financial sector, companies with cross country listing
and companies included in SHSE corporate governance index. SHSE mandated a disclosures requirement for
companies that are part of Shenzhen 100 index. 18 In the Danish Financial Statements Act, a company is considered large if it satisfies any two of: 1) total assets
above 143 Million Danish marks; 2) net revenue over 286 Danish marks; or 3) average 250 or more full-time
employees.

33
policies and report on the achievement of the objectives set in the policies. Although the
regulations mandated CSR reporting in China, Malaysia, South Africa and Denmark, they lack
a comprehensive framework of metrics for CSR reporting (Ioannou & Serafeim, 2017).
2.6.1. NFI disclosures regulations in Europe Directive 2014/95/EU
On 22 October, 2014, the European Parliament enacted its directive 2014/95/EU that
mandates disclosure of non-financial and diversity information for large19 entities and
business groups. This directive amended Directive 2013/34/EU and Regulation (EC) No
562/2006 that were in place for NFI disclosures in the EU. This new directive requires firms to
report information on six broad topics: 1) environmental, 2) social, 3) employee matters, 4)
respect for human rights, 5) anti-corruption, and 6) bribery matters as minimum
requirements of NFI disclosures. Firms are also required to report how their business model,
policies, policy outcomes, potential risks and key performance indicators (KPIs) synchronise
with the six broad topics of NFI disclosures. Like other NFI reporting frameworks, this
framework does not provide any NFI performance metrics. However, the six major topics
cover almost all aspects of ESG related activities. Moreover, recital 720 of directive 2014/EU/95
provides details of potential information to be included under each topic. This makes NFI
reporting under the directive more standardized and comparable than previous NFI reporting
regulations. Thus, this EU directive has the most comprehensive regulations for NFI
disclosures and is expected to bring major changes in policies and disclosures related to the
CSR activities of firms operating in the EU. Given the comprehensive nature of directive
2014/95/EU, this study uses the directive as a case study of NFI disclosures regulations.
Recent studies that investigate the implementation of the EU directive in different member
states indicate that different European countries have transposed the EU directive into their
reporting regulations. For example, Testarmata, Ciaburri, Fortuna, and Sergiacomi (2020)
report that the leading European countries, France, Germany, Italy and Spain, have
transposed the EU directive into their reporting regulations. They also maintain that NFI
reporting regulations have increased the uniformity, transparency and comparability of
information disclosed by companies (p. 67). Matuszak and Różańska (2017) report that a
19 Companies with total balance sheet, net turnover and average number of employees above EUR 400,000, EUR
800,000 and 50, respectively. 20 See recital 7 of directive 2014/95/EU.
34
relatively smaller country, Poland, has also transposed the EU directive into its reporting
regulations. They suggest that the transposition of the EU directive into Poland’s reporting
regulations will increase the quantity and quality of NFI disclosures. These studies show that
the recently enacted EU directive is receiving widespread acceptance from EU member states
and it is expected to have substantial effects on the NFI disclosure practices of the firms
operating in the EU. Moreover, Korca and Costa (2021) conducting a review of the research
on the the EU directive suggest further investigation should explore the impact of the
directive on non-financial disclorsures and firm performance. Therefore, investigating the
impact of mandatory NFI disclosures in the context of the EU directive could provide
important insights regarding the acceptability of mandatory NFI disclosure requirements and
its impact of NFI disclosures.
2.6.2. The consequences of the NFI disclosure regulations
Empirical evidence on the impact of mandatory CSR reporting on the quantity of NFI
disclosures is sparse. Using a worldwide sample of 58 countries, (Ioannou & Serafeim, 2011)
report a significant positive effect of CSR reporting regulations on the amount of NFI
information reporting measured by different country-specific measurements such as social
responsibility, sustainable development, employee training, corporate board and ethical
practices. According to their findings, regulation effects are more substantial for countries
with better law enforcement systems, better mechanisms of CSR reporting assurance and
higher per capita GDP. Continuing their work using a better source of CSR measurement,
Ioannou & Serafeim (2017) report increased ESG disclosures following the enforcement of
mandatory NFI disclosure regulations in China, Denmark, Malaysia and South Africa.
Given the importance of NFI disclosure legislation (directive 2014/95/EU), we propose using
the regulation as an exogenous shock for NFI disclosures of European firms. We expect NFI
disclosures to be higher after the implementation of the directive. To test the effect of
legislative change on NFI disclosures, we propose the following hypotheses.
Hypothesis 4. Ceteris paribus, there is a significant difference between NFI disclosure scores
of European firms before and after the enforcement of directive 2014/95/EU.
To test the impact of the legislative change on the different components of NFI disclosure
scores, we propose the following auxiliary hypotheses.
35
Hypothesis 4a. Ceteris paribus, there is a significant difference between environmental
disclosure scores of the European firms before and after the enforcement of directive
2014/95/EU.
Hypothesis 4b. Ceteris paribus, there is a significant difference between governance disclosure
scores of the European firms before and after the enforcement of directive
2014/95/EU.
Hypothesis 4c. Ceteris paribus, there is a significant difference between social disclosure
scores of the European firms before and after the enforcement of directive
2014/95/EU.
Studies also report a favourable impact of NFI disclosures in a mandatory NFI reporting regime
on firm value and information asymmetry. For example, Ioannou and Serafeim (2017) report
increased firm value for firms that increase their disclosures post-regulation. Similarly, under
South Africa’s Integrated Reporting Regulation, Bernardi and Stark (2018) report an increased
level of ESG disclosures that, in turn, results in increased analysts’ forecast accuracy. These
studies show NFI regulations not only increase the level of CSR disclosures, but they also
moderate the CSR disclosures and information asymmetry, and CSR performance and firm
value links. These findings further strengthen the views of those who support regulations for
NFI reporting.
Given the empirical evidence concerning the favourable impact of NFI disclosures after
enforcement of mandatory regulations, this study proposes to measure the difference
between the pre- and post-regulation association between NFI disclosures and firm risk. We
propose the following hypotheses:
Hypothesis 5. There is a significant difference between the association of NFI disclosures and
firms’ future earnings risk before and after the enforcement of directive 2014/95/EU.
Hypothesis 5a. There is a significant difference between the association of environment
disclosure scores and firms’ future earnings risk before and after the enforcement of
directive 2014/95/EU.
Hypothesis 5b. There is a significant difference between the association of governance
disclosure scores and firms’ future earnings risk before and after the enforcement of
directive 2014/95/EU.

36
Hypothesis 5c. There is a significant difference between social disclosure scores and firms’
future earnings risk before and after the enforcement of directive 2014/95/EU.
2.7. Chapter Summary
This chapter briefly reviews the different strands in NFI disclosures literature that are most
relevant to this study. Starting with the theoretical foundations of NFI disclosures research,
we briefly review the theories that provide a conceptual understanding and reasoning for NFI
disclosures. Agency theory that focuses on the investor-manager relationship as agent and
principal maintains that managers should provide all relevant information to investors so they
can make informed investment decisions. Studies on the association between NFI disclosure
and information asymmetry report contradictory evidence since some researchers maintain
increased NFI disclosures reduce agency problems (Garcia et al., 2017; Martínez‐Ferrero et
al., 2016; Ness & Mirza, 1991) and others report the converse (Kartadjumena & Rodgers,
2019). Studies on the application of stakeholder theory in NFI literature provide the reasoning
for voluntary, improved NFI disclosures by corporate managers. According to these studies,
corporate managers disclose NFI to address investor concerns (Branco & Rodrigues, 2007;
Huang & Kung, 2010; Mukherjee & Nuñez, 2019), reduce information asymmetry (Garcia et
al., 2017), and maintain legitimacy in a high stakeholder protection environment (García-
Sánchez et al., 2019; Landi & Sciarelli, 2019). Studies use legitimacy theory to explain the
motivations of a firm’s NFI disclosures from the perspective of legitimizing business activities
(Dhaliwal, Li, Tsang, & Yang, 2014; Gamerschlag et al., 2011; Khan et al., 2013), and comply
with disclosures regulations (Arena et al., 2018).
The chapter also presents the pioneering work of Bowen (1953), who presented the first
definition of CSR, followed by Davis (1960) and Johnson (1971). These academics presented
two contrasting CSR views from the managerial and stakeholder perspectives, respectively.
Later, Drucker (1984) presented the compatibility concept between corporate objectives and
CSR activities that was subsequently applied by many researchers to provide evidence of such
compatibility. Together with academics, different institutions contributed to the evolution of
the CSR definition and framework. At first, the CED presented three-tier CSR framework that
covers the economic, social and environmental aspects of organizational responsibility. Later,
in the aftermath of Exxon Valdez oil spill, CERES (a group of investment professionals) put

37
forth the “Valdez Principles” that require better management and disclosures of
environmental issues by organizations. Subsequently, CERES together with UNEP, launched
GRI to develop a unanimous NFI reporting framework. In 2013, IIRC presented its
international integrated reporting framework that provides organizations the guidelines to
report NFI together with financial information in an integrated manner.
This chapter also provides a review of empirical studies. The empirical studies on the impact
of NFI disclosures on firm performance report a positive impact on accounting-based (Chopra
& Wu, 2016; Frank & Obloj, 2014; Greening & Turban, 2000; Kassinis & Soteriou, 2003; Russo
& Fouts, 1997) and market-based (Bauer & Hann, 2010; Graham & Maher, 2006; Graham et
al., 2001; Konar & Cohen, 2001; Thomas, 2001; Yoon & Chung, 2018) financial performance
measures. The empirical studies report a significant negative impact of NFI disclosures on
different measures of information asymmetry like bid-ask spread (Cho et al., 2013; Cui et al.,
2018; Michaels & Grüning, 2017), analysts’ forecast dispersion (Martínez-Ferrero et al., 2017;
Michaels & Grüning, 2017), and share price volatility and liquidity (Cormier et al., 2011; Xu &
Liu, 2018). Evidence of a negative relationship between NFI disclosures and firm risk
measured by stock return volatility (Benlemlih et al., 2018; Sassen et al., 2016), systematic
risk (Oikonomou et al., 2012; Orlitzky & Benjamin, 2001) and analyst forecast dispersion
(Chien & Lu, 2015; Kothari et al., 2009) was reviewed.
Finally, this chapter reviews developments in NFI reporting regulations and their impact on
the level of NFI disclosures in different countries. In the recent past, stock markets in South
Africa, China, Malaysia and Denmark have mandated NFI for listed companies. More recently,
the EU enacted directive 2014/95/EU that mandates NFI disclosures for companies operating
in member states. The reviewed studies show the evidence of an increase in the quantity of
NFI disclosures (Ioannou & Serafeim, 2011, 2017) that leads to an increase (decrease) in firm
value (information asymmetry) (Bernardi & Stark, 2018; Ioannou & Serafeim, 2017).

38
Chapter 3
Sample, Data and Methodology
3.1. Introduction
This chapter presents the sample, data and methodology of the study. The chapter first
introduces the sample and data variables used in the study. Next, we present the basic
diagnostics tests and empirical models used in the study to check the validity of the data and
test the research hypotheses, respectively. The chapter concludes with tests on the
robustness of estimates, potential robustness and endogeneity control measures.
3.2. Sample
The study sample comprises firms from the S&P Global 1200 index. That index (hereafter the
global index) encompasses seven dominant regional indices that cover companies from all
over the world21. The sub-indices are: S&P 500, S&P 350, S&P TOPIX 150, S&P/TSX 60, S&P
Asia 50, and S&P Latin America 40, which include companies from the US, Europe, Japan,
Canada, Australia, four Asian countries (Hong Kong, Korea, Singapore and Taiwan) and five
Latin American countries (Brazil, Chile, Colombia, Mexico and Peru), respectively. The sample
period for this study is 2008-2018. The length of the study’s sample period is limited by the
fact that Bloomberg started publishing ESG disclosure scores from 2008 after it acquired the
U.K. based New Energy Finance, which reported news and data on carbon and clean energy
markets, and the fact that, at the time of data collection, ESG data were not available beyond
2018.
We select the global index companies as our sample firms for various reasons. First, the
companies included in the global index genuinely embody a global sample that represents
70% of the total global market capitalisation. It is often used as a proxy of world stock market
performance (Nanayakkara & Colombage, 2019; Shamsuddin & Kim, 2010) and is an
internationally diversified portfolio of firms (Cosset, Somé, & Valéry, 2016; Hassan &
Giorgioni, 2019; Hassan, 2018). The global index offers sufficient representation of each world
region relative to its size in the international equity market (Del Bosco & Misani, 2016). Hence,
the results of this study can be generalised more confidently than other studies that focus on
21 See https://us.spindices.com/indices/equity/sp-global-1200

39
companies incorporated in a specific country (Becchetti, Ciciretti, & Hasan, 2015; Bernardi &
Stark, 2018; Cai, Cui, & Jo, 2016; Chang et al., 2014), a group of developed countries
(Benlemlih & Girerd‐Potin, 2017), or a geographical region (Sassen et al., 2016). Second,
global index companies represent a random sample because we do not select firms that
already make a higher or lower NFI disclosures, such as the Dow Jones Sustainability Index
(DJSI) World22 companies.
Table 3. 1. Index and industry-wide companies that comprise the study sample
Note: Table 1 presents the index and industry-wise details of companies included in the final sample.
Table 3.1 presents the details of the final sample companies in each index and industry in the
final sample. Financial and industrial sector companies are the two largest groups in our
sample, followed by consumer discretionary and materials. Since this study collects data from
two different databases, several global index companies were not included in the final sample
because of non-availability of data for those companies in both databases. This study uses the
Institutional Brokers Estimate System (IBES) to extract analysts’ earnings per share (EPS)
forecasts and the standard deviation of the EPS forecasts. IBES is a commonly used database
in NFI disclosure literature, e.g., see (Bernardi & Stark, 2018; Dhaliwal et al., 2012; Li & Wu,
2014). This study collects NFI disclosures data from the Bloomberg ESG database, which is an
established source of NFI disclosures in the, e.g., see (Buchanan, Cao, & Chen, 2018; Nollet,
Filis, & Mitrokostas, 2016).
22 The DJSI World is composed of world leading sustainability companies created by RobecoSAM. See
https://eu.spindices.com/indices/equity/dow-jones-sustainability-world-index
Industry AS 50 AU 50 CA 60 EU 350 JP 150 LA 40 US 500 Grand Total
Communication Services 4 3 5 30 7 2 11 62
Consumer Discretionary 4 3 4 45 18 2 37 113
Consumer Staples 2 1 3 27 12 6 26 77
Energy 3 4 13 12 1 3 18 54
Financials 12 10 9 66 11 4 50 162
Health Care 0 1 2 16 6 0 36 61
Industrials 6 6 5 56 39 4 44 160
Information Technology 8 0 1 13 16 0 40 78
Materials 5 11 10 35 18 7 14 100
MISC 0 5 6 21 12 6 1 51
Real Estate 2 5 0 5 4 0 13 29
Utilities 3 1 2 17 6 6 22 57
Grand Total 49 50 60 343 150 40 312 1004
40
3.3. Dependent and Independent Variables
This study uses analysts earnings forecasts dispersion as proxy for earnings risk as the primary
dependent variable. We use total and disaggregated ESG disclosure scores as dependent
variables for supplementary analysis. However, the overall and disaggregated ESG disclosure
scores are also the leading independent variables in this study. NFI disclosure regulations and
the sensitive industry status of a company are supplementary independent variables. Based
on previous studies, we control for several firm-specific variables. The next sections present
detailed explanations of all data variables used in the study.
3.3.1. Analysts’ earnings forecasts dispersion – earnings risk relationship
Analysts’ earnings forecasts dispersion is the key dependent variable used in this study to
proxy for a firm's future earnings risk. Barron et al. (2009) and Li and Wu (2014) define
analysts’ earnings forecast dispersion as the standard deviation of analysts’ earnings forecast
scaled by (consensus analysts forecast/(actual earnings per share). Although researchers
traditionally use analysts earnings forecasts error and dispersion as proxies for information
asymmetry (Cui et al., 2018; Martínez-Ferrero, Rodríguez-Ariza, García-Sánchez, & Cuadrado-
Ballesteros, 2018; Yang, Cheng, Sun, & Lu, 2019), many researchers also use it as a measure
of firm risk. For example, Gregoriou, Ioannidis, and Skerratt (2005) report analysts’ forecast
dispersion to be a significant factor in determining a firm's bid-ask spread alongside other
measures of firm risk. Similarly, Chien and Lu (2015) report a significant relationship between
firms' NFI disclosures and analysts forecasts dispersion alongside other proxies of risk such as
cost of equity and the volatility of stock returns. Notably, Barron et al. (2009) reconcile the
contradictory evidence of (Diether et al., 2002) and (Johnson, 2004) on analysts’ forecasts
dispersion as a measure of uncertainty or information asymmetry and maintain that the level
of dispersion in analysts forecasts represents uncertainty on future earnings, which is
negatively associated with a firm's future stock returns. They further argue that changes in
analysts’ forecasts dispersion reflect information asymmetry not the level of analysts’
forecasts dispersion.
This study adopts Barron et al. (2009) view that the level of dispersion in analysts’ earnings
forecasts represents uncertainty in future earnings hence serves as a proxy of a firm's future
earnings risk. Following Barron et al. (2009), a firm's earnings risk is calculated by:

41
𝐹𝑖𝑟𝑚′𝑠 𝑒𝑎𝑟𝑛𝑖𝑛𝑔𝑠 𝑟𝑖𝑠𝑘 = (1 − 1
𝑛) ∗ 𝐷 + 𝑆𝐸 (3.1)
where: a firm's earning risk equals the uncertainty part of analysts’ earnings forecasts
dispersion; D = forecast dispersion — i.e., the sample variance of the individual forecasts (𝐹𝐶𝑖)
around the mean forecast (𝐹𝐶̅̅̅̅ ); SE = squared error in the mean forecast measured as the
difference between earnings per share and the mean forecast, (𝐸𝑆𝑃𝑖 − 𝐹𝐶̅̅̅̅ )2 ; and N = the
number of individual forecasts.
Notably, our firm’s earnings risk variable captures the overall uncertainty in analysts’ earnings
forecasts that includes analyst-specific uncertainty (D in equation 3.1) plus the common
uncertainty among analysts (SE in equation 3.1). In doing so, we capture the overall
uncertainty surrounding analysts’ earnings forecasts for a particular firm thus it represents
the future earnings risk for a firm.
3.3.2. Non-Financial Information disclosures
As discussed earlier, the Bloomberg ESG disclosure scores are used as the leading
independent variable and as an auxiliary dependent variable in this study. We use ESG
disclosure scores reported in the Bloomberg ESG database to proxy for a firm’s NFI
disclosures. Bloomberg analysts construct ESG disclosure scores using over 900 data fields
across a variety of NFI indicators, such as air quality, water, and energy management, human
capital, waste management, compensation, diversity, and shareholders' rights. To construct
the disclosure scores, Bloomberg uses company reported data from CSR and annual reports,
company websites and other company sources to maintain the accuracy and consistency of
their database23.
Overall, ESG disclosure scores present a bigger picture of a firm’s efforts to inform its
stakeholders about the policies and actions implemented by the firm for a better society and
a safer environment. Given the depth and breadth of data used to calculate the scores,
Bloomberg ESG disclosure scores serve as a better proxy than the broader proxies of NFI
disclosures such as stand-alone CSR reports and self-created disclosure indices. Moreover,
Bloomberg analysts also construct sub-scores that individually consider environmental, social
23 See https://data.bloomberglp.com/professional/sites/10/1148330431.pdf

42
and governance disclosures separately. These sub-scores are the environmental disclosure
score (EDS), social disclosure score (SDS), and governance disclosure score (GDS). These
subdivisions of ESG scores serve the needs of stakeholders who are interested in a particular
area of sustainability, such as the environment or governance. We apply these sub-scores to
measure the disaggregated impact of ESG disclosures on a company's future earnings risk.
The Bloomberg ESG database provides data for over 11,500 companies across 70 countries.
The comprehensive coverage of this database lines up with our sample companies that are
spread around 30 different countries across seven regions. Several researchers such as
(Buchanan et al., 2018; Han, Kim, & Yu, 2016; Nollet et al., 2016; Wang & Sarkis, 2017), have
used Bloomberg ESG scores as a measure of a firm's NFI disclosures which confirms the
reliability and acceptability of these scores as a sound indicator of firm's NFI disclosures.
3.3.3. Sensitive industries
Prior studies on NFI disclosures maintain that because of the harmful effects of their business
activities on society and the environment, sensitive industry firms are subject to higher
reputation risk than their counterparts in other industries. Reporting more information about
business activities will increase the transparency of business operations that, as a resultant,
provides higher benefits for sensitive industry firms (Garcia et al., 2017). Following (Baron et
al., 2011; Garcia et al., 2017)and Garcia et al. (2017), we treat a firm as a sensitive industry
firm if it belongs to the alcohol, tobacco, gambling, weapon production, adult entertainment,
oil, gas, and consumable fuels, metals and mining, paper and forest products, chemicals,
construction materials, or energy businesses. This study uses a dummy variable to measure
the impact of this variable; the sensitive industry variable equals 1 if a firm belongs to a
sensitive industry and 0 otherwise.
3.3.4. Non-Financial Information disclosure regulations
Recently, the demand for mandating NFI disclosures has received unprecedented support
from different groups of stakeholders, forcing countries such as South Africa, China, Malaysia,
and Denmark, to regulate NFI disclosures that have been mostly voluntary in the past. More
recently, the European Parliament enacted NFI disclosure regulation in its non-financial
reporting directive (Directives, 2014), that provides a detailed framework for NFI reporting by
43
large organisations operating in the EU. The regulation applied from 1 January, 2017, for
target firms operating in all member states.
The regulation of NFI disclosures prompted researchers such as Bernardi and Stark (2018) and
Ioannou and Serafeim (2017) to measure the impact of regulations on the level of NFI
disclosures by target firms and how such regulations can mediate the association of NFI
disclosures and firm value or risk. Recognising the potential impact of NFI disclosure
regulations on improving NFI disclosures and so reducing the information opacity of a
reporting firm's earnings, this study uses the recent EU regulation as an exogenous shock to
measure the direct and mediating impact of regulations on the level of NFI disclosures by
target firms and the reduction in their earnings risk, respectively. Hence, the regulation
variable equals 0 before 2017 and 1 afterwards.
3.4. Control Variables
Prior studies show that a firm’s information environment is affected by several firm-specific
factors such as size, financial distress, the visibility, earnings volatility, profitability, and firm
growth, among others. Based on the prior literature on NFI disclosures and their association
with firm risk (Bernardi & Stark, 2018; Dhaliwal et al., 2012; Jo & Na, 2012; Sassen et al., 2016),
we control for firm size, debt ratio, the number of analysts following a firm, earnings per share
(EPS) volatility, loss, and book to market ratio to achieve reliable, accurate estimates.
3.4.1. Firm size
Firm size is a critical variable in corporate finance literature because it affects a firm's
profitability, returns, and value-related performance indicators. Likewise, prior studies show
that larger firms have a higher impact on society and the environment because of their scale
of operations. They are also highly visible and extensively followed by the media and
stakeholders. Consequently, larger firms make higher NFI disclosures (Ali, Frynas, &
Mahmood, 2017; Branco & Rodrigues, 2008; Chiu & Wang, 2015; Tagesson, Blank, Broberg,
& Collin, 2009) and have lower dispersion in analysts’ earnings forecasts (Bernardi & Stark,
2018; Flores, Fasan, Mendes‐da‐Silva, & Sampaio, 2019). Thus, controlling for firm size is
essential to measure the actual impact of NFI disclosures on a company’s earnings risk. This
44
study uses the natural log of total assets at the end of a year to proxy for firm size and we
expect a negative (positive) effect of firm size on earnings risk (NFI disclosures).
3.4.2. The number of analysts following a firm
The number of analysts following a firm indicates a higher visibility and information demand
for that firm among investors and other stakeholders. Accordingly, Baldini, Dal Maso,
Liberatore, Mazzi, and Terzani (2018) and (Ioannou & Serafeim, 2012) report a significant
positive relationship between the number of analysts following and NFI disclosures. However,
some studies show a significant negative relationship between the number of analysts
following and analysts’ forecasts absolute error (Garrido‐Miralles, Zorio‐Grima, & García‐
Benau, 2016; Martínez‐Ferrero et al., 2016) whereas others report this relationship to be
insignificant (Bernardi & Stark, 2018; D. Lee, 2017). According to Dhaliwal et al. (2012), the
number of analysts following a firm suggests competition among analysts. Thus, the greater
the number of analysts, the better the accuracy of analyst forecasts. This study uses the
number of analysts following the firm as a proxy for a firm's NFI disclosures demand and
analysts’ competition. The expected sign of this variable is negative when we use earnings
risk as the dependent variable and otherwise in the case of NFI disclosures.
3.4.3. Financial leverage
In general, the leverage ratio provides ideas about the capital structure of a company and the
extent to which creditors can influence decision-making (X. Liu & Anbumozhi, 2009). Further,
in the context of agency theory, Jensen and Meckling (1979) state that highly leveraged firms
are more likely to make NFI disclosures to reduce the agency cost. Similarly, Andrikopoulos
and Kriklani (2013) maintain that companies with a lower leverage face less pressure from
creditors to disclose NFI. Nevertheless, leverage could provide additional funding to initiate
new investments and sustainable operations so highly leveraged firms may lack the ability to
invest intensively in CSR activities because of their high cost (Andrikopoulos & Kriklani, 2013;
Stanny & Ely, 2008). Accordingly, Purushothaman, Tower, Hancock, and Taplin (2000) and
Branco and Rodrigues (2008) report a negative relationship between the degree of financial
leverage and CSR disclosures by Singaporean and Portuguese companies, respectively.
Additionally, financially distressed firms are likely to have an opaque information
environment, which impairs analysts' ability to accurately forecast their future income
45
(Espahbodi, Dugar, & Tehranian, 2001; Iatridis, 2016). This study uses the debt to total asset
ratio as a proxy for financial leverage and we hypothesise a positive relationship with earnings
risk and a negative relationship with NFI disclosures.
3.4.4. Loss
As profitability and stability in earnings are critical factors in projecting the future earnings of
a firm. Conversely, it is challenging to forecast earnings for organisations that report losses
(Hope, 2003). Accordingly, prior studies show a significant positive relationship between a
loss in the current year and analysts’ earnings forecasts error and dispersion for the following
year (Cormier & Magnan, 2014; Dhaliwal et al., 2012; Martínez‐Ferrero et al., 2016).
Therefore, it is essential to control for a firm’s current year reported earnings when its future
earnings forecasts are being made. Therefore, this study uses loss as a dummy variable equal
to 1 if a firm reports negative earnings in the current year, 0 otherwise. We expect a positive
relationship between loss and earnings risk.
3.4.5. Earnings volatility
Dichev and Tang (2009) report that uncertain earnings increase the complexity of future
earnings forecasts, thus we expect higher earnings uncertainty to be positively associated
with analysts’ earnings forecasts dispersion. Following (Dhaliwal et al., 2012), this study uses
earnings per share volatility as a proxy for firm earnings uncertainty measured as the natural
logarithm of time-series standard deviation for a firm's EPS using the last 10 years rolling
window. To avoid higher dependence on recent earnings, we use a 10-year rolling window
that considers substantial amount of time for earnings volatility estimation.
3.4.6. Financial opaqueness
Future earnings of firms with a higher level of financial opaqueness are challenging to predict
so there exists a negative relationship between analysts’ forecast accuracy and financial
opaqueness (Hope, 2003). Dhaliwal et al. (2012) report that information asymmetry and NFI
disclosure are more robust for firms with a higher level of financial opaqueness. To control
for this variable, we follow (Bhattacharya, Daouk, & Welker, 2003) and (Dhaliwal et al., 2012)
to compute firm-level financial transparency using an average of the past three years scaled
accruals. The calculation of accruals is as follows:

46
𝐴𝑐𝑐𝑟𝑢𝑎𝑙 =∆𝐶𝐴− ∆𝐶𝐿− ∆𝐶𝐴𝑆𝐻+ ∆𝑆𝑇𝐷−𝐷𝐸𝑃+ ∆𝑇𝑃
𝑙𝑎𝑔 (𝑇𝐴) (3.2)
where: ∆𝐶𝐴, ∆𝐶𝐿, ∆𝐶𝐴𝑆𝐻, ∆𝑆𝑇𝐷 and ∆𝑇𝑃 equal the change in the total current assets,
current liabilities, cash, and the short-term portion of debt and income tax payable,
respectively. 𝐷𝐸𝑃 measures the depreciation and amortisation for the year and 𝑙𝑎𝑔 (𝑇𝐴) is
the total assets of a firm in the previous year. If a firm has higher than the industry-year mean
of accruals for a particular year, Accrual equals 1 and 0 otherwise.
3.4.7. Firm growth
A growing firm would attract more investors, which, in turn, increases the information
demand for such firms. In their classic work, Fama and French (1998) argue that growth stocks
are riskier than values stocks because of their underlying characteristics such as small size and
higher growth. Consequently, information processing of growth firms is relatively complex for
the analysts, which leads to greater disagreement among analysts, causing forecast errors
and greater dispersion (Maaloul, Ben Amar, & Zeghal, 2016). This study uses the market-to-
book ratio as a proxy of growth opportunities available to a company and we expect it to be
negatively related to a firm’s earnings risk.
3.4.8. Firm profitability
A firm’s financial performance is also considered an important variable determining the level
of a firm’s NFI disclosures (Cormier & Magnan, 1999; Gamerschlag et al., 2011; Tagesson et
al., 2009) and has a significant influence on the accuracy of analysts’ earnings forecasts
(Bernardi & Stark, 2018; Cormier & Magnan, 2014; Dhaliwal et al., 2012). Therefore, to control
the for financial performance effect, we use return on assets (ROA) as a proxy for a company’s
financial performance because it embodies the performance of total investments made by an
organisation. Based on the literature, the financial performance variable carries a positive and
negative sign against level NFI disclosures and earnings risk, respectively.
3.4.9. Industry and index dummies
We use industry and index fixed effects as control variables in our empirical analysis.
Industries included in the sample are as follows: communication services, consumer staples,
consumer discretionary, energy, finacials, health care, industrials, information technology,

47
materials, real estate, and utilities. The indexes included in the sample are: S&P 500, S&P
Europe 350, S&P/TOPIX 150, S&P/ASX All Australian 50, S&P Asia 50, S&P Latin America 40
and S&P/TSX 60.
Table 3. 2. A summary of the study variables and expected signs Variable Variable Type Proxy Literature Expected
Sign
NFI disclosures Independent ESG disclosure scores
(Buchanan, Cao, & Chen, 2018; Han et al., 2016; Nollet, Filis, & Mitrokostas, 2016; Wang & Sarkis, 2017)
-ve
Sensitive industry Firms
Independent Dummy variable (Baron et al., 2011; Garcia et al., 2017) -ve
NFI disclosure Regulations
Independent Dummy variable (Ioannou & Serafeim, 2011; Ioannou & Serafeim, 2017; Bernardi and Stark, 2018)
-ve / +ve
Firm Size Control Logarithm of total market
capitalization
(Ali, Frynas, & Mahmood, 2017; Branco & Rodrigues, 2008; Chiu & Wang, 2015; Tagesson, Blank, Broberg, & Collin, 2009)
-ve
Information demand for the firm
Control Number of analysts following
(Garrido‐Miralles et al., 2016; Martínez‐Ferrero et al., 2016; Bernardi & Stark, 2018; Lee, 2017; Dhaliwal et al. 2012)
-ve / +ve
Financial leverage
Control Debt ratio (Stanny & Ely, 2008) +ve
Firm Growth Control Market-to-book ratio
Maaloul et al., 2016 +ve
Loss Control Dummy variable (Cormier & Magnan, 2014; Dhaliwal et al., 2012; Martínez‐Ferrero et al., 2016)
+ve
Earnings Volatility
Control Standard deviation of EPS – 10 years rolling window
(Dichev and Tang ,2009; Dhaliwal et al., 2012)
+ve
Financial Opaqueness
Control Dummy variable (Hope, 2003; Dhaliwal et al. 2012 ; Choi & Wong, 2007; Gul, Kim, & Qiu, 2010)
+ve
Financial performance
Control Return on assets (Cormier & Magnan, 1999; Gamerschlag et al., 2011; Tagesson et al., 2009)
+ve
Note: Table 3.2 provides a summary of variables and expected signs used in the empirical analysis.
3.5. Basic Diagnostic Test
This study uses regression analysis to test the hypotheses because this analysis method
provides a simple, but dominant way to determine the relationship between two variables
while controlling for other factors. However, before applying the regression analysis, some
diagnostic checks need to be performed to examine the appropriateness of the data for the

48
regression approach. This study performs the following diagnostic checks before regression
analysis.
3.5.1. Pairwise correlation
One of the underlying assumptions for regression analysis is to check the presence of
multicollinearity in the data. Explicitly, there should be no perfect collinear variables among
the independent variables as perfectly collinear explanatory variables undermine the
accuracy of regression results and also result in the violation of one of the underlying classic
linear regression model (CLRM) assumptions (Baltagi, 2008; Gujarati, 2009). Accordingly, we
uses pairwise Pearson correlation analysis to test the multicollinearity assumption of the
regression analysis. This test also provides a basic idea of the association between two
variables and whether the association is worth further investigation. Further, in the post-
estimation analysis, this study also applies variance inflation factor (VIF) test to quantify the
severity of correlation among the variables. As a rule of thumb, a VIF score of less than four
indicates the absence of multicollinearity.
3.6. Regression models
We analyse the impact of NFI disclosures on a company's earnings risk for global index
companies. In doing so, we use a multivariate regression framework because this method
provides the flexibility of testing the impact of an independent variable on a dependent
variable while controlling for several factors. Additionally, the regression framework allows
the inclusion of interaction terms and indicator variables that are essential variables in this
study.
𝐸𝑎𝑟𝑛𝑖𝑛𝑔𝑠 𝑟𝑖𝑠𝑘 = 𝛽0 + 𝛽1𝐸𝑆𝐺𝐷𝑆𝑖𝑡 + 𝛽2 𝑙𝑛𝑠𝑖𝑧𝑒𝑖𝑡 + 𝛽3𝐿𝐸𝑉𝑖𝑡 + 𝛽4𝐿𝑁𝐴𝐹𝑖𝑡 + 𝛽5𝑀𝑇𝐵𝑖𝑡 +
𝛽6 𝐸𝑉𝑂𝐿𝑖𝑡 + 𝛽7𝐿𝑜𝑠𝑠𝑖𝑡 + 𝛽8𝐴𝑐𝑐𝑟𝑢𝑎𝑙𝑠𝑖𝑡 + 𝛽9𝑅𝑂𝐴𝑖𝑡 + 𝛽9 𝐼𝑁𝐷 + 𝛾𝑡 + 𝛿𝑖 + ∈𝑖𝑡 (3.3)
In equation (3.3), we test the impact of NFI disclosures on earnings risk for global index
companies. 𝐸𝑆𝐺𝐷𝑆 measures the ESG disclosure scores, a proxy for NFI disclosures that
captures the impact of NFI disclosures on a firm’s earning risk. Studies show that individual
ESG dimensions have varying effects on the risk profile of an organisation. For example, Chang
et al. (2014) show the varying impact of CSR dimensions that target institutional and primary
stakeholders. Similarly, Benlemlih et al. (2018) report the social dimension as having a larger

49
negative impact on a firm’s total and idiosyncratic risk than the environmental dimension. To
ascertain these varying effects, we use the disaggregated ESG factors, i.e., environmental,
social and governance disclosure scores, to measure their impact on earnings risk.
Lins et al. (2017) report that a higher intensity of CSR disclosures has a more significant impact
on stock returns for the reporting companies. We use quartiles of ESG disclosure scores to
measure the impact of overall and disaggregated NFI disclosures on firms’ earnings risk. We
split ESG disclosure scores into four quartiles with dummies for second, third and fourth
quartile; the intercept captures the effect of the first quartile.
𝐸𝑎𝑟𝑛𝑖𝑛𝑔𝑠 𝑟𝑖𝑠𝑘 = 𝛽0 + 𝛽2𝑄2𝐸𝑆𝐺𝐷𝑆𝑖𝑡 + 𝛽3𝑄3𝐸𝑆𝐺𝐷𝑆𝑖𝑡 + 𝛽4𝑄4𝐸𝑆𝐺𝐷𝑆𝑖𝑡 +
𝛽2𝑙𝑛𝑠𝑖𝑧𝑒𝑖𝑡 + 𝛽3𝐿𝐸𝑉𝑖𝑡 + 𝛽4𝐿𝑁𝐴𝐹𝑖𝑡 + 𝛽5𝑀𝑇𝐵𝑖𝑡 + 𝛽6 𝐸𝑉𝑂𝐿𝑖𝑡 + 𝛽7𝐿𝑜𝑠𝑠𝑖𝑡 +
𝛽9𝑅𝑂𝐴𝑖𝑡 + 𝛽8𝐴𝑐𝑐𝑟𝑢𝑎𝑙𝑠𝑖𝑡 + 𝛾𝑡 + 𝛿𝑖 + ∈𝑖𝑡 (3.4)
In equation (3.4), 2𝐸𝑆𝐺𝐷𝑆 , 𝑄3𝐸𝑆𝐺𝐷𝑆,and 𝑄4𝐸𝑆𝐺𝐷𝑆 capture the impact of the second, third
and fourth quartiles of the NFI disclosure on earnings risk and the constant term captures the
coefficient for firms in the first quartile of NFI disclosures.
Previous studies report that sensitive industry firms make higher NFI disclosures than non-
sensitive firms. For example, using a sample from BRICS countries, Garcia et al. (2017) report
that sensitive industry firms produce a greater ESG performance than their non-sensitive
counterparts. Thus, this study uses a propensity weighted sample to ascertain the causal
effect of sensitive industry on the cumulative and disaggregated disclosures of sensitive
industry firms in the sample.
𝐸𝑆𝐺𝐷𝑆𝑖𝑡 = 𝛽0 + 𝛽1𝑆𝑒𝑛𝑠𝑖𝑡𝑖𝑣𝑒 + 𝛽4𝑙𝑛𝑠𝑖𝑧𝑒𝑖𝑡 + 𝛽5𝐿𝐸𝑉𝑖𝑡 + 𝛽6𝐿𝑁𝐴𝐹𝑖𝑡 + 𝛽7𝑀𝑇𝐵𝑖𝑡 +
𝛽8 𝐸𝑉𝑂𝐿𝑖𝑡 + 𝛽9𝐿𝑜𝑠𝑠𝑖𝑡 + 𝛽10𝐴𝑐𝑐𝑟𝑢𝑎𝑙𝑠𝑖𝑡 + 𝛽9𝑅𝑂𝐴𝑖𝑡 + 𝛽11 𝐼𝑁𝐷 + 𝛾𝑡 + 𝛿𝑖 + ∈𝑖𝑡 (3.5)
In equation (3.5), 𝑆𝑒𝑛𝑠𝑖𝑡𝑖𝑣𝑒 is an indicator variable equal to 1 if a firm belongs to sensitive
industry, 0 otherwise.
We split the sample into sensitive and non-sensitive firms to ascertain whether sensitive firms
benefit more in terms of reduced future earnings risk by reporting NFI disclosures. We expect
the effect of NFI disclosures to be both economically and statistically higher for sensitive
industry firms since these firms go through strict scrutiny because of their sensitive status.
Thus, disclosing more NFI will reduce information asymmetry for these firms more than for

50
non-sensitive industry firms, resulting in reduced earnings risk. Jo and Na (2012) report a
relatively lower market risk for sensitive industry firms that have more CSR disclosures in both
the short and the long run.
For the control variables, 𝑙𝑛𝑠𝑖𝑧𝑒 is the natural logarithm of a firm's market capitalisation at
year-end and 𝐿𝐸𝑉 represents financial distress calculated as total debt scaled by total assets.
𝐿𝑁𝐴𝐹 is the variable that proxies for the number of analysts reporting the earnings forecasts
for a company during the current year, and 𝑀𝑇𝐵 measures the market growth opportunities
of a company. 𝐸𝑉𝑂𝐿 is a measure of a firm's earnings volatility based on the standard
deviation of earnings per share. 𝐿𝑜𝑠𝑠, 𝐴𝑐𝑐𝑟𝑢𝑎𝑙𝑠 and 𝐼𝑁𝐷 are dummy variables that equal 1
if a firm reports negative earnings, shows financial opacity or belongs to sensitive industry
and 0 otherwise, respectively.
To test the effect of mandatory NFI disclosure regulations, we first measure the impact of
regulations on the quantity of NFI disclosures using the following model:
𝐸𝑆𝐺𝐷𝑆𝑖𝑡 = 𝛽0 + 𝛽1𝑅𝑒𝑔 ∗ 𝑡𝑟𝑒𝑎𝑡𝑒𝑑 + 𝛽2𝑙𝑛𝑠𝑖𝑧𝑒𝑖𝑡 + 𝛽3𝐿𝐸𝑉𝑖𝑡 + 𝛽4𝐿𝑁𝐴𝐹𝑖𝑡 + 𝛽5𝑀𝑇𝐵𝑖𝑡 +
𝛽6 𝐸𝑉𝑂𝐿𝑖𝑡 + 𝛽7𝐿𝑜𝑠𝑠𝑖𝑡 + 𝛽8𝐴𝑐𝑐𝑟𝑢𝑎𝑙𝑠𝑖𝑡 + 𝛽9𝑅𝑂𝐴𝑖𝑡 + 𝛽10 𝐼𝑁𝐷 + 𝛾𝑡 + 𝛿𝑖 + ∈𝑖𝑡 (3.6)
In equation (3.6), 𝐸𝑆𝐺𝐷𝑆 is a measure of the NFI disclosures. 𝑅𝑒𝑔 ∗ 𝑡𝑟𝑒𝑎𝑡𝑒𝑑 is an interaction
term that exclusively captures the effect of regulations on the treatment group firms’ NFI
disclosures. The interaction variable is constructed by interacting the treated dummy (S&P
350 index) with a regulation period (post-2017) dummy. The pre- and post-regulation periods
are 2008-2016 and 2017-2018, respectively. Therefore, the post-regulation interaction term
captures the effect of the regulations on NFI disclosures for the treated firms whereas the
constant term captures the disclosure scores of the control group of firms. We use a
propensity score weighting method to mitigate the problem of incomparability of sample
firms in the treatment and the control groups. Equation (3.6) also includes other time-varying
firm-level variables to control for their impact. We also apply industry and year fixed effects
to control for industry and time effects.
Finally, to test the impact of regulation-driven changes in ESG disclosure scores on a firm’s
earnings risk, we use difference-in-differences (DID) analysis. We decompose the ESG

51
disclosure scores into 𝑃𝑟𝑒𝑅𝑒𝑔𝑡𝑟𝑒𝑎𝑡𝑒𝑑𝐸𝑆𝐺𝐷𝑆 and 𝑃𝑜𝑠𝑡𝑅𝑒𝑔𝑡𝑟𝑒𝑎𝑡𝑒𝑑𝐸𝑆𝐺𝐷𝑆 components as
defined in equation (3.7):
𝐸𝑎𝑟𝑛𝑖𝑛𝑔𝑠 𝑟𝑖𝑠𝑘𝑖𝑡 = 𝛽0 + 𝛽1𝑃𝑟𝑒𝑅𝑒𝑔 ∗ 𝑡𝑟𝑒𝑎𝑡𝑒𝑑 ∗ 𝐸𝑆𝐺𝐷𝑆𝑖𝑡 + 𝛽2𝑃𝑜𝑠𝑡𝑅𝑒𝑔 ∗ 𝑡𝑟𝑒𝑎𝑡𝑒𝑑 ∗
𝐸𝑆𝐺𝐷𝑆𝑖𝑡 + 𝛽3 𝑙𝑛𝑠𝑖𝑧𝑒𝑖𝑡 + 𝛽5𝐿𝐸𝑉𝑖𝑡 + 𝛽6𝐿𝑁𝐴𝐹𝑖𝑡 + 𝛽7 𝐸𝑉𝑂𝐿𝑖𝑡 + 𝛽8𝑀𝑇𝐵𝑖𝑡 + 𝛽9𝐿𝑜𝑠𝑠𝑖𝑡 +
𝛽9𝑅𝑂𝐴𝑖𝑡 + 𝛽10𝐴𝑐𝑐𝑟𝑢𝑎𝑙𝑠𝑖𝑡 + 𝛾𝑡 + 𝛿𝑖 + ∈𝑖𝑡 (3.7)
𝑃𝑟𝑒𝑅𝑒𝑔𝑡𝑟𝑒𝑎𝑡𝑒𝑑𝐸𝑆𝐺𝐷𝑆 = (1-Reg) * treated * ESGDS
𝑃𝑜𝑠𝑡𝑅𝑒𝑔𝑡𝑟𝑒𝑎𝑡𝑒𝑑𝐸𝑆𝐺𝐷𝑆 = Reg * treated * ESGDS
𝑃𝑟𝑒𝑅𝑒𝑔𝑡𝑟𝑒𝑎𝑡𝑒𝑑𝐸𝑆𝐺𝐷𝑆 captures the ESG scores for S&P 350 Europe index firms before the
enactment of the regulations and zero otherwise and 𝑃𝑜𝑠𝑡𝑅𝑒𝑔𝑡𝑟𝑒𝑎𝑡𝑒𝑑𝐸𝑆𝐺𝐷𝑆 represents
the ESG scores for treated firms in the post-enactment period and zero otherwise. Reg = 1 for
any firm-year after the enforcement (Directives, 2014), 0 otherwise. This method is beneficial
to compare the impact of ESG disclosure scores on a firm’s earnings risk for S&P 350 Europe
index firms both in the pre- and post-regulation period with the control group (firms in
S&P1200 index other than S&P350) firms.
Given that our sample is restricted to S&P global index companies, we follow Baltagi (2008)
and use fixed effects estimations for all the models above. According to Baltagi (2008) “The
fixed effects model is an appropriate specification if we are focussing on a specific set of N
firms . . . and our inference is restricted to the behaviour of this set of firms” (p. 14). The
Hausman and joint significance Chow (F-test) tests also support the use of fixed-effects
estimation. Alternatively, pooled ordinary least square (OLS) estimation is another potential
method to estimate the impact of NFI disclosure scores on firm earnings risk. However, we
opted against applying this technique since it delivers inconsistent estimates when the fixed
effects technique is appropriate (Cameron & Trivedi, 2005).
Nevertheless, Roberts and Whited (2013) recommend caution in the use of fixed effects
estimation in situations where: (1) the dependent variable is a first differenced variable, i.e.,
a change in investments or market prices; (2) if the research question relates to understanding
cross-sectional variation among the cross-sections, i.e., understanding cross-sectional
variation in analysts’ forecasts error or NFI disclosures in the global index companies in the
context of this study; and (3) where the lagged dependent variable is an explanatory variable,

52
i.e., last year’s earnings per share, when the dependent variable is the current year’s earnings
per share. Notably, our study variables and research questions do not suffer from any of these
limitations; hence the use of fixed effects is a suitable estimation method for the study.
3.7. Robustness and Endogeneity
Panel data models potentially suffer from the presence of non-constant error of variance,
which could be a problem in our data because of the presence of firms with varying
characteristics such as firm size. Consequently, the presence of non-constant variance errors
would result in heteroscedasticity, producing inefficient regression estimates (Baltagi, 2008).
To overcome this problem, we report cluster robust standard errors that correct for the
possible presence of heteroscedasticity. Additionally, studies show panel data studies suffer
from cross-sectional dependence that results in imprecise regression estimates. To correct
for this error, we use (Driscoll & Kraay, 1998) standard error estimation method that controls
for cross-sectional dependence in samples with a large number of cross-sections and a small
number of time-series observations.
We replace firm fixed effects with sector fixed effects along with time fixed effects to allow
more cross-sectional variation. Additionally, we use different proxies for firm characteristics,
i.e., market capitalisation for firm size and volatility of stock returns for firm risk, to test the
robustness of our control variables measures. Prior studies show the realtionship between a
firm's NFI disclosures and risk suffers from omitted variable bias and simultaneity bias (Gangi,
Meles, Monferrà, & Mustilli, 2018; Jo & Na, 2012; D. Lee, 2017). The use of the fixed effects
model mitigates the omitted variable bias, but simultaneity bias is potentially present in our
models. Following (Chang et al., 2014; Oikonomou et al., 2012), we use lagged NFI disclosures
and control variables to resolve the potential simultaneity bias. Further, because of the
endogenous nature of the NFI disclosure variables, we also perform the generalised methods
of momentum (GMM) estimation that provides the flexibility of including both past levels of
a firm’s earnings risk and fixed effects to account for the dynamic aspect of the NFI disclosure
and firm earnings risk relationship and time-invariant unobservable heterogeneity (Cai et al.,
2016). In addition, the GMM estimation method controls for reverse causality that is also a
potential source of endogeneity in the NFI disclosures and firm risk link (Lueg, Krastev, & Lueg,
2019).

53
3.8. Chapter Summary
This chapter outlines the study sample, the dependent, independent and control variables,
the empirical models and the robustness measures used in this study. The study sample
comprises data from S&P 1200 global index companies from 2008-2018. The primary
independent variables are the amount of NFI disclosures characterised by ESG disclosure
scores and NFI disclosure regulations in the EU directive 2014. We use a fixed effects
regression model to ascertain the impact of NFI disclosures on a firm’s earnings risk.
Additionally, this study uses the difference-in-differences approach to capture the mediating
impact of NFI regulations on the relationship between NFI disclosures and earnings risk.
Additionally, this study generates a propensity score-matched sample of regulated and non-
regulated firms to capture the effect of NFI disclosure regulations on the extent of disclosures.
Based on evidence from literature, we control for firm-specific characteristics such as size,
financial performance, growth, earnings volatility, financial opaqueness, information
demand, earnings volatility and financial leverage, to disentangle their effect from the NFI
disclosures and firm risk relationship. To achieve robust regression estimates, we use
standard errors that account for potential sources of bias such as heteroscedasticity,
autocorrelation and cross-sectional dependence (Driscoll & Kraay, 1998). Additionally, to
address endogeneity concerns, we perform a system GMM estimation that uses the dynamic
aspect of the NFI disclosures and firm earnings risk relationship and controls for time-
invariant unobservable heterogeneity.

54
Chapter 4
Results and Discussion
4.1. Introduction
This chapter presents the descriptive statistics, data diagnostics tests and the empirical
analyses to test the research hypotheses concerning the impact of NFI disclosures on earnings
risk, the impact of industry-type on the level of NFI disclosures and the mediating impact of
industry-type on the relationship between NFI disclosures and earnings risk. The descriptive
analysis covers the descriptive statistics of the study variables and the evolution of NFI
disclosures during the sample period. Next, the basic diagnostic test of pairwise correlation
are presented is check that our data meet conditions of regression analysis. Next, the chapter
tests the first hypothesis by exploring the linear and quartile-based impact of NFI disclosures
on the sample firms’ earnings risk. Additional subsample and robustness tests are performed
to ascertain the robustness of our baseline results.
To test the second hypothesis, we present evidence on how the sensitive nature of different
industries determines the NFI disclosure practices of sensitive industry firms and explores
whether sensitive industry membership has varying effects on the different dimensions of NFI
disclosures. The resulting impact of the different levels of NFI disclosures by sensitive and
non-sensitive industry firms on the association between NFI disclosures and future earnings
risk is explored using a split-sample and interaction term approach. The spilt-sample and
interaction term analysis assists in testing the study’s third hypothesis. The chapter ends with
a summary of the findings regarding the impact of NFI disclosures on the firm earnings risk
and the role that sensitive industry membership plays in determining the NFI disclosures of
the sample firms.
4.2. Descriptive Statistics
Table 4.1 presents the descriptive statistics of the study variables. To account for potential
outliers, 1% values of all study variables are winsorised at each end. The primary dependent
variable represented by the earnings risk variable captures the overall uncertainty in an
analyst’s earnings forecast that includes analyst specific uncertainty plus the common
uncertainty among analysts. Following, Barron et al. (1998), we define analyst specific

55
uncertainty as the difference between individual analyst’s forecasts and the mean of analysts’
forecast EPS. Common uncertainty measures the difference between the actual earnings per
share and analysts’ mean forecast EPS. In this sphere, we capture the overall uncertainty
surrounding the analysts’ earnings forecasts for a particular firm; thus, it represents the future
earnings risk for a firm. The mean value for earnings risk shows that, on average, the
uncertainty in analysts’ forecasts dispersion is positive (2.201), which implies that analysts
tend to make dispersed EPS forecasts for the sample organisations compared with their actual
and mean forecasted EPS. Moreover, because of the higher standard deviation (5.656) and
large positive skewness (3.026), this study uses log-transformed values of the earnings risk in
the empirical analyses. The use of log-transformed earnings risk is consistent with the
literature (Barron et al., 2009; Bernardi & Stark, 2018) and does not change the primary
inferences of the results if log-transformation is not applied.
The study’s primary independent variables are the NFI disclosures measured as the
environmental, social and governance (ESG) disclosure scores. The mean of the aggregate ESG
disclosure variable that denotes the overall NFI disclosures of a firm shows that, on average,
sample firms make a moderate disclosures (39.68). The higher standard deviation (14.39)
shows that NFI disclosure practices vary substantially among the sample firms, which is an
expected outcome, considering the diversity of firms in our sample. Moreover, the
disaggregated NFI disclosures show that sample firms make relatively more NFI disclosures
concerning the governance dimension (52.27) than for the environmental (35.18) and social
(37.70) domains. The regulatory requirements to disclose governance-related information is
one possible explanation for the relatively higher levels of governance disclosure scores. The
sample firms report identically on environmental and social disclosures in terms of their mean
and standard deviations measures, indicating that those NFI dimensions receive equal
consideration from corporate managers. Our findings regarding moderate aggregate
disclosures and relatively higher disclosure scores for the governance dimension supports
other studies that used S&P1200 firms as their sample (Del Bosco & Misani, 2016; Hassan &
Giorgioni, 2019).
Table 4.1 also includes the descriptive statistics for the control variables used in the study.
Based on the prior literature, the control variables are firm size, number of analysts following
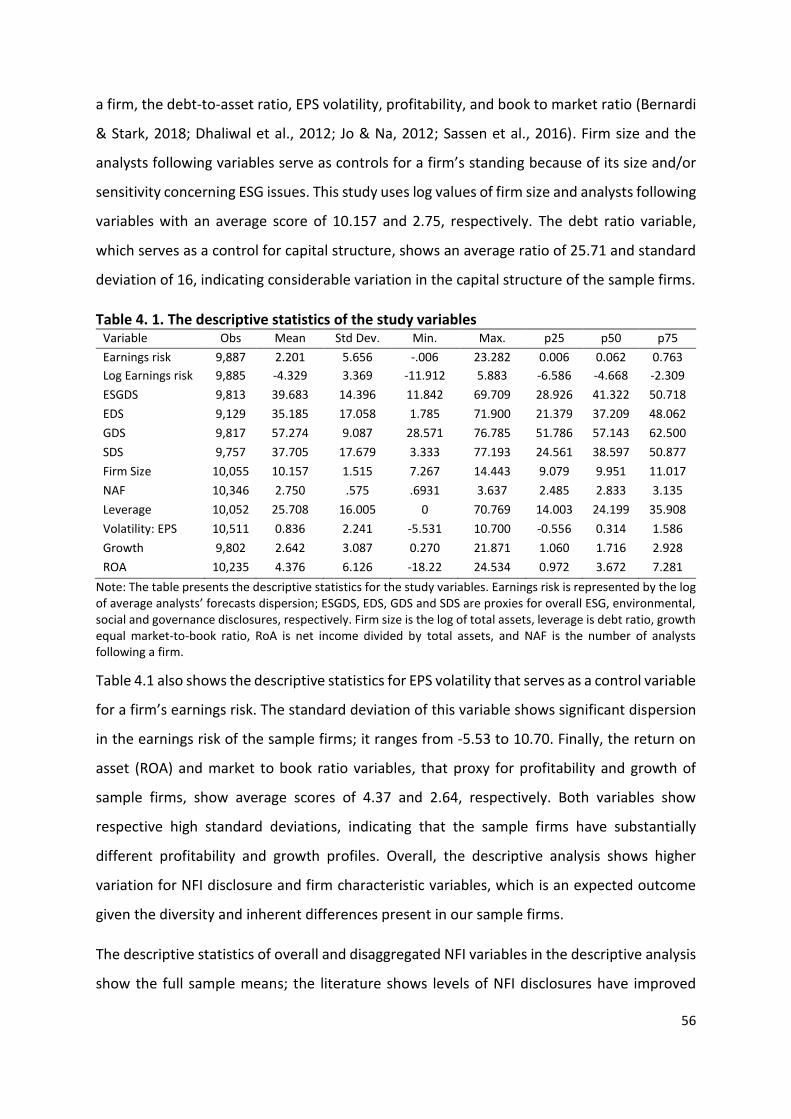
56
a firm, the debt-to-asset ratio, EPS volatility, profitability, and book to market ratio (Bernardi
& Stark, 2018; Dhaliwal et al., 2012; Jo & Na, 2012; Sassen et al., 2016). Firm size and the
analysts following variables serve as controls for a firm’s standing because of its size and/or
sensitivity concerning ESG issues. This study uses log values of firm size and analysts following
variables with an average score of 10.157 and 2.75, respectively. The debt ratio variable,
which serves as a control for capital structure, shows an average ratio of 25.71 and standard
deviation of 16, indicating considerable variation in the capital structure of the sample firms.
Table 4. 1. The descriptive statistics of the study variables Variable Obs Mean Std Dev. Min. Max. p25 p50 p75
Earnings risk 9,887 2.201 5.656 -.006 23.282 0.006 0.062 0.763
Log Earnings risk 9,885 -4.329 3.369 -11.912 5.883 -6.586 -4.668 -2.309
ESGDS 9,813 39.683 14.396 11.842 69.709 28.926 41.322 50.718
EDS 9,129 35.185 17.058 1.785 71.900 21.379 37.209 48.062
GDS 9,817 57.274 9.087 28.571 76.785 51.786 57.143 62.500
SDS 9,757 37.705 17.679 3.333 77.193 24.561 38.597 50.877
Firm Size 10,055 10.157 1.515 7.267 14.443 9.079 9.951 11.017
NAF 10,346 2.750 .575 .6931 3.637 2.485 2.833 3.135
Leverage 10,052 25.708 16.005 0 70.769 14.003 24.199 35.908
Volatility: EPS 10,511 0.836 2.241 -5.531 10.700 -0.556 0.314 1.586
Growth 9,802 2.642 3.087 0.270 21.871 1.060 1.716 2.928
ROA 10,235 4.376 6.126 -18.22 24.534 0.972 3.672 7.281
Note: The table presents the descriptive statistics for the study variables. Earnings risk is represented by the log of average analysts’ forecasts dispersion; ESGDS, EDS, GDS and SDS are proxies for overall ESG, environmental, social and governance disclosures, respectively. Firm size is the log of total assets, leverage is debt ratio, growth equal market-to-book ratio, RoA is net income divided by total assets, and NAF is the number of analysts following a firm.
Table 4.1 also shows the descriptive statistics for EPS volatility that serves as a control variable
for a firm’s earnings risk. The standard deviation of this variable shows significant dispersion
in the earnings risk of the sample firms; it ranges from -5.53 to 10.70. Finally, the return on
asset (ROA) and market to book ratio variables, that proxy for profitability and growth of
sample firms, show average scores of 4.37 and 2.64, respectively. Both variables show
respective high standard deviations, indicating that the sample firms have substantially
different profitability and growth profiles. Overall, the descriptive analysis shows higher
variation for NFI disclosure and firm characteristic variables, which is an expected outcome
given the diversity and inherent differences present in our sample firms.
The descriptive statistics of overall and disaggregated NFI variables in the descriptive analysis
show the full sample means; the literature shows levels of NFI disclosures have improved

57
significantly over the years (Cahaya, Porter, Tower, & Brown, 2015; Hassan, Adhikariparajuli,
Fletcher, & Elamer, 2019). To present a broad picture of how NFI disclosures have changed
during the sample period, Figure 4.1 graphically presents the annual aggregate and sub-
dimension average disclosure scores. The figure shows that aggregate disclosure scores have
steadily increased during the sample period from the low 30s to mid-40s. Relative to other
dimensions, a greater increase (29 to 42) is seen in the social disclosure scores during the
sample period, which suggests that, relatively, social indicators are receiving more attention
from corporate managers.
Figure 4.1. Evolution of NFI disclosures
Note: Figure 4.1 presents the annual evolution of NFI disclosures.
4.3. Diagnostics Test
Before the empirical analysis, we perform the pairwise correlation analysis to examine the
appropriateness of data variables for the regression framework. Gujarati (2009) and Baltagi
(2008) maintain that the presence of perfect collinear variables in a regression equation
undermines the estimates; hence a quick check of the pairwise correlation helps identify any
such collinearity among the variables.
4.3.1. Pairwise correlation analysis
Table 4.3 presents the pairwise correlation coefficients of all variable against each other. A
detailed look at the correlation coefficients shows that there are no perfectly collinear
variables among the selected variables. However, there is a very high pairwise correlation
58
among the aggregate NFI disclosure variable and its sub-dimensions. For example, the social
disclosure scores variable has a correlation coefficient of 0.82 with the overall NFI disclosure
scores variable. Similarly, the NFI sub-dimensions have high correlations amongst each other.
For instance, the environmental dimension exhibits a correlation coefficient of 0.45 and 0.62
with the governance and social dimensions, respectively. Therefore, one should be cautious
in using the different dimensions of NFI disclosures together in a regression equation when
measuring their impact on a firm performance/risk indicator. Accordingly, we use the
disaggregated dimensions of NFI disclosures independently to avoid potential collinearity
problems in the regression analyses.
As hypothesised, the earnings risk variable shows a negative relationship with all NFI
disclosure variables except the environmental disclosures. A thorough sub-index correlation
analysis reveals that the constituents of specific indices such as S&P AS50 drive the positive
relationship between the environmental disclosures and earnings risk. Further, the variables
concerning the risk profile of a firm such as leverage, earnings volatility and negative income,
positively correlate with our earnings risk proxy. Similarly, sensitive industry firms also show
a significant positive correlation with earnings risk. Conversely, the growth and ROA variables
have a negative correlation with earnings risk, signifying that the profitability and growth of
a firm reduce the risks surrounding future earnings. Likewise, higher analyst following also
improves the earnings forecast for a firm, which indicates the analyst following serves as a
tool of firm transparency.
The results also reveal that all the aggregate and disaggregated NFI disclosure variables
display a positive correlation with the firm size, analyst following and sensitive industry
variables. However, the growth and profitability of a firm are positively related to only the
governance domain of the NFI of the study sample firms. At the same time, these variables
show a negative relationship with the other dimensions of NFI disclosures. The variables
concerning a firm’s financial reporting opaqueness (Accrual), negative income and earnings
volatility generally maintain a negative correlation with NFI disclosures. Earnings volatility
maintains a positive correlation with overall and environmental disclosures.
Overall, the correlation analysis shows that the investigated variables maintain anticipated
correlations and there are no perfectly collinear variables that may reduce the efficiency of

59
regression estimates. Nevertheless, some variables show mixed results in terms of their
expected correlation direction. This inconsistency may arise from the diversity of our sample
since it contains firms from a variety of industries and geographical locations that treat NFI
disclosures differently.

60
Table 4. 2. Pairwise correlation matrix of the study variables
Note: The Table presents the pairwise correlation coefficients of the study variables. For variable definitions, refer to Table 4.1. *** = p<0.01; ** = p<0.05; and * = p<0.1.
Variable 1 2 3 4 5 6 7 8 9 10 11 12 13 14
1 Earnings Risk 1 -0.025** 0.062*** -0.227*** -0.091*** -0.005 0.001 -0.336*** 0.517*** -0.203*** -0.131*** 0.100*** 0.046*** 0.066***
2 ESGDS -0.018* 1 0.943*** 0.629*** 0.805*** 0.291*** 0.004 -0.063*** 0.036*** -0.028** 0.195*** -0.024** -0.108*** 0.091***
3 EDS 0.061*** 0.950*** 1 0.449*** 0.618*** 0.261*** -0.007 -0.100*** 0.153*** -0.041*** 0.131*** -0.019* -0.080*** 0.097***
4 GDS -0.210*** 0.600*** 0.431*** 1 0.514*** 0.278*** -0.004 0.059*** -0.201*** 0.037*** 0.216*** -0.050*** -0.122*** 0.021*
5 SDS -0.089*** 0.819*** 0.640*** 0.464*** 1 0.196*** 0.052*** -0.009 -0.134*** -0.015 0.221*** -0.014 -0.098*** 0.093***
6 Firm Size 0.017 0.272*** 0.241*** 0.265*** 0.185*** 1 0.054*** -0.332*** 0.124*** -0.353*** 0.204*** -0.024** -0.204*** -0.037***
7 Leverage 0.024** -0.007 -0.016 -0.014 0.035*** 0.029*** 1 0.010 -0.049*** -0.159*** -0.044*** 0.082*** 0.010 0.074***
8 Growth -0.215*** -0.041*** -0.063*** 0.056*** -0.017 -0.259*** 0.151*** 1 -0.359*** 0.583*** 0.085*** -0.224*** 0.048*** -0.134***
9 Volatility: EPS 0.653*** 0.013 0.130*** -0.211*** -0.144*** 0.100*** -0.007 -0.233*** 1 -0.193*** -0.123*** 0.085*** -0.001 0.063***
10 ROA -0.178*** -0.036*** -0.044*** 0.033*** -0.031*** -0.261*** -0.172*** 0.435*** -0.170*** 1 0.062*** -0.520*** 0.076*** -0.022**
11 NAF -0.115*** 0.194*** 0.137*** 0.197*** 0.215*** 0.222*** -0.057*** 0.057*** -0.124*** 0.060*** 1 -0.048*** -0.063*** -0.085***
12 Loss 0.111*** -0.026** -0.021* -0.053*** -0.015 -0.022** 0.080*** -0.111*** 0.075*** -0.522*** -0.046*** 1 0.029*** 0.050***
13 Accrual 0.043*** -0.101*** -0.074*** -0.121*** -0.094*** -0.194*** 0.012 0.045*** 0.004 0.063*** -0.060*** 0.029*** 1 0.038***
14 Sensitive 0.059*** 0.097*** 0.099*** 0.018 0.094*** -0.059*** 0.057*** -0.110*** 0.059*** -0.041*** -0.086*** 0.050*** 0.038*** 1

61
4.4. The Impact of NFI Disclosures on Earnings Risk
4.4.1. Baseline results
The diagnostics test performed in the previous section provides sufficient support for the
nonexistence of any perfectly collinear variable and unit-root problem in our data, indicating
that the data are suitable for regression analysis. Accordingly, we use panel data regression
techniques to capture the impact of NFI disclosures on a firm’s earnings risk. Specifically, we
apply the panel fixed-effects regression method to test the first hypothesis about the impact
of NFI disclosures on earnings risk. As explained in Chapter 3.6, the fixed-effects regression
method is the most suitable technique given the nature of the study sample. Additionally, the
Hausman test (Table A1) and joint significance Chow F-test also support the fixed-effects
estimation method. We use (Driscoll & Kraay, 1998) standard error estimation method that
controls for cross-sectional dependence in samples with a large number of cross-sections and
a small number of time-series observations. In addition to controlling cross-sectional
dependence, the standard errors estimation method also controls for heteroskedasticity and
auto-correlation problems. Thus, this method is superior to conventional standard and
cluster-robust standard error estimation methods.
Table 4.3, Column 1, presents the results of the impact of aggregate NFI disclosures on
earnings risk. The overall NFI disclosure scores have a significant negative impact on the
future earnings risk, indicating that firms that make more NFI disclosures have more
predictable future earnings than firms that make lower NFI disclosures. From an economic
relevance view point, NFI disclosures reduce the future earnings risk by 1.6%, signifying that
the inclusion of ESG information could provide financial analysts more certainty about the
organisations’ future earnings. The increased certainty translates into lower information
asymmetry among stakeholders, providing the organisation the needed legitimacy regarding
their business operations. This finding agrees with existing studies that report a negative
relationship between NFI disclosures and different firm risk proxies such as total risk
(Benlemlih et al., 2018), systematic risk (Lueg et al., 2019; Oikonomou et al., 2012; Orlitzky &
Benjamin, 2001), firm-specific risk (Benlemlih et al., 2018; Sassen et al., 2016), and analysts
forecasts dispersion (Martínez-Ferrero et al., 2018; Xu & Liu, 2018). Accordingly, this result

62
provides a strong basis to reject the null hypothesis regarding the neutral association between
NFI disclosures and firm earning risk.
The results in Table 4.3 show that the total NFI disclosure score has a significant negative
impact on a firm’s future earnings risk. However, the impact of the individual dimensions of
NFI disclosures, environmental, social and governance disclosures, could have a dissimilar
impact on a firm’s future earnings risk given their unique nature and varying importance for
Table 4. 3. The impact of NFI disclosures on firms’ earnings risk Dependent Variable: Earnings Risk
VARIABLE 1 2 3 4
ESGDS -0.016*** (0.003)
EDS -0.008*** (0.002)
GDS -0.006 (0.006)
SDS -0.013***
(0.003) Leverage 0.018*** 0.019*** 0.018*** 0.017***
(0.005) (0.004) (0.005) (0.004) Firm Size -0.246*** -0.201** -0.308*** -0.257***
(0.070) (0.086) (0.073) (0.071) Growth -0.097*** -0.115*** -0.101*** -0.093***
(0.011) (0.011) (0.010) (0.011) Volatility: EPS 0.370*** 0.421*** 0.360*** 0.362***
(0.037) (0.033) (0.038) (0.037) Loss 0.330*** 0.298*** 0.337*** 0.328***
(0.104) (0.109) (0.105) (0.109) Accrual 0.177*** 0.191*** 0.179*** 0.183***
(0.043) (0.050) (0.044) (0.045) ROA -0.011 -0.009 -0.011 -0.010
(0.012) (0.011) (0.011) (0.012) LNAF -0.130* -0.167** -0.160** -0.144**
(0.071) (0.077) (0.080) (0.066) Constant -1.395 -2.086** -0.972 -1.366
(0.876) (0.982) (0.902) (0.893) FE time, industry and index Yes Yes Yes Yes R-Squared 0.0546 0.0533 0.0511 0.0543 Observations 8,885 8,305 8,891 8,850 Number of groups 915 887 914 913
Note: The Table presents the impact of overall and disaggregated NFI disclosures on a firm’s earnings risk. See
Table 4.1 for variable definitions; standard errors are in parentheses. *** = p<0.01, ** = p<0.05, * = p<0.1.
different stakeholders. Therefore, Table 4.3 presents the isolated impact of each NFI
dimension on a firm’s earnings risk. Table 4.3, Column 2, shows that environmental
disclosures have a significant negative impact on future earnings risk. This signifies that the
reporting of environmental initiatives such as lower greenhouse gas emissions, waste

63
reduction, and recycling of resources by a firm improve its information environment, which
leads to reduced dispersion in forecast and actual earnings. Similarly, Bernardi and Stark
(2018) and Cormier and Magnan (2015) report a significant contribution of environmental
disclosures to improving the information environment of a firm, which leads to a precise
forecast of future earnings. Rezaee, Alipour, Faraji, Ghanbari, and Jamshidinavid (2020)and
Zeng, Zhang, Zhou, Zhao, and Chen (2020) report a negative relationship between
environmental disclosures and proxies of firm risk such as market and total risk, respectively.
The results on social disclosure scores also exhibit a significant negative association with
future earnings risk. This signifies that disclosure of organisational initiatives concerning the
diversity of the workforce, sustainability governance, a better relationship with community
and customers and human capital improves the information landscape and results in better
estimates of future earnings. Our results agree with Cormier and Magnan (2014) and García‐
Sánchez, Gómez‐Miranda, David, and Rodríguez‐Ariza (2019) findings on the impact of social
dimension of NFI disclosures in improving earnings forecasts. Arayssi, Dah, and Jizi (2016)
report a negative relationship between social engagement and risk for firms that have women
directors on their board.
On the other hand, governance disclosure scores do not show any impact on a firm’s future
earnings risk, meaning that the disclosure of governance issues does not improve forecasts of
the future earnings of a firm. Similarly, Bernardi and Stark (2018) report that governance
disclosures do not add any value in the information environment of analysts in South Africa.
Using the KLD database, Erragragui (2018) report that concerns related to the governance
dimension do not have any effect on the cost of debt for U.S. based firms whereas, at the
same time, environmental concerns increase the cost of debt. However, he also reports that
environmental and governance strengths reduce the cost of equity for U.S. based firms, which
indicates that governance strengths and concerns play conflicting roles in reducing firm risk.
Similarly, using specific corporate governance disclosures related to ownership structure,
investor rights, financial transparency and board structure, Yu (2010) reports evidence of a
negative relationship between corporate governance disclosures and analysts’ forecasts
dispersion for an international sample of firms. These contradictory results show that an in-

64
depth, detailed analysis of governance disclosures may reveal more information about their
impact on future earnings risk and other risk indicators.
All the control variables, except ROA, show the expected direction and magnitude. In
particular, firm size, growth and analyst following show a negative relationship with a firm’s
future earnings risk, indicating that larger and growing firms have stable earnings streams
that are forecast more accurately than their smaller counterparts. Similarly, analyst following
reduces the dispersion in forecast and actual earnings, which indicates the monitoring effect
of analyst following. Our results corroborate the literature that shows a positive impact of
firm size, growth and analyst following in reducing a firm’s risk. Conversely, the variables
related to the risk profile of a firm such as leverage, negative earnings, and volatility of EPS
show a positive relationship with a firm’s earnings risk. The positive association between the
risk-related factors and future earnings risk of a firm not only indicates that the risk profile of
a firm increases the dispersion of forecast and actual earnings, but also validates the choice
of risk proxy. The opaqueness of financial disclosures proxied by Accrual also shows a positive
relationship with a firm’s future earnings risk, indicating that financial opacity makes it
difficult to forecast the correct future earnings of a firm. Lastly, this study controls for time,
industry and sub-index effects that account for potential aggregate time-trend effects,
differences in firms belonging to diverse industries and geographies.
4.4.2. NFI quartile results
The results discussed above focus on the average impact of aggregate and disaggregated NFI
disclosures on the future earnings risk of a firm. However, Lins et al. (2017) show that the
higher quartiles of corporate social responsibility (CSR) disclosures have a greater impact on
stock market performance than lower quartiles. Accordingly, we use the quartiles of NFI
disclosures to ascertain their varying impact on the future earnings risk of the sample firms.
We include four dummy variables in our analysis to capture the four quartiles of aggregate
and disaggregated NFI disclosures so that 1st (4th) quartile captures all the firms that make the
lowest (highest) disclosures compared with other firms.
Table. 4.4 presents the results of the NFI disclosure quartiles at the aggregate and sub-
dimension levels. The aggregate disclosure results presented in Table 4.4, Column 1, show an
increasingly negative coefficient for NFI disclosure quartiles. For example, the negative impact

65
of the overall NFI disclosures on future earnings risk of a firm with disclosure scores in the 3rd
quartile of ESGDS disclosures is 0.463 percentage points higher than for a firm with disclosure
scores in the 1st quartile. Further, Table 4.4, Column 2 to 4, show a similar pattern of
increasing impact for all sub-dimensions of NFI disclosures. This finding indicates that firms
making higher disclosures of ESG issues would have a better information environment than
lower disclosure counterparts, which reduces the gap between forecast and actual earnings
estimates.
Table. 4.4 presents the results of the NFI disclosure quartiles at the aggregate and sub-
dimension levels. The aggregate disclosure results in Table 4.4, Column 1, show an
increasingly negative coefficient of NFI disclosure quartiles. For example, the negative impact
of the overall NFI disclosures on future earnings risk of a firm with disclosure scores in the 3rd
quartile of ESGDS disclosures is 0.463 percentage points higher than a firm with disclosure
scores in the 1st quartile. Table 4.4, Columns 2 to 4, show a similar pattern of increasing impact
for all sub-dimensions of NFI disclosures. This indicates that firms making higher disclosures
on ESG issues have better information environments than lower disclosure level counterparts,
consequently, reducing the gap between forecaste and actual earnings estimates.
Interestingly, the higher quartiles of governance disclosures also show a negative impact on
future earnings risk, which was not present under the linear measure of governance
disclosures. This observation reinforces the notion that higher disclosures in all categories of
NFI disclosures improve analysts’ information processing efficiency and lead to more precise
estimates. These findings contradict the view that higher disclosure of information increases
the information load for analysts, leading to imprecise forecasts. Lee and Lee (2019) and Lins
et al. (2017) report an enhanced effect of higher quantiles/quartiles of CSR disclosures on
firms’ value and stock returns, respectively. Based on the quartile regression results, it is
evident that firms disclosing a higher level of NFI disclosures will benefit more in terms of
lower future earnings risk than firms making lower NFI disclosures.
Overall, the baseline results show that NFI disclosures have a significant negative impact on a
firm’s future earnings risk. Additionally, the individual dimensions of NFI disclosures show
varying impacts that signify the disparate importance of each dimension for different
stakeholders.

66
Table 4. 4. The impact of NFI disclosure quartiles on firms’ earnings risk Dependent Variable: Earnings Risk
VARIABLE 1 2 3 4
QESGDS2 -0.236*** (0.053)
QESGDS3 -0.340*** (0.091)
QESGDS4 -0.408*** (0.125)
QEDS2 -0.199*** (0.046)
QEDS3 -0.157** (0.066)
QEDS4 -0.279*** (0.063)
QGDS2 -0.095* (0.056)
QGDS3 -0.306*** (0.090)
QGDS4 -0.257** (0.127)
QSDS2 -0.262***
(0.067) QSDS3 -0.437***
(0.093) QSDS4 -0.453***
(0.092) Leverage 0.018*** 0.019*** 0.018*** 0.017***
(0.005) (0.004) (0.005) (0.004) Firm Size -0.273*** -0.210** -0.282*** -0.270***
(0.072) (0.087) (0.075) (0.072) Growth -0.099*** -0.116*** -0.100*** -0.096***
(0.011) (0.011) (0.011) (0.010) Volatility: EPS 0.367*** 0.417*** 0.366*** 0.368***
(0.038) (0.032) (0.036) (0.038) Loss 0.337*** 0.296*** 0.339*** 0.328***
(0.104) (0.112) (0.103) (0.107) Accrual 0.184*** 0.198*** 0.178*** 0.184***
(0.045) (0.051) (0.044) (0.045) ROA -0.011 -0.008 -0.010 -0.010
(0.012) (0.011) (0.011) (0.012) LNAF -0.144* -0.170** -0.145* -0.162**
(0.074) (0.079) (0.078) (0.069) Constant -1.471 -2.117** -1.469 -1.408
(0.897) (1.000) (0.914) (0.910) FE time, industry and index Yes Yes Yes Yes R-Squared 0.0535 0.0531 0.0528 0.0533 Observations 8,885 8,305 8,891 8,850 Number of groups 915 887 914 913
Note: The Table presents the impact of overall and disaggregated NFI disclosure quartiles on a firm’s earnings
risk; Q2, Q3 and Q4 represent second, third and fourth quartiles of overall ESG and sub-dimension disclosure
scores. Fixed effects mean industry and index fixed effects, see Table 4.1 for variable definitins; standard
errors are are in parentheses. *** = p<0.01, ** = p<0.05, * = p<0.1.
67
Notably, the impact of the social dimension is economically more pronounced than the
environmental dimension of NFI disclosures, indicating that the disclosure of social issues
carries more value than the other dimensions of NFI disclosures in minimising the dispersion
of future earnings risk of a firm. These findings suggest that a more transparent information
environment could serve as a tool to minimise agency problems arising from information
asymmetry between corporate managers and shareholders.
Because of the breadth of information covered under its sub-dimensions, ESG disclosures
cater to a large group of stakeholders, including financial analysts. Accordingly, higher
disclosures concerning different dimensions can mitigate different stakeholders’ concerns
related to the social and environmental impact of a firm. Thus, addressing the information
needs of a diverse group of stakeholders would result in a lower chance of customer
complaints, lawsuits by consumer and environmental groups and penalties by regulating
agencies. The resulting improved stakeholder connections and lower concerns about
unexpected stakeholder actions also serve as an instrument for analysts to make more precise
forecasts about future earnings for the NFI reporting firm.
4.4.3. Subsample analysis
The baseline analysis provides sufficient evidence on the significant negative impact of overall
and disaggregated NFI disclosures on a firm’s earnings risk except for the governance
dimension of NFI disclosures that does not exhibit a significant relationship. To further analyse
this relationship, we perform subsample analysis to account for differing firm characteristics
such as size, debt level, income status (negative or positive) and volatility of stock returns
(high vs low volatility). For example, subsequent analysis is undertaken to ascertain whether
the impact of NFI disclosures varies between large and small firms or between high leverage
and low leverage firms24. These analyses are vital given that existing studies report that firm
characteristics such as size, levergage and stock return volatility influence the association
between NFI disclosures and firm risk. For example, Oikonomou et al. (2012) report higher
association between CSR concerns and firms’ financial risk during periods of high stock returns
24 All subsample analysis tables are presented in Appendix A.

68
volatility. Moreover, Sassen et al. (2016) report that highly visible firms show higher
association between ESG disclosures and firms’ financial risk than their low visibility
counterparts. Thus, the proposed subsample analyses could provide additional information
about the association between NFI disclosures and firms’ earnings risk.
Table. A.2 compares the results for large and small firms. We define a firm as large if the value
of its total assets is more than the median value of total assets of the sample firms. According
to the results, larger firms benefit more in terms of reducing their future earnings risk by
reporting NFI disclosures than smaller firms. This effect is more pronounced for
environmental-related reporting and is non-existent for governance disclosures. These
findings complement the literature that shows larger firms have stable earnings (Chung &
Kim, 1994) and they exhibit a higher level of disclosures (Lang & Lundholm, 1996), resulting
in a better information environment. It is essential to understand that, because of their scale
of operations and impact on society, larger firms come under stricter scrutiny from
stakeholders than smaller firms. Hence, this finding provides a useful insight for corporate
managers and stakeholders of large firms to improve the information environment of their
firm through ESG reporting, especially efforts undertaken to mitigate the impact of their
operations on the environment.
We apply a sub-sample analysis to high and low leverage firms. Any firm having a debt ratio
higher than the median debt ratio of the sample firms is classified as a high leverage firm and
otherwise. Table A.3 shows the differences between high and low leverage firms regarding
the impact of NFI disclosures on future earnings risk. The table shows that the overall NFI
disclosures reduce the gap between forecast and actual earnings slightly more for high
leverage firms than for low leverage counterparts. Similarly, this difference is more
pronounced when disaggregared disclosures such as environmental and governance are
considered. This observation is particularly relevant as the literature shows that highly
leverage firms face higher monitoring and, as a result, make better investments in ESG issues
(Iatridis, 2015). Therefore, additional monitoring exercised by creditors could enhance the
quality of disclosures and reduce the future earnings risk of high leverage firms.
Next, we apply another sub-sample analysis to high and low stock return volatility samples.
Firms with stock returns higher than the median return of the sample firms are categorised

69
as high-risk firms and otherwise. Table. A.4 shows that the overall impact of NFI disclosures is
more robust for high stock return volatility firms than for lower volatility returns firm. This
observation is also true for the social dimension of NFI disclosures. These findings agree with
Oikonomou et al. (2012) as they report a higher association between firm CSR disclosures and
firm risk during time of high stock market volatility. Thus, our findings complement earlier
findings on the higher impact of NFI disclosures for financially distressed firms. This finding is
particularly important for financial managers operating in high risk stock markets and in
general for corporate decision makers during market-wide contagion such as global financial
crisis and the current covid-19 pandemic crisis.
Lastly, we perform sub-sample analysis for firms reporting a negative income in the current
year against firms reporting a profit. This analysis is important given that the negative income
alleviates the information asymmetry problem for stakeholders, requiring firms to disclose
more information that can explain the reason for negative income. Table A.5 presents the
results for loss-making and profitable firms. It shows the overall impact of NFI disclosures is
significantly higher for loss reporting firms than for firms reporting a positive income. All the
sub-dimensions of NFI disclosures show a significantly higher coefficient for firms
experiencing negative income than for profit-making firms. This difference is more
pronounced for environmental disclosure than for the other dimensions. This finding suggests
that information asymmetry arising from negative earnings can be reduced by reporting more
information regarding a firm’s efforts on ESG issues.
Overall, the subsample analyses show that the impact of NFI disclosures varies based on firm
characteristics such as size, risk and profitability. However, the study’s results suggest that,
regardless of differing firm characteristics, NFI disclosures improve the information
environment for a firm, resulting in lower future earnings risk. These results provide beneficial
understandings about the impact of NFI disclosures and show that they are useful whether a
firm is experiencing information asymmetry because of financial distress or a large firm is
experiencing higher stakeholder scrutiny because of their operational scale. All firms can
address stakeholders’ concerns by improving their information environment through NFI
reporting.

70
4.4.4. Robustness tests
We perform several robustness tests to check the robustness of the baseline results. First, to
control for country level institutional factors, we rerun the baseline results including country
dummies. The untabulated results show that our results remain qualitatively similar to the
baseline results.
Table 4. 5. The impact of NFI disclosures on stock return volatility Dependent Variable: Stock Return Volatility
VARIABLE 1 2 3 4
ESGDS -0.102*** (0.030)
EDS -0.062*** (0.023)
GDS -0.021
(0.019) SDS -0.066**
(0.026)
Leverage 0.191*** 0.186*** 0.193*** 0.194***
(0.022) (0.023) (0.023) (0.024)
Firm Size -2.334* -2.056* -2.566** -2.247*
(1.222) (1.195) (1.194) (1.190)
Growth -0.366*** -0.358*** -0.378*** -0.356***
(0.082) (0.078) (0.087) (0.083)
Volatility : EPS 1.592*** 1.597*** 1.560*** 1.516***
(0.366) (0.337) (0.359) (0.373)
Loss Dummy 6.874*** 6.014*** 6.880*** 6.793***
(1.174) (0.902) (1.182) (1.159)
Accrual Dummy 0.125 0.245 0.115 0.171
(0.256) (0.233) (0.262) (0.252)
RoA -0.029 -0.031 -0.028 -0.025
(0.078) (0.063) (0.078) (0.076)
LNAF -1.578** -1.054** -1.742** -1.625**
(0.629) (0.471) (0.713) (0.664)
Constant 54.802*** 48.741*** 54.984*** 52.458***
(13.309) (12.948) (13.131) (12.865)
FE time, industry and index Yes Yes Yes Yes
R-squared 0.6009 0.5933 0.6008 0.6017
Observations 8,888 8,312 8,894 8,853
Number of groups 916 888 915 914
Note: The Table presents the impact of overall and disaggregated NFI disclosures on a firm’s stock returns volatility. See Table 4.1 for the variable definitions; standard errors are in parentheses. *** - p<0.01, ** = p<0.05, * - p<0.1.
Second, we use annualised volatility of stocks returns as an alternative proxy for firm risk. This
proxy is widely used as a proxy of firm risk along with the analysts’ forecasts dispersion in the

71
firm information environment literature, e.g., see (Chien & Lu, 2015) and (Kothari et al., 2009).
Hence, evidence of a significant negative relationship between an alternative firm risk proxy
and NFI disclosures will enhance our understanding of the hypothesised relationship between
firm risk and NFI disclosures.
Table 4. 6. The impact of NFI disclosures on firms’ earnings risk (Alternative proxies) Dependent Variable: Earnings Risk
VARIABLE 1 2 3 4
ESGDS -0.009** (0.003)
EDS -0.004* (0.002)
GDS -0.002 (0.005)
SDS -0.009***
(0.003)
Debt to equity 0.042*** 0.041*** 0.042*** 0.043***
(0.007) (0.007) (0.006) (0.007)
Log of Market cap. -0.739*** -0.787*** -0.766*** -0.732***
(0.067) (0.066) (0.063) (0.069)
Sales Growth -0.215** -0.194 -0.214** -0.197*
(0.107) (0.141) (0.105) (0.110)
Volatility: EPS 0.306*** 0.349*** 0.298*** 0.304***
(0.040) (0.032) (0.042) (0.039)
Loss 0.206** 0.181* 0.210** 0.203*
(0.102) (0.106) (0.102) (0.104)
Accrual 0.176*** 0.182*** 0.176*** 0.182***
(0.043) (0.049) (0.044) (0.044)
ROA -0.001 0.002 0.001 -0.000
(0.011) (0.010) (0.011) (0.011) LNAF -0.082 -0.081 -0.101 -0.072
(0.067) (0.080) (0.072) (0.069) Constant 2.767*** 3.044*** 2.865*** 2.661***
(0.631) (0.632) (0.578) (0.657) FE time, industry and index Yes Yes Yes Yes
R-Squared 0.0757 0.0748 0.0744 0.0762
Observations 8,808 8,237 8,814 8,774 Number of groups 912 884 911 910
Note: The Table presents the impact of overall and disaggregated NFI disclosures on a firm’s earnings risk. Debt to equity, log of market capitalisation and sales growth are alternative proxies for leverage, firm size and growth. See Table 4.1 for variable definitions; standard errors in parentheses. *** = p<0.01, ** = p<0.05, * = p<0.1
Table. 4.6 presents the results of the impact of the NFI disclosure proxies used in this study
on stock return volatility. The results show that the overall disclosures along with the
environmental and social dimensions exhibit a significant negative relationship with stock
returns volatility, signifying that firms reporting higher NFI disclosures experience less risk in

72
terms of stock returns volatility. In line with the baseline results, governance disclosures do
not show any significant impact on earnings risk. These findings complement and support our
baseline results regarding the role of NFI disclosures in reducing uncertainty surrounding a
firm’s stock returns.
Table 4. 7. The impact of NFI disclosures on firms’ earnings risk (Alternative proxies) Dependent Variable: Earnings Risk
VARIABLE 1 2 3 4
ESGDS -0.015*** (0.003)
EDS -0.008*** (0.002)
GDS -0.006 (0.006)
SDS -0.013***
(0.003) Firm Size -0.267*** -0.226** -0.326*** -0.278***
(0.073) (0.090) (0.076) (0.075) Volatility: EPS 0.364*** 0.415*** 0.353*** 0.356***
(0.035) (0.030) (0.036) (0.034) Loss dummy 0.306*** 0.274*** 0.311*** 0.302***
(0.100) (0.102) (0.102) (0.105) Accrual dummy 0.188*** 0.206*** 0.189*** 0.195***
(0.046) (0.053) (0.047) (0.048) Log NAF -0.129* -0.169** -0.157* -0.142**
(0.071) (0.077) (0.080) (0.065) Growth_NFS -0.071*** -0.089*** -0.074*** -0.066***
(0.010) (0.011) (0.010) (0.009) RoA_ NFS -0.014 -0.012 -0.013 -0.012
(0.011) (0.010) (0.011) (0.011) Leverage_ NFS -0.023** -0.037** -0.023** -0.026**
(0.011) (0.016) (0.011) (0.012) Growth_FS -0.407*** -0.409*** -0.417*** -0.410***
(0.058) (0.064) (0.058) (0.060) RoA_FS 0.002 0.014 0.002 0.003
(0.019) (0.016) (0.019) (0.019) Leverage_FS 0.000 0.000 0.000 0.000
(0.000) (0.000) (0.000) (0.000) Constant -1.184 -1.795* -0.758 -1.138
(0.888) (1.001) (0.923) (0.903) FE time, industry and index Yes Yes Yes Yes
R-squared 0.0618 0.0602 0.0586 0.0619
Observations 8,885 8,305 8,891 8,850 Number of groups 915 887 914 913
Note: Growth_NFS (FS), RoA_NFS (FS) and Leverage_FS (NFS) represent market-to-book ratio, return on assets and debt ratio of non-financial firms (financial firms), respectively. See Table 4.1 for other variable definitions; standard errors are in parentheses *** = p<0.01, ** = p<0.05, * = p<0.1.
After testing for an alternative proxy for the dependent variable, we substitute some of the
control variables with alternative proxies. First, the proxies for firm size, leverage and growth

73
are changed to the log of market capitalisation, debt to equity, and sales growth,
respectively25. Table. 4.6 shows that the impact of NFI disclosures under the alternative
proxies have similar coefficients to the baseline results, signifying that the results are robust
for different measures of firm size, leverage and growth. In addition, alternative proxies
except for the sales growth variable also show a significant relationship with earnings risk.
Since the full sample analysis also contains financial service sector firms, this study follows
(Bernardi & Stark, 2018) to spilt the leverage, profitability and growth variables into two
components. For example, the debt ratio is split into two components so that each variable
contains only the debt ratios for either financial or non-financial firms. This way, the study
model captures the effect of each component separately and does not affect the primary
relationship between NFI disclosure and earnings risk. Table. 4.7 present the results, where
the main conclusion vis-à-vis the impact of overall NFI disclosures and environmental and
social dimension remains the same. We also perform a spilt sample analysis only on non-
financial firms. Table A.6 results confirm that the main conclusion about the significant
negative impact of NFI disclosures on future earning risk stays the same.
To address the endogeneity concern arising from the bidirectional contemporaneous
association between NFI disclosures and earnings risk, we follow (Oikonomou et al., 2012) to
include one-period lagged independent variables of NFI disclosures and firm characteristics
used in our baseline model. Table. 4.8 show that the main conclusions of the baseline results
do not change, indicating that simultaneity and bidirectional effects do not alter our main
conclusions. However, as opposed to baseline results, the dimension of governance
disclosure scores also show a significant impact on earnings risk alongside environmental and
social disclosures.
The results in Table 4.8 indicate that governance-related disclosures have a lagged effect on
earnings risk. This finding agrees with Godfrey et al. (2009) argument that including lagged
values of NFI disclosures ensures that all the considered information is public knowledge. The
finding of the lagged effect for governance disclosures also aligns with the literature that
25 The baseline results use log of total assets, debt ratio, and market to book ratio as proxies of firm size,
leverage and growth, respectively.
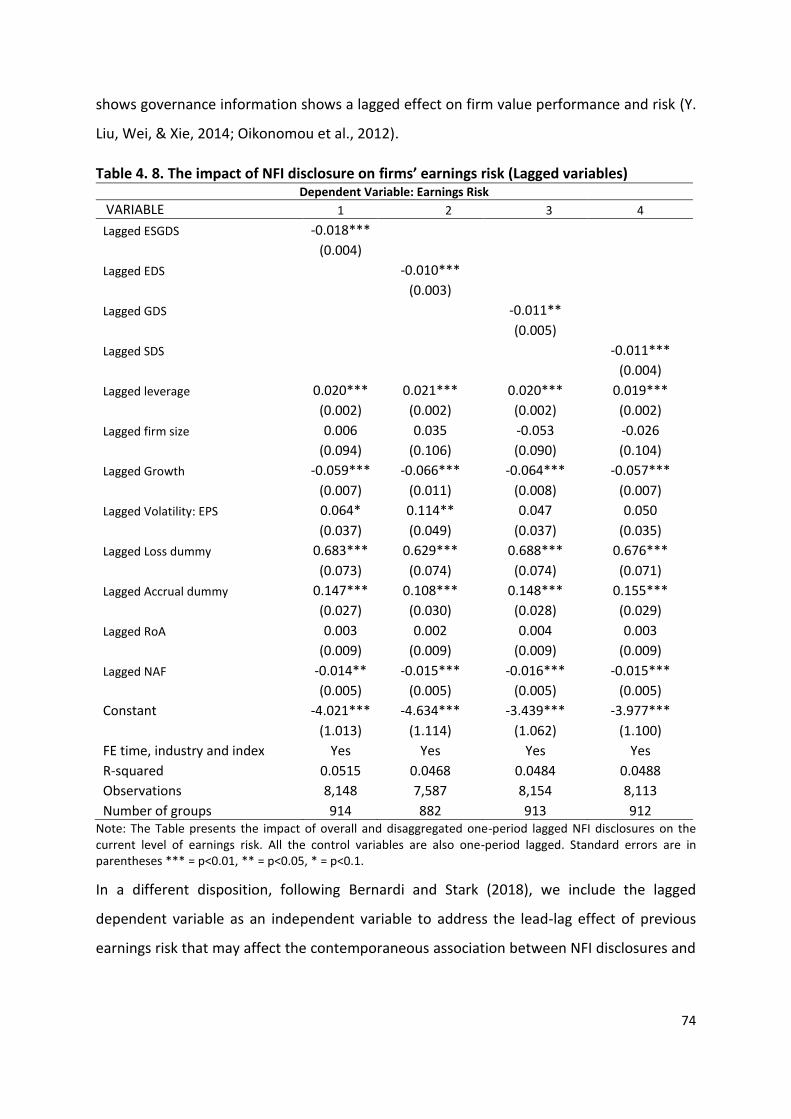
74
shows governance information shows a lagged effect on firm value performance and risk (Y.
Liu, Wei, & Xie, 2014; Oikonomou et al., 2012).
Table 4. 8. The impact of NFI disclosure on firms’ earnings risk (Lagged variables) Dependent Variable: Earnings Risk
VARIABLE 1 2 3 4
Lagged ESGDS -0.018*** (0.004)
Lagged EDS -0.010*** (0.003)
Lagged GDS -0.011**
(0.005) Lagged SDS -0.011***
(0.004)
Lagged leverage 0.020*** 0.021*** 0.020*** 0.019***
(0.002) (0.002) (0.002) (0.002)
Lagged firm size 0.006 0.035 -0.053 -0.026
(0.094) (0.106) (0.090) (0.104)
Lagged Growth -0.059*** -0.066*** -0.064*** -0.057***
(0.007) (0.011) (0.008) (0.007)
Lagged Volatility: EPS 0.064* 0.114** 0.047 0.050
(0.037) (0.049) (0.037) (0.035)
Lagged Loss dummy 0.683*** 0.629*** 0.688*** 0.676***
(0.073) (0.074) (0.074) (0.071)
Lagged Accrual dummy 0.147*** 0.108*** 0.148*** 0.155***
(0.027) (0.030) (0.028) (0.029)
Lagged RoA 0.003 0.002 0.004 0.003
(0.009) (0.009) (0.009) (0.009)
Lagged NAF -0.014** -0.015*** -0.016*** -0.015***
(0.005) (0.005) (0.005) (0.005)
Constant -4.021*** -4.634*** -3.439*** -3.977***
(1.013) (1.114) (1.062) (1.100)
FE time, industry and index Yes Yes Yes Yes
R-squared 0.0515 0.0468 0.0484 0.0488
Observations 8,148 7,587 8,154 8,113
Number of groups 914 882 913 912 Note: The Table presents the impact of overall and disaggregated one-period lagged NFI disclosures on the current level of earnings risk. All the control variables are also one-period lagged. Standard errors are in parentheses *** = p<0.01, ** = p<0.05, * = p<0.1.
In a different disposition, following Bernardi and Stark (2018), we include the lagged
dependent variable as an independent variable to address the lead-lag effect of previous
earnings risk that may affect the contemporaneous association between NFI disclosures and

75
earnings risk. The results in Table A.7 show that adding the lagged dependent variable
produces significant coefficients; however, the baseline results do not change.
The significant lagged effects of both the independent and dependent variable raise concern
of an unobserved heterogeneity problem in our analysis. Studies such as Cai et al. (2016),
Ioannou and Serafeim (2015) and Jo and Harjoto (2011) report a similar concern regarding
NFI disclosures as an endogenous variable resulting in the simultaneous determination of the
negative relationship between NFI disclosure and firm risk. Additionally, we consider the
potential of reverse causality between NFI disclosures and firm risk. For example, the current
or past realisation of firm risk may also influence the future NFI disclosures of a firm to reduce
information asymmetry. Given these concerns, this study uses Blundell and Bond (1998)
system generalised methods of the moment (GMM) estimator to calculate robust estimates
concerning the dynamic relationship between NFI disclosures and a firm’s earnings risk.
According to Blundell and Bond (1998), system GMM is more robust than other GMM
estimators like the first-difference GMM estimator of (Arellano & Bover, 1995) and the non-
linear GMM estimator of (Ahn & Schmidt, 1995). Additionally, the system GMM, like other
GMM estimators, provides the flexibility of using lagged values of the independent and
dependent variables as instruments. Thus, the system GMM becomes a prime instrument of
choice to address endogeneity concerns in the absence of strictly exogenous instruments
(Mohamed, Masih, & Bacha, 2015; Nadeem, 2016).
To that end, we use the STATA’s xtabond2 command developed by (Roodman, 2009) to
explore the dynamic relationship between a firm’s NFI disclosures and earnings risk. Given
the significant lagged effect of the independent variables, this study assumes lagged firm risk
and all the independent variables as endogenous variables. Following the arguments
presented by (Y. Liu et al., 2014) and (Wintoki, Linck, & Netter, 2012) distant historical values
of the dependent variable and firm characteristics are assumed to provide an exogenous
source of variation for the current level of a firm’s earnings risk. Accordingly, lagged values of
t-5 to t-9 are used as instruments in the system GMM estimation. Robust standard errors are
used to address heteroscedasticity concerns.
Table 4.9 presents the results of the system GMM estimates that show the significant
negative impact of the overall and sub-dimension NFI disclosures on earnings risk, confirming

76
that firms reporting more NFI disclosures are better at reducing the gap between their
forecast and actual earnings. The results of the aggregate NFI disclosures presented in Table
4.9 are identical to our baseline results. However, the results of the environmental (social)
dimension exhibits a moderately higher (lower) coefficient. The governance dimension also
has a significant adverse effect as was present in the one-period lagged specification, but the
contemporaneous baseline model was unable to show such a relationship. These results
reinforce our earlier argument that reporting information related to ESG issues significantly
reduces information asymmetry among analysts, resulting in more precise forecasts that
ultimately reduce a firm’s earnings risk.
Table 4. 9. The impact of NFI disclosure on firms’ earnings risk (System GMM estimator) VARIABLE Dependent Variable: Earnings Risk
1 2 3 4
Lagged earnings risk 0.426*** (0.110)
0.384*** (0.109)
0.372*** (0.118)
0.430*** (0.107)
ESGDS -0.021***
(0.008)
EDS
-0.018*** (0.006)
GDS
-0.029** (0.014)
SDS
-0.011** (0.005)
Control variables Yes Yes Yes Yes
FE Year and Industry Yes Yes Yes Yes
AR (1) p- value 0.000 0.000 0.000 0.000
AR (2) p- value 0.186 0.266 0.309 0.124
Hansen test of overid p- value 0.225 0.631 0.054 0.210
Difference-in-Hansen Test for exogeneity 0.230 0.289 0.226 0.490
Observations 6,072 5,600 6,081 6,046
Number of id 859 817 859 855
Note: Lagged earnings risk is a one-period lagged dependent variable. AR(1) and AR(2) represent the first and second-order autocorrelation tests for the first-difference residuals. The Hansen test and difference-in-Hansen test show the test statistics for over-identification and exogeneity of instruments, respectively. Standard are errors in parentheses *** = p<0.01, ** = p<0.05, * = p<0.1
Table 4.9 also contains the results of specification tests of autocorrelation AR(2), Hansen test
of over-identification and difference-in-Hansen test of exogeneity. The p-values of AR(2)
range from 0.124 to 0.309, suggesting that the null hypothesis concerning second-order
autocorrelation is not rejected for all models. Except for governance disclosures model with
a p-value of 0.054, the highly insignificant p-value for the Hansen tests signifies the validity of
our instruments for the models. We also test another GMM estimator assumption that the

77
correlation between the endogenous variables and unobserved fixed-effects is constant over
time. This system GMM estimator assumption provides the flexibility of adding lagged
differences of endogenous variables as instruments in the system GMM estimation process
and can be conveniently tested using the difference-in-Hansen test of exogeneity
(Eichenbaum, Hansen, & Singleton, 1988; Wintoki et al., 2012). The highly insignificant p-
values of difference-in-Hansen test for all models suggest strong non-rejection of the null
hypothesis concerning the exogeneity of the additional subset of instruments. Overall, the
system GMM specification tests support our earlier conclusion about the significant negative
relationship between NFI disclosures and earnings risk.
4.5. Sensitive Industries Analysis
The above analysis shows the impact of NFI disclosures on a firm’s future earnings risk without
considering the inherent negative impact of its business operations on the society and
environment. However, prior studies on NFI disclosures maintain that, because of the harmful
effects of their business activities on the society and environment, sensitive industry firms are
subject to higher reputation risk than their counterparts. Therefore, to increase the legitimacy
of their business operations, firms in sensitive industries make more NFI disclosures than their
counterparts (Garcia et al., 2017; Grougiou, Dedoulis, & Leventis, 2016; Kilian & Hennigs,
2014). Additionally, previous studies show that reporting more information about business
activities provides more benefits for sensitive industry firms in terms of higher market value
(De Klerk, De Villiers, & Van Staden, 2015; Reverte, 2016), lower cost of capital and debt
(Gerwanski; Reverte, 2012), and a firm’s market risk (Jo & Na, 2012; Zeng et al., 2020). We
separately analyse the impact of NFI disclosures on future earnings risk for sensitive and non-
sensitive industry firms to ascertain the differences that may arise because of a company’s
involvement in ESG-sensitive industries.
Before analysing the differences between the impact of NFI disclosures on a firm’s future
earnings risk between sensitive and non-sensitive industry firms, we first test the second
hypothesis on differences in the level of NFI disclosures between the two firm types of firms.
This analysis extends the existing evidence of higher NFI disclosures by sensitive industry firms
for an international sample, resulting in far-reaching understanding about the relationship
between involvement in an ESG sensitive business and NFI disclosure practices. To the best

78
of our knowledge, such evidence is non-existent in the literature. Following (Baron et al.,
2011; Garcia et al., 2017), we treat a firm as a sensitive firm if it belongs to the alcohol,
tobacco, gambling, weapon production, adult entertainment, oil, gas and consumable fuels,
metal and mining, paper and forest products, chemical, construction materials, or energy
businesses.
4.5.1. Level of NFI disclosure: Sensitive v/s non-sensitive industry firms
To explore the differences in the level of NFI disclosures between sensitive and non-sensitive
industry firms, we use the propensity score estimation technique to draw a matched sample
of non-sensitive firms that are comparable to sensitive industry firms. There are several
methods to perform propensity score estimation such as nearest neighbour matching, Kernel
matching, radius matching and stratification matching. However, these matching techniques
may suffer from several drawbacks. For example, Guo and Fraser (2014) maintain that
propensity matching techniques may require a large number of control group participants to
provide reliable matching estimates. Additionally, Randolph and Falbe (2014) report that,
depending on the matching technique (one-to-one or one to many matches, exact, nearest
neighbour or optimal matching; many participants in the control group may not be used for
matching because they do not match a participant in the treatment group. Consequently,
there is a potential risk of losing many observations from the treatment group, resulting in
the loss of valuable information and generalisability of the treatment effect (Austin, 2017).
We use the propensity score weighting (PSW) technique introduced by (McCaffrey, Ridgeway,
& Morral, 2004) to overcome the problems mentioned above with propensity score matching
techniques. This method of propensity score estimation is more efficient than conventional
matching techniques and provides better results when the treated and control groups have
quantitatively different characteristics. For example, in our sample, sensitive industry firms
show a higher financial opaqueness than non-sensitive firms. Firm size for both types of firms
also differs significantly26. Hence, accounting for these divergences is necessary because
existing studies show that, along with other firm characteristics, earnings management and
26 In untabulated results, we performed the mean comparison test of firm size, volatility of EPS and return on
assets. All the mean comparison tests show both types of firm are significantly different from each other.

79
firm size are dominant determinants of NFI disclosures (Abdi, Kacem, & Omri, 2018; Fahad &
Nidheesh, 2020; Ismail & El‐Shaib, 2012).
Using generalised boosted models, the PSW technique eliminates the differences between
the covariates (firm characteristics here) of control and treatment groups, resulting in the
formation of a control group that is comparable to the treatment group. Therefore, the
influence on NFI disclosures because of being a sensitive industry firm relative to non-
sensitive industry firm can be captured in a propensity-matched sample under the PSW
method. McCaffrey et al. (2013) suggest that, if there is imbalance and insufficient overlap
between the two groups, the casual estimation may produce inefficient results. To check
these conditions, we present overlap plot and balance tables of PSW estimation in Appendix
B. The overlap boxplot in Figure B.1 shows a sufficient overlap between the sensitive and non-
sensitive industry groups to indicate that the treatment and control groups have firms that
are identical to each other in terms of firm-specific characteristics. Additionally, we use the
standardised effect size differences (ES) statistic to summarise the differences in the means
of covariates for treatment and control groups. The ES statistic is calculated as:
ES Statistic = 𝐷𝑖𝑓𝑓𝑒𝑟𝑒𝑛𝑐𝑒 𝑖𝑛 𝑡ℎ𝑒 𝑚𝑒𝑎𝑛𝑠 𝑜𝑓 𝑎 𝑐𝑜𝑣𝑎𝑟𝑖𝑡𝑒𝑠 𝑓𝑜𝑟 𝑡𝑟𝑒𝑎𝑡𝑚𝑒𝑛𝑡 𝑎𝑛𝑑 𝑐𝑜𝑛𝑡𝑟𝑜𝑙 𝑔𝑟𝑜𝑢𝑝𝑠
𝑆𝑡𝑎𝑛𝑑𝑎𝑟𝑑 𝑑𝑒𝑣𝑖𝑎𝑡𝑖𝑜𝑛 𝑜𝑓 𝑡ℎ𝑒 𝑐𝑜𝑣𝑎𝑟𝑖𝑎𝑡𝑒
Table 4.10 shows the ES statistic before and after the PSW, which indicates the statistically
significant differences in firm size and EPS volatility between the control and treatment
groups in the unweighted sample. For example, the unweighted sample scores for firm size
are statistically significant difference of 0.075 between two types of firm. However, the
differences do not exist in the weighted samples scores, indicating that PSW successfully
eliminated them. Based on these results, it is suggested that there is sufficient overlap and
balance between the weighted samples of sensitive and non-sensitive industry firms,
indicating that PSW successfully creates a control sample of non-sensitive firms that is
analogous to the treatment (sensitive firms) sample.
After the estimation of the PSW matched samples, we use the average treatment effect (ATE)
method to estimate the treatment effects of sensitive industry status on the NFI disclosure
practices of the treatment group firms. The results in Table 4.11, Panel A, show that sensitive
industry firms make higher aggregate NFI disclosures than their non-sensitive industry
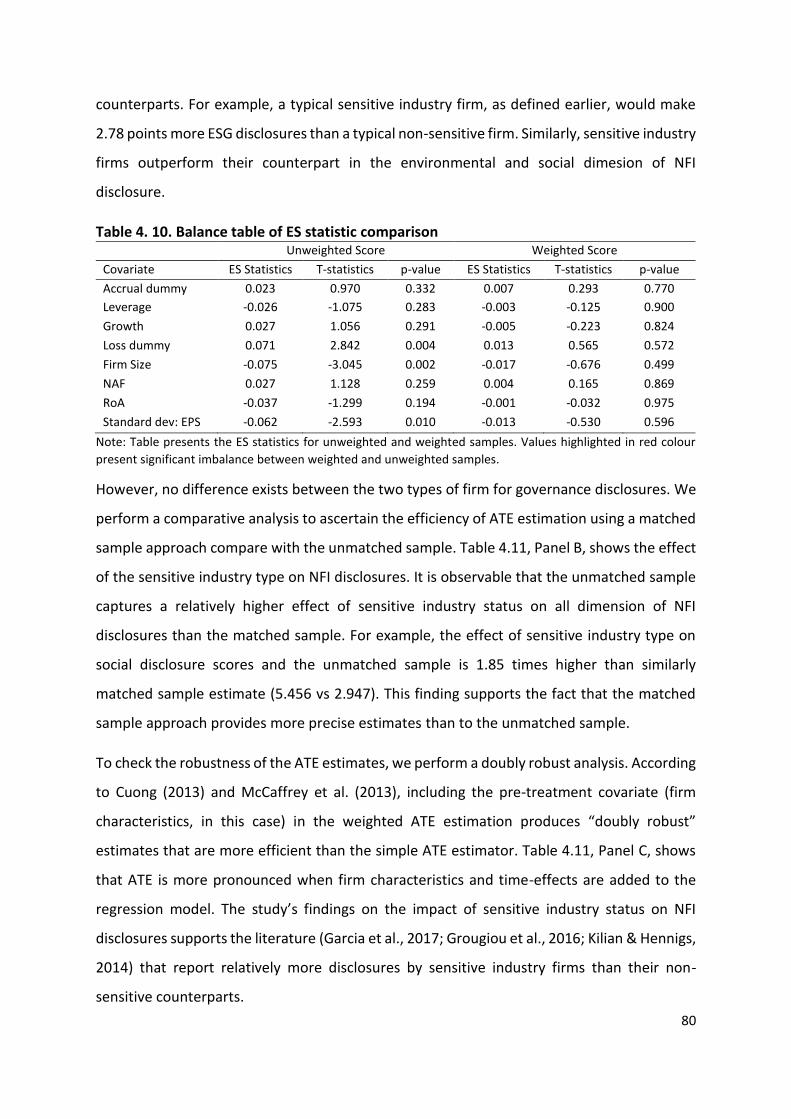
80
counterparts. For example, a typical sensitive industry firm, as defined earlier, would make
2.78 points more ESG disclosures than a typical non-sensitive firm. Similarly, sensitive industry
firms outperform their counterpart in the environmental and social dimesion of NFI
disclosure.
Table 4. 10. Balance table of ES statistic comparison Unweighted Score Weighted Score
Covariate ES Statistics T-statistics p-value ES Statistics T-statistics p-value
Accrual dummy 0.023 0.970 0.332 0.007 0.293 0.770
Leverage -0.026 -1.075 0.283 -0.003 -0.125 0.900
Growth 0.027 1.056 0.291 -0.005 -0.223 0.824
Loss dummy 0.071 2.842 0.004 0.013 0.565 0.572
Firm Size -0.075 -3.045 0.002 -0.017 -0.676 0.499
NAF 0.027 1.128 0.259 0.004 0.165 0.869
RoA -0.037 -1.299 0.194 -0.001 -0.032 0.975
Standard dev: EPS -0.062 -2.593 0.010 -0.013 -0.530 0.596
Note: Table presents the ES statistics for unweighted and weighted samples. Values highlighted in red colour
present significant imbalance between weighted and unweighted samples.
However, no difference exists between the two types of firm for governance disclosures. We
perform a comparative analysis to ascertain the efficiency of ATE estimation using a matched
sample approach compare with the unmatched sample. Table 4.11, Panel B, shows the effect
of the sensitive industry type on NFI disclosures. It is observable that the unmatched sample
captures a relatively higher effect of sensitive industry status on all dimension of NFI
disclosures than the matched sample. For example, the effect of sensitive industry type on
social disclosure scores and the unmatched sample is 1.85 times higher than similarly
matched sample estimate (5.456 vs 2.947). This finding supports the fact that the matched
sample approach provides more precise estimates than to the unmatched sample.
To check the robustness of the ATE estimates, we perform a doubly robust analysis. According
to Cuong (2013) and McCaffrey et al. (2013), including the pre-treatment covariate (firm
characteristics, in this case) in the weighted ATE estimation produces “doubly robust”
estimates that are more efficient than the simple ATE estimator. Table 4.11, Panel C, shows
that ATE is more pronounced when firm characteristics and time-effects are added to the
regression model. The study’s findings on the impact of sensitive industry status on NFI
disclosures supports the literature (Garcia et al., 2017; Grougiou et al., 2016; Kilian & Hennigs,
2014) that report relatively more disclosures by sensitive industry firms than their non-
sensitive counterparts.
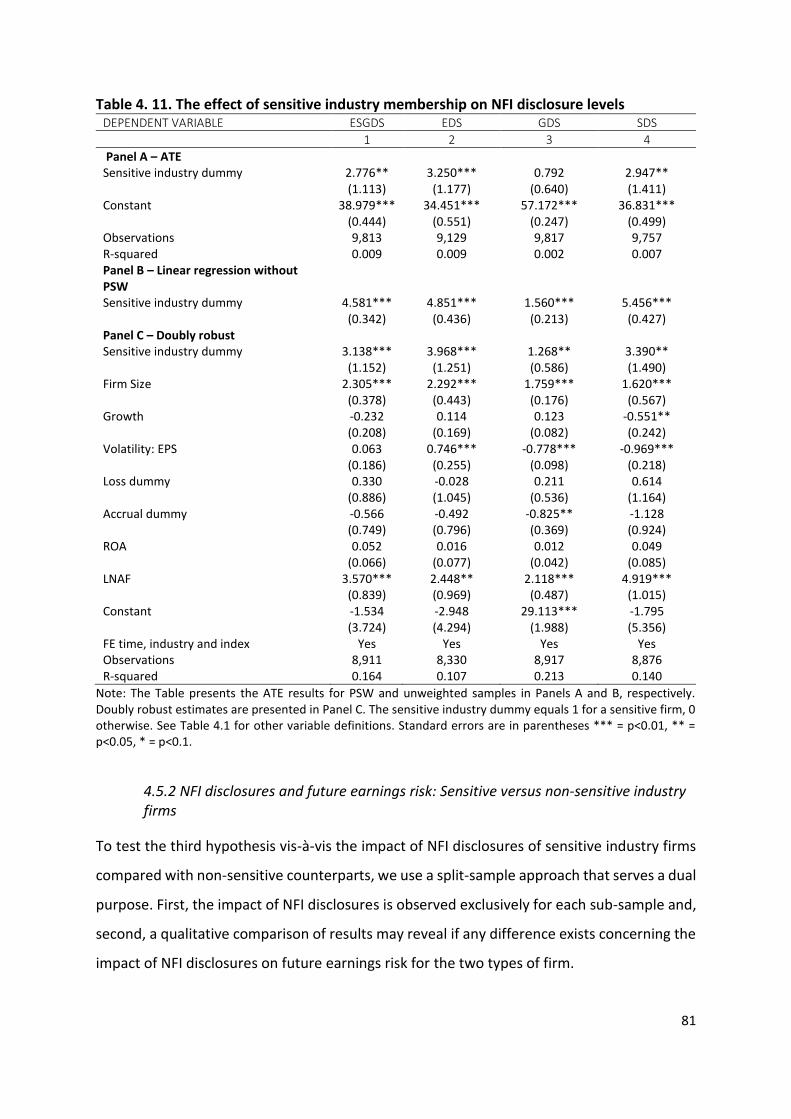
81
Table 4. 11. The effect of sensitive industry membership on NFI disclosure levels DEPENDENT VARIABLE ESGDS EDS GDS SDS
1 2 3 4
Panel A – ATE Sensitive industry dummy 2.776** 3.250*** 0.792 2.947**
(1.113) (1.177) (0.640) (1.411) Constant 38.979*** 34.451*** 57.172*** 36.831***
(0.444) (0.551) (0.247) (0.499) Observations 9,813 9,129 9,817 9,757 R-squared 0.009 0.009 0.002 0.007 Panel B – Linear regression without PSW
Sensitive industry dummy 4.581*** 4.851*** 1.560*** 5.456*** (0.342) (0.436) (0.213) (0.427) Panel C – Doubly robust Sensitive industry dummy 3.138*** 3.968*** 1.268** 3.390** (1.152) (1.251) (0.586) (1.490) Firm Size 2.305*** 2.292*** 1.759*** 1.620*** (0.378) (0.443) (0.176) (0.567) Growth -0.232 0.114 0.123 -0.551** (0.208) (0.169) (0.082) (0.242) Volatility: EPS 0.063 0.746*** -0.778*** -0.969*** (0.186) (0.255) (0.098) (0.218) Loss dummy 0.330 -0.028 0.211 0.614
(0.886) (1.045) (0.536) (1.164) Accrual dummy -0.566 -0.492 -0.825** -1.128 (0.749) (0.796) (0.369) (0.924) ROA 0.052 0.016 0.012 0.049
(0.066) (0.077) (0.042) (0.085) LNAF 3.570*** 2.448** 2.118*** 4.919*** (0.839) (0.969) (0.487) (1.015) Constant -1.534 -2.948 29.113*** -1.795 (3.724) (4.294) (1.988) (5.356) FE time, industry and index Yes Yes Yes Yes Observations 8,911 8,330 8,917 8,876 R-squared 0.164 0.107 0.213 0.140
Note: The Table presents the ATE results for PSW and unweighted samples in Panels A and B, respectively. Doubly robust estimates are presented in Panel C. The sensitive industry dummy equals 1 for a sensitive firm, 0 otherwise. See Table 4.1 for other variable definitions. Standard errors are in parentheses *** = p<0.01, ** = p<0.05, * = p<0.1.
4.5.2 NFI disclosures and future earnings risk: Sensitive versus non-sensitive industry firms
To test the third hypothesis vis-à-vis the impact of NFI disclosures of sensitive industry firms
compared with non-sensitive counterparts, we use a split-sample approach that serves a dual
purpose. First, the impact of NFI disclosures is observed exclusively for each sub-sample and,
second, a qualitative comparison of results may reveal if any difference exists concerning the
impact of NFI disclosures on future earnings risk for the two types of firm.

82
Table 4.12 presents the results of the fixed-effects regression of the non-sensitive and
sensitive industry firms in Panels A and B, respectively. For the non-sensitive industry results,
the aggregate and disaggregated components of NFI disclosures exhibit a significant negative
impact on future earnings risk. These results agree with our full sample results and,
expectedly, show a quantitatively lower impact of environmental disclosures on future
earnings risk. Interestingly, governance disclosures show a significant negative impact on
future earnings risk that is not present in the full sample analysis. This observation indicates
that governance disclosures increase the transparency of the information environment for
non-sensitive industry firms. Moreover, adding time fixed effects reduces the statistical
significance of NFI disclosure estimates but the governance and social dimensions remain
significant at the 5% significance level.
Table 4.12, Panel B, presents the results for sensitive industry firms that exhibit a slightly
higher impact of NFI disclosures on future earnings risk when overall disclosures are
considered. The analysis of disaggregated disclosures reveals interesting results. First, the
environmental dimension shows a quantitatively higher coefficient than the same dimension
for non-sensitive industry firms. This observation indicates that reporting information related
to environmental impacts benefits sensitive industry firms more than non-sensitive
counterparts regarding the reduction of dispersion between forecast and actual earnings.
Secondly, governance disclosures do not exhibit any significant relationship with future
earnings risk for sensitive industry firms, signifying that the impact of governance disclosures
are limited to non-sensitive industry firms. Lastly, the social dimension shows no difference
between the two types of industry, indicating that social issues carry equal weight regardless
of a firm’s industry affiliation. These results are sensitive to time fixed effects except for the
social disclosure scores.
4.5.3 NFI disclosures and future earnings risk: Interaction approach
The split sample method provides important insights into the impact of NFI disclosures for
sensitive and non-sensitive industries. However, the method has two limitations. First, under
fixed-effects model estimation, it is problematic to test whether the coefficients of NFI
disclosures from the two samples are statistically different. Second, the group residual
variance may differ between the sensitive and non-sensitive industry groups. For example,

83
the relationship between firm size and earnings risk may differ for the two types of firm,
causing the group variance to differ. To this end, we apply the interaction term technique to
capture the impact of sensitive and non-sensitive industry firms in a single estimation model.
Accordingly, we create four interaction terms by multiplying the sensitive industry dummy
with the overall and disaggregated NFI disclosure scores. Next, the F-test is conducted to test
the equality between the coefficients of NFI disclosures and interacted NFI disclosure
variables. Thus this method accounts for both limitations present in the spilt sample method.
Table 4. 12. The impact of NFI disclosures on firms’ earnings risk – Split sample approach Dependent Variable: Earnings Risk
VARIABLE 1 2 3 4 1 2 3 4 Panel A - Non-sensitive firms Panel B- Sensitive firms ESGDS -0.011*** -0.019***
(0.003) (0.005) EDS -0.003 -0.012**
(0.002) (0.005) GDS -0.015*** -0.012
(0.005) (0.008) SDS -0.018*** -0.021***
(0.002) (0.003)
Leverage 0.018*** 0.018*** 0.018*** 0.018*** 0.035*** 0.035*** 0.034*** 0.035***
(0.004) (0.004) (0.004) (0.004) (0.006) (0.006) (0.006) (0.005)
Firm Size -0.215*** -0.247*** -0.239*** -0.190*** -0.153 -0.177 -0.187 -0.141
(0.071) (0.069) (0.071) (0.064) (0.254) (0.256) (0.261) (0.248)
Growth -0.095*** -0.097*** -0.098*** -0.094*** -0.213*** -0.212*** -0.216*** -0.214***
(0.011) (0.011) (0.011) (0.012) (0.041) (0.043) (0.043) (0.042)
Volatility: EPS 0.145*** 0.134*** 0.197*** 0.228*** 0.006 -0.029 0.062* 0.089**
(0.023) (0.027) (0.025) (0.019) (0.038) (0.040) (0.032) (0.042)
Loss Dummy 0.359*** 0.364*** 0.361*** 0.358*** 0.113 0.109 0.118 0.129
(0.120) (0.122) (0.118) (0.119) (0.161) (0.163) (0.163) (0.158)
Accrual dummy 0.187*** 0.189*** 0.187*** 0.183*** 0.217** 0.220*** 0.234*** 0.231***
(0.053) (0.053) (0.053) (0.052) (0.084) (0.083) (0.084) (0.084)
ROA -0.011 -0.010 -0.011 -0.011 0.005 0.005 0.005 0.007
(0.009) (0.009) (0.009) (0.009) (0.021) (0.021) (0.021) (0.020)
Log NAF -0.232*** -0.244*** -0.234*** -0.216*** 0.058 0.047 0.016 0.090
(0.061) (0.064) (0.065) (0.057) (0.144) (0.144) (0.153) (0.150)
Constant -1.266 -1.280 -0.605 -1.314 -2.373 -2.498 -2.047 -2.587
(0.915) (0.925) (0.856) (0.862) (2.376) (2.391) (2.335) (2.359) FE Year and industry
Yes Yes Yes Yes Yes Yes Yes Yes
R-Squared 0.0483 0.047 0.0484 0.0532 0.0559 0.0539 0.0523 0.0595
Observations 6,512 6,512 6,512 6,512 1,775 1,775 1,775 1,775
Number of groups 704 704 704 704 182 182 182 182
Note: The Table presents the results of NFI disclosures on earnings risk for non-sensitive (sensitive) firms in
Panel A (B). See Table 4.1 for other variable definitions. Standard are errors in parentheses *** = p<0.01, ** =
p<0.05, * = p<0.1.
Table 4.13 separately shows the coefficients of the overall and sub-dimension NFI disclosures
for the total sample and sensitive industry firms. In the first column, the overall NFI
disclosures coefficient of sensitive industry firms is statistically and economically more
pronounced than the non-sensitive firms (-.015 vs -0.06). However, the F-statistic shows that
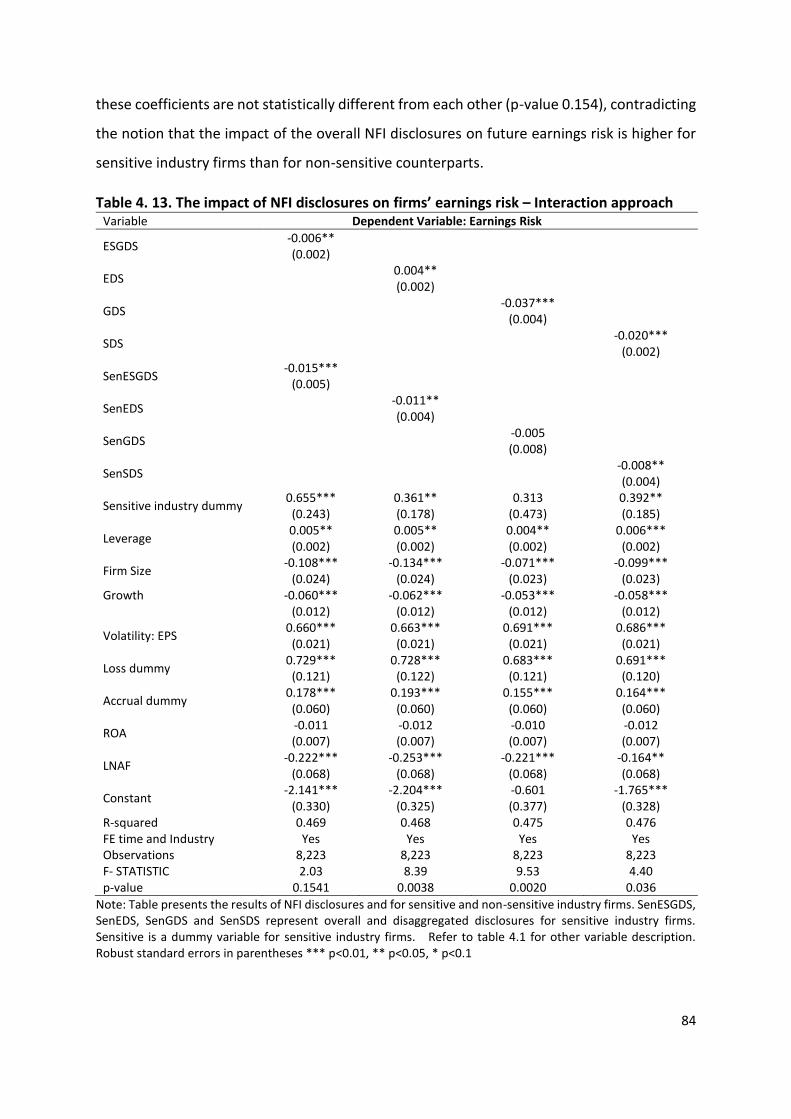
84
these coefficients are not statistically different from each other (p-value 0.154), contradicting
the notion that the impact of the overall NFI disclosures on future earnings risk is higher for
sensitive industry firms than for non-sensitive counterparts.
Table 4. 13. The impact of NFI disclosures on firms’ earnings risk – Interaction approach Variable Dependent Variable: Earnings Risk
ESGDS -0.006** (0.002)
EDS
0.004** (0.002)
GDS
-0.037***
(0.004)
SDS
-0.020***
(0.002)
SenESGDS -0.015***
(0.005)
SenEDS
-0.011** (0.004)
SenGDS
-0.005 (0.008)
SenSDS
-0.008** (0.004)
Sensitive industry dummy 0.655*** (0.243)
0.361** (0.178)
0.313 (0.473)
0.392** (0.185)
Leverage 0.005** (0.002)
0.005** (0.002)
0.004** (0.002)
0.006*** (0.002)
Firm Size -0.108***
(0.024) -0.134***
(0.024) -0.071***
(0.023) -0.099***
(0.023) Growth -0.060*** -0.062*** -0.053*** -0.058*** (0.012) (0.012) (0.012) (0.012)
Volatility: EPS 0.660*** (0.021)
0.663*** (0.021)
0.691*** (0.021)
0.686*** (0.021)
Loss dummy 0.729*** (0.121)
0.728*** (0.122)
0.683*** (0.121)
0.691*** (0.120)
Accrual dummy 0.178*** (0.060)
0.193*** (0.060)
0.155*** (0.060)
0.164*** (0.060)
ROA -0.011 (0.007)
-0.012 (0.007)
-0.010 (0.007)
-0.012 (0.007)
LNAF -0.222***
(0.068) -0.253***
(0.068) -0.221***
(0.068) -0.164** (0.068)
Constant -2.141***
(0.330) -2.204***
(0.325) -0.601 (0.377)
-1.765*** (0.328)
R-squared 0.469 0.468 0.475 0.476 FE time and Industry Yes Yes Yes Yes Observations 8,223 8,223 8,223 8,223 F- STATISTIC 2.03 8.39 9.53 4.40 p-value 0.1541 0.0038 0.0020 0.036
Note: Table presents the results of NFI disclosures and for sensitive and non-sensitive industry firms. SenESGDS, SenEDS, SenGDS and SenSDS represent overall and disaggregated disclosures for sensitive industry firms. Sensitive is a dummy variable for sensitive industry firms. Refer to table 4.1 for other variable description. Robust standard errors in parentheses *** p<0.01, ** p<0.05, * p<0.1

85
Nevertheless, the environmental dimension results in the second column show that sensitive
industry firms disclosing environment-related information benefit more than a non-sensitive
counterpart (-.011 vs 0.004) in terms of reducing future earnings risk. The significant value of
the F-statistic further confirms that the impact of environmental disclosures for both types of
firm is statistically different concerning the future earnings risk. Last two columns in Table
4.13 present the results for the governance and social dimensions. The results show that non-
sensitive industry firms benefit more than sensitive counterpart in terms of reducing the gap
between forecast and actual earnings by reporting information related to governance and
social issues. The significant value of the F-statistic confirms that these differences are
statistically significant at conventional levels of significance. Lastly, the inclusion of time and
industry fixed effects does not change our earlier findings, indicating that these results are
robust to these fixed effects.
Overall, the split sample and interaction terms approaches present similar results on the
relationship between NFI disclosures and earnings risk. These findings indicate that
environmental disclosures bring higher benefits to sensitive industry firms, which agrees with
the literature. On the other hand, the governance disclosure impact is limited to only non-
sensitive firms; this signifies that these firms can further improve their information
environment by disclosing governance-related information.
4.6. Chapter Summary
This chapter presents empirical evidence on the impact of NFI disclosures on a firm’s earnings
risk. The results show that overall ESG disclosures show a significant negative relationship
with future earnings risk. The disaggregated dimensions of social and environmental
disclosures also exhibit a negative impact on earnings risk. The relationship between NFI
disclosures is quantitatively more pronounced for firms reporting higher NFI disclosures. Sub-
sample analysis shows that the impact of NFI disclosures varies based on firm characteristics
such as size, risk and profitability.
The robustness analysis shows that the study’s results are robust for alternative proxies of
firm risk and control variables such as firm size, growth and leverage. This study explores the
dynamic nature of the relationship between NFI disclosures and earnings risk to address
concerns such as omitted variable and reverse causality bias. The dynamic analysis using

86
system GMM estimation shows that the baseline results do not suffer from omitted variable
or reverse causality biases.
This chapter presents evidence of sensitive industry membership on NFI disclosures practices
and shows that sensitive industry firms reporting on ESG issues outperform non-sensitive
counterparts in overall and disaggregated disclosures. However, the resulting impact of the
higher NFI disclosures by sensitive industry firms does not show a greater reduction in
earnings risk except for environmental disclosures. The findings for non-sensitive firms’
disclosures on the governance and social dimensions produce relatively better outcomes in
reducing the earnings risk than their sensitive counterparts.
87
Chapter 5
Mandatory NFI Disclosures and Firm Risk
5.1. Introduction
This chapter presents the empirical analysis of the impact of mandatory non-financial
information (NFI) reporting regulations on the level of NFI disclosures of the regulated firms.
The chapter also presents a difference-in-difference analysis to ascertain the change in the
impact of NFI disclosures on a firm’s earnings risk before and after the mandating of NFI
reporting. To that end, the chapter uses the recent EU directive 2014/95/EU as an example
of mandated NFI reporting regulations. To test the study’s fourth hypothesis that assumes a
positive impact of NFI reporting regulations on the level of NFI disclosures, we use a
propensity-matched sample approach to estimate the impact of the EU directive on the level
of aggregate and disaggregated NFI disclosures for S&P350 EU index firms. The chapter
estimates the changes in the impact of NFI disclosures on earnings risk by using the
difference-in-differences technique that helps capture the impact before and after the
enactment of the NFI regulations. Different robustness tests are performed to evaluate the
validity of the results.
The chapter is structured as follows: Section 5.1 introduces NFI directive 2014/95/EU and
discusses the recent evidence of its acceptance in EU member states. Section 5.2 explores the
causal impact of the EU directive on NFI disclosures of European firms. Section 5.3 provides
evidence regarding increased NFI disclosures impact on earnings risk in the post-regulation
period. Section 5.4 summarises the chapter.
5.2. The European Union’s NFI Directive 2014/95/EU
The European Parliament enacted directive 2014/95/EU on 22 October 2014. It mandates the
disclosure of non-financial and diversity information for large27 entities and business groups
operating in the EU’s jurisdiction. The European Parliament allowed member states to
transpose the new directive into their laws by December 2016 to ensure compliance from
calendar year 2017 or during calendar year 2017. Recent studies show widespread
27 Companies with total balance sheet, net turnover and average number of employees above EUR 400,000, EUR
800,000 and 500, respectively.

88
compliance with the new EU directive. For example, using a sample from 10 European
countries and seven different industries, Manes-Rossi et al. (2018) report a higher level of
compliance in terms of content coverage by the 50 largest companies. They also report that
the content requirements of the new EU directive are exhaustive compared with the Global
Reporting Initiative (GRI) and International Integrated Reporting Framework, making the EU
directive qualitatively more robust. Testarmata et al. (2020) show that harmonisation of NFI
reporting in the EU has improved comparability, consistency and transparency among
European companies.
For content disclosures, directive 2014/95/EU requires firms to report information on six
broad topics: 1) environmental; 2) social; 3) employee matters; 4) respect for human rights;
5) anti-corruption; and 6) bribery matters, as a minimum requirement of NFI disclosures. Like
other NFI reporting frameworks, this framework does not provide any NFI performance
metrics. However, the six major topics cover almost all facets of ESG related activities.
Therefore, the EU directive is expected to bring significant changes in the quantity and quality
of disclosures for large firms operating in the EU. Recent studies also suggest a likely increase
in the quality of NFI reporting after the implementation of directive 2014/95/EU, e.g.e, see
(Arvidsson, 2019; Dumitru, Dyduch, Gușe, & Krasodomska, 2017).
Mandating by the EU directive offers a unique opportunity to analyse the impact of
mandatory NFI reporting on the level of NFI disclosures at a regional level that has not been
studied so far. Additionally, any subsequent increase in the quality of NFI disclosures in the
post-directive period could be further explored by analysing the change in the effect of NFI
disclosures on a firm’s information environment. As a result, this study treats directive
2014/95/EU as an exogenous shock for large European firms and measures its impact on the
level of aggregate and sub-dimension level of ESG disclosures. Moreover, this study attempts
to ascertain the difference between the magnitude of NFI disclosures impact on a firm’s
earnings risk before and after the EU directive.
5.3. The Impact of Directive 2014/95/EU on NFI Disclosures
Section 4.1 shows an increasing trend of NFI disclosures during the sample period. This
observation raises an empirical challenge concerning the measurement of real impact of
disclosure regulations on the level of disclosures for the targeted firms. Different firm

89
characteristics and industry type can influence the level of disclosures before and after the
mandating regulation. It is very important to control for factors that may induce a change in
disclosure level. We use a propensity matched sample approach to draw a control group of
firms from the sample firms. This approach offers the benefit of creating an analogous control
sample using propensity score matching based on the observable characteristics of a sampling
unit – firms, in this case. Accordingly, we use firm characteristics, such as firm size, growth,
profitability, earnings volatility, leverage, pre-existing ESG disclosures, financial opaqueness,
the number of analysts following a firm, and industry type, as covariates to construct a
comparable control group from the sample firms. Since all S&P350 index firms in the sample
fall under the definition of large firms, all S&P350 index firms qualify to be part of the
treatment group. All non-S&P350 index companies are identified as the control group.
We use the propensity score weighting (PSW) technique to generate a group of control firms.
We use the PSW method because it provides a better matching estimator than other
matching techniques. As discussed in section 4.5.1, the efficiency of a control group based on
the PSW technique can be measured by checking the balance and overlap conditions. It is
important to understand that, traditionally, a statistically significant standardised effect size
differences (ES) value of at least 0.25 is assumed to be a significant difference, i.e., any ES
statistic value less than 0.25 does not affect the balancing property of PSW. Table 5.1 shows
the balance scores between treatment and control groups before and after the weighting
process in Panels A and B, respectively.
The unweighted sample (see Table 5.1 Panel A) shows significant differences between the
treated and control firms for several variables. For example, the ESG disclosure scores,
earnings volatility and the number of analysts following a firm, exhibit substantial differences
(absolute ES > 0.25) between the unweighted treatment and control samples. This finding
confirms that the use of an unweighted sample can produce biased estimates as sample firms
in the control and treatment groups are inherently different based on several characteristics.
However, the weighted result presented in Table 5.1, Panel B, exhibits no significant
difference between the treatment and control samples. Thus, the PSW estimation process
successfully eliminates the inherent differences in the sample firms, resulting in the formation
of an analogous control sample that can be used for causal effect estimation in the next step.

90
Figure B.2 (Appendix B) shows that there is a sufficient overlap between the treatment and
control groups, indicating that the overlap condition of the PSW is also satisfied. These
observations show that PSW successfully generated a comparable group of control firms and
provides the perfect environment to measure the actual effect of an external shock on the
treated companies’ NFI disclosure practices.
Table 5. 1. The balance table of ES statistics Covariates Panel A - Unweighted Score Panel B- Weighted Score
ES Statistics T-stat p-value ES Statistics T-stat p-value ESGDS 0.5720 29.04 0.000 0.180 6.826 0.000 NAF 0.6780 34.16 0.000 0.203 7.796 0.000 Accrual dummy -0.1180 -6.003 0.000 -0.046 -1.882 0.060 Leverage 0.0420 2.001 0.045 -0.002 -0.086 0.931 Growth 0.0120 0.575 0.565 -0.039 -1.772 0.076 Loss dummy 0.0880 4.222 0.000 0.041 1.647 0.100 Firm Size 0.2170 9.919 0.000 0.055 2.276 0.023 RoA -0.0250 -1.106 0.269 -0.006 -0.258 0.797 Volatility: EPS -0.5320 -28.98 0.000 -0.216 -7.968 0.000
Note: Table 5.1 presents the ES statistics for unweighted and weighted samples. ES statistics values greater than
0.25 present a significant imbalance between weighted and unweighted samples. ESGDS is the overall ESG
disclosures score; NAF is the number of analysts following a firm; the Accrual dummy is indicator variable for financial reporting quality; Leverage is debt to total asset ratio; the Loss dummy is the indicator variable for negative income; Firm size is the log of total assets; RoA is net income divided by total assets; and Volatility: EPS is the volatility of earnings.
Post PSW estimation, we estimate the average treatment effect (ATE) of the EU directive on
the NFI disclosures of the treated firms. For this, the treatment variable is constructed by
interacting the treated dummy (the S&P 350 index) with a regulation period (post-2017)
dummy. The pre- and post-regulation periods are defined as 2008-2016 and 2017-2018,
respectively. Therefore, the post-regulation interaction term captures the effect of regulation
on NFI disclosures for the treated firms. The estimates of the interaction terms allow us to
test the study’s fourth hypothesis that assumes a significant difference between treated and
non-treated firms. Table 5.2, Panel A, shows the ATE results concerning the regulations’
impact on the overall and disaggregated NFI disclosures when the reference group is the pre-
directive disclosure score of S&P 350 index firms. The ATE results show a statistically
significant positive regulation effect on the overall and sub-dimension NFI disclosures with
social disclosures displaying the greatest increase followed by the environment and
governance disclosures. In the economic context, the cumulative effect of regulations on the
overall ESG disclosures during the post-regulation period was an increase of 12.05%. The ATE
ranges from 6.51 % to 14.84% for the disaggregated dimensions governance and social
disclosures, respectively. These findings show that the mandating directive has substantially

91
increased the magnitude of NFI disclosures of large firms in the EU, which signifies the
importance of regulations that mandate NFI disclosures.
Next, we expand the reference group from the pre-directive S&P350 index companies to all
non-S&P350 index group companies that are part of the study sample. This expansion of the
reference group serves two objectives. First, the inclusion of the non-S&P 350 index in the
reference group facilitates a comparison with a diverse set of firms from all over the world.
Second, non-S&P 350 companies provide disclosure observations in the post-directive period
that serve as a comparison point for the treated firms during that period. The latter objective
also controls for a potential time-trend effect that we observe in the disclosure practices of
the sample firms.
Table 5.2, Panel B, presents the results of the expanded reference group setting which also
show a significant positive impact of the EU directives on NFI disclosures of the treated firms
compared with the non-treated group. This comparison shows that the impact of the EU
directive on treated firms is not sensitive to the composition of the reference group and is
independent of the current momentum of NFI disclosures around the world. Additionally, the
impact of the EU directive is more pronounced in economic terms when the reference group
includes geographically diverse firms, indicating that some of the sample firms are lagging in
NFI reporting despite the heightened importance of NFI disclosures. Furthermore, we
perform a doubly robust analysis by including the firm characteristics, time and industry
effects, in the basic model. Table 5.2, Panel C, presents the doubly robust ATE estimates that
confirm the robustness of our results regarding the impact of the EU directive on NFI
disclosures in the presence of additional controls such as firm characteristics and industry
effects.
Thus, the results signify the importance of NFI disclosure regulations and indicate that such
regulations help increase the socially responsible activities of the target firms. The study’s
results complement and advance the literature that reports the effectiveness of mandatory
disclosure regulations in increasing NFI disclosures in different parts of the world. For
example, using a worldwide sample of 58 countries, Ioannou and Serafeim (2011) report a
significant positive effect of CSR reporting regulations on the amount of NFI information

92
reporting measured by different country-specific measurements such as social responsibility
sustainable development, employee training and corporate board ethical practices.
Table 5. 2. The impact of the EU directive on NFI disclosures 1 2 3 4 VARIABLES ESGDS EDS GDS SDS Panel A Interaction 4.965*** 3.452*** 3.687*** 6.301***
(0.530) (0.909) (0.444) (0.601) Constant 41.189*** 35.258*** 56.629*** 42.451***
(0.851) (0.969) (0.581) (0.940) Observations 3,408 3,335 3,406 3,395 R-squared 0.019 0.006 0.019 0.023 Panel B Interaction 6.642*** 3.899*** 3.258*** 10.961***
(0.664) (0.97) (0.456) (0.751) Constant 39.512*** 34.811*** 57.058*** 37.790***
(0.447) (0.535) (0.282) (0.483) Observations 9,813 9,129 9,817 9,757 R-squared 0.015 0.004 0.009 0.029 Panel C Interaction 6.336*** 4.082*** 2.801*** 10.743***
(0.629) (0.936) (0.468) (0.698) Firm size 3.049*** 3.219*** 1.706*** 2.526***
(0.295) (0.376) (0.183) (0.357) Leverage -0.004 -0.02 0.006 0.032
(0.027) (0.032) (0.017) (0.032) Volatility: EPS -0.04 0.692*** -0.796*** -0.856***
(0.167) (0.237) (0.124) (0.186) RoA 0.014 0.011 0.051 -0.043
(0.046) (0.061) (0.033) (0.054) LNAF 0.268*** 0.213*** 0.126*** 0.331***
(0.05) (0.061) (0.035) (0.059) Loss dummy -1.480* -1.611 -0.447 -1.846*
(0.831) (1.088) (0.537) (1.011) Accrual dummy -1.372** -1.091 -1.686*** -1.807**
(0.667) (0.863) (0.466) (0.718) Constant 3.631 -3.656 36.599*** 8.988**
(3.073) (3.909) (1.954) (3.924) Year and Industry effects
Yes Yes Yes Yes Observations 9,057 8,441 9,063 9,019 R-squared 0.19 0.137 0.155 0.167
Note: Table presents the impact of the EU directive on NFI disclosures. The Interaction term captures the
effect of the EU directive of NFI disclosures; ESGDS, EDS, GDS and SDS are proxies for overall ESG,
environmental, social and governance disclosures, respectively. Standard errors are in parentheses ***
= p<0.01, ** = p<0.05, * = p<0.1.
Continuing their work using Bloomberg ESG disclosure scores, Ioannou and Serafeim (2017)
report increased ESG disclosures following the enforcement of mandatory NFI disclosure
regulations in China, Denmark, Malaysia and South Africa. Using the instance of mandated
integrated reporting in South Africa, Bernardi and Stark (2018) reveal enhanced levels of ESG
disclosures.
93
For EU directive 2014/95/EU, different country-level studies show that, following the
mandate of the directive, large companies have increased their NFI disclosures in Italy
(Leopizzi, Iazzi, Venturelli, & Principale, 2020; Venturelli, Caputo, Cosma, Leopizzi, & Pizzi,
2017), Romania (Dumitru et al., 2017) and France, Germany and Italy (Boyer-Allirol & Barbu,
2017). However, using an advanced technique of propensity score weighting, we for the first
time provide a comparative analysis of the impact of the EU directive on large European firms
(treated) compared with non-European (untreated) firms. Additionally, the use of
disaggregated disclosure scores helps measure the impact of the EU directive on
environmental, social and governance disclosures. As a result, we find the EU directive is more
effective in increasing social disclosures compared with environmental and social disclosures.
Thus, it is important to incorporate more dimensions of environmental disclosures in the
recent directive to achieve the sustainability targets set under the United Nation’s Paris
Climate Change Agreement and sustainable development goals.
5.4. The Impact of the EU Directive on Future Earnings Risk
Article 2 of the EU directive 2014/95/EU required the European Commission to publish
guidelines that provide useful, relevant and comparable standards for NFI reporting. It states:
“The Commission shall prepare non-binding guidelines on methodology for reporting non-
financial information, including non-financial key performance indicators, general and
sectoral, with a view to facilitating relevant, useful and comparable disclosure of non-financial
information by undertakings. In doing so, the Commission shall consult relevant stakeholders”.
Consequently, the European Commission published its NFI reporting guidelines (2017/C
215/01) on 26 June 201728. According to the European Commission, “The aim of these
guidelines is to help companies disclose high quality, relevant, useful, consistent and more
comparable non-financial (environmental, social and governance-related) information in a
way that fosters resilient and sustainable growth and employment, and provides transparency
to stakeholders. These non-binding guidelines are proposed within the remit of the reporting
requirements provided for under the Directive. They are intended to help companies draw up
relevant, useful, concise non-financial statements according to the requirements of the
28 For details see : https://ec.europa.eu/commission/presscorner/detail/en/IP_17_1702

94
Directive. Significant efforts have been made to avoid undue administrative burden,
boilerplate disclosures, or a mere box-ticking exercise”.
Therefore, the mandating of NFI reporting and the subsequent guidelines would not only
increase the quantity of NFI disclosures but may also improve the quality of disclosed
information. Therefore, we hypothesise NFI disclosures have enhanced effects on earnings
risk after the mandating of the directive compared with the earlier period. We use the
difference-in-differences (DiD) method to ascertain the differences between pre and post
directive effects of NFI disclosures on earnings risk. We also use the disaggregated NFI
disclosure scores in the analysis to test whether the different dimensions show different
effects from the overall NFI disclosures.
Table 5.3 shows that the post directive impact (-0.041) of the overall NFI disclosures on
earnings risk is more pronounced than the impact before (-0.031) the directive. The
cumulative impact of the overall NFI disclosures in the post-directive period show an increase
of 32.56% compared with pre-directive period. This indicates that mandating the directive
and subsequent guidelines for NFI reporting make NFI disclosures more information-rich,
resulting in reduced earnings risk. This outcome supports (Bernardi & Stark, 2018) findings
regarding the enhanced negative association between ESG reporting and analysts’ forecasts
accuracy after the mandating of integrated reporting in South Africa.
All the disaggregated NFI disclosure dimensions show an enhanced negative impact on
earnings risk in the post-directive period. More importantly, the governance disclosures that
did not show any significant impact on earnings risk in the pre-directive period now exhibit a
significant (at the 5% level) negative impact in the post-directive period. This observation
indicates that the quality, consistency and relevance of NFI disclosures induced by the
directive have enhanced the efficiency of the information disclosed for governance
disclosures along with the other NFI disclosure dimensions. The results for the control
variables show the expected positive (negative) relationship of leverage, earnings volatility,
loss dummy and financial opaqueness (analyst following) with earnings volatility.
Table 5.3 provides statistical evidence of the differences between the pre- and post-directive
coefficients of NFI disclosures, i.e., the main objective for the fifth hypothesis of this study.
We use the F-test to test the equality of pre- and post-directive coefficients. The F-statistic

95
results show that the pre- and post-directive coefficients of the overall and disaggregated
dimensions of NFI are statistically different at conventional significance levels. This
observation reinforces the earlier conclusion that the post-directive impact of NFI disclosures
is statistically and economically more pronounced than pre-directive effects.
Table 5. 3. The impact of NFI disclosures on firms’ earnings risk (pre and post EU directive) VARIABLES Dependent variable: Earnings risk
1 2 3 4 PreESGDS -0.031***
(0.008) PostESGDS -0.041***
(0.006) PreEDS -0.018***
(0.004) PostEDS -0.029***
(0.004) PreGDS -0.000
(0.006) PostGDS -0.011**
(0.005) PreSDS -0.023***
(0.006) PostSDS -0.032***
(0.005) Firm size 0.284* 0.364*** 0.222 0.274**
(0.145) (0.133) (0.148) (0.126) Leverage 0.028*** 0.025*** 0.031*** 0.022***
(0.006) (0.004) (0.007) (0.005) Volatility: EPS 0.447*** 0.442*** 0.458*** 0.439***
(0.027) (0.026) (0.025) (0.023) RoA -0.006 0.001 -0.004 -0.003
(0.009) (0.009) (0.010) (0.010) LNAF -0.028*** -0.029*** -0.033*** -0.030***
(0.006) (0.005) (0.006) (0.006) Loss dummy 0.426*** 0.474*** 0.451*** 0.463***
(0.150) (0.153) (0.148) (0.156) Accrual dummy 0.190*** 0.211*** 0.201*** 0.188***
(0.060) (0.065) (0.065) (0.058) Constant -6.336*** -7.839*** -7.015*** -6.379***
(1.529) (1.441) (1.548) (1.383) Year and Industry effects Yes Yes Yes Yes F-Statistic 5.13 6.33 6.90 5.72 F-test, p-value 0.0243 0.0124 0.0091 0.0174 R-squared 0.0383 0.0333 0.0330 0.0365 Observations 3,087 3,027 3,085 3,082 Number of groups 308 306 307 307 Note: Pre and Post represent the impact of overall and disaggregated NFI disclosures before and after mandating of the EU directive. Earnings risk represents the log of average analyst forecast dispersion. For other variables definitions see table 5.1. Standard errors are in parentheses. ***= p<0.01, ** = p<0.05, * = p<0.1.
Overall, the results in Table 5.3 provide substantial evidence to reject the null hypothesis of
equality of pre- and post-directive NFI disclosures’ impact on earnings risk. Moreover, these
results are robust for year and industry effects. To ascertain that some unstipulated global
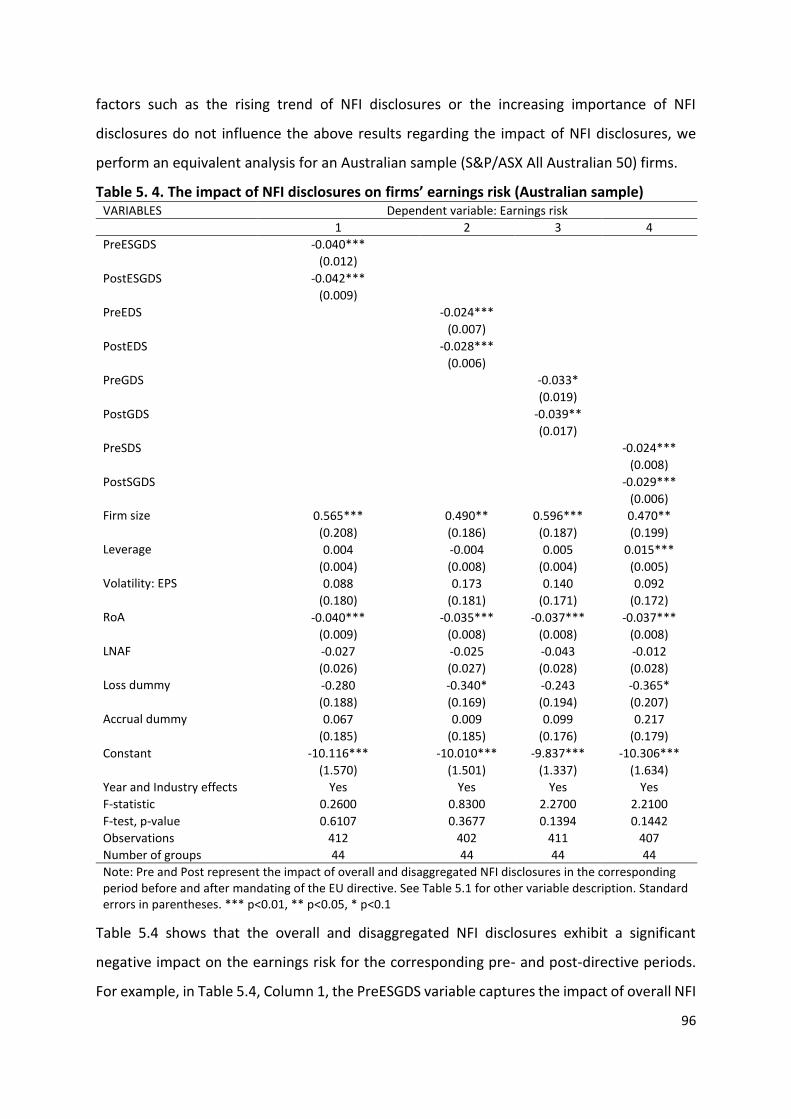
96
factors such as the rising trend of NFI disclosures or the increasing importance of NFI
disclosures do not influence the above results regarding the impact of NFI disclosures, we
perform an equivalent analysis for an Australian sample (S&P/ASX All Australian 50) firms.
Table 5. 4. The impact of NFI disclosures on firms’ earnings risk (Australian sample) VARIABLES Dependent variable: Earnings risk
1 2 3 4
PreESGDS -0.040*** (0.012)
PostESGDS -0.042*** (0.009)
PreEDS -0.024*** (0.007)
PostEDS -0.028*** (0.006)
PreGDS -0.033*
(0.019) PostGDS -0.039**
(0.017) PreSDS -0.024***
(0.008)
PostSGDS -0.029***
(0.006)
Firm size 0.565*** 0.490** 0.596*** 0.470**
(0.208) (0.186) (0.187) (0.199)
Leverage 0.004 -0.004 0.005 0.015***
(0.004) (0.008) (0.004) (0.005)
Volatility: EPS 0.088 0.173 0.140 0.092
(0.180) (0.181) (0.171) (0.172)
RoA -0.040*** -0.035*** -0.037*** -0.037***
(0.009) (0.008) (0.008) (0.008)
LNAF -0.027 -0.025 -0.043 -0.012
(0.026) (0.027) (0.028) (0.028)
Loss dummy -0.280 -0.340* -0.243 -0.365*
(0.188) (0.169) (0.194) (0.207)
Accrual dummy 0.067 0.009 0.099 0.217
(0.185) (0.185) (0.176) (0.179)
Constant -10.116*** -10.010*** -9.837*** -10.306***
(1.570) (1.501) (1.337) (1.634)
Year and Industry effects Yes Yes Yes Yes
F-statistic 0.2600 0.8300 2.2700 2.2100
F-test, p-value 0.6107 0.3677 0.1394 0.1442
Observations 412 402 411 407
Number of groups 44 44 44 44
Note: Pre and Post represent the impact of overall and disaggregated NFI disclosures in the corresponding period before and after mandating of the EU directive. See Table 5.1 for other variable description. Standard errors in parentheses. *** p<0.01, ** p<0.05, * p<0.1
Table 5.4 shows that the overall and disaggregated NFI disclosures exhibit a significant
negative impact on the earnings risk for the corresponding pre- and post-directive periods.
For example, in Table 5.4, Column 1, the PreESGDS variable captures the impact of overall NFI
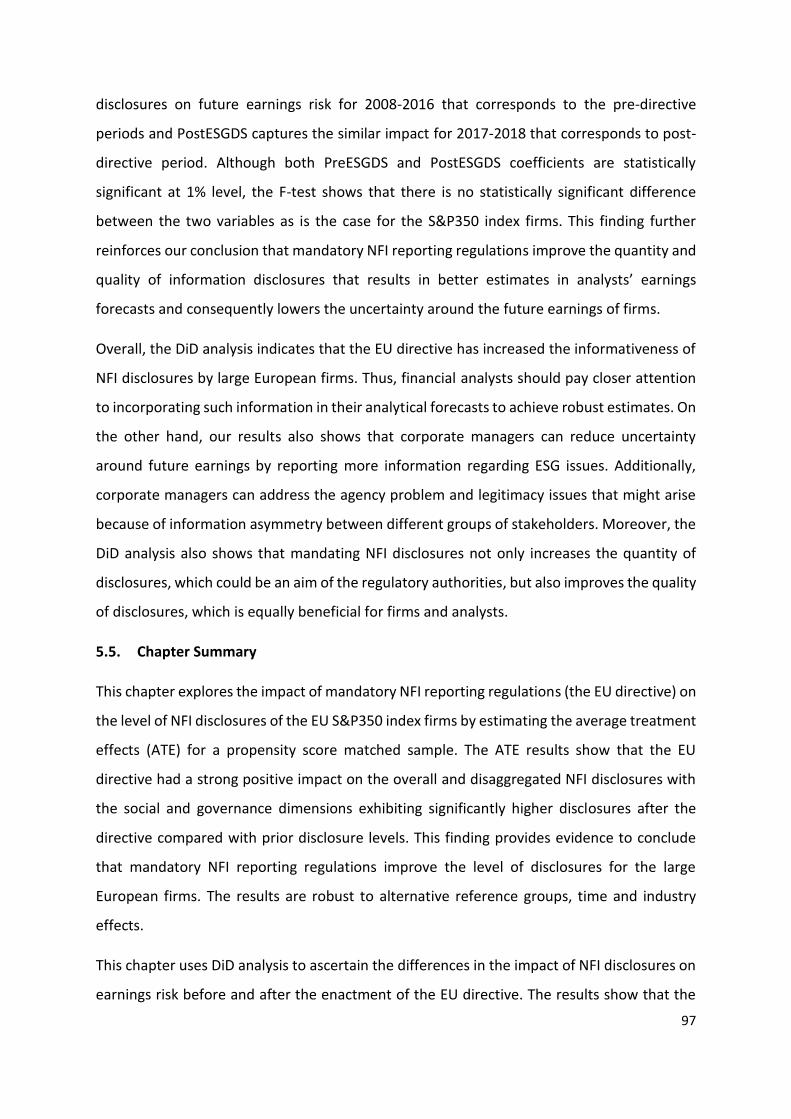
97
disclosures on future earnings risk for 2008-2016 that corresponds to the pre-directive
periods and PostESGDS captures the similar impact for 2017-2018 that corresponds to post-
directive period. Although both PreESGDS and PostESGDS coefficients are statistically
significant at 1% level, the F-test shows that there is no statistically significant difference
between the two variables as is the case for the S&P350 index firms. This finding further
reinforces our conclusion that mandatory NFI reporting regulations improve the quantity and
quality of information disclosures that results in better estimates in analysts’ earnings
forecasts and consequently lowers the uncertainty around the future earnings of firms.
Overall, the DiD analysis indicates that the EU directive has increased the informativeness of
NFI disclosures by large European firms. Thus, financial analysts should pay closer attention
to incorporating such information in their analytical forecasts to achieve robust estimates. On
the other hand, our results also shows that corporate managers can reduce uncertainty
around future earnings by reporting more information regarding ESG issues. Additionally,
corporate managers can address the agency problem and legitimacy issues that might arise
because of information asymmetry between different groups of stakeholders. Moreover, the
DiD analysis also shows that mandating NFI disclosures not only increases the quantity of
disclosures, which could be an aim of the regulatory authorities, but also improves the quality
of disclosures, which is equally beneficial for firms and analysts.
5.5. Chapter Summary
This chapter explores the impact of mandatory NFI reporting regulations (the EU directive) on
the level of NFI disclosures of the EU S&P350 index firms by estimating the average treatment
effects (ATE) for a propensity score matched sample. The ATE results show that the EU
directive had a strong positive impact on the overall and disaggregated NFI disclosures with
the social and governance dimensions exhibiting significantly higher disclosures after the
directive compared with prior disclosure levels. This finding provides evidence to conclude
that mandatory NFI reporting regulations improve the level of disclosures for the large
European firms. The results are robust to alternative reference groups, time and industry
effects.
This chapter uses DiD analysis to ascertain the differences in the impact of NFI disclosures on
earnings risk before and after the enactment of the EU directive. The results show that the

98
post-directive impact of NFI disclosures on earnings risk is substantially greater than in the
pre-directive period. This indicates that the introduction of mandatory NFI reporting not only
increased the level of disclosures, but also enhances the quality of the reported information
that leads to better estimates of future earnings. The results are robust for different firm,
industry and time effects.
This chapter’s findings signify the importance of NFI disclosure regulations in increasing the
amount and transparency of corporate NFI reporting and providing much-needed certainty
surrounding the firm income that is the primary concern of corporate managers and firm
stakeholders. Mandatory NFI regulations could also help countries achieve sustainable and
ethical business practice targets set out in accordance with different global initiatives such as
the Paris agreement and the United Nations’ sustainable development goals.

99
Chapter 6
Summary and Conclusions
6.1. Introduction
This chapter summarises the study’s background, objectives, sample and methodological
approaches used to answer the study’s objectives. The chapter then summarises the key
findings and provides concluding remarks regarding the practical and policy implications of
study’s findings. The chapter also highlights the contributions of the study to the current
literature on ESG disclosure research and discusses the research limitations. Finally, the
chapter proposes potential future research ideas in the ESG disclosures domain.
6.2. Research Background and Objectives
There are increasing concerns about unsustainable production practices, ethical dilemmas
and complex governance structures of modern firms. Therefore, shareholders, along with
other stakeholders, increasingly require firms to enhance the quantity and quality of their
financial and non-financial information disclosures. As a result, firms supplement
conventional financial statements with NFI disclosures to meet stakeholders’ information
needs and address the concerns relating to the sustainability of the business’s operations and
impact on the environment and society. Firms operating in sensitive industries face strict
scrutiny because of the potentially harmful impact of their activities on the environment and
society. As a result, there have been collective efforts such as the Paris Climate Change
Agreement, the United Nations sustainable development goals and the European green deal
to develop sustainable ways of doing business. Similarly, efforts are underway to mandate
the disclosure of business information that has been mostly voluntary, such as issues related
to the environment, society and corporate governance. One such disclosure regulation is the
European directive on non-financial reporting that mandates the reporting of NFI information
for large firms operating in the EU.
Against this backdrop, this study explores the impact of NFI disclosures on the information
environment of the reporting firms and attempts to ascertain the reduction in earnings risk
in the context of environmental, social and governance (ESG) reporting. This study aimed to
quantify the impact of sensitive industry status on the level of NFI disclosures and the

100
resulting decrease in earnings risk for sensitive industry firms. The study also measured the
impact of the EU regulation that mandates NFI disclosure reporting for large EU firms. Finally,
the study attempted to explore the changes in the impact of NFI disclosures on earnings risk
before and after the EU directive. Specifically, we answer the following research questions:
i. What is the impact of cumulative and disaggregated NFI disclosure scores on the
earnings risk for S&P1200 index firms?
ii. What is the impact of sensitive industry position on the level of overall and
disaggregated NFI disclosures for S&P1200 index firms?
iii. Does the impact of total and disaggregated NFI disclosure scores on earning risk vary
between sensitive and non-sensitive industry firms in the S&P 1200 index?
iv. How did mandatory NFI disclosure requirements change the degree of NFI disclosures
at the total and disaggregated levels for the S&P 350 EU index firms?
v. Did the enforcement of mandatory NFI disclosure requirements strengthen the
relationship between NFI disclosures and earnings risk for the S&P 350 EU index firms?
6.3. Study Sample, Data and Empirical Models
This study uses the S&P1200 global index constituents as sample firms i.e., an international,
diversified, representative sample. The study used the Bloomberg database to collect ESG
disclosure scores and financial data for the sample firms and the IBES database to collect
analysts’ earnings forecasts and analyst following data. The data period is from 2008 to 2018.
To answer the research questions, we used panel fixed-effect regression, propensity score
weighting approach and a DiD model. We also used various subsamples, alternative variables
and system GMM estimators to check the robustness of our regression estimates.
6.4. Summary of Findings
This section summarises the study’s key findings. Before the formal empirical analysis, we
performed pairwise correlation and unit-root tests to determine the suitability of the data for
regression analysis. The diagnostic test’s results show that the data are free from
multicollinearity and unit-root problems. The descriptive statistics show that the data

101
variables do not suffer from outlier bias. The next section gives the key findings for each
research objective.
6.4.1. NFI disclosures and earnings risk
The first objective of this study was to determine the impact of cumulative and disaggregated
NFI disclosures on the earnings risk of the sample firms. To this end, we used different
estimation methods to estimate the relationship between NFI disclosures and earnings risk.
Table 6.1 summarises the main results for these estimates. First, we used a panel fixed-effect
regression method that shows that the cumulative NFI disclosures exhibit a strong negative
impact on earnings risk. The environmental and social dimensions also show a negative
impact on earnings risk. However, governance disclosures do not contribute to reduced
earnings risk for our sample firms. We used quartile-based analysis to explore how different
quartiles of NFI disclosures affect the earnings risk.
Table 6. 1. The impact of NFI disclosures on firms’ earnings risk Dependent Variable Earnings Risk
NFI Disclosure variable Total
sample
Large
firms
High-Lev
firms
Neg-Income
firms
High-stock
volatility
GMM
estimation
ESG disclosures (-)*** (-)*** (-)*** (-)*** (-)* (-)***
Environment disclosures (-)*** (-)*** (-)*** (-)*** (-) (-)***
Governance disclosures (-) (-) (-)** (-)** (-) (-)***
Social disclosures (-)*** (-)*** (-)*** (-)*** (-)** (-)***
Note: (-) represents the direction of the relationship between NFI disclosures and risk. *, **, *** denote the statistical significance of the estimates at 1%, 5% and 10% significance, respectively.
The results show that the higher quartiles of overall and disaggregated NFI disclosures exhibit
a more substantial negative impact than the lower quartiles. This finding indicates that high
NFI reporting firms are better at reducing earnings risk compared with low reporting firms.
We used sub-sample analyses based on firm size, profitability, leverage and stock return
volatility that support the main conclusion of the baseline models disclosure effects do not
change because of varying firm characteristics. We used alternative proxies of the dependent
and control variables that produce similar results to the baseline models. Finally, the system
GMM estimators also confirmed that the study’s results do not suffer from endogeneity or

102
simultaneity biases. Overall, this study found strong evidence to conclude that NFI disclosures
improve the information environment for firms, which results in lower earnings risk.
6.4.2. Sensitive industries and NFI disclosures
The literature shows that sensitive industry firms face strict scrutiny because of the sensitive
nature of their operations. Therefore, using a propensity score weighting approach, we
showed that sensitive industry firms report more overall and disaggregated NFI disclosures
than non-sensitive firms (Table 6.2). The difference is more pronounced for the
environmental and social dimensions. This finding indicates that sensitive industry firms
realise the need to make more NFI disclosures to maintain the legitimacy of their operations.
Table 6. 2. The impact of sensitive industry status on NFI disclosures
Note: (+) represents the direction of the relationship between sensitive industry status and NFI disclosures. *, **, *** denote the statistical significance of the estimates at 1%, 5% and 10% significance, respectively.
6.4.3. NFI disclosures and earnings risk (sensitive vs non-sensitive industry firms)
Using interaction terms and split-sample approaches, we confirmed that the disclosure of
environmental information provides more benefit to sensitive industry firms in terms of
reducing earnings risk than for non-sensitive industry firms (Table 6.3). Moreover, the
governance disclosures benefit only non-sensitive industry firms with regard to reducing
uncertainty of future earnings. Thus, based on our empirical results, we present substantial
evidence that sensitive industry firms may increase the legitimacy of their operations and
reduce earnings risk by improving their NFI disclosures, especially environmental information.
Table 6. 3. The impact of NFI disclosures and firms’ earnings risk (sensitive vs non-sensitive industry firms)
Dependent variable Split sample Interaction term approach
Earnings risk Sensitive firms Non-sensitive firms Sensitive firms Non- sensitive firms
ESG disclosures (-)*** (-)*** (-)*** (-)***
Environment Disclosures (-)** (-) (-)** (-)**
Governance Disclosures (-) (-)*** (-) (-)***
Social Disclosures (-)*** (-)*** (-)*** (-)***
Note: (-) represents the direction of the association between NFI disclosures and earnings risk. *, **, *** denote the statistical significance of the estimates at 1%, 5% and 10% significance, respectively.
Dependent Variable - NFI disclosures
ESG
disclosure
Environment
Disclosures
Governance
Disclosures
Social
Disclosures Sensitive
industry
(+)*** (+)*** (+) (+)***
103
6.4.4. The impact of mandatory NFI regulations
Next, we used the case of the recently enacted EU NFI reporting directive to quantify its
impact on the level of NFI disclosures for European firms in the study sample. Using a
propensity-weighted sample, we found a significant positive impact of the EU directive on the
level of cumulative as well as disaggregated disclosure scores of the treated firms compared
with the control group of firms that comprised: 1) pre-directive European firms and 2) pre
and post-directive non-European firms (see Table 6.4). These findings show that the EU
directive has not only increased the quantity of NFI disclosures for European firms from the
pre-directive levels, but also shows that the post directive disclosures of European firms are
substantially more than the non-European firms during the post-regulation period.
Table 6. 4. The impact of a mandatory NFI directive on NFI disclosures
Note: (+) represents the direction of the association between mandatory NFI disclosure regulations and NFI disclosures. *, **, *** denote the statistical significance of the estimates at 1%, 5% and 10% significance, respectively.
6.4.5. The impact of mandatory NFI regulations on the NFI and earnings risk link
Lastly, we investigated the impact of the EU directive on the relationship between NFI
disclosures and earnings risk. We hypothesised that the post-directive NFI disclosures would
have an enhanced effect on earnings risk compared with pre-directive disclosures. To this
end, we used the difference-in-differences method to measure the pre- and post-directive
estimates of NFI disclosures. The results (see Table 6.5) confirmed that the post-directive
cumulative NFI disclosures have a more pronounced impact on earnings risk than pre-
directive disclosures. All sub-dimensions of NFI disclosures also show a relatively enhanced
impact on earnings risk in the post-directive period. These findings provide decisive conclusive
evidence that mandating NFI disclosures results in more disclosures that, in return, increase
the efficiency of reported information in reducing uncertainty surrounding a firm’s future
earnings.
Dependent Variable - NFI disclosures
ESG
disclosures
Environment
disclosures
Governance
disclosures
Social
disclosures Mandatory NFI directive (+)*** (+)*** (+)*** (+)***

104
Table 6. 5. The impact of NFI disclosures on firms’ earnings risk pre versus post the EU directive
Dependent variable
Earnings risk
Pre-directive
period
Post-directive
period
F-Statistic P-Value
ESG disclosures (-0.031)*** (-0.041)*** 5.13 0.0243
Environment Disclosures (-0.018) *** (-0.029)*** 6.33 0.0124
Governance Disclosures (-0.000) (-0.011)*** 6.90 0.0091
Social Disclosures (-0.023)*** (-0.032)*** 5.72 0.0365
Note: (-) represents the direction of the relationship between NFI disclosures and earnings risk. *, **, *** denote the statistical significance of the estimates at 1%, 5% and 10% significance, respectively.
6.5. Practical and Policy implications
This section discusses the practical and policy implications of the study’s findings for various
individuals and groups such as corporate managers, stakeholders and regulators.
6.5.1. Implications for corporate managers
According to agency theory, corporate managers work as agents on behalf of the
shareholders. However, they possess first-hand knowledge about the firm’s activities and
decision-making that creates an information gap between them and the shareholders,
sometimes resulting in agency conflict. Our findings suggest that corporate managers can
alleviate agency conflict by improving the transparency of a firm’s information environment
through reporting more information related to ESG issues. The results also identified that
corporate managers operating in environmentally sensitive, large, highly leveraged and loss
reporting firms could benefit more by reporting ESG related information than others. These
findings further suggest corporate managers managing firms that face stricter scrutiny
because of their size or sensitive industry status can mitigate legitimacy concerns by reporting
ESG related information. Finally, our results suggest that corporate managers can use NFI
disclosures to devise reporting policies for their firm regarding ESG issues that are much
sought after and influence the public image of firms and their decision makers.
6.5.2. Implications for firm stakeholders
Freeman (2010) defines stakeholders as “any group or individual that can affect or be affected
by the realisation of the organisation’s purpose” (p. 26). Accordingly, stakeholders consist of
a variety of individuals and groups that might be internal to a firm such as employees and
shareholders or external such as suppliers, customers, competitors, and government. These
stakeholders also require ESG related information along with the financial information to

105
make informed decisions about the firm. One of the stakeholders is a financial analyst who
forecasts estimates of a firm’s future earnings and market value. The study’s results show that
NFI disclosures are beneficial in reducing the difference between actual and the forecast
earnings by financial analysts. Fundamentally, these findings imply that more precise earnings
estimates by financial analysts can influence the perceptions of other stakeholders such as
suppliers, creditors and regulators since they use analysts’ forecasts to make their decisions.
Likewise, our findings suggest that NFI disclosures improve the transparency of a firm’s
information environment, which serves as a tool to minimise information asymmetry
problems arising from information lop-sidedness between corporate managers and
stakeholders. NFI disclosures can help pro-ESG stakeholders to analyse the social and
environmental impacts of a firm. Our findings suggest that such stakeholders can use ESG
disclosures, with financial information, to make informed decisions about a firm’s future
performance and risks.
6.5.3. Implications for regulators
Countries around the world face increasing pressures from the international community to
make businesses more responsible in terms of their conduct and information disclosures.
Global agreements such as the Paris Agreement, the United Nations development goals and
other such agreements, also provide countries specific targets for reducing their impact on
the environment and society. Accordingly, many countries have enacted regulations that
require businesses to report efforts undertaken to minimise impact on the environment and
progress towards an equitable society. In this context, using the recently enacted EU directive
on NFI reporting, we showed that mandating of NFI disclosures results in more reporting of
NFI information in all ESG domains. Further analysis of post-directive disclosures shows an
improved information environment of firms, suggesting that the mandating of NFI disclosures
not only improves the degree of disclosures, it also enhances the disclosure quality. These
findings suggest that regulators in the other parts of the world should move towards
mandatory NFI disclosure regimes such as the EU directive, which presents promising results
to achieve much-needed business sustainability goals that are essential to achieve country-
level targets set in the global agreements. Furthermore, providing evidence regarding
improved disclosure quality in a mandated disclosure regime, our findings supplement the
106
literature that propose state institutions can facilitate business legitimisation strategies
through policy interventions. For example, see (Archel, Husillos, Larrinaga, & Spence, 2009;
La Torre, Sabelfeld, Blomkvist, Tarquinio, & Dumay, 2018). Finally, mandatory NFI regimes
could also improve disclosures on the governance practices of firms, which is a necessary tool
to avoid fraudulent and risky business practices that could result in systemic failure such as
the recent 2008 global financial crisis.
6.6. Research Contribution
This study contributes in several ways to existing NFI disclosure and firm risk literature. First,
this study uses an internationally diversified, representative sample that covers over 70% of
the total global market capitalisation and is often used as a proxy for world stock market
performance. Hence, the study’s results are more generalisable than existing studies that
focus on companies incorporated in a specific country (Becchetti et al., 2015; Bernardi &
Stark, 2018; Cai et al., 2016; Chang et al., 2014), a group of developed countries (Benlemlih &
Girerd‐Potin, 2017), or a geographical region (Sassen et al., 2016). Second, we used a firm risk
proxy that is more relatable to NFI disclosures than other firm risk proxies used in the
literature such as idiosyncratic or market risk, e.g., see (Benlemlih et al., 2018; Oikonomou et
al., 2012). The use of an earnings risk proxy offers new insights into the relationship between
NFI disclosures and firm risk that further improve understanding of the importance of NFI
disclosures for today’s businesses. Our findings provide essential understandings about the
ESG disclosure and firms’ earnings risk association that can help corporate managers devise
NFI disclosure policies for their firm.
Third, using the improved methodology of propensity score weighting, we quantified the
impact of sensitive industry status on the level of overall and disaggregated disclosures. To
the best of our knowledge, this study is the first to quantify the impact of sensitive industry
status on NFI disclosures for an international sample. This study also contributes to the
understanding of the relationship between NFI disclosures and firm risk in sensitive industry
firms for an international sample; current evidence is limited to individual countries such as
the U.S., China, and Spain, e.g., see (Jo & Na, 2012), (Zeng et al., 2020) and (Reverte, 2012).
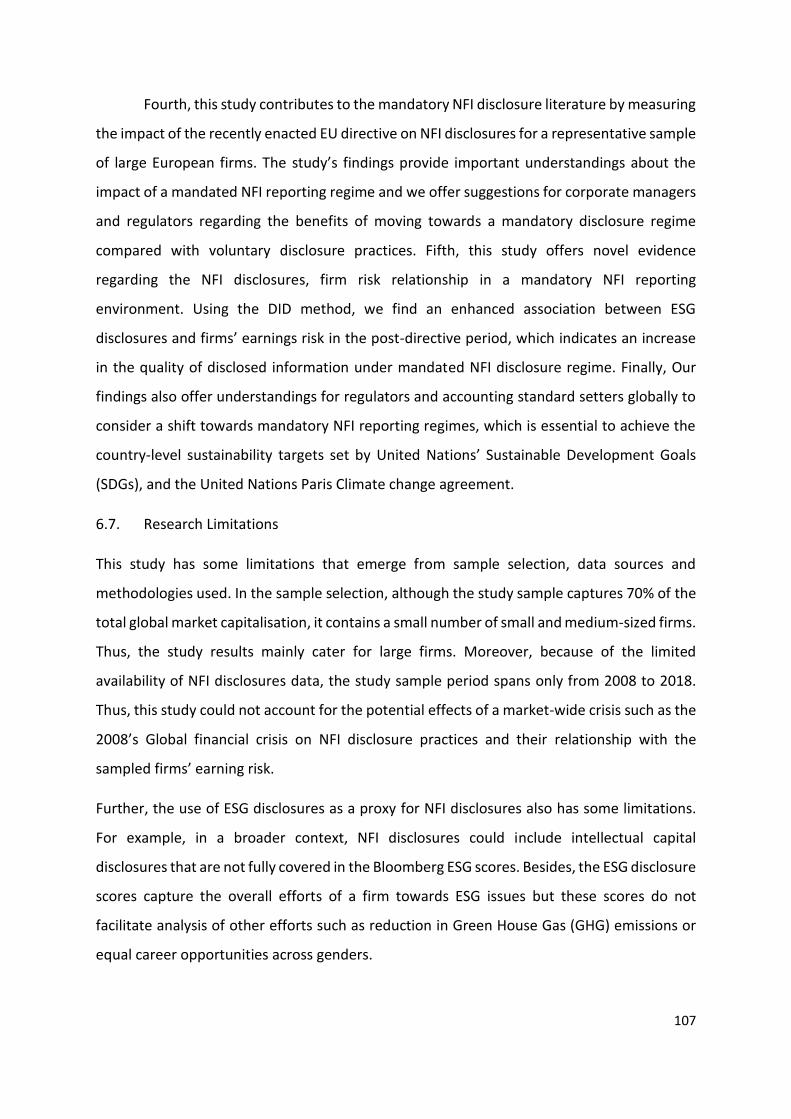
107
Fourth, this study contributes to the mandatory NFI disclosure literature by measuring
the impact of the recently enacted EU directive on NFI disclosures for a representative sample
of large European firms. The study’s findings provide important understandings about the
impact of a mandated NFI reporting regime and we offer suggestions for corporate managers
and regulators regarding the benefits of moving towards a mandatory disclosure regime
compared with voluntary disclosure practices. Fifth, this study offers novel evidence
regarding the NFI disclosures, firm risk relationship in a mandatory NFI reporting
environment. Using the DID method, we find an enhanced association between ESG
disclosures and firms’ earnings risk in the post-directive period, which indicates an increase
in the quality of disclosed information under mandated NFI disclosure regime. Finally, Our
findings also offer understandings for regulators and accounting standard setters globally to
consider a shift towards mandatory NFI reporting regimes, which is essential to achieve the
country-level sustainability targets set by United Nations’ Sustainable Development Goals
(SDGs), and the United Nations Paris Climate change agreement.
6.7. Research Limitations
This study has some limitations that emerge from sample selection, data sources and
methodologies used. In the sample selection, although the study sample captures 70% of the
total global market capitalisation, it contains a small number of small and medium-sized firms.
Thus, the study results mainly cater for large firms. Moreover, because of the limited
availability of NFI disclosures data, the study sample period spans only from 2008 to 2018.
Thus, this study could not account for the potential effects of a market-wide crisis such as the
2008’s Global financial crisis on NFI disclosure practices and their relationship with the
sampled firms’ earning risk.
Further, the use of ESG disclosures as a proxy for NFI disclosures also has some limitations.
For example, in a broader context, NFI disclosures could include intellectual capital
disclosures that are not fully covered in the Bloomberg ESG scores. Besides, the ESG disclosure
scores capture the overall efforts of a firm towards ESG issues but these scores do not
facilitate analysis of other efforts such as reduction in Green House Gas (GHG) emissions or
equal career opportunities across genders.

108
This study uses quantitative variables to control for firm characteristics that might affect the
relationship between NFI disclosures and earnings risk. However, there might be some
qualitative variables such as company values, philosophy and culture, that may determine the
level of NFI disclosures. Such variables are not considered in this study. Additionally, this study
uses various estimation methods to establish a causal relationship between NFI disclosures
and earnings risk and avoids biases such as endogeneity and simultaneity. However, we did
not apply other estimation methods such as the instrumental variable approach that might
help identify robust instruments.
6.8. Future Research
This study’s limitations help identify several research avenues for future studies into NFI
disclosures and their relationship with firm risk. First, future studies may focus on small and
medium enterprises (SME) to better understand the NFI disclosure practices of these firms
since the literature provides minimal evidence for this group of firms. The SME sector
constitutes a very significant proportion of business establishments especially in developing
countries; hence, studying NFI disclosures and their relationship with firms’ financial
outcomes could reveal novel results. Second, future studies could consider using specific NFI
disclosures such as GHG emissions, workforce diversity, community and customer relations.
In doing so, future studies may focus on individual industries or firms to better understand
the motives behind NFI disclosures and their relationship with firms’ financial outcomes.
This study provides a foundation for future studies to continue investigating the impact of
mandatory NFI disclosure regimes on firm-level disclosures and the resulting consequences
for firms and economies. Future studies may also investigate the level of compliance with
mandatory NFI disclosure requirements, which will give a better idea about the areas that
need improving and reconsideration. Such studies will guide regulators and policy-makers in
developing holistic disclosure regimes that embody all aspects of business activities and
address the concerns of the variety of stakeholders.

109
Appendix A
Table A.1. The Hausman test estimates of the study variables Variable Fixed Random Difference S.E.
ESGDS -0.0205 -0.0177 -0.0028 0.0014
Leverage 0.0183 0.0140 0.0043 0.0019
Firm Size -0.2664 -0.1059 -0.1606 0.0668
Growth -0.1050 -0.1132 0.0082 0.0049
Volatility: EPS 0.3614 0.7571 -0.3957 0.0390
Loss Dummy 0.3181 0.3549 -0.0368 0.0111
Accrual dummy 0.2029 0.2266 -0.0237 0.0102
RoA -0.0082 -0.0103 0.0021 0.0013
LNAF -0.1752 -0.1800 0.0048 0.0268
Test: Ho: difference in coefficients not systematic.
chi2(9) = (b-B)'[(V_b-V_B)^(-1)](b-B)
Chi- square value = 153.15; p-value = 0.00000
Note: The Table presents the Hausman test estimates of the study variables.

110
Table A.2. The impact of NFI disclosures on firms’ earnings risk
Small firms Large firms
VARIABLE Dependent Variable: Earnings Risk
ESGDS -0.014*** -0.020*** (0.003) (0.004)
EDS -0.005** -0.012*** (0.002) (0.002)
GDS -0.007 -0.008 (0.007) (0.007)
SDS -0.014*** -0.014***
(0.003) (0.005)
Firm Size -0.289*** -0.194 -0.345*** -0.301*** -0.037 0.003 -0.129 -0.063
(0.107) (0.155) (0.108) (0.101) (0.194) (0.184) (0.196) (0.211)
Leverage 0.015*** 0.014*** 0.015*** 0.014*** 0.027*** 0.028*** 0.028*** 0.027***
(0.005) (0.004) (0.005) (0.004) (0.007) (0.007) (0.007) (0.008)
Growth -0.087*** -0.111*** -0.090*** -0.080*** -0.122*** -0.130*** -0.129*** -0.123***
(0.014) (0.017) (0.014) (0.013) (0.025) (0.025) (0.025) (0.026)
Volatility: EPS 0.315*** 0.413*** 0.308*** 0.314*** 0.453*** 0.460*** 0.442*** 0.438***
(0.068) (0.064) (0.065) (0.064) (0.036) (0.038) (0.034) (0.033)
Loss Dummy 0.338** 0.218 0.343** 0.319* 0.288*** 0.299*** 0.288*** 0.287***
(0.171) (0.183) (0.173) (0.181) (0.104) (0.099) (0.105) (0.104)
Accrual dummy 0.264*** 0.287*** 0.259*** 0.270*** 0.037 0.048 0.049 0.043
(0.088) (0.101) (0.088) (0.093) (0.064) (0.058) (0.066) (0.065)
RoA -0.015 -0.016 -0.014 -0.013 -0.003 -0.000 -0.003 -0.003
(0.013) (0.013) (0.014) (0.014) (0.011) (0.009) (0.011) (0.011)
Log NAF -0.040 -0.129 -0.071 -0.074 -0.226*** -0.207*** -0.254*** -0.222***
(0.108) (0.117) (0.123) (0.081) (0.056) (0.064) (0.056) (0.058)
Constant -1.602* -2.415* -1.119 -1.413 -3.270 -4.174* -2.569 -3.279
(0.966) (1.300) (0.901) (0.937) (2.195) (2.176) (2.053) (2.313)
FE time and industry Yes Yes Yes Yes Yes Yes Yes Yes
R-squared 0.0605 0.059 0.0573 0.0597 0.0562 0.0546 0.052 0.0559
Observations 4,386 3,991 4,391 4,359 4,499 4,314 4,500 4,491
Number of groups 543 511 542 541 512 502 511 511
Note: The Table presents the sub-sample analysis for small and large firms. Standard errors are in parentheses; *** = p<0.01, ** = p<0.05, * = p<0.1.

111
Table A.3. The impact of NFI disclosures on firms’ earnings risk Low leverage sample High leverage sample
VARIABLE Dependent Variable – Earnings Risk
ESGDS -0.009* -0.019*** (0.005) (0.003)
EDS -0.005 -0.010*** (0.004) (0.002)
GDS 0.000 -0.015** (0.007) (0.006)
SDS -0.011*** -0.014***
(0.003) (0.003) Firm Size -0.120 -0.058 -0.161 -0.083 -0.239*** -0.260** -0.312*** -0.282***
(0.110) (0.133) (0.110) (0.113) (0.078) (0.123) (0.078) (0.077) Leverage 0.009* 0.008 0.010* 0.010* 0.025*** 0.029*** 0.026*** 0.027***
(0.005) (0.006) (0.006) (0.005) (0.004) (0.005) (0.004) (0.004) Growth -0.127*** -0.135*** -0.128*** -0.123*** -0.076*** -0.100*** -0.081*** -0.073***
(0.019) (0.018) (0.019) (0.020) (0.010) (0.013) (0.010) (0.009) Volatility: EPS 0.371*** 0.398*** 0.363*** 0.359*** 0.473*** 0.511*** 0.471*** 0.468***
(0.026) (0.024) (0.027) (0.024) (0.034) (0.032) (0.032) (0.033) Loss Dummy 0.267* 0.275* 0.276* 0.262* 0.212*** 0.134 0.207*** 0.191**
(0.162) (0.148) (0.160) (0.155) (0.068) (0.090) (0.073) (0.078) Accrual dummy -0.012 -0.014 -0.011 -0.010 -0.015 -0.014 -0.015 -0.015
(0.009) (0.010) (0.009) (0.009) (0.012) (0.012) (0.012) (0.013) RoA -0.294*** -0.303*** -0.316*** -0.297*** -0.031 -0.065 -0.058 -0.009
(0.048) (0.052) (0.050) (0.047) (0.062) (0.084) (0.072) (0.056) LNAF -2.099* -2.845* -2.020 -2.433* -2.106*** -2.229* -1.184 -1.992***
(1.200) (1.473) (1.274) (1.270) (0.760) (1.152) (0.772) (0.755) Constant -0.120 -0.058 -0.161 -0.083 -0.239*** -0.260** -0.312*** -0.282***
(0.110) (0.133) (0.110) (0.113) (0.078) (0.123) (0.078) (0.077) FE time and industry Yes Yes Yes Yes Yes Yes Yes Yes R-squared 0.0469 0.0481 0.0456 0.0477 0.0515 0.0516 0.0487 0.0519 Observations 4,512 4,184 4,515 4,491 4,373 4,121 4,376 4,359 Number of groups 620 600 620 619 642 614 642 639
Note: The Table presents the sub-sample analysis for low and high leverage firms. Standard errors are in parentheses; *** = p<0.01, ** = p<0.05, * = p<0.1.
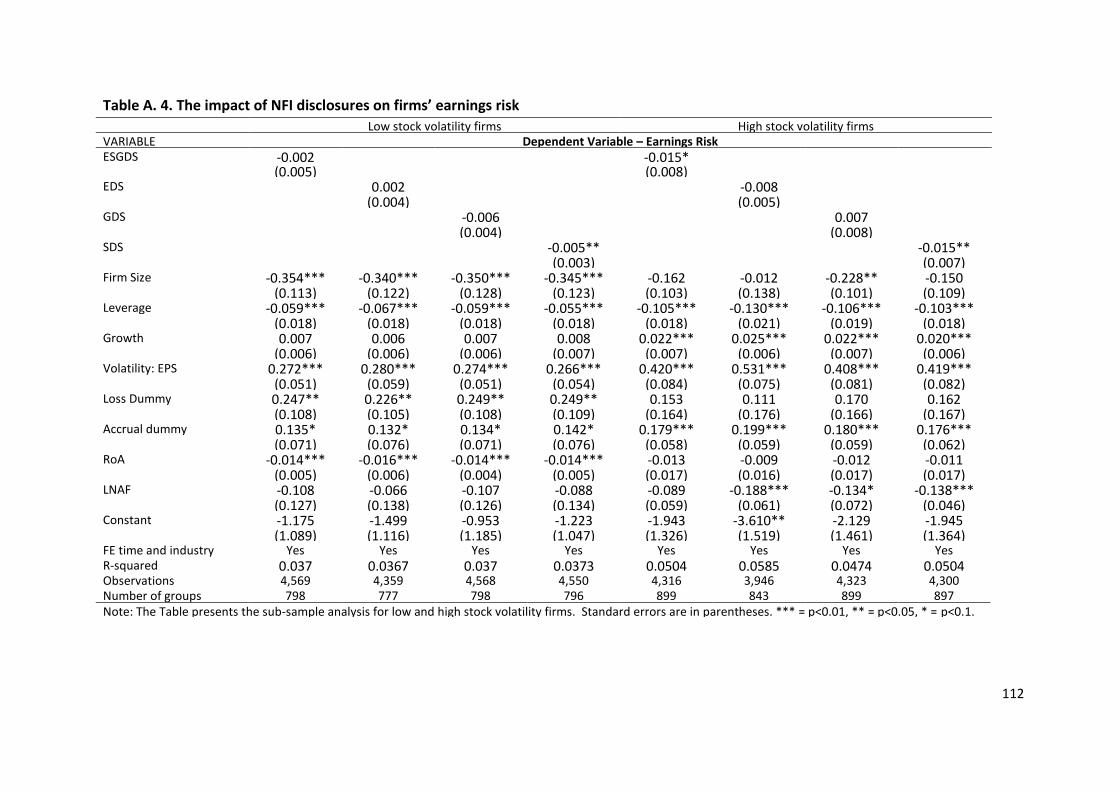
112
Table A. 4. The impact of NFI disclosures on firms’ earnings risk
Low stock volatility firms High stock volatility firms VARIABLE Dependent Variable – Earnings Risk ESGDS -0.002 -0.015*
(0.005) (0.008) EDS 0.002 -0.008
(0.004) (0.005) GDS -0.006 0.007
(0.004) (0.008) SDS -0.005** -0.015**
(0.003) (0.007) Firm Size -0.354*** -0.340*** -0.350*** -0.345*** -0.162 -0.012 -0.228** -0.150
(0.113) (0.122) (0.128) (0.123) (0.103) (0.138) (0.101) (0.109) Leverage -0.059*** -0.067*** -0.059*** -0.055*** -0.105*** -0.130*** -0.106*** -0.103***
(0.018) (0.018) (0.018) (0.018) (0.018) (0.021) (0.019) (0.018) Growth 0.007 0.006 0.007 0.008 0.022*** 0.025*** 0.022*** 0.020***
(0.006) (0.006) (0.006) (0.007) (0.007) (0.006) (0.007) (0.006) Volatility: EPS 0.272*** 0.280*** 0.274*** 0.266*** 0.420*** 0.531*** 0.408*** 0.419***
(0.051) (0.059) (0.051) (0.054) (0.084) (0.075) (0.081) (0.082) Loss Dummy 0.247** 0.226** 0.249** 0.249** 0.153 0.111 0.170 0.162
(0.108) (0.105) (0.108) (0.109) (0.164) (0.176) (0.166) (0.167) Accrual dummy 0.135* 0.132* 0.134* 0.142* 0.179*** 0.199*** 0.180*** 0.176***
(0.071) (0.076) (0.071) (0.076) (0.058) (0.059) (0.059) (0.062) RoA -0.014*** -0.016*** -0.014*** -0.014*** -0.013 -0.009 -0.012 -0.011
(0.005) (0.006) (0.004) (0.005) (0.017) (0.016) (0.017) (0.017) LNAF -0.108 -0.066 -0.107 -0.088 -0.089 -0.188*** -0.134* -0.138***
(0.127) (0.138) (0.126) (0.134) (0.059) (0.061) (0.072) (0.046) Constant -1.175 -1.499 -0.953 -1.223 -1.943 -3.610** -2.129 -1.945
(1.089) (1.116) (1.185) (1.047) (1.326) (1.519) (1.461) (1.364) FE time and industry Yes Yes Yes Yes Yes Yes Yes Yes R-squared 0.037 0.0367 0.037 0.0373 0.0504 0.0585 0.0474 0.0504 Observations 4,569 4,359 4,568 4,550 4,316 3,946 4,323 4,300 Number of groups 798 777 798 796 899 843 899 897 Note: The Table presents the sub-sample analysis for low and high stock volatility firms. Standard errors are in parentheses. *** = p<0.01, ** = p<0.05, * = p<0.1.

113
Table A.5. The impact of NFI disclosures on firms’ earnings risk Positive income firms Negative income firms
VARIABLE Dependent Variable – Earnings Risk
ESGDS -0.014*** -0.047*** (0.003) (0.009)
EDS -0.006*** -0.035*** (0.002) (0.009)
GDS -0.009* 0.027** (0.005) (0.012)
SDS -0.013*** -0.027***
(0.002) (0.010)
Firm Size -0.285*** -0.266*** -0.336*** -0.294*** -0.159 0.051 -0.205 -0.121
(0.062) (0.072) (0.068) (0.059) (0.284) (0.372) (0.276) (0.283)
Leverage 0.013*** 0.012*** 0.013*** 0.013*** 0.067*** 0.069*** 0.067*** 0.061***
(0.004) (0.004) (0.004) (0.005) (0.009) (0.008) (0.011) (0.009)
Growth -0.090*** -0.106*** -0.093*** -0.087*** -0.021 -0.042 -0.020 -0.018
(0.015) (0.015) (0.015) (0.016) (0.026) (0.027) (0.030) (0.029)
Volatility: EPS 0.377*** 0.409*** 0.368*** 0.367*** 0.272 0.341** 0.324* 0.288*
(0.047) (0.048) (0.050) (0.047) (0.169) (0.145) (0.173) (0.160)
Loss Dummy 0.170*** 0.177*** 0.169*** 0.174*** 0.262 0.307* 0.379** 0.336*
(0.038) (0.045) (0.038) (0.039) (0.163) (0.172) (0.181) (0.178)
Accrual dummy -0.005 -0.009 -0.004 -0.004 -0.010 -0.007 -0.010 -0.006
(0.008) (0.009) (0.008) (0.008) (0.022) (0.017) (0.021) (0.019)
RoA -0.116 -0.126 -0.134* -0.095 0.167 -0.002 0.074 0.025
(0.073) (0.083) (0.079) (0.075) (0.165) (0.269) (0.235) (0.183)
LNAF -1.084 -1.501* -0.540 -1.143 -2.716 -5.089 -5.455** -3.389
(0.793) (0.803) (0.885) (0.769) (2.860) (3.288) (2.655) (2.740)
FE time and industry Yes Yes Yes Yes Yes Yes Yes Yes
R-squared 0.0463 0.0467 0.044 0.0471 0.1033 0.093 0.0851 0.0772
Observations 7,942 7,444 7,944 7,909 943 861 947 941
Number of groups 908 879 907 905 412 379 413 413
Note: The Table presents the sub-sample analysis for negative and positive income firms. Standard errors are in parentheses; *** = p<0.01, ** = p<0.05, * = p<0.1

114
Table A.6. The impact of NFI disclosures on firms’ earnings risk (non-financial firms)
Dependent Variable: Earnings Risk
VARIABLE 1 2 3 4
ESGDS -0.009*** (0.003)
EDS -0.005** (0.002)
GDS 0.003
(0.004)
SDS -0.009***
(0.002)
Leverage 0.015*** 0.012*** 0.015*** 0.013***
(0.004) (0.004) (0.004) (0.004)
Firm Size -0.285*** -0.252** -0.325*** -0.292***
(0.087) (0.109) (0.087) (0.087)
Growth -0.075*** -0.092*** -0.077*** -0.069***
(0.011) (0.011) (0.011) (0.009)
Volatility: EPS 0.361*** 0.422*** 0.352*** 0.355***
(0.038) (0.028) (0.039) (0.037)
Loss 0.219* 0.188 0.225* 0.212
(0.130) (0.135) (0.131) (0.133)
Accrual 0.223*** 0.261*** 0.226*** 0.230***
(0.050) (0.056) (0.051) (0.053)
ROA -0.016 -0.014 -0.015 -0.015
(0.012) (0.011) (0.012) (0.012)
LNAF -0.009 -0.050 -0.030 -0.028
(0.073) (0.079) (0.080) (0.065)
Constant -1.688* -2.013** -1.786* -1.577*
(0.889) (1.018) (0.919) (0.899)
0.0432 0.0448 0.0415 0.0425 Observations 7,408 6,981 7,413 7,378
Number of groups 768 747 767 766
Note: The Table presents the sub-sample analysis for non-financial firms. See Table 4.1 for variable definitions.
Standard errors are in parentheses; *** = p<0.01, ** = p<0.05, * = p<0.1.
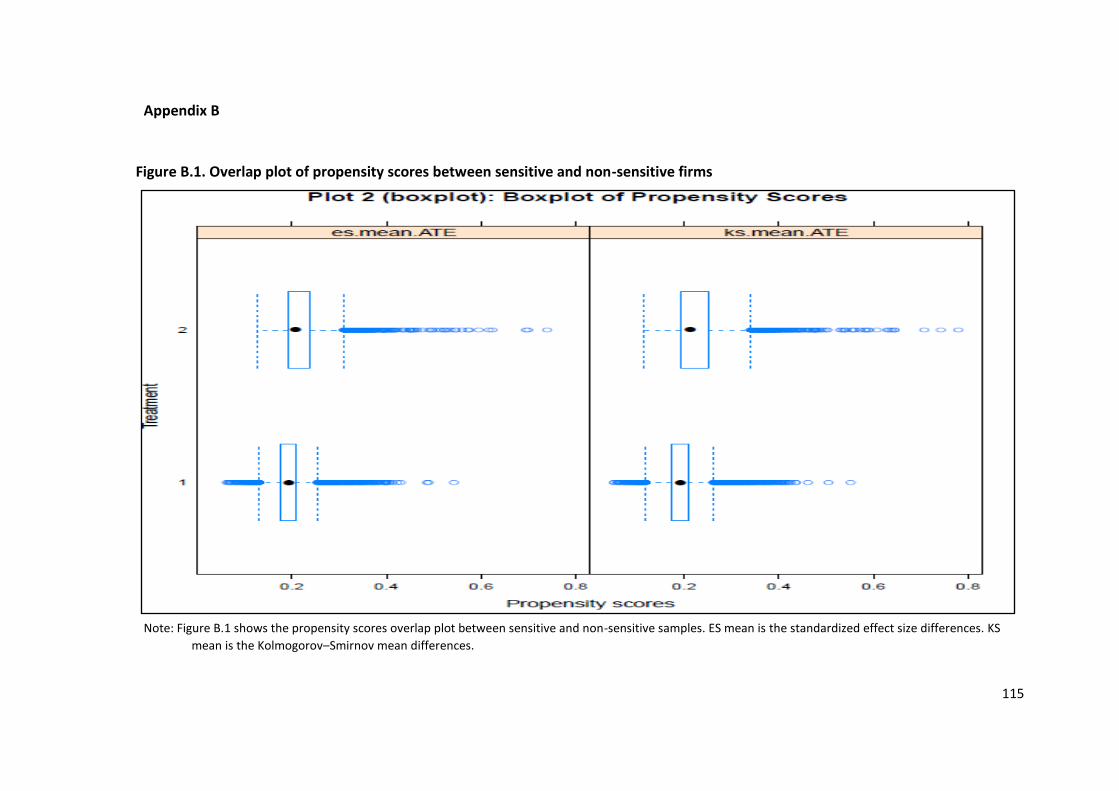
115
Appendix B
Figure B.1. Overlap plot of propensity scores between sensitive and non-sensitive firms
Note: Figure B.1 shows the propensity scores overlap plot between sensitive and non-sensitive samples. ES mean is the standardized effect size differences. KS
mean is the Kolmogorov–Smirnov mean differences.
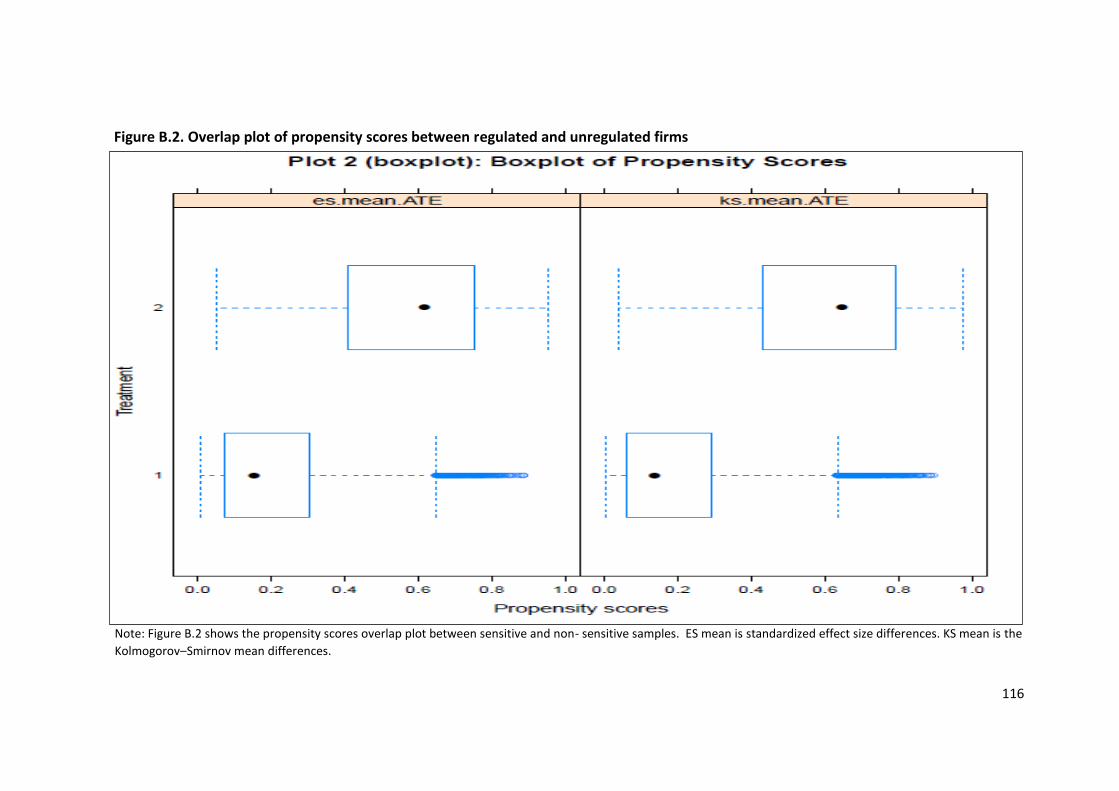
116
Figure B.2. Overlap plot of propensity scores between regulated and unregulated firms
Note: Figure B.2 shows the propensity scores overlap plot between sensitive and non- sensitive samples. ES mean is standardized effect size differences. KS mean is the
Kolmogorov–Smirnov mean differences.

117
Appendix C
List of companies contained in the sample
S&P AS 50
Asustek Computer Inc
AU Optronics Corp
BOC Hong Kong Holdings Ltd
Cathay Financial Holding Co Ltd
China Communications Construction Co Ltd
China Construction Bank Corp
China Life Insurance Co Ltd
China Mobile Ltd
China Steel Corp
Chunghwa Telecom Co Ltd
CLP Holdings Ltd
CNOOC Ltd
DBS Group Holdings Ltd
Esprit Holdings Ltd
Formosa Chemicals & Fibre Corp
Formosa Plastics Corp
Hang Seng Bank Ltd
Hon Hai Precision Industry Co Ltd
Hong Kong & China Gas Co Ltd
Hong Kong Exchanges & Clearing Ltd
HTC Corp
Hutchison Whampoa Ltd
Hyundai Motor Co
Industrial & Commercial Bank of China Ltd
KB Financial Group Inc
Keppel Corp Ltd
Korea Electric Power Corp
Korea Shipbuilding & Offshore Engineering Co Ltd
KT&G Corp
LG Electronics Inc
Li & Fung Ltd
MediaTek Inc
Nan Ya Plastics Corp
Oversea-Chinese Banking Corp Ltd
PetroChina Co Ltd
POSCO
Samsung C&T Corp/Old
Samsung Electronics Co Ltd
Shinhan Financial Group Co Ltd
Singapore Airlines Ltd

118
Singapore Telecommunications Ltd
SK Innovation Co Ltd
SK Telecom Co Ltd
Sun Hung Kai Properties Ltd
Swire Pacific Ltd
Taiwan Semiconductor Manufacturing Co Ltd
United Microelectronics Corp
United Overseas Bank Ltd
Wilmar International Ltd
S&P AU 50
ACN 004 410 833 Ltd
AGL Energy Ltd
Alumina Ltd
Amcor PLC
AMP Ltd
ASX Ltd
Australia & New Zealand Banking Group Ltd
BHP Group Ltd
BlueScope Steel Ltd
Brambles Ltd
CIMIC Group Ltd
Commonwealth Bank of Australia
Crown Resorts Ltd
CSL Ltd
Fairfax Media Ltd
Fortescue Metals Group Ltd
Frugl Group Ltd
Goodman Group
GPT Group/The
Incitec Pivot Ltd
Insurance Australia Group Ltd
Intoll Group
Lendlease Corp Ltd
Lynch Group Holdings Ltd
Macquarie Group Ltd
Newcrest Mining Ltd
Orica Ltd
Origin Energy Ltd
OZ Minerals Ltd
Qantas Airways Ltd
QBE Insurance Group Ltd
Resolution Life Aaph Ltd
Rio Tinto Ltd
Santos Ltd
Spark New Zealand Ltd
Stockland

119
Suncorp Group Ltd
Sydney Airport
Tabcorp Holdings Ltd
Telstra Corp Ltd
TFCF Corp
Toll Holdings Ltd
Transurban Group
Wesfarmers Ltd
Westfield Corp
Westpac Banking Corp
Woodside Petroleum Ltd
Woolworths Group Ltd
Worley Ltd
S&P CA 60
Agnico Eagle Mines Ltd
Agrium Inc
Aimia Inc
ARC Resources Ltd
Augusta Gold Corp
Bank of Montreal
Bank of Nova Scotia/The
Barrick Gold Corp
Bausch Health Cos Inc
BCE Inc
BlackBerry Ltd
Blackstone Mortgage Trust Inc
Bombardier Inc
Brookfield Asset Management Inc
Cameco Corp
Canadian Imperial Bank of Commerce
Canadian National Railway Co
Canadian Natural Resources Ltd
Canadian Oil Sands Ltd
Canadian Pacific Railway Ltd
Canadian Tire Corp Ltd
Corp Shoppers Drug Mart
Enbridge Inc
Enerplus Corp
First Quantum Minerals Ltd
Fortis Inc/Canada
George Weston Ltd
Gildan Activewear Inc
Husky Energy Inc
Imperial Oil Ltd
Inmet Mining Corp
Kinross Gold Corp

120
Loblaw Cos Ltd
Lundin Mining Corp
Magna International Inc
Manulife Financial Corp
Metro Inc/CN
Nexen Energy ULC
Nordion Inc
NOVA Chemicals Corp
Obsidian Energy Ltd
Ovintiv Canada ULC
Petro-Canada
Potash Corp of Saskatchewan Inc
Repsol Oil & Gas Canada Inc
Rogers Communications Inc
Royal Bank of Canada
Shaw Communications Inc
SNC-Lavalin Group Inc
Sun Life Financial Inc
Suncor Energy Inc
TC Energy Corp
Teck Resources Ltd
TELUS Corp
Thomson Reuters Corp
Tim Hortons Inc
Toronto-Dominion Bank/The
TransAlta Corp
Yamana Gold Inc
Yellow Pages Digital & Media Solutions Ltd
S&P EU 350
3i Group PLC
ABB Ltd
Abertis Infraestructuras SA
Abi Sab Group Holding Ltd
Accor SA
Acerinox SA
ACS Actividades de Construccion y Servicios SA
Adecco Group AG
adidas AG
Ageas SA/NV
AGFA-Gevaert NV
AIB Group PLC
Air France-KLM
Air Liquide SA
Airbus SE
Alcatel Lucent SAS
Alfa Laval AB

121
Alleanza Toro SpA
Allergan PLC
Allianz SE
Alpha Services and Holdings SA
Alstom SA
Anglo American PLC
Anheuser-Busch InBev SA/NV
AP Moller - Maersk A/S
ArcelorMittal SA
ASML Holding NV
Assa Abloy AB
Assicurazioni Generali SpA
Associated British Foods PLC
AstraZeneca PLC
Atlantia SpA
Atlas Copco AB
Aviva PLC
AXA SA
BAE Systems PLC
Baloise Holding AG
Banca Monte dei Paschi di Siena SpA
Banca Popolare di Milano Scarl
Banco Bilbao Vizcaya Argentaria SA
Banco Comercial Portugues SA
Banco Espirito Santo SA
Banco Popolare SC
Banco Popular Espanol SA
Banco Santander SA
Bank of Ireland Group PLC
Bankinter SA
Barclays PLC
BASF SE
Bayer AG
Bayerische Motoren Werke AG
Beiersdorf AG
BG Group Ltd
BHP Group PLC
BNP Paribas SA
BNY Mellon Strategic Municipal Bond Fund Inc
Boliden AB
Bouygues SA
BP PLC
Brisa Auto-Estradas de Portugal SA
British American Tobacco PLC
British Land Co PLC/The
BT Group PLC

122
Bunzl PLC
Cable & Wireless Communications Ltd/Old
Cadbury Ltd
Capgemini SE
Capita PLC
Carlsberg AS
Carnival PLC
Carrefour SA
Casino Guichard Perrachon SA
CECONOMY AG
Christian Dior SE
Cie de Saint-Gobain
Cie Financiere Richemont SA
Cie Generale des Etablissements Michelin SCA
Clariant AG
Cobham Ltd
Commerzbank AG
Compass Group PLC
Credit Agricole SA
Credit Suisse Group AG
CRH PLC
Daily Mail & General Trust PLC
Daimler AG
Danone SA
Danske Bank A/S
Darty Ltd
Dassault Systemes SE
Delhaize Group SCA
Dentsu International Ltd
Deutsche Bank AG
Deutsche Boerse AG
Deutsche Lufthansa AG
Deutsche Post AG
Deutsche Telekom AG
Dexia SA
Diageo PLC
Dixons Retail Group Ltd
DNB ASA
Drax Group PLC
EDF Energy Nuclear Generation Group Ltd
EDP - Energias de Portugal SA
EI Group Ltd
Electricite de France SA
Electrocomponents PLC
Electrolux AB
Enel SpA

123
Engie SA
Eni SpA
Equinor ASA
Erste Group Bank AG
EssilorLuxottica SA
Eurobank Ergasias Services and Holdings SA
Experian PLC
Ferguson PLC
Fiat SpA
Finastra Group Holdings Ltd
Firstgroup PLC
Fortum Oyj
Fresenius Medical Care AG & Co KGaA
Friends Life FPG Ltd
G4S PLC
GAM Holding AG
Gates Worldwide Ltd
Givaudan SA
GKN Ltd
GlaxoSmithKline PLC
Groupe Bruxelles Lambert SA
Grupo Ferrovial SA
H & M Hennes & Mauritz AB
Hammerson PLC
Hays PLC
HBOS PLC
Hellenic Telecommunications Organization SA
Henkel AG & Co KGaA
Hermes International
Hibu plc
HOCHTIEF AG
Holcim Ltd
Holmen AB
Home Reit PLC
HSBC Holdings PLC
Hypo Real Estate Holding GmbH
Iberdrola SA
Igeamed SpA
IMI PLC
Imperial Brands PLC
Infineon Technologies AG
Integra Inc
Intercement Portugal SA
InterContinental Hotels Group PLC
International Consolidated Airlines Group SA
International Power Ltd

124
Intesa Sanpaolo SpA
Invensys Ltd
Investor AB
Irish Bank Resolution Corp Ltd/Old
Italiaonline SpA
ITV PLC
J Sainsbury PLC
Johnson Matthey PLC
K+S AG
KBC Group NV
Kering SA
Kingfisher PLC
Kone Oyj
Koninklijke KPN NV
Ladbrokes Coral Group Ltd
Lafarge SA
Lagardere SCA
Land Securities Group PLC
Legal & General Group PLC
Leonardo SpA
Lloyds Banking Group PLC
Logica Ltd
L'Oreal SA
Luxottica Group SpA
LVMH Moet Hennessy Louis Vuitton SE
Man Group PLC/Jersey
MAN SE
Marks & Spencer Group PLC
Mediaset SpA
Mediobanca Banca di Credito Finanziario SpA
Merck KGaA
Mitchells & Butlers PLC
Muenchener Rueckversicherungs-Gesellschaft AG in Muenchen
National Bank of Greece SA
National Grid PLC
Naturgy Energy Group SA
Neles Oyj
Nestle SA
Next PLC
Nobel Biocare Holding AG
Nokia Oyj
Nordea Bank Abp
Norsk Hydro ASA
Novartis AG
Novo Nordisk A/S
Novozymes A/S

125
Om Residual UK Ltd
OMV AG
OPAP SA
Orange SA
Orkla ASA
Pearson PLC
Pernod Ricard SA
Perrigo Corp DAC
Persimmon PLC
Peugeot SA
Pharol SGPS SA
Pirelli & C SpA
Porsche Automobil Holding SE
Provident Financial PLC
Proximus SADP
Prudential PLC
Publicis Groupe SA
Puma SE
Punch Taverns Ltd
Rand Capital Corp
REC Silicon ASA
Reckitt Benckiser Group PLC
RELX PLC
Renault SA
Rentokil Initial PLC
Rentrak Corp
Repsol SA
Rexam Ltd
Rio Tinto PLC
Roche Holding AG
Rolls-Royce Holdings PLC
Royal Dutch Shell PLC
RSA Insurance Group LTD
RWE AG
Ryanair Holdings PLC
Safran SA
Sage Group PLC/The
Saipem SpA
Salzgitter AG
Sampo Oyj
Sandvik AB
Sanofi
SAP SE
Scania AB
Schneider Electric SE
Schroders PLC

126
Securitas AB
Segro PLC
SES SA
Severn Trent PLC
Shire PLC
Sibanye UK Ltd
Siemens AG
Skandinaviska Enskilda Banken AB
Skanska AB
SKF AB
Sky Ltd
Smith & Nephew PLC
Smiths Group PLC
Snam SpA
Societe Generale SA
Sodexo SA
Solvay SA
SSAB AB
SSE PLC
Standard Chartered PLC
Standard Life Aberdeen PLC
STMicroelectronics NV
Stora Enso Oyj
Suez SA
Svenska Cellulosa AB SCA
Svenska Handelsbanken AB
SVF Holdco UK Ltd
Swatch Group AG/The
Swedbank AB
Swedish Match AB
Swiss Life Holding AG
Swiss Reinsurance Co Ltd
Swisscom AG
Syngenta AG
Tate & Lyle PLC
Technicolor SA
Technip SA
Tele2 AB
Telecom Italia SpA/Milano
Telefonaktiebolaget LM Ericsson
Telefonica SA
Telekom Austria AG
Telenor ASA
Television Francaise 1
Telia Co AB
Tesco PLC

127
Thales SA
Thomson Reuters UK Ltd
thyssenkrupp AG
TotalEnergies SE
TUI AG
UBM PLC
UBS AG
UCB SA
Umicore SA
Unibail-Rodamco-Westfield SE
UniCredit SpA
Unilever PLC
Union Fenosa SA
Unione di Banche Italiane SpA
United Utilities Group PLC
Unity Software Inc
Universal Display Corp
UPM-Kymmene Oyj
Valassis Direct Mail Inc
Valeo SA
Vallourec SA
Veolia Environnement SA
Vestas Wind Systems A/S
Vesuvius PLC
Vinci SA
Vivendi SE
Vodafone Group PLC
voestalpine AG
Volkswagen AG
Volvo AB
WH Smith PLC
Whitbread PLC
William Hill PLC
Wm Morrison Supermarkets PLC
WPP PLC
Xstrata Ltd
Yara International ASA
Zurich Insurance Group AG
S&P JP 150
Advantest Corp
Aeon Co Ltd
AGC Inc
Ajinomoto Co Inc
ANA Holdings Inc
Asahi Group Holdings Ltd
Asahi Kasei Corp

128
Astellas Pharma Inc
Bridgestone Corp
Canon Inc
Central Japan Railway Co
Chubu Electric Power Co Inc
Credit Saison Co Ltd
Dai Nippon Printing Co Ltd
Daiichi Sankyo Co Ltd
Daikin Industries Ltd
Daiwa House Industry Co Ltd
Daiwa Securities Group Inc
Denso Corp
Dentsu Group Inc
East Japan Railway Co
Eisai Co Ltd
ENEOS Corp
FANUC Corp
FUJIFILM Holdings Corp
Fujikura Ltd
Fujitsu Ltd
Furukawa Electric Co Ltd
Hirose Electric Co Ltd
Hitachi Ltd
Honda Motor Co Ltd
Hoya Corp
ITOCHU Corp
Japan Airlines Corp
Japan Tobacco Inc
JFE Holdings Inc
JSR Corp
Kajima Corp
Kansai Electric Power Co Inc/The
Kao Corp
Kawasaki Heavy Industries Ltd
Keyence Corp
Kintetsu Group Holdings Co Ltd
Kirin Holdings Co Ltd
Kobe Steel Ltd
Komatsu Ltd
Konica Minolta Inc
Kubota Corp
Kuraray Co Ltd
Kyocera Corp
Kyushu Electric Power Co Inc
Lixil Corp
Marubeni Corp

129
Marui Group Co Ltd
Mitsubishi Chemical Holdings Corp
Mitsubishi Corp
Mitsubishi Electric Corp
Mitsubishi Estate Co Ltd
Mitsubishi Heavy Industries Ltd
Mitsubishi Materials Corp
Mitsubishi UFJ Financial Group Inc
Mitsui & Co Ltd
Mitsui Chemicals Inc
Mitsui Fudosan Co Ltd
Mitsui Mining & Smelting Co Ltd
Mitsui OSK Lines Ltd
Mizuho Financial Group Inc
MS&AD Insurance Group Holdings Inc
Murata Manufacturing Co Ltd
NEC Corp
NGK Insulators Ltd
NH Foods Ltd
Nikon Corp
Nintendo Co Ltd
Nippon Express Co Ltd
Nippon Paper Group Inc
Nippon Steel Corp
Nippon Telegraph & Telephone Corp
Nippon Television Holdings Inc
Nippon Yusen KK
Nipponkoa Insurance Co Ltd
Nissan Motor Co Ltd
Nissin Foods Holdings Co Ltd
Nitto Denko Corp
NOK Corp
Nomura Holdings Inc
NSK Ltd
NTT Data Corp
NTT DOCOMO Inc
Obayashi Corp
Odakyu Electric Railway Co Ltd
Oji Holdings Corp
Oriental Land Co Ltd/Japan
ORIX Corp
Osaka Gas Co Ltd
Panasonic Corp
Panasonic Electric Works Co Ltd
Pioneer Corp
Ricoh Co Ltd

130
Rohm Co Ltd
Sanyo Electric Co Ltd
Secom Co Ltd
Sekisui House Ltd
Seven & i Holdings Co Ltd
Sharp Corp/Japan
Shimizu Corp
Shin-Etsu Chemical Co Ltd
Shinsei Bank Ltd
Shiseido Co Ltd
SMBC Consumer Finance Co Ltd
SMC Corp
SoftBank Group Corp
Sompo Japan Insurance Inc/Old
Sony Group Corp
Sumitomo Chemical Co Ltd
Sumitomo Corp
Sumitomo Electric Industries Ltd
Sumitomo Metal Industries Ltd
Sumitomo Metal Mining Co Ltd
Sumitomo Mitsui Financial Group Inc
Sumitomo Mitsui Trust Bank Ltd
Sumitomo Realty & Development Co Ltd
Suzuki Motor Corp
T&D Holdings Inc
Taisei Corp
Taisho Pharmaceutical Co Ltd
Takeda Pharmaceutical Co Ltd
TDK Corp
Teijin Ltd
Terumo Corp
TFK Co Ltd
Tokio Marine Holdings Inc
Tokyo Electric Power Co Holdings Inc
Tokyo Electron Ltd
Tokyo Gas Co Ltd
Tokyu Corp
TonenGeneral Sekiyu KK
Toppan Printing Co Ltd
Toray Industries Inc
Toshiba Corp
TOTO Ltd
Toyo Seikan Group Holdings Ltd
Toyota Industries Corp
Toyota Motor Corp
Unicharm Corp

131
West Japan Railway Co
Yakult Honsha Co Ltd
Yamada Holdings Co Ltd
Yamato Holdings Co Ltd
Z Holdings Corp
S&P LA 40
Alfa SAB de CV
Ambev SA
America Movil SAB de CV
Aracruz Celulose SA
Banco Bradesco SA
Banco de Chile
Banco Santander Chile
Brasil Telecom Participacoes SA
Cemex SAB de CV
Centrais Eletricas Brasileiras SA
Cia Energetica de Minas Gerais
Cia Paranaense de Energia
Cia Siderurgica Nacional SA
Cyrela Brazil Realty SA Empreendimentos e Participacoes
Embraer SA
Empresas CMPC SA
Empresas COPEC SA
Enel Americas SA
Enel Generacion Chile SA
Falabella SA
Fomento Economico Mexicano SAB de CV
Gerdau SA
Grupo Carso SAB de CV
Grupo Modelo SAB de CV
Grupo Televisa SAB
Itau Unibanco Holding SA
Kimberly-Clark de Mexico SAB de CV
Latam Airlines Group SA
Petrobras Energia Participaciones SA
Petroleo Brasileiro SA
Sociedad Quimica y Minera de Chile SA
Tele Norte Leste Participacoes SA
Telefonos de Mexico SAB de CV
Tenaris SA
Unibanco - Uniao de Bancos Brasileiros SA
Vale SA
Wal-Mart de Mexico SAB de CV
Walmart Inc
S&P US 500
3M Co

132
Abbott Laboratories
Abercrombie & Fitch Co
Adobe Inc
Adtalem Global Education Inc
Affiliated Computer Services Inc
Air Products and Chemicals Inc
Akamai Technologies Inc
Alcoa Corp
Allegheny Technologies Inc
Allergan PLC
Allstate Corp/The
Alpha Appalachia Holdings LLC
Amazon.com Inc
Ameren Corp
American Electric Power Co Inc
American Express Co
American International Group Inc
Amgen Inc
Amphenol Corp
Andeavor
Aon PLC
APA Corp
Apartment Investment and Management Co
Apollo Education Group Inc
Apple Inc
Archer-Daniels-Midland Co
Autodesk Inc
Automatic Data Processing Inc
AutoNation Inc
AutoZone Inc
AvalonBay Communities Inc
Avery Dennison Corp
Avon Products Inc
Baker Hughes Holdings LLC
Bank of New York Mellon Corp/The
Baxter International Inc
Beam Therapeutics Inc
Best Buy Co Inc
Big Lots Inc
Biogen Inc
BJ Services Co
Black & Decker Corp/The
BMC Software Inc
Boston Properties Inc
Boston Scientific Corp
Bristol-Myers Squibb Co

133
Burlington Northern Santa Fe LLC
CA Inc
Cabot Oil & Gas Corp
Cameron International Corp
Capital One Financial Corp
Cardinal Health Inc
Caterpillar Inc
Celgene Corp
CenterPoint Energy Inc
Cephalon Inc
Charles Schwab Corp/The
Chesapeake Energy Corp
Chevron Corp
Chubb Corp/The
Cigna Corp
Cintas Corp
Cisco Systems Inc/Delaware
Citigroup Inc
Cleveland-Cliffs Inc
Clorox Co/The
Coca-Cola Co/The
Coca-Cola Europacific Partners PLC
Colgate-Palmolive Co
Comerica Inc
Consolidated Edison Inc
Constellation Brands Inc
Constellation Energy Group Inc
Corning Inc
Coventry Health Care Inc
CR Bard Inc
Cummins Inc
Danaher Corp
Darden Restaurants Inc
Dean Foods Co
Dell Technologies Inc
Devon Energy Corp
Diamond Offshore Drilling Inc
DIRECTV
Dominion Energy Inc
Dover Corp
Dow Inc
DR Horton Inc
DTE Energy Co
Duke Energy Corp
DuPont de Nemours Inc
Eastman Chemical Co

134
Eastman Kodak Co
Ecolab Inc
Edison International
Electronic Arts Inc
Eli Lilly & Co
EMC Corp
EMD Millipore Corp
Entergy Corp
EOG Resources Inc
EQT Corp
Equifax Inc
Equity Residential
Estee Lauder Cos Inc/The
ETC Sunoco Holdings LLC
Evernorth Health Inc
Eversource Energy
Exelon Corp
Expedia Group Inc
Expeditors International of Washington Inc
Exxon Mobil Corp
Fastenal Co
Federated Hermes Inc
FedEx Corp
Fifth Third Bancorp
First Horizon Corp
FirstEnergy Corp
Fiserv Inc
FLIR Systems Inc
Flowserve Corp
FMC Corp
Forest Road Acquisition Corp
Franklin Resources Inc
Freeport-McMoRan Inc
Frontier Communications Corp
Gap Inc/The
General Dynamics Corp
General Electric Co
Genuine Parts Co
Gilead Sciences Inc
Globe Life Inc
Goldman Sachs Group Inc/The
Goodyear Tire & Rubber Co/The
H&R Block Inc
Harman International Industries Inc
Hartford Financial Services Group Inc/The
Healthpeak Properties Inc

135
Hershey Co/The
Hess Corp
Hillshire Brands Co/The
Home Depot Inc/The
Honeywell International Inc
Hospira Inc
Host Hotels & Resorts Inc
HP Inc
Huntington Bancshares Inc/OH
Illinois Tool Works Inc
Intel Corp
Intercontinental Exchange Inc
International Business Machines Corp
International Flavors & Fragrances Inc
Intuitive Surgical Inc
Iron Mountain Inc
J M Smucker Co/The
Jabil Inc
Jacobs Engineering Group Inc
Jefferies Financial Group Inc
JPMorgan Chase & Co
Juniper Networks Inc
Keurig Dr Pepper Inc
Kimberly-Clark Corp
KLA Corp
Kohl's Corp
Kroger Co/The
L Brands Inc
Laboratory Corp of America Holdings
Leidos Holdings Inc
Lexmark International Inc
Lincoln National Corp
Linde Inc/CT
Lockheed Martin Corp
Loews Corp
Lorillard LLC
Lumen Technologies Inc
Macy's Inc
Marathon Oil Corp
Marsh & McLennan Cos Inc
Marshall & Ilsley Corp
Masco Corp
Mattel Inc
McCormick & Co Inc/MD
McKesson Corp
Mead Johnson Nutrition Co

136
Medco Health Solutions Inc
Medtronic PLC
Merck & Co Inc
MetLife Inc
Microsoft Corp
Molson Coors Beverage Co
Mondelez International Inc
Monster Worldwide Inc
Motorola Solutions Inc
Murphy Oil Corp
Mylan NV
Nabors Industries Ltd
National Semiconductor Corp
NextEra Energy Inc
Nicor Inc
NIKE Inc
NiSource Inc
Noble Energy Inc
Nordstrom Inc
Norfolk Southern Corp
Northern Trust Corp
Northrop Grumman Corp
NOV Inc
Nucor Corp
NVIDIA Corp
NYSE Euronext
ODP Corp/The
O-I Glass Inc
Old Copper Co Inc
O'Reilly Automotive Inc
Patterson Cos Inc
Paychex Inc
Peabody Energy Corp
People's United Financial Inc
Pepco Holdings LLC
PerkinElmer Inc
Pfizer Inc
PG&E Corp
Philip Morris International Inc
Piedmont Lithium Inc
Pitney Bowes Inc
Plum Creek Timber Co Inc
PNC Financial Services Group Inc/The
PPG Industries Inc
PPL Corp
Precision Castparts Corp

137
Principal Financial Group Inc
Procter & Gamble Co/The
Progressive Corp/The
Prudential Financial Inc
Public Service Enterprise Group Inc
Public Storage
Quest Diagnostics Inc
Ralph Lauren Corp
Raytheon Co
Raytheon Technologies Corp
Red Hat Inc
Regions Financial Corp
Republic Services Inc
Robert Half International Inc
Rockwell Automation Inc
Roper Technologies Inc
Rowan Cos Ltd
RS Legacy Corp
Safeway Inc
SanDisk LLC
SCANA Corp
Schlumberger NV
Sealed Air Corp
Sigma-Aldrich Corp
Simon Property Group Inc
Southern Co/The
Southwestern Energy Co
Spectra Energy LLC
Sprint Communications Inc
Sprint Corp
Stanley Black & Decker Inc
Staples Inc
Starbucks Corp
State Street Corp
Stericycle Inc
Stryker Corp
SunTrust Banks Inc
SUPERVALU Inc
Sysco Corp
Target Corp
TECO Energy Inc
Teradata Corp
Teradyne Inc
Textron Inc
Tiffany & Co
Time Warner Inc

138
TJX Cos Inc/The
Total System Services Inc
Travel + Leisure Co
Travelers Cos Inc/The
Truist Financial Corp
Tyson Foods Inc
United Parcel Service Inc
United States Steel Corp
UnitedHealth Group Inc
Unum Group
US Bancorp
VeriSign Inc
Verizon Communications Inc
VF Corp
Viacom Inc
ViacomCBS Inc
Viavi Solutions Inc
Vornado Realty Trust
Walgreens Boots Alliance Inc
Walt Disney Co/The
Waste Management Inc
Waters Corp
WEC Energy Group Inc
Wells Fargo & Co
Welltower Inc
Western Union Co/The
Weyerhaeuser Co
Whirlpool Corp
Williams Cos Inc/The
Xcel Energy Inc
Xerox Holdings Corp
XL Fleet Corp
XTO Energy Inc
Zimmer Biomet Holdings Inc
Zions Bancorp NA

139
References
Abbott, W. F., & Monsen, R. J. (1979). On the measurement of corporate social responsibility: Self-reported disclosures as a method of measuring corporate social involvement. Academy of management journal, 22(3), 501-515.
Abdi, H., Kacem, H., & Omri, M. A. B. (2018). Determinants of Web-based disclosure in the Middle East. Journal of Financial Reporting and Accounting.
Ahn, S. C., & Schmidt, P. (1995). Efficient estimation of models for dynamic panel data. Journal of econometrics, 68(1), 5-28.
Ali, W., Frynas, J. G., & Mahmood, Z. (2017). Determinants of corporate social responsibility (CSR) disclosure in developed and developing countries: a literature review. Corporate Social Responsibility and Environmental Management, 24(4), 273-294.
Andrikopoulos, A., & Kriklani, N. (2013). Environmental disclosure and financial characteristics of the firm: The case of Denmark. Corporate Social Responsibility and Environmental Management, 20(1), 55-64.
Arayssi, M., Dah, M., & Jizi, M. (2016). Women on boards, sustainability reporting and firm performance. Sustainability Accounting, Management and Policy Journal.
Archel, P., Husillos, J., Larrinaga, C., & Spence, C. (2009). Social disclosure, legitimacy theory and the role of the state. Accounting, auditing & accountability journal.
Arellano, M., & Bover, O. (1995). Another look at the instrumental variable estimation of error-components models. Journal of econometrics, 68(1), 29-51.
Arena, C., Liong, R., & Vourvachis, P. (2018). Carrot or stick: CSR disclosures by Southeast Asian companies. Sustainability Accounting, Management and Policy Journal, 9(4), 422-454.
Arvidsson, S. (2011). Disclosure of non-financial information in the annual report: A management-team perspective. Journal of intellectual capital, 12(2), 277-300.
Arvidsson, S. (2019). An exposé of the challenging practice development of sustainability reporting: From the first wave to the EU Directive (2014/95/EU). In Challenges in Managing Sustainable Business (pp. 3-24): Springer.
Austin, P. C. (2017). Double propensity-score adjustment: a solution to design bias or bias due to incomplete matching. Statistical methods in medical research, 26(1), 201-222.
Baldini, M., Dal Maso, L., Liberatore, G., Mazzi, F., & Terzani, S. (2018). Role of country-and firm-level determinants in environmental, social, and governance disclosure. Journal of Business Ethics, 150(1), 79-98.
Baltagi, B. (2008). Econometric analysis of panel data: John Wiley & Sons. Baron, D. P., Harjoto, M. A., & Jo, H. (2011). The economics and politics of corporate social
performance. Business and Politics, 13(2), 1-46. Barone, M. J., Miyazaki, A. D., & Taylor, K. A. (2000). The influence of cause-related marketing on
consumer choice: does one good turn deserve another? Journal of the academy of marketing Science, 28(2), 248-262.
Barron, O. E., Stanford, M. H., & Yu, Y. (2009). Further evidence on the relation between analysts' forecast dispersion and stock returns. Contemporary Accounting Research, 26(2), 329-357.
Bauer, R., & Hann, D. (2010). Corporate environmental management and credit risk. Becchetti, L., Ciciretti, R., & Hasan, I. (2015). Corporate social responsibility, stakeholder risk, and
idiosyncratic volatility. Journal of Corporate Finance, 35, 297-309. Benjamin, S. J., Regasa, D. G., Wellalage, N. H., & M Marathamuthu, M. S. (2020). Waste disclosure
and corporate cash holdings. Applied Economics, 52(49), 5399-5412. Benlemlih, M., & Girerd‐Potin, I. (2017). Corporate social responsibility and firm financial risk
reduction: On the moderating role of the legal environment. Journal of Business Finance & Accounting, 44(7-8), 1137-1166.

140
Benlemlih, M., Shaukat, A., Qiu, Y., & Trojanowski, G. (2018). Environmental and social disclosures and firm risk. Journal of Business Ethics, 152(3), 613-626.
Bernardi, C., & Stark, A. W. (2018). Environmental, social and governance disclosure, integrated reporting, and the accuracy of analyst forecasts. The British Accounting Review, 50(1), 16-31.
Bhattacharya, A., & Singh, P. J. (2018). Antecedents of agency problems in service outsourcing. International Journal of Production Research, 1-17.
Bhattacharya, U., Daouk, H., & Welker, M. (2003). The world price of earnings opacity. The accounting review, 78(3), 641-678.
Bhattacharyya, A., & Yang, H. (2019). Biodiversity disclosure in Australia: effect of GRI and institutional factors. Australasian Journal of Environmental Management, 26(4), 347-369.
Blundell, R., & Bond, S. (1998). Initial conditions and moment restrictions in dynamic panel data models. Journal of econometrics, 87(1), 115-143.
Borghei, Z., Leung, P., & Guthrie, J. (2018). Does voluntary greenhouse gas emissions disclosure reduce information asymmetry? Australian evidence. Afro-Asian Journal of Finance and Accounting, 8(2), 123-147.
Bouslah, K., Kryzanowski, L., & M’Zali, B. (2013). The impact of the dimensions of social performance on firm risk. Journal of Banking & Finance, 37(4), 1258-1273.
Bowen, H. R. (1953). Social responsibilities of the businessman: University of Iowa Press. Bowman, E. H., & Haire, M. (1975). A strategic posture toward corporate social responsibility.
California management review, 18(2), 49-58. Boyer-Allirol, B., & Barbu, E. (2017). Should European environmental law be strengthened? Revue
internationale de droit economique, 31(3), 109-124. Bozzolan, S., Favotto, F., & Ricceri, F. (2003). Italian annual intellectual capital disclosure. Journal of
intellectual capital. Branco, M. C., & Rodrigues, L. L. (2007). Positioning stakeholder theory within the debate on
corporate social responsibility. Electronic Journal of Business Ethics and Organization Studies.
Branco, M. C., & Rodrigues, L. L. (2008). Factors influencing social responsibility disclosure by Portuguese companies. Journal of Business Ethics, 83(4), 685-701.
Brown, T. J., & Dacin, P. A. (1997). The company and the product: Corporate associations and consumer product responses. The Journal of Marketing, 68-84.
Buchanan, B., Cao, C. X., & Chen, C. (2018). Corporate social responsibility, firm value, and influential institutional ownership. Journal of Corporate Finance, 52, 73-95.
Burgman, R., Roos, G., Boldt-Christmas, L., & Pike, S. (2007). Information needs of internal and external stakeholders and how to respond: reporting on operations and intellectual capital. International Journal of Accounting, Auditing and Performance Evaluation, 4(4-5), 529-546.
Cahaya, F. R., Porter, S., Tower, G., & Brown, A. (2015). The Indonesian Government’s coercive pressure on labour disclosures. Sustainability Accounting, Management and Policy Journal.
Cai, L., Cui, J., & Jo, H. (2016). Corporate environmental responsibility and firm risk. Journal of Business Ethics, 139(3), 563-594.
Cameron, A. C., & Trivedi, P. K. (2005). Microeconometrics: methods and applications. In (pp. 703): Cambridge university press.
Camilleri. (2015). Environmental, social and governance disclosures in Europe. Sustainability Accounting, Management and Policy Journal, 6(2), 224-242.
Carroll, A. B. (1979). A three-dimensional conceptual model of corporate performance. Academy of management review, 4(4), 497-505.
Caruana, R., & Crane, A. (2008). Constructing consumer responsibility: Exploring the role of corporate communications. Organization Studies, 29(12), 1495-1519.
CED. (1971). Social responsibilities of business corporations: The Committee. Chang, K., Kim, I., & Li, Y. (2014). The heterogeneous impact of corporate social responsibility
activities that target different stakeholders. Journal of Business Ethics, 125(2), 211-234.

141
Chen, K. H., & Metcalf, R. W. (1980). The relationship between pollution control record and financial indicators revisited. The accounting review, 55(1), 168-177.
Chien, Y.-T., & Lu, H.-M. (2015). Firm websites and the risk of firm. Industrial Management & Data Systems, 115(3), 504-520.
Chiu, T.-K., & Wang, Y.-H. (2015). Determinants of social disclosure quality in Taiwan: An application of stakeholder theory. Journal of Business Ethics, 129(2), 379-398.
Cho, S. Y., Lee, C., & Pfeiffer Jr, R. J. (2013). Corporate social responsibility performance and information asymmetry. Journal of Accounting and Public Policy, 32(1), 71-83.
Chopra, S., & Wu, P.-J. (2016). Eco-activities and operating performance in the computer and electronics industry. European Journal of Operational Research, 248(3), 971-981.
Chung, H. Y., & Kim, J. B. (1994). THE USE OF MULTIPLE INSTRUMENTS FOR MEASUREMENT OF EARNINGS FORECAST ERRORS, FIRM SIZE EFFECT AND THE QUALITY OF ANALYSTS’FORECAST ERRORS. Journal of Business Finance & Accounting, 21(5), 707-727.
Cochran, P. L., & Wood, R. A. (1984). Corporate social responsibility and financial performance. Academy of management journal, 27(1), 42-56.
Coluccia, D., Fontana, S., & Solimene, S. (2016). Disclosure of corporate social responsibility: a comparison between traditional and digital reporting. An empirical analysis on Italian listed companies. International Journal of Managerial and Financial Accounting, 8(3-4), 230-246.
Cormier, D., Ledoux, M.-J., & Magnan, M. (2011). The informational contribution of social and environmental disclosures for investors. Management Decision, 49(8), 1276-1304.
Cormier, D., & Magnan, M. (1999). Corporate environmental disclosure strategies: determinants, costs and benefits. Journal of Accounting, Auditing & Finance, 14(4), 429-451.
Cormier, D., & Magnan, M. (2014). The impact of social responsibility disclosure and governance on financial analysts’ information environment. Corporate Governance, 14(4), 467-484.
Cormier, D., & Magnan, M. (2015). The economic relevance of environmental disclosure and its impact on corporate legitimacy: An empirical investigation. Business Strategy and the Environment, 24(6), 431-450.
Cortesi, A., & Vena, L. (2019). Disclosure quality under integrated reporting: A Value Relevance Approach. Journal of cleaner production, 220, 745-755.
Cosset, J.-C., Somé, H. Y., & Valéry, P. (2016). Does competition matter for corporate governance? The role of country characteristics. Journal of Financial and Quantitative analysis, 51(4), 1231-1267.
Crisóstomo, V. L., de Azevedo Prudêncio, P., & Forte, H. C. (2017). An analysis of the adherence to GRI for disclosing information on social action and sustainability concerns. In Advances in Environmental Accounting & Management: Social and Environmental Accounting in Brazil: Emerald Publishing Limited.
Crouch, C. (2006). Modelling the firm in its market and organizational environment: Methodologies for studying corporate social responsibility. Organization Studies, 27(10), 1533-1551.
Cui, J., Jo, H., & Na, H. (2018). Does corporate social responsibility affect information asymmetry? Journal of Business Ethics, 148(3), 549-572.
Cuong. (2013). Which covariates should be controlled in propensity score matching? Evidence from a simulation study. Statistica Neerlandica, 67(2), 169-180.
Davis, K. (1960). Can business afford to ignore social responsibilities? California management review, 2(3), 70-76.
De Klerk, M., De Villiers, C., & Van Staden, C. (2015). The influence of corporate social responsibility disclosure on share prices. Pacific Accounting Review.
Del Bosco, B., & Misani, N. (2016). The effect of cross-listing on the environmental, social, and governance performance of firms. Journal of World Business, 51(6), 977-990.
Demir, M., & Min, M. (2019). Consistencies and discrepancies in corporate social responsibility reporting in the pharmaceutical industry. Sustainability Accounting, Management and Policy Journal.

142
Dhaliwal, Li, Tsang, & Yang. (2011). Voluntary nonfinancial disclosure and the cost of equity capital: The initiation of corporate social responsibility reporting. The accounting review, 86(1), 59-100.
Dhaliwal, Li, O. Z., Tsang, A., & Yang, Y. G. (2014). Corporate social responsibility disclosure and the cost of equity capital: The roles of stakeholder orientation and financial transparency. Journal of Accounting and Public Policy, 33(4), 328-355.
Dhaliwal, Radhakrishnan, Tsang, & Yang. (2012). Nonfinancial disclosure and analyst forecast accuracy: International evidence on corporate social responsibility disclosure. The accounting review, 87(3), 723-759.
Diamond, D. W., & Verrecchia, R. E. (1991). Disclosure, liquidity, and the cost of capital. The journal of finance, 46(4), 1325-1359.
Dichev, I. D., & Tang, V. W. (2009). Earnings volatility and earnings predictability. Journal of accounting and economics, 47(1-2), 160-181.
Diether, K. B., Malloy, C. J., & Scherbina, A. (2002). Differences of opinion and the cross section of stock returns. The journal of finance, 57(5), 2113-2141.
Directives. (2014). Directive 2014/95/eu of the European parliament and of the council. Retrieved from https://eur-lex.europa.eu/legal-content/EN/TXT/PDF/?uri=CELEX:32014L0095&from=EN
Donaldson, T., & Dunfee, T. W. (1999). Ties that bind: A social contracts approach to business ethics. Driscoll, J. C., & Kraay, A. C. (1998). Consistent covariance matrix estimation with spatially dependent
panel data. Review of economics and statistics, 80(4), 549-560. Drucker, P. F. (1984). Converting social problems into business opportunities: The new meaning of
corporate social responsibility. California Management Review (pre-1986), 26(000002), 53. Du, S., & Vieira, E. T. (2012). Striving for legitimacy through corporate social responsibility: Insights
from oil companies. Journal of Business Ethics, 110(4), 413-427. Dumitru, M., Dyduch, J., Gușe, R.-G., & Krasodomska, J. (2017). Corporate reporting practices in
Poland and Romania–an ex-ante study to the new non-financial reporting European Directive. Accounting in Europe, 14(3), 279-304.
Easley, D., & O'hara, M. (2004). Information and the cost of capital. The journal of finance, 59(4), 1553-1583.
Eccles, R. G., Serafeim, G., & Krzus, M. P. (2011). Market interest in nonfinancial information. Journal of Applied Corporate Finance, 23(4), 113-127.
Eichenbaum, M. S., Hansen, L. P., & Singleton, K. J. (1988). A time series analysis of representative agent models of consumption and leisure choice under uncertainty. The Quarterly Journal of Economics, 103(1), 51-78.
Elliott, R. K., & Jacobson, P. D. (1994). Costs and benefits of business information. Accounting horizons, 8(4), 80-96.
Emma, G.-M., & Jennifer, M.-F. (2021). Is SDG reporting substantial or symbolic? An examination of controversial and environmentally sensitive industries. Journal of cleaner production, 298, 126781.
Erragragui, E. (2018). Do creditors price firms’ environmental, social and governance risks? Research in International Business and Finance, 45, 197-207.
Espahbodi, R., Dugar, A., & Tehranian, H. (2001). Further evidence on optimism and underreaction in analysts' forecasts. Review of Financial Economics, 10(1), 1-21.
Fahad, P., & Nidheesh, K. (2020). Determinants of CSR disclosure: an evidence from India. Journal of Indian Business Research.
Fallan, E., & Fallan, L. (2019). Corporate tax behaviour and environmental disclosure: Strategic trade-offs across elements of CSR? Scandinavian Journal of Management, 101042.
Fama, E. F., & French, K. R. (1998). Value versus growth: The international evidence. The journal of finance, 53(6), 1975-1999.

143
Fanasch, P., & Frick, B. (2020). The value of signals: Do self-declaration and certification generate price premiums for organic and biodynamic wines? Journal of cleaner production, 249, 119415.
Felber, C., Campos, V., & Sanchis, J. R. (2019). The common good balance sheet, an adequate tool to capture non-financials? Sustainability, 11(14), 3791.
Flores, E., Fasan, M., Mendes‐da‐Silva, W., & Sampaio, J. O. (2019). Integrated reporting and capital markets in an international setting: The role of financial analysts. Business Strategy and the Environment, 28(7), 1465-1480.
Frank, D. H., & Obloj, T. (2014). Firm‐specific human capital, organizational incentives, and agency costs: Evidence from retail banking. Strategic management journal, 35(9), 1279-1301.
Freeman, R. E. (2010). Strategic management: A stakeholder approach: Cambridge university press. Gamerschlag, R., Möller, K., & Verbeeten, F. (2011). Determinants of voluntary CSR disclosure:
empirical evidence from Germany. Review of Managerial Science, 5(2-3), 233-262. Gangi, F., Meles, A., Monferrà, S., & Mustilli, M. (2018). Does corporate social responsibility help the
survivorship of SMEs and large firms? Global Finance Journal. García-Sánchez, I.-M., Suárez-Fernández, O., & Martínez-Ferrero, J. (2019). Female directors and
impression management in sustainability reporting. International Business Review, 28(2), 359-374.
García‐Sánchez, I. M., Gómez‐Miranda, M. E., David, F., & Rodríguez‐Ariza, L. (2019). Analyst coverage and forecast accuracy when CSR reports improve stakeholder engagement: The Global Reporting Initiative‐International Finance Corporation disclosure strategy. Corporate Social Responsibility and Environmental Management, 26(6), 1392-1406.
Garcia, A. S., Mendes-Da-Silva, W., & Orsato, R. J. (2017). Sensitive industries produce better ESG performance: Evidence from emerging markets. Journal of cleaner production, 150, 135-147.
Garrido‐Miralles, P., Zorio‐Grima, A., & García‐Benau, M. A. (2016). Sustainable development, stakeholder engagement and analyst forecasts’ accuracy: Positive evidence from the Spanish setting. Sustainable Development, 24(2), 77-88.
Gerwanski, J. Does it pay off? Integrated reporting and cost of debt: European evidence. Corporate Social Responsibility and Environmental Management.
Gilbert, S. (2002). The transparency evolution. Paper presented at the Environmental Forum. Godfrey, P. C. (2005). The relationship between corporate philanthropy and shareholder wealth: A
risk management perspective. Academy of management review, 30(4), 777-798. Godfrey, P. C., Merrill, C. B., & Hansen, J. M. (2009). The relationship between corporate social
responsibility and shareholder value: An empirical test of the risk management hypothesis. Strategic management journal, 30(4), 425-445.
Graham, A., & Maher, J. J. (2006). Environmental liabilities, bond ratings, and bond yields. In Environmental Accounting (pp. 111-142): Emerald Group Publishing Limited.
Graham, A., Maher, J. J., & Northcut, W. D. (2001). Environmental liability information and bond ratings. Journal of Accounting, Auditing & Finance, 16(2), 93-116.
Greening, D. W., & Turban, D. B. (2000). Corporate social performance as a competitive advantage in attracting a quality workforce. Business & Society, 39(3), 254-280.
Gregoriou, A., Ioannidis, C., & Skerratt, L. (2005). Information Asymmetry and the Bid‐Ask Spread: Evidence From the UK. Journal of Business Finance & Accounting, 32(9‐10), 1801-1826.
Grougiou, V., Dedoulis, E., & Leventis, S. (2016). Corporate social responsibility reporting and organizational stigma: The case of “sin” industries. Journal of Business Research, 69(2), 905-914.
Gujarati, D. N. (2009). Basic econometrics: Tata McGraw-Hill Education. Guo, S., & Fraser, M. W. (2014). Propensity score analysis: Statistical methods and applications (Vol.
11): SAGE publications.

144
Han, J.-J., Kim, H. J., & Yu, J. (2016). Empirical study on relationship between corporate social responsibility and financial performance in Korea. Asian Journal of Sustainability and Social Responsibility, 1(1), 61.
Handelman, J. M., & Arnold, S. J. (1999). The role of marketing actions with a social dimension: Appeals to the institutional environment. The Journal of Marketing, 33-48.
Hassan, A., Adhikariparajuli, M., Fletcher, M., & Elamer, A. (2019). Integrated reporting in UK higher education institutions. Sustainability Accounting, Management and Policy Journal.
Hassan, O., & Giorgioni, G. (2019). The impact of corruption on analyst coverage. Managerial Auditing Journal.
Hassan, O. A. (2018). The impact of voluntary environmental disclosure on firm value: Does organizational visibility play a mediation role? Business Strategy and the Environment, 27(8), 1569-1582.
Hoffmann, E., Dietsche, C., & Hobelsberger, C. (2018). Between mandatory and voluntary: non-financial reporting by German companies. Paper presented at the NachhaltigkeitsManagementForum| Sustainability Management Forum.
Hope, O. K. (2003). Disclosure practices, enforcement of accounting standards, and analysts' forecast accuracy: An international study. Journal of accounting research, 41(2), 235-272.
Huang, & Kung, F.-H. (2010). Drivers of environmental disclosure and stakeholder expectation: Evidence from Taiwan. Journal of Business Ethics, 96(3), 435-451.
Iatridis, G. E. (2015). Corporate philanthropy in the US stock market: Evidence on corporate governance, value relevance and earnings manipulation. International Review of Financial Analysis, 39, 113-126.
Iatridis, G. E. (2016). Financial reporting language in financial statements: Does pessimism restrict the potential for managerial opportunism? International Review of Financial Analysis, 45, 1-17.
IIRC. (2011). Towards integrated reporting: Communicating value in the 21st century. Author, London.
Ioannou, I., & Serafeim, G. (2011). The Consequences of Mandatory Corporate Sustainability Reporting.
Ioannou, I., & Serafeim, G. (2012). What drives corporate social performance? The role of nation-level institutions. Journal of International Business Studies, 43(9), 834-864.
Ioannou, I., & Serafeim, G. (2015). The impact of corporate social responsibility on investment recommendations: Analysts' perceptions and shifting institutional logics. Strategic management journal, 36(7), 1053-1081.
Ioannou, I., & Serafeim, G. (2017). The consequences of mandatory corporate sustainability reporting. Harvard Business School research working paper(11-100).
Ismail, T. H., & El‐Shaib, N. M. (2012). Impact of market and organizational determinants on voluntary disclosure in Egyptian companies. Meditari Accountancy Research.
Jain, A., Keneley, M., & Thomson, D. (2015). Voluntary CSR disclosure works! Evidence from Asia-Pacific banks. Social Responsibility Journal, 11(1), 2-18.
Jensen, M. C., & Meckling, W. H. (1976). Theory of the firm: Managerial behavior, agency costs and ownership structure. Journal of financial economics, 3(4), 305-360.
Jensen, M. C., & Meckling, W. H. (1979). Theory of the firm: Managerial behavior, agency costs, and ownership structure. In Economics social institutions (pp. 163-231): Springer.
Jo, H., & Harjoto, M. A. (2011). Corporate governance and firm value: The impact of corporate social responsibility. Journal of Business Ethics, 103(3), 351-383.
Jo, H., & Harjoto, M. A. (2012). The causal effect of corporate governance on corporate social responsibility. Journal of Business Ethics, 106(1), 53-72.
Jo, H., & Na, H. (2012). Does CSR reduce firm risk? Evidence from controversial industry sectors. Journal of Business Ethics, 110(4), 441-456.
Johnson. (1971). Business in contemporary society: Framework and issues: Wadsworth Pub. Co.
145
Johnson. (2004). Forecast dispersion and the cross section of expected returns. The journal of finance, 59(5), 1957-1978.
Kaplan, S. E., & Ruland, R. G. (1991). Positive theory, rationality and accounting regulation (Vol. 2). Kartadjumena, E., & Rodgers, W. (2019). Executive compensation, sustainability, climate,
environmental concerns, and company financial performance: Evidence from Indonesian commercial banks. Sustainability, 11(6), 1673.
Kassinis, G. I., & Soteriou, A. C. (2003). Greening the service profit chain: The impact of environmental management practices. Production and operations Management, 12(3), 386-403.
Khan, A., Muttakin, M. B., & Siddiqui, J. (2013). Corporate governance and corporate social responsibility disclosures: Evidence from an emerging economy. Journal of Business Ethics, 114(2), 207-223.
Kilian, T., & Hennigs, N. (2014). Corporate social responsibility and environmental reporting in controversial industries. European Business Review, 26(1), 79-101.
Kim, O., & Verrecchia, R. E. (1994). Market liquidity and volume around earnings announcements. Journal of accounting and economics, 17(1-2), 41-67.
Konar, S., & Cohen, M. A. (2001). Does the market value environmental performance? Review of economics and statistics, 83(2), 281-289.
Korca, B., & Costa, E. (2021). Directive 2014/95/EU: building a research agenda. Journal of Applied Accounting Research.
Kothari, S. P., Li, X., & Short, J. E. (2009). The effect of disclosures by management, analysts, and business press on cost of capital, return volatility, and analyst forecasts: A study using content analysis. The accounting review, 84(5), 1639-1670.
La Torre, M., Sabelfeld, S., Blomkvist, M., Tarquinio, L., & Dumay, J. (2018). Harmonising non-financial reporting regulation in Europe: Practical forces and projections for future research. Meditari Accountancy Research.
Lambert, R., Leuz, C., & Verrecchia, R. E. (2007). Accounting information, disclosure, and the cost of capital. Journal of accounting research, 45(2), 385-420.
Landi, G., & Sciarelli, M. (2019). Towards a more ethical market: the impact of ESG rating on corporate financial performance. Social Responsibility Journal, 15(1), 11-27.
Lang, M. H., & Lundholm, R. J. (1996). Corporate disclosure policy and analyst behavior. Accounting Review, 467-492.
Lee, & Yeo, G. H.-H. (2016). The association between integrated reporting and firm valuation. Review of Quantitative Finance and Accounting, 47(4), 1221-1250.
Lee, D. (2017). Corporate social responsibility and management forecast accuracy. Journal of Business Ethics, 140(2), 353-367.
Lee, K., & Lee, H. (2019). How does CSR activity affect sustainable growth and value of corporations? Evidence from Korea. Sustainability, 11(2), 508.
Leopizzi, R., Iazzi, A., Venturelli, A., & Principale, S. (2020). Nonfinancial risk disclosure: The “state of the art” of Italian companies. Corporate Social Responsibility and Environmental Management, 27(1), 358-368.
Li, M.-Y., & Wu, J.-S. (2014). Analysts’ forecast dispersion and stock returns: A quantile regression approach. Journal of Behavioral Finance, 15(3), 175-183.
Lins, K. V., Servaes, H., & Tamayo, A. (2017). Social capital, trust, and firm performance: The value of corporate social responsibility during the financial crisis. The journal of finance, 72(4), 1785-1824.
Liu, X., & Anbumozhi, V. (2009). Determinant factors of corporate environmental information disclosure: an empirical study of Chinese listed companies. Journal of cleaner production, 17(6), 593-600.
Liu, Y., Wei, Z., & Xie, F. (2014). Do women directors improve firm performance in China? Journal of Corporate Finance, 28, 169-184.

146
Lu, L. Y., Shailer, G., & Yu, Y. (2017). Corporate social responsibility disclosure and the value of cash holdings. European Accounting Review, 26(4), 729-753.
Lueg, K., Krastev, B., & Lueg, R. (2019). Bidirectional effects between organizational sustainability disclosure and risk. Journal of cleaner production, 229, 268-277.
Maaloul, A., Ben Amar, W., & Zeghal, D. (2016). Voluntary disclosure of intangibles and analysts’ earnings forecasts and recommendations. Journal of Applied Accounting Research, 17(4), 421-439.
Manes-Rossi, F., Tiron-Tudor, A., Nicolò, G., & Zanellato, G. (2018). Ensuring more sustainable reporting in Europe using non-financial disclosure—De facto and de jure evidence. Sustainability, 10(4), 1162.
Manne, H. G., & Wallich, H. (1972). The modern corporation and social responsibility. Books. Martínez-Ferrero, J., Rodríguez-Ariza, L., García-Sánchez, I.-M., & Cuadrado-Ballesteros, B. (2017).
Corporate social responsibility disclosure and information asymmetry: the role of family ownership. Review of Managerial Science, 1-32.
Martínez-Ferrero, J., Rodríguez-Ariza, L., García-Sánchez, I.-M., & Cuadrado-Ballesteros, B. (2018). Corporate social responsibility disclosure and information asymmetry: the role of family ownership. Review of Managerial Science, 12(4), 885-916.
Martínez‐Ferrero, J., Ruiz‐Cano, D., & García‐Sánchez, I. M. (2016). The causal link between sustainable disclosure and information asymmetry: The moderating role of the stakeholder protection context. Corporate Social Responsibility and Environmental Management, 23(5), 319-332.
Matuszak, Ł., & Różańska, E. (2017). CSR disclosure in Polish-listed companies in the light of Directive 2014/95/EU requirements: Empirical evidence. Sustainability, 9(12), 2304.
McCaffrey, D. F., Griffin, B. A., Almirall, D., Slaughter, M. E., Ramchand, R., & Burgette, L. F. (2013). A tutorial on propensity score estimation for multiple treatments using generalized boosted models. Statistics in medicine, 32(19), 3388-3414.
McCaffrey, D. F., Ridgeway, G., & Morral, A. R. (2004). Propensity score estimation with boosted regression for evaluating causal effects in observational studies. Psychological methods, 9(4), 403.
McGuire, J. B., Sundgren, A., & Schneeweis, T. (1988). Corporate social responsibility and firm financial performance. Academy of management journal, 31(4), 854-872.
McKinsey, & Company. (2002). Governance is increasingly at the heart of investment decisions, new Mckinsey survey shows. Retrieved from https://www.iasplus.com/en/binary/resource/mckinsey.pdf
Michaels, A., & Grüning, M. (2017). Relationship of corporate social responsibility disclosure on information asymmetry and the cost of capital. Journal of Management Control, 28(3), 251-274.
Mohamed, H. H., Masih, M., & Bacha, O. I. (2015). Why do issuers issue Sukuk or conventional bond? Evidence from Malaysian listed firms using partial adjustment models. Pacific-Basin Finance Journal, 34, 233-252.
Moskowitz, M. (1972). Choosing socially responsible stocks. Business and Society Review, 1(1), 71-75. Mostafa, M. M. (2016). Egyptian consumers' willingness to pay for carbon-labeled products: A
contingent valuation analysis of socio-economic factors. Journal of cleaner production, 135, 821-828.
Mukherjee, A., & Nuñez, R. (2019). Doing well by doing good: can voluntary CSR reporting enhance financial performance? Journal of Indian Business Research.
Muslu, V., Mutlu, S., Radhakrishnan, S., & Tsang, A. (2019). Corporate social responsibility report narratives and analyst forecast accuracy. Journal of Business Ethics, 154(4), 1119-1142.
Nadeem, M. (2016). Intellectual capital and firm performance: evidence from developed, emerging and frontier markets of the world. Lincoln University,
147
Nanayakkara, M., & Colombage, S. (2019). Do investors in Green Bond market pay a premium? Global evidence. Applied Economics, 51(40), 4425-4437.
Nations, U. (2015). Paris Agreement. Retrieved from https://unfccc.int/sites/default/files/english_paris_agreement.pdf
Ness, K. E., & Mirza, A. (1991). Corporate social disclosure: A note on a test of agency theory. The British Accounting Review, 23(3), 211-217.
Nguyen, Agbola, F. W., & Choi, B. (2016). Does corporate social responsibility reduce information asymmetry? Empirical evidence from Australia. Australian Journal of Management, 0312896218797163.
Nguyen, & Nguyen. (2015). The effect of corporate social responsibility on firm risk. Social Responsibility Journal, 11(2), 324-339.
Nguyen, & Nguyen, A. (2015). The effect of corporate social responsibility on firm risk. Social Responsibility Journal, 11(2), 324-339.
Nollet, J., Filis, G., & Mitrokostas, E. (2016). Corporate social responsibility and financial performance: A non-linear and disaggregated approach. Economic Modelling, 52, 400-407.
O'Bannon, D., & Preston, L. (1993). Corporate social responsibility and firm financial performance relationships: A typology and analysis of possible relationships. Paper presented at the annual meeting of the Academy of Management, Atlanta.
Ochi, N. (2018). Reporting of Real Option Value Related to ESG: Including Complementary Systems for Disclosure Incentives. International Journal of Financial Research, 9(4), 19-34.
Oikonomou, I., Brooks, C., & Pavelin, S. (2012). The impact of corporate social performance on financial risk and utility: A longitudinal analysis. Financial Management, 41(2), 483-515.
Orlitzky, M., & Benjamin, J. D. (2001). Corporate social performance and firm risk: A meta-analytic review. Business & Society, 40(4), 369-396.
Park, S., & Park, K. (2019). Can investors profit from security analyst recommendations?: New evidence on the value of consensus recommendations. Finance Research Letters, 30, 403-413.
Preston, L. E. (1982). Analysing Corporate Social Performance: Methods and Results. In Management Accountability and Corporate Governance (pp. 163-182): Springer.
Purushothaman, M., Tower, G., Hancock, P., & Taplin, R. (2000). Determinants of corporate social reporting practices of listed Singapore companies. Pacific Accounting Review, 12(2), 101.
Randolph, J. J., & Falbe, K. (2014). A step-by-step guide to propensity score matching in R. Practical Assessment, Research & Evaluation, 19.
Ratnatunga, J., & Jones, S. (2012). A methodology to rank the quality and comprehensiveness of sustainability information provided in publicly listed company reports. Contemporary Issues in Sustainability Accounting, Assurance and Reporting, 227.
Rettab, B., Brik, A. B., & Mellahi, K. (2009). A study of management perceptions of the impact of corporate social responsibility on organisational performance in emerging economies: the case of Dubai. Journal of Business Ethics, 89(3), 371-390.
Reverte, C. (2009). Determinants of corporate social responsibility disclosure ratings by Spanish listed firms. Journal of Business Ethics, 88(2), 351-366.
Reverte, C. (2012). The impact of better corporate social responsibility disclosure on the cost of equity capital. Corporate Social Responsibility and Environmental Management, 19(5), 253-272.
Reverte, C. (2016). Corporate social responsibility disclosure and market valuation: evidence from Spanish listed firms. Review of Managerial Science, 10(2), 411-435.
Rezaee, Z., Alipour, M., Faraji, O., Ghanbari, M., & Jamshidinavid, B. (2020). Environmental disclosure quality and risk: the moderating effect of corporate governance. Sustainability Accounting, Management and Policy Journal.
Roberts, M. R., & Whited, T. M. (2013). Endogeneity in empirical corporate finance1. In Handbook of the Economics of Finance (Vol. 2, pp. 493-572): Elsevier.

148
Roodman, D. (2009). How to do xtabond2: An introduction to difference and system GMM in Stata. The stata journal, 9(1), 86-136.
Russo, M. V., & Fouts, P. A. (1997). A resource-based perspective on corporate environmental performance and profitability. Academy of management journal, 40(3), 534-559.
Sassen, R., Hinze, A.-K., & Hardeck, I. (2016). Impact of ESG factors on firm risk in Europe. Journal of Business Economics, 86(8), 867-904.
Schulz, J.-F. (2017). Does greater disclosure of information on CSR performance improve analysts’ forecast accuracy? Journal of Environmental Law and Policy, 40(2), 134-160.
Sethi, S. P. (1975). Dimensions of corporate social performance: An analytical framework. California management review, 17(3), 58-64.
Sethi, S. P., Martell, T. F., & Demir, M. (2016). Building corporate reputation through corporate social responsibility (CSR) reports: The case of extractive industries. Corporate Reputation Review, 19(3), 219-243.
Sethi, S. P., Martell, T. F., & Demir, M. (2017). Enhancing the role and effectiveness of corporate social responsibility (CSR) reports: The missing element of content verification and integrity assurance. Journal of Business Ethics, 144(1), 59-82.
Shamsuddin, A., & Kim, J. H. (2010). Short‐horizon return predictability in international equity markets. Financial Review, 45(2), 469-484.
Shane, P. B., & Spicer, B. H. (1983). Market response to environmental information produced outside the firm. Accounting Review, 521-538.
Shapiro, S. P. (2005). Agency theory. Annual review of sociology, 31. Siew, R. Y., Balatbat, M. C., & Carmichael, D. G. (2016). The impact of ESG disclosures and
institutional ownership on market information asymmetry. Asia-Pacific Journal of Accounting & Economics, 23(4), 432-448.
Stanny, E., & Ely, K. (2008). Corporate environmental disclosures about the effects of climate change. Corporate Social Responsibility and Environmental Management, 15(6), 338-348.
Tagesson, T., Blank, V., Broberg, P., & Collin, S. O. (2009). What explains the extent and content of social and environmental disclosures on corporate websites: a study of social and environmental reporting in Swedish listed corporations. Corporate Social Responsibility and Environmental Management, 16(6), 352-364.
Tamimi, N., & Sebastianelli, R. (2017). Transparency among S&P 500 companies: An analysis of ESG disclosure scores. Management Decision, 55(8), 1660-1680.
Testarmata, S., Ciaburri, M., Fortuna, F., & Sergiacomi, S. (2020). Harmonization of Non-financial Reporting Regulation in Europe: A Study of the Transposition of the Directive 2014/95/EU. In Accountability, Ethics and Sustainability of Organizations (pp. 67-88): Springer.
Thomas, A. (2001). Corporate environmental policy and abnormal stock price returns: an empirical investigation. Business Strategy and the Environment, 10(3), 125-134.
Ullmann, A. A. (1985). Data in search of a theory: A critical examination of the relationships among social performance, social disclosure, and economic performance of US firms. Academy of management review, 10(3), 540-557.
Varadarajan, P. R., & Menon, A. (1988). Cause-related marketing: A coalignment of marketing strategy and corporate philanthropy. The Journal of Marketing, 58-74.
Velte, P. (2020). Institutional ownership, environmental, social, and governance performance and disclosure–a review on empirical quantitative research. Problems and Perspectives in Management, 18(3), 282.
Venturelli, A., Caputo, F., Cosma, S., Leopizzi, R., & Pizzi, S. (2017). Directive 2014/95/EU: Are Italian companies already compliant? Sustainability, 9(8), 1385.
Vollero, A., Conte, F., Siano, A., & Covucci, C. (2019). Corporate social responsibility information and involvement strategies in controversial industries. Corporate Social Responsibility and Environmental Management, 26(1), 141-151.

149
Waddock, S. A., & Graves, S. B. (1997). The corporate social performance–financial performance link. Strategic management journal, 18(4), 303-319.
Wagner, T., Lutz, R. J., & Weitz, B. A. (2009). Corporate hypocrisy: Overcoming the threat of inconsistent corporate social responsibility perceptions. Journal of marketing, 73(6), 77-91.
Wang, Z., & Sarkis, J. (2017). Corporate social responsibility governance, outcomes, and financial performance. Journal of cleaner production, 162, 1607-1616.
Wei, Z., & Xue, J. (2015). Fair value accounting of financial assets and analyst forecasts. China Journal of Accounting Studies, 3(4), 294-319.
Wintoki, M. B., Linck, J. S., & Netter, J. M. (2012). Endogeneity and the dynamics of internal corporate governance. Journal of financial economics, 105(3), 581-606.
Wokutch, R. E., & McKinney, E. W. (1991). Behavioral and perceptual measures of corporate social performance. Research in corporate social performance and policy, 12, 309-330.
Xu, S., & Liu, D. (2018). Do Financial Markets Care about Corporate Social Responsibility Disclosure? Further Evidence from China. Australian Accounting Review, 28(1), 79-103.
Yang, M., Cheng, X., Sun, Q., & Lu, C. (2019). How does analyst forecast dispersion affect SEO discounts in uniform-price auction system? Evidence from investor bids in China. International Review of Economics & Finance, 63, 198-208.
Yoon, B., & Chung, Y. (2018). The effects of corporate social responsibility on firm performance: A stakeholder approach. Journal of Hospitality and Tourism Management, 37, 89-96.
Yu, E. P. y., Guo, C. Q., & Luu, B. V. (2018). Environmental, social and governance transparency and firm value. Business Strategy and the Environment, 27(7), 987-1004.
Yu, M. (2010). Analyst forecast properties, analyst following and governance disclosures: A global perspective. Journal of International Accounting, Auditing and Taxation, 19(1), 1-15.
Yusoff, R., Yusoff, H., Abd Rahman, S. A., & Darus, F. (2019). Investigating Sustainability Reporting from the Lens of Stakeholder Pressures and Isomorphism. Journal of Asia-Pacific Business, 20(4), 302-321.
Zeng, H., Zhang, T., Zhou, Z., Zhao, Y., & Chen, X. (2020). Water disclosure and firm risk: Empirical evidence from highly water‐sensitive industries in China. Business Strategy and the Environment, 29(1), 17-38.
Related Documents


