Statistical release P9115 Non-financial census of municipalities for the year ended 30 June 2014 Embargoed until: 25 August 2015 13:00 Enquiries: Forthcoming issue: Expected release date User Information Services +27 12 310 8600 P9115 June 2015 August 2016

Welcome message from author
This document is posted to help you gain knowledge. Please leave a comment to let me know what you think about it! Share it to your friends and learn new things together.
Transcript

Statistical release P9115
Non-financial census of municipalities for the year ended
30 June 2014
Embargoed until: 25 August 2015
13:00
Enquiries: Forthcoming issue: Expected release date
User Information Services +27 12 310 8600
P9115 June 2015 August 2016
Statistics South Africa i P9115
Non-financial census of municipalities for the year ended 30 June 2014
PREFACE
Statistics South Africa (Stats SA) has undertaken an annual non-financial census of municipalities with effect from 2002. The purpose of the census is to measure selected aspects of service delivery of municipalities. The results of this census provide information that can serve as a framework for policymakers and other stakeholders for planning and monitoring. The census enables users to analyse the services provided by municipalities in terms of water, electricity, solid waste management, sewerage and sanitation. The 2014 non-financial census of municipalities obtained information on various issues, including:
particulars of services provided in the municipalities as at 30 June 2013 and 30 June 2014; and
particulars of total employment in the municipalities as at 30 June 2013 and 30 June 2014. This statistical release contains the preliminary results of the 2014 non-financial census of municipalities and the revised figures for 2013. In the event of revised figures being obtained for 2014, they will be incorporated into the 2015 non-financial census of municipalities (if applicable). For the purposes of this printed version, all results are presented at provincial level. Detailed information of each respondent (for 2013 and 2014) can be obtained from the Stats SA website (or can be made available upon request).
PJ Lehohla Statistician-General
Statistics South Africa ii P9115
Non-financial census of municipalities for the year ended 30 June 2014
Contents
Background .................................................................................................................................................................................................................................................. iv
Purpose of the survey .................................................................................................................................................................................................................................. iv
Methodology ................................................................................................................................................................................................................................................ iv
Technical notes ............................................................................................................................................................................................................................................ v
List of municipalities (2014) ......................................................................................................................................................................................................................... vi
Key findings ................................................................................................................................................................................................................................................. 1
Table 1.1 - Managerial positions by province according to Section 57 of Local Government Municipal System Act, 2000 (Act No.32 of 2000): 2013 and 2014 ............ 8
Table 1.2 - Managerial positions by province according to organogram: 2013 and 2014 .......................................................................................................................... 9
Table 1.3 – Number of councillors by province: 2013 and 2014 ................................................................................................................................................................. 10
Table 1.4 - Executive mayor and mayor positions by province: 2013 and 2014 ......................................................................................................................................... 11
Table 2.1 - Employment positions including managerial positions by province: 2013 and 2014 ................................................................................................................ 12
Table 2.2 - Employment positions excluding managerial positions by department for 2013 and 2014: ..................................................................................................... 13
Table 3 - Number of municipalities in each province responsible for providing services under the powers and functions allocated to them: 2013 and 2014 ................. 14
Table 4 - Number of municipalities in each province with infrastructure to provide services: 2013 and 2014 ............................................................................................ 15
Table 5 - Number of municipalities in each province that provide basic services: 2013 and 2014 ............................................................................................................. 16
Table 6 - Number of municipalities in each province that have commercialised or outsourced basic services: 2013 and 2014 ............................................................... 17
Table 7 - Number of consumer units in each province receiving selected services from municipalities: 2013 and 2014 .......................................................................... 18
Table 8 - Number of consumer units in each province receiving water from municipalities: 2013 and 2014 ............................................................................................. 19
Table 9 - Number of consumer units in each province receiving basic sewerage and sanitation from municipalities: 2013 and 2014 ..................................................... 20
Table 10 - Number of municipalities in each province with a policy in place relating to free basic services: 2013 and 2014 .................................................................... 21
Statistics South Africa iii P9115
Non-financial census of municipalities for the year ended 30 June 2014
Table 11 - Number of municipalities in each province which have implemented the policy relating to free basic services: 2013 and 2014 ............................................. 22
Table 12 - Number of municipalities in each province providing free basic services at standard and other levels: 2013 and 2014 .......................................................... 23
Table 13 - Number of domestic consumer units in each province receiving free basic services from municipalities: 2013 and 2014 ....................................................... 24
Table 14.1 (a) - Mechanisms used by municipalities to provide free basic services to indigent households for 2014: Water ................................................................... 25
Table 14.1 (b) - Mechanisms used by municipalities to provide free basic services to indigent households for 2014: Electricity ............................................................. 26
Table 14.1 (c) - Mechanisms used by municipalities to provide free basic services to indigent households for 2014: Sewerage and sanitation ..................................... 27
Table 14.1 (d) - Mechanisms used by municipalities to provide free basic services to indigent households for 2014: Solid waste management .................................... 28
Table 14.2 - Number of municipalities in each province using indicated monthly income cut-off points to identify indigent households: 2014 ........................................ 29
Table 15 - Number of municipalities in each province with an indigent support policy: 2013 and 2014 ..................................................................................................... 30
Table 16 - Number of municipalities in each province which have implemented an indigent support policy: 2013 and 2014 ................................................................... 31
Table 17 - Number of indigent households in each province benefiting from an indigent support system over the period 2013 and 2014 .............................................. 32
Table 18 - Number of municipalities in each province that provide free basic alternative energy: 2013 and 2014 .................................................................................... 33
Table 19 - Number of indigent households in each province provided with free basic alternative energy: 2013 and 2014 ....................................................................... 34
Table 20 - Number of municipalities in each province that have submitted an Integrated Development Plan (IDP), WSDP, monitoring for water quality and
effluent discharges, and an HIV/AIDS policy, and signed a funding agreement with Eskom: 2013 and 2014 ........................................................................... 35
Explanatory notes ........................................................................................................................................................................................................................................ 36
Glossary of the selected variables ............................................................................................................................................................................................................... 37
Technical enquiries ...................................................................................................................................................................................................................................... 39
General information ..................................................................................................................................................................................................................................... 40

Statistics South Africa iv P9115
Non-financial census of municipalities for the year ended 30 June 2014
Background
The census provides information that serves as a framework for policymakers and other stakeholders for analysis, planning and monitoring in terms of service delivery of water, electricity, solid waste management, sewerage and sanitation.
Purpose of the survey
This publication is directed towards the following major goals:
Assist in monitoring the progress made with regard to the implementation of service provision, free basic services and poverty alleviation as national priorities.
Provide baseline non-financial information from those institutions classified as municipalities in terms of the Local Government Municipal Structures Act, 1998 (Act No. 117 of 1998).
Provide information that can serve as a framework for policymakers and other stakeholders for planning, as well as monitoring and evaluating the performance of municipalities.
Allow national and provincial governments and other stakeholders to analyse the actual services provided by municipalities.
Make data available for use by researchers, organisations and individuals.
Methodology
Scope of the survey All 278 municipalities responded to the survey for 2014. Questionnaire and data collection
The methods used for collection included personal visits, telephone, fax, email and post. Data are generally comparable between the 2013 and 2014 publications. Limitations of the survey
This publication is not necessarily comparable with the Stats SA population census of 2011 and/or household survey data, mainly due to: i. The data source is municipalities as opposed to households. ii. The different definitions of ‘household’. Most municipalities do not
have a system for identifying multiple households served by one billing unit or delivery point.
iii. Different reporting periods.
The term ‘consumer unit’ or ‘billing unit’ (as used by the municipality for their recording purposes) is not directly comparable with other Stats SA household-based surveys.
Statistics South Africa v P9115
Non-financial census of municipalities for the year ended 30 June 2014
Technical notes
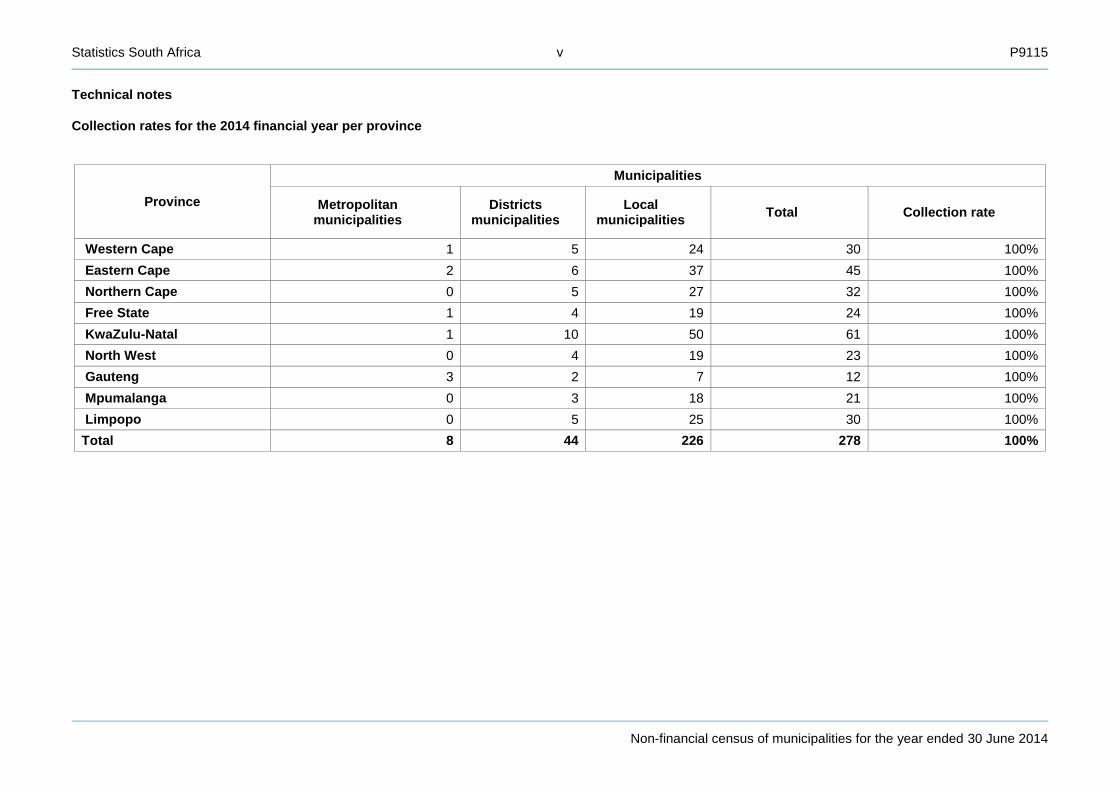
Collection rates for the 2014 financial year per province
Province
Municipalities
Metropolitan municipalities
Districts municipalities
Local municipalities
Total Collection rate
Western Cape 1 5 24 30 100%
Eastern Cape 2 6 37 45 100%
Northern Cape 0 5 27 32 100%
Free State 1 4 19 24 100%
KwaZulu-Natal 1 10 50 61 100%
North West 0 4 19 23 100%
Gauteng 3 2 7 12 100%
Mpumalanga 0 3 18 21 100%
Limpopo 0 5 25 30 100%
Total 8 44 226 278 100%

Statistics South Africa vi P9115
Non-financial census of municipalities for the year ended 30 June 2014
List of municipalities (2014)
Western Cape City of Cape Town Metro West Coast District Municipality Matzikama Cederberg Bergrivier Saldanha Bay Swartland Cape Winelands District Municipality Witzenberg Drakenstein Stellenbosch Breede Valley Langeberg Overberg District Municipality Theewaterskloof Overstrand Cape Agulhas Swellendam Eden District Municipality Kannaland Hessequa Mossel Bay George Oudtshoorn Bitou Knysna Central Karoo District Municipality Laingsburg Prince Albert Beaufort West
Eastern Cape Nelson Mandela Bay Metro Buffalo City Metro Saartjie Baartman District Municipality (was Cacadu) Camdeboo Blue Crane Route Ikwezi Makana Ndlambe Sunday’s River Valley Baviaans Kouga Kou-Kamma Amathole District Municipality Mbhashe Mnquma Great Kei Amahlathi Ngqushwa Nkonkobe Nxuba Chris Hani District Municipality Inxuba Yethemba Tsolwana Inkwanca Lukhanji Intsika Yethu Emalahleni Engcobo Sakhisizwe
Alfred Nzo District Municipality Matatiele Umzimvubu Ntabankulu Mbizana O.R. Tambo District Municipality Ngquza Hill Port St Johns Nyandeni Mhlontlo King Sabata Dalindyebo Joe Gqabi District Municipality Elundini Gariep Maletswai Senqu
Northern Cape Namakwa District Municipality Richtersveld Nama Khoi Kamiesberg Hantam Karoo Hoogland Khai-Ma
Pixley kaSeme District Municipality Ubuntu Umsobomvu Emthanjeni Kareeberg Renosterberg Thembelihle Siyathemba Siyancuma
ZF Mgcawu District Municipality Mier Kai !Garib Khara Hais !Kheis Tsantsabane Kgatelopele
John Taolo Gaetsewe District Municipality Ga-Segonyana Gamagara Joe Morolong
Frances Baard District Municipality Dikgatlong Magareng Phokwane Sol Plaatje

Statistics South Africa vii P9115
Non-financial census of municipalities for the year ended 30 June 2014
Free State
Mangaung Metro Xhariep District Municipality Letsemeng Kopanong Mohokare Naledi Lejweleputswa District Municipality Masilonyana Tokologo Tswelopele Matjhabeng Nala Thabo Mofutsanyane District Municipality Setsoto Dihlabeng Nketoana Maluti a Phofung Phumelela Mantsopa Fezile Dabi District Municipality Moqhaka Ngwathe Metsimaholo Mafube
KwaZulu-Natal eThekwini Metro Ugu District Municipality Vulamehlo Umdoni Umzumbe UMuziwabantu Ezinqolweni Hibiscus Coast uMgungundlovu District Municipality uMshwathi uMngeni Mooi Mpofana Impendle Msunduzi Mkhambathini Richmond uThukela District Municipality Emnambithi-Ladysmith Indaka Umtshezi Okhahlamba Imbabazane Umzinyathi District Municipality Endumeni Nqutu Msinga Umvoti Amajuba District Municipality Newcastle Emadlangeni Dannhauser
KwaZulu-Natal (concluded) Zululand District Municipality eDumbe uPhongolo Abaqulusi Nongoma Ulundi uMkhanyakude District Municipality uMhlabuyalingana Jozini The Big Five False Bay Hlabisa Mtubatuba uThungulu District Municipality Mfolozi City of uMhlathuze Ntambanana uMlalazi Mthonjaneni Nkandla ILembe District Municipality Mandeni KwaDukuza Ndwedwe Maphumulo Harry Gwala District Municipality (was Sisonke) Ingwe Kwa Sani Greater Kokstad Ubuhlebezwe Umzimkhulu
North West Bojanala District Municipality Moretele Madibeng Rustenburg Kgetlengrivier Moses Kotane Ngaka Modiri Molema District Municipality Ratlou Tswaing Mahikeng Ditsobotla Ramotshere Moila Dr Ruth Segomotsi Mompati District Municipality Kagisano-Molopo Naledi Mamusa Greater Taung Lekwa-Teemane Dr Kenneth Kaunda District Municipality Ventersdorp Tlokwe City of Matlosana Maquassi Hills

Statistics South Africa viii P9115
Non-financial census of municipalities for the year ended 30 June 2014
Gauteng City of Johannesburg Metro City of Tshwane Metro Ekurhuleni Metro Sedibeng District Municipality Emfuleni Midvaal Lesedi West Rand District Municipality Mogale City Randfontein Westonaria Merafong City
Mpumalanga Gert Sibande District Municipality Albert Luthuli Msukaligwa Mkhondo Pixley ka Seme Lekwa Dipaleseng Govan Mbeki Nkangala District Municipality Emalahleni Steve Tshwete Emakhazeni Thembisile Dr J.S. Moroka Victor Khanye Ehlanzeni District Municipality Bushbuckridge Thaba Chweu Mbombela Umjindi Nkomazi
Limpopo Mopani District Municipality Ba-Phalaborwa Greater Giyani Greater Letaba Greater Tzaneen Maruleng Vhembe District Municipality Musina Mutale Thulamela Makhado
Capricorn District Municipality Blouberg Aganang Molemole Polokwane Lepelle-Nkumpi Waterberg District Municipality Thabazimbi Lephalale Mookgopong Modimolle Bela-Bela Mogalakwena Sekhukhune District Municipality Makhuduthamaga Fetakgomo Elias Motsoaledi Ephriam Mogale Greater Tubatse

Statistics South Africa 1 P9115
Non-financial census of municipalities for the year ended 30 June 2014
Key findings
Figure A - Number of consumer units receiving services from municipalities: 2013 and 2014
* Some figures have been revised.
The number of consumer units receiving services from municipalities increased between 2013 and 2014. The highest percentage increase from 2013 to 2014 in the provision of services was recorded in sewerage and
sanitation (5,9%), followed by solid waste management (5,6%), electricity (4,6%) and water (3,9%).
Water Electricity Sewerage and sanitation Solid waste management
2013* 11 661 295 9 998 039 9 853 993 8 391 693
2014 12 116 820 10 454 556 10 433 174 8 862 570
% change 3,9 4,6 5,9 5,6
0
2 000 000
4 000 000
6 000 000
8 000 000
10 000 000
12 000 000
14 000 000
Nu
mb
er
of
con
sum
er
un
its

Statistics South Africa 2 P9115
Non-financial census of municipalities for the year ended 30 June 2014
Figure B - Number of consumer units using bucket toilet systems provided by municipalities in each province: 2013 and 2014
*Some figures have been revised.
Over the period 2013 to 2014, three provinces showed a decrease in the use of bucket toilet systems provided by municipalities: Western Cape (-45,8%), Eastern Cape (-30,5%) and Free State (-11,2%). The following three provinces,
on the other hand, showed an increase in the use of bucket toilet systems over the same period: North West (57,4%), Mpumalanga (20,0%) and Northern Cape (7,3%).
Eastern Cape Free State Northern Cape North West Mpumalanga Western Cape Gauteng KwaZulu-Natal Limpopo
2013* 50 266 34 638 8 765 4 078 1 500 1 313 58 0 0
2014 34 913 30 759 9 406 6 417 1 800 712 58 0 0
% change -30,5 -11,2 7,3 57,4 20,0 -45,8 0,0
0
10 000
20 000
30 000
40 000
50 000
60 000
Num
ber
of
household
s
Statistics South Africa 3 P9115
Non-financial census of municipalities for the year ended 30 June 2014
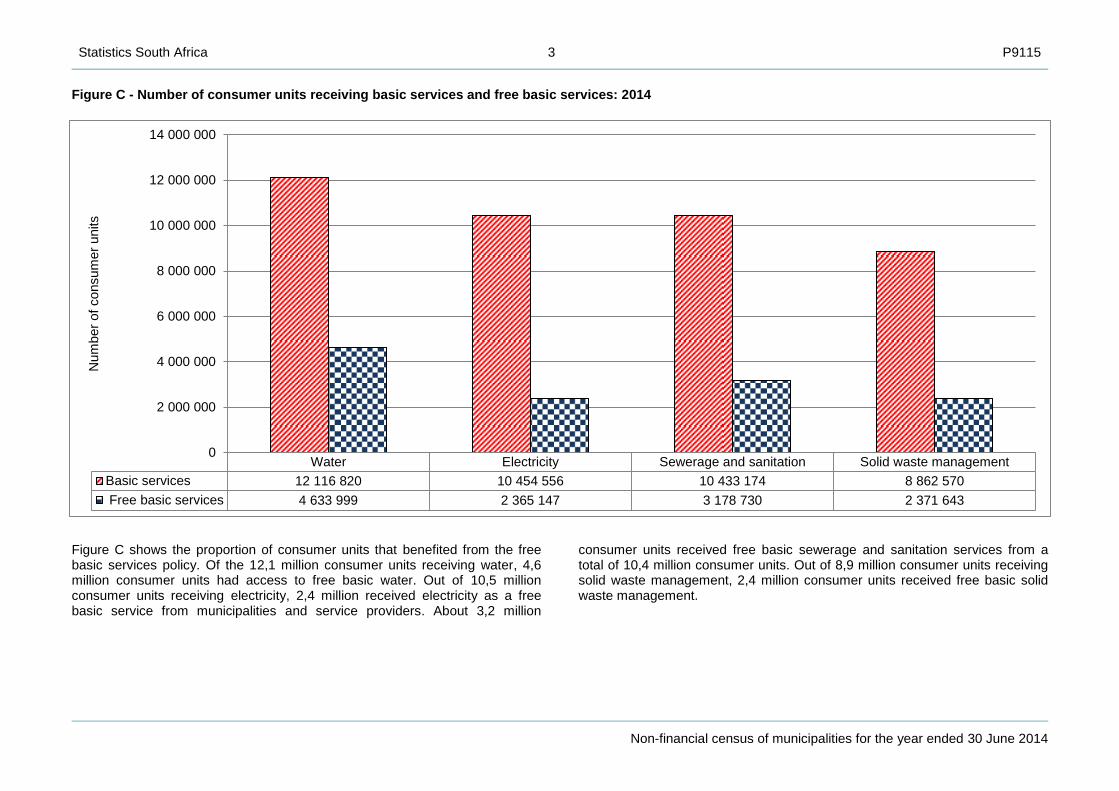
Figure C - Number of consumer units receiving basic services and free basic services: 2014
Figure C shows the proportion of consumer units that benefited from the free basic services policy. Of the 12,1 million consumer units receiving water, 4,6 million consumer units had access to free basic water. Out of 10,5 million consumer units receiving electricity, 2,4 million received electricity as a free basic service from municipalities and service providers. About 3,2 million
consumer units received free basic sewerage and sanitation services from a total of 10,4 million consumer units. Out of 8,9 million consumer units receiving solid waste management, 2,4 million consumer units received free basic solid waste management.
Water Electricity Sewerage and sanitation Solid waste management
Basic services 12 116 820 10 454 556 10 433 174 8 862 570
Free basic services 4 633 999 2 365 147 3 178 730 2 371 643
0
2 000 000
4 000 000
6 000 000
8 000 000
10 000 000
12 000 000
14 000 000
Num
ber
of
consum
er
units

Statistics South Africa 4 P9115
Non-financial census of municipalities for the year ended 30 June 2014
Table A - Number of consumer units receiving water and free basic water services from municipalities over the period 2013 and 2014
Province
2013* 2014
Number of consumer units receiving basic water services
Number of consumer units
receiving free basic water services
Proportion benefiting
(%)
Number of consumer units receiving basic water services
Number of consumer units
receiving free basic water services
Proportion benefiting
(%)
Western Cape 1 202 348 944 844 78,6 1 223 563 926 007 75,7
Eastern Cape 1 494 344 678 014 45,4 1 550 681 610 690 39,4
Northern Cape 271 919 91 240 33,6 281 901 68 700 24,4
Free State 770 967 272 151 35,3 781 915 187 111 23,9
KwaZulu-Natal 2 068 512 814 266 39,4 2 118 994 856 225 40,4
North West 840 751 188 894 22,5 889 881 212 265 23,9
Gauteng 2 850 080 1 077 660 37,8 3 000 662 830 471 27,7
Mpumalanga 1 021 837 581 307 56,9 1 050 250 433 979 41,3
Limpopo 1 140 537 480 787 42,2 1 218 973 508 551 41,7
South Africa 11 661 295 5 129 163 44,0 12 116 820 4 633 999 38,2
* Some figures have been revised.
Table A shows the proportion of consumer units that benefited from the free basic water policy. According to 2014 estimates, 12,1 million consumer units received water from municipalities in South Africa, of which 4,6 million (38,2%) consumer units received free basic water. Western Cape showed the highest proportion of consumer units that benefited from the free basic water policy (75,7%), followed by Limpopo (41,7%) and Mpumalanga (41,3%). The provinces with the lowest proportion of consumer
units that benefited from the free basic water policy were North West and Free State (23,9%), followed by Northern Cape (24,4%). Differences in free basic services between 2013 and 2014 are partly the result of changes in the targeting mechanisms used by municipalities to provide such services, namely technical, geographical, broad-based, self-based, consumption-based, property value, and plot size.

Statistics South Africa 5 P9115
Non-financial census of municipalities for the year ended 30 June 2014
Table B - Number of consumer units receiving electricity and free basic electricity services from municipalities over the period 2013 and 2014
Province
2013* 2014
Number of consumer units receiving basic
electricity services
Number of consumer units receiving free
basic electricity services
Proportion benefiting
(%)
Number of consumer units receiving basic
electricity services
Number of consumer units
receiving free basic electricity services
Proportion benefiting
(%)
Western Cape 1 241 350 560 877 45,2 1 260 398 565 442 44,9
Eastern Cape 1 144 731 313 343 27,4 1 168 878 300 888 25,7
Northern Cape 267 951 68 292 25,5 275 673 64 961 23,6
Free State 697 926 171 847 24,6 718 516 172 863 24,1
KwaZulu-Natal 1 609 718 180 181 11,2 1 658 519 243 532 14,7
North West 876 531 152 030 17,3 906 783 171 714 18,9
Gauteng 2 182 341 677 341 31,0 2 413 281 517 673 21,5
Mpumalanga 788 862 262 848 33,3 824 728 176 270 21,4
Limpopo 1 188 629 141 913 11,9 1 227 780 151 804 12,4
South Africa 9 998 039 2 528 672 25,3 10 454 556 2 365 147 22,6
* Some figures have been revised.
Table B shows the proportion of consumer units that benefited from the free basic electricity policy. According to 2014 estimates, about 10,5 million consumer units received electricity from municipalities in South Africa and about 2,4 million (22,6%) consumer units had free basic electricity. Western Cape showed the highest proportion of consumer units that benefited from the free basic electricity policy (44,9%), followed by Eastern Cape (25,7%) and Free State (24,1%). Limpopo showed the lowest proportion (12,4%), followed by KwaZulu-Natal (14,7%) and North West (18,9%).
Differences in free basic services between 2013 and 2014 are partly the result of changes in the targeting mechanisms used by municipalities to provide such services, namely technical, geographical, broad-based, self-based, consumption-based, property value, and plot size.

Statistics South Africa 6 P9115
Non-financial census of municipalities for the year ended 30 June 2014
Table C - Number of consumer units receiving sewerage and sanitation and free basic sewerage and sanitation services from municipalities over the period 2013 and 2014
Province
2013* 2014
Number of consumer units receiving basic sewerage and
sanitation services
Number of consumer units
receiving free basic sewerage and
sanitation services
Proportion benefiting
(%)
Number of consumer units receiving basic sewerage and
sanitation services
Number of consumer units
receiving free basic sewerage and
sanitation services
Proportion benefiting
(%)
Western Cape 1 061 682 738 830 69,6 1 087 067 749 909 69,0
Eastern Cape 1 142 293 501 222 43,9 1 284 399 538 619 41,9
Northern Cape 256 976 58 353 22,7 265 367 56 013 21,1
Free State 718 743 144 716 20,1 769 701 158 000 20,5
KwaZulu-Natal 1 867 052 397 867 21,3 1 994 091 461 710 23,2
North West 679 569 97 872 14,4 707 185 100 412 14,2
Gauteng 2 459 296 891 986 36,3 2 559 973 785 349 30,7
Mpumalanga 906 416 97 053 10,7 970 353 102 273 10,5
Limpopo 761 966 207 705 27,3 795 038 226 445 28,5
South Africa 9 853 993 3 135 604 31,8 10 433 174 3 178 730 30,5
* Some figures have been revised.
Table C shows the proportion of consumer units receiving free basic sewerage and sanitation from municipalities. According to 2014 estimates, about 10,4 million consumer units received sewerage and sanitation from municipalities in South Africa and 30,5% of these consumer units had access to free basic sewerage and sanitation. Western Cape showed the highest proportion of consumer units that benefited from free basic sewerage and sanitation (69,0%), followed by Eastern Cape (41,9%) and Gauteng (30,7%). The province with the lowest proportion was Mpumalanga (10,5%), followed by North West (14,2%) and Free State (20,5%).
There were about 3,2 million consumer units receiving free basic sewerage and sanitation from municipalities in 2014 compared with about 3,1 million consumer units in 2013. Differences in free basic services between 2013 and 2014 are partly the result of changes in the targeting mechanisms used by municipalities to provide such services, namely technical, geographical, broad-based, self-based, consumption-based, property value, and plot size.

Statistics South Africa 7 P9115
Non-financial census of municipalities for the year ended 30 June 2014
Table D - Number of consumer units receiving solid waste management and free basic solid waste management services from municipalities over the period 2013 and 2014
Province
2013* 2014
Number of consumer units receiving basic
solid waste management
services
Number of consumer units
receiving free basic solid waste
management services
Proportion benefiting
(%)
Number of consumer units receiving basic
solid waste management
services
Number of consumer units
receiving free basic solid waste
management services
Proportion benefiting
(%)
Western Cape 1 172 648 553 379 47,2 1 184 892 625 246 52,8
Eastern Cape 766 131 224 769 29,3 802 073 223 579 27,9
Northern Cape 221 478 59 073 26,7 227 012 56 000 24,7
Free State 628 430 146 547 23,3 655 580 137 256 20,9
KwaZulu-Natal 1 423 290 698 875 49,1 1 466 259 691 111 47,1
North West 491 175 97 866 19,9 573 424 103 291 18,0
Gauteng 2 763 184 482 053 17,4 2 978 735 343 713 11,5
Mpumalanga 513 075 88 370 17,2 549 468 95 002 17,3
Limpopo 412 282 77 457 18,8 425 127 96 445 22,7
South Africa 8 391 693 2 428 389 28,9 8 862 570 2 371 643 26,8
* Some figures have been revised.
Table D shows the proportion of consumer units receiving solid waste management as a free basic service. According to 2014 estimates, 8,9 million consumer units received solid waste management from municipalities in South Africa and 26,8% of these consumer units had access to free basic solid waste management. Western Cape showed the highest proportion of consumer units that benefited from free basic solid waste management (52,8%), followed by KwaZulu-Natal (47,1%) and Eastern Cape (27,9%). The province with the lowest proportion was Gauteng (11,5%), followed by Mpumalanga (17,3%) and North West (18,0%).
Differences in free basic services between 2013 and 2014 are partly the result of changes in the targeting mechanisms used by municipalities to provide such services, namely technical, geographical, broad-based, self-based, consumption-based, property value, and plot size.

Statistics South Africa 8 P9115
Non-financial census of municipalities for the year ended 30 June 2014
Table 1.1 - Managerial positions by province according to Section 57 of Local Government Municipal System Act, 2000 (Act No.32 of 2000): 2013 and 2014
Province
Full-time Part-time
Vacant posts
Total
(including vacancies) Male Female Male Female
2013* 2014 2013* 2014 2013* 2014 2013* 2014 2013* 2014 2013* 2014
Western Cape 107 113 22 21 12 12 1 0 29 22 171 168
Eastern Cape 179 162 89 58 0 0 0 0 37 49 305 269
Northern Cape 76 79 25 22 13 12 3 3 30 39 147 155
Free State 82 78 26 26 2 2 3 3 12 14 125 123
KwaZulu-Natal 292 293 75 85 3 4 2 2 43 54 415 438
North West 92 107 30 43 2 4 2 2 29 18 155 174
Gauteng 149 91 81 47 0 0 0 0 33 8 263 146
Mpumalanga 80 74 24 22 0 0 0 0 27 31 131 127
Limpopo 91 89 45 49 3 3 0 2 50 44 189 187
South Africa 1 148 1 086 417 373 35 37 11 12 290 279 1 901 1 787
* Some figures have been revised.

Statistics South Africa 9 P9115
Non-financial census of municipalities for the year ended 30 June 2014
Table 1.2 - Managerial positions by province according to organogram: 2013 and 2014
Province
Full-time Part-time
Vacant posts
Total
(including vacancies) Male Female Male Female
2013* 2014 2013* 2014 2013* 2014 2013* 2014 2013* 2014 2013* 2014
Western Cape 669 700 242 252 3 7 3 1 112 107 1 029 1 067
Eastern Cape 557 657 314 371 0 0 0 0 176 135 1 047 1 163
Northern Cape 196 190 51 60 6 0 0 4 55 57 308 311
Free State 386 407 120 124 1 5 0 0 117 140 624 676
KwaZulu-Natal 793 836 328 369 0 2 0 0 122 147 1 243 1 354
North West 319 322 152 167 0 0 0 0 81 71 552 560
Gauteng 1 813 2 255 977 1 590 2 0 0 1 654 914 3 446 4 760
Mpumalanga 346 408 136 153 0 1 0 0 65 52 547 614
Limpopo 439 487 189 195 1 0 0 0 179 113 808 795
South Africa 5 518 6 262 2 509 3 281 13 15 3 6 1 561 1 736 9 604 11 300
* Some figures have been revised.

Statistics South Africa 10 P9115
Non-financial census of municipalities for the year ended 30 June 2014
Table 1.3 – Number of councillors by province: 2013 and 2014
Province
Full-time Part-time
Vacant posts
Total
(including vacancies) Male Female Male Female
2013* 2014 2013* 2014 2013* 2014 2013* 2014 2013* 2014 2013* 2014
Western Cape 182 147 95 53 354 404 215 238 2 6 848 848
Eastern Cape 121 184 86 127 828 760 608 571 7 8 1 650 1 650
Northern Cape 43 31 26 22 217 231 153 156 1 0 440 440
Free State 126 204 86 113 318 240 193 166 3 3 726 726
KwaZulu-Natal 181 195 92 97 1 092 1 070 522 521 3 7 1 890 1 890
North West 167 187 122 152 388 347 234 223 0 2 911 911
Gauteng 425 453 289 405 228 131 140 88 13 18 1 095 1 095
Mpumalanga 70 73 55 48 465 454 321 336 0 0 911 911
Limpopo 72 146 63 101 636 560 466 427 8 11 1 245 1 245
South Africa 1 387 1 620 914 1 118 4 526 4 197 2 852 2 726 37 55 9 716 9 716
* Some figures have been revised.

Statistics South Africa 11 P9115
Non-financial census of municipalities for the year ended 30 June 2014
Table 1.4 - Executive mayor and mayor positions by province: 2013 and 2014
Province
Full-time Part-time
Vacant posts
Total
(including vacancies) Male Female Male Female
2013* 2014 2013* 2014 2013* 2014 2013* 2014 2013* 2014 2013* 2014
Western Cape 24 23 6 7 0 0 0 0 0 0 30 30
Eastern Cape 29 26 15 17 1 1 0 1 0 0 45 45
Northern Cape 19 18 13 13 0 0 0 1 0 0 32 32
Free State 15 16 9 8 0 0 0 0 0 0 24 24
KwaZulu-Natal 41 42 18 17 1 0 1 1 0 1 61 61
North West 10 13 13 10 0 0 0 0 0 0 23 23
Gauteng 6 5 6 7 0 0 0 0 0 0 12 12
Mpumalanga 11 12 10 9 0 0 0 0 0 0 21 21
Limpopo 15 14 14 16 0 0 1 0 0 0 30 30
South Africa 170 169 104 104 2 1 2 3 0 1 278 278
* Some figures have been revised.
Statistics South Africa 12 P9115
Non-financial census of municipalities for the year ended 30 June 2014
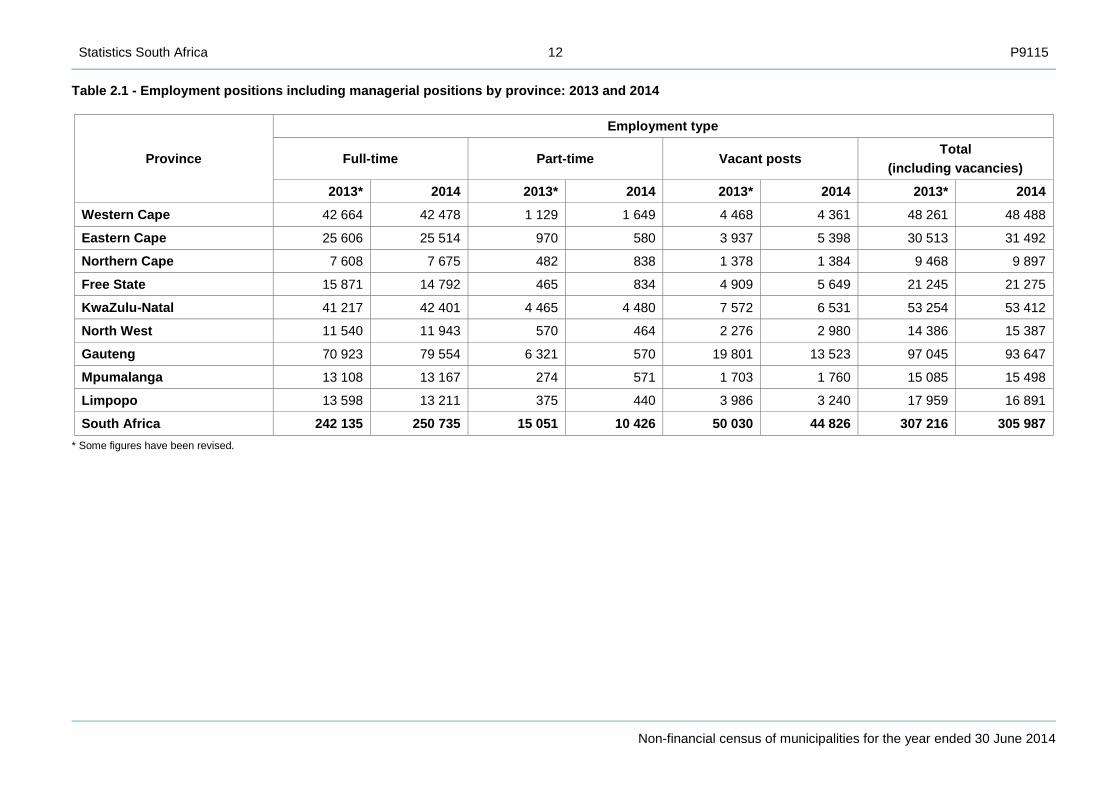
Table 2.1 - Employment positions including managerial positions by province: 2013 and 2014
Province
Employment type
Full-time Part-time Vacant posts Total
(including vacancies)
2013* 2014 2013* 2014 2013* 2014 2013* 2014
Western Cape 42 664 42 478 1 129 1 649 4 468 4 361 48 261 48 488
Eastern Cape 25 606 25 514 970 580 3 937 5 398 30 513 31 492
Northern Cape 7 608 7 675 482 838 1 378 1 384 9 468 9 897
Free State 15 871 14 792 465 834 4 909 5 649 21 245 21 275
KwaZulu-Natal 41 217 42 401 4 465 4 480 7 572 6 531 53 254 53 412
North West 11 540 11 943 570 464 2 276 2 980 14 386 15 387
Gauteng 70 923 79 554 6 321 570 19 801 13 523 97 045 93 647
Mpumalanga 13 108 13 167 274 571 1 703 1 760 15 085 15 498
Limpopo 13 598 13 211 375 440 3 986 3 240 17 959 16 891
South Africa 242 135 250 735 15 051 10 426 50 030 44 826 307 216 305 987
* Some figures have been revised.

Statistics South Africa 13 P9115
Non-financial census of municipalities for the year ended 30 June 2014
Table 2.2 - Employment positions excluding managerial positions by department for 2013 and 2014:
Employment section
Employment type
Full-time Part-time Vacant posts Total
(including vacancies)
2013* 2014 2013* 2014 2013* 2014 2013* 2014
Community and Social Services 25 544 22 342 891 1 407 4 683 5 213 31 118 28 962
Finance and Administration 48 310 43 767 1 343 1 564 9 162 8 597 58 815 53 928
Electricity 17 174 15 863 238 173 4 510 3 508 21 922 19 544
Environmental Protection 5 625 3 291 140 92 1 185 707 6 950 4 090
Health 7 568 7 112 19 119 1 231 1 212 8 818 8 443
Public Safety 29 415 33 484 439 757 6 626 5 199 36 480 39 440
Road Transport 16 270 18 108 847 668 3 979 4 737 21 096 23 513
Sport and Recreation 7 409 7 350 408 436 1 898 1 474 9 715 9 260
Waste Management 27 682 26 273 973 793 5 812 3 282 34 467 30 348
Waste Water Management 9 060 9 565 194 327 2 196 2 034 11 450 11 926
Water 24 997 27 635 725 748 3 229 3 689 28 951 32 072
Other 13 489 24 943 8 772 3 272 3 668 3 159 25 929 31 374
Total 232 543 239 733 14 989 10 356 48 179 42 811 295 711 292 900
* Some figures have been revised.

Statistics South Africa 14 P9115
Non-financial census of municipalities for the year ended 30 June 2014
Table 3 - Number of municipalities in each province responsible for providing services under the powers and functions allocated to them: 2013 and 2014
Province
Number of municipalities Water Electricity Sewerage and
sanitation Solid waste
management
2013 2014 2013* 2014 2013* 2014 2013* 2014 2013* 2014
Western Cape 30 30 26 26 26 26 26 26 26 26
Eastern Cape 45 45 16 16 39 39 16 16 39 39
Northern Cape 32 32 27 27 27 27 27 27 27 27
Free State 24 24 20 20 20 20 20 20 20 20
KwaZulu-Natal 61 61 14 14 51 51 14 14 49 49
North West 23 23 11 11 19 19 11 11 19 19
Gauteng 12 12 10 10 10 10 10 10 10 10
Mpumalanga 21 21 18 18 18 18 18 18 18 18
Limpopo 30 30 11 11 24 24 11 11 25 25
South Africa 278 278 153 153 234 234 153 153 233 233
* Some figures have been revised.

Statistics South Africa 15 P9115
Non-financial census of municipalities for the year ended 30 June 2014
Table 4 - Number of municipalities in each province with infrastructure to provide services: 2013 and 2014
Province
Number of municipalities Water Electricity Sewerage and
sanitation Solid waste
management
2013 2014 2013* 2014 2013* 2014 2013* 2014 2013* 2014
Western Cape 30 30 26 26 26 26 26 26 26 26
Eastern Cape 45 45 26 26 29 29 26 26 38 38
Northern Cape 32 32 27 27 25 25 27 27 27 27
Free State 24 24 20 20 20 20 20 20 20 20
KwaZulu-Natal 61 61 15 15 26 26 15 15 47 47
North West 23 23 19 19 14 14 19 19 16 17
Gauteng 12 12 10 10 10 10 10 10 10 10
Mpumalanga 21 21 18 18 18 18 18 18 18 18
Limpopo 30 30 26 26 17 17 25 25 24 24
South Africa 278 278 187 187 185 185 186 186 226 227
* Some figures have been revised.

Statistics South Africa 16 P9115
Non-financial census of municipalities for the year ended 30 June 2014
Table 5 - Number of municipalities in each province that provide basic services: 2013 and 2014
Province
Number of municipalities Water Electricity Sewerage and
sanitation Solid waste
management
2013 2014 2013* 2014 2013* 2014 2013* 2014 2013* 2014
Western Cape 30 30 26 26 26 26 26 26 26 26
Eastern Cape 45 45 23 23 31 31 23 23 39 39
Northern Cape 32 32 27 27 25 25 27 27 27 27
Free State 24 24 20 20 18 18 20 20 20 20
KwaZulu-Natal 61 61 15 15 27 27 15 15 46 47
North West 23 23 18 18 14 14 18 18 16 17
Gauteng 12 12 10 10 10 10 10 10 10 10
Mpumalanga 21 21 18 18 18 18 18 18 18 18
Limpopo 30 30 11 11 17 17 11 11 24 24
South Africa 278 278 168 168 186 186 168 168 226 228
* Some figures have been revised.

Statistics South Africa 17 P9115
Non-financial census of municipalities for the year ended 30 June 2014
Table 6 - Number of municipalities in each province that have commercialised or outsourced basic services: 2013 and 2014
Province
Number of municipalities Water Electricity Sewerage and
sanitation Solid waste
management
2013 2014 2013* 2014 2013* 2014 2013* 2014 2013* 2014
Western Cape 30 30 0 0 4 4 0 0 1 1
Eastern Cape 45 45 0 0 37 37 0 0 1 1
Northern Cape 32 32 3 3 15 15 0 0 0 0
Free State 24 24 1 1 15 15 1 1 0 0
KwaZulu-Natal 61 61 2 2 57 57 2 2 2 2
North West 23 23 0 0 16 16 0 0 0 1
Gauteng 12 12 1 1 7 7 1 1 1 1
Mpumalanga 21 21 1 1 8 9 0 0 0 0
Limpopo 30 30 2 3 23 23 2 2 1 1
South Africa 278 278 10 11 182 183 6 6 6 7
* Some figures have been revised.

Statistics South Africa 18 P9115
Non-financial census of municipalities for the year ended 30 June 2014
Table 7 - Number of consumer units in each province receiving selected services from municipalities: 2013 and 2014
Province Water Electricity Sewerage and sanitation Solid waste management
2013* 2014 2013* 2014 2013* 2014 2013* 2014
Western Cape 1 202 348 1 223 563 1 241 350 1 260 398 1 061 682 1 087 067 1 172 648 1 184 892
Eastern Cape 1 494 344 1 550 681 1 144 731 1 168 878 1 142 293 1 284 399 766 131 802 073
Northern Cape 271 919 281 901 267 951 275 673 256 976 265 367 221 478 227 012
Free State 770 967 781 915 697 926 718 516 718 743 769 701 628 430 655 580
KwaZulu-Natal 2 068 512 2 118 994 1 609 718 1 658 519 1 867 052 1 994 091 1 423 290 1 466 259
North West 840 751 889 881 876 531 906 783 679 569 707 185 491 175 573 424
Gauteng 2 850 080 3 000 662 2 182 341 2 413 281 2 459 296 2 559 973 2 763 184 2 978 735
Mpumalanga 1 021 837 1 050 250 788 862 824 728 906 416 970 353 513 075 549 468
Limpopo 1 140 537 1 218 973 1 188 629 1 227 780 761 966 795 038 412 282 425 127
South Africa 11 661 295 12 116 820 9 998 039 10 454 556 9 853 993 10 433 174 8 391 693 8 862 570
* Some figures have been revised.

Statistics South Africa 19 P9115
Non-financial census of municipalities for the year ended 30 June 2014
Table 8 - Number of consumer units in each province receiving water from municipalities: 2013 and 2014
Province
Number of domestic consumer units served through a delivery point Total number of non-domestic consumer
units
Total consumer units for
basic water supply
Inside the yard Less than 200m from
yard More than 200m
from yard
Total number of domestic consumer
units
2013* 2014 2013* 2014 2013* 2014 2013* 2014 2013* 2014 2013* 2014
Western Cape 962 114 978 534 177 231 183 208 1 729 1 265 1 141 074 1 163 007 61 274 60 556 1 202 348 1 223 563
Eastern Cape 717 011 738 991 485 414 458 114 232 034 282 883 1 434 459 1 479 988 59 885 70 693 1 494 344 1 550 681
Northern Cape 204 479 214 134 48 949 48 995 9 434 9 625 262 862 272 754 9 057 9 147 271 919 281 901
Free State 658 882 677 847 74 928 68 200 6 992 5 230 740 802 751 277 30 165 30 638 770 967 781 915
KwaZulu-Natal 1 384 505 1 437 804 506 168 541 292 132 105 94 534 2 022 778 2 073 630 45 734 45 364 2 068 512 2 118 994
North West 566 730 616 582 158 444 174 528 107 758 90 623 832 932 881 733 7 819 8 148 840 751 889 881
Gauteng 2 263 191 2 416 146 389 182 332 413 100 459 123 887 2 752 832 2 872 446 97 248 128 216 2 850 080 3 000 662
Mpumalanga 726 911 806 457 179 824 128 344 68 378 67 061 975 113 1 001 862 46 724 48 388 1 021 837 1 050 250
Limpopo 408 393 426 542 569 904 647 748 150 507 131 483 1 128 804 1 205 773 11 733 13 200 1 140 537 1 218 973
South Africa 7 892 216 8 313 037 2 590 044 2 582 842 809 396 806 591 11 291 656 11 702 470 369 639 414 350 11 661 295 12 116 820
* Some figures have been revised.

Statistics South Africa 20 P9115
Non-financial census of municipalities for the year ended 30 June 2014
Table 9 - Number of consumer units in each province receiving basic sewerage and sanitation from municipalities: 2013 and 2014
Number of domestic consumer units connected to different types of toilet facilities in each province
Total number of non-domestic
consumer units
Total consumer units for
sewerage and sanitation
Province
Flush toilets connected to
public sewerage system
Flush toilets connected to septic tank
Bucket system Ventilated
improved pit latrines
Other Total number of
domestic consumer units
2013* 2014 2013* 2014 2013* 2013* 2014 2014 2013* 2014 2013* 2014 2013* 2014 2013* 2014
Western Cape 909 707 931 006 48 943 46 171 1 313 712 4 014 2 952 39 244 48 181 1 003 221 1 029 022 58 461 58 045 1 061 682 1 087 067
Eastern Cape 604 271 649 639 62 939 81 049 50 266 34 913 356 731 392 109 23 128 69 787 1 097 335 1 227 497 44 958 56 902 1 142 293 1 284 399
Northern Cape 163 373 167 719 27 059 27 249 8 765 9 406 47 433 49 019 1 466 1 532 248 096 254 925 8 880 10 442 256 976 265 367
Free State 510 441 555 083 20 224 12 532 34 638 30 759 118 840 117 239 4 978 23 816 689 121 739 429 29 622 30 272 718 743 769 701
KwaZulu-Natal 827 255 866 653 174 561 178 115 0 0 652 557 653 801 173 570 255 840 1 827 943 1 954 409 39 109 39 682 1 867 052 1 994 091
North West 421 364 434 319 35 001 43 309 4 078 6 417 131 789 140 925 80 173 73 977 672 405 698 947 7 164 8 238 679 569 707 185
Gauteng 1 997 087 2 187 885 7 507 10 115 58 58 83 218 71 907 264 087 152 391 2 351 957 2 422 356 107 339 137 617 2 459 296 2 559 973
Mpumalanga 456 537 484 556 27 122 31 309 1 500 1 800 152 421 283 778 224 499 139 421 862 079 940 864 44 337 29 489 906 416 970 353
Limpopo 283 952 290 632 15 399 14 306 0 0 353 026 325 057 101 578 156 937 753 955 786 932 8 011 8 106 761 966 795 038
South Africa 6 173 987 6 567 492 418 755 444 155 100 618 84 065 1 900 029 2 036 787 912 723 921 882 9 506 112 10 054
381 347 881 378 793 9 853 993
10 433 174
* Some figures have been revised.

Statistics South Africa 21 P9115
Non-financial census of municipalities for the year ended 30 June 2014
Table 10 - Number of municipalities in each province with a policy in place relating to free basic services: 2013 and 2014
* Some figures have been revised.
Province
Number of municipalities Free basic policy
2013 2014 2013* 2014
Western Cape 30 30 26 26
Eastern Cape 45 45 41 42
Northern Cape 32 32 27 27
Free State 24 24 20 20
KwaZulu-Natal 61 61 52 53
North West 23 23 19 19
Gauteng 12 12 10 10
Mpumalanga 21 21 18 18
Limpopo 30 30 29 28
South Africa 278 278 242 243

Statistics South Africa 22 P9115
Non-financial census of municipalities for the year ended 30 June 2014
Table 11 - Number of municipalities in each province which have implemented the policy relating to free basic services: 2013 and 2014
Province
Number of municipalities Water Electricity Sewerage and
sanitation Solid waste
management
2013 2014 2013* 2014 2013* 2014 2013* 2014 2013* 2014
Western Cape 30 30 26 26 26 26 26 26 26 26
Eastern Cape 45 45 24 24 38 39 23 23 30 32
Northern Cape 32 32 27 27 27 27 25 26 25 25
Free State 24 24 20 20 20 20 19 20 19 20
KwaZulu-Natal 61 61 15 15 40 41 12 12 29 30
North West 23 23 17 17 19 19 15 16 15 16
Gauteng 12 12 10 10 10 10 10 10 10 10
Mpumalanga 21 21 18 18 18 17 16 15 16 15
Limpopo 30 30 11 11 25 25 10 10 19 21
South Africa 278 278 168 168 223 224 156 158 189 195
* Some figures have been revised.

Statistics South Africa 23 P9115
Non-financial census of municipalities for the year ended 30 June 2014
Table 12 - Number of municipalities in each province providing free basic services at standard and other levels: 2013 and 2014
Province
Water Electricity Sewerage and sanitation Solid waste management
6kl Other 50kWh Other More than
average (R50) Other
More than average (R50)
Other
2013* 2014 2013* 2014 2013* 2014 2013* 2014 2013* 2014 2013* 2014 2013* 2014 2013* 2014
Western Cape 23 23 3 3 20 19 6 7 22 23 4 3 22 23 4 3
Eastern Cape 20 20 4 4 37 36 1 3 16 16 7 7 25 28 5 4
Northern Cape 22 23 5 4 26 27 1 . 22 23 3 3 19 21 6 4
Free State 17 17 3 3 20 20 . . 18 17 1 3 11 16 8 4
KwaZulu-Natal 13 12 2 3 36 36 4 5 10 10 2 2 20 21 9 9
North West 16 16 1 1 18 18 1 1 9 9 6 7 11 11 4 5
Gauteng 7 6 3 4 6 6 4 4 4 6 6 4 7 9 3 1
Mpumalanga 17 15 1 3 18 17 . . 7 9 9 6 10 10 6 5
Limpopo 9 9 2 2 22 22 3 3 5 5 5 5 11 13 8 8
South Africa 144 141 24 27 203 201 20 23 113 118 43 40 136 152 53 43
* Some figures have been revised.
. Not selected by municipalities.

Statistics South Africa 24 P9115
Non-financial census of municipalities for the year ended 30 June 2014
Table 13 - Number of domestic consumer units in each province receiving free basic services from municipalities: 2013 and 2014
Province Water Electricity Sewerage and sanitation Solid waste management
2013* 2014 2013* 2014 2013* 2014 2013* 2014
Western Cape 944 844 926 007 560 877 565 442 738 830 749 909 553 379 625 246
Eastern Cape 678 014 610 690 313 343 300 888 501 222 538 619 224 769 223 579
Northern Cape 91 240 68 700 68 292 64 961 58 353 56 013 59 073 56 000
Free State 272 151 187 111 171 847 172 863 144 716 158 000 146 547 137 256
KwaZulu-Natal 814 266 856 225 180 181 243 532 397 867 461 710 698 875 691 111
North West 188 894 212 265 152 030 171 714 97 872 100 412 97 866 103 291
Gauteng 1 077 660 830 471 677 341 517 673 891 986 785 349 482 053 343 713
Mpumalanga 581 307 433 979 262 848 176 270 97 053 102 273 88 370 95 002
Limpopo 480 787 508 551 141 913 151 804 207 705 226 445 77 457 96 445
South Africa 5 129 163 4 633 999 2 528 672 2 365 147 3 135 604 3 178 730 2 428 389 2 371 643
* Some figures have been revised.
Statistics South Africa 25 P9115
Non-financial census of municipalities for the year ended 30 June 2014
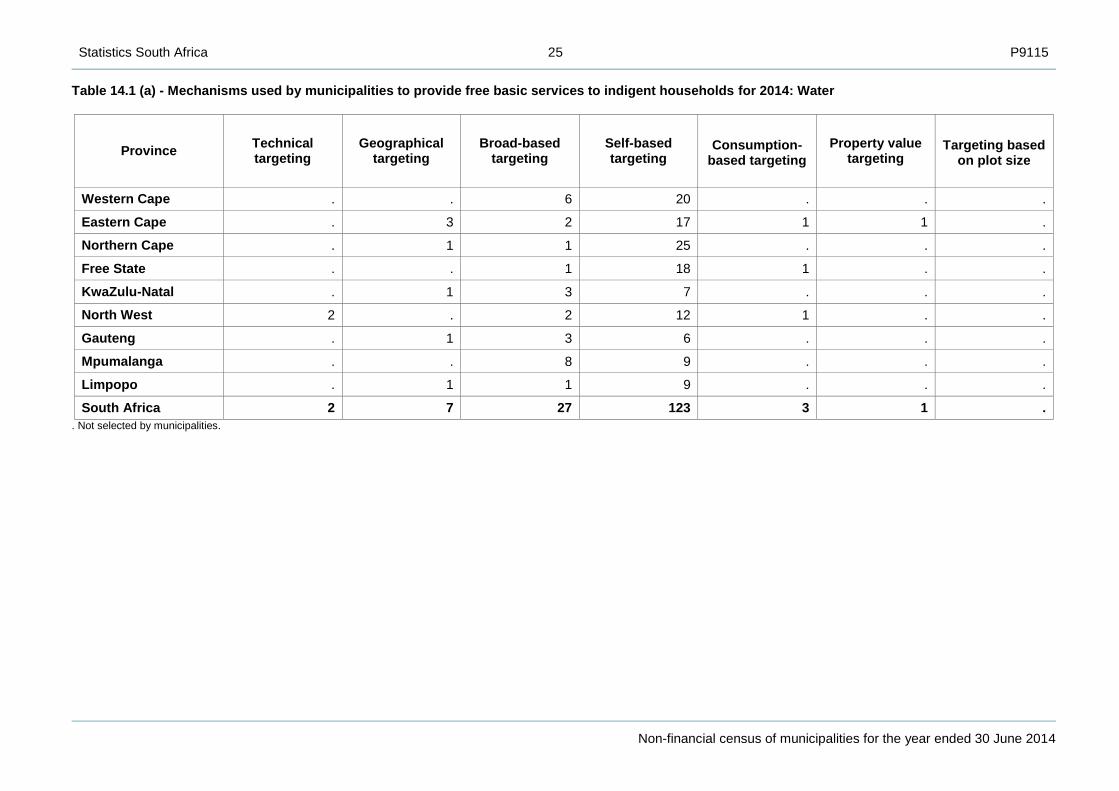
Table 14.1 (a) - Mechanisms used by municipalities to provide free basic services to indigent households for 2014: Water
Province Technical targeting
Geographical targeting
Broad-based targeting
Self-based targeting
Consumption- based targeting
Property value targeting
Targeting based on plot size
Western Cape . . 6 20 . . .
Eastern Cape . 3 2 17 1 1 .
Northern Cape . 1 1 25 . . .
Free State . . 1 18 1 . .
KwaZulu-Natal . 1 3 7 . . .
North West 2 . 2 12 1 . .
Gauteng . 1 3 6 . . .
Mpumalanga . . 8 9 . . .
Limpopo . 1 1 9 . . .
South Africa 2 7 27 123 3 1 .
. Not selected by municipalities.

Statistics South Africa 26 P9115
Non-financial census of municipalities for the year ended 30 June 2014
Table 14.1 (b) - Mechanisms used by municipalities to provide free basic services to indigent households for 2014: Electricity
Province Technical targeting
Geographical targeting
Broad-based targeting
Self-based targeting
Consumption- based targeting
Property value targeting
Targeting based on plot size
Western Cape . . 2 24 . . .
Eastern Cape 3 3 . 31 1 1 .
Northern Cape . 1 . 26 . . .
Free State . . 2 18 . . .
KwaZulu-Natal 1 . . 38 . 1 .
North West 2 . . 15 1 . .
Gauteng . 1 1 8 . . .
Mpumalanga . . 3 14 . . .
Limpopo 1 . . 24 . . .
South Africa 7 5 8 198 2 2 .
. Not selected by municipalities.

Statistics South Africa 27 P9115
Non-financial census of municipalities for the year ended 30 June 2014
Table 14.1 (c) - Mechanisms used by municipalities to provide free basic services to indigent households for 2014: Sewerage and sanitation
Province Technical targeting
Geographical targeting
Broad-based targeting
Self-based targeting
Consumption- based targeting
Property value targeting
Targeting based on plot size
Western Cape . . 1 25 . . .
Eastern Cape 1 3 2 16 . 1 .
Northern Cape . 1 . 25 . . 1
Free State . . . 20 . . .
KwaZulu-Natal . 1 1 7 . 1 .
North West 1 . 1 13 1 . .
Gauteng . 1 1 8 . . .
Mpumalanga . . . 15 . . .
Limpopo . 1 . 9 . . .
South Africa 2 7 6 138 1 2 1
. Not selected by municipalities.

Statistics South Africa 28 P9115
Non-financial census of municipalities for the year ended 30 June 2014
Table 14.1 (d) - Mechanisms used by municipalities to provide free basic services to indigent households for 2014: Solid waste management
Province Technical targeting
Geographical targeting
Broad-based targeting
Self-based targeting
Consumption- based targeting
Property value targeting
Targeting based on plot
size
Western Cape . . . 26 . . .
Eastern Cape . 3 . 28 . 1 .
Northern Cape . 1 . 24 . . .
Free State . . . 20 . . .
KwaZulu-Natal . . 1 28 . 1 .
North West . . 1 14 1 . .
Gauteng . 1 1 8 . . .
Mpumalanga . . . 15 . . .
Limpopo . . . 21 . . .
South Africa . 5 3 184 1 2 .
. Not selected by municipalities.
Statistics South Africa 29 P9115
Non-financial census of municipalities for the year ended 30 June 2014
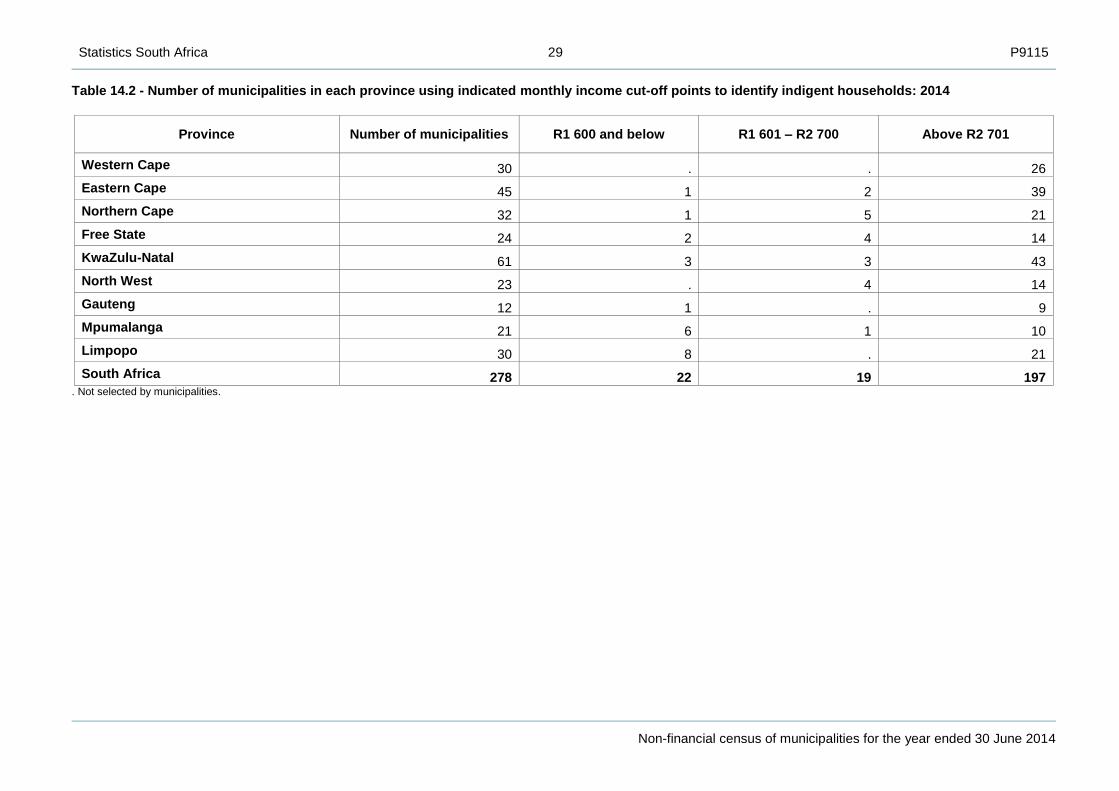
Table 14.2 - Number of municipalities in each province using indicated monthly income cut-off points to identify indigent households: 2014
Province Number of municipalities R1 600 and below R1 601 – R2 700 Above R2 701
Western Cape 30 . . 26
Eastern Cape 45 1 2 39
Northern Cape 32 1 5 21
Free State 24 2 4 14
KwaZulu-Natal 61 3 3 43
North West 23 . 4 14
Gauteng 12 1 . 9
Mpumalanga 21 6 1 10
Limpopo 30 8 . 21
South Africa 278 22 19 197 . Not selected by municipalities.

Statistics South Africa 30 P9115
Non-financial census of municipalities for the year ended 30 June 2014
Table 15 - Number of municipalities in each province with an indigent support policy: 2013 and 2014
Province
Number of municipalities Indigent support policy
2013 2014 2013* 2014
Western Cape 30 30 26 26
Eastern Cape 45 45 41 42
Northern Cape 32 32 27 27
Free State 24 24 20 20
KwaZulu-Natal 61 61 46 48
North West 23 23 18 18
Gauteng 12 12 10 10
Mpumalanga 21 21 16 17
Limpopo 30 30 29 29
South Africa 278 278 233 237
* Some figures have been revised.

Statistics South Africa 31 P9115
Non-financial census of municipalities for the year ended 30 June 2014
Table 16 - Number of municipalities in each province which have implemented an indigent support policy: 2013 and 2014
Province
Number of municipalities Water Electricity Sewerage and
sanitation Solid waste
management
2013 2014 2013* 2014 2013* 2014 2013* 2014 2013* 2014
Western Cape 30 30 26 26 26 26 26 26 26 26
Eastern Cape 45 45 24 24 38 39 23 23 30 32
Northern Cape 32 32 27 27 27 27 25 26 25 25
Free State 24 24 20 20 20 20 19 20 19 20
KwaZulu-Natal 61 61 12 11 38 40 11 10 29 30
North West 23 23 17 17 18 18 15 16 15 16
Gauteng 12 12 10 10 10 10 10 10 10 10
Mpumalanga 21 21 15 17 16 17 14 15 14 15
Limpopo 30 30 11 11 25 25 10 10 19 21
South Africa 278 278 162 163 218 222 153 156 187 195
* Some figures have been revised.

Statistics South Africa 32 P9115
Non-financial census of municipalities for the year ended 30 June 2014
Table 17 - Number of indigent households in each province benefiting from an indigent support system over the period 2013 and 2014
Province
Indigent households identified by the municipalities
Beneficiaries
Water Electricity Sewerage and
sanitation Solid waste
management
2013* 2014 2013* 2014 2013* 2014 2013* 2014 2013* 2014
Western Cape 419 140 413 259 414 775 406 262 406 089 407 377 407 408 400 143 409 349 403 476
Eastern Cape 808 109 829 371 559 529 570 823 287 309 300 888 469 340 527 159 224 769 223 579
Northern Cape 76 252 71 274 73 512 66 514 65 221 64 232 57 184 55 905 57 904 55 901
Free State 141 127 122 611 141 100 122 427 139 827 121 099 132 142 122 486 134 973 122 465
KwaZulu-Natal 765 766 770 049 572 767 589 008 168 681 217 988 367 768 432 846 684 401 670 032
North West 159 879 184 510 106 787 117 640 146 320 165 974 97 872 100 412 97 543 103 291
Gauteng 335 177 484 861 247 843 228 304 230 116 484 861 259 091 240 128 326 584 308 734
Mpumalanga 123 090 140 777 98 076 131 449 106 139 133 829 85 211 94 037 86 769 87 566
Limpopo 514 314 465 548 232 404 227 708 141 906 151 804 111 655 115 452 75 306 94 744
South Africa 3 342 854 3 482 260 2 446 793 2 460 135 1 691 608 2 048 052 1 987 671 2 088 568 2 097 598 2 069 788
* Some figures have been revised.
Statistics South Africa 33 P9115
Non-financial census of municipalities for the year ended 30 June 2014
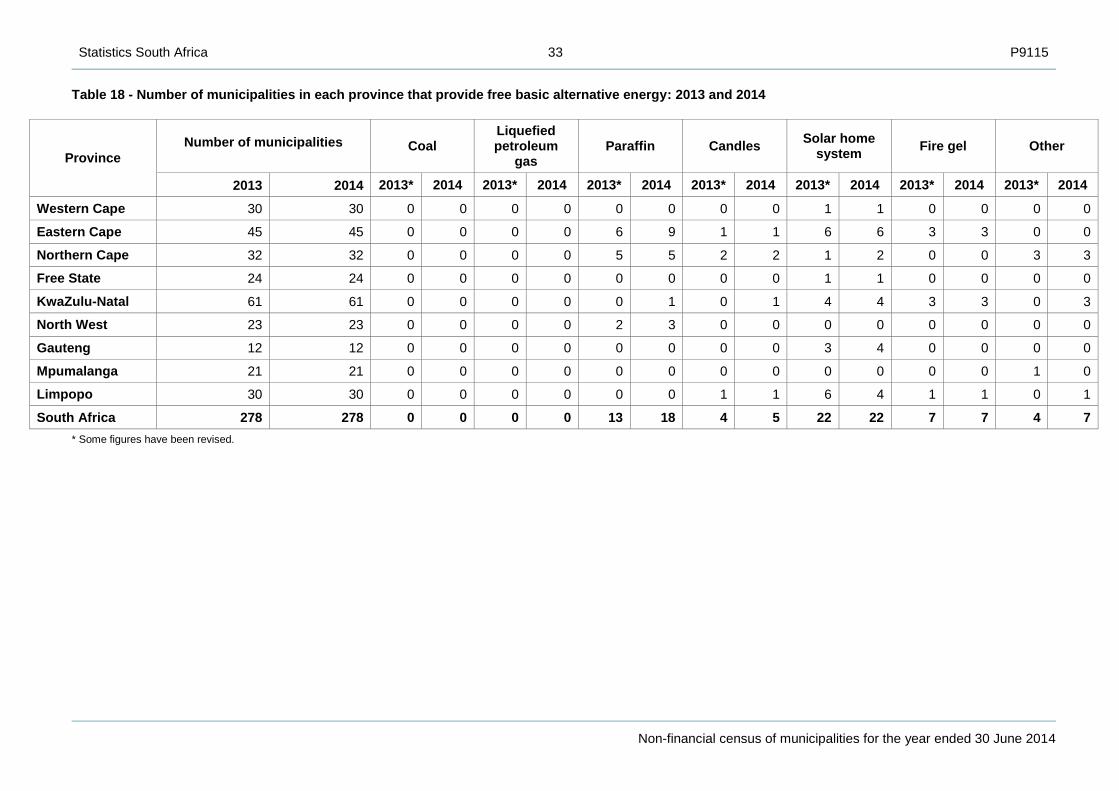
Table 18 - Number of municipalities in each province that provide free basic alternative energy: 2013 and 2014
Province
Number of municipalities Coal
Liquefied petroleum
gas Paraffin Candles
Solar home system
Fire gel Other
2013 2014 2013* 2014 2013* 2014 2013* 2014 2013* 2014 2013* 2014 2013* 2014 2013* 2014
Western Cape 30 30 0 0 0 0 0 0 0 0 1 1 0 0 0 0
Eastern Cape 45 45 0 0 0 0 6 9 1 1 6 6 3 3 0 0
Northern Cape 32 32 0 0 0 0 5 5 2 2 1 2 0 0 3 3
Free State 24 24 0 0 0 0 0 0 0 0 1 1 0 0 0 0
KwaZulu-Natal 61 61 0 0 0 0 0 1 0 1 4 4 3 3 0 3
North West 23 23 0 0 0 0 2 3 0 0 0 0 0 0 0 0
Gauteng 12 12 0 0 0 0 0 0 0 0 3 4 0 0 0 0
Mpumalanga 21 21 0 0 0 0 0 0 0 0 0 0 0 0 1 0
Limpopo 30 30 0 0 0 0 0 0 1 1 6 4 1 1 0 1
South Africa 278 278 0 0 0 0 13 18 4 5 22 22 7 7 4 7
* Some figures have been revised.
Statistics South Africa 34 P9115
Non-financial census of municipalities for the year ended 30 June 2014
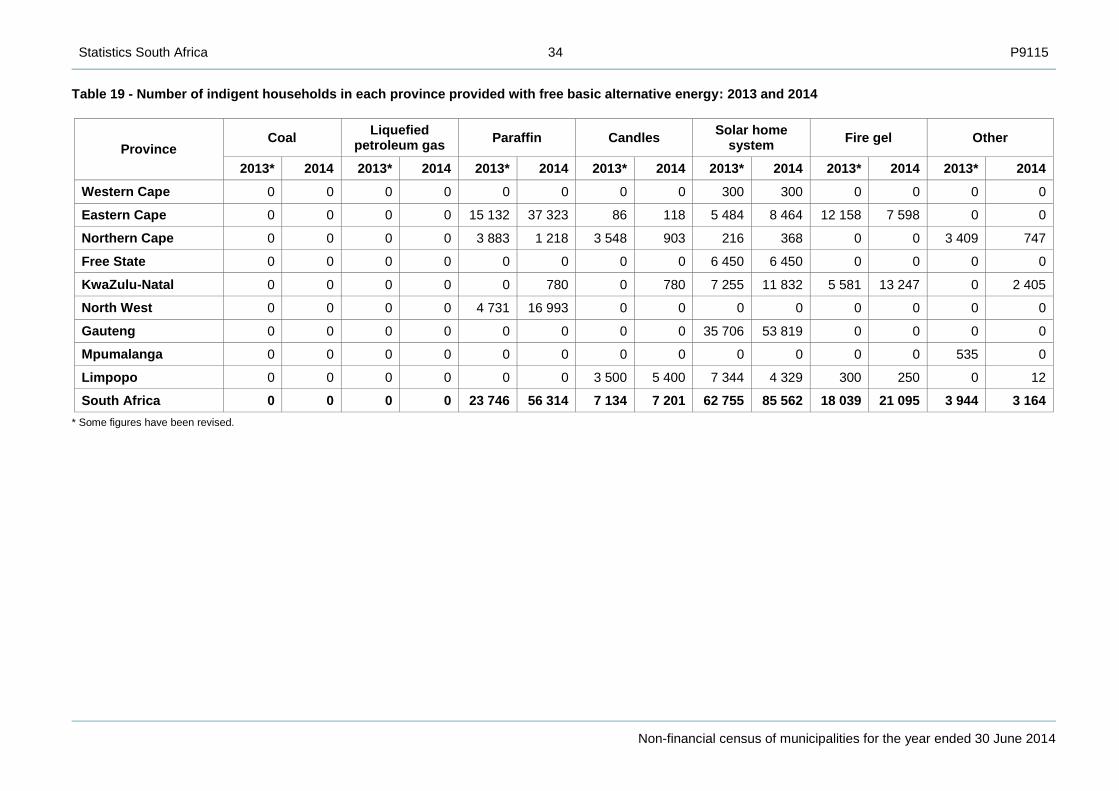
Table 19 - Number of indigent households in each province provided with free basic alternative energy: 2013 and 2014
Province Coal
Liquefied petroleum gas
Paraffin Candles Solar home
system Fire gel Other
2013* 2014 2013* 2014 2013* 2014 2013* 2014 2013* 2014 2013* 2014 2013* 2014
Western Cape 0 0 0 0 0 0 0 0 300 300 0 0 0 0
Eastern Cape 0 0 0 0 15 132 37 323 86 118 5 484 8 464 12 158 7 598 0 0
Northern Cape 0 0 0 0 3 883 1 218 3 548 903 216 368 0 0 3 409 747
Free State 0 0 0 0 0 0 0 0 6 450 6 450 0 0 0 0
KwaZulu-Natal 0 0 0 0 0 780 0 780 7 255 11 832 5 581 13 247 0 2 405
North West 0 0 0 0 4 731 16 993 0 0 0 0 0 0 0 0
Gauteng 0 0 0 0 0 0 0 0 35 706 53 819 0 0 0 0
Mpumalanga 0 0 0 0 0 0 0 0 0 0 0 0 535 0
Limpopo 0 0 0 0 0 0 3 500 5 400 7 344 4 329 300 250 0 12
South Africa 0 0 0 0 23 746 56 314 7 134 7 201 62 755 85 562 18 039 21 095 3 944 3 164
* Some figures have been revised.

Statistics South Africa 35 P9115
Non-financial census of municipalities for the year ended 30 June 2014
Table 20 - Number of municipalities in each province that have submitted an Integrated Development Plan (IDP), WSDP, monitoring for water quality and effluent discharges, and an HIV/AIDS policy, and signed a funding agreement with Eskom: 2013 and 2014
Province
Number of municipalities IDP submitted
WSDP submitted
Monitoring for water quality
Monitoring for effluent
discharges
Funding agreement with
Eskom HIV/AIDS policy
2013 2014 2013* 2014 2013* 2014 2013* 2014 2013* 2014 2013* 2014 2013* 2014
Western Cape 30 30 30 30 25 25 28 28 26 28 21 22 27 26
Eastern Cape 45 45 39 41 17 18 21 22 22 25 19 26 34 36
Northern Cape 32 32 32 32 24 22 31 29 21 20 21 18 29 29
Free State 24 24 23 18 15 13 21 17 11 12 14 9 17 11
KwaZulu-Natal 61 61 61 58 12 11 16 15 19 16 40 40 54 52
North West 23 23 19 20 13 13 16 17 12 15 10 13 15 17
Gauteng 12 12 12 12 10 10 10 10 10 10 9 9 12 12
Mpumalanga 21 21 20 20 17 15 17 17 16 16 11 11 18 18
Limpopo 30 30 27 25 15 12 17 13 13 13 15 10 21 20
South Africa 278 278 263 256 148 139 177 168 150 155 160 158 227 221
* Some figures have been revised.
.

Statistics South Africa 36 P9115
Non-financial census of municipalities for the year ended 30 June 2014
Explanatory notes
Introduction This publication contains results of the annual non-financial census of municipalities for the financial years ended 30 June 2013 and 30 June 2014.
Scope of the survey This survey covers selected non-financial information of all 278 municipalities for 2013/14. The census provides information that can serve as a framework for policymakers and other stakeholders for analysis, planning and monitoring in terms of service delivery of water, electricity, solid waste management, sewerage and sanitation, indigent households and employment.
Statistical unit The statistical unit is the municipality.
Survey methodology and design The information is collected annually from 278 municipalities administered through questionnaires by means of personal visits, email and fax.
Reliability of estimates Inaccuracies may occur because of imperfections in reporting by municipalities. Every effort is made to reduce errors to a minimum by carefully designing the questionnaire, undertaking pilot studies/workshops and editing the data.
Abbreviations and symbols 0
.
Nil or not applicable Not selected by municipality
IDP Integrated Development Plan
WSDP Water Services Development Plan
Stats SA Statistics South Africa
Comparability with previous census
The 2014 non-financial census of municipalities is generally comparable with the 2013 non-financial census of municipalities.
Revision of data The 2014 information is preliminary, and is subject to revision. The revised figures are due to respondents reporting revisions.

Statistics South Africa 37 P9115
Non-financial census of municipalities for the year ended 30 June 2014
Glossary of the selected variables
Broad-based approach
Each consumer unit in that municipality receives free basic services on the current billing system of the municipality.
Consumer unit/billing unit An entity to which the service is (or would be) delivered, and which receives one bill if the service is billed, alternatively known as a delivery point. (This concept is often referred to as a household by municipalities, but this is not strictly correct, as households and consumer units do not coincide one to one, particularly in blocks of flats, on stands where there are multiple households in the same dwelling, or in additional dwellings, such as garden flats, backyard rooms, etc., and in the case of public taps.)
District municipality District municipality means a municipality that has municipal executive and legislative authority in an area that includes more than one municipality, and which is described in section 155(1) of the Constitution as a category C municipality. (Refer to Local Government: Municipal Structures Act, 1998 (Act No,117 of 1998).)
Domestic consumer unit Employees
An entity to which the service is (or would be) delivered, and which receives one bill if the service is billed, alternatively known as a delivery point. (This concept is often referred to as a household by municipalities, but this is not strictly correct, as households and consumer units do not coincide one to one, particularly in blocks of flats, on stands where there are multiple households in the same dwelling or in additional dwellings, such as garden flats, backyard rooms, etc., and in the case of public taps.) Employees are those people employed by the individual / enterprise / business / organisation who received payment (in salaries, wages, commission, piece rates or payments in kind) for any part of the reference period (excluding independent contractors and employers).
Free basic water An amount of water determined by government that should be provided free to poor households to meet basic needs, currently set at 6 kl per month per household within 200 metres from each dwelling.
Full-time employees Full-time employees are those employees (permanent, temporary or casual) who normally work the agreed hours for a full-time employee in a specific occupation. If agreed hours do not apply, employees are regarded as full-time if they normally work 35 hours per week, including seasonal employees.
Geographical approach Household
The process whereby consumers living in a particular area are assumed to have the same socio-economic profile and therefore tariffs can be set on location. (a) A group of persons who live together and provide themselves jointly with food or other essentials for living, or a single person who lives alone, (b) A billing unit or delivery point. Both definitions were specified in the questionnaire. Given the different meanings of ‘household’, users are advised to use caution when comparing this publication with other Stats SA publications that report data at the household level (for example, the General Household Survey and the Quarterly Labour Force Survey).

Statistics South Africa 38 P9115
Non-financial census of municipalities for the year ended 30 June 2014
Indigent household
These are poor households as determined by municipalities. The basis on which a municipality determines if a household is indigent (and the criteria used for such determination) can vary.
Infrastructure Physical structures used for the delivery of services (e.g. power lines, pipes, roads and assets such as trucks and equipment to unblock sewerage, pay-point offices and computers).
Integrated Development Plan A process by which municipalities prepare 5-year strategic plans that are reviewed annually in consultation with communities and stakeholders.
Local municipality
Local municipality means a municipality that shares municipal executive and legislative authority in its area with a district municipality within whose area it falls, and which is described in section 155(1) of the Constitution as a category B municipality. (Refer to Local Government: Municipal Structures Act, 1998 (Act No, 117 of 1998).)
Managerial position For the purpose of this survey, managerial positions refer to section 57 managers, according to the Local Government Municipal System Act, 2000 (Act No, 32 of 2000) and other managers according to the organogram.
Metropolitan municipality Metropolitan municipality means a municipality that has exclusive executive and legislative authority in its area, and which is described in section 155(1) of the Constitution as a category A municipality. (Refer to Local Government: Municipal Structure Act 1998, (Act No, 117 of 1998).)
Municipality Municipality is a generic term describing the unit of government in the local sphere responsible for local government in a geographically demarcated area, and includes district, local and metropolitan municipalities. A municipality is an institution consisting of a municipal council (elected political representatives) and the municipal administration (appointed officials).
Non-domestic unit
Part-time employees
This includes all other consumer units excluding domestic – e.g. industrial, commercial, schools, clinics, hospitals and government departments etc.
Part-time employees are employees (permanent, temporary or casual) who are not full-time employees as defined above or who normally work less than 35 hours per week, including seasonal employees.
Self-targeting approach A system whereby only indigent households receive the benefits of the free basic services programme as mutually determined by the service provider and service authority.
Technical targeting approach
The process whereby technology is used to regulate the provision of free basic services (including water and electricity meters).
Water Service Development Plan The WSDP is a sectoral plan that falls within the inter-sectoral umbrella plan of the IDP.

Statistics South Africa 39 P9115
Non-financial census of municipalities for the year ended 30 June 2014
Technical enquiries
Malibongwe Mhemhe Telephone number: (+27 12) 310 6928 Email: [email protected]
Hellen Maribe Telephone number: (012) 310 2931 Email: hellenm@statssa,gov,za

Statistics South Africa 40 P9115
Non-financial census of municipalities for the year ended 30 June 2014
General information
Statistics South Africa publishes approximately 300 different statistical releases each year. It is not economically viable to produce them in more than one of South Africa's eleven official languages. Since the releases are used extensively, not only locally but also by international economic and social-scientific communities, Stats SA releases are published in English only. Stats SA has copyright on this publication. Users may apply the information as they wish, provided that they acknowledge Stats SA as the source of the basic data wherever they process, apply, utilise, publish or distribute the data, and also that they specify that the relevant application and analysis (where applicable) result from their own processing of the data. Advance release calendar An advance release calendar is disseminated on www.statssa.gov.za/Publications Stats SA products A complete set of Stats SA publications is available at the Stats SA Library and the following libraries: National Library of South Africa, Pretoria Division National Library of South Africa, Cape Town Division Natal Society Library, Pietermaritzburg Library of Parliament, Cape Town Bloemfontein Public Library Johannesburg Public Library Eastern Cape Library Services, King William’s Town Central Regional Library, Polokwane Central Reference Library, Mbombela Central Reference Collection, Kimberley Central Reference Library, Mmabatho Stats SA also provides a subscription service. Electronic services A large range of data is available via online services. For more details about our electronic services, contact Stats SA’s user information services at (+27 12) 310 8600.
You can visit us on the Internet at: www.statssa.gov.za
Forth coming issues Issue Expected release date
Non-financial census of municipalities August 2016
General enquiries
User information services: Telephone number: (+27 12) 310 8600/8390 Email address: [email protected]
Orders/subscription: Telephone number: (+27 12) 310 8358
Email address: [email protected]
Postal address: Private Bag X44, Pretoria, 0001
Produced by Stats SA
Related Documents