Non-deal Roadshows in Singapore, Bangkok and Hong Kong 19 – 27 September 2019

Welcome message from author
This document is posted to help you gain knowledge. Please leave a comment to let me know what you think about it! Share it to your friends and learn new things together.
Transcript

Non-deal Roadshows
in Singapore, Bangkok
and Hong Kong
19 – 27 September 2019

Important Notice
The past performance of Keppel Pacific Oak US REIT is not necessarily indicative of its future performance. Certain statements made in this release may not be based on historical information or
facts and may be “forward-looking” statements due to a number of risks, uncertainties and assumptions. Representative examples of these factors include (without limitation) general industry and
economic conditions, interest rate trends, cost of capital and capital availability, competition from similar developments, shifts in expected levels of property rental income, changes in operating
expenses, including employee wages, benefits and training, property expenses and governmental and public policy changes, and the continued availability of financing in the amounts and terms
necessary to support future business.
Prospective investors and unitholders of Keppel Pacific Oak US REIT (Unitholders) are cautioned not to place undue reliance on these forward-looking statements, which are based on the current
view of Keppel Pacific Oak US REIT Management Pte. Ltd., as manager of Keppel Pacific Oak US REIT (the Manager) on future events. No representation or warranty, express or implied, is made
as to, and no reliance should be placed on, the fairness, accuracy, completeness or correctness of the information, or opinions contained in this release. None of the Manager, the trustee of Keppel
Pacific Oak US REIT or any of their respective advisors, representatives or agents shall have any responsibility or liability whatsoever (for negligence or otherwise) for any loss howsoever arising
from any use of this release or its contents or otherwise arising in connection with this release. The information set out herein may be subject to updating, completion, revision, verification and
amendment and such information may change materially. The value of units in Keppel Pacific Oak US REIT (Units) and the income derived from them may fall as well as rise. Units are not
obligations of, deposits in, or guaranteed by, the Manager or any of its affiliates. An investment in Units is subject to investment risks, including possible loss of principal amount invested.
Investors have no right to request the Manager to redeem their Units while the Units are listed. It is intended that Unitholders may only deal in their Units through trading on Singapore Exchange
Securities Trading Limited (SGX-ST). Listing of the Units on SGX-ST does not guarantee a liquid market for the Units.
Content Outline
• Overview
• Key Growth Markets Overview
• Proposed Acquisition of One Twenty Five in Dallas, Texas
• Looking Ahead
3
7
13
24

Overview
Tenant lounge
The Westpark Portfolio
Seattle, Washington

4
▪ Distinctive US office REIT focused on
key growth markets significantly driven by
innovation and technology
▪ Exposure to freehold office buildings and
business campuses in first choice submarkets
About Keppel Pacific
Oak US REIT
Tenant space, Bellevue Technology Center, Seattle, Washington
Investment
mandate
▪ To invest in a diversified portfolio of income-producing
commercial assets and real estate-related assets
in key growth markets of the US with favourable
economic and office fundamentals
Distribution
Policy &
Distribution
Currency
▪ Semi-annual distributions
▪ 100% of annual distributable income for the period from
Listing Date to the end of Projection Year 2019, and
at least 90% of annual distributable income for each
financial year thereafter
▪ Distributions declared in US dollars; Unitholders
have the option to receive distributions in Singapore
or US dollars (by submitting a ‘Currency Election Form’)
Sponsors ▪ Keppel Capital and KBS Pacific Advisors
Manager ▪ Keppel Pacific Oak US REIT Management Pte. Ltd.
Exposure to key growth markets in the US
Benefitting from solid US office real estate fundamentals
Tax advantaged structure

Healthy committedoccupancy levels
2.4% from end-2018
~376,000 sf of total space leased in 1H 2019, equivalent to 8.8% of the portfolio, bringing portfolio committed occupancy to 94.0%
Annualised Distribution Yield
7.9%
Based on the market closing
price of US$0.765 per Unit
as at 30 June 2019
5
▪ Significant contributions from the two acquisitions
in Seattle (November 2018) and Florida (January
2019)
▪ Positive rental reversion of 8.6% for 1H 2019
▪ Continued healthy leasing momentum
Distributable IncomeUS$24.8 million
30.9%Outperformed 1H 2018 and IPO Forecast by 30.9% and 23.1% respectively
Distribution per Unit3.00 US cents
31.0%
1H 2019 DPU was 31.0% and
23.0% above actual 1H 2018 and
IPO Forecast adjusted DPU
respectively
Key Highlights
Delivering Growth in 1H 2019
Tenant space, Westmoor Center, Denver, Colorado

6
First Choice Submarkets in Key US Growth Markets
West Coast (43.3%)
Central (39.6%)
East Coast (17.1%)
Dallas, Texas (9.4%)
One Twenty FiveOccupancy: 95.5%
All information as at 30 June 2019.
Percentage breakdown adjusted to include the proposed acquisition of One Twenty Five, based on cash rental
income, and on an enlarged portfolio as at 30 June 2019. Keppel Pacific Oak US REIT announced the proposed
acquisition of One Twenty Five in Dallas, Texas, on 6 September 2019.
Expanding footprint to a new key growth market of Dallas with the proposed acquisition of One Twenty Five

Neighbouring Park
Dallas, Texas
Key Growth
Markets
Overview
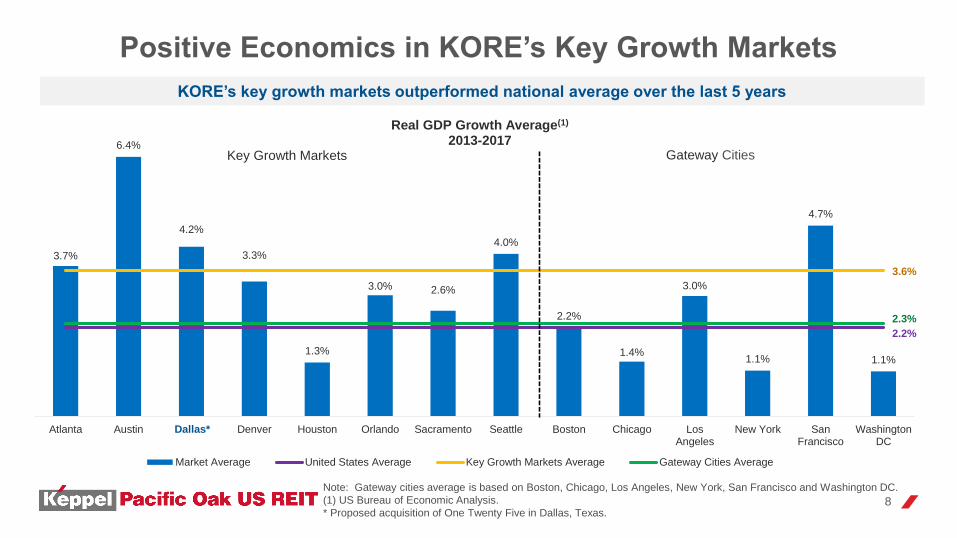
3.7%
6.4%
4.2%
3.3%
1.3%
3.0% 2.6%
4.0%
2.2%
1.4%
3.0%
1.1%
4.7%
1.1%
2.2%
3.6%
2.3%
Atlanta Austin Dallas Denver Houston Orlando Sacramento Seattle Boston Chicago LosAngeles
New York SanFrancisco
WashingtonDC
Real GDP Growth Average(1)
2013-2017
Market Average United States Average Key Growth Markets Average Gateway Cities Average
Key Growth Markets Gateway Cities
Note: Gateway cities average is based on Boston, Chicago, Los Angeles, New York, San Francisco and Washington DC.
(1) US Bureau of Economic Analysis.
* Proposed acquisition of One Twenty Five in Dallas, Texas.
Positive Economics in KORE’s Key Growth Markets
KORE’s key growth markets outperformed national average over the last 5 years
8
Dallas*

2.8%
3.6%
3.0%2.8%
1.6%
4.0%
2.9% 2.8%
1.7%
1.3%
1.9% 1.7%
3.0%
1.4%
1.8%
2.9%
Atlanta Austin Dallas Denver Houston Orlando Sacramento Seattle Boston Chicago LosAngeles
New York SanFrancisco
WashingtonDC
Employment Growth Average(1)
2014-2018
Market Average United States and Gateway Cities Average Key Growth Markets Average
Key Growth Markets Gateway Cities
Rising Employment in KORE’s Key Growth Markets
KORE’s key growth markets outperformed national average over the last 5 years
9
Dallas*
Note: Gateway cities average is based on Boston, Chicago, Los Angeles, New York, San Francisco and Washington DC.
(1) US Bureau of Economic Analysis.
* Proposed acquisition of One Twenty Five in Dallas, Texas.

1.5%
2.9%
2.0%
1.7%
2.0%
2.5%
1.2%
1.8%
0.7%
-0.1%
0.3%0.1%
0.9%1.0%
0.7%
2.0%
0.5%
Atlanta Austin Dallas Denver Houston Orlando Sacramento Seattle Boston Chicago LosAngeles
New York SanFrancisco
WashingtonDC
Population Growth Average(1)
2014-2018
Market Average United States Average Key Growth Markets Average Gateway Cities Average
Key Growth Markets Gateway Cities
Expanding Population in KORE’s Key Growth Markets
KORE’s key growth markets outperformed national average over the last 5 years
10
Dallas*
Note: Gateway cities average is based on Boston, Chicago, Los Angeles, New York, San Francisco and Washington DC.
(1) US Bureau of Economic Analysis.
* Proposed acquisition of One Twenty Five in Dallas, Texas.

2.5%
3.5%
3.1%
2.6%
3.5%
3.1%2.9%
2.7%
2.2%
1.5%
2.0%
1.8%
3.0%
2.2%
2.1%
3.0%
0.0%
1.0%
2.0%
3.0%
4.0%
Atlanta Austin Dallas Denver Houston Orlando Sacramento Seattle Boston Chicago LosAngeles
New York SanFrancisco
WashingtonDC
Real GDP Growth Average Forecast(1)
2018-2022F
Market Average United States & Gateway Cities Average Key Growth Markets Average
Positive Economic Outlook in KORE’s Key Growth Markets
KORE’s Key Growth Markets are Forecasted to Outperform National Average
Key Growth Markets Gateway Cities
Note: Gateway cities average is based on Boston, Chicago, Los Angeles, New York, San Francisco and Washington DC.
Sources: IMF, World Economic Outlook; US Metro Economies
* Proposed acquisition of One Twenty Five in Dallas, Texas.
11
Dallas*

1.5%
2.6%
2.0%
1.6%
2.0%
2.3%
1.7%
1.5%
0.9%
0.7%
0.9%
0.7%
1.4%
1.2%
0.7%
1.9%
1.0%
0.0%
1.0%
2.0%
3.0%
Atlanta Austin Dallas Denver Houston Orlando Sacramento Seattle Boston Chicago LosAngeles
New York SanFrancisco
WashingtonDC
Employment Growth Average Forecast(1)
2018-2022F
Market Average United States Average Key Growth Markets Average Gateway Cities Average
Positive Job Outlook in KORE’s Key Growth Markets
KORE’s Key Growth Markets are Forecasted to Outperform National Average
Gateway CitiesKey Growth Markets
Note: Gateway cities average is based on Boston, Chicago, Los Angeles, New York, San Francisco and Washington DC.
(1) U.S Bureau of Labor Statistics, US Metro Economies
* Proposed acquisition of One Twenty Five in Dallas, Texas.
12
Dallas*

Proposed
Acquisition of
One Twenty Five
in Dallas, Texas
One Twenty Five
Dallas, Texas

14
Expanding Footprint to the Key Growth Market of Dallas
(1) As at 30 June 2019
(2) Based on Cash Rental Income as at 30 June 2019. WALE is 7.0 years based on NLA
• Key Growth Market: Latest
acquisition extends KORE’s
presence to 8 key growth markets
• Coveted Live-Work-Play
Destination: Las Colinas is an
attractive submarket that continues
to attract a young, well-educated
and highly affluent population
• Highly Accessible: Near major
thoroughfares, easy freeway
access and proximity to airport
• Strong Leasing Demand:
Supported by limited supply of
quality office spaces, as well as
strong employment growth and
population expansion
Property
Description
• Office complex comprising two Class A
office buildings
– 125 East John Carpenter
– 5100 North O’Connor
• Located in the first choice submarket of
Las Colinas in Dallas, Texas
• Modern interior finishes that appeal to office users
• Onsite amenities include fitness centre,
conference centre, deli, tenant lounge and
7-storey parking garage
Land Tenure • Freehold
Net Lettable Area • 445,317 sq ft
Committed
Occupancy• 95.5%(1)
WALE • 7.1 years(2)
Refurbishment
Period• 2015-2019
Number of Tenants • 20(1)
Key Tenants• Bio Medical Applications of Texas, US Homeland
Security, United Capital Financial Advisors
Overview of One Twenty Five in Dallas, Texas
Reception Area
Fitness Centre One Twenty Five

15
Transaction Overview
Acquisition Cost
• Estimated total acquisition cost of US$105.2m,
comprising:
- Purchase Consideration US$101.5m
- Acquisition Fee US$1.0m
(payable in Units to the Manager)
- Estimated professional &
other fees and expenses
incurred or to be incurred(2) US$2.7m
Valuations(1)• JLL: US$102.0m
• Cushman: US$103.5m
Proposed Method
of Financing
• Proceeds from a private placement to
institutional and other investors; debt financing;
and internal cash resources
• Proportion of the debt and equity will be
determined at the appropriate time, taking into
account the then prevailing market conditions
Transaction Summary Purchase Consideration at Discount to Valuations
(1) The Manager has commissioned an independent property valuer, Cushman, and the Trustee has commissioned an independent property valuer, JLL, to value the Property.
Cushman in its report dated 23 August 2019, stated that the aggregate open market value of the Property is US$103.5 million and JLL in its report dated 4 September 2019,
stated that the aggregate open market value of the Property is US$102.0 million
(2) Refers to the estimated professional and other fees and expenses incurred or to be incurred by Keppel Pacific Oak US REIT in connection with the Acquisition (inclusive of
debt financing related expenses)
US$101.5m
US$102.0m
US$103.5m
PurchaseConsideration
JLL Cushman
1.9%
Discount
0.5%
Discount

16
One Twenty Five
Dallas, Texas
Extending Footprint to
Key Growth Market of Dallas
Strategically located Class A office complex with
high quality tenants in a strong office market 2
Opportunity for rental uplift supported by lower than market
in-place rent and positive market outlook3
Enhances income resilience through diversification4
DPU accretive acquisition that will drive long term
value for Unitholders 5
Addition of high-growth Dallas market extends
KORE’s footprint to eight key growth markets1
✓ Strong economic and office
fundamentals
✓ A key corporate hub in the US
✓ Young, affluent and well-educated
workforce
✓ Growing population
Strategic Addition for Long Term Growth

Dallas: Economic Hub of North Central Texas
Growing Population
✓ Consistently outpaced the US in population growth
over the past 30 years
✓ From 2014-2018, average population growth of 2.0%,
above the US national average of 0.7%
✓ Population expected to grow 19.7% through 2025
17
Attractive Dynamics Driving Strong Office Fundamentals
Sources: Cushman, US Bureau of Economic Analysis, US Bureau of Labor Statistics and US Census Bureau,
Population Division
Educated Workforce
✓ Young, affluent, well-educated population
✓ From 2014-2018, average employment growth of 3.0%,
above the US national average of 1.8%
Key Corporate Hub
✓ One of the highest concentrations of corporate
headquarters in the US
✓ Desirable live-work-play community and continued
in-migration will drive business growth
Strong Economic Fundamentals
✓ From 2013-2017, average GDP growth of 4.2%, above the US national average of 2.2%
✓ GDP expected to continue growing at 3.1% through 2022

18
Attractive Office Fundamentals in Las Colinas
• Office inventory space of approximately
6.6m sq ft between 33 buildings
• No new deliveries until the Music Factory
opened in 2018, with supply of new office
space restrained since
• Overall vacancy rate has decreased
significantly from 25.5% in 2009 to 13.0%
in 2Q 2019, well below the average vacancy
rate of 19.3% for Dallas
• Average asking rents in Las Colinas
increased from US$22.10 psf in 2009 to
US$29.74 psf in 2018, with a CAGR of 3.4%,
outpacing the Dallas’ CAGR of 2.9% over
the same period
• Average asking rents are projected to
increase to US$32.57 psf in 2024 driven
by strong leasing demand
(75,717)
(184,793)
273,860
42,829
202,765
88,913 176,799
122,702
(47,958)
14,786
148,102
2009 2010 2011 2012 2013 2014 2015 2016 2017 2018 Q2 2019
(In sq ft)
Overall Absorption
Positive Overall Net Absorption, Rent Growth and Lower Vacancy
0%
5%
10%
15%
20%
25%
30%
$0
$5
$10
$15
$20
$25
$30
$35
2009 2010 2011 2012 2013 2014 2015 2016 2017 2018 Q22019
2020F 2021F 2022F 2023F 2024F
Direct average rent (LHS) Direct vacancy rate (RHS) #REF!
Average asking rent (US$ per sq ft)
Overall Vacancy Rate and Overall Asking Rent by Year
Limited Supply in Las Colinas
Positive Rent Growth and Low Vacancy
Source: Cushman

19
One Twenty Five: Strategic Location with Excellent Accessibility
• First choice submarket ofLas Colinas in Dallas, Texas
• Unique suburban market with an urban live-work-play feel that is also home to
– Gables Water Street: 60,000 sq ft of retail and restaurant space
– Toyota Music Factory: 8,000-seat concert hall, restaurants and clubs, as well as a fully-leased 100,000 sq ft office component
• Choice business address US corporate headquarters
• Well-connected by major thoroughfares
• Property underwent extensive capital improvement works since 2015
Desirable Live-work-play Community
Well-located Quality Asset
1
2
3
4
5
Key Landmarks
Gables Water Street:
retail and restaurant
space
Toyota Music Factory:
concert hall
DFW Freeport:
international business
and office park
The Irving Convention
Center
Southern Methodist
University: top-ranked
university in Texas
1
2
3
4
5
ONE TWENTY FIVE
For illustrative purposes only, and not drawn to scale.

Diversification of tenant base with increased exposure to professional services and defensive sectors
• Property leased to 20 tenants mainly in the professional services, government service administration, medical and healthcare,
and finance and insurance sectors
• Average portfolio WALE of 7.1 years(1)
• Top 5 tenants comprise large companies with stable credit profiles, with an average WALE of 8.5 years(2)
One Twenty Five: Trade Sector Breakdown (by NLA)
Professional Services41.0%
Technology1.5%
Finance and Insurance10.1%
Medical and Healthcare14.3%
Others33.1%
Tenant SectorLease Term Remaining
% of CRI % of NLA
Bio Medical Applications of Texas
Medical and Healthcare
9.9 years 14.0 11.1
US Homeland SecurityGovernment Service Administration(3)
9.9 years 12.9 14.2
United Capital Financial Advisors
Finance and Insurance
9.2 years 11.2 8.7
Smurfit Kappa North America
Professional Services
7.8 years 9.2 6.9
Paycom PayrollProfessional Services
2.2 years 7.7 6.0
TotalWALE (by NLA):
8.5 years 55.0 46.9
(1) As at 30 June 2019 and based on Cash Rental Income
(2) As at 30 June 2019 and based on NLA
(3) Government Service Administration tenants fall under the trade sector labelled as “Others”20
Exposure to High Quality Trade Sectors and Tenants
One Twenty Five: Top 5 Tenants

21
Delivering Value through Accretive Acquisition
Existing
Portfolio
One Twenty
Five(1)
Enlarged
Portfolio% Change
NLA (sq ft) 4,258,367 445,317 4,703,684 ▲10.5%
Number of
Tenants466 20 486 ▲4.3%
Committed
Occupancy (%)94.0 95.5 94.2 ▲20bps
WALE
by NLA3.9 7.0 4.2 ▲0.3 years
Valuation
(US$ million)1,085.8 101.5 1,187.3 ▲9.3%
All figures as at 30 June 2019.
(1) Valuation of One Twenty Five is based on Purchase Consideration of US$101.5 million
(2) Actual (and after acquisition) DPU for the period from 9 November 2017 to 31 December 2018 of 6.22
(and 6.28) US cents comprises of 3.82 US cents paid for the period from 9 November 2017 to 30 June
2018, calculated based on 630.2 (and 728.8) million units and 2.40 (and 2.46) US cents for the period
from 1 July 2018 to 31 December 2018 calculated based on 821.7 (and 920.7) million units
(3) For the financial period from 9 November 2017 (Date of listing) and 31 December 2018, assuming that
the acquisition, issuance of new units under a private placement, issuance of acquisition fee units and
drawdown of loan facilities were completed on 31 December 2018
6.22
6.28
Existing Enlarged
Distribution per Unit (US$ cents)(2)
Aggregate leverage(3)
35.1% 35.0%
Existing Enlarged
FOR ILLUSTRATIVE PURPOSES ONLY – NOT A FORWARD LOOKING PROJECTION

• Property in-place rent are 10.7% below market rent
• Strong organic growth opportunity as leases are marked to market
22
Strong Organic Growth With Potential Rental Upside
Strong office fundamentals expected to drive positive rental reversion
• Average asking rents in Las Colinas increased from
US$22.10 psf in 2009 to US$29.74 psf in 2018
• Average asking rents projected to increase to US$32.57 psf
in 2024 supported by strong leasing demand
Strong office fundamentals in Las Colinas Positive rental reversion
US$25.72
US$28.80
In-Place Rent Market Rent
In-place
rents are
10.7% below
market
Source: Cushman
US$22.10
US$29.74US$32.57
2009 2018 2024F
Outpaced
Dallas CAGR
of 2.9% over
the same
period

Enhanced Portfolio Scale and Diversification
Builds income resilience of portfolio
1,085.8
1,187.3
Existing Enlarged
Enlarges AUM (US$m) Expands tenant base
466 486
Existing Enlarged
23
23.8% 21.8%
Existing Enlarged
Greater portfolio diversification reducing single asset exposure(2) Reduces top 10 tenant exposure(3)
20.4% 18.5%
Existing Enlarged
Increases occupancy(1)
94.0% 94.2%
Existing Enlarged
(1) Assuming One Twenty Five has a portfolio occupancy of 95.5% for the period between 9 November 2017 and
31 December 2018, and all leases, whether existing or committed as at the latest practicable date, were in place
since 9 November 2017.
(2) Based on book value
(3) Based on cash rental income

Looking
Ahead
Tenant space,
Northridge I & II
Atlanta, Georgia

25
Focused on Delivering Stable Distributions and Long Term Value
Portfolio Optimisation
➢ Focused leasing strategy targeting growth sectors
➢ Proactive and effective asset management
➢ Maximise rental rates and capture positive rental reversions
Value Accretive Investments
➢ Pursue growth opportunities to create long term value
➢ Target key growth markets with strong office fundamentals
➢ Focus on first choice submarkets with strong macroeconomic
growth indicators that outpace national average
Prudent Capital Management
➢ Effective hedging to mitigate against impact of unfavourable
interest rate movements
➢ Acquire funding at optimal costs
➢ Fortify balance sheet and maintain an optimal capital structure
Cafe, 1800 West Loop South
Texas, Houston

Additional
Information
Café,
Westmoor Center,
Denver, Colorado

(1) U.S. Bureau of Economic Analysis, July 2019.
(2) U.S. Bureau of Labor Statistic, June 2019.
• US continued to register stable GDP growth of 2.1% in 2Q 2019
• Unemployment rate ticked up 0.1% to 3.7% in June 2019 as more people
entered the workforce than the 224,000 jobs created
• Stable GDP growth, low unemployment rates and expectations of future rate
cuts provide for an encouraging backdrop and potential tailwinds
Sound US Economic Fundamentals
2.1%Real GDP growth
in 2Q 2019(1)
3.7%Low unemployment(2)
+3.1%Average hourly
earnings y-o-y(2)
+224,000
Jobs added(2)
Indoor courtyard, Great Hills Plaza, Austin, Texas
US Economy at a Glance0%
1%
2%
3%
2014 2015 2016 2017 2018 2Q2019
GDP(1)
0%
1%
2%
3%
4%
5%
6%
7%
2014 2015 2016 2017 2018 Jun-19
Unemployment(2)
27

8.5%
9.0%
9.5%
10.0%
10.5%
11.0%
11.5%
$24.00
$26.00
$28.00
$30.00
$32.00
$34.00
$36.00
2014 2015 2016 2017 2018 2019 2020 2021 2022 2023
Asking Rent Vacancy
Attractive US Office Outlook
0.0
10.0
20.0
30.0
40.0
50.0
60.0
70.0
80.0
90.0
100.0
2014 2015 2016 2017 2018 2019 2020 2021 2022 2023
MS
F
Net Absorption
(1) CoStar Office Report, 28 June 2019.
Positive overall net absorption, rent growth and lower vacancy
66.4m 64.1mLast 12M Net Absorption Last 12M Deliveries
2.3% 9.6%
Last 12M Rent Growth Vacancy Rate
Overall Net Absorption(1)
Overall Asking Rents & Vacancy(1)
Deliveries & Demolitions(1)
Forecast
Forecast
28

Well-Spread Lease Expiration Profile
Limited lease expiries ranging from 10 – 15% per year until 2023
Lease Expiry Profile for the Existing Portfolio Lease Expiry Profile for the Enlarged Portfolio
4.8%
14.0%15.4%
10.3%
16.5%
39.0%
4.4%
14.4%15.8%
10.5%
17.0%
37.9%
2019 2020 2021 2022 2023 2024 andBeyond
By NLA By CRI
4.5%
12.8%14.6%
10.2%
15.2%
42.7%
4.0%
12.9%15.0%
10.3%
15.5%
42.3%
2019 2020 2021 2022 2023 2024 andBeyond
By NLA By CRI
29All figures as at 30 June 2019.

Professional Services29.5%
Finance and Insurance
22.6%Others6.5%
Media and Information
4.4%
Medical and Healthcare
7.5%
Technology29.5%
30
Portfolio Sector Breakdown
Highly diversified tenant base with increased exposure to the Medical & Healthcare sector
Existing Portfolio by NLA Enlarged Portfolio by NLA
Professional Services30.7%
Finance and Insurance
21.4%Others8.9%
Media and Information
4.0%
Medical and Healthcare
8.2%
Technology26.8%
NLA:
4.3 mn sq ft
NLA:
4.7 mn sq ft
All figures as at 30 June 2019.

31
Portfolio CRI Contribution
Enlarged AUM with greater asset diversification
Existing Portfolio by CRI
Bellevue Technology
Centre8.5%
The Plaza Buildings
19.7%
The Westpark Portfolio14.0%
Iron Point5.6%Westmoor Center
9.5%Westech 360
3.9%
Great Hills Plaza3.0%
1800 West Loop8.5%
West Loop I & II
8.4%
Maitland Promenade I &
II11.9%
Northridge Center I & II
3.9%
Powers Ferry3.1%
Enlarged Portfolio by CRI
Bellevue Technology
Centre7.7%
The Plaza Buildings
17.8%
The Westpark Portfolio12.7%
Iron Point5.1%
Westmoor Center8.6%
Westech 3603.5%
Great Hills Plaza2.8%
1800 West Loop7.7%
West Loop I & II
7.6%
One Twenty Five9.4%
Maitland Promenade I & II
10.8%
Northridge Center I & II
3.5%
Powers Ferry2.8%
All figures as at 30 June 2019.

32
Top 10 Tenants
Top 10 Tenants for the Existing Portfolio Top 10 Tenants for the Enlarged Portfolio
Tenant Asset % of CRI
Ball Aerospace & Tech Corp Westmoor Center 3.5
Oculus VR, LLC Westpark Portfolio 2.5
Zimmer Biomet Spine, Inc Westmoor Center 2.3
Spectrum Maitland Promenade I 2.1
Unigard Insurance Company(1) Bellevue Technology Center 1.9
US Bank National Association The Plaza Buildings 1.9
Blucora, Inc The Plaza Buildings 1.8
Futurewei Technologies, Inc The Plaza Buildings 1.6
Reed Group, Ltd Westmoor Center 1.5
Regus PLC Bellevue Technology Center 1.3
Top 10 Tenants 20.4%
Tenant Asset % of CRI
Ball Aerospace & Tech Corp Westmoor Center 3.1
Oculus VR, LLC Westpark Portfolio 2.3
Zimmer Biomet Spine, Inc Westmoor Center 2.0
Spectrum Maitland Promenade I 1.8
Unigard Insurance Company(1) Bellevue Technology Center 1.7
US Bank National Association The Plaza Buildings 1.7
Blucora, Inc The Plaza Buildings 1.6
Bio Medical Applications of Texas, Inc One Twenty Five 1.5
Futurewei Technologies, Inc The Plaza Buildings 1.4
US Homeland Security One Twenty Five 1.4
Total: 18.5%
Top 10 tenants now account for less than 19% of the overall CRI
All figures as at 30 June 2019.
(1) Subsidiary of QBE Insurance Group.

For more information, please visit
www.koreusreit.com
Westech 360
Austin, Texas
Related Documents