ORIGINAL ARTICLE Nomophobia in Late Childhood and Early Adolescence: the Development and Validation of a New Interactive Electronic Nomophobia Test Ali Mahdi Kazem 1 & Mahmoud Mohammed Emam 1 & Marwa Nasser Alrajhi 2 & Said Sulaiman Aldhafri 1,3 & Hafidha Sulaiman AlBarashdi 3 & Bahia Abdullah Al-Rashdi 4 Accepted: 26 January 2021/ # Associação Brasileira de Psicologia 2021 Abstract The widely spread dependence on smartphones by children, adolescents, and adults has shoved researchers to assess its impact on the wellbeing of individuals. Nomophobia, the fear of being out of cellular contact, was typically assessed by self-report measures or proxy measures in adolescents and older adults. The goal of the current study was to examine nomophobia in late childhood and adolescence using scenario-based vignettes that are interactively presented and mediated by computers. To fulfill this goal, the Interactive Electronic Nomophobia Test (IENT), comprising of five scenario-based vignettes, was developed and administered to 1211 students aged between 10 and 18 years and enrolled in grades 5–12. The IENT psychometric properties were exam- ined using a series of confirmatory factor analysis and structural equation modeling. Additionally, the study examined the clustering nomophobia symptoms in a nationally representative sample of Omani students and explored the association of these Nomophobia symptoms with both students’ grade and gender. Results of the study provided evidence of the four-pronged structure of the IENT, and an overall all composite nomophobia score, with strong associations found among the subscales, and between each of the four subscales and Nomophobia composite score. Invariance tests found significantly different model results by gender in all cases. Finally, cluster analysis revealed two to three clusters, with significant associations between gender, class, and cluster type. Implications of the study are discussed in view of previous literature on the assessment of nomophobia and smartphone addiction. Keywords Nomophobia . Mobile phone addiction . Test development . Children . Oman https://doi.org/10.1007/s43076-021-00068-0 * Ali Mahdi Kazem [email protected] Extended author information available on the last page of the article Published online: 11 March 2021 Trends in Psychology (2021) 29:543–562

Welcome message from author
This document is posted to help you gain knowledge. Please leave a comment to let me know what you think about it! Share it to your friends and learn new things together.
Transcript

ORIGINAL ARTICLE
Nomophobia in Late Childhood and EarlyAdolescence: the Development and Validationof a New Interactive Electronic Nomophobia Test
Ali Mahdi Kazem1& Mahmoud Mohammed Emam1
& Marwa Nasser Alrajhi2 &
Said Sulaiman Aldhafri1,3 & Hafidha Sulaiman AlBarashdi3 &
Bahia Abdullah Al-Rashdi4
Accepted: 26 January 2021/# Associação Brasileira de Psicologia 2021
AbstractThe widely spread dependence on smartphones by children, adolescents, and adults hasshoved researchers to assess its impact on the wellbeing of individuals. Nomophobia,the fear of being out of cellular contact, was typically assessed by self-report measuresor proxy measures in adolescents and older adults. The goal of the current study was toexamine nomophobia in late childhood and adolescence using scenario-based vignettesthat are interactively presented and mediated by computers. To fulfill this goal, theInteractive Electronic Nomophobia Test (IENT), comprising of five scenario-basedvignettes, was developed and administered to 1211 students aged between 10 and18 years and enrolled in grades 5–12. The IENT psychometric properties were exam-ined using a series of confirmatory factor analysis and structural equation modeling.Additionally, the study examined the clustering nomophobia symptoms in a nationallyrepresentative sample of Omani students and explored the association of theseNomophobia symptoms with both students’ grade and gender. Results of the studyprovided evidence of the four-pronged structure of the IENT, and an overall allcomposite nomophobia score, with strong associations found among the subscales,and between each of the four subscales and Nomophobia composite score. Invariancetests found significantly different model results by gender in all cases. Finally, clusteranalysis revealed two to three clusters, with significant associations between gender,class, and cluster type. Implications of the study are discussed in view of previousliterature on the assessment of nomophobia and smartphone addiction.
Keywords Nomophobia . Mobile phone addiction . Test development . Children . Oman
https://doi.org/10.1007/s43076-021-00068-0
* Ali Mahdi [email protected]
Extended author information available on the last page of the article
Published online: 11 March 2021
Trends in Psychology (2021) 29:543–562

Mobile phone has gradually occupied a major part of the techno-culture across theglobe since it was first introduced. The increasing utilization and pervasion of themobile phone, the new smart technology, and virtual communication tools includingcomputers, tablets, and smartphones have influenced peoples’ daily routines (Bragazzi& Puente, 2014). A huge revolution in mobile phone technology is smartphones thatallow individuals to do more than just communication with others. A variety of dailytasks are now easily performed by smartphones including calling, texting, sending e-mails, scheduling appointments, communicating socially, surfing the internet, andgaming (Park et al., 2013). Kang and Jung (2014) proposed that the use of smartphoneshas gone beyond communication. They identified five basic needs that usingsmartphones fulfill for individuals in the USA and Korea: (a) physiological needs,(b) safety, (c) belongingness, (d) self-esteem, and (f) self-actualization.
The absence of face to face communication and the excessive use of new technol-ogies may arguably cause negative behaviors and feelings. It may result in socialisolation, alienation, stress, and economic and financial problems (Bragazzi &Puente, 2014). More importantly, there is research evidence that smartphones can causeaddictive behavior, compulsive checking habits, distress, and pressure (e.g., Matusik &Mickel, 2011; Oulasvirta et al., 2012). Additionally, nomophobia negatively impactsthe individual’s physical and mental health, leading undesirable outcomes in personal-ity, stress, self-esteem, and academic performance (Rodríguez-García et al., 2020). Theterm nomophobia stands for “no mobile phobia,” and was first coined in 2008 in astudy conducted by SecurEnvoy Company to examine anxiety that mobile phone usersin the UK suffer from. The study defined nomophobia as “the fear of being out ofmobile phone contact” (SecurEnvoy, 2012, Par 1).
Recently, nomophobia has received considerable attention by numerous researcherswho investigated this type of phobia referring to it as a psychosocial neurosis (Bragazzi& Puente, 2014). The first aspect of investigating nomophobia involved the develop-ment of different measures for the assessment of the different aspects of the construct.To date, the majority of the developed measures which attempted to capture theconstruct were in the form of self-report questionnaires that are used with adolescentsand older adults (e.g., Billieux et al., 2008; Buctot et al., 2020; Gao et al., 2020;Olivencia-Carrión et al., 2018; Yildirim & Correia, 2015). To date, no measures werespecifically designed to assess nomophobia in children and adolescents. The currentstudy, therefore, aimed to develop a new measure for nomophobia that is specificallydesigned to assess nomophobia in childhood and adolescence. To avoid the limitationslinked to the use of self-report measures, the new nomophobia measure in the currentstudy takes an electronic form and utilizes scenario-based vignettes and written re-sponses to capture nomophobia among children and adolescents.
Nomophobia: a Succinct Review
Nomophobia or mobile phone addiction is recently perceived as a psychologicaldisorder resulting from the excessive use of new technology and virtual communica-tion. Nomophobia refers to “discomfort, anxiety, nervousness, or anguish caused bybeing out of contact with a mobile phone or a computer” (Bragazzi & Puente, 2014, p.156). Some scholars have proposed to include nomophobia in DSM-V as a type of
544 Trends in Psychology (2021) 29:543–562
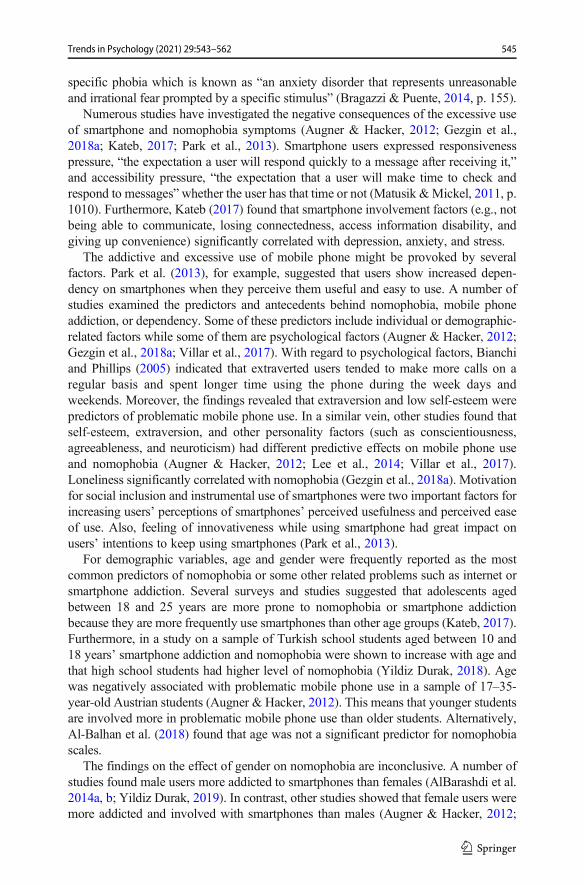
specific phobia which is known as “an anxiety disorder that represents unreasonableand irrational fear prompted by a specific stimulus” (Bragazzi & Puente, 2014, p. 155).
Numerous studies have investigated the negative consequences of the excessive useof smartphone and nomophobia symptoms (Augner & Hacker, 2012; Gezgin et al.,2018a; Kateb, 2017; Park et al., 2013). Smartphone users expressed responsivenesspressure, “the expectation a user will respond quickly to a message after receiving it,”and accessibility pressure, “the expectation that a user will make time to check andrespond to messages”whether the user has that time or not (Matusik &Mickel, 2011, p.1010). Furthermore, Kateb (2017) found that smartphone involvement factors (e.g., notbeing able to communicate, losing connectedness, access information disability, andgiving up convenience) significantly correlated with depression, anxiety, and stress.
The addictive and excessive use of mobile phone might be provoked by severalfactors. Park et al. (2013), for example, suggested that users show increased depen-dency on smartphones when they perceive them useful and easy to use. A number ofstudies examined the predictors and antecedents behind nomophobia, mobile phoneaddiction, or dependency. Some of these predictors include individual or demographic-related factors while some of them are psychological factors (Augner & Hacker, 2012;Gezgin et al., 2018a; Villar et al., 2017). With regard to psychological factors, Bianchiand Phillips (2005) indicated that extraverted users tended to make more calls on aregular basis and spent longer time using the phone during the week days andweekends. Moreover, the findings revealed that extraversion and low self-esteem werepredictors of problematic mobile phone use. In a similar vein, other studies found thatself-esteem, extraversion, and other personality factors (such as conscientiousness,agreeableness, and neuroticism) had different predictive effects on mobile phone useand nomophobia (Augner & Hacker, 2012; Lee et al., 2014; Villar et al., 2017).Loneliness significantly correlated with nomophobia (Gezgin et al., 2018a). Motivationfor social inclusion and instrumental use of smartphones were two important factors forincreasing users’ perceptions of smartphones’ perceived usefulness and perceived easeof use. Also, feeling of innovativeness while using smartphone had great impact onusers’ intentions to keep using smartphones (Park et al., 2013).
For demographic variables, age and gender were frequently reported as the mostcommon predictors of nomophobia or some other related problems such as internet orsmartphone addiction. Several surveys and studies suggested that adolescents agedbetween 18 and 25 years are more prone to nomophobia or smartphone addictionbecause they are more frequently use smartphones than other age groups (Kateb, 2017).Furthermore, in a study on a sample of Turkish school students aged between 10 and18 years’ smartphone addiction and nomophobia were shown to increase with age andthat high school students had higher level of nomophobia (Yildiz Durak, 2018). Agewas negatively associated with problematic mobile phone use in a sample of 17–35-year-old Austrian students (Augner & Hacker, 2012). This means that younger studentsare involved more in problematic mobile phone use than older students. Alternatively,Al-Balhan et al. (2018) found that age was not a significant predictor for nomophobiascales.
The findings on the effect of gender on nomophobia are inconclusive. A number ofstudies found male users more addicted to smartphones than females (AlBarashdi et al.2014a, b; Yildiz Durak, 2019). In contrast, other studies showed that female users weremore addicted and involved with smartphones than males (Augner & Hacker, 2012;
545Trends in Psychology (2021) 29:543–562

Kateb, 2017; Kwon et al., 2013). However, Al-Balhan et al. (2018) indicated thatgender was not a significant predictor of nomophobia. In a recent study on the effect ofage and gender on the prevalence of nomophobia among young people in Spain,Moreno-Guerrero and colleagues surveyed 1743 students between 12 and 20 yearsand found that women showed higher rates of nomophobia than men. Additionally,they reported no significant differences between age groups, concluding thatnomophobia affects all ages equally (Moreno-Guerrero et al., 2020b). In a similarstudy, Moreno-Guerrero and colleagues used the NMP-Q to examine nomophobia in849 future teaches in Early Childhood and Elementary Education. Overall, they foundaverage levels of nomophobia, with higher prevalence of anxiety and fear in relation tothe inability to communicate. Additionally, nomophobia was most prevalent in thosewho reported they sacrificed their rest time to use their mobile phones (Moreno-Guerrero et al., 2020b).
Prevalence of Mobile Phone Use and Nomophobia
Mobile phones and internet use have become pervasive across countries. InternationalTelecommunication Union (2018) demonstrated that 51.2% of the global population(3.9 billion people) are using the internet. Furthermore, the total global mobile-cellularsubscriptions was 8 million and 160 by the end of 2018. In Oman, The National Centerfor Statistics and Information in Oman (2018) reported that the number of sim cardsused for mobile phones was 6,440,889 in 2018. Also, the number of people benefitingfrom the internet by the end of 2011 was 2,168,049.
Some researchers attempted to examine the prevalence of smartphone addiction ornomophobia. In a study conducted on Saudi undergraduate students, Kateb (2017)showed that more than half of the participants (63. 3%) use their phone more than 4 hdaily and 61.2% check their phones more than 10 times each day. In addition,AlBarashdi et al. (2014b) reported that the casual level of smartphone addiction wasthe highest among undergraduate Omani students (42.3% of the sample) followed byheavy level (30.8%) and finally moderate level (26%). In a study conducted on Turkishundergraduates, the highest percentage (32.6%) revealed using their smartphones morethan 49 times daily and the findings indicated a moderate level of nomophobia amongthe participants (Gezgin et al., 2018a). Among Kuwaiti users, Al-Balhan et al. (2018)showed that 18% of participants presented mild level of nomophobia, 56.2% showedmoderate level, and 25.8% exhibited severe level of nomophobia. Using the NMP-Q,Moreno-Guerrero and colleagues explored nomophobia among Spanish students aged12–20 years and found that the most prevalent rates of nomophobia were found inrelation to the inability to communicate and contact others immediately (Moreno-Guerrero et al., 2020a).
Measurement of Nomophobia
As a response to the increasing prevalence of nomophobia across countries, differentinstruments were developed to assess it among individuals across cultures. Althoughnot all the instruments were specifically designed to measure nomophobia, they
546 Trends in Psychology (2021) 29:543–562
measure some related phenomena such as smartphone involvement, addiction, ordependency. Table 1 provides a summary of some existing measures in the literature.
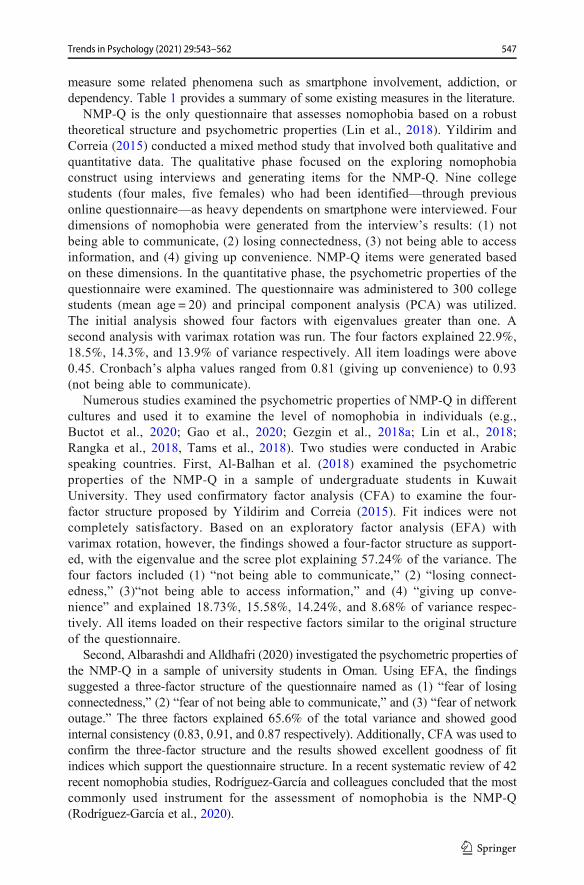
NMP-Q is the only questionnaire that assesses nomophobia based on a robusttheoretical structure and psychometric properties (Lin et al., 2018). Yildirim andCorreia (2015) conducted a mixed method study that involved both qualitative andquantitative data. The qualitative phase focused on the exploring nomophobiaconstruct using interviews and generating items for the NMP-Q. Nine collegestudents (four males, five females) who had been identified—through previousonline questionnaire—as heavy dependents on smartphone were interviewed. Fourdimensions of nomophobia were generated from the interview’s results: (1) notbeing able to communicate, (2) losing connectedness, (3) not being able to accessinformation, and (4) giving up convenience. NMP-Q items were generated basedon these dimensions. In the quantitative phase, the psychometric properties of thequestionnaire were examined. The questionnaire was administered to 300 collegestudents (mean age = 20) and principal component analysis (PCA) was utilized.The initial analysis showed four factors with eigenvalues greater than one. Asecond analysis with varimax rotation was run. The four factors explained 22.9%,18.5%, 14.3%, and 13.9% of variance respectively. All item loadings were above0.45. Cronbach’s alpha values ranged from 0.81 (giving up convenience) to 0.93(not being able to communicate).
Numerous studies examined the psychometric properties of NMP-Q in differentcultures and used it to examine the level of nomophobia in individuals (e.g.,Buctot et al., 2020; Gao et al., 2020; Gezgin et al., 2018a; Lin et al., 2018;Rangka et al., 2018, Tams et al., 2018). Two studies were conducted in Arabicspeaking countries. First, Al-Balhan et al. (2018) examined the psychometricproperties of the NMP-Q in a sample of undergraduate students in KuwaitUniversity. They used confirmatory factor analysis (CFA) to examine the four-factor structure proposed by Yildirim and Correia (2015). Fit indices were notcompletely satisfactory. Based on an exploratory factor analysis (EFA) withvarimax rotation, however, the findings showed a four-factor structure as support-ed, with the eigenvalue and the scree plot explaining 57.24% of the variance. Thefour factors included (1) “not being able to communicate,” (2) “losing connect-edness,” (3)“not being able to access information,” and (4) “giving up conve-nience” and explained 18.73%, 15.58%, 14.24%, and 8.68% of variance respec-tively. All items loaded on their respective factors similar to the original structureof the questionnaire.
Second, Albarashdi and Alldhafri (2020) investigated the psychometric properties ofthe NMP-Q in a sample of university students in Oman. Using EFA, the findingssuggested a three-factor structure of the questionnaire named as (1) “fear of losingconnectedness,” (2) “fear of not being able to communicate,” and (3) “fear of networkoutage.” The three factors explained 65.6% of the total variance and showed goodinternal consistency (0.83, 0.91, and 0.87 respectively). Additionally, CFA was used toconfirm the three-factor structure and the results showed excellent goodness of fitindices which support the questionnaire structure. In a recent systematic review of 42recent nomophobia studies, Rodríguez-García and colleagues concluded that the mostcommonly used instrument for the assessment of nomophobia is the NMP-Q(Rodríguez-García et al., 2020).
547Trends in Psychology (2021) 29:543–562
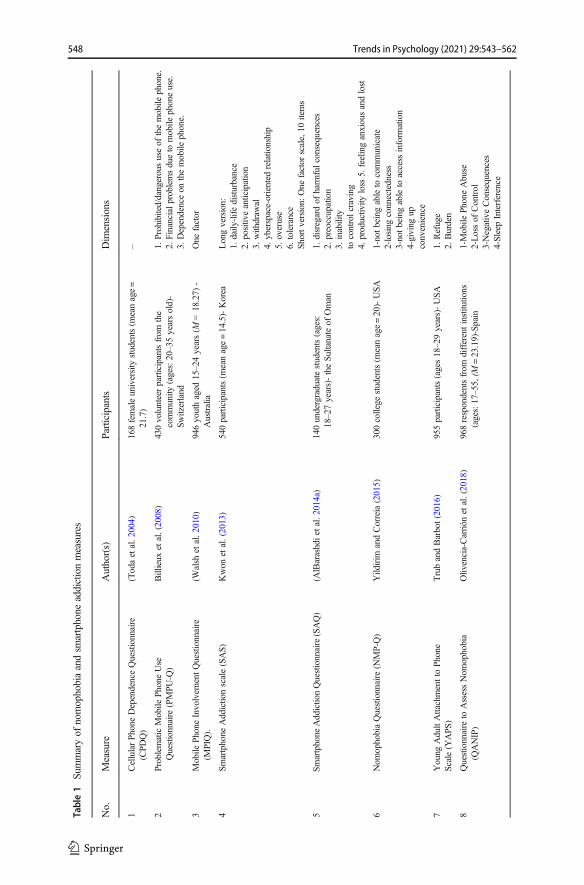
Table1
Summaryof
nomophobiaandsm
artphone
addictionmeasures
No.
Measure
Author(s)
Participants
Dim
ensions
1CellularPhone
DependenceQuestionnaire
(CPD
Q)
(Todaetal.2
004)
168femaleuniversity
students(m
eanage=
21.7)
–
2ProblematicMobile
PhoneUse
Questionnaire
(PMPU
-Q)
Billieux
etal.(2008)
430volunteerparticipantsfrom
the
community
(ages:20–35yearsold)-
Switzerland
1.Prohibited/dangeroususeof
themobile
phone.
2.Financialproblemsdueto
mobile
phoneuse.
3.Dependenceon
themobile
phone.
3Mobile
Phone
Involvem
entQuestionnaire
(MPIQ).
(Walsh
etal.2
010)
946youthaged
15–24years(M
=18.27)
-Australia
One
factor
4Sm
artphone
Addictionscale(SAS)
Kwon
etal.(2013)
540participants(m
eanage=14.5)-Korea
Longversion:
1.daily-lifedisturbance
2.positiveanticipation
3.withdraw
al4.
yberspace-oriented
relationship
5.overuse
6.tolerance
Shortversion:
One
factor
scale,10
items
5Sm
artphone
AddictionQuestionnaire(SAQ)
(AlBarashdietal.2
014a)
140undergraduatestudents(ages:
18–27years)-theSu
ltanateof
Oman
1.disregardof
harm
fulconsequences
2.preoccupation
3.inability
tocontrolcraving
4.productivity
loss
5.feelinganxiousandlost
6Nom
ophobiaQuestionnaire
(NMP-Q)
Yildirim
andCorreia(2015)
300college
students(m
eanage=20)-USA
1-notbeingableto
communicate
2-losing
connectedness
3-notbeingableto
access
inform
ation
4-giving
upconvenience
7Young
AdultAttachmentto
Phone
Scale(Y
APS
)TrubandBarbot(2016)
955participants(ages18–29years)-USA
1.Refuge
2.Burden
8Questionnaire
toAssessNom
ophobia
(QANIP)
Olivencia-Carrión
etal.(2018)
968respondentsfrom
differentinstitutions
(ages:17–55,
(M=23.19)-Spain
1-Mobile
PhoneAbuse
2-Lossof
Control
3-NegativeConsequences
4-SleepInterference
548 Trends in Psychology (2021) 29:543–562

The Current Study
One of the characteristic differences between today’s children and adults in usingmobile phone is the longer exposure of children in their lifetime (Chiu et al., 2015;Fadzil et al., 2016). Children begin using mobile phones and other technologies at anearly stage of their life. Tablets, computers, and the internet are introduced to childrenas early as they begin their preschool, thereby predisposing them to nomophobia whichmay affect their health and wellbeing (Zheng et al., 2015). Several studies have assertedvarious symptoms that can be detected among nomophobic users. Examples ofthese symptoms include trembling, anxiety, respiratory alternation, agitation(Bhattacharya et al., 2019), spending much time using the phone, processing morethan one phone and keeping chargers always around, and frequently checking thescreen (Bragazzi and Puente, 2014); which are associated with health relatedoutcomes such as stress and depression (Kateb, 2017). Nomophobia diagnosisamong adolescents and adults received considerable attention by scholars. It isequally essential, however, to identify nomophobia among children given theirincreasing exposure to mobile phones and other technological devices. Betoncuand Ozdamli (2019) pointed out that individuals aged 12–18 are more vulnerableto “digital disease” such as nomophobia. Based on aforementioned review, itseems that instruments available to assess nomophobia for children are notavailable. A few studies examined nomophobia, smart phone, or internet addictionamong young children aged 10 and above (e.g., Yildiz Durak, 2018; Gezgin et al.,2018a; Leung, 2017, Wang et al., 2017).
The current study utilizes Yildirim and Correia (2015) Nomophobia Questionnaire(NMP-Q) model as a theoretical framework to develop the new Interactive ElectronicNomophobia Test. The aim of the current study, therefore, is threefold: (1) develop andvalidate a new instrument, namely the Interactive Electronic Nomophobia Test (IENT),that can be used to assess nomophobia in children and adolescents aged 10–18 yearsusing innovative format other than self-report written questionnaires, (2) examine theconstruct validity of the IENT using CFA and gender invariance, (3) analyze therepresentation of nomophobia characteristics in relation to gender and grades, usingstructural equation modeling and cluster analysis.
Method
Participants
Data for the current study was collected as part of a lager research project, whichexamined psychological outcomes associated with nomophobia among children.Schools were contacted to have access to students for data collection. Informationon the study aims and procedures was sent to enable access to data collection andallow for students’ participation in the study. Participants of the study wererecruited from the different regions in the Sultanate of Oman using cluster randomsampling method. In total, 1211 students aged between 10 and 18 years andenrolled in grades 5–12 participated in the study. The number of participants ineach grade ranged between 131 and 164. A number of research assistant were
549Trends in Psychology (2021) 29:543–562

trained on administering and scoring the IENT. The IENT was administered to theparticipants in learning support rooms in schools which included a number ofcomputers with internet access.
Ethical Considerations
Prior to data collection, the study was approved by the Institution Review Board (IRB),the Humanity Research Ethics Board (HREB) at Sultan Qaboos University, and theMinistry of Education Technical Office for Research and Development (MoE-TORD).Because our study included participants at early and late childhood stages, we obtainedparticipants’ consent in two different ways. For early childhood participants, the paperand electronic consent forms were sent for schools to have them signed by students’parents. For late childhood participants asked them to sign the consent forms bythemselves. Consent forms included information on the overall goals of the researchstudy.
Instrument
The IENT was developed based on Yildirim’s and Correia’s Nomophobia Ques-tionnaire (NMP-Q) model. Hence, the IENT includes four dimensions: (1) “Notbeing able to communicate” which refers to “the feelings of losing instant com-munication with people and not being able to use the services that allow forinstant communication,” (2) “losing connectedness” which refers to “feelings oflosing the ubiquitous connectivity smartphones provide, and being disconnectedfrom one’s online identity, especially on social media,” (3) “not being able toaccess information” which reflects “discomfort of losing pervasive access toinformation through smartphones, being unable to retrieve information throughsmartphones and search for information on smartphones,” and (4) “giving upconvenience” which relates to “the desire to utilize the convenience of having asmartphone” (Yildirim & Correia, 2015, pp. 133–134).
The IENT (see Appendix) used five nomophobia animated vignettes thatdepict real situations in real-life contexts. The video clips portray schoolchildren acting in different situations in which they lose their phones, chargers,or the internet connections, or excessively use the phone without marking thetime they spent doing so. The respondents are then asked about how wouldthey react or feel if they went through the same experience. For each question,four responses are provided that reflect the four aforementioned dimensions.Examples of the responses are as follows: “I would feel uncomfortable becauseI can’t use the phone,” or “I would feel anxious because I will not be able tocomplete my favorite game.” Responses are scored on five-point Likert scaleranging from strongly disagree (1) to strongly agree (5). The time duration ofeach video clip ranges between 47 and 63 s. Scenario 1 for example shows achild using iPad, and a wall clock is placed behind him. One hour, two hours,and three hours pass and the child still indulges in using the device withoutnoticing the time lapse. Suddenly, the child notices that the device battery isdraining and the iPad is about to die. The child looks for the charger every-where but never finds it.
550 Trends in Psychology (2021) 29:543–562
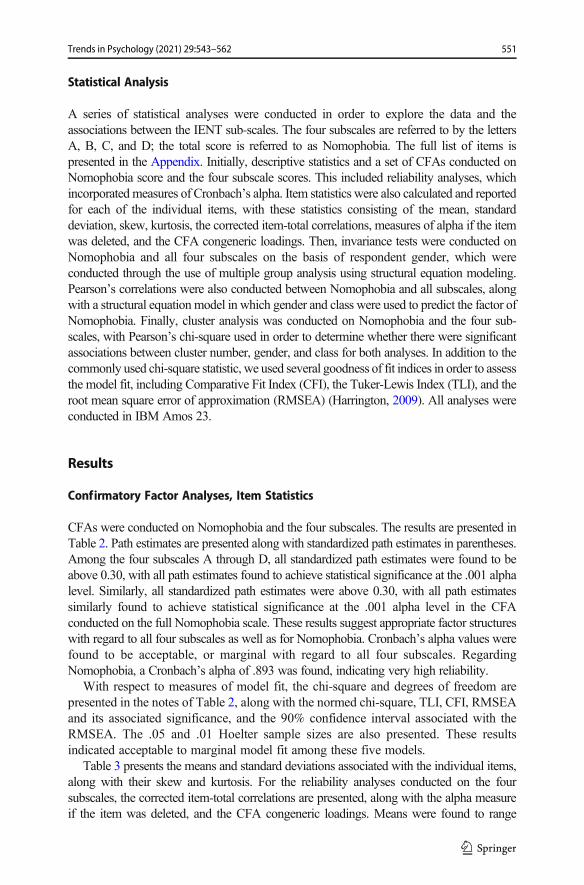
Statistical Analysis
A series of statistical analyses were conducted in order to explore the data and theassociations between the IENT sub-scales. The four subscales are referred to by the lettersA, B, C, and D; the total score is referred to as Nomophobia. The full list of items ispresented in the Appendix. Initially, descriptive statistics and a set of CFAs conducted onNomophobia score and the four subscale scores. This included reliability analyses, whichincorporated measures of Cronbach’s alpha. Item statistics were also calculated and reportedfor each of the individual items, with these statistics consisting of the mean, standarddeviation, skew, kurtosis, the corrected item-total correlations, measures of alpha if the itemwas deleted, and the CFA congeneric loadings. Then, invariance tests were conducted onNomophobia and all four subscales on the basis of respondent gender, which wereconducted through the use of multiple group analysis using structural equation modeling.Pearson’s correlations were also conducted between Nomophobia and all subscales, alongwith a structural equationmodel in which gender and class were used to predict the factor ofNomophobia. Finally, cluster analysis was conducted on Nomophobia and the four sub-scales, with Pearson’s chi-square used in order to determine whether there were significantassociations between cluster number, gender, and class for both analyses. In addition to thecommonly used chi-square statistic, we used several goodness of fit indices in order to assessthe model fit, including Comparative Fit Index (CFI), the Tuker-Lewis Index (TLI), and theroot mean square error of approximation (RMSEA) (Harrington, 2009). All analyses wereconducted in IBM Amos 23.
Results
Confirmatory Factor Analyses, Item Statistics
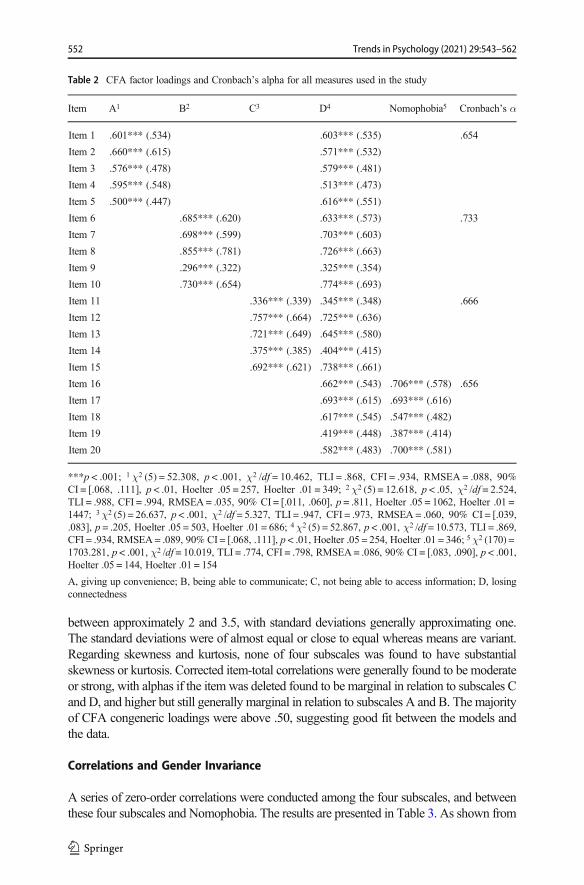
CFAs were conducted on Nomophobia and the four subscales. The results are presented inTable 2. Path estimates are presented along with standardized path estimates in parentheses.Among the four subscales A through D, all standardized path estimates were found to beabove 0.30, with all path estimates found to achieve statistical significance at the .001 alphalevel. Similarly, all standardized path estimates were above 0.30, with all path estimatessimilarly found to achieve statistical significance at the .001 alpha level in the CFAconducted on the full Nomophobia scale. These results suggest appropriate factor structureswith regard to all four subscales as well as for Nomophobia. Cronbach’s alpha values werefound to be acceptable, or marginal with regard to all four subscales. RegardingNomophobia, a Cronbach’s alpha of .893 was found, indicating very high reliability.
With respect to measures of model fit, the chi-square and degrees of freedom arepresented in the notes of Table 2, along with the normed chi-square, TLI, CFI, RMSEAand its associated significance, and the 90% confidence interval associated with theRMSEA. The .05 and .01 Hoelter sample sizes are also presented. These resultsindicated acceptable to marginal model fit among these five models.
Table 3 presents the means and standard deviations associated with the individual items,along with their skew and kurtosis. For the reliability analyses conducted on the foursubscales, the corrected item-total correlations are presented, along with the alpha measureif the item was deleted, and the CFA congeneric loadings. Means were found to range
551Trends in Psychology (2021) 29:543–562
between approximately 2 and 3.5, with standard deviations generally approximating one.The standard deviations were of almost equal or close to equal whereas means are variant.Regarding skewness and kurtosis, none of four subscales was found to have substantialskewness or kurtosis. Corrected item-total correlations were generally found to be moderateor strong, with alphas if the item was deleted found to be marginal in relation to subscales Cand D, and higher but still generally marginal in relation to subscales A and B. The majorityof CFA congeneric loadings were above .50, suggesting good fit between the models andthe data.
Correlations and Gender Invariance
A series of zero-order correlations were conducted among the four subscales, and betweenthese four subscales and Nomophobia. The results are presented in Table 3. As shown from
Table 2 CFA factor loadings and Cronbach’s alpha for all measures used in the study
Item A1 B2 C3 D4 Nomophobia5 Cronbach’s α
Item 1 .601*** (.534) .603*** (.535) .654
Item 2 .660*** (.615) .571*** (.532)
Item 3 .576*** (.478) .579*** (.481)
Item 4 .595*** (.548) .513*** (.473)
Item 5 .500*** (.447) .616*** (.551)
Item 6 .685*** (.620) .633*** (.573) .733
Item 7 .698*** (.599) .703*** (.603)
Item 8 .855*** (.781) .726*** (.663)
Item 9 .296*** (.322) .325*** (.354)
Item 10 .730*** (.654) .774*** (.693)
Item 11 .336*** (.339) .345*** (.348) .666
Item 12 .757*** (.664) .725*** (.636)
Item 13 .721*** (.649) .645*** (.580)
Item 14 .375*** (.385) .404*** (.415)
Item 15 .692*** (.621) .738*** (.661)
Item 16 .662*** (.543) .706*** (.578) .656
Item 17 .693*** (.615) .693*** (.616)
Item 18 .617*** (.545) .547*** (.482)
Item 19 .419*** (.448) .387*** (.414)
Item 20 .582*** (.483) .700*** (.581)
***p < .001; 1 χ2 (5) = 52.308, p < .001, χ2 /df = 10.462, TLI = .868, CFI = .934, RMSEA = .088, 90%CI = [.068, .111], p < .01, Hoelter .05 = 257, Hoelter .01 = 349; 2χ2 (5) = 12.618, p < .05, χ2 /df = 2.524,TLI = .988, CFI = .994, RMSEA= .035, 90% CI = [.011, .060], p = .811, Hoelter .05 = 1062, Hoelter .01 =1447; 3χ2 (5) = 26.637, p < .001, χ2 /df = 5.327, TLI = .947, CFI = .973, RMSEA = .060, 90% CI = [.039,.083], p = .205, Hoelter .05 = 503, Hoelter .01 = 686; 4χ2 (5) = 52.867, p < .001, χ2 /df = 10.573, TLI = .869,CFI = .934, RMSEA= .089, 90% CI = [.068, .111], p < .01, Hoelter .05 = 254, Hoelter .01 = 346; 5χ2 (170) =1703.281, p < .001, χ2 /df = 10.019, TLI = .774, CFI = .798, RMSEA= .086, 90% CI = [.083, .090], p < .001,Hoelter .05 = 144, Hoelter .01 = 154
A, giving up convenience; B, being able to communicate; C, not being able to access information; D, losingconnectedness
552 Trends in Psychology (2021) 29:543–562
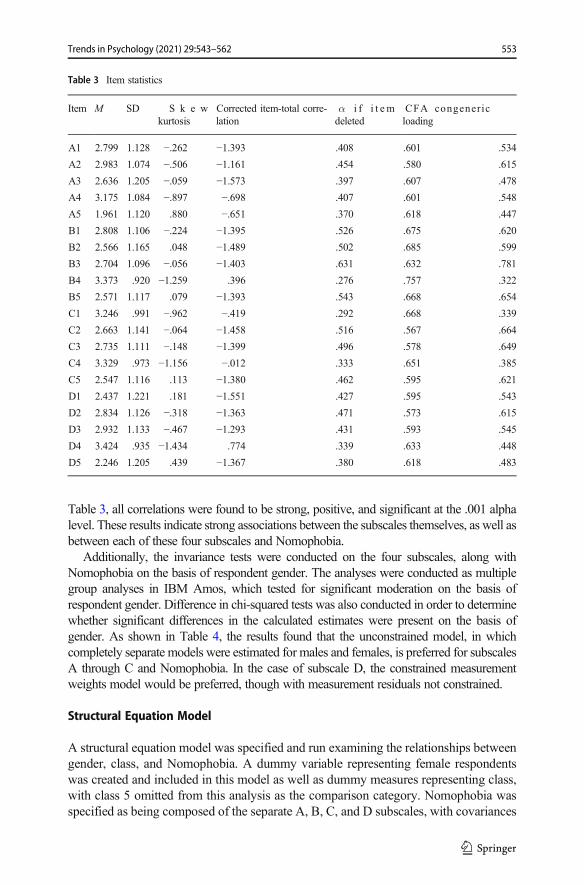
Table 3, all correlations were found to be strong, positive, and significant at the .001 alphalevel. These results indicate strong associations between the subscales themselves, as well asbetween each of these four subscales and Nomophobia.
Additionally, the invariance tests were conducted on the four subscales, along withNomophobia on the basis of respondent gender. The analyses were conducted as multiplegroup analyses in IBM Amos, which tested for significant moderation on the basis ofrespondent gender. Difference in chi-squared tests was also conducted in order to determinewhether significant differences in the calculated estimates were present on the basis ofgender. As shown in Table 4, the results found that the unconstrained model, in whichcompletely separate models were estimated for males and females, is preferred for subscalesA through C and Nomophobia. In the case of subscale D, the constrained measurementweights model would be preferred, though with measurement residuals not constrained.
Structural Equation Model
A structural equation model was specified and run examining the relationships betweengender, class, and Nomophobia. A dummy variable representing female respondentswas created and included in this model as well as dummy measures representing class,with class 5 omitted from this analysis as the comparison category. Nomophobia wasspecified as being composed of the separate A, B, C, and D subscales, with covariances
Table 3 Item statistics
Item M SD S k e wkurtosis
Corrected item-total corre-lation
α i f i t e mdeleted
CFA congenericloading
A1 2.799 1.128 −.262 −1.393 .408 .601 .534
A2 2.983 1.074 −.506 −1.161 .454 .580 .615
A3 2.636 1.205 −.059 −1.573 .397 .607 .478
A4 3.175 1.084 −.897 −.698 .407 .601 .548
A5 1.961 1.120 .880 −.651 .370 .618 .447
B1 2.808 1.106 −.224 −1.395 .526 .675 .620
B2 2.566 1.165 .048 −1.489 .502 .685 .599
B3 2.704 1.096 −.056 −1.403 .631 .632 .781
B4 3.373 .920 −1.259 .396 .276 .757 .322
B5 2.571 1.117 .079 −1.393 .543 .668 .654
C1 3.246 .991 −.962 −.419 .292 .668 .339
C2 2.663 1.141 −.064 −1.458 .516 .567 .664
C3 2.735 1.111 −.148 −1.399 .496 .578 .649
C4 3.329 .973 −1.156 −.012 .333 .651 .385
C5 2.547 1.116 .113 −1.380 .462 .595 .621
D1 2.437 1.221 .181 −1.551 .427 .595 .543
D2 2.834 1.126 −.318 −1.363 .471 .573 .615
D3 2.932 1.133 −.467 −1.293 .431 .593 .545
D4 3.424 .935 −1.434 .774 .339 .633 .448
D5 2.246 1.205 .439 −1.367 .380 .618 .483
553Trends in Psychology (2021) 29:543–562

specified between all four errors associated with these subscales. This model’s pathdiagram is presented in Fig. 1.
Table 5 presents the regression weights associated with this structural equation model.Significant, negative paths were found between gender and Nomophobia, with positive,significant paths found between grades 7 through 11 and Nomophobia. No significant pathswere found between grade 6 or grade 12 andNomophobia. Additionally, significant positivepaths were found between Nomophobia and subscales B through D. No significance testwas conducted on the path between Nomophobia and subscale A as this path wasconstrained to be equal to zero.
With regard to gender, this result found that females had an estimated value onNomophobia that was .202 units lower as compared with male respondents. With regardto grade, grade 5 was omitted from this model as the comparison category. Compared withgrade 5 respondents, those in grade 7 had expected values on Nomophobia that wereincreased by .250 units, with those in grade 8 having expected values on Nomophobia that
Table 4 Invariance tests by gender for Nomophobia and subscales
Model χ2(df) χ2/df TLI CFI RMSEA Hoelter .05 .01
A
Unconstrained 58.742*** (10) 5.874 .867 .934 .063 [.048, .080] 378 479
Meas. weights 88.347*** (15) 5.890 .867 .900 .064* [.051, .077] 344 420
Meas. Resid. 142.456*** (20) 7.123 .833 .833 .071** [.060, .082] 268 320
B
Unconstrained 15.649 (10) 1.565 .991 .995 .022 [.000, .041] 1416 1795
Meas. weights 29.795* (15) 1.986 .984 .988 .029 [.013, .044] 1016 1242
Meas. Resid. 54.852*** (20) 2.743 .972 .972 .038 [.026, .050] 694 830
C
Unconstrained 22.622* (10) 2.262 .970 .985 .032 [.014, .050] 980 1242
Meas. weights 44.029*** (15) 2.935 .954 .965 .040 [.027, .054] 688 841
Meas. Resid. 60.662*** (20) 3.033 .952 .952 .041 [.029, .053] 628 750
D
Unconstrained 49.282*** (10) 4.928 .893 .947 .057 [.042, .073] 451 571
Meas. weights 56.827*** (15) 3.788 .924 .943 .048 [.035, .062] 533 652
Meas. Resid. 70.791*** (20) 3.540 .931 .931 .046 [.035, .058] 538 643
Nomophobia
Unconstrained 1914.927*** (340) 5.632 .770 .794 .062*** [.059, .065] 244 256
Meas. weights 1970.301*** (360) 5.473 .778 .789 .061*** [.058, .063] 250 262
Meas. Resid. 2089.850*** (380) 5.500 .776 .776 .061*** [.058, .064] 248 260
Zero-order Pearson’s correlations between Nomophobia and subscales
Measure A B C D
B .643***
C .648*** .675***
D .686*** .685*** .702***
Nomophobia .857*** .867*** .867*** .885***
*p < .05, **p < .01, ***p < .001; df = 1209
554 Trends in Psychology (2021) 29:543–562
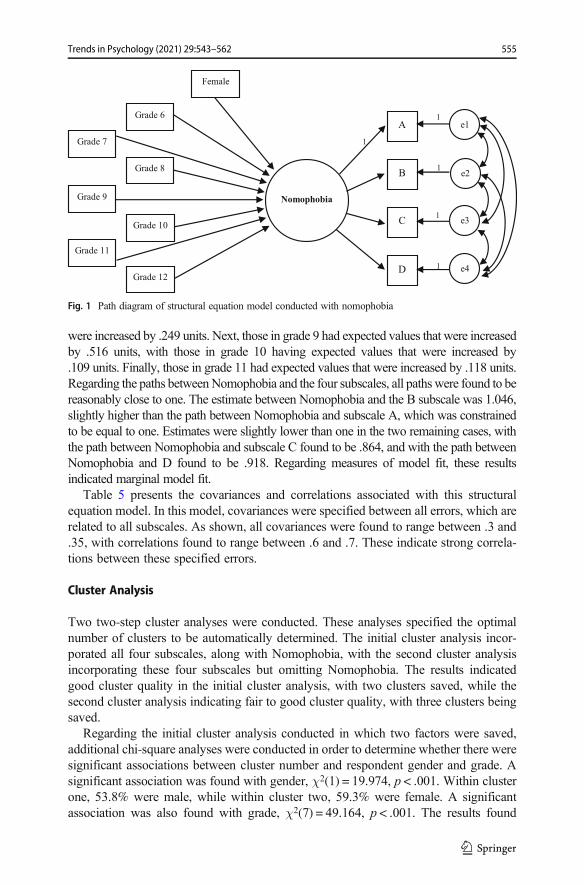
were increased by .249 units. Next, those in grade 9 had expected values that were increasedby .516 units, with those in grade 10 having expected values that were increased by.109 units. Finally, those in grade 11 had expected values that were increased by .118 units.Regarding the paths betweenNomophobia and the four subscales, all paths were found to bereasonably close to one. The estimate between Nomophobia and the B subscale was 1.046,slightly higher than the path between Nomophobia and subscale A, which was constrainedto be equal to one. Estimates were slightly lower than one in the two remaining cases, withthe path between Nomophobia and subscale C found to be .864, and with the path betweenNomophobia and D found to be .918. Regarding measures of model fit, these resultsindicated marginal model fit.
Table 5 presents the covariances and correlations associated with this structuralequation model. In this model, covariances were specified between all errors, which arerelated to all subscales. As shown, all covariances were found to range between .3 and.35, with correlations found to range between .6 and .7. These indicate strong correla-tions between these specified errors.
Cluster Analysis
Two two-step cluster analyses were conducted. These analyses specified the optimalnumber of clusters to be automatically determined. The initial cluster analysis incor-porated all four subscales, along with Nomophobia, with the second cluster analysisincorporating these four subscales but omitting Nomophobia. The results indicatedgood cluster quality in the initial cluster analysis, with two clusters saved, while thesecond cluster analysis indicating fair to good cluster quality, with three clusters beingsaved.
Regarding the initial cluster analysis conducted in which two factors were saved,additional chi-square analyses were conducted in order to determine whether there weresignificant associations between cluster number and respondent gender and grade. Asignificant association was found with gender, χ2(1) = 19.974, p < .001. Within clusterone, 53.8% were male, while within cluster two, 59.3% were female. A significantassociation was also found with grade, χ2(7) = 49.164, p < .001. The results found
Grade 7
Grade 9
Grade 6
Grade 8
Grade 11
Grade 12
Grade 10
Female
Nomophobia
A
B
C
D
e1
e2
e3
e4
1
1
1
1
1
Fig. 1 Path diagram of structural equation model conducted with nomophobia
555Trends in Psychology (2021) 29:543–562
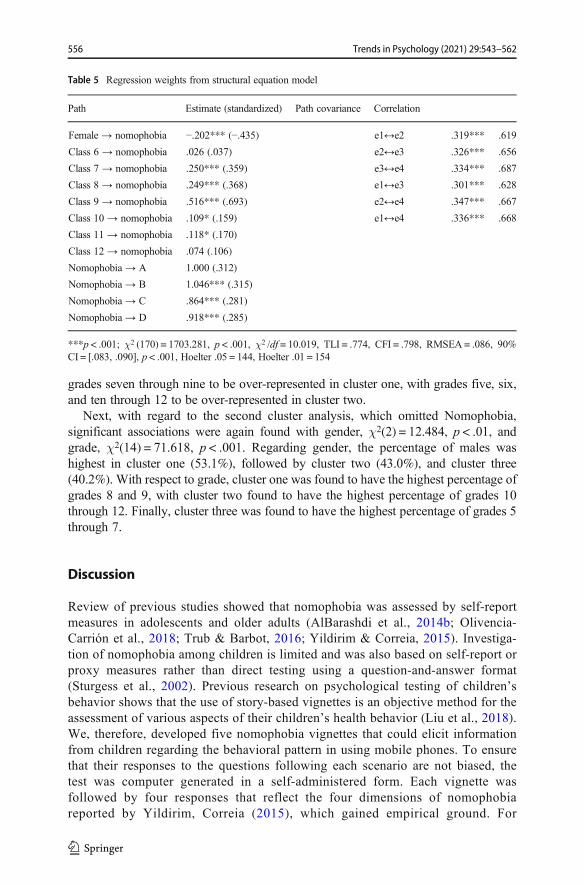
grades seven through nine to be over-represented in cluster one, with grades five, six,and ten through 12 to be over-represented in cluster two.
Next, with regard to the second cluster analysis, which omitted Nomophobia,significant associations were again found with gender, χ2(2) = 12.484, p < .01, andgrade, χ2(14) = 71.618, p < .001. Regarding gender, the percentage of males washighest in cluster one (53.1%), followed by cluster two (43.0%), and cluster three(40.2%). With respect to grade, cluster one was found to have the highest percentage ofgrades 8 and 9, with cluster two found to have the highest percentage of grades 10through 12. Finally, cluster three was found to have the highest percentage of grades 5through 7.
Discussion
Review of previous studies showed that nomophobia was assessed by self-reportmeasures in adolescents and older adults (AlBarashdi et al., 2014b; Olivencia-Carrión et al., 2018; Trub & Barbot, 2016; Yildirim & Correia, 2015). Investiga-tion of nomophobia among children is limited and was also based on self-report orproxy measures rather than direct testing using a question-and-answer format(Sturgess et al., 2002). Previous research on psychological testing of children’sbehavior shows that the use of story-based vignettes is an objective method for theassessment of various aspects of their children’s health behavior (Liu et al., 2018).We, therefore, developed five nomophobia vignettes that could elicit informationfrom children regarding the behavioral pattern in using mobile phones. To ensurethat their responses to the questions following each scenario are not biased, thetest was computer generated in a self-administered form. Each vignette wasfollowed by four responses that reflect the four dimensions of nomophobiareported by Yildirim, Correia (2015), which gained empirical ground. For
Table 5 Regression weights from structural equation model
Path Estimate (standardized) Path covariance Correlation
Female → nomophobia −.202*** (−.435) e1↔e2 .319*** .619
Class 6 → nomophobia .026 (.037) e2↔e3 .326*** .656
Class 7 → nomophobia .250*** (.359) e3↔e4 .334*** .687
Class 8 → nomophobia .249*** (.368) e1↔e3 .301*** .628
Class 9 → nomophobia .516*** (.693) e2↔e4 .347*** .667
Class 10 → nomophobia .109* (.159) e1↔e4 .336*** .668
Class 11 → nomophobia .118* (.170)
Class 12 → nomophobia .074 (.106)
Nomophobia → A 1.000 (.312)
Nomophobia → B 1.046*** (.315)
Nomophobia → C .864*** (.281)
Nomophobia → D .918*** (.285)
***p < .001; χ2 (170) = 1703.281, p < .001, χ2 /df = 10.019, TLI = .774, CFI = .798, RMSEA = .086, 90%CI = [.083, .090], p < .001, Hoelter .05 = 144, Hoelter .01 = 154
556 Trends in Psychology (2021) 29:543–562

validation purposes, data was collected on a representative sample from Oman toexamine its validity, reliability and authenticity.
The result of the employed statistical analyses indicated marginal to adequatereliability among the four nomophobia subscales, with very high reliability found inthe total score of Nomophobia. Previous studies showed that the four dimensionssuggested by Yildirim and Correia (2015) were reliable across different cultures(Galhardo et al., 2020; González-Cabrera et al., 2017; Lin et al., 2018; Ma & Liu,2018). Our findings, therefore, provide further evidence to the utility of the fourdimensions even though we used a different testing technique. The CFA resultsindicated appropriate factor structure, while measures of model fit varied, commonlyindicating marginal to acceptable model fit. Invariance tests found significantly differ-ent model results by gender in all cases, with strong correlations indicated between allsubscales, as well as between all subscales and Nomophobia. The results, therefore,provide further support to the four factors reported by Yildirim and Correia (2015),which were examined in different cultures (Galhardo et al., 2020; Lin et al., 2018;González-Cabrera et al., 2017; Ma & Liu, 2018). More specifically, Ma & Liu (2018)reported that the CFA provided support to the four dimensions of the NMP-Q on asample of 966 Chinese college students. Using EFA, González-Cabrera et al., (2017)reported a similar four-dimension structure of the NMP-Q in a Spanish sample of 306students aged 13–19 years. Galhardo et al. (2020) examined the NMP-Q scale structureamong 500 Portuguesa subjects aged 18–59 years. Testing three models of the NMP-Qfactor structure, they reported that one higher order factor (global nomophobia) withfour lower order factors revealed a good fit to the data.
Invariance tests found significantly different model results by gender in all cases,with strong correlations indicated between all subscales, as well as between all subscalesand Nomophobia. This result suggests that conclusions about differences in all subscalesand Nomophobia do not generalize over the set of items used in the IENT for both malesand females. Previous studies on NMP-Q provided support for gender invariance,reflecting that scores are comparable between both genders (Lin et al., 2018; Moreno-Guerrero et al., 2020a; Yildirim & Correia, 2015). Given that the gender measurementmodel of IENT does not hold across males and females, real differences in the structureof nomophobia may exist between both groups, differences in observed scores may notbe directly comparable, and some measurement bias could arise when nomophobia isassessed by the IENT. Therefore, the true differences across groups may be mixed withthe measurement bias of assessment.
With regard to the third aim, the structural equation model conducted foundsignificant relationships between gender, grade, and Nomophobia, as well as significantpaths between Nomophobia and the associated subscales. The results of the clusteranalysis revealed two to three clusters, with significant associations between gender,class, and cluster type. For the two-cluster solution, the first cluster was slightly moreheavily weighted by males, grades 7–9, and higher means on A–D and Nomophobia.Alternatively, the second cluster was slightly more heavily weighted by females, grades(5–6, 10–12), and lower means on A–D and Nomophobia. In the three-cluster solution,the first cluster was slightly more heavily weighted by males, grades 7–9, and thehighest means on A–D and Nomophobia. The second cluster was slightly more heavilyweighted by females, (5–6, 10–12), and moderate means on A-D and Nomophobia.The third cluster slightly more heavily weighted by females, grades (5–7, 10–11), and
557Trends in Psychology (2021) 29:543–562
the lowest means on A–D. Previous research studies found similar clusters of severe,moderate, and mild nomophobia levels in individuals with different psychologicaldistress and psychiatric disorders (Adawi et al., 2019), and in college students(Dasgupta et al., 2017). Additionally, nomophobia was shown to increase in lateadolescence as compared to adolescence (Yildiz Durak, 2018; Gezgin et al., 2018b;Kateb, 2017; Yildirim & Correia, 2015) and in males compared to females (AlBarashdiet al., 2014a, b; Yildiz Durak, 2019).
Limitations of the Study
The current study has a number of limitations that warrant discussion. First, the data did notinclude any information on the duration the participants used their smart phones. Thismeansthat claims on the participants’ exposure to their mobile phones could not be made. Second,the study did not collect any data on the participants’ other psychological problems whetherfrom their parents or their teachers in school. It could be expected that some of theparticipants had some type of psychological problems or psychiatric disorder, includinganxiety, depression, and obsessive compulsive disorder particularly in older participants inhigh school. These psychiatric problems could have comorbid effects with nomophobia.Third, all participants were indigenous Omani students and, therefore, our findings need tovalidated in other cultures whether in Asia or in Europe. Third, there was no data collectedon whether the electronic administration of the vignettes had any effect on the participants’responses. Further investigation is needed to examine participants’ responses on the writtenpaper and pencil format of the test. Fourth, no evidence was collected on the concurrent orcriterion validity of the test with other available instruments that assess nomophobia,including proxy and self-report measures. Further studies may explore concurrent validitywith such measures and other qualitative measures that could provide in depth informationon the utility of the test and what it actually captures.
Implications of the Study
The study offers a number of theoretical and practical implications. Given that nomophobiaresearch is at incipient phase, more empirical research is needed on testing the validity ofvarious assessment methods. To date, proxy and self-report measures represent the mostwidely used methods for measuring nomophobia. The current study provided preliminaryevidence that using scenario-based vignettes may provide a more flexible novel way ofassessing nomophobia in children. Future research needs to replicate this method withsamples from different age groups. The cluster analysis findings provide further evidencethat the effect of age and gender on nomophobia is salient but inconclusive. These resultsmay inform teachers and families when they consider children’s interaction with smartphones. This is equally important as a new reality has been shaped following the break out ofCOVID-19 pandemic during which the demarcation of advantages and risks associatedwiththe use of smart phones has disappeared. The recent emergence of the dependence ontechnology as the sole mode of education during disruptive time has provided compellingevidence that children’s vulnerability is confirmed. Anticipating the negative consequencesof nomophobia requires credible, authentic, and valid assessment that can inform the designof possible context-bound intervention (e.g., home, school) and which are informed bycultural values.
558 Trends in Psychology (2021) 29:543–562
Conclusion
Despite the study limitations, the findings of the current study indicated that the IENT isa valid and reliable measure to assess nomophobia children aged 10–18 years. Thefindings provided further evidence on the four-pronged structure of nomophobia whichgained ground through the use of NMP-Q in different cultures. The IENT has somepsychometric properties that warrant revision in future investigation, particularly withregard to gender invariance. Overall, our results showed that the IENT could be apromising measure of nomophobia in children that health professionals, school psy-chologists, and other professionals in clinical settings can use for various purposes.
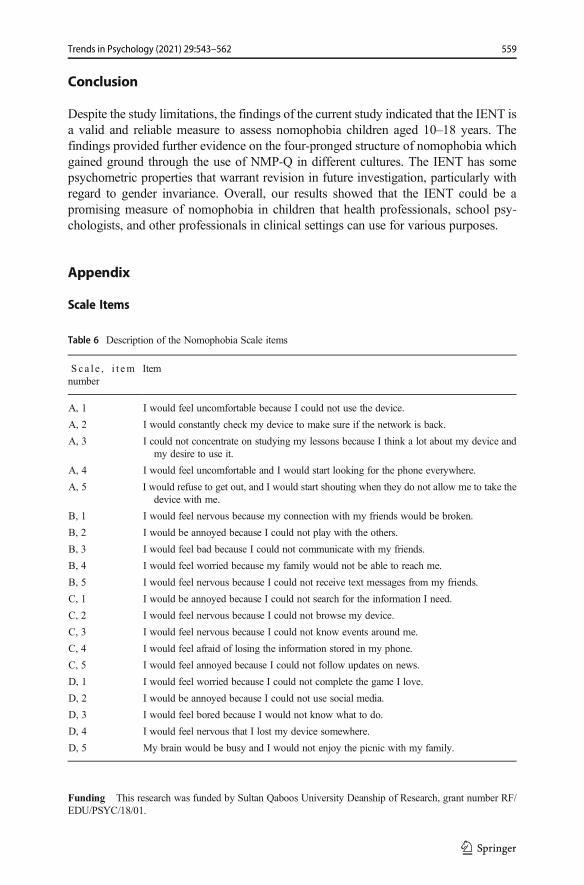
Appendix
Scale Items
Funding This research was funded by Sultan Qaboos University Deanship of Research, grant number RF/EDU/PSYC/18/01.
Table 6 Description of the Nomophobia Scale items
Sc a l e , i t emnumber
Item
A, 1 I would feel uncomfortable because I could not use the device.
A, 2 I would constantly check my device to make sure if the network is back.
A, 3 I could not concentrate on studying my lessons because I think a lot about my device andmy desire to use it.
A, 4 I would feel uncomfortable and I would start looking for the phone everywhere.
A, 5 I would refuse to get out, and I would start shouting when they do not allow me to take thedevice with me.
B, 1 I would feel nervous because my connection with my friends would be broken.
B, 2 I would be annoyed because I could not play with the others.
B, 3 I would feel bad because I could not communicate with my friends.
B, 4 I would feel worried because my family would not be able to reach me.
B, 5 I would feel nervous because I could not receive text messages from my friends.
C, 1 I would be annoyed because I could not search for the information I need.
C, 2 I would feel nervous because I could not browse my device.
C, 3 I would feel nervous because I could not know events around me.
C, 4 I would feel afraid of losing the information stored in my phone.
C, 5 I would feel annoyed because I could not follow updates on news.
D, 1 I would feel worried because I could not complete the game I love.
D, 2 I would be annoyed because I could not use social media.
D, 3 I would feel bored because I would not know what to do.
D, 4 I would feel nervous that I lost my device somewhere.
D, 5 My brain would be busy and I would not enjoy the picnic with my family.
559Trends in Psychology (2021) 29:543–562
Declarations
Conflict of Interest The authors declare no competing interests.
References
Adawi, M., Zerbetto, R., Re, T. S., Bisharat, B., Mahamid, M., Amital, H., Del Puente, G., & Bragazzi, N. L.(2019). Psychometric properties of the Brief Symptom Inventory in nomophobic subjects: insights frompreliminary confirmatory factor, exploratory factor, and clustering analyses in a sample of healthy Italianvolunteers. Psychology Research and Behavior Management, 12, 145–154.
Al-Balhan, E., Khabbache, H., Watfa, A., Re, T., Zerbetto, R., & Bragazzi, N. (2018). Psychometricevaluation of the Arabic version of the Nomophobia Questionnaire: confirmatory and exploratory factoranalysis-implications from a pilot study in Kuwait among university students. Psychology Research andBehavior Management, 11, 471–482. https://doi.org/10.2147/PRBM.S169918.
AlBarashdi, H., & Aldhafri, S. (2020). Alkasaes asaykometrya le asora almuaraba men meqyaas alnomofobialada alshabab [The psychometric properties of the Arabic version of nomophobia scale among Omaniyouth]. Journal of Educational and Psychological Researches, 17(64), 244–271.
AlBarashdi, H., Bouazza, A., & Al Zubaidi, A. (2014a). Psychometric properties of Smartphone AddictionQuestionnaire (SPAQ) among Sultan Qaboos University undergraduate students. Journal of Educationaland Psychological Studies, 8, 637–644. https://doi.org/10.12816/0014333.
AlBarashdi, H., Bouazza, A., & Jabr, N. (2014b). Smartphone addiction among Sultan Qaboos Universityundergraduates. Journal of Social Sciences Research, 5(2), 723–740.
Augner, C., & Hacker, G. (2012). Associations between problematic mobile phone use and psychologicalparameters in young adults. International Journal of Public Health, 57, 437–441. https://doi.org/10.1007/s00038-011-0234-z.
Betoncu, O., & Ozdamli, F. (2019). The disease of 21st century: digital disease. TEM Journal, 8(2), 598–603.https://doi.org/10.18421/TEM82-37.
Bhattacharya, A., Bashar, M., Srivastava, A., & Singh, A. (2019). Nomophobia: no mobile phone phobia.Journal of Family Medicine and Primary Care, 8(4), 1297–1300.
Bianchi, A., & Phillips, J. (2005). Psychological predictors of problem mobile phone use. Cyber Psychologyand Behavior, 8(1), 39–51.
Billieux, J., Linden, M., & Rochat, L. (2008). The role of impulsivity in actual and problematic use of themobile phone. Applied Cognitive Psychology, 22, 1195–1210. https://doi.org/10.1002/acp.
Bragazzi, N., & Puente, G. (2014). A proposal for including nomophobia in the new DSM-V. PsychologyResearch and Behavior Management, 7, 155–160. https://doi.org/10.2147/PRBM.S41386.
Buctot, D. B., Kim, N., & Kim, S. H. (2020). The role of nomophobia and smartphone addiction in thelifestyle profiles of junior and senior high school students in the Philippines. Social Sciences &Humanities Open, 2(1), 100035.
Chiu, C. T., Chang, Y. H., Chen, C. C., Ko, M. C., & Li, C. Y. (2015). Mobile phone use and healthsymptoms in children. Journal of the Formosan Medical Association, 114(7), 598–604.
Dasgupta, P., Bhattacherjee, S., Dasgupta, S., Roy, J. K., Mukherjee, A., & Biswas, R. (2017). Nomophobicbehaviors among smartphone using medical and engineering students in two colleges of West Bengal.Indian Journal of Public Health, 61(3), 199–204.
Fadzil, N. M., Abdullah, M. Y., & Salleh, M. A. M. (2016). The level of tolerance sanctıonıng children usınggadgets by parents lead to nomophobia: Early age gadgets exposure. International Journal of Arts &Sciences, 9(2), 615–622.
Galhardo, A., Loureiro, D., Raimundo, E., Massano-Cardoso, I., & Cunha, M. (2020). Assessing nomophobia:validation study of the European Portuguese version of the Nomophobia Questionnaire. CommunityMental Health Journal, 56, 1–10. https://doi.org/10.1007/s10597-020-00600-z.
Gao, Y., Dai, H., Jia, G., Liang, C., Tong, T., Zhang, Z., Song, R., Wang, Q., & Zhu, Y. (2020). Translation ofthe Chinese version of the nomophobia questionnaire and its validation among college students: factoranalysis. JMIR mHealth and uHealth, 8(3), e13561.
Gezgin, D., Hamutoglu, N., Sezen-Gultekin, G., & Ayas, T. (2018a). The relationship between nomophobiaand loneliness among Turkish adolescents. International Journal of Research in Education and Science,4(2), 358–374. https://doi.org/10.21890/ijres.409265.
560 Trends in Psychology (2021) 29:543–562
Gezgin, D. M., Cakir, O., & Yildirim, S. (2018b). The relationship between levels of nomophobia prevalenceand internet addiction among high school students: the factors influencing nomophobia. InternationalJournal of Research in Education and Science, 4(1), 215–225. https://doi.org/10.21890/ijres.383153.
González-Cabrera, J., León-Mejía, A., Pérez-Sancho, C., & Calvete, E. (2017). Adaptation of theNomophobia Questionnaire (NMP-Q) to Spanish in a sample of adolescents. Actas Españolas dePsiquiatría, 45, 137–144.
Harrington, D. (2009). Confirmatory factor analysis. New York: Oxford University Press.International Telecommunication Union. (2018). Statistics. Retrieved from: https://www.itu.int/en/ITU-D/
Statistics/Pages/stat/default.aspxKang, S., & Jung, J. (2014). Mobile communication for human needs: a comparison of smartphone use
between the US and Korea. Computers in Human Behavior, 35, 376–387. https://doi.org/10.1016/j.chb.2014.03.024.
Kateb, S. A. (2017). The prevalence and psychological symptoms of nomophobia among university students.Journal of Research in Curriculum Instruction and Educational Technology, 3(3), 155–182.
Kwon, M., Kim, D. J., Cho, H., & Yang, S. (2013). The smartphone addiction scale: development andvalidation of a short version for adolescents. PLoS One, 8(12), 1–7. https://doi.org/10.1371/journal.pone.0083558.
Lee, S., Tam, C., & Chie, Q. (2014). Mobile phone usage preferences: the contributing factors of personality,social anxiety and loneliness. Social Indicators Research, 118, 1205–1228. https://doi.org/10.1007/s11205-013-0460-2.
Leung, C. (2017). Assessing mobile phone dependency and teens’ everyday life in Hong Kong. AustralianJournal of Psychology, 69, 29–38. https://doi.org/10.1111/ajpy.12115.
Lin, C., Griffith, M., & Pakpur, A. (2018). Psychometric evaluation of Persian Nomophobia Questionnaire:differential item functioning and measurement invariance across gender. Journal of BehavioralAddictions, 7(1), 100–108. https://doi.org/10.1556/2006.7.2018.11.
Liu, C. H., Liao, L. L., Cheng, C. C. J., & Chang, T. C. (2018). Development and validation of the TaiwanChildren’s Health Literacy Test. Global Health Promotion, 25(2), 34–46.
Ma, J., & Liu, C. (2018). Evaluation of the factor structure of the Chinese version of the NomophobiaQuestionnaire. Current Psychology, 1–7. https://doi.org/10.1007/s12144-018-0071-9.
Matusik, S. F., & Mickel, A. E. (2011). Embracing or embattled by converged mobile devices? Users’experiences with a contemporary connectivity technology. Human Relations, 64(8), 1001–1030. https://doi.org/10.1177/0018726711405552.
Moreno-Guerrero, A. J., Aznar-Díaz, I., Cáceres-Reche, P., & Rodríguez-García, A. M. (2020a). Do age,gender and poor diet influence the higher prevalence of nomophobia among young people? InternationalJournal of Environmental Research and Public Health, 17(10), 3697.
Moreno-Guerrero, A. J., López-Belmonte, J., Romero-Rodríguez, J. M., & Rodríguez-García, A. M. (2020b).Nomophobia: impact of cell phone use and time to rest among teacher students. Heliyon, 6(5), e04084.
Olivencia-Carrión, M., Ferri-García, R., Rueda, M., Jiménez-Torres, M., & López-Torrecillas, F. (2018).Temperament and characteristics related to nomophobia. Psychiatry Research, 266, 5–10. https://doi.org/10.1016/j.psychres.2018.04.056.
Oulasvirta, A., Rattenbury, T., Ma, L., & Raita, E. (2012). Habits make smartphone use more pervasive.Personal and Ubiquitous Computing, 16, 105–114. https://doi.org/10.1007/s00779-011-0412-2.
Park, N., Kim, Y., Shon, H., & Shim, H. (2013). Factors influencing smartphone use and dependency in SouthKorea. Computers in Human Behavior, 29(4), 1763–1770. https://doi.org/10.1016/j.chb.2013.02.008.
Rangka, I., Prasetyaningtyas, w., Ifdil, I., Ardi, Z., Suranata, K., Winingsih, E., Sofyan, A., Irawan, M.,Arjanto, P., Muslifar, R., & Wijaya, R. (2018). Measuring psychometric properties of the Indonesianversion of the NoMoPhobia Questionnaire (NMPQ): insight from Rasch measurement tool. Journal ofPhysics: Conference Series, 1114, 1–7. https://doi.org/10.1088/1742-6596/1114/1/012127.
Rodríguez-García, A. M., Moreno-Guerrero, A. J., & López Belmonte, J. (2020). Nomophobia: an individ-ual’s growing fear of being without a smartphone—a systematic literature review. International Journalof Environmental Research and Public Health, 17(2), 580.
SecurEnvoy. (2012). 66% of the population suffer from nomophobia the fear of being without their phone.Retrieved July 28, 2019 from: https://www.securenvoy.com/en-gb/blog/66-population-suffer-nomophobia-fear-being-without-their-phone
Sturgess, J., Rodger, S., & Ozanne, A. (2002). A review of the use of self-report assessment with youngchildren. British Journal of Occupational Therapy, 65(3), 108–116.
Tams, S., Legoux, R., & Leger, P. (2018). Smartphone withdrawal creates stress: a moderated mediationmodel of nomophobia, social threat, and phone withdrawal context. Computers in Human Behavior, 81,1–9. https://doi.org/10.1016/j.chb.2017.11.026.
561Trends in Psychology (2021) 29:543–562
https://www.securenvoy.com/en-gb/blog/66-population-suffer-nomophobia-fear-being-without-their-phone

The National Center for Statistics and Information in Oman. (2018). Data portal: communication. Retrievedfrom: https://data.gov.om/OMCMC2016
Toda, M., Monden, K., Kubo, K., & Morimoto, K. (2004). Cellular phone dependence tendency of femaleuniversity students. Nippon Eiseigaku Zasshi (Japanese Journal of Hygiene), 59(4), 383–386.
Trub, L., & Barbot, B. (2016). The paradox of phone attachment: Development and validation of the YoungAdult Attachment to Phone Scale (YAPS). Computers in Human Behavior, 64, 663–672. https://doi.org/10.1016/j.chb.2016.07.050.
Villar, L., Grau, J., & Colet, A. (2017). Exploratory investigation of theoretical predictors of nomophobiausing the Mobile Phone Involvement Questionnaire (MPIQ). Journal of Adolescence, 56, 127–135.https://doi.org/10.1016/j.adolescence.2017.02.003.
Walsh, S. P., White, K. M., & Young, R. M. (2010). Needing to connect: The effect of self and others onyoung people's involvement with their mobile phones. Australian Journal of Psychology, 62(4), 194–203.
Wang, L., Tao, T., & fan, C., Gao, W., & Wei, C. (2017). The association between internet addiction and bothimpulsivity and effortful control and its variation with age. Addiction Research and Theory, 25(1), 83–90.https://doi.org/10.1080/16066359.2016.1206082.
Yildirim, C., & Correia, A. (2015). Exploring the dimensions of nomophobia: development and validation of aself-reported questionnaire. Computers in Human Behavior, 49, 130–137. https://doi.org/10.1016/j.chb.2015.02.059.
Yildiz Durak, H. Y. (2018). What would you do without your smartphone? Adolescents’ social media usage,locus of control and loneliness as a predictor of Nomophobia. The Turkish Journal on Addiction, 5(2), 1–15.
Yildiz Durak, H. (2019). Investigation of nomophobia and smartphone addiction predictors among adoles-cents in Turkey: demographic variables and academic performance. The Social Science Journal, 56(4),492–517.
Zheng, F., Gao, P., He, M., Li, M., Tan, J., Chen, D., Zhou, Z., Yu, Z., & Zhang, L. (2015). Associationbetween mobile phone use and self-reported well-being in children: a questionnaire-based cross-sectionalstudy in Chongqing, China. BMJ Open, 5(5), 1–7.
Affiliations
Ali Mahdi Kazem1& Mahmoud Mohammed Emam1
& Marwa Nasser Alrajhi2 &
Said Sulaiman Aldhafri1,3 & Hafidha Sulaiman AlBarashdi3 & Bahia AbdullahAl-Rashdi4
1 Department of Psychology, College of Education, Sultan Qaboos University, P.O.Box: 32, Al-Khod,P.C.: 123 Muscat, Oman
2 Student Counseling Centre, Sultan Qaboos University, Muscat, Oman
3 Research Council, Muscat, Oman
4 Ministry of Education, Muscat, Oman
562 Trends in Psychology (2021) 29:543–562
Related Documents