http://jfs.sagepub.com/ Journal of Fire Sciences http://jfs.sagepub.com/content/30/3/240 The online version of this article can be found at: DOI: 10.1177/0734904111433265 2012 30: 240 originally published online 14 February 2012 Journal of Fire Sciences Sergey V. Shepel, Karim Ghazi Wakili and Erich Hugi nominal fire scenarios Investigation of heat transfer in gypsum plasterboard exposed to fire for three Published by: http://www.sagepublications.com can be found at: Journal of Fire Sciences Additional services and information for http://jfs.sagepub.com/cgi/alerts Email Alerts: http://jfs.sagepub.com/subscriptions Subscriptions: http://www.sagepub.com/journalsReprints.nav Reprints: http://www.sagepub.com/journalsPermissions.nav Permissions: http://jfs.sagepub.com/content/30/3/240.refs.html Citations: What is This? - Feb 14, 2012 OnlineFirst Version of Record - May 17, 2012 Version of Record >> at Lib4RI on May 20, 2012 jfs.sagepub.com Downloaded from

Welcome message from author
This document is posted to help you gain knowledge. Please leave a comment to let me know what you think about it! Share it to your friends and learn new things together.
Transcript
http://jfs.sagepub.com/Journal of Fire Sciences
http://jfs.sagepub.com/content/30/3/240The online version of this article can be found at:
DOI: 10.1177/0734904111433265 2012 30: 240 originally published online 14 February 2012Journal of Fire Sciences
Sergey V. Shepel, Karim Ghazi Wakili and Erich Huginominal fire scenarios
Investigation of heat transfer in gypsum plasterboard exposed to fire for three
Published by:
http://www.sagepublications.com
can be found at:Journal of Fire SciencesAdditional services and information for
http://jfs.sagepub.com/cgi/alertsEmail Alerts:
http://jfs.sagepub.com/subscriptionsSubscriptions:
http://www.sagepub.com/journalsReprints.navReprints:
http://www.sagepub.com/journalsPermissions.navPermissions:
http://jfs.sagepub.com/content/30/3/240.refs.htmlCitations:
What is This?
- Feb 14, 2012OnlineFirst Version of Record
- May 17, 2012Version of Record >>
at Lib4RI on May 20, 2012jfs.sagepub.comDownloaded from
Article
Journal of Fire Sciences
30(3) 240–255
� The Author(s) 2012
Reprints and permissions:
sagepub.co.uk/journalsPermissions.nav
DOI: 10.1177/0734904111433265
jfs.sagepub.com
Investigation of heat transferin gypsum plasterboardexposed to fire for threenominal fire scenarios
Sergey V. Shepel, Karim Ghazi Wakili and Erich Hugi
Date received: 29 July 2011; accepted: 28 November 2011
AbstractThe present article is concerned with modelling of heat transfer through a plasterboard panelexposed to fire. Two commercial plasterboard materials are tested for three nominal fire scenar-ios in a certified furnace, and the obtained temperature measurements are used to test and tovalidate a numerical model of plasterboard developed recently by Shepel et al. with the ultimategoal of exposing the model to a wider range of fire conditions. Overall, the agreement betweenthe obtained numerical predictions and experimental data is found to be good. Some discrepan-cies observed at the early and late stages of the dehydration reaction are shown to be caused bythe high local heating rate of the material during those stages.
Keywordsgypsum, plasterboard, fire regime, heating rate, validation
Introduction
Plasterboard panels are produced by pressing a gypsum plaster between paper sheets orfibreglass mats. Owing to the good mechanical properties, high fire resistance and relativelylow cost of production, plasterboard has become a popular construction material usedmainly for lightweight wall structures. The main reason for the high resistance of fire spread-ing through plasterboards is the dehydration phenomenon: a chemical endothermic reaction
Empa, Swiss Federal Laboratories for Materials Science and Technology, Uberlandstrasse 129, CH-8600, Dubendorf,
Switzerland
Corresponding author:
Sergey V. Shepel, Wartsila Switzerland Ltd, P.O. Box 414, Zurcherstrasse 12, CH-8401, Winterthur, Switzerland.
Email: [email protected]
at Lib4RI on May 20, 2012jfs.sagepub.comDownloaded from
occurring in the temperature range ’90�C–250�C, whereby the chemically bounded watercontained in the gypsum crystal structure is released as vapour.1,2 The vapour is then drivenby pressure and concentration gradients through the pore network to the plasterboard sur-faces where it is expelled into the surroundings. As the dehydration reaction consumes alarge amount of heat, the heat transfer from the fire-exposed surface of plasterboard to theunexposed ‘cold’ surface is strongly retarded during the initial stage of fire, causing a consid-erable delay in the temperature rise on the cold side of plasterboard. This extends accord-ingly the time available for the evacuation of buildings. Therefore, investigation of thedehydration phenomenon and its effects on the heat transfer is of high importance for firesafety engineering.
In our recent study,3 a new numerical model of heat and mass transfer in dehydratingplasterboard was proposed, in which the presence of air inside plasterboard pores wasneglected. This simplification is justifiable, because in the case of monotonic temperaturegrowth on the fire-exposed side of a plasterboard panel, which is a typical fire scenario, noair flows into the material from the surroundings, and furthermore the initial content of airin the plasterboard constitutes less than 1% of the total amount of vapour generated bydehydration. It should be mentioned that the approach based on the idea of excluding airout of modelling has been used before.4 Our contribution in the study3 consisted of furtherdevelopment of the model by providing it with condensation capabilities. The model wasvalidated using temperature measurement data for two plasterboard materials tested in thestandard fire resistance test ISO-834.5 It was demonstrated in the study3 that the convectiveflow of vapour generated by dehydration plays an important role in the heat transfer. Thepresence of paper liner on plasterboard surfaces was found to affect somewhat the distribu-tion of vapour fluxes between the hot and cold sides; however, the effect of paper onthe heat transfer was found to be negligible. The amount of condensate accumulating inpores during the fire was found to be low and its effect on the heat transfer negligible.Alternative approaches to modelling the vapour convection have been presented in the pre-vious studies.6–8
As it is possible to develop engineering correlations describing the temperature rise on thecold side of plasterboard exposed to fire, one might tend to assume that there is no need formathematical modelling. However, such correlations are applicable only to those fire scenar-ios and those materials, for which they have been validated. Any changes in the flame tem-perature or plasterboard properties raise concerns about the accuracy of predictionsobtained using those correlations, and the cost of fire tests is high. For this reason, this studyis aimed at applying the model developed recently by Shepel et al.3 to new fire scenarios andnew plasterboard materials, in order to carry out additional assessment of the model byexposing it to a wider range of fire conditions. To achieve this goal, two commercial plaster-board materials, different from those used in the study by Shepel et al.,3 are selected for thepresent investigation. The plasterboards, one of which is covered with paper liner and theother with fibreglass mats, are characterised using thermogravimetric analysis (TGA), per-meability and thermal conductivity measurements and then several specimens are tested infire using three nominal heating curves: the standard ISO-834 curve,9 the hydrocarboncurve10 and the external fire exposure curve.10 The standard ISO-834 was used for validationpurposes by Shepel et al.3; nevertheless, it is also used in this study for reference purposes.Readings of the thermocouples installed inside and on the cold side of the tested plaster-board panels are compared with the predictions of the model. A critical analysis of theresults is given in the following section.
Shepel et al. 241
at Lib4RI on May 20, 2012jfs.sagepub.comDownloaded from
Plasterboard model
Two types of plasterboard of the same thickness (12 mm) are produced industrially11 accord-ing to the European standard EN 52012 and have similar chemical compositions. One mate-rial (hereafter referred to as plasterboard 1) is covered with paper liner on both sides, and theother (referred to as plasterboard 2) is covered with fibreglass mats. The fire-exposed surfaceof plasterboard is referred to as the fire side, and the unexposed surface is referred to as thecold side. The subscripts D and DC denote dehydration and decarbonation, whereas the sub-scripts w and v denote water and water vapour. The superscripts BD, AD and ADC denotebefore dehydration, after dehydration and after decarbonation, respectively.
The main component of the plasterboard core is gypsum, calcium sulphate dihydrateCaSO4 � 2H2O. The gypsum content in the two plasterboard materials studied herein consti-tutes approximately 83% (by mass). Under monotonic heating in air in the temperaturerange 90�C–250�C,1,2,13 gypsum undergoes a two-step dehydration reaction
CaSO4 � 2H2O(s)! CaSO4 � 0:5H2O(s) + 1:5H2O(g) ð1aÞ
CaSO4 � 0:5H2O(s)! CaSO4(s) + 0:5H2O(g) ð1bÞ
the final products of which are calcium sulphate anhydrite, CaSO4 and water vapour.Calcium carbonate CaCO3 constituting 11.6% of the core of the two plasterboards experi-ences endothermic decomposition, the so-called decarbonation reaction
CaCO3 ! CaO+CO2(g) ð2Þ
in the temperature range of 700�C–800�C. The amounts of gypsum and calcium carbonatepresent in the two materials have been established using TGA.13
To evaluate the influence of air contained initially in plasterboard pores on the heat andmass transfer during dehydration, it is sufficient to compare the mass of the air to the massof generated vapour. Before dehydration, the mass of air contained in a piece of plasterboardof volume V is equal to fBD
m raV , where fm is the material porosity and ra is the air density.The mass of vapour is equal to DrmV , where Drm = rBD
m � rADm is the decrease in plasterboard
density caused by dehydration. Hence, the ratio of the mass of air to that of vapour is givenby fBD
m ra=Drm. For typical values of fBDm = 0:65 and Drm = 150 kg=m3,3,13 this ratio is equal
to 0.005. Consequently, the effects of air on the convective heat transfer in dehydrating plas-terboard are rather small and can be neglected. As the values of thermal conductivity, spe-cific heat and density of air and vapour are of the same order, we model the plasterboardassuming that its pores are from the beginning filled with water vapour only (this approachrequires naturally some modification of the vapour saturation curve). Leaving air out of con-sideration reduces the number of equations by one, but more important, this approach sim-plifies the formulation of boundary condition for the mass transfer at plasterboard surfaces,which in this case is simply the Dirichlet condition: pv = pA, where pv is the vapour pressureand pA is the atmospheric pressure.
The main difficulty resulting from adding air into analysis is the necessity of imposing aboundary condition on the partial pressure of vapour or its gradient at the external plaster-board surfaces. This is not a trivial task, since the standard approach of handling such prob-lems employs the convective boundary condition with the corresponding mass transfercoefficient. However, the latter is not well defined for a dehydrating plasterboard expelling
242 Journal of Fire Sciences 30(3)
at Lib4RI on May 20, 2012jfs.sagepub.comDownloaded from
vapour into the surroundings, and it is not clear at all if the convective boundary conditionis appropriate for the problem under study. There are a number of available empirical corre-lations for the mass transfer coefficient,14 but these correlations are normally obtained forrelatively impermeable surfaces. The use of convective boundary conditions can be justified,for instance, for simulation of dehydration in concrete,15 as convection of gases in concreteis very slow owing to the low permeability of this material. In contrast, the permeability ofplasterboard is one order of magnitude higher than that of concrete,3 and the vapour flow-ing out of plasterboard through the pores on the surface hardly experiences any resistancefrom the developing concentration boundary layer. Nevertheless, some researchers use theconvective boundary condition for modelling the dehydration in plasterboard.6
Material properties
Table 1 shows some thermophysical properties of the two materials before and after dehy-dration. The porosity values have been obtained using the mercury intrusion porosimetryprocedure. The plasterboard permeabilities have been measured using the falling head per-meameter (for details see Ref. 3).
Rates of the reactions (1a) and (1b) reach their maxima at different but close tempera-tures, the values of which depend on the applied heating rate16,17 and the local partial pres-sure of vapour.18 Unfortunately, there are no available correlations describing the combinedeffects of the heating rate and partial pressure of vapour; although, the dependence of dehy-dration temperature range on the heating rate alone has been addressed.17 A simplisticapproach is employed here assuming that the dehydration reaction starts at certain tempera-ture TD1, and it is complete at temperature TD2, with the maximum production of vapourbeing reached at the intermediate temperature TD = (TD1 + TD2)=2. Accordingly, all numericalsimulations are carried out in this study assuming constant values of TD1 and TD2; however,some possible effects of the heating rate on the value of TD and correspondingly on thenumerical solution are addressed and discussed. One possible alternative approach would beto approximate the rate of dehydration reaction using the Arrhenius model4; however, thisapproach requires introduction of additional assumptions concerning the kinetics of thedehydration reaction (activation energy, the rate constant).
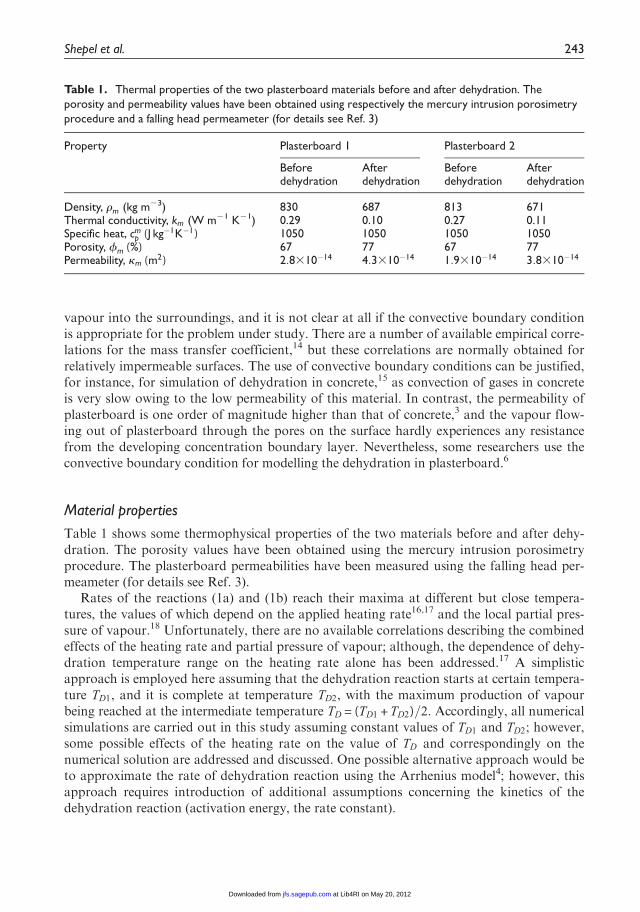
Table 1. Thermal properties of the two plasterboard materials before and after dehydration. Theporosity and permeability values have been obtained using respectively the mercury intrusion porosimetryprocedure and a falling head permeameter (for details see Ref. 3)
Property Plasterboard 1 Plasterboard 2
Beforedehydration
Afterdehydration
Beforedehydration
Afterdehydration
Density, rm (kg m23) 830 687 813 671Thermal conductivity, km (W m21 K21) 0.29 0.10 0.27 0.11Specific heat, cm
p (J kg�1K�1) 1050 1050 1050 1050Porosity, fm (%) 67 77 67 77Permeability, km (m2) 2:8310�14 4:3310�14 1:9310�14 3:8310�14
Shepel et al. 243
at Lib4RI on May 20, 2012jfs.sagepub.comDownloaded from
The dependence of plasterboard density rm on local temperature is approximated asfollows:
rm(T) = rBDm + (rAD
m � rBDm )HDTD
(T � TD) + (rADCm � rAD
m )HDTDC(T � TDC) ð3Þ
where HDT (j) is the smoothed Heaviside function:
HDT (j) =0 if j\� DT
(j + DT )=(2DT) + sin (pj=DT )=(2p) if jj j<DT
1 if j.DT
8<: ð4Þ
Here, j = T � TD and DT = DTD in the second term of equation (3) (dehydration contribu-tion) and j = T � TDC and DT = DTDC in the third term (decarbonation contribution). Thefunction defined by equation (4) is commonly used in Computational Fluid Dynamicsbecause it ensures good numerical stability.19
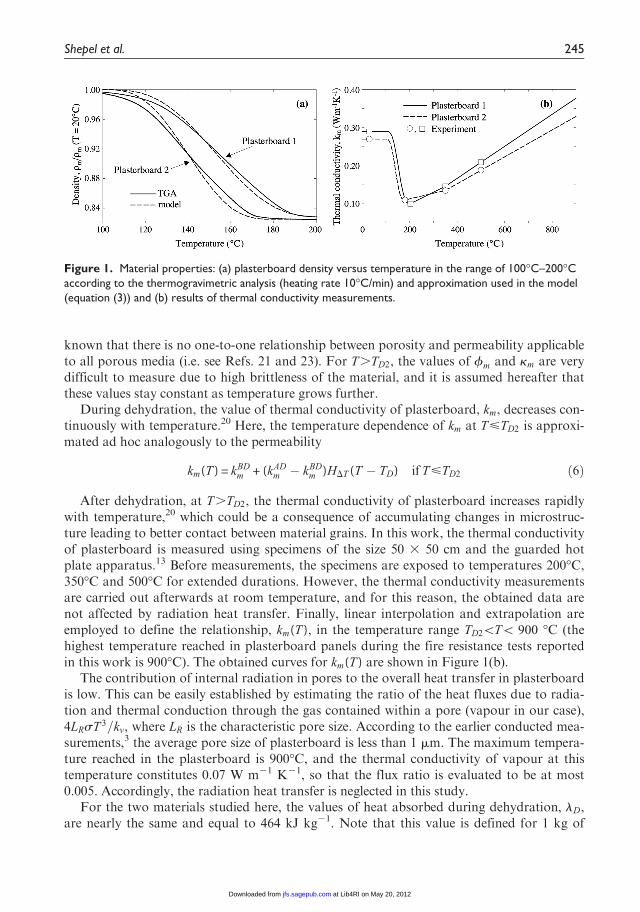
The values of TD1 and TD2 for the two materials determined using TGA at the heatingrate of 10�C/min are given in Table 2. Figure 1(a) shows the obtained curves rm (T) com-pared to the approximations given by equation (3). The approximations provide acceptableaccuracy. The noticeable difference between the curves corresponding to the two differentmaterials is believed to be a consequence of differences in the microstructures. It should bealso noted that according to the results of TGA, both materials are already slightly dehy-drated as the temperature exceeds the 100�C mark, which implies slow partial dehydrationat T\1008C. Nevertheless, the amount of dehydrated phase at T = 100 8C is very small, andit can be neglected.
With the exception of thermal conductivity, many properties of dehydrated plasterboardshow negligible variations with increasing temperature until the end of decarbonation,20
Contraction of dehydrating plasterboard can be also neglected.20 However, within the dehy-dration temperature range, the variations of plasterboard properties have to be taken intoaccount. It is assumed here that the values of porosity fm and permeability km vary propor-tionally to the material density
fm(T ) = fBDm + (fAD
m � fBDm )HDT (T � TD) ð5aÞ
km(T ) = kBDm + (kAD
m � kBDm )HDT (T � TD) ð5bÞ
As the relationship between material density and its effective porosity for many materialsis close to linear,21,22 the choice of equation (5a) appears to be justified. In contrast, equation(5b) is an ad hoc assumption made due to lack of data for dehydrating plasterboard, as it is
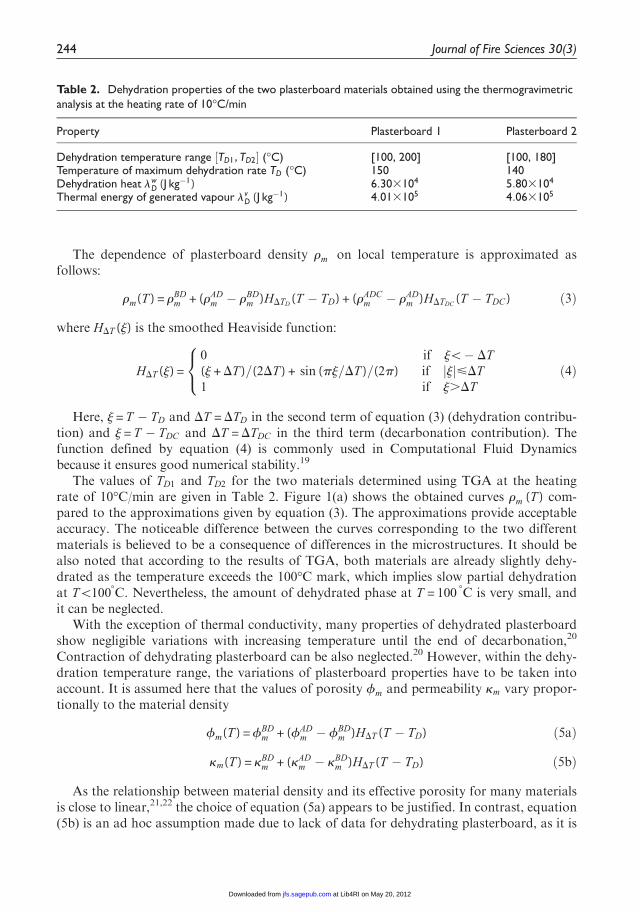
Table 2. Dehydration properties of the two plasterboard materials obtained using the thermogravimetricanalysis at the heating rate of 10�C/min
Property Plasterboard 1 Plasterboard 2
Dehydration temperature range ½TD1, TD2� (�C) [100, 200] [100, 180]Temperature of maximum dehydration rate TD (�C) 150 140Dehydration heat lw
D (J kg�1) 6:303104 5:803104
Thermal energy of generated vapour lvD (J kg�1) 4:013105 4:063105
244 Journal of Fire Sciences 30(3)
at Lib4RI on May 20, 2012jfs.sagepub.comDownloaded from
known that there is no one-to-one relationship between porosity and permeability applicableto all porous media (i.e. see Refs. 21 and 23). For T.TD2, the values of fm and km are verydifficult to measure due to high brittleness of the material, and it is assumed hereafter thatthese values stay constant as temperature grows further.
During dehydration, the value of thermal conductivity of plasterboard, km, decreases con-tinuously with temperature.20 Here, the temperature dependence of km at T<TD2 is approxi-mated ad hoc analogously to the permeability
km(T) = kBDm + (kAD
m � kBDm )HDT (T � TD) ifT<TD2 ð6Þ
After dehydration, at T.TD2, the thermal conductivity of plasterboard increases rapidlywith temperature,20 which could be a consequence of accumulating changes in microstruc-ture leading to better contact between material grains. In this work, the thermal conductivityof plasterboard is measured using specimens of the size 50 3 50 cm and the guarded hotplate apparatus.13 Before measurements, the specimens are exposed to temperatures 200�C,350�C and 500�C for extended durations. However, the thermal conductivity measurementsare carried out afterwards at room temperature, and for this reason, the obtained data arenot affected by radiation heat transfer. Finally, linear interpolation and extrapolation areemployed to define the relationship, km(T), in the temperature range TD2\T\ 900 �C (thehighest temperature reached in plasterboard panels during the fire resistance tests reportedin this work is 900�C). The obtained curves for km(T) are shown in Figure 1(b).
The contribution of internal radiation in pores to the overall heat transfer in plasterboardis low. This can be easily established by estimating the ratio of the heat fluxes due to radia-tion and thermal conduction through the gas contained within a pore (vapour in our case),4LRsT 3=kv, where LR is the characteristic pore size. According to the earlier conducted mea-surements,3 the average pore size of plasterboard is less than 1 mm. The maximum tempera-ture reached in the plasterboard is 900�C, and the thermal conductivity of vapour at thistemperature constitutes 0.07 W m21 K21, so that the flux ratio is evaluated to be at most0.005. Accordingly, the radiation heat transfer is neglected in this study.
For the two materials studied here, the values of heat absorbed during dehydration, lD,are nearly the same and equal to 464 kJ kg21. Note that this value is defined for 1 kg of
Figure 1. Material properties: (a) plasterboard density versus temperature in the range of 100�C–200�Caccording to the thermogravimetric analysis (heating rate 10�C/min) and approximation used in the model(equation (3)) and (b) results of thermal conductivity measurements.
Shepel et al. 245
at Lib4RI on May 20, 2012jfs.sagepub.comDownloaded from
intact, non-dehydrated plasterboard. It should be also taken into consideration that thevalue of lD, which is obtained using the Differential Scanning Calorimetry, includes thethermal energy of vapour generated by dehydration, and the amount of this energy is quitehigh. However, if convection of vapour in the material is modelled explicitly, one should notinclude the thermal energy of vapour leaving the material at its surfaces into the value of lD
(see Ref. 3 for details). Let us denote the energy necessary to drive water molecules out ofcrystal structure of the material as lw
D and the thermal energy of vapour that is lost to thesurroundings as lv
D. Then
lD = lwD + lv
D ð7Þ
Having the results of TGA and the value of lD, one can easily estimate the quantities lwD
and lvD using the method proposed by Shepel et al.3 In particular, the estimate of lw
D is givenas
lwD = lD �
Drm
rBDm
ðTD2
TD1
(hv(T )� cmp T)H9DT (T � TD)dT ð8Þ
where Drm = rBDm � rAD
m , H9DT is the derivative of HDT (T) with respect to T , and hv is the spe-cific enthalpy of water vapour. The vapour enthalpy at atmospheric pressure grows linearlywith temperature from 2676 kJ/kg at 100�C to 2875 kJ/kg at 200�C.24 Substitution of equa-tion (4) into equation (8) yields lw
D = lD � Drm
rBDm
(hv(TD)� cmp TD). The obtained estimates for lw
D
and lvD are given in Table 2.
Heat and mass transfer
The model of heat and mass transfer in plasterboard has been formulated and explained indetail in Ref. 3. For this reason, only the main points of the model are given in this section.
The major assumptions are the following:
1. The gas, liquid and solid phases are continuous.2. Local thermodynamic equilibrium exists (temperature at a point in all three phases is
equal).3. Once condensed, water stays immobile.4. Initially, pore space of the material is filled with vapour at atmospheric pressure.5. Water vapour is an ideal gas.6. The material does not contract due to dehydration.
During the initial stage of fire, some part of vapour flowing away from the dehydrationzone towards the cold side of plasterboard condenses. Nevertheless, the results of simula-tions3 indicate that the amount of condensate accumulating in pores is very low, whichallows capillary effects to be neglected. The degree of water saturation is defined as
s =volumeof pore space occupied by liquidwater
volumeof pore spaceð9Þ
246 Journal of Fire Sciences 30(3)
at Lib4RI on May 20, 2012jfs.sagepub.comDownloaded from
The relation between the vapour density, rv(x, t), and pressure, pv(x, t), is modelled usingthe ideal gas law: pv = rvRT=Mv, where x is the space coordinate, t is time and R is the univer-sal gas constant. In the absence of other gases, the mass flux of vapour is given by Darcy’sapproximation jv = � rvkg
mvrpv, where mv is the viscosity of vapour. For pv\1MPa, the
vapour viscosity mv(T) is described well by the following correlation
mv=m�v = ½t0:5(1 + 0:978197t + 0:579829t2 � 0:202354t3)��1 ð10Þ
where t = T �=T , T � = 647:226K and m�v = 55:071 � 10�6 Pa � s.24The conservation equations for vapour, condensed water and energy in plasterboard are
written, respectively, as
∂rv(1� s)fm
∂t+r � (jv) = _ID � _IC ð11aÞ
∂rwsfm
∂t= _IC ð11bÞ
∂
∂t(rmhm + rwhwsfm + rvhv(1� s)fm +r � (jvhv) =r � (kmrT)� _QD � _QDC ð11cÞ
where _ID(x, t) is the production rate of vapour due to dehydration; _QD(x, t) is the heat sinkdue to heat absorption by dehydration; _QDC(x, t) is the heat sink due to decarbonation;_IC(x, t) is the condensation rate and hm(T), hw(T) and hv(T) are the enthalpy densities of thematerial, water and vapour. The enthalpies are defined, respectively, as
hm = cmp T ð12aÞ
hw = cwp T ð12bÞ
hv = cvpT + ½(cw
p � cvp)Tsat + lC� ð12cÞ
where Tsat is the saturation temperature of vapour and lC is the latent heat of condensa-tion.25 Vapour–water mixture is modelled here as a single medium with the discontinuousjump in the enthalpy value equal to ½(cw
p � cvp)Tsat + lC� at the saturation temperature. Note
that mathematically this operation is equivalent to introduction of a source function to equa-tion (11c) representing the contribution of condensation.
As the actual gas permeability, kg, differs from the intrinsic permeability, km, due toreduction of permeation area caused by condensation, the effect of condensation on perme-ability is modelled using the common approach based on the notion of relative permeabilitykrel, which is a function of saturation26:
kg(s) = kmkrel(s), 0< krel(s)<1 ð13Þ
We employ the linear correlation of krel(s) proposed by Bear26
krel =1� 1:1 s if s<1=1:1
0 if s.1=1:1
�ð14Þ
Shepel et al. 247
at Lib4RI on May 20, 2012jfs.sagepub.comDownloaded from
The vapour production rate _ID(x, t) is equal to the gypsum dehydration rate with theopposite sign: _ID = � ∂rm
∂t. Differentiation of the first term of equation (3) with respect to time
gives
_ID = DrmH9DTD(T � TD)
∂T
∂tð15Þ
The sink term _QD(x, t) introduced in equation (11c) is defined as the amount of heatabsorbed per 1 kg of the generated vapour, the production rate of which is given by equa-tion (15). On the other hand, the dehydration heat, lw
D, is defined per 1 kg of the intact non-dehydrated material. One kilogram of vapour is produced by dehydrating rBD
m =Drm(kg) ofplasterboard. Hence
_QD =lw
DrBDm
_ID
Drm
= lwDrBD
m H9DT (T � Td)∂T
∂tð16Þ
The plasterboard is split into two adjacent regions: (1) the vapour-only region withs(x, t) = 0 and (2) the saturation region where the liquid and vapour phases coexist, that is,s(x, t).0. The existence of this and other similar configurations in porous media has beenconfirmed experimentally by Udell.27 In the vapour-only region, the vapour pressure is givenby the ideal gas law, whereas in the saturation region the vapour pressure at each point mustbe equal to the local saturation pressure:
pv(x, t) = psatv (T(x, t)) ð17Þ
Consequently, the solution (pv, T , s) at each point is uniquely determined by solving equa-tion (11) in the vapour-only region and equations (11) and (17) in the saturation region.Thus, equations (11) and (17) form the complete system of equations.
The curve psatv (T) can be approximated using the correlation psat
v = aebT 28 (the constants aand b are given in Table 3). However, this expression needs some modification in our caseowing to the assumption made at the outset that the pore space of plasterboard at t = 0 isfilled with vapour instead of air. The necessary modification is implemented as
psatv (T ) =
aebT if T � 1008C
pA if T\1008C
�ð18Þ
To avoid a cumbersome procedure of defining the fire-generated convective and radiativeheat fluxes, equation (11c) is solved using the Dirichlet condition for temperatureT jx = 0 = T(t)fs on the fire side. The curves T(t)fs are determined experimentally for each con-ducted fire test. As the convective flux of vapour is continuous across the plasterboard sur-face and evaporation on the cold side is negligible, the boundary condition on the cold sidereduces to �km
∂T∂x
= �h(T � Tinf ) + es(T4 � T 4inf ), where Tinf is the temperature of the surround-
ings and e is the surface emissivity. Equation (11a) is solved using the Dirichlet condition forpressure on both sides of plasterboard: pjx = 0 = pA and pjx = dm
= pA.
Numerical scheme
Normally, the temperature distribution over the fire-exposed surface of tested plasterboardsis close to uniform. For this reason, the system of equations (11) and (17) is solved here in a
248 Journal of Fire Sciences 30(3)
at Lib4RI on May 20, 2012jfs.sagepub.comDownloaded from
one-dimensional formulation. The plasterboard properties and other data necessary fornumerical simulations are given in Tables 1 to 3.
Equation (11) is discretised using the standard conservative Finite Volume Method withthe second-order central stencil for the thermal diffusion term and first-order upwind stencilfor the convective terms. The first-order implicit backwards Euler scheme is employed fordifferentiation in time. At t = 0, the plasterboard is assumed to be filled with vapour at atmo-spheric pressure and temperature of the surroundings, Tinf . All simulations are carried outusing a regular grid of size 0.24 mm (50 cells) and time step 0.5 s. For each fire scenario, theCPU time on Intel Core 2 Duo 1.8 GHz, 1 GB RAM computer constitutes just severalminutes.
In the context of fire safety, temperature predictions of the model are of primary interest,and therefore, the main attention of this study is focused on heat transfer issues. As it hasbeen already reported by Shepel et al.,3 the plasterboard covering, condensation of vapourin pores and its following revaporisation have negligible effect on the heat transfer throughplasterboard panel, and for this reason, these aspects are not given attention herein.
Results and discussion
Overall, three fire tests are carried out corresponding to the three selected fire scenarios:Hydrocarbon, External and Standard (ISO 834-1). In each test, the output power of oil dri-ven burners is adjusted using an automatic control system that supports the average tem-perature in the furnace according to the internationally accepted standards9,10
Hydrocarbon:T (t) = 1080(1� 0:325e0:167t � 0:675e�2:5t) + 20 ð19aÞ
External : T(t) = 660(1� 0:687e0:32t � 0:313e�3:8t) + 20 ð19bÞ
Standard(ISO834-1) : T (t) = 345 log10(8t + 1) + 20 ð19cÞ
Table 3. Properties of plasterboard and surroundings used for simulations
dm Thickness of plasterboard core 1:2310�2 mrw Water density 1000 kg m�3
½TD1, TD2� Decarbonation temperature range [700,800]�CTDC Temperature of maximum decarbonation rate 750�ClDC Decarbonation heat 2:323105 J kg�1
lC Condensation latent heat of vapour 2:263106 J kg�1
cwp Specific heat of water 4:193103 J kg�1K�1
cvp Specific heat of vapour 2:03103 J kg�1K�1
Mv Molar mass of vapour 18310�3 kg mole�1
�h Heat transfer coefficient on the cold side 10 W m�2K�1
e Emissivity of plasterboard 0.9Tinf Temperature of the surroundings 22.8�CpA Atmospheric pressure 105 Pasjt = 0 Initial water saturation 0a Constant from equation (18) 0.19743 Pab Constant from equation (18) 0:03525 K�1
Shepel et al. 249
at Lib4RI on May 20, 2012jfs.sagepub.comDownloaded from
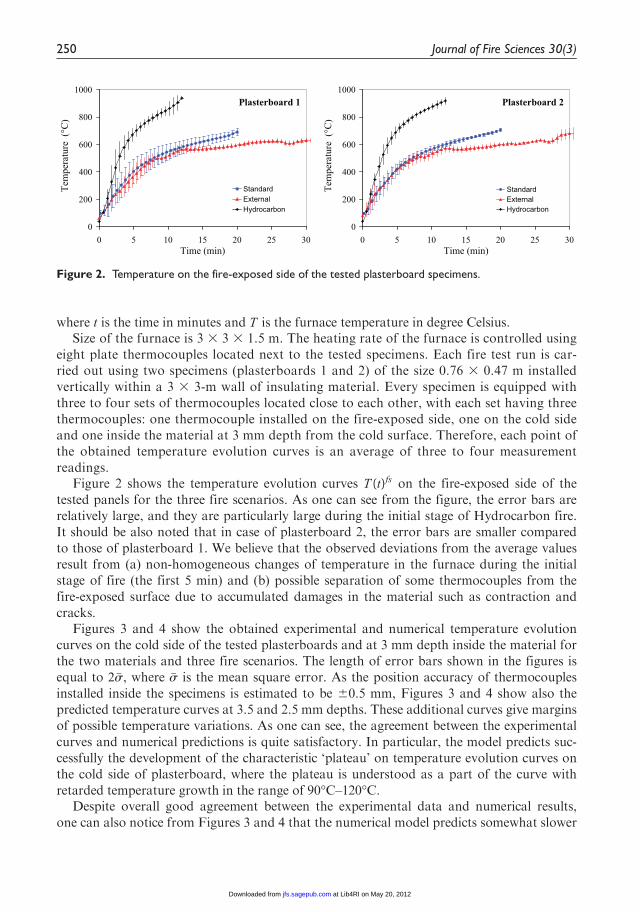
where t is the time in minutes and T is the furnace temperature in degree Celsius.Size of the furnace is 3 3 3 3 1.5 m. The heating rate of the furnace is controlled using
eight plate thermocouples located next to the tested specimens. Each fire test run is car-ried out using two specimens (plasterboards 1 and 2) of the size 0.76 3 0.47 m installedvertically within a 3 3 3-m wall of insulating material. Every specimen is equipped withthree to four sets of thermocouples located close to each other, with each set having threethermocouples: one thermocouple installed on the fire-exposed side, one on the cold sideand one inside the material at 3 mm depth from the cold surface. Therefore, each point ofthe obtained temperature evolution curves is an average of three to four measurementreadings.
Figure 2 shows the temperature evolution curves T(t)fs on the fire-exposed side of thetested panels for the three fire scenarios. As one can see from the figure, the error bars arerelatively large, and they are particularly large during the initial stage of Hydrocarbon fire.It should be also noted that in case of plasterboard 2, the error bars are smaller comparedto those of plasterboard 1. We believe that the observed deviations from the average valuesresult from (a) non-homogeneous changes of temperature in the furnace during the initialstage of fire (the first 5 min) and (b) possible separation of some thermocouples from thefire-exposed surface due to accumulated damages in the material such as contraction andcracks.
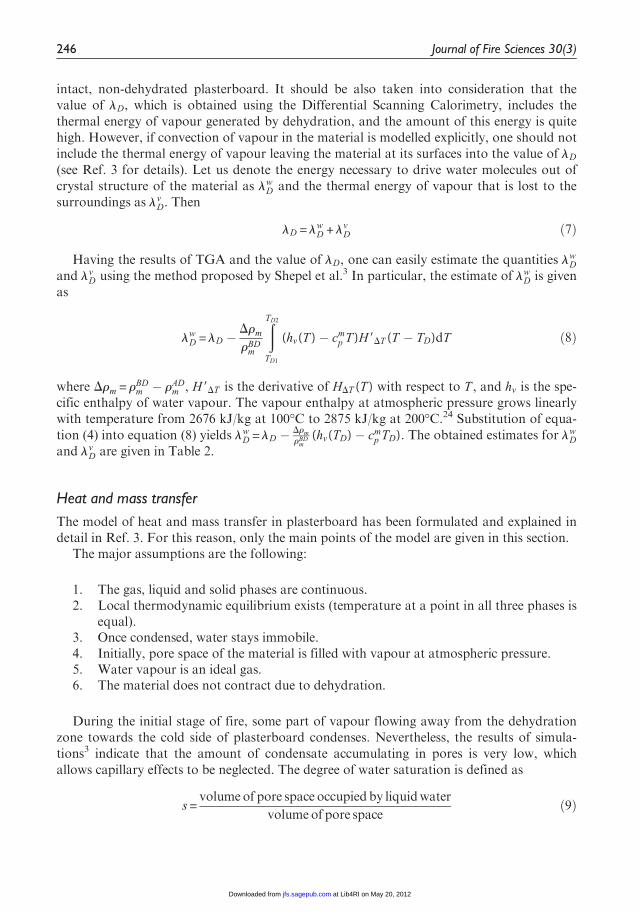
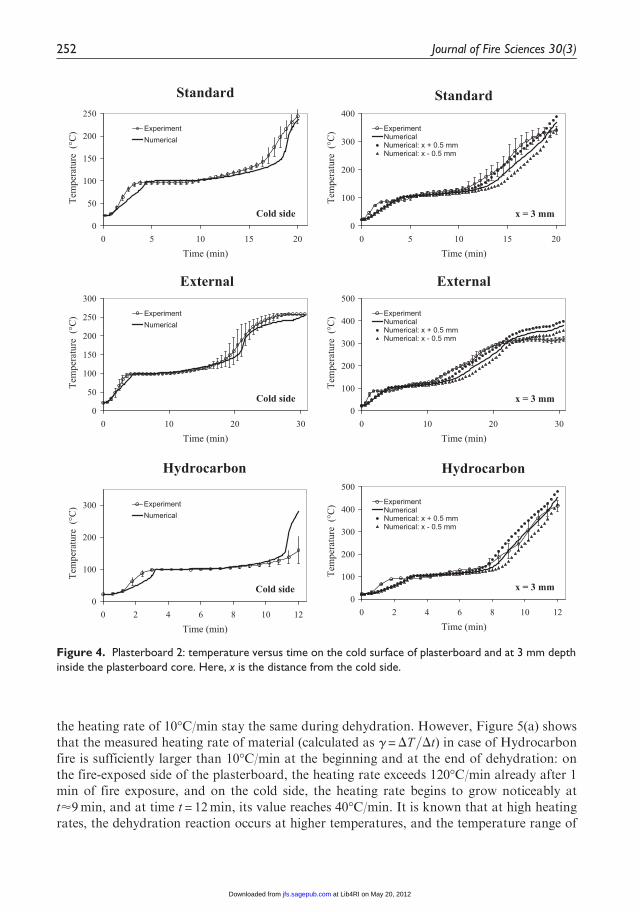
Figures 3 and 4 show the obtained experimental and numerical temperature evolutioncurves on the cold side of the tested plasterboards and at 3 mm depth inside the material forthe two materials and three fire scenarios. The length of error bars shown in the figures isequal to 2�s, where �s is the mean square error. As the position accuracy of thermocouplesinstalled inside the specimens is estimated to be 60.5 mm, Figures 3 and 4 show also thepredicted temperature curves at 3.5 and 2.5 mm depths. These additional curves give marginsof possible temperature variations. As one can see, the agreement between the experimentalcurves and numerical predictions is quite satisfactory. In particular, the model predicts suc-cessfully the development of the characteristic ‘plateau’ on temperature evolution curves onthe cold side of plasterboard, where the plateau is understood as a part of the curve withretarded temperature growth in the range of 90�C–120�C.
Despite overall good agreement between the experimental data and numerical results,one can also notice from Figures 3 and 4 that the numerical model predicts somewhat slower
Plasterboard 1
0
200
400
600
800
1000
0 5 10 15 20 25 30Time (min)
Tem
pera
ture
(°C
)
StandardExternalHydrocarbon
Plasterboard 2
0
200
400
600
800
1000
0 5 10 15 20 25 30Time (min)
Tem
pera
ture
(°C
)
StandardExternalHydrocarbon
Figure 2. Temperature on the fire-exposed side of the tested plasterboard specimens.
250 Journal of Fire Sciences 30(3)
at Lib4RI on May 20, 2012jfs.sagepub.comDownloaded from
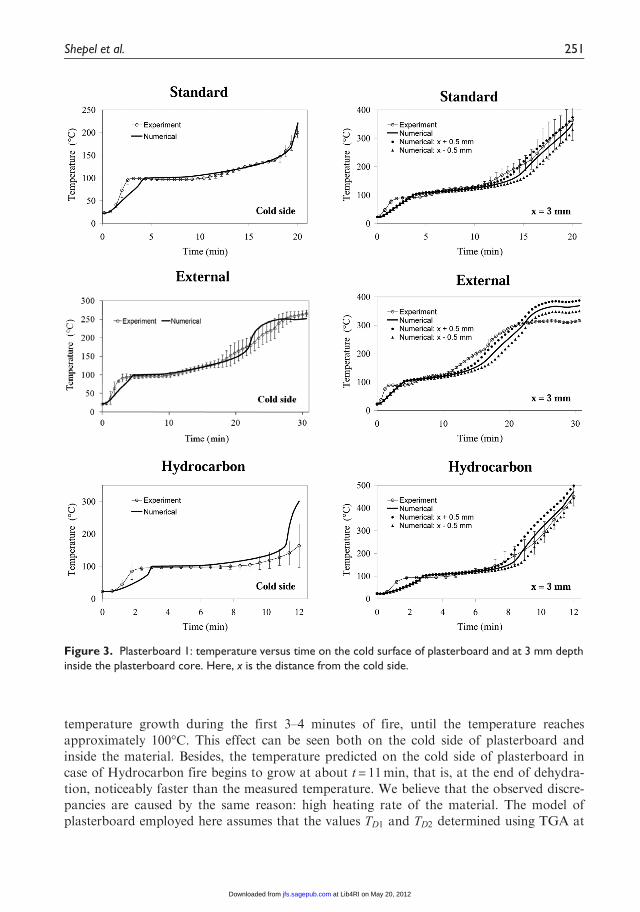
temperature growth during the first 3–4 minutes of fire, until the temperature reachesapproximately 100�C. This effect can be seen both on the cold side of plasterboard andinside the material. Besides, the temperature predicted on the cold side of plasterboard incase of Hydrocarbon fire begins to grow at about t = 11min, that is, at the end of dehydra-tion, noticeably faster than the measured temperature. We believe that the observed discre-pancies are caused by the same reason: high heating rate of the material. The model ofplasterboard employed here assumes that the values TD1 and TD2 determined using TGA at
Figure 3. Plasterboard 1: temperature versus time on the cold surface of plasterboard and at 3 mm depthinside the plasterboard core. Here, x is the distance from the cold side.
Shepel et al. 251
at Lib4RI on May 20, 2012jfs.sagepub.comDownloaded from
the heating rate of 10�C/min stay the same during dehydration. However, Figure 5(a) showsthat the measured heating rate of material (calculated as g = DT=Dt) in case of Hydrocarbonfire is sufficiently larger than 10�C/min at the beginning and at the end of dehydration: onthe fire-exposed side of the plasterboard, the heating rate exceeds 120�C/min already after 1min of fire exposure, and on the cold side, the heating rate begins to grow noticeably att’9min, and at time t = 12min, its value reaches 40�C/min. It is known that at high heatingrates, the dehydration reaction occurs at higher temperatures, and the temperature range of
Cold side0
50
100
150
200
250
0 5 10 15 20
Time (min)
Tem
pera
ture
(°C
) ExperimentNumerical
x = 3 mm0
100
200
300
400
0 5 10 15 20
Time (min)
Tem
pera
ture
(°C
) ExperimentNumericalNumerical: x + 0.5 mmNumerical: x - 0.5 mm
Cold side0
50
100
150
200
250
300
0 10 20 30
Time (min)
Tem
pera
ture
(°C
) ExperimentNumerical
x = 3 mm0
100
200
300
400
500
0 10 20 30
Time (min)
Tem
pera
ture
(°C
) ExperimentNumericalNumerical: x + 0.5 mmNumerical: x - 0.5 mm
Cold side0
100
200
300
0 2 4 6 8 10 12
Time (min)
Tem
pera
ture
(°C
) ExperimentNumerical
x = 3 mm0
100
200
300
400
500
0 2 4 6 8 10 12
Time (min)
Tem
pera
ture
(°C
) ExperimentNumericalNumerical: x + 0.5 mmNumerical: x - 0.5 mm
Hydrocarbon Hydrocarbon
ExternalExternal
StandardStandard
Figure 4. Plasterboard 2: temperature versus time on the cold surface of plasterboard and at 3 mm depthinside the plasterboard core. Here, x is the distance from the cold side.
252 Journal of Fire Sciences 30(3)
at Lib4RI on May 20, 2012jfs.sagepub.comDownloaded from
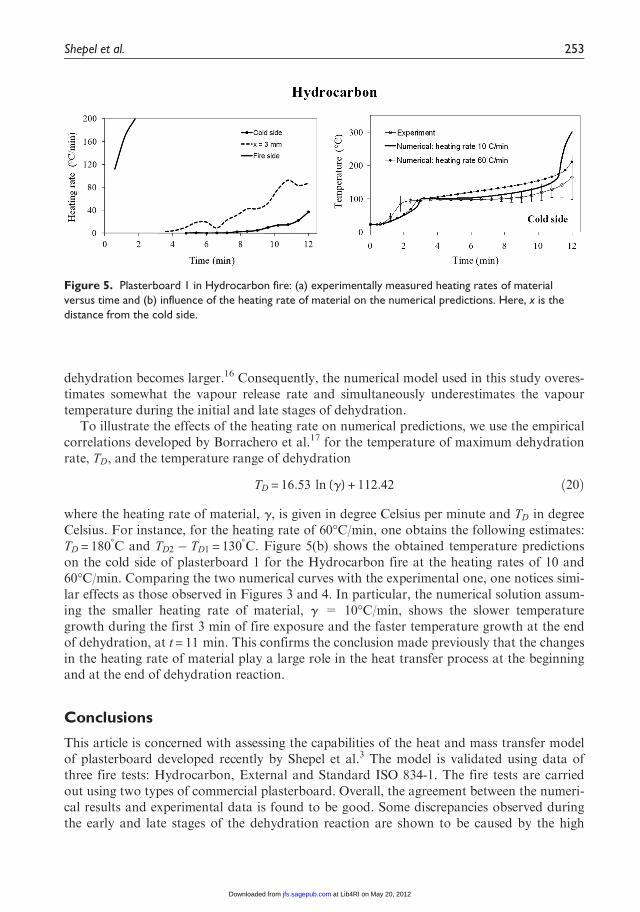
dehydration becomes larger.16 Consequently, the numerical model used in this study overes-timates somewhat the vapour release rate and simultaneously underestimates the vapourtemperature during the initial and late stages of dehydration.
To illustrate the effects of the heating rate on numerical predictions, we use the empiricalcorrelations developed by Borrachero et al.17 for the temperature of maximum dehydrationrate, TD, and the temperature range of dehydration
TD = 16:53 ln (g) + 112:42 ð20Þ
where the heating rate of material, g, is given in degree Celsius per minute and TD in degreeCelsius. For instance, for the heating rate of 60�C/min, one obtains the following estimates:TD = 1808C and TD2 � TD1 = 1308C. Figure 5(b) shows the obtained temperature predictionson the cold side of plasterboard 1 for the Hydrocarbon fire at the heating rates of 10 and60�C/min. Comparing the two numerical curves with the experimental one, one notices simi-lar effects as those observed in Figures 3 and 4. In particular, the numerical solution assum-ing the smaller heating rate of material, g = 10�C/min, shows the slower temperaturegrowth during the first 3 min of fire exposure and the faster temperature growth at the endof dehydration, at t = 11 min. This confirms the conclusion made previously that the changesin the heating rate of material play a large role in the heat transfer process at the beginningand at the end of dehydration reaction.
Conclusions
This article is concerned with assessing the capabilities of the heat and mass transfer modelof plasterboard developed recently by Shepel et al.3 The model is validated using data ofthree fire tests: Hydrocarbon, External and Standard ISO 834-1. The fire tests are carriedout using two types of commercial plasterboard. Overall, the agreement between the numeri-cal results and experimental data is found to be good. Some discrepancies observed duringthe early and late stages of the dehydration reaction are shown to be caused by the high
Figure 5. Plasterboard 1 in Hydrocarbon fire: (a) experimentally measured heating rates of materialversus time and (b) influence of the heating rate of material on the numerical predictions. Here, x is thedistance from the cold side.
Shepel et al. 253
at Lib4RI on May 20, 2012jfs.sagepub.comDownloaded from
local heating rate of the material during those stages. The heating rate of material affects thecourse of dehydration reaction, and it should be accounted for when developing new mathe-matical models of plasterboard.
References
1. Mehaffey JR, Cuerrier P and Carisse GA. A model forpredicting heat transfer through gypsum-board/wood-studexposed to fire. Fire Mater 1994; 18: 297–305.
2. Freyer D and Voigt W. Crystallization and phase stabilityof CaSO4 and CaSO4 -based salts. Monatsh Chem 2003;134: 693–719.
3. Shepel SV, Ghazi Wakili K and Hugi E. Vapourconvection in gypsum plasterboard exposed to fire:Numerical simulation and validation. Numer Heat Tran A2010; 57: 911–935.
4. Craft ST, Isgor B, and Hadjisophocleous G, et al.Predicting the thermal response of gypsum boardsubjected to a constant heat flux. Fire Mater 2008; 32:333–355.
5. ISO 834-1:1999. Fire resistance tests—elements of buildingconstruction—part 1: general requirements.
6. Kontogeorgos D and Founti M. Numerical investigationof simultaneous heat and mass transfer mechanismsoccurring in a gypsum board exposed to fire conditions.Appl Thermal Eng 2010; 30: 1461–1469.
7. Manzello SL, Gann RG, and Kukuck SR, et al.Performance of a non-load-bearing steal stud gypsumboard wall assembly: Experiments and modelling. FireMater 2007; 31: 297–310.
8. Ang CN and Wang YC. Effect of moisture transfer onspecific heat of gypsum plasterboard at high temperatures.Constr Build Mater 2009; 23: 675–686.
9. ISO 834-1:1999. Fire resistance tests—elements of buildingconstruction—part 1: general requirements, Geneva:Switzerland.
10. EN 1363-2:1999. Fire resistance tests—part 2: alternativeand additional procedures, Brussels: Belgium; .
11. Knauf Gips KG, Mainbernheimer Strasse: 97346 Iphofen,Germany.
12. EN 520:2004. Gypsum plasterboards. Definitions,requirements and test methods, Brussels: Belgium.
13. Ghazi Wakili K and Hugi E. Four types of gypsum plasterboards and their thermo-physical properties under firecondition. J Fire Sci 2009; 27: 27–43.
14. Incropera FP and DeWitt DP. Fundamentals of heat andmass transfer. New York: John Wiley & Sons, 1996.
15. Ahmed GN and Hurst JP. Coupled heat and masstransport phenomena in siliceous aggregate concrete slabssubjected to fire. Fire Mater 1997; 21: 161–168.
16. Ghazi Wakili K, Hugi E, Wullschleger L, et al. Gypsumboard in fire-modelling and experimental validation. J FireSci 2007; 25: 267–281.
17. Borrachero MV, Paya J, and Bonilla M, et al. The use ofthermogravimetric analysis technique for thecharacterization of construction materials, the gypsumcase. J Therm Anal Calorim 2008; 91: 503–509.
18. Robertson K and Bish D. The dehydration kinetics ofgypsum: The effect of relative humidity on its stability andimplications in the Martian environment. Lunar Planet Sci,2007; XXXVIII [CD-ROM]: abstract 1432.
19. Sethian JA. Level set methods and fast marching methods:evolving interfaces in computational geometry, fluidmechanics, computer vision, and materials science.Cambridge: Cambridge University Press, 1999.
20. Benichou N and Sultan MA. Thermal properties oflightweight-framed construction components at elevatedtemperatures. Fire Mater 2005; 29: 165–179.
21. Tsibin IP and Vorob’ev IP. Determining the apparentdensity and open porosity of magnesite clinker from itsbulk density. Refract Ind Ceram 1970; 11: 596–598.
22. Sperl J and Trckova J. Permeability and porosity of rocksand their relationship based on laboratory testing. ActaGeodyn Geomater 2008; 5(1): 41–47.
23. Bernabe Y, Mok U and Evans B. Permeability-porosityrelationships in rocks subjected to various evolutionprocesses. Pure Appl Geophys 2003; 160: 937–960.
24. Wagner W and Kruse A. Properties of water and steam, theindustrial standard IAPWS-IF97 for the thermodynamicproperties and supplementary equations for other properties,tables based on these equations. Berlin Heidelberg,Germany: Springer-Verlag, 1998.
25. Wang C-Y and Beckermann C. A two-phase mixturemodel of liquid-gas flow and heat transfer in capillaryporous media-I. Formulation. Int J Heat Mass Tran 1993;36: 2747–2758.
26. Bear J. Dynamics of fluids in porous media. Mineola, NY:Dover Publications, 1988.
27. Udell KS. Heat transfer in porous media heated fromabove with evaporation, condensation, and capillaryeffects. J Heat Tran 1983; 105: 485–492.
28. Bridge L, Bradean R, Ward MJ, et al. The analysis of atwo-phase zone with condensation in a porous medium. JEng Math 2003; 45: 247–268.
Sergey V. Shepel worked as a mechanical engineer at the Swiss Federal Laboratories for MaterialsScience and Technology, Empa, from 2007 to 2010, where he conducted research in the area of heatand mass transfer in construction materials. He received his PhD in mechanical engineering from theUniversity of Notre Dame, USA, in 2002. Currently, he works as a CFD engineer at the Research andDevelopment Division at Wartsila Switzerland Ltd.
Karim Ghazi Wakili is a senior scientist at the Swiss Federal Laboratories for Materials Science andTechnology, Empa. He received his MS and PhD in experimental physics from the Swiss FederalInstitute of Technology (ETH) in 1984 and 1988, respectively. Having joined Empa in 1989, he con-ducts numerical and experimental investigations of heat and mass transfer in materials and structures
254 Journal of Fire Sciences 30(3)
at Lib4RI on May 20, 2012jfs.sagepub.comDownloaded from
at room and fire temperatures. He serves as the head of the hygrothermal lab and leads the FireTechnology group together with Erich Hugi at the Laboratory of Building Science and Technology.
Erich Hugi is a scientific group leader at the Swiss Federal Laboratories for Materials Science andTechnology, Empa. He received his MS and PhD in mechanical engineering from the Swiss FederalInstitute of Technology (ETH) in 1993 and 1997, respectively. Having joined Empa in 2002, he servesas the head of the business area Fire Resistance Testing and conducts research in the areas of heat andmass transfer in construction materials and thermomechanical behaviour of building components atdifferent scales. He is also a co-leader of the Fire Technology group at the Laboratory of BuildingScience and Technology.
Shepel et al. 255
at Lib4RI on May 20, 2012jfs.sagepub.comDownloaded from
Related Documents