See last page for document information Noise Tutorial Part VI ~ Noise Measurements with a Spectrum Analyzer Whitham D. Reeve Anchorage, Alaska USA

Welcome message from author
This document is posted to help you gain knowledge. Please leave a comment to let me know what you think about it! Share it to your friends and learn new things together.
Transcript
See last page for document information
Noise TutorialPart VI ~ Noise Measurements
with a Spectrum Analyzer
Whitham D. ReeveAnchorage, Alaska USA
Noise Tutorial VI ~ Noise Measurements with a Spectrum Analyzer
See last page for document information
Abstract: With the exception of some solar radio bursts, the extraterrestrial emissions received on Earth’s surface are veryweak. Noise places a limit on the minimum detection capabilities of a radio telescope and may mask or corrupt these weakemissions. An understanding of noise and its measurement will help observers minimize its effects. This paper is a tutorialand includes six parts.
Table of Contents Page
Part I ~ Noise Concepts
1-1 Introduction
1-2 Basic noise sources
1-3 Noise amplitude
1-4 References
Part II ~ Additional Noise Concepts
2-1 Noise spectrum
2-2 Noise bandwidth
2-3 Noise temperature
2-4 Noise power
2-5 Combinations of noisy resistors
2-6 References
Part III ~ Attenuator and Amplifier Noise
3-1 Attenuation effects on noise temperature
3-2 Amplifier noise
3-3 Cascaded amplifiers
3-4 References
Part IV ~ Noise Factor
4-1 Noise factor and noise figure
4-2 Noise factor of cascaded devices
4-3 References
Part V ~ Noise Measurements Concepts
5-1 General considerations for noise factor measurements
5-2 Noise factor measurements with the Y-factor method
5-3 References
Part VI ~ Noise Measurements with a Spectrum Analyzer
6-1 Noise factor measurements with a spectrum analyzer 6-1
6-2 References 6-10
Noise Tutorial VI ~ Noise Measurements with a Spectrum Analyzer
See last page for document revision information ~ File: Reeve_Noise_6_NFMeasSpecAnalyz.doc, Page 6-1
Part VI ~ Noise Measurements with a Spectrum Analyzer
6-1. Noise measurements with a spectrum analyzer
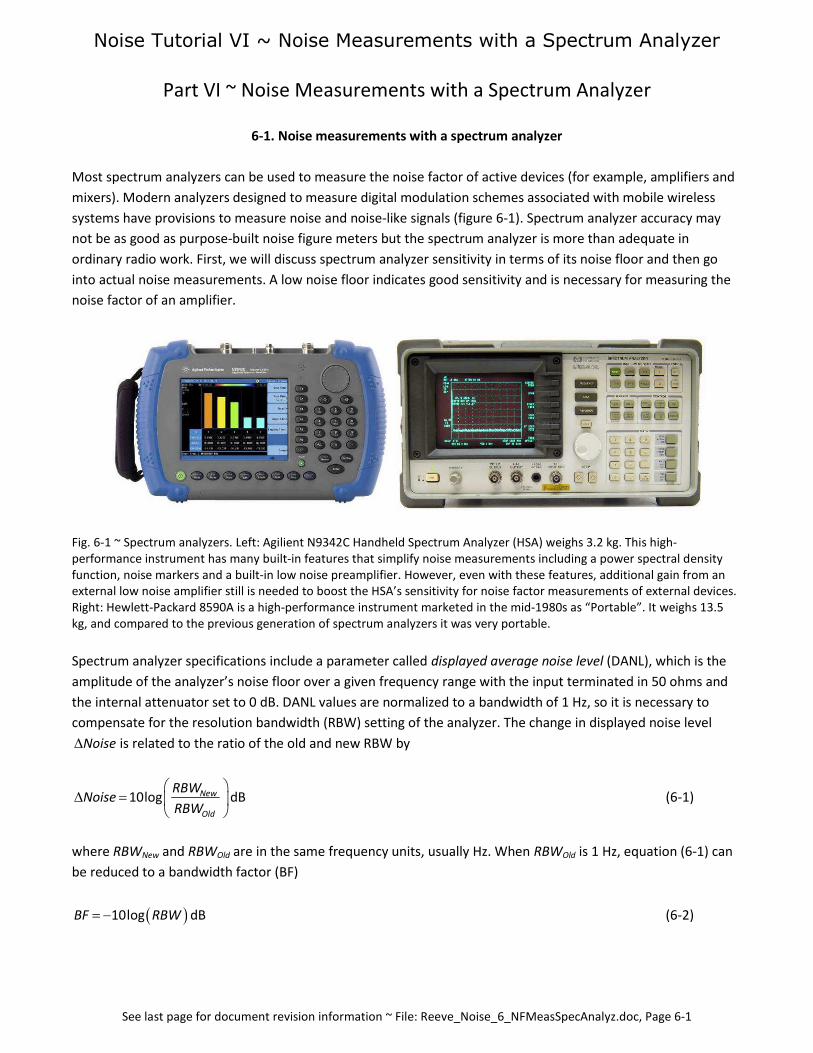
Most spectrum analyzers can be used to measure the noise factor of active devices (for example, amplifiers and
mixers). Modern analyzers designed to measure digital modulation schemes associated with mobile wireless
systems have provisions to measure noise and noise-like signals (figure 6-1). Spectrum analyzer accuracy may
not be as good as purpose-built noise figure meters but the spectrum analyzer is more than adequate in
ordinary radio work. First, we will discuss spectrum analyzer sensitivity in terms of its noise floor and then go
into actual noise measurements. A low noise floor indicates good sensitivity and is necessary for measuring the
noise factor of an amplifier.
Fig. 6-1 ~ Spectrum analyzers. Left: Agilient N9342C Handheld Spectrum Analyzer (HSA) weighs 3.2 kg. This high-performance instrument has many built-in features that simplify noise measurements including a power spectral densityfunction, noise markers and a built-in low noise preamplifier. However, even with these features, additional gain from anexternal low noise amplifier still is needed to boost the HSA’s sensitivity for noise factor measurements of external devices.Right: Hewlett-Packard 8590A is a high-performance instrument marketed in the mid-1980s as “Portable”. It weighs 13.5kg, and compared to the previous generation of spectrum analyzers it was very portable.
Spectrum analyzer specifications include a parameter called displayed average noise level (DANL), which is the
amplitude of the analyzer’s noise floor over a given frequency range with the input terminated in 50 ohms and
the internal attenuator set to 0 dB. DANL values are normalized to a bandwidth of 1 Hz, so it is necessary to
compensate for the resolution bandwidth (RBW) setting of the analyzer. The change in displayed noise level
Noise is related to the ratio of the old and new RBW by
10log New
Old
RBWNoise
RBW
dB (6-1)
where RBWNew and RBWOld are in the same frequency units, usually Hz. When RBWOld is 1 Hz, equation (6-1) can
be reduced to a bandwidth factor (BF)
10logBF RBW dB (6-2)
Noise Tutorial VI ~ Noise Measurements with a Spectrum Analyzer
See last page for document revision information ~ File: Reeve_Noise_6_NFMeasSpecAnalyz.doc, Page 6-2
For example, if a noise measurement is made in dBm at a resolution bandwidth of 10 kHz, the displayed noise
power would need to be lowered by 40 dB [ 410log 10log 10 40BF RBW dB] for the equivalent noise
in a bandwidth of 1 Hz.
DANL measurements often are at the narrowest RBW setting, but analyzer datasheets usually specify the DANL
measurement conditions. The easiest way to measure a spectrum analyzer’s noise floor is to place a noise
marker at the desired frequency. Modern analyzers internally compensate and display the noise marker value in
dBm/Hz for any RBW setting and also take into account the difference in RBW filter bandwidth compared to an
ideal noise filter.
A noise marker uses an rms (root mean square) detector with averaging performed on a logarithmic scale, called
log power averaging. The log power averaging lowers the displayed noise by 2.51 dB (if root-mean-square, rms,
averaging is used, the 2.51 dB factor is not used the calculation). Some analyzers automatically select the right
settings for a noise marker. However, depending on the measurement, it may be necessary to manually set
some parameters. For example, the input attenuator in most spectrum analyzers has to be manually set to 0 dB
when making DANL measurements. Trace averaging also needs to be set and for noise measurements usually is
at least 40 to 50 sweeps. Trace averaging is used to reduce jitter in the displayed marker value. The sweep times
in older (analog) spectrum analyzers are much longer than modern analyzers so noise measurements with trace
averaging require patience.
For an input noise temperature T0, the DANL in terms of spectrum analyzer noise factor NFSA is given by
DANL dBm/Hz = –174 dBm/Hz + NFSA – 2.51 dB (6-3)
If we are interested in measuring the spectrum analyzer noise factor, solve for NFSA, or
NFSA = DANL dBm/Hz +174 dBm/Hz + 2.51 dB (6-4)
As an example, we will measure the noise factor of two spectrum analyzers, an older (1986) model and a much
newer (2013) HSA. The newer model is equipped with an internal preamplifier that significantly lowers the
analyzer noise factor, so comparative measurements will be made with the preamplifier on and off.
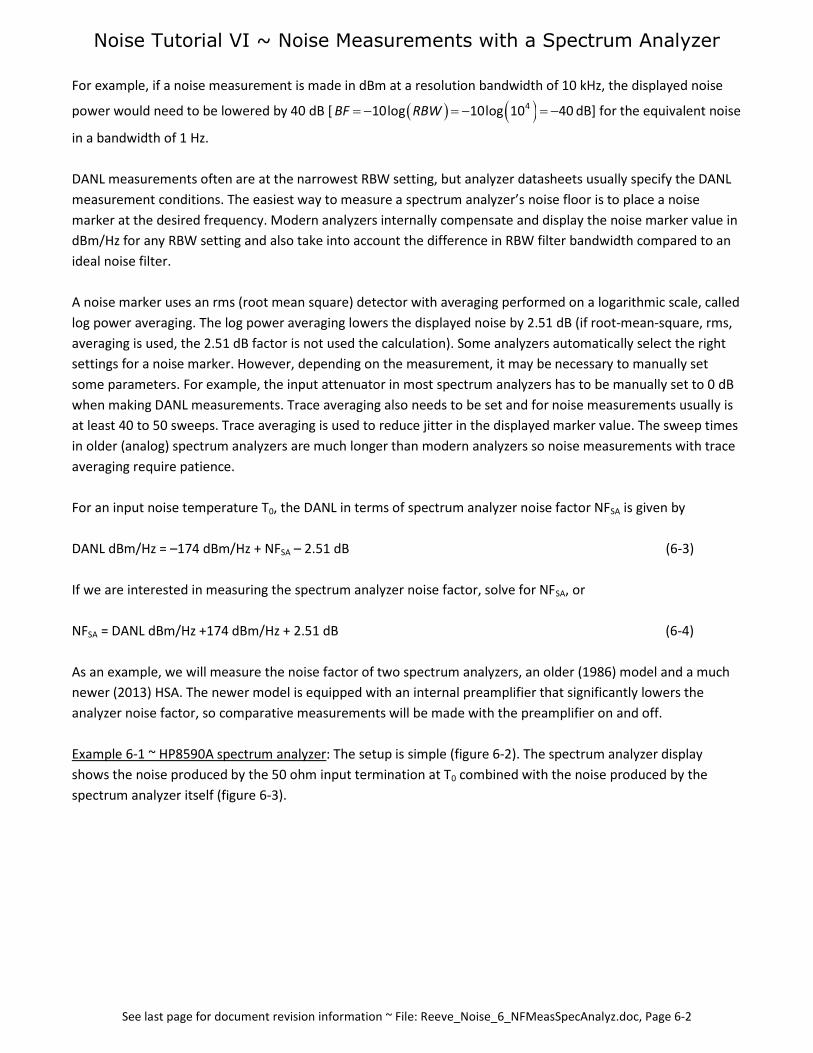
Example 6-1 ~ HP8590A spectrum analyzer: The setup is simple (figure 6-2). The spectrum analyzer display
shows the noise produced by the 50 ohm input termination at T0 combined with the noise produced by the
spectrum analyzer itself (figure 6-3).
Noise Tutorial VI ~ Noise Measurements with a Spectrum Analyzer
See last page for document revision information ~ File: Reeve_Noise_6_NFMeasSpecAnalyz.doc, Page 6-3
Fig. 6-2 ~ Hewlett-Packard 8590A spectrum analyzer terminated in 50 ohms (just right of center) to measure the spectrumanalyzer’s noise floor and noise factor.
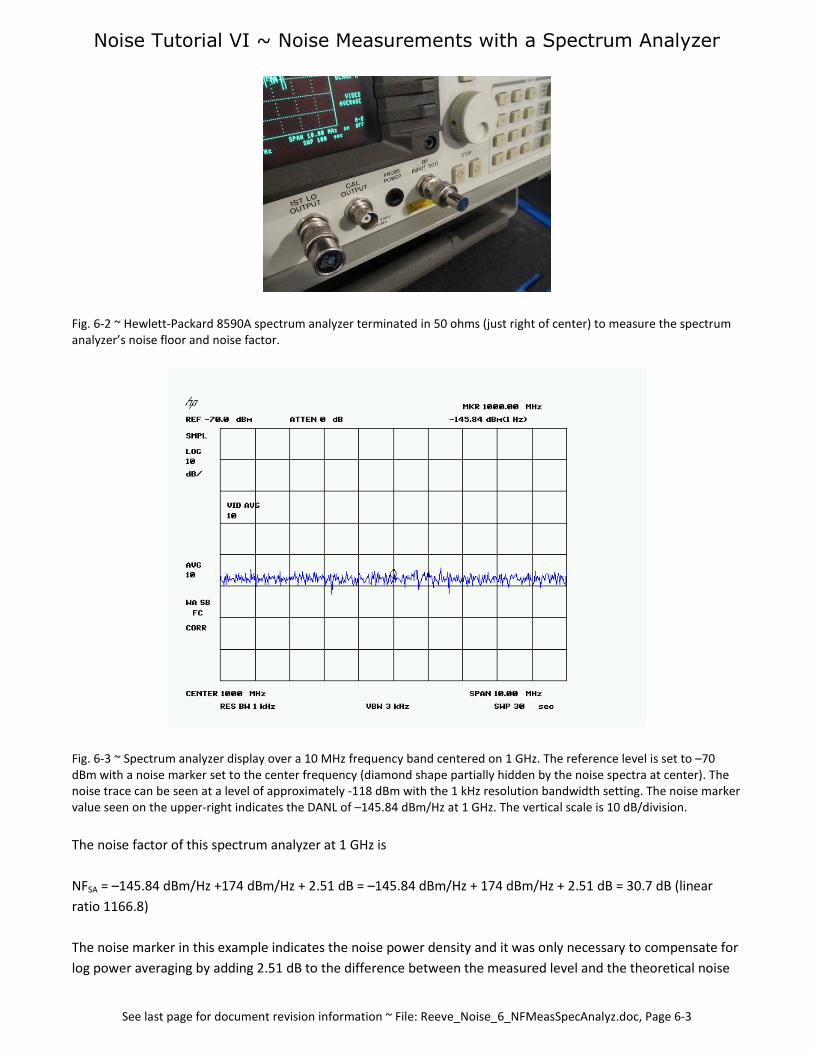
Fig. 6-3 ~ Spectrum analyzer display over a 10 MHz frequency band centered on 1 GHz. The reference level is set to –70dBm with a noise marker set to the center frequency (diamond shape partially hidden by the noise spectra at center). Thenoise trace can be seen at a level of approximately -118 dBm with the 1 kHz resolution bandwidth setting. The noise markervalue seen on the upper-right indicates the DANL of –145.84 dBm/Hz at 1 GHz. The vertical scale is 10 dB/division.
The noise factor of this spectrum analyzer at 1 GHz is
NFSA = –145.84 dBm/Hz +174 dBm/Hz + 2.51 dB = –145.84 dBm/Hz + 174 dBm/Hz + 2.51 dB = 30.7 dB (linear
ratio 1166.8)
The noise marker in this example indicates the noise power density and it was only necessary to compensate for
log power averaging by adding 2.51 dB to the difference between the measured level and the theoretical noise
Noise Tutorial VI ~ Noise Measurements with a Spectrum Analyzer
See last page for document revision information ~ File: Reeve_Noise_6_NFMeasSpecAnalyz.doc, Page 6-4
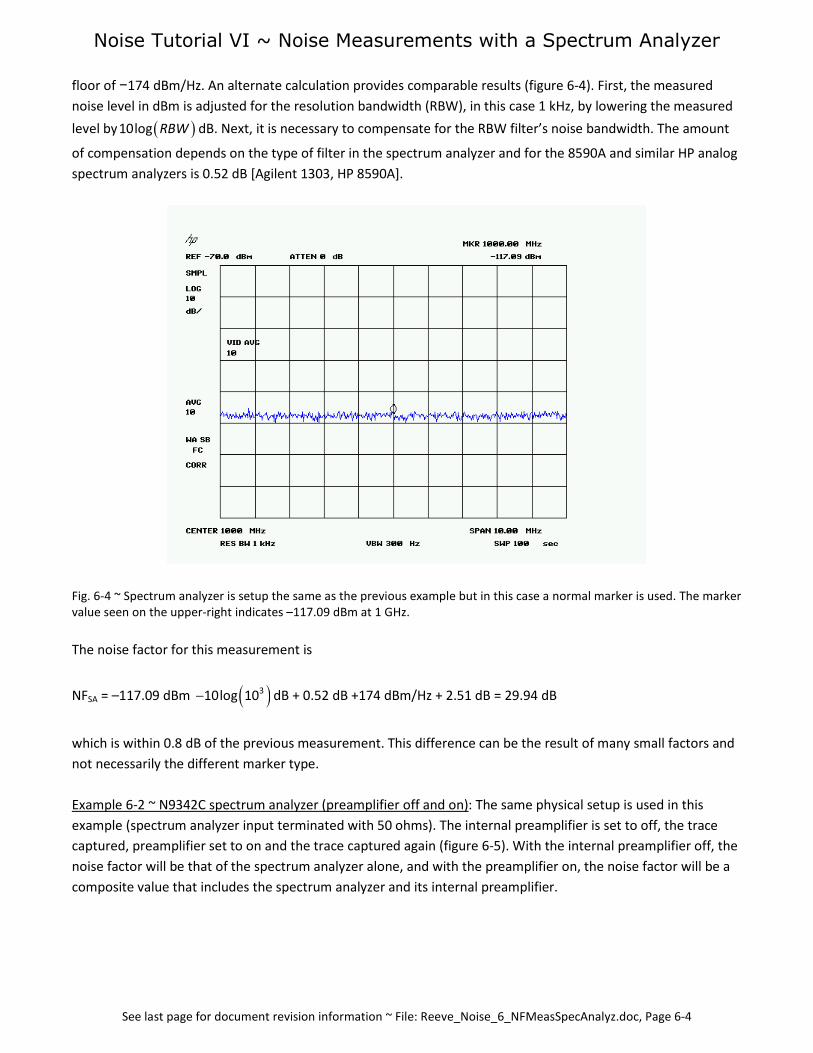
floor of −174 dBm/Hz. An alternate calculation provides comparable results (figure 6-4). First, the measured
noise level in dBm is adjusted for the resolution bandwidth (RBW), in this case 1 kHz, by lowering the measured
level by 10log RBW dB. Next, it is necessary to compensate for the RBW filter’s noise bandwidth. The amount
of compensation depends on the type of filter in the spectrum analyzer and for the 8590A and similar HP analog
spectrum analyzers is 0.52 dB [Agilent 1303, HP 8590A].
Fig. 6-4 ~ Spectrum analyzer is setup the same as the previous example but in this case a normal marker is used. The markervalue seen on the upper-right indicates –117.09 dBm at 1 GHz.
The noise factor for this measurement is
NFSA = –117.09 dBm 310log 10 dB + 0.52 dB +174 dBm/Hz + 2.51 dB = 29.94 dB
which is within 0.8 dB of the previous measurement. This difference can be the result of many small factors and
not necessarily the different marker type.
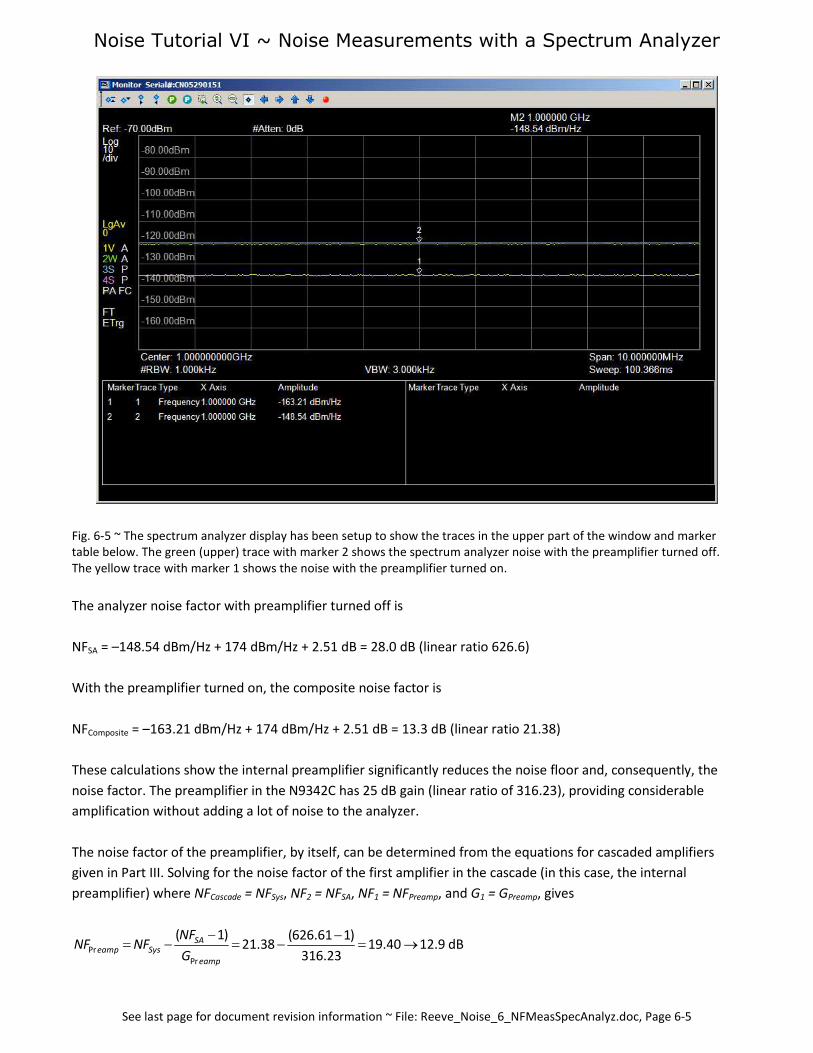
Example 6-2 ~ N9342C spectrum analyzer (preamplifier off and on): The same physical setup is used in this
example (spectrum analyzer input terminated with 50 ohms). The internal preamplifier is set to off, the trace
captured, preamplifier set to on and the trace captured again (figure 6-5). With the internal preamplifier off, the
noise factor will be that of the spectrum analyzer alone, and with the preamplifier on, the noise factor will be a
composite value that includes the spectrum analyzer and its internal preamplifier.
Noise Tutorial VI ~ Noise Measurements with a Spectrum Analyzer
See last page for document revision information ~ File: Reeve_Noise_6_NFMeasSpecAnalyz.doc, Page 6-5
Fig. 6-5 ~ The spectrum analyzer display has been setup to show the traces in the upper part of the window and markertable below. The green (upper) trace with marker 2 shows the spectrum analyzer noise with the preamplifier turned off.The yellow trace with marker 1 shows the noise with the preamplifier turned on.
The analyzer noise factor with preamplifier turned off is
NFSA = –148.54 dBm/Hz + 174 dBm/Hz + 2.51 dB = 28.0 dB (linear ratio 626.6)
With the preamplifier turned on, the composite noise factor is
NFComposite = –163.21 dBm/Hz + 174 dBm/Hz + 2.51 dB = 13.3 dB (linear ratio 21.38)
These calculations show the internal preamplifier significantly reduces the noise floor and, consequently, the
noise factor. The preamplifier in the N9342C has 25 dB gain (linear ratio of 316.23), providing considerable
amplification without adding a lot of noise to the analyzer.
The noise factor of the preamplifier, by itself, can be determined from the equations for cascaded amplifiers
given in Part III. Solving for the noise factor of the first amplifier in the cascade (in this case, the internal
preamplifier) where NFCascade = NFSys, NF2 = NFSA, NF1 = NFPreamp, and G1 = GPreamp, gives
PrPr
( 1) (626.61 1)21.38 19.40 12.9
316.23SA
eamp Syseamp
NFNF NF
G
dB
Noise Tutorial VI ~ Noise Measurements with a Spectrum Analyzer
See last page for document revision information ~ File: Reeve_Noise_6_NFMeasSpecAnalyz.doc, Page 6-6
In the above measurements, the analyzer’s internal attenuator was set to zero. This was necessary to increase
the sensitivity. An analyzer is designed for unity gain so that it correctly displays the input signal levels. Adding
attenuation or gain changes the transfer function from the input to the display. If the input attenuator is set to
anything but zero, the analyzer must increase its internal gain (usually in its intermediate frequency, IF, stages)
to maintain a correctly displayed level. However, this raises the noise floor an equivalent amount. The concept is
similar for the internal preamplifier except that the spectrum analyzer reduces its internal gain, thus lowering
the noise floor. The noise floor is
, Pr ,dBm dBm A dB eamp dBNoiseFloor DANL L G dB (6-5)
where
LA,dB Attenuator setting in dB
GPreamp,dB Preamplifier gain in dB
It was previously shown that the hot power of a 5 dB ENR noise source is approximately –168 dBm/Hz. The
DANL of the N9342C spectrum analyzer with the preamplifier turned on and attenuator set to zero is about –163
dBm/Hz. This is 5 dB above the noise source hot power, and there is little chance the noise source output will be
visible on the display. Setting the analyzer attenuator to 10 dB attenuation, increases the difference to 15 dB. It
should be noted that an attenuator is necessary to prevent overloading the spectrum analyzer mixer, but it
usually can be set to zero for very low power measurements.
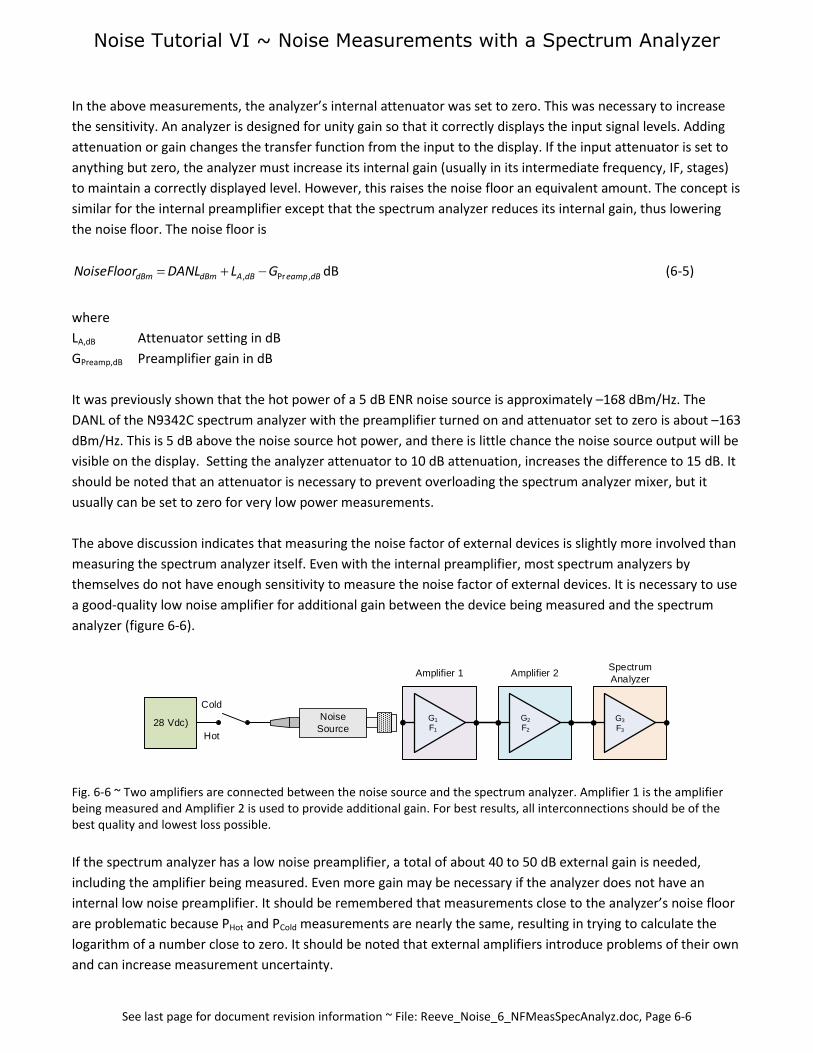
The above discussion indicates that measuring the noise factor of external devices is slightly more involved than
measuring the spectrum analyzer itself. Even with the internal preamplifier, most spectrum analyzers by
themselves do not have enough sensitivity to measure the noise factor of external devices. It is necessary to use
a good-quality low noise amplifier for additional gain between the device being measured and the spectrum
analyzer (figure 6-6).
G3
F3
G1
F1
G2
F2
NoiseSource
Cold
Hot
Amplifier 1 Amplifier 2SpectrumAnalyzer
28 Vdc)
Fig. 6-6 ~ Two amplifiers are connected between the noise source and the spectrum analyzer. Amplifier 1 is the amplifierbeing measured and Amplifier 2 is used to provide additional gain. For best results, all interconnections should be of thebest quality and lowest loss possible.
If the spectrum analyzer has a low noise preamplifier, a total of about 40 to 50 dB external gain is needed,
including the amplifier being measured. Even more gain may be necessary if the analyzer does not have an
internal low noise preamplifier. It should be remembered that measurements close to the analyzer’s noise floor
are problematic because PHot and PCold measurements are nearly the same, resulting in trying to calculate the
logarithm of a number close to zero. It should be noted that external amplifiers introduce problems of their own
and can increase measurement uncertainty.

Noise Tutorial VI ~ Noise Measurements with a Spectrum Analyzer
See last page for document revision information ~ File: Reeve_Noise_6_NFMeasSpecAnalyz.doc, Page 6-7
Examples follow that use the Y-Factor method to measure the noise factor of two amplifiers at 1 GHz, a Mini-
Circuits ZKL-2 and a Chinese amplifier marketed as a low noise amplifier and designated here as CxLNA.
Attempts to measure the noise factor of one of these devices without the gain of the other failed, that is,
measurement of either amplifier is not possible without the additional gain provided by the other. The ZKL-2 has
a nominal gain of 30 dB and 3.45 dB noise factor and the CxLNA has a nominal gain of 17 dB and 1 dB noise
factor.
Example 6-3 ~ CxLNA as Amplifier 1 and ZKL-2 as Amplifier 2. The noise source ENRdB = 5.32 dB at 1 GHz
(RFD2305). The spectrum analyzer’s internal preamplifier is turned on to increase the analyzer’s sensitivity.
However, to maintain proper internal levels the analyzer’s internal attenuator is set to auto. The Y-factor
method is used in which a noise measurement is made with the noise source off (PCold) and another
measurement with the noise source on (PHot). The measured noise factor is a composite value that includes the
spectrum analyzer, its internal preamplifier and the two external amplifiers (figure 6-7).
Fig. 6-7 ~ Spectrum analyzer with traces and marker table for CxLNA as Amplifier 1 and ZKL-2 as Amplifier 2. For thesemeasurements the analyzer was placed in the power spectral density measurement mode, which sets up the properdetector and averaging protocols. The yellow (lower) trace with marker 1 shows the noise level with the noise source off(cold). The green trace with marker 2 shows the noise with the noise source on (hot). The attenuator was set to Autoresulting in 10 dB of attenuation (setting shown just above the grid to the left of center).
The following data are from the marker table:
PCold,dB = –134.39 dBm/Hz
PHot,dB = –128.68 dBm/Hz

Noise Tutorial VI ~ Noise Measurements with a Spectrum Analyzer
See last page for document revision information ~ File: Reeve_Noise_6_NFMeasSpecAnalyz.doc, Page 6-8
and YdB = PHot,dB – PCold,dB = –128.68 dBm/Hz – (–134.39 dBm/Hz) = 5.71 dB
From Eq. (4-9)
5.71
10 10, 10 log 10 1 5.32 10 log 10 1 0.97
dBY
Composite dB dBNF ENR
dB (1.25 linear ratio)
The composite noise factor includes the combined effects of the spectrum analyzer and the two external
amplifiers. To find the noise factor of Amplifier 1 alone it is necessary to use the calculations for cascaded
amplifiers as before. In this case we assume Amplifier 2 noise factor is 3.45 dB (2.213 linear ratio). It is necessary
to know the gain of the Amplifier 1. A measurement using the spectrum analyzer’s tracking generator gives
17.17 dB (52.12 linear ratio) at 1 GHz. Therefore,
21
1
( 1) (2.213 1)1.25 1.23 0.89
52.12
AmplifierAmplifier Composite
Amplifier
NFNF NF
G
dB
The contribution of the spectrum analyzer is ignored in the calculation. Examination of the composite noise
factor for a cascade of three devices shows that the noise factor of the third device (in this case the spectrum
analyzer) is reduced by the factor 1/G1G2, where G1 and G2 are the power gains of the two external amplifiers.
For this example the reduction factor is about 1/60500, which reduces the spectrum analyzer’s contribution to a
negligible value.
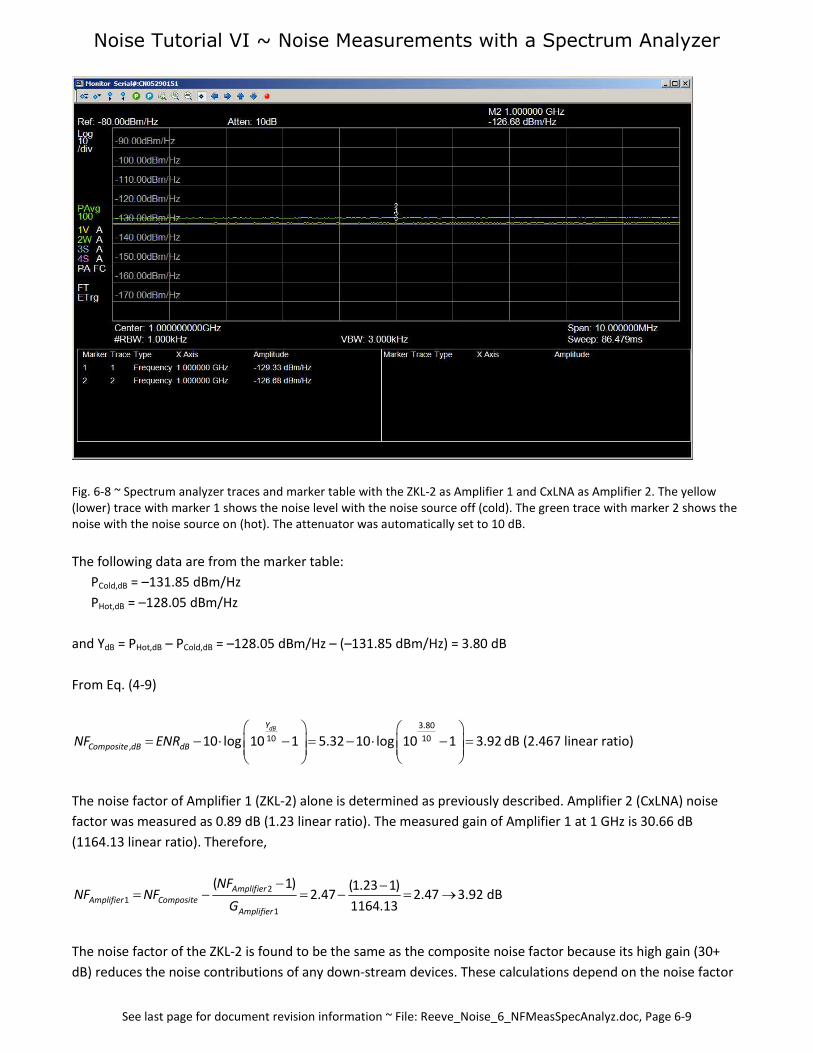
Example 6-4 ~ ZKL-2 as Amplifier 1 and CxLNA as Amplifier 2. As before, noise measurement is made with the
noise source off and another with the noise source on (figure 6-8).
Noise Tutorial VI ~ Noise Measurements with a Spectrum Analyzer
See last page for document revision information ~ File: Reeve_Noise_6_NFMeasSpecAnalyz.doc, Page 6-9
Fig. 6-8 ~ Spectrum analyzer traces and marker table with the ZKL-2 as Amplifier 1 and CxLNA as Amplifier 2. The yellow(lower) trace with marker 1 shows the noise level with the noise source off (cold). The green trace with marker 2 shows thenoise with the noise source on (hot). The attenuator was automatically set to 10 dB.
The following data are from the marker table:
PCold,dB = –131.85 dBm/Hz
PHot,dB = –128.05 dBm/Hz
and YdB = PHot,dB – PCold,dB = –128.05 dBm/Hz – (–131.85 dBm/Hz) = 3.80 dB
From Eq. (4-9)
3.80
10 10, 10 log 10 1 5.32 10 log 10 1 3.92
dBY
Composite dB dBNF ENR
dB (2.467 linear ratio)
The noise factor of Amplifier 1 (ZKL-2) alone is determined as previously described. Amplifier 2 (CxLNA) noise
factor was measured as 0.89 dB (1.23 linear ratio). The measured gain of Amplifier 1 at 1 GHz is 30.66 dB
(1164.13 linear ratio). Therefore,
21
1
( 1) (1.23 1)2.47 2.47 3.92
1164.13
AmplifierAmplifier Composite
Amplifier
NFNF NF
G
dB
The noise factor of the ZKL-2 is found to be the same as the composite noise factor because its high gain (30+
dB) reduces the noise contributions of any down-stream devices. These calculations depend on the noise factor

Noise Tutorial VI ~ Noise Measurements with a Spectrum Analyzer
See last page for document revision information ~ File: Reeve_Noise_6_NFMeasSpecAnalyz.doc, Page 6-10
of Amplifier 2 (CxLNA). However, this noise factor is based on the noise factor of Amplifier 1, which was
obtained as a typical value from its datasheet. It is seen that the measured noise factor of Amplifier 1 (3.92 dB) is
about 0.5 dB higher than the assumed value, potentially leading to an error in the calculation. However, in this
case, the high gain of Amplifier 1 reduces the error to a negligible value. There are other potential sources of
error in noise factor calculations and measurement; for example, see [Agilent 1484].
For comparison with the above spectrum analyzer measurements, the noise factors of the two amplifiers were
separately measured with an HP 8970B noise figure meter and HP 346A noise source (table 6-1).
Table 6-1 ~ Comparison of noise factor measurements of CxLNA and ZKL-2 amplifiers with HP 8970B noise figure meter and
N9342C spectrum analyzer
AmplifierGain(dB)
Noise factor(dB)
Measured with 8970B noise figure meter
CxLNA 17.10 0.85
ZKL-2 30.84 3.64
Measured with N9342C spectrum analyzer
CxLNA 17.17 0.89
ZKL-2 30.66 3.92
6-2. References
[Agilent 1303] Spectrum and Signal Analyzer Measurements and Noise, Application Note 1303, Document No.5966-4008E, Agilent Technologies, 2012
[Agilent 1484] Non-Zero Noise Figure after Calibration, Application Note 1484, Document No. 5989-0270EN,Agilent Technologies, Inc., 2004
[HP 8590A] HP 8590A Portable RF Spectrum Analyzer Installation Manual, Manual P/N 08590-90003,Hewlett-Packard Corp., Jan 1987
Noise Tutorial VI ~ Noise Measurements with a SpectrumAnalyzer
See last page for document revision information ~ File: Reeve_Noise_6_NFMeasSpecAnalyz.doc, Page 6-11
Document informationAuthor: Whitham D. ReeveCopyright: © 2013, 2014, 2016, 2017 W. ReeveRevision: 0.0 (Adapted from original expanded work, 19 Jun 2014)
0.1 (Updated TOC and references, 7 Jul 2014)0.2 (Added rms averaging to log power averaging discussion, 24 Dec 2016)0.3 (Revised RBW discussion, 02 Jan 2017)
Word count:3016
Size: 4297728
Related Documents