Page 1 of 25 Classification: Open Status: Final www.equinor.com Noise Impact Assessment Hywind Tampen

Welcome message from author
This document is posted to help you gain knowledge. Please leave a comment to let me know what you think about it! Share it to your friends and learn new things together.
Transcript
Page 1 of 25
Classification Open Status Final wwwequinorcom
Noise Impact Assessment Hywind Tampen
Security Classification Open - Status Final Page 2 of 25
Noise Impact Assessment Hywind Tampen
Document no Contract no Project
Classification Distribution
Open
Expiry date Status
Final
Distribution date Rev no Copy no
Author(s)Source(s)Juumlrgen Weissenberger
Subjects
Hywind sound propagation modelling
Remarks
Valid from Updated
Responsible publisher Authority to approve deviations
Prepared by (Organisation unit Name) DateSignature 29032019
X
Signed by jurw
FT SST ERO Juumlrgen Weissenberger
X
Recommended (Organisation unit Name) DateSignature 29032019
X
Signed by S-1-5-21-220523388-1085031214-725345543-721783584630b7-9b8c-462f-8f33-103fe4b85964logi
FT SST ERO Lars Petter Myhre
Approved by (Organisation unit Name) DateSignature
X
FT SST ERO Cecilie Fjeld Nygaard
29032019
Doc No
Valid from Rev no
Security Classification Open - Status Final Page 3 of 25
Summary
In this study we assessed the possible impact on marine mammals of noise from the Hywind Tampen wind turbines
Measured data from Hywind 1 were used as the basis of the assessment The sound from Hywind 1 was measured over
a period of several month being representative for a variety of weather and operational conditions The sound was
measured at 150m distance from Hywind 1 and at a control station about 10k away with otherwise quite similar
conditions The work at Hywind 1 was analysed and reported by a renowned third-party consultant called JASCO It was
not easy to detect sound from Hywind 1 in the surrounding of other natural and anthropogenic noises a clear sign that
Hywind 1 only created a relatively low sound level Sound at low frequencies 25Hz 50Hz and 125Hz was detected that
was attributed to the revolution of the rotor and the gear For this study a scaling factor was used to account for the more
powerful wind turbines that will be used at Hywind Tampen Suggestions made in a report assessing the noise input from
Hywind Scotland by consultant company Xodus were followed At Hywind 1 a short transient sound was detected most
probably originating from the mooring system it was describes as a ldquosnappingrdquo broadband sound that occurred
occasionally This transient sound was clearly detectable at Hywind 1 but is not known if this sound also occurs on other
Hywind installations with a modified design For completeness it has been included in this study
This study modelled the noise in the environment around Hywind Tampen by using a modelling tool that predicts sound
propagation based on distance from source and environmental parameters like water temperature and salinity and sea
bottom conditions The obtained results were related to internationally accepted threshold values for impact on marine
mammals Due to their excellent hearing capabilities marine mammals have generally lower threshold values for impact
from sound than other animal groups like fish and invertebrates therefore we only considered those for marine
mammals
Two properties of sound were used for the assessment this is the sound pressure expressed as sound pressure level
(SPL) and the accumulated energy of the sound over a longer time period This is called Sound Energy Level SEL In this
study we used SEL over a 24h time period Guidelines developed by the National Oceanid and Atmospheric
Administration NOAA in US suggest that both metrics are used and suggests respective thresholds for both SPL and
SEL This is based on the theory that sound can cause damage to the auditory system of marine mammals ether by a
short strong sound pulse or by a series of lower sound pulsed where the energy over time adds up until a damage
occurs Damage in this respect is the onset of temporary threshold shift (TTS) or permanent threshold shift (PTS) of the
hearing capabilities of the respective animals The NOAA guidelines are regarded as the most stringent to date
Threshold values for behavioural reactions published in literature were also considered
None of the threshold values for injury were exceeded in the vicinity of Hywind Tampen The continuous sound generated
by Hywind Tampen has a low sound pressure far below any threshold values and the accumulated energy over 24h
also stayed below the threshold values exept for the group of low frequency cetaceans where the SEL threshold for TTS
onset was exceeded at distances closer than 45m to the shaft of the wind turbine The probability of an animal to stay for
24 hours within a 45m radius to a wind turbine was however evaluated as zero so no overall risk was found The
continuous sound created by Hywind Tampen is only audible for marine mammals at a couple of hundred meters at
average levels of ambient sound
The transient (snapping) sound has stronger sound pressure values that could come close to some of the threshold
levels for harassment There are however many uncertainties on the exact source strength of this sound and the
assessment can only be an indication The sound pressure (SPL) from the transient sound was below accepted criteria
for injury The accumulated energy over 24 hours (SEL) did not exceed accepted threshold values for injury
Overall the risk of a negative impact on marine mammals by sound created form the Hywind Tampen installation
was evaluated as non existenent
Doc No
Valid from Rev no
Security Classification Open - Status Final Page 4 of 25
Doc No
Valid from Rev no
Security Classification Open - Status Final Page 5 of 25
Table of contents
1 Introduction 6
2 Underwater noise 6
21 Acoustic concepts and terminology 6
22 Baseline noise 7
23 Threshold values for assessing impacts 8
3 Sound propagation modelling 11
31 Sound propagation modelling software 11
4 Input data sound modelling 11
41 Bathymetry 11
42 Sound velocity profile 13
43 Sea bed properties 14
44 Sound source propertiesa 14
441 Operational sound 14
442 Impulsive Sound 15
45 Sound propagation solvers 18
5 Results 19
51 Continuous sound SPL 19
52 Continuous sound SEL 21
53 Transient sound (snapping sound) 23
6 Risk evaluation of sound originating from Hywind Tampen windturbines 24
61 Continous sound evaluated on SPL and SEL metrics 24
62 Transient sound 24
7 Appendix 25
Doc No
Valid from Rev no
Security Classification Open - Status Final Page 6 of 25
1 Introduction
FT SST ERO has been commissioned to undertake an underwater noise impact assessment for Hywind
Tampen
Hywind Tampen Windfarm is planned to be installed between Snorre and Gullfaks oil field and will consist of 11
x 84MW floating wind turbines
Fig 1 Schematic overview over location of Hywind Tampen Windpark in the Norwegian Sea
In relation to noise there are several issues to review This is underwater noise during construction caused by
increased activity of ships in the area and by some special activities like installations of anchors and
infrastructure and noise created by the floating windmills during operation The current report only assesses
the noise that originates from the wind mill structure during operations The noise during construction does not
differ substantially from other marine activities typical for offshore industry Noise created during installation is
also much less than for wind farms installations where impact piling is used and the impact statement for
Hywind Scotland concluded that this impact is negligible and will therefor not be part of this assessment
During operation of the wind mills wind park two kinds of noise is created continuous noise crated by rotating
parts of the windmill that is then propagated from the floating shaft into the water and transient noise that has
been identified at Hywind Pilot This noise most probably comes from the anchor chains cables and
connections
At Hywind Pilot located outside of Stavanger sound has been measured from end of March 2011 to end to
mid of August 2011and reported by JASCO This data set has been assessed by Xodus for the bigger Hywind
windmills at Hywind Scotland In this report we use information from both reports for assessing the noise
impact at Hywind Tampen
2 Underwater noise
21 Acoustic concepts and terminology
Sound travels through the water as vibrations of the fluid particles in a series of pressure waves The waves
comprise a series of alternating compressions (positive pressure variations) and rarefactions (negative
pressure fluctuations) Because sound consists of variations in pressure the unit for measuring sound is
Doc No
Valid from Rev no
Security Classification Open - Status Final Page 7 of 25
usually referenced to a unit of pressure the Pascal (Pa) The unit usually used to describe sound is the decibel
(dB) and in the case of underwater sound the reference unit is taken as 1 μPa
Fig 2 Graphical representation of acoustic wave descriptors
There are multiple ways to report sound levels We will adhere to the ISO standard 184052017 and
recommendations given by NOAA using the following metrics and units
SPL Sound Pressure Levels RMS Applicable to continuous sounds (dB re 1 microPa)
SPLpeak Lp Sound Pressure Level zero to peak Applicaple to continuous sound exposure (dB re 1
microPa)
SELcum24h also LE Sound Exposure Level cumulated over 24h (dB re 1 microPa2 s)
dBSL Source Level This is the sound pressure level of an equivalent point source as measured at
one meter distance can be expressed as SPL SPLpeak or SEL (re 1 microPa m re 1 microPa2 s m)
22 Baseline noise
Background or ldquoambientrdquo underwater noise is generated by a number of natural sources such as rain breaking
waves wind at the surface seismic noise biological noise and thermal noise Biological sources include
marine mammals (which use sound to communicate build up an image of their environment and detect prey
and predators) as well as certain fish and shrimp Anthropogenic sources also add to the background noise
such as fishing boats ships industrial noise seismic surveys and leisure activities Generalised ambient noise
levels in the oceans has been described by Wenz 1962 spectra attributable to various noise sources (Wenz
1962) are shown in Figure 3 Brokker et all (2012) describe background noise levesl in UK wates ranging from
Doc No
Valid from Rev no
Security Classification Open - Status Final Page 8 of 25
92dBre 1 microPa (rms) under low sea state to a maximum of 132 dB re 1 microPa (rms) at sea state 3 Mean values
are at 111 to 112 dB re 1 microPa (rms) At the Hywind control site an average ambient noise level of 1215 dB re
1microPa (rms) was measured Ambient noise levels for the Tampen area are not know from direct measurements
but the area sees less traffic as the area of the Hywind control side outside Stavanger Conditions for Tampen
area assumed to be in the same range as reported by Brooker for UK waters with a mean value approximately
112 dB re 1 microPa (rms)
Fig 3 Generalised ambient noise attributable to various natural and anthropogenic noise sources (Wenz 1962)
23 Threshold values for assessing impacts
There is no regulatory framework in place on the NCS that gives requests on threshold values to be used when
assessing noise impact It is however expected to use the best available scientific knowledge
There is internationally accepted literature that defines threshold values for most of the groups of marine
organisms In this report we adhere to internationally accepted literature and guidelines and in particular to the
guidelines from NOAA (2018) giving threshold values for onset of PTS (Permanent Threshold Shift) and TTS
(Temporary Threshold Shift) PTS is an irreversible reduction in hearing sensitivity TTS is the reversible
reduction in hearing sensitivity with full recovery of hearing after exposure The NOAA guidelines work with a
so called ldquodual criteriardquo This is based on the theory that high sound pressures for impulsive sound can lead to
PTS or TTS when over a certain threshold but also sound of lower strength that is repeated frequently can
Doc No
Valid from Rev no
Security Classification Open - Status Final Page 9 of 25
lead to the same impact Dual metric thresholds using weighted cumulative sound exposure level (SELcum)
and peak sound pressure (PK) metrics for impulsive sounds As dual metrics the guidelines considers onset of
PTS to have occurred when either one of the two metrics is exceeded For non-impulsive sounds thresholds
are provided using the weighted SELcum metric where the sound energy is integrated over a 24h period
Additionally to account for the fact that different species groups use and hear sound differently marine
mammals are sub-divided into five broad hearing groups (ie LF MF HF PW and OW) (Tab1) and
thresholds in the weighted SELcum metric incorporate auditory weighting functions
Tab 1 Marine mammal hearing groups (NOAA 2018)
Doc No
Valid from Rev no
Security Classification Open - Status Final Page 10 of 25
Tab 2 Threshold values for onset of PTS as used in this report (NOAA 2018)
Tab 3 Threshold values for onset of TTS as used in this report (NOAA 2018)
The threshold criteria used in this report are in some parts more stringent than those used in the underwater
noise assessment for Hywind Scotland (Xodus 2015) This has been done because the NOAA guidelines are
Doc No
Valid from Rev no
Security Classification Open - Status Final Page 11 of 25
more recent and acknowledge the most recent literature in the field and because the NOAA guidelines are
geting increasing international attention
Threshold levels for behavioural reactions are extensively discussed in the Xodus report In this report the
same criteria are proposed (Table 4)
Table 4 Suggested marine mammal criteria for onset of disturbance (Xodus 2015)
3 Sound propagation modelling
31 Sound propagation modelling software
For sound propagation modelling the software package dBSea V 25 from Irwinn Carr consulting was used
The software uses bathymetry sediment and sound speed input data to build a 3D acoustic model of the
environment This paired with accurate sound propagation models such as dBSeaPE a Parabolic Equation
algorithm and dBSeaRay a Ray Theory algorithm make for accurate prediction of the sound propagation
Parabolic equation algorithms are known to be the most accurate for modelling low frequencies in shallow
water scenarios while ray theory algorithms deliver the best performance at higher frequencies
4 Input data sound modelling
41 Bathymetry
Bathymetry data were taken from EMODNet Bathymetry database (httpwwwemodnet-bathymetryeudata-
products) that provides bathymetry data for the area with about 100m resolution The postions of the Hywind
stucturs were taken from Hywind Tampen field layout document C219EQ-XE-00001-01 (Table 5)
Doc No
Valid from Rev no
Security Classification Open - Status Final Page 12 of 25
Table 5 Planned infrastructure coordinates for wind mill positions Please note that positions are given in
WGS84 not in ED50 as in field layout document
Fig 4 Hywind tampen placed on the bathymetry map
Name WGS84 Latitude WGS84 Longitude WGS84 UTMz31 Easting WGS84 UTMz31 Northing
HY01 61deg 21 59058 N 2deg 15 6223 E 459 99673 6 803 82959
HY02 61deg 21 12044 N 2deg 15 31773 E 460 35963 6 802 37063
HY03 61deg 20 25029 N 2deg 15 57302 E 460 72253 6 800 91167
HY04 61deg 19 38012 N 2deg 16 22809 E 461 08543 6 799 45272
HY05 61deg 18 50994 N 2deg 16 48295 E 461 44833 6 797 99376
HY06 61deg 18 3974 N 2deg 17 13760 E 461 81123 6 796 53480
HY07 61deg 18 16872 N 2deg 15 36355 E 460 36628 6 796 95000
HY08 61deg 19 3887 N 2deg 15 10846 E 460 00338 6 798 40896
HY09 61deg 19 50900 N 2deg 14 45317 E 459 64048 6 799 86792
HY10 61deg 20 37912 N 2deg 14 19766 E 459 27758 6 801 32687
HY11 61deg 21 24922 N 2deg 13 54194 E 458 91469 6 802 78583
Doc No
Valid from Rev no
Security Classification Open - Status Final Page 13 of 25
42 Sound velocity profile
Salinity temperature and pressure (depth) are the most important parameters that influence the speed of
sound in water Salinity and temperature profiles from World Ocean Database (NOAA National Centres for
Environmental Information (2005) Those data were used to calculate sound speed (Tollefsen CDS 2013)
using the following formula
c(TS z) = 14492+46T minus0055T2+00029T3
+(134minus001T)(Sminus35)+0016z
where T is the temperature in C S is the dimensionless salinity (frequently quoted as
Practical Salinity Units or PSU) and z is the depth in m From Equation 1 it is evident that the sound speed
depends most strongly on T with a weaker dependence on S and z
For each month a sound speed profile was calculated (Fig 5) Because sound is refracted towards depths of
low sound speed sound propagation differ over the seson In order to simulate sound propagation under most
different propagation conditions the sound speed profile for June and April (Fig 6)
Fig 5 Sound speed profiles representative for the area for each month For simulations sound speed profilrs
form April and June were used
Doc No
Valid from Rev no
Security Classification Open - Status Final Page 14 of 25
Fig 6 Sound speed prfiles for April (left) and July (right) as used in dBSea
For calculation of sound absorption effects in the water column average values for water temperature and
salinity for April (707decC 3513PSU) and July were used (872decC 3510PSU
43 Sea bed properties
The acoustic properties of the sea floor have influence of the amount of sound reflected from the sea floor
Bottoms with higher sound speed than the overlying water do reflect more sound back into the water column
than bottoms with lower sound speed (Ballard 2017) In this study we used information from the Equinor
ldquoHywind Tampen Substucure and Mooring System Functional requirementsrdquo report
For the model a sandy layer of 1m thickness with a sound velocity of 1650ms a density of 1900kgm and a
attenuation of 08dBwavelength as used and a clay from 1 m to infinite depth with sound velocity of 1500ms
and density of 1500kgm3 and an attenuttion of 02 dBwavelength was used
44 Sound source properties
Equinor commissioned Fugro GEOS and Jasco Applied Sciences to undertake underwater noise
measurements in the vicinity of Hywind 1 installation at a test site north-west of Stavanger Norway The
purpose of this exercise was to quantify potential underwater noise emissions form the Hywind turbines during
operation in order to inform any impact assessments what will be required for future Hywind projects
Measurements were undertaken at a test location some 150 m from the main structure and the hydrophone
was deployed at a depth of 91 m Additional background noise level readings were undertaken at a remote
control site with comparable natural environmental conditions 10 km from the Hywind test site
This measurements were used to assess noise impact for the Hywind Scotland project This study was done by
Xodus in 2015 The study by Xodus also includes suggestion on upscaling the produces sound to the
somehow bigger turbines to be used for Hywind Scotland In this study we use information from both reports for
the definition of the source strength for the sound at Hywind Tampen
441 Operational sound
Sound originating form Hywind was reported in the respective JASCO report as power spectral densities and
as 13 octave band spectral values (ref Figure 25 and Figure 38 in JASCO Measurement Report) Those data
were measured at 150m distance The Jasco report identified tonal frequencies created by the Hywind at 25Hz
and harmonics thereof with frequencies of 50 Hz and 125Hz Power spectral densities from the Jasco report
were converted to approximate sound pressure level data in third octave bins Same results as in the Xodus
report were achieved In order to get values at source spherical propagation was assumed and 435dB were
added to the values measured at 150m A 4 dB upscaling factor was used according to the suggestions made
Doc No
Valid from Rev no
Security Classification Open - Status Final Page 15 of 25
in the Xodus 2015 report A total SPL source level of 166 dB re 1microPa 1m (rms) was used for each of the
Hywwind Tampen wind turbines in the simulations
Fig 7 Spectral content of the operational noise used in the sound simulations Only those frequency bands
that show clear difference to the general ambient sound in the area are shown
Note The steps of reading out data from graphs in the Jasco report doing back calculations to source level
and the upscaling to bigger wind turbines is based on some assumptions and results in uncertainty Especially
the scaling factor of 4dB for the bigger and more powerful wind turbines is based on assumptions field
measurement on bigger floating wind turbines are not available
442 Impulsive Sound
The Hywind 1 sound study identified a transient sound measurable in the vicinity of Hywind 1 The exact origin
of this transient sound has not been identified it is assumed to be produced by tension realese in the mooring
structure It is unknown if other Hywind installations also exhibit this transient noise
This transient sound was measured above SPLpeak 160 dB re 1 microPa at a distance of 150m corresponding to
SPL of 120 to 125 dB re 1microPa The frequency of this sound extends troughout the recorded frequency range of
0-20kHz
For this study a original sound file from the Hywind I study was used for the sound source characterisation of
the snapping sound (as WAF file) This signal was scaled up to the source strength on the place of its assumed
place of origin on the shaft of the Hywind structure in 150m distance Sperical propagation laws were assumed
and 435 dB was added to the sound level measured at 150 resulting in a SPLpeak level at the source for a
individual turbine to be 203dB re 1 microPa 1m The snapping sound was reported to occur up to 23 times a
day for calculation of SEL over 24h 23 snapping events per day per wind turbine were used accumulating to
253 snapping events for all the Hywind Tampen wind turbines
There is a high uncertainty for the source strength of this transient sound mostly attributed to the unknown
position of its origin It could be stronger or weaker calculations done in this study are only a rough indication
Doc No
Valid from Rev no
Security Classification Open - Status Final Page 16 of 25
Fig 8Transient sound from Hywind expressed with relative sound pressure
Doc No
Valid from Rev no
Security Classification Open - Status Final Page 17 of 25
Fig 9 Input data for transient sound used in modelling softwareExample for HY01 Original wav file measured
at 150m distance upscaled to source level at 1 m from source
A Fast Fourier Transformation (FFT) of the sound file (Audacity V222) showed a main frequency content of
the signal between 50Hz and 10kHz (Fig 10) Lower and higher frequencies are about 10dB lower and are not
considered in the respective modelling because the contribute less than 1 to the sound energy
Doc No
Valid from Rev no
Security Classification Open - Status Final Page 18 of 25
Fig 10
45 Sound propagation solvers
Continous sound
For frequencies 125Hz to 400Hz a solver for the parabolic wave equation was used and for frequencies
above 400 Hz a solver for ray tracing Frequency for simulations was 125Hz to 16kHz
Specific settings for parabolic wave equation an ray tracer solver in dBSea are given in appendix X
Impulsive sound
For calculation of SEL A ray tracer was used throughout the frequency spectrum Frequency spectrum was
315Hz to 125kHz For calculation of SPL a split solver with parabolic wave equation up to 400Hz and a ray
tracer for higher frequencies
Doc No
Valid from Rev no
Security Classification Open - Status Final Page 19 of 25
5 Results
51 Continuous sound SPL
The sound velocity profile used for the April and July simulations resulted in less propagation loss at distances
from the sound sources for the April simulations (better propagation conditions) differences are relatively small
(Fig11) Because of this we use the simulation for April for the further assessment
Fig 11 Sound pressure levels SPLpeak for April and July simulation Highest level from all depth projected to
the surface
Doc No
Valid from Rev no
Security Classification Open - Status Final Page 20 of 25
Fig 12 Sound pressure levels SPLpeak for April across positions HY4 and HY8 (position of transect in insert)
Sound propagation around each wind turbine is almost circular with a slightly better propagation into the north-
east direction where the water depth increases Sound propagation is also fairly uniform at different water
depth (Fig 12) with a slightly reduced sound strength at the surface
In the risk assessment for possible impacts it is always the distance of the highest value that is considered and
all graphical displays show the highest value projected to the surface
If a non-impulsive sound has the potential of exceeding the peak sound pressure level threshold associates
with impulsive sound (Table 2) these tresholds are recommended for consideration according to the NOAA
guedelines
For the Hywind Tampen continuous sound none of the sound pressure thresholds for injury are
exceeded
The threshold for behavioural reaction of SPL 160 db re 1 microPa is not exceeded at any distance to the wind
turbines The lower threshold limit of SPL 120 dB re 1 microPa is about at 2000m distance to the wind mills (Fig
13) Ambient sound SPL in the area is about 112dB re 1microPa in average and 132dB re microPa at noisy days The
the indicated distance to the 120dB isopleth is also showing the audible distance at a days above average
ambient sound On days with average ambient sound levels the noise from Hywind Tampen will be audible to
animals at about 4km
Doc No
Valid from Rev no
Security Classification Open - Status Final Page 21 of 25
Fig 13 Isopleth of the 120dB re 1 microPa threshold limit for behavioural disturbance (Table 4) around the Hywind
Tampen windmills
52 Continuous sound SEL
Sound exposure patterns follow the spatial pattern for sound pressure for the unweighted SEL calculations (Fig
14 SELcum24h unweighted) There are very small differences in the sound propagation when SEL weighted
functions are use because different frequencies propagate different
Unweighted SEL and weighted SEL for all species groups from Table 2 are shown in Fig 14
Doc No
Valid from Rev no
Security Classification Open - Status Final Page 22 of 25
Fig14 Weighted SEL values for groups of marine mammals according to table 6
Table 6 NOAA risk critaria for marine mammals and relevant distances for threshold values NA shows that the
respective threshold value is not exceeded
NOAA criteria Project LE = SELcum re 1 microPa
2s
Hywind Tampen operational sound
Hearing group
range
(average)
(m)
range
max (km)
PTS Onset Threshold levels non impulsive sound
Low-Frequency (LF) Cetaceans LEp LF24h 199 dB NA NA
Mid-Frequency (MF) Cetaceans LEp MF24h 198 dB NA NA
High-Frequency (HF) Cetaceans LEp HF24h 173 dB NA NA
Phocoid Pinnipeds (PW) LEpPW24h 201 dB NA NA
Otariid Pinnipeds (OW) LEp OW24h 219 dB NA NA
TTS onset thresholds for non-impulsive sounds
Low-Frequency (LF) Cetaceans LEp LF24h 179 dB 45 52
Mid-Frequency (MF) Cetaceans LEp MF24h 178 dB NA NA
High-Frequency (HF) Cetaceans LEp HF24h 153 dB NA NA
Phocoid Pinnipeds (PW) LEpPW24h 181 dB NA NA
Otariid Pinnipeds (OW) LEp OW24h 199 dB NA NA
Doc No
Valid from Rev no
Security Classification Open - Status Final Page 23 of 25
53 Transient sound (snapping sound)
The SPLpeak at the source is with 203dB re 1 microPa just above the PTS threshold limit for high frequency
cetaceans but will drop below this threshold at a short distance (around 1 meter) to the source It is well below
threshold limits for single and multiple impulses suggested by Southall (2007) This peak value corresponds to
a SPL of 173dB re 1 microPa this is below the threshold limit for injury but above the threshold values for
behavioural disturbance of 160 dB re 1 microPa (strong reaction) and 140dB re microPa (mild reaction) The 140dB
threshold limit for weak reaction would be exceeded at distances below 160m those for the 160dB threshold
for strong reaction at 16m form the source It again has to be stressed that the available information on the
origin of the transient sound only allows a coarse estimate
Fig 15 SPL around a single turbine with indication of threshold limit for mild behavioural reaction to marine
mammals Average distance to the SPL 140 dB re 1microPa isopleth is 160m those to the SPL 160 dB re 1 microPa
isopleth is about 8m
The SELcum24h values also stay below the threshold levels for injury (Fig 16) for all groups of marine mammals
Doc No
Valid from Rev no
Security Classification Open - Status Final Page 24 of 25
Fig 16 SELcum 24 of this transient sound as unweighted and weighted SELcum24h shows that the threshold
limits for injury are not exceeded at any distance to the wind tubines
6 Risk evaluation of sound originating from Hywind Tampen windturbines
61 Continous sound evaluated on SPL and SEL metrics
The threshold limits for injury (PTS and TTS) are not exceeded in the vicinity of Hywind Tampen wind turbines
except those for low frequency cetaceans where the respective SEL threshold limit is exceeded within a radius
of 52m around each individual wind turbine This however does not pose a risk to marine mammals In order to
receiveobserve this threshold limit an animal from the group of the low frequency cetaceans has to be present
within this zone for 24hours The probability that this happens is almost zero An actively movingmigrating
animal will pass this zone within a few seconds and even a none moving animal drifting with the currents will
only be exposed for a short time The ambient noise in the area is estimated to about 112 dB re 1 microPa SPL
this means the sound created by Hywind turbines is on average not audible to marine mammals beyond a
distance of 4km
The overall risk for marine mammals from continuous sound form Hywind Tampen during operations is
evaluated as non existing
62 Transient sound
Risk assessment for the transient is based on many assumptions related to the origin of the sound and the
strength of the sound on it source It is further not established if this so called ldquosnappingrdquo sound is an inherent
property of the Hywind design or if it is a property only be found on the Hywind 1
Risk assessment is included in this study because the strength of the snapping sound is close to some of the
threshold values (SPL 180dB re 1 microPa for harassment B definition) and needs consideration in case it is an
Doc No
Valid from Rev no
Security Classification Open - Status Final Page 25 of 25
inherent property of the Hywind design It is highly recommended to verify the presence or absence of this
feature on the Hywind Scotland installation In case of absence this risk assessment has not to be repeated for
future Hywind installations
The risk is however evaluated as low in general Higher sound pressures can only be expected very close to
the sound source and the the probability of being close to the source of the transient sound is small for any
marine mammal The sound energy animals would be exposed to if staying in the are for a longer period is
also relatively low and does not pose a risk It can not be expected that animals stay for 24hours in the area
and even if they the received sound energy is below any threshold levels for injury Behavioural reactions can
be expected at relatively close distances to the wind turbines eg avoiding Though it is not expected that this
has negative impact on individuals or populations of marine mammals
Overall the risk for marine mammals originating from the transient sound is evaluated as non-existing
Due to the risk of formally exceeding some threshold levels for the transient sound it is recommended to do
sound measurements at newer Hywind installations eg in Scotland to find out if the new design of the
mooring creates similar sound or not
7 Appendix
JASCO 2011 Hywind Acoustic Measurement Report Jasco Report NO 00229
Xodus 2015 Technical Note on Underwater Noise A-100142-S20-TECH-001
NOAA (2018) 2018 Revision to Technical Guidance for Assessing the Effects of Anthropogenic Sound on
Marine Mammal Hearing (Version 2) httpswwwfisheriesnoaagovnationalmarine-mammal-
protectionmarine-mammal-acoustic-technical-guidance
Tollefsen Christina D S (2013) Reccomendations for calculatintg sound speed profiles from field data
Defence RampD Canada Atlantic Technical1048577Memorandum DRDC Atlantic TM 2013-156
Ballard MS and Lee Kevin M2017 The Acoustics of Marine Sediments Acoustics Today volume 13 issue 3
Fall 2017
Doc No
Valid from Rev no
Security Classification Open - Status Final Page 3 of 25
Summary
In this study we assessed the possible impact on marine mammals of noise from the Hywind Tampen wind turbines
Measured data from Hywind 1 were used as the basis of the assessment The sound from Hywind 1 was measured over
a period of several month being representative for a variety of weather and operational conditions The sound was
measured at 150m distance from Hywind 1 and at a control station about 10k away with otherwise quite similar
conditions The work at Hywind 1 was analysed and reported by a renowned third-party consultant called JASCO It was
not easy to detect sound from Hywind 1 in the surrounding of other natural and anthropogenic noises a clear sign that
Hywind 1 only created a relatively low sound level Sound at low frequencies 25Hz 50Hz and 125Hz was detected that
was attributed to the revolution of the rotor and the gear For this study a scaling factor was used to account for the more
powerful wind turbines that will be used at Hywind Tampen Suggestions made in a report assessing the noise input from
Hywind Scotland by consultant company Xodus were followed At Hywind 1 a short transient sound was detected most
probably originating from the mooring system it was describes as a ldquosnappingrdquo broadband sound that occurred
occasionally This transient sound was clearly detectable at Hywind 1 but is not known if this sound also occurs on other
Hywind installations with a modified design For completeness it has been included in this study
This study modelled the noise in the environment around Hywind Tampen by using a modelling tool that predicts sound
propagation based on distance from source and environmental parameters like water temperature and salinity and sea
bottom conditions The obtained results were related to internationally accepted threshold values for impact on marine
mammals Due to their excellent hearing capabilities marine mammals have generally lower threshold values for impact
from sound than other animal groups like fish and invertebrates therefore we only considered those for marine
mammals
Two properties of sound were used for the assessment this is the sound pressure expressed as sound pressure level
(SPL) and the accumulated energy of the sound over a longer time period This is called Sound Energy Level SEL In this
study we used SEL over a 24h time period Guidelines developed by the National Oceanid and Atmospheric
Administration NOAA in US suggest that both metrics are used and suggests respective thresholds for both SPL and
SEL This is based on the theory that sound can cause damage to the auditory system of marine mammals ether by a
short strong sound pulse or by a series of lower sound pulsed where the energy over time adds up until a damage
occurs Damage in this respect is the onset of temporary threshold shift (TTS) or permanent threshold shift (PTS) of the
hearing capabilities of the respective animals The NOAA guidelines are regarded as the most stringent to date
Threshold values for behavioural reactions published in literature were also considered
None of the threshold values for injury were exceeded in the vicinity of Hywind Tampen The continuous sound generated
by Hywind Tampen has a low sound pressure far below any threshold values and the accumulated energy over 24h
also stayed below the threshold values exept for the group of low frequency cetaceans where the SEL threshold for TTS
onset was exceeded at distances closer than 45m to the shaft of the wind turbine The probability of an animal to stay for
24 hours within a 45m radius to a wind turbine was however evaluated as zero so no overall risk was found The
continuous sound created by Hywind Tampen is only audible for marine mammals at a couple of hundred meters at
average levels of ambient sound
The transient (snapping) sound has stronger sound pressure values that could come close to some of the threshold
levels for harassment There are however many uncertainties on the exact source strength of this sound and the
assessment can only be an indication The sound pressure (SPL) from the transient sound was below accepted criteria
for injury The accumulated energy over 24 hours (SEL) did not exceed accepted threshold values for injury
Overall the risk of a negative impact on marine mammals by sound created form the Hywind Tampen installation
was evaluated as non existenent
Doc No
Valid from Rev no
Security Classification Open - Status Final Page 4 of 25
Doc No
Valid from Rev no
Security Classification Open - Status Final Page 5 of 25
Table of contents
1 Introduction 6
2 Underwater noise 6
21 Acoustic concepts and terminology 6
22 Baseline noise 7
23 Threshold values for assessing impacts 8
3 Sound propagation modelling 11
31 Sound propagation modelling software 11
4 Input data sound modelling 11
41 Bathymetry 11
42 Sound velocity profile 13
43 Sea bed properties 14
44 Sound source propertiesa 14
441 Operational sound 14
442 Impulsive Sound 15
45 Sound propagation solvers 18
5 Results 19
51 Continuous sound SPL 19
52 Continuous sound SEL 21
53 Transient sound (snapping sound) 23
6 Risk evaluation of sound originating from Hywind Tampen windturbines 24
61 Continous sound evaluated on SPL and SEL metrics 24
62 Transient sound 24
7 Appendix 25
Doc No
Valid from Rev no
Security Classification Open - Status Final Page 6 of 25
1 Introduction
FT SST ERO has been commissioned to undertake an underwater noise impact assessment for Hywind
Tampen
Hywind Tampen Windfarm is planned to be installed between Snorre and Gullfaks oil field and will consist of 11
x 84MW floating wind turbines
Fig 1 Schematic overview over location of Hywind Tampen Windpark in the Norwegian Sea
In relation to noise there are several issues to review This is underwater noise during construction caused by
increased activity of ships in the area and by some special activities like installations of anchors and
infrastructure and noise created by the floating windmills during operation The current report only assesses
the noise that originates from the wind mill structure during operations The noise during construction does not
differ substantially from other marine activities typical for offshore industry Noise created during installation is
also much less than for wind farms installations where impact piling is used and the impact statement for
Hywind Scotland concluded that this impact is negligible and will therefor not be part of this assessment
During operation of the wind mills wind park two kinds of noise is created continuous noise crated by rotating
parts of the windmill that is then propagated from the floating shaft into the water and transient noise that has
been identified at Hywind Pilot This noise most probably comes from the anchor chains cables and
connections
At Hywind Pilot located outside of Stavanger sound has been measured from end of March 2011 to end to
mid of August 2011and reported by JASCO This data set has been assessed by Xodus for the bigger Hywind
windmills at Hywind Scotland In this report we use information from both reports for assessing the noise
impact at Hywind Tampen
2 Underwater noise
21 Acoustic concepts and terminology
Sound travels through the water as vibrations of the fluid particles in a series of pressure waves The waves
comprise a series of alternating compressions (positive pressure variations) and rarefactions (negative
pressure fluctuations) Because sound consists of variations in pressure the unit for measuring sound is
Doc No
Valid from Rev no
Security Classification Open - Status Final Page 7 of 25
usually referenced to a unit of pressure the Pascal (Pa) The unit usually used to describe sound is the decibel
(dB) and in the case of underwater sound the reference unit is taken as 1 μPa
Fig 2 Graphical representation of acoustic wave descriptors
There are multiple ways to report sound levels We will adhere to the ISO standard 184052017 and
recommendations given by NOAA using the following metrics and units
SPL Sound Pressure Levels RMS Applicable to continuous sounds (dB re 1 microPa)
SPLpeak Lp Sound Pressure Level zero to peak Applicaple to continuous sound exposure (dB re 1
microPa)
SELcum24h also LE Sound Exposure Level cumulated over 24h (dB re 1 microPa2 s)
dBSL Source Level This is the sound pressure level of an equivalent point source as measured at
one meter distance can be expressed as SPL SPLpeak or SEL (re 1 microPa m re 1 microPa2 s m)
22 Baseline noise
Background or ldquoambientrdquo underwater noise is generated by a number of natural sources such as rain breaking
waves wind at the surface seismic noise biological noise and thermal noise Biological sources include
marine mammals (which use sound to communicate build up an image of their environment and detect prey
and predators) as well as certain fish and shrimp Anthropogenic sources also add to the background noise
such as fishing boats ships industrial noise seismic surveys and leisure activities Generalised ambient noise
levels in the oceans has been described by Wenz 1962 spectra attributable to various noise sources (Wenz
1962) are shown in Figure 3 Brokker et all (2012) describe background noise levesl in UK wates ranging from
Doc No
Valid from Rev no
Security Classification Open - Status Final Page 8 of 25
92dBre 1 microPa (rms) under low sea state to a maximum of 132 dB re 1 microPa (rms) at sea state 3 Mean values
are at 111 to 112 dB re 1 microPa (rms) At the Hywind control site an average ambient noise level of 1215 dB re
1microPa (rms) was measured Ambient noise levels for the Tampen area are not know from direct measurements
but the area sees less traffic as the area of the Hywind control side outside Stavanger Conditions for Tampen
area assumed to be in the same range as reported by Brooker for UK waters with a mean value approximately
112 dB re 1 microPa (rms)
Fig 3 Generalised ambient noise attributable to various natural and anthropogenic noise sources (Wenz 1962)
23 Threshold values for assessing impacts
There is no regulatory framework in place on the NCS that gives requests on threshold values to be used when
assessing noise impact It is however expected to use the best available scientific knowledge
There is internationally accepted literature that defines threshold values for most of the groups of marine
organisms In this report we adhere to internationally accepted literature and guidelines and in particular to the
guidelines from NOAA (2018) giving threshold values for onset of PTS (Permanent Threshold Shift) and TTS
(Temporary Threshold Shift) PTS is an irreversible reduction in hearing sensitivity TTS is the reversible
reduction in hearing sensitivity with full recovery of hearing after exposure The NOAA guidelines work with a
so called ldquodual criteriardquo This is based on the theory that high sound pressures for impulsive sound can lead to
PTS or TTS when over a certain threshold but also sound of lower strength that is repeated frequently can
Doc No
Valid from Rev no
Security Classification Open - Status Final Page 9 of 25
lead to the same impact Dual metric thresholds using weighted cumulative sound exposure level (SELcum)
and peak sound pressure (PK) metrics for impulsive sounds As dual metrics the guidelines considers onset of
PTS to have occurred when either one of the two metrics is exceeded For non-impulsive sounds thresholds
are provided using the weighted SELcum metric where the sound energy is integrated over a 24h period
Additionally to account for the fact that different species groups use and hear sound differently marine
mammals are sub-divided into five broad hearing groups (ie LF MF HF PW and OW) (Tab1) and
thresholds in the weighted SELcum metric incorporate auditory weighting functions
Tab 1 Marine mammal hearing groups (NOAA 2018)
Doc No
Valid from Rev no
Security Classification Open - Status Final Page 10 of 25
Tab 2 Threshold values for onset of PTS as used in this report (NOAA 2018)
Tab 3 Threshold values for onset of TTS as used in this report (NOAA 2018)
The threshold criteria used in this report are in some parts more stringent than those used in the underwater
noise assessment for Hywind Scotland (Xodus 2015) This has been done because the NOAA guidelines are
Doc No
Valid from Rev no
Security Classification Open - Status Final Page 11 of 25
more recent and acknowledge the most recent literature in the field and because the NOAA guidelines are
geting increasing international attention
Threshold levels for behavioural reactions are extensively discussed in the Xodus report In this report the
same criteria are proposed (Table 4)
Table 4 Suggested marine mammal criteria for onset of disturbance (Xodus 2015)
3 Sound propagation modelling
31 Sound propagation modelling software
For sound propagation modelling the software package dBSea V 25 from Irwinn Carr consulting was used
The software uses bathymetry sediment and sound speed input data to build a 3D acoustic model of the
environment This paired with accurate sound propagation models such as dBSeaPE a Parabolic Equation
algorithm and dBSeaRay a Ray Theory algorithm make for accurate prediction of the sound propagation
Parabolic equation algorithms are known to be the most accurate for modelling low frequencies in shallow
water scenarios while ray theory algorithms deliver the best performance at higher frequencies
4 Input data sound modelling
41 Bathymetry
Bathymetry data were taken from EMODNet Bathymetry database (httpwwwemodnet-bathymetryeudata-
products) that provides bathymetry data for the area with about 100m resolution The postions of the Hywind
stucturs were taken from Hywind Tampen field layout document C219EQ-XE-00001-01 (Table 5)
Doc No
Valid from Rev no
Security Classification Open - Status Final Page 12 of 25
Table 5 Planned infrastructure coordinates for wind mill positions Please note that positions are given in
WGS84 not in ED50 as in field layout document
Fig 4 Hywind tampen placed on the bathymetry map
Name WGS84 Latitude WGS84 Longitude WGS84 UTMz31 Easting WGS84 UTMz31 Northing
HY01 61deg 21 59058 N 2deg 15 6223 E 459 99673 6 803 82959
HY02 61deg 21 12044 N 2deg 15 31773 E 460 35963 6 802 37063
HY03 61deg 20 25029 N 2deg 15 57302 E 460 72253 6 800 91167
HY04 61deg 19 38012 N 2deg 16 22809 E 461 08543 6 799 45272
HY05 61deg 18 50994 N 2deg 16 48295 E 461 44833 6 797 99376
HY06 61deg 18 3974 N 2deg 17 13760 E 461 81123 6 796 53480
HY07 61deg 18 16872 N 2deg 15 36355 E 460 36628 6 796 95000
HY08 61deg 19 3887 N 2deg 15 10846 E 460 00338 6 798 40896
HY09 61deg 19 50900 N 2deg 14 45317 E 459 64048 6 799 86792
HY10 61deg 20 37912 N 2deg 14 19766 E 459 27758 6 801 32687
HY11 61deg 21 24922 N 2deg 13 54194 E 458 91469 6 802 78583
Doc No
Valid from Rev no
Security Classification Open - Status Final Page 13 of 25
42 Sound velocity profile
Salinity temperature and pressure (depth) are the most important parameters that influence the speed of
sound in water Salinity and temperature profiles from World Ocean Database (NOAA National Centres for
Environmental Information (2005) Those data were used to calculate sound speed (Tollefsen CDS 2013)
using the following formula
c(TS z) = 14492+46T minus0055T2+00029T3
+(134minus001T)(Sminus35)+0016z
where T is the temperature in C S is the dimensionless salinity (frequently quoted as
Practical Salinity Units or PSU) and z is the depth in m From Equation 1 it is evident that the sound speed
depends most strongly on T with a weaker dependence on S and z
For each month a sound speed profile was calculated (Fig 5) Because sound is refracted towards depths of
low sound speed sound propagation differ over the seson In order to simulate sound propagation under most
different propagation conditions the sound speed profile for June and April (Fig 6)
Fig 5 Sound speed profiles representative for the area for each month For simulations sound speed profilrs
form April and June were used
Doc No
Valid from Rev no
Security Classification Open - Status Final Page 14 of 25
Fig 6 Sound speed prfiles for April (left) and July (right) as used in dBSea
For calculation of sound absorption effects in the water column average values for water temperature and
salinity for April (707decC 3513PSU) and July were used (872decC 3510PSU
43 Sea bed properties
The acoustic properties of the sea floor have influence of the amount of sound reflected from the sea floor
Bottoms with higher sound speed than the overlying water do reflect more sound back into the water column
than bottoms with lower sound speed (Ballard 2017) In this study we used information from the Equinor
ldquoHywind Tampen Substucure and Mooring System Functional requirementsrdquo report
For the model a sandy layer of 1m thickness with a sound velocity of 1650ms a density of 1900kgm and a
attenuation of 08dBwavelength as used and a clay from 1 m to infinite depth with sound velocity of 1500ms
and density of 1500kgm3 and an attenuttion of 02 dBwavelength was used
44 Sound source properties
Equinor commissioned Fugro GEOS and Jasco Applied Sciences to undertake underwater noise
measurements in the vicinity of Hywind 1 installation at a test site north-west of Stavanger Norway The
purpose of this exercise was to quantify potential underwater noise emissions form the Hywind turbines during
operation in order to inform any impact assessments what will be required for future Hywind projects
Measurements were undertaken at a test location some 150 m from the main structure and the hydrophone
was deployed at a depth of 91 m Additional background noise level readings were undertaken at a remote
control site with comparable natural environmental conditions 10 km from the Hywind test site
This measurements were used to assess noise impact for the Hywind Scotland project This study was done by
Xodus in 2015 The study by Xodus also includes suggestion on upscaling the produces sound to the
somehow bigger turbines to be used for Hywind Scotland In this study we use information from both reports for
the definition of the source strength for the sound at Hywind Tampen
441 Operational sound
Sound originating form Hywind was reported in the respective JASCO report as power spectral densities and
as 13 octave band spectral values (ref Figure 25 and Figure 38 in JASCO Measurement Report) Those data
were measured at 150m distance The Jasco report identified tonal frequencies created by the Hywind at 25Hz
and harmonics thereof with frequencies of 50 Hz and 125Hz Power spectral densities from the Jasco report
were converted to approximate sound pressure level data in third octave bins Same results as in the Xodus
report were achieved In order to get values at source spherical propagation was assumed and 435dB were
added to the values measured at 150m A 4 dB upscaling factor was used according to the suggestions made
Doc No
Valid from Rev no
Security Classification Open - Status Final Page 15 of 25
in the Xodus 2015 report A total SPL source level of 166 dB re 1microPa 1m (rms) was used for each of the
Hywwind Tampen wind turbines in the simulations
Fig 7 Spectral content of the operational noise used in the sound simulations Only those frequency bands
that show clear difference to the general ambient sound in the area are shown
Note The steps of reading out data from graphs in the Jasco report doing back calculations to source level
and the upscaling to bigger wind turbines is based on some assumptions and results in uncertainty Especially
the scaling factor of 4dB for the bigger and more powerful wind turbines is based on assumptions field
measurement on bigger floating wind turbines are not available
442 Impulsive Sound
The Hywind 1 sound study identified a transient sound measurable in the vicinity of Hywind 1 The exact origin
of this transient sound has not been identified it is assumed to be produced by tension realese in the mooring
structure It is unknown if other Hywind installations also exhibit this transient noise
This transient sound was measured above SPLpeak 160 dB re 1 microPa at a distance of 150m corresponding to
SPL of 120 to 125 dB re 1microPa The frequency of this sound extends troughout the recorded frequency range of
0-20kHz
For this study a original sound file from the Hywind I study was used for the sound source characterisation of
the snapping sound (as WAF file) This signal was scaled up to the source strength on the place of its assumed
place of origin on the shaft of the Hywind structure in 150m distance Sperical propagation laws were assumed
and 435 dB was added to the sound level measured at 150 resulting in a SPLpeak level at the source for a
individual turbine to be 203dB re 1 microPa 1m The snapping sound was reported to occur up to 23 times a
day for calculation of SEL over 24h 23 snapping events per day per wind turbine were used accumulating to
253 snapping events for all the Hywind Tampen wind turbines
There is a high uncertainty for the source strength of this transient sound mostly attributed to the unknown
position of its origin It could be stronger or weaker calculations done in this study are only a rough indication
Doc No
Valid from Rev no
Security Classification Open - Status Final Page 16 of 25
Fig 8Transient sound from Hywind expressed with relative sound pressure
Doc No
Valid from Rev no
Security Classification Open - Status Final Page 17 of 25
Fig 9 Input data for transient sound used in modelling softwareExample for HY01 Original wav file measured
at 150m distance upscaled to source level at 1 m from source
A Fast Fourier Transformation (FFT) of the sound file (Audacity V222) showed a main frequency content of
the signal between 50Hz and 10kHz (Fig 10) Lower and higher frequencies are about 10dB lower and are not
considered in the respective modelling because the contribute less than 1 to the sound energy
Doc No
Valid from Rev no
Security Classification Open - Status Final Page 18 of 25
Fig 10
45 Sound propagation solvers
Continous sound
For frequencies 125Hz to 400Hz a solver for the parabolic wave equation was used and for frequencies
above 400 Hz a solver for ray tracing Frequency for simulations was 125Hz to 16kHz
Specific settings for parabolic wave equation an ray tracer solver in dBSea are given in appendix X
Impulsive sound
For calculation of SEL A ray tracer was used throughout the frequency spectrum Frequency spectrum was
315Hz to 125kHz For calculation of SPL a split solver with parabolic wave equation up to 400Hz and a ray
tracer for higher frequencies
Doc No
Valid from Rev no
Security Classification Open - Status Final Page 19 of 25
5 Results
51 Continuous sound SPL
The sound velocity profile used for the April and July simulations resulted in less propagation loss at distances
from the sound sources for the April simulations (better propagation conditions) differences are relatively small
(Fig11) Because of this we use the simulation for April for the further assessment
Fig 11 Sound pressure levels SPLpeak for April and July simulation Highest level from all depth projected to
the surface
Doc No
Valid from Rev no
Security Classification Open - Status Final Page 20 of 25
Fig 12 Sound pressure levels SPLpeak for April across positions HY4 and HY8 (position of transect in insert)
Sound propagation around each wind turbine is almost circular with a slightly better propagation into the north-
east direction where the water depth increases Sound propagation is also fairly uniform at different water
depth (Fig 12) with a slightly reduced sound strength at the surface
In the risk assessment for possible impacts it is always the distance of the highest value that is considered and
all graphical displays show the highest value projected to the surface
If a non-impulsive sound has the potential of exceeding the peak sound pressure level threshold associates
with impulsive sound (Table 2) these tresholds are recommended for consideration according to the NOAA
guedelines
For the Hywind Tampen continuous sound none of the sound pressure thresholds for injury are
exceeded
The threshold for behavioural reaction of SPL 160 db re 1 microPa is not exceeded at any distance to the wind
turbines The lower threshold limit of SPL 120 dB re 1 microPa is about at 2000m distance to the wind mills (Fig
13) Ambient sound SPL in the area is about 112dB re 1microPa in average and 132dB re microPa at noisy days The
the indicated distance to the 120dB isopleth is also showing the audible distance at a days above average
ambient sound On days with average ambient sound levels the noise from Hywind Tampen will be audible to
animals at about 4km
Doc No
Valid from Rev no
Security Classification Open - Status Final Page 21 of 25
Fig 13 Isopleth of the 120dB re 1 microPa threshold limit for behavioural disturbance (Table 4) around the Hywind
Tampen windmills
52 Continuous sound SEL
Sound exposure patterns follow the spatial pattern for sound pressure for the unweighted SEL calculations (Fig
14 SELcum24h unweighted) There are very small differences in the sound propagation when SEL weighted
functions are use because different frequencies propagate different
Unweighted SEL and weighted SEL for all species groups from Table 2 are shown in Fig 14
Doc No
Valid from Rev no
Security Classification Open - Status Final Page 22 of 25
Fig14 Weighted SEL values for groups of marine mammals according to table 6
Table 6 NOAA risk critaria for marine mammals and relevant distances for threshold values NA shows that the
respective threshold value is not exceeded
NOAA criteria Project LE = SELcum re 1 microPa
2s
Hywind Tampen operational sound
Hearing group
range
(average)
(m)
range
max (km)
PTS Onset Threshold levels non impulsive sound
Low-Frequency (LF) Cetaceans LEp LF24h 199 dB NA NA
Mid-Frequency (MF) Cetaceans LEp MF24h 198 dB NA NA
High-Frequency (HF) Cetaceans LEp HF24h 173 dB NA NA
Phocoid Pinnipeds (PW) LEpPW24h 201 dB NA NA
Otariid Pinnipeds (OW) LEp OW24h 219 dB NA NA
TTS onset thresholds for non-impulsive sounds
Low-Frequency (LF) Cetaceans LEp LF24h 179 dB 45 52
Mid-Frequency (MF) Cetaceans LEp MF24h 178 dB NA NA
High-Frequency (HF) Cetaceans LEp HF24h 153 dB NA NA
Phocoid Pinnipeds (PW) LEpPW24h 181 dB NA NA
Otariid Pinnipeds (OW) LEp OW24h 199 dB NA NA
Doc No
Valid from Rev no
Security Classification Open - Status Final Page 23 of 25
53 Transient sound (snapping sound)
The SPLpeak at the source is with 203dB re 1 microPa just above the PTS threshold limit for high frequency
cetaceans but will drop below this threshold at a short distance (around 1 meter) to the source It is well below
threshold limits for single and multiple impulses suggested by Southall (2007) This peak value corresponds to
a SPL of 173dB re 1 microPa this is below the threshold limit for injury but above the threshold values for
behavioural disturbance of 160 dB re 1 microPa (strong reaction) and 140dB re microPa (mild reaction) The 140dB
threshold limit for weak reaction would be exceeded at distances below 160m those for the 160dB threshold
for strong reaction at 16m form the source It again has to be stressed that the available information on the
origin of the transient sound only allows a coarse estimate
Fig 15 SPL around a single turbine with indication of threshold limit for mild behavioural reaction to marine
mammals Average distance to the SPL 140 dB re 1microPa isopleth is 160m those to the SPL 160 dB re 1 microPa
isopleth is about 8m
The SELcum24h values also stay below the threshold levels for injury (Fig 16) for all groups of marine mammals
Doc No
Valid from Rev no
Security Classification Open - Status Final Page 24 of 25
Fig 16 SELcum 24 of this transient sound as unweighted and weighted SELcum24h shows that the threshold
limits for injury are not exceeded at any distance to the wind tubines
6 Risk evaluation of sound originating from Hywind Tampen windturbines
61 Continous sound evaluated on SPL and SEL metrics
The threshold limits for injury (PTS and TTS) are not exceeded in the vicinity of Hywind Tampen wind turbines
except those for low frequency cetaceans where the respective SEL threshold limit is exceeded within a radius
of 52m around each individual wind turbine This however does not pose a risk to marine mammals In order to
receiveobserve this threshold limit an animal from the group of the low frequency cetaceans has to be present
within this zone for 24hours The probability that this happens is almost zero An actively movingmigrating
animal will pass this zone within a few seconds and even a none moving animal drifting with the currents will
only be exposed for a short time The ambient noise in the area is estimated to about 112 dB re 1 microPa SPL
this means the sound created by Hywind turbines is on average not audible to marine mammals beyond a
distance of 4km
The overall risk for marine mammals from continuous sound form Hywind Tampen during operations is
evaluated as non existing
62 Transient sound
Risk assessment for the transient is based on many assumptions related to the origin of the sound and the
strength of the sound on it source It is further not established if this so called ldquosnappingrdquo sound is an inherent
property of the Hywind design or if it is a property only be found on the Hywind 1
Risk assessment is included in this study because the strength of the snapping sound is close to some of the
threshold values (SPL 180dB re 1 microPa for harassment B definition) and needs consideration in case it is an
Doc No
Valid from Rev no
Security Classification Open - Status Final Page 25 of 25
inherent property of the Hywind design It is highly recommended to verify the presence or absence of this
feature on the Hywind Scotland installation In case of absence this risk assessment has not to be repeated for
future Hywind installations
The risk is however evaluated as low in general Higher sound pressures can only be expected very close to
the sound source and the the probability of being close to the source of the transient sound is small for any
marine mammal The sound energy animals would be exposed to if staying in the are for a longer period is
also relatively low and does not pose a risk It can not be expected that animals stay for 24hours in the area
and even if they the received sound energy is below any threshold levels for injury Behavioural reactions can
be expected at relatively close distances to the wind turbines eg avoiding Though it is not expected that this
has negative impact on individuals or populations of marine mammals
Overall the risk for marine mammals originating from the transient sound is evaluated as non-existing
Due to the risk of formally exceeding some threshold levels for the transient sound it is recommended to do
sound measurements at newer Hywind installations eg in Scotland to find out if the new design of the
mooring creates similar sound or not
7 Appendix
JASCO 2011 Hywind Acoustic Measurement Report Jasco Report NO 00229
Xodus 2015 Technical Note on Underwater Noise A-100142-S20-TECH-001
NOAA (2018) 2018 Revision to Technical Guidance for Assessing the Effects of Anthropogenic Sound on
Marine Mammal Hearing (Version 2) httpswwwfisheriesnoaagovnationalmarine-mammal-
protectionmarine-mammal-acoustic-technical-guidance
Tollefsen Christina D S (2013) Reccomendations for calculatintg sound speed profiles from field data
Defence RampD Canada Atlantic Technical1048577Memorandum DRDC Atlantic TM 2013-156
Ballard MS and Lee Kevin M2017 The Acoustics of Marine Sediments Acoustics Today volume 13 issue 3
Fall 2017

Doc No
Valid from Rev no
Security Classification Open - Status Final Page 4 of 25
Doc No
Valid from Rev no
Security Classification Open - Status Final Page 5 of 25
Table of contents
1 Introduction 6
2 Underwater noise 6
21 Acoustic concepts and terminology 6
22 Baseline noise 7
23 Threshold values for assessing impacts 8
3 Sound propagation modelling 11
31 Sound propagation modelling software 11
4 Input data sound modelling 11
41 Bathymetry 11
42 Sound velocity profile 13
43 Sea bed properties 14
44 Sound source propertiesa 14
441 Operational sound 14
442 Impulsive Sound 15
45 Sound propagation solvers 18
5 Results 19
51 Continuous sound SPL 19
52 Continuous sound SEL 21
53 Transient sound (snapping sound) 23
6 Risk evaluation of sound originating from Hywind Tampen windturbines 24
61 Continous sound evaluated on SPL and SEL metrics 24
62 Transient sound 24
7 Appendix 25
Doc No
Valid from Rev no
Security Classification Open - Status Final Page 6 of 25
1 Introduction
FT SST ERO has been commissioned to undertake an underwater noise impact assessment for Hywind
Tampen
Hywind Tampen Windfarm is planned to be installed between Snorre and Gullfaks oil field and will consist of 11
x 84MW floating wind turbines
Fig 1 Schematic overview over location of Hywind Tampen Windpark in the Norwegian Sea
In relation to noise there are several issues to review This is underwater noise during construction caused by
increased activity of ships in the area and by some special activities like installations of anchors and
infrastructure and noise created by the floating windmills during operation The current report only assesses
the noise that originates from the wind mill structure during operations The noise during construction does not
differ substantially from other marine activities typical for offshore industry Noise created during installation is
also much less than for wind farms installations where impact piling is used and the impact statement for
Hywind Scotland concluded that this impact is negligible and will therefor not be part of this assessment
During operation of the wind mills wind park two kinds of noise is created continuous noise crated by rotating
parts of the windmill that is then propagated from the floating shaft into the water and transient noise that has
been identified at Hywind Pilot This noise most probably comes from the anchor chains cables and
connections
At Hywind Pilot located outside of Stavanger sound has been measured from end of March 2011 to end to
mid of August 2011and reported by JASCO This data set has been assessed by Xodus for the bigger Hywind
windmills at Hywind Scotland In this report we use information from both reports for assessing the noise
impact at Hywind Tampen
2 Underwater noise
21 Acoustic concepts and terminology
Sound travels through the water as vibrations of the fluid particles in a series of pressure waves The waves
comprise a series of alternating compressions (positive pressure variations) and rarefactions (negative
pressure fluctuations) Because sound consists of variations in pressure the unit for measuring sound is
Doc No
Valid from Rev no
Security Classification Open - Status Final Page 7 of 25
usually referenced to a unit of pressure the Pascal (Pa) The unit usually used to describe sound is the decibel
(dB) and in the case of underwater sound the reference unit is taken as 1 μPa
Fig 2 Graphical representation of acoustic wave descriptors
There are multiple ways to report sound levels We will adhere to the ISO standard 184052017 and
recommendations given by NOAA using the following metrics and units
SPL Sound Pressure Levels RMS Applicable to continuous sounds (dB re 1 microPa)
SPLpeak Lp Sound Pressure Level zero to peak Applicaple to continuous sound exposure (dB re 1
microPa)
SELcum24h also LE Sound Exposure Level cumulated over 24h (dB re 1 microPa2 s)
dBSL Source Level This is the sound pressure level of an equivalent point source as measured at
one meter distance can be expressed as SPL SPLpeak or SEL (re 1 microPa m re 1 microPa2 s m)
22 Baseline noise
Background or ldquoambientrdquo underwater noise is generated by a number of natural sources such as rain breaking
waves wind at the surface seismic noise biological noise and thermal noise Biological sources include
marine mammals (which use sound to communicate build up an image of their environment and detect prey
and predators) as well as certain fish and shrimp Anthropogenic sources also add to the background noise
such as fishing boats ships industrial noise seismic surveys and leisure activities Generalised ambient noise
levels in the oceans has been described by Wenz 1962 spectra attributable to various noise sources (Wenz
1962) are shown in Figure 3 Brokker et all (2012) describe background noise levesl in UK wates ranging from
Doc No
Valid from Rev no
Security Classification Open - Status Final Page 8 of 25
92dBre 1 microPa (rms) under low sea state to a maximum of 132 dB re 1 microPa (rms) at sea state 3 Mean values
are at 111 to 112 dB re 1 microPa (rms) At the Hywind control site an average ambient noise level of 1215 dB re
1microPa (rms) was measured Ambient noise levels for the Tampen area are not know from direct measurements
but the area sees less traffic as the area of the Hywind control side outside Stavanger Conditions for Tampen
area assumed to be in the same range as reported by Brooker for UK waters with a mean value approximately
112 dB re 1 microPa (rms)
Fig 3 Generalised ambient noise attributable to various natural and anthropogenic noise sources (Wenz 1962)
23 Threshold values for assessing impacts
There is no regulatory framework in place on the NCS that gives requests on threshold values to be used when
assessing noise impact It is however expected to use the best available scientific knowledge
There is internationally accepted literature that defines threshold values for most of the groups of marine
organisms In this report we adhere to internationally accepted literature and guidelines and in particular to the
guidelines from NOAA (2018) giving threshold values for onset of PTS (Permanent Threshold Shift) and TTS
(Temporary Threshold Shift) PTS is an irreversible reduction in hearing sensitivity TTS is the reversible
reduction in hearing sensitivity with full recovery of hearing after exposure The NOAA guidelines work with a
so called ldquodual criteriardquo This is based on the theory that high sound pressures for impulsive sound can lead to
PTS or TTS when over a certain threshold but also sound of lower strength that is repeated frequently can
Doc No
Valid from Rev no
Security Classification Open - Status Final Page 9 of 25
lead to the same impact Dual metric thresholds using weighted cumulative sound exposure level (SELcum)
and peak sound pressure (PK) metrics for impulsive sounds As dual metrics the guidelines considers onset of
PTS to have occurred when either one of the two metrics is exceeded For non-impulsive sounds thresholds
are provided using the weighted SELcum metric where the sound energy is integrated over a 24h period
Additionally to account for the fact that different species groups use and hear sound differently marine
mammals are sub-divided into five broad hearing groups (ie LF MF HF PW and OW) (Tab1) and
thresholds in the weighted SELcum metric incorporate auditory weighting functions
Tab 1 Marine mammal hearing groups (NOAA 2018)
Doc No
Valid from Rev no
Security Classification Open - Status Final Page 10 of 25
Tab 2 Threshold values for onset of PTS as used in this report (NOAA 2018)
Tab 3 Threshold values for onset of TTS as used in this report (NOAA 2018)
The threshold criteria used in this report are in some parts more stringent than those used in the underwater
noise assessment for Hywind Scotland (Xodus 2015) This has been done because the NOAA guidelines are
Doc No
Valid from Rev no
Security Classification Open - Status Final Page 11 of 25
more recent and acknowledge the most recent literature in the field and because the NOAA guidelines are
geting increasing international attention
Threshold levels for behavioural reactions are extensively discussed in the Xodus report In this report the
same criteria are proposed (Table 4)
Table 4 Suggested marine mammal criteria for onset of disturbance (Xodus 2015)
3 Sound propagation modelling
31 Sound propagation modelling software
For sound propagation modelling the software package dBSea V 25 from Irwinn Carr consulting was used
The software uses bathymetry sediment and sound speed input data to build a 3D acoustic model of the
environment This paired with accurate sound propagation models such as dBSeaPE a Parabolic Equation
algorithm and dBSeaRay a Ray Theory algorithm make for accurate prediction of the sound propagation
Parabolic equation algorithms are known to be the most accurate for modelling low frequencies in shallow
water scenarios while ray theory algorithms deliver the best performance at higher frequencies
4 Input data sound modelling
41 Bathymetry
Bathymetry data were taken from EMODNet Bathymetry database (httpwwwemodnet-bathymetryeudata-
products) that provides bathymetry data for the area with about 100m resolution The postions of the Hywind
stucturs were taken from Hywind Tampen field layout document C219EQ-XE-00001-01 (Table 5)
Doc No
Valid from Rev no
Security Classification Open - Status Final Page 12 of 25
Table 5 Planned infrastructure coordinates for wind mill positions Please note that positions are given in
WGS84 not in ED50 as in field layout document
Fig 4 Hywind tampen placed on the bathymetry map
Name WGS84 Latitude WGS84 Longitude WGS84 UTMz31 Easting WGS84 UTMz31 Northing
HY01 61deg 21 59058 N 2deg 15 6223 E 459 99673 6 803 82959
HY02 61deg 21 12044 N 2deg 15 31773 E 460 35963 6 802 37063
HY03 61deg 20 25029 N 2deg 15 57302 E 460 72253 6 800 91167
HY04 61deg 19 38012 N 2deg 16 22809 E 461 08543 6 799 45272
HY05 61deg 18 50994 N 2deg 16 48295 E 461 44833 6 797 99376
HY06 61deg 18 3974 N 2deg 17 13760 E 461 81123 6 796 53480
HY07 61deg 18 16872 N 2deg 15 36355 E 460 36628 6 796 95000
HY08 61deg 19 3887 N 2deg 15 10846 E 460 00338 6 798 40896
HY09 61deg 19 50900 N 2deg 14 45317 E 459 64048 6 799 86792
HY10 61deg 20 37912 N 2deg 14 19766 E 459 27758 6 801 32687
HY11 61deg 21 24922 N 2deg 13 54194 E 458 91469 6 802 78583
Doc No
Valid from Rev no
Security Classification Open - Status Final Page 13 of 25
42 Sound velocity profile
Salinity temperature and pressure (depth) are the most important parameters that influence the speed of
sound in water Salinity and temperature profiles from World Ocean Database (NOAA National Centres for
Environmental Information (2005) Those data were used to calculate sound speed (Tollefsen CDS 2013)
using the following formula
c(TS z) = 14492+46T minus0055T2+00029T3
+(134minus001T)(Sminus35)+0016z
where T is the temperature in C S is the dimensionless salinity (frequently quoted as
Practical Salinity Units or PSU) and z is the depth in m From Equation 1 it is evident that the sound speed
depends most strongly on T with a weaker dependence on S and z
For each month a sound speed profile was calculated (Fig 5) Because sound is refracted towards depths of
low sound speed sound propagation differ over the seson In order to simulate sound propagation under most
different propagation conditions the sound speed profile for June and April (Fig 6)
Fig 5 Sound speed profiles representative for the area for each month For simulations sound speed profilrs
form April and June were used
Doc No
Valid from Rev no
Security Classification Open - Status Final Page 14 of 25
Fig 6 Sound speed prfiles for April (left) and July (right) as used in dBSea
For calculation of sound absorption effects in the water column average values for water temperature and
salinity for April (707decC 3513PSU) and July were used (872decC 3510PSU
43 Sea bed properties
The acoustic properties of the sea floor have influence of the amount of sound reflected from the sea floor
Bottoms with higher sound speed than the overlying water do reflect more sound back into the water column
than bottoms with lower sound speed (Ballard 2017) In this study we used information from the Equinor
ldquoHywind Tampen Substucure and Mooring System Functional requirementsrdquo report
For the model a sandy layer of 1m thickness with a sound velocity of 1650ms a density of 1900kgm and a
attenuation of 08dBwavelength as used and a clay from 1 m to infinite depth with sound velocity of 1500ms
and density of 1500kgm3 and an attenuttion of 02 dBwavelength was used
44 Sound source properties
Equinor commissioned Fugro GEOS and Jasco Applied Sciences to undertake underwater noise
measurements in the vicinity of Hywind 1 installation at a test site north-west of Stavanger Norway The
purpose of this exercise was to quantify potential underwater noise emissions form the Hywind turbines during
operation in order to inform any impact assessments what will be required for future Hywind projects
Measurements were undertaken at a test location some 150 m from the main structure and the hydrophone
was deployed at a depth of 91 m Additional background noise level readings were undertaken at a remote
control site with comparable natural environmental conditions 10 km from the Hywind test site
This measurements were used to assess noise impact for the Hywind Scotland project This study was done by
Xodus in 2015 The study by Xodus also includes suggestion on upscaling the produces sound to the
somehow bigger turbines to be used for Hywind Scotland In this study we use information from both reports for
the definition of the source strength for the sound at Hywind Tampen
441 Operational sound
Sound originating form Hywind was reported in the respective JASCO report as power spectral densities and
as 13 octave band spectral values (ref Figure 25 and Figure 38 in JASCO Measurement Report) Those data
were measured at 150m distance The Jasco report identified tonal frequencies created by the Hywind at 25Hz
and harmonics thereof with frequencies of 50 Hz and 125Hz Power spectral densities from the Jasco report
were converted to approximate sound pressure level data in third octave bins Same results as in the Xodus
report were achieved In order to get values at source spherical propagation was assumed and 435dB were
added to the values measured at 150m A 4 dB upscaling factor was used according to the suggestions made
Doc No
Valid from Rev no
Security Classification Open - Status Final Page 15 of 25
in the Xodus 2015 report A total SPL source level of 166 dB re 1microPa 1m (rms) was used for each of the
Hywwind Tampen wind turbines in the simulations
Fig 7 Spectral content of the operational noise used in the sound simulations Only those frequency bands
that show clear difference to the general ambient sound in the area are shown
Note The steps of reading out data from graphs in the Jasco report doing back calculations to source level
and the upscaling to bigger wind turbines is based on some assumptions and results in uncertainty Especially
the scaling factor of 4dB for the bigger and more powerful wind turbines is based on assumptions field
measurement on bigger floating wind turbines are not available
442 Impulsive Sound
The Hywind 1 sound study identified a transient sound measurable in the vicinity of Hywind 1 The exact origin
of this transient sound has not been identified it is assumed to be produced by tension realese in the mooring
structure It is unknown if other Hywind installations also exhibit this transient noise
This transient sound was measured above SPLpeak 160 dB re 1 microPa at a distance of 150m corresponding to
SPL of 120 to 125 dB re 1microPa The frequency of this sound extends troughout the recorded frequency range of
0-20kHz
For this study a original sound file from the Hywind I study was used for the sound source characterisation of
the snapping sound (as WAF file) This signal was scaled up to the source strength on the place of its assumed
place of origin on the shaft of the Hywind structure in 150m distance Sperical propagation laws were assumed
and 435 dB was added to the sound level measured at 150 resulting in a SPLpeak level at the source for a
individual turbine to be 203dB re 1 microPa 1m The snapping sound was reported to occur up to 23 times a
day for calculation of SEL over 24h 23 snapping events per day per wind turbine were used accumulating to
253 snapping events for all the Hywind Tampen wind turbines
There is a high uncertainty for the source strength of this transient sound mostly attributed to the unknown
position of its origin It could be stronger or weaker calculations done in this study are only a rough indication
Doc No
Valid from Rev no
Security Classification Open - Status Final Page 16 of 25
Fig 8Transient sound from Hywind expressed with relative sound pressure
Doc No
Valid from Rev no
Security Classification Open - Status Final Page 17 of 25
Fig 9 Input data for transient sound used in modelling softwareExample for HY01 Original wav file measured
at 150m distance upscaled to source level at 1 m from source
A Fast Fourier Transformation (FFT) of the sound file (Audacity V222) showed a main frequency content of
the signal between 50Hz and 10kHz (Fig 10) Lower and higher frequencies are about 10dB lower and are not
considered in the respective modelling because the contribute less than 1 to the sound energy
Doc No
Valid from Rev no
Security Classification Open - Status Final Page 18 of 25
Fig 10
45 Sound propagation solvers
Continous sound
For frequencies 125Hz to 400Hz a solver for the parabolic wave equation was used and for frequencies
above 400 Hz a solver for ray tracing Frequency for simulations was 125Hz to 16kHz
Specific settings for parabolic wave equation an ray tracer solver in dBSea are given in appendix X
Impulsive sound
For calculation of SEL A ray tracer was used throughout the frequency spectrum Frequency spectrum was
315Hz to 125kHz For calculation of SPL a split solver with parabolic wave equation up to 400Hz and a ray
tracer for higher frequencies
Doc No
Valid from Rev no
Security Classification Open - Status Final Page 19 of 25
5 Results
51 Continuous sound SPL
The sound velocity profile used for the April and July simulations resulted in less propagation loss at distances
from the sound sources for the April simulations (better propagation conditions) differences are relatively small
(Fig11) Because of this we use the simulation for April for the further assessment
Fig 11 Sound pressure levels SPLpeak for April and July simulation Highest level from all depth projected to
the surface
Doc No
Valid from Rev no
Security Classification Open - Status Final Page 20 of 25
Fig 12 Sound pressure levels SPLpeak for April across positions HY4 and HY8 (position of transect in insert)
Sound propagation around each wind turbine is almost circular with a slightly better propagation into the north-
east direction where the water depth increases Sound propagation is also fairly uniform at different water
depth (Fig 12) with a slightly reduced sound strength at the surface
In the risk assessment for possible impacts it is always the distance of the highest value that is considered and
all graphical displays show the highest value projected to the surface
If a non-impulsive sound has the potential of exceeding the peak sound pressure level threshold associates
with impulsive sound (Table 2) these tresholds are recommended for consideration according to the NOAA
guedelines
For the Hywind Tampen continuous sound none of the sound pressure thresholds for injury are
exceeded
The threshold for behavioural reaction of SPL 160 db re 1 microPa is not exceeded at any distance to the wind
turbines The lower threshold limit of SPL 120 dB re 1 microPa is about at 2000m distance to the wind mills (Fig
13) Ambient sound SPL in the area is about 112dB re 1microPa in average and 132dB re microPa at noisy days The
the indicated distance to the 120dB isopleth is also showing the audible distance at a days above average
ambient sound On days with average ambient sound levels the noise from Hywind Tampen will be audible to
animals at about 4km
Doc No
Valid from Rev no
Security Classification Open - Status Final Page 21 of 25
Fig 13 Isopleth of the 120dB re 1 microPa threshold limit for behavioural disturbance (Table 4) around the Hywind
Tampen windmills
52 Continuous sound SEL
Sound exposure patterns follow the spatial pattern for sound pressure for the unweighted SEL calculations (Fig
14 SELcum24h unweighted) There are very small differences in the sound propagation when SEL weighted
functions are use because different frequencies propagate different
Unweighted SEL and weighted SEL for all species groups from Table 2 are shown in Fig 14
Doc No
Valid from Rev no
Security Classification Open - Status Final Page 22 of 25
Fig14 Weighted SEL values for groups of marine mammals according to table 6
Table 6 NOAA risk critaria for marine mammals and relevant distances for threshold values NA shows that the
respective threshold value is not exceeded
NOAA criteria Project LE = SELcum re 1 microPa
2s
Hywind Tampen operational sound
Hearing group
range
(average)
(m)
range
max (km)
PTS Onset Threshold levels non impulsive sound
Low-Frequency (LF) Cetaceans LEp LF24h 199 dB NA NA
Mid-Frequency (MF) Cetaceans LEp MF24h 198 dB NA NA
High-Frequency (HF) Cetaceans LEp HF24h 173 dB NA NA
Phocoid Pinnipeds (PW) LEpPW24h 201 dB NA NA
Otariid Pinnipeds (OW) LEp OW24h 219 dB NA NA
TTS onset thresholds for non-impulsive sounds
Low-Frequency (LF) Cetaceans LEp LF24h 179 dB 45 52
Mid-Frequency (MF) Cetaceans LEp MF24h 178 dB NA NA
High-Frequency (HF) Cetaceans LEp HF24h 153 dB NA NA
Phocoid Pinnipeds (PW) LEpPW24h 181 dB NA NA
Otariid Pinnipeds (OW) LEp OW24h 199 dB NA NA
Doc No
Valid from Rev no
Security Classification Open - Status Final Page 23 of 25
53 Transient sound (snapping sound)
The SPLpeak at the source is with 203dB re 1 microPa just above the PTS threshold limit for high frequency
cetaceans but will drop below this threshold at a short distance (around 1 meter) to the source It is well below
threshold limits for single and multiple impulses suggested by Southall (2007) This peak value corresponds to
a SPL of 173dB re 1 microPa this is below the threshold limit for injury but above the threshold values for
behavioural disturbance of 160 dB re 1 microPa (strong reaction) and 140dB re microPa (mild reaction) The 140dB
threshold limit for weak reaction would be exceeded at distances below 160m those for the 160dB threshold
for strong reaction at 16m form the source It again has to be stressed that the available information on the
origin of the transient sound only allows a coarse estimate
Fig 15 SPL around a single turbine with indication of threshold limit for mild behavioural reaction to marine
mammals Average distance to the SPL 140 dB re 1microPa isopleth is 160m those to the SPL 160 dB re 1 microPa
isopleth is about 8m
The SELcum24h values also stay below the threshold levels for injury (Fig 16) for all groups of marine mammals
Doc No
Valid from Rev no
Security Classification Open - Status Final Page 24 of 25
Fig 16 SELcum 24 of this transient sound as unweighted and weighted SELcum24h shows that the threshold
limits for injury are not exceeded at any distance to the wind tubines
6 Risk evaluation of sound originating from Hywind Tampen windturbines
61 Continous sound evaluated on SPL and SEL metrics
The threshold limits for injury (PTS and TTS) are not exceeded in the vicinity of Hywind Tampen wind turbines
except those for low frequency cetaceans where the respective SEL threshold limit is exceeded within a radius
of 52m around each individual wind turbine This however does not pose a risk to marine mammals In order to
receiveobserve this threshold limit an animal from the group of the low frequency cetaceans has to be present
within this zone for 24hours The probability that this happens is almost zero An actively movingmigrating
animal will pass this zone within a few seconds and even a none moving animal drifting with the currents will
only be exposed for a short time The ambient noise in the area is estimated to about 112 dB re 1 microPa SPL
this means the sound created by Hywind turbines is on average not audible to marine mammals beyond a
distance of 4km
The overall risk for marine mammals from continuous sound form Hywind Tampen during operations is
evaluated as non existing
62 Transient sound
Risk assessment for the transient is based on many assumptions related to the origin of the sound and the
strength of the sound on it source It is further not established if this so called ldquosnappingrdquo sound is an inherent
property of the Hywind design or if it is a property only be found on the Hywind 1
Risk assessment is included in this study because the strength of the snapping sound is close to some of the
threshold values (SPL 180dB re 1 microPa for harassment B definition) and needs consideration in case it is an
Doc No
Valid from Rev no
Security Classification Open - Status Final Page 25 of 25
inherent property of the Hywind design It is highly recommended to verify the presence or absence of this
feature on the Hywind Scotland installation In case of absence this risk assessment has not to be repeated for
future Hywind installations
The risk is however evaluated as low in general Higher sound pressures can only be expected very close to
the sound source and the the probability of being close to the source of the transient sound is small for any
marine mammal The sound energy animals would be exposed to if staying in the are for a longer period is
also relatively low and does not pose a risk It can not be expected that animals stay for 24hours in the area
and even if they the received sound energy is below any threshold levels for injury Behavioural reactions can
be expected at relatively close distances to the wind turbines eg avoiding Though it is not expected that this
has negative impact on individuals or populations of marine mammals
Overall the risk for marine mammals originating from the transient sound is evaluated as non-existing
Due to the risk of formally exceeding some threshold levels for the transient sound it is recommended to do
sound measurements at newer Hywind installations eg in Scotland to find out if the new design of the
mooring creates similar sound or not
7 Appendix
JASCO 2011 Hywind Acoustic Measurement Report Jasco Report NO 00229
Xodus 2015 Technical Note on Underwater Noise A-100142-S20-TECH-001
NOAA (2018) 2018 Revision to Technical Guidance for Assessing the Effects of Anthropogenic Sound on
Marine Mammal Hearing (Version 2) httpswwwfisheriesnoaagovnationalmarine-mammal-
protectionmarine-mammal-acoustic-technical-guidance
Tollefsen Christina D S (2013) Reccomendations for calculatintg sound speed profiles from field data
Defence RampD Canada Atlantic Technical1048577Memorandum DRDC Atlantic TM 2013-156
Ballard MS and Lee Kevin M2017 The Acoustics of Marine Sediments Acoustics Today volume 13 issue 3
Fall 2017
Doc No
Valid from Rev no
Security Classification Open - Status Final Page 5 of 25
Table of contents
1 Introduction 6
2 Underwater noise 6
21 Acoustic concepts and terminology 6
22 Baseline noise 7
23 Threshold values for assessing impacts 8
3 Sound propagation modelling 11
31 Sound propagation modelling software 11
4 Input data sound modelling 11
41 Bathymetry 11
42 Sound velocity profile 13
43 Sea bed properties 14
44 Sound source propertiesa 14
441 Operational sound 14
442 Impulsive Sound 15
45 Sound propagation solvers 18
5 Results 19
51 Continuous sound SPL 19
52 Continuous sound SEL 21
53 Transient sound (snapping sound) 23
6 Risk evaluation of sound originating from Hywind Tampen windturbines 24
61 Continous sound evaluated on SPL and SEL metrics 24
62 Transient sound 24
7 Appendix 25
Doc No
Valid from Rev no
Security Classification Open - Status Final Page 6 of 25
1 Introduction
FT SST ERO has been commissioned to undertake an underwater noise impact assessment for Hywind
Tampen
Hywind Tampen Windfarm is planned to be installed between Snorre and Gullfaks oil field and will consist of 11
x 84MW floating wind turbines
Fig 1 Schematic overview over location of Hywind Tampen Windpark in the Norwegian Sea
In relation to noise there are several issues to review This is underwater noise during construction caused by
increased activity of ships in the area and by some special activities like installations of anchors and
infrastructure and noise created by the floating windmills during operation The current report only assesses
the noise that originates from the wind mill structure during operations The noise during construction does not
differ substantially from other marine activities typical for offshore industry Noise created during installation is
also much less than for wind farms installations where impact piling is used and the impact statement for
Hywind Scotland concluded that this impact is negligible and will therefor not be part of this assessment
During operation of the wind mills wind park two kinds of noise is created continuous noise crated by rotating
parts of the windmill that is then propagated from the floating shaft into the water and transient noise that has
been identified at Hywind Pilot This noise most probably comes from the anchor chains cables and
connections
At Hywind Pilot located outside of Stavanger sound has been measured from end of March 2011 to end to
mid of August 2011and reported by JASCO This data set has been assessed by Xodus for the bigger Hywind
windmills at Hywind Scotland In this report we use information from both reports for assessing the noise
impact at Hywind Tampen
2 Underwater noise
21 Acoustic concepts and terminology
Sound travels through the water as vibrations of the fluid particles in a series of pressure waves The waves
comprise a series of alternating compressions (positive pressure variations) and rarefactions (negative
pressure fluctuations) Because sound consists of variations in pressure the unit for measuring sound is
Doc No
Valid from Rev no
Security Classification Open - Status Final Page 7 of 25
usually referenced to a unit of pressure the Pascal (Pa) The unit usually used to describe sound is the decibel
(dB) and in the case of underwater sound the reference unit is taken as 1 μPa
Fig 2 Graphical representation of acoustic wave descriptors
There are multiple ways to report sound levels We will adhere to the ISO standard 184052017 and
recommendations given by NOAA using the following metrics and units
SPL Sound Pressure Levels RMS Applicable to continuous sounds (dB re 1 microPa)
SPLpeak Lp Sound Pressure Level zero to peak Applicaple to continuous sound exposure (dB re 1
microPa)
SELcum24h also LE Sound Exposure Level cumulated over 24h (dB re 1 microPa2 s)
dBSL Source Level This is the sound pressure level of an equivalent point source as measured at
one meter distance can be expressed as SPL SPLpeak or SEL (re 1 microPa m re 1 microPa2 s m)
22 Baseline noise
Background or ldquoambientrdquo underwater noise is generated by a number of natural sources such as rain breaking
waves wind at the surface seismic noise biological noise and thermal noise Biological sources include
marine mammals (which use sound to communicate build up an image of their environment and detect prey
and predators) as well as certain fish and shrimp Anthropogenic sources also add to the background noise
such as fishing boats ships industrial noise seismic surveys and leisure activities Generalised ambient noise
levels in the oceans has been described by Wenz 1962 spectra attributable to various noise sources (Wenz
1962) are shown in Figure 3 Brokker et all (2012) describe background noise levesl in UK wates ranging from
Doc No
Valid from Rev no
Security Classification Open - Status Final Page 8 of 25
92dBre 1 microPa (rms) under low sea state to a maximum of 132 dB re 1 microPa (rms) at sea state 3 Mean values
are at 111 to 112 dB re 1 microPa (rms) At the Hywind control site an average ambient noise level of 1215 dB re
1microPa (rms) was measured Ambient noise levels for the Tampen area are not know from direct measurements
but the area sees less traffic as the area of the Hywind control side outside Stavanger Conditions for Tampen
area assumed to be in the same range as reported by Brooker for UK waters with a mean value approximately
112 dB re 1 microPa (rms)
Fig 3 Generalised ambient noise attributable to various natural and anthropogenic noise sources (Wenz 1962)
23 Threshold values for assessing impacts
There is no regulatory framework in place on the NCS that gives requests on threshold values to be used when
assessing noise impact It is however expected to use the best available scientific knowledge
There is internationally accepted literature that defines threshold values for most of the groups of marine
organisms In this report we adhere to internationally accepted literature and guidelines and in particular to the
guidelines from NOAA (2018) giving threshold values for onset of PTS (Permanent Threshold Shift) and TTS
(Temporary Threshold Shift) PTS is an irreversible reduction in hearing sensitivity TTS is the reversible
reduction in hearing sensitivity with full recovery of hearing after exposure The NOAA guidelines work with a
so called ldquodual criteriardquo This is based on the theory that high sound pressures for impulsive sound can lead to
PTS or TTS when over a certain threshold but also sound of lower strength that is repeated frequently can
Doc No
Valid from Rev no
Security Classification Open - Status Final Page 9 of 25
lead to the same impact Dual metric thresholds using weighted cumulative sound exposure level (SELcum)
and peak sound pressure (PK) metrics for impulsive sounds As dual metrics the guidelines considers onset of
PTS to have occurred when either one of the two metrics is exceeded For non-impulsive sounds thresholds
are provided using the weighted SELcum metric where the sound energy is integrated over a 24h period
Additionally to account for the fact that different species groups use and hear sound differently marine
mammals are sub-divided into five broad hearing groups (ie LF MF HF PW and OW) (Tab1) and
thresholds in the weighted SELcum metric incorporate auditory weighting functions
Tab 1 Marine mammal hearing groups (NOAA 2018)
Doc No
Valid from Rev no
Security Classification Open - Status Final Page 10 of 25
Tab 2 Threshold values for onset of PTS as used in this report (NOAA 2018)
Tab 3 Threshold values for onset of TTS as used in this report (NOAA 2018)
The threshold criteria used in this report are in some parts more stringent than those used in the underwater
noise assessment for Hywind Scotland (Xodus 2015) This has been done because the NOAA guidelines are
Doc No
Valid from Rev no
Security Classification Open - Status Final Page 11 of 25
more recent and acknowledge the most recent literature in the field and because the NOAA guidelines are
geting increasing international attention
Threshold levels for behavioural reactions are extensively discussed in the Xodus report In this report the
same criteria are proposed (Table 4)
Table 4 Suggested marine mammal criteria for onset of disturbance (Xodus 2015)
3 Sound propagation modelling
31 Sound propagation modelling software
For sound propagation modelling the software package dBSea V 25 from Irwinn Carr consulting was used
The software uses bathymetry sediment and sound speed input data to build a 3D acoustic model of the
environment This paired with accurate sound propagation models such as dBSeaPE a Parabolic Equation
algorithm and dBSeaRay a Ray Theory algorithm make for accurate prediction of the sound propagation
Parabolic equation algorithms are known to be the most accurate for modelling low frequencies in shallow
water scenarios while ray theory algorithms deliver the best performance at higher frequencies
4 Input data sound modelling
41 Bathymetry
Bathymetry data were taken from EMODNet Bathymetry database (httpwwwemodnet-bathymetryeudata-
products) that provides bathymetry data for the area with about 100m resolution The postions of the Hywind
stucturs were taken from Hywind Tampen field layout document C219EQ-XE-00001-01 (Table 5)
Doc No
Valid from Rev no
Security Classification Open - Status Final Page 12 of 25
Table 5 Planned infrastructure coordinates for wind mill positions Please note that positions are given in
WGS84 not in ED50 as in field layout document
Fig 4 Hywind tampen placed on the bathymetry map
Name WGS84 Latitude WGS84 Longitude WGS84 UTMz31 Easting WGS84 UTMz31 Northing
HY01 61deg 21 59058 N 2deg 15 6223 E 459 99673 6 803 82959
HY02 61deg 21 12044 N 2deg 15 31773 E 460 35963 6 802 37063
HY03 61deg 20 25029 N 2deg 15 57302 E 460 72253 6 800 91167
HY04 61deg 19 38012 N 2deg 16 22809 E 461 08543 6 799 45272
HY05 61deg 18 50994 N 2deg 16 48295 E 461 44833 6 797 99376
HY06 61deg 18 3974 N 2deg 17 13760 E 461 81123 6 796 53480
HY07 61deg 18 16872 N 2deg 15 36355 E 460 36628 6 796 95000
HY08 61deg 19 3887 N 2deg 15 10846 E 460 00338 6 798 40896
HY09 61deg 19 50900 N 2deg 14 45317 E 459 64048 6 799 86792
HY10 61deg 20 37912 N 2deg 14 19766 E 459 27758 6 801 32687
HY11 61deg 21 24922 N 2deg 13 54194 E 458 91469 6 802 78583
Doc No
Valid from Rev no
Security Classification Open - Status Final Page 13 of 25
42 Sound velocity profile
Salinity temperature and pressure (depth) are the most important parameters that influence the speed of
sound in water Salinity and temperature profiles from World Ocean Database (NOAA National Centres for
Environmental Information (2005) Those data were used to calculate sound speed (Tollefsen CDS 2013)
using the following formula
c(TS z) = 14492+46T minus0055T2+00029T3
+(134minus001T)(Sminus35)+0016z
where T is the temperature in C S is the dimensionless salinity (frequently quoted as
Practical Salinity Units or PSU) and z is the depth in m From Equation 1 it is evident that the sound speed
depends most strongly on T with a weaker dependence on S and z
For each month a sound speed profile was calculated (Fig 5) Because sound is refracted towards depths of
low sound speed sound propagation differ over the seson In order to simulate sound propagation under most
different propagation conditions the sound speed profile for June and April (Fig 6)
Fig 5 Sound speed profiles representative for the area for each month For simulations sound speed profilrs
form April and June were used
Doc No
Valid from Rev no
Security Classification Open - Status Final Page 14 of 25
Fig 6 Sound speed prfiles for April (left) and July (right) as used in dBSea
For calculation of sound absorption effects in the water column average values for water temperature and
salinity for April (707decC 3513PSU) and July were used (872decC 3510PSU
43 Sea bed properties
The acoustic properties of the sea floor have influence of the amount of sound reflected from the sea floor
Bottoms with higher sound speed than the overlying water do reflect more sound back into the water column
than bottoms with lower sound speed (Ballard 2017) In this study we used information from the Equinor
ldquoHywind Tampen Substucure and Mooring System Functional requirementsrdquo report
For the model a sandy layer of 1m thickness with a sound velocity of 1650ms a density of 1900kgm and a
attenuation of 08dBwavelength as used and a clay from 1 m to infinite depth with sound velocity of 1500ms
and density of 1500kgm3 and an attenuttion of 02 dBwavelength was used
44 Sound source properties
Equinor commissioned Fugro GEOS and Jasco Applied Sciences to undertake underwater noise
measurements in the vicinity of Hywind 1 installation at a test site north-west of Stavanger Norway The
purpose of this exercise was to quantify potential underwater noise emissions form the Hywind turbines during
operation in order to inform any impact assessments what will be required for future Hywind projects
Measurements were undertaken at a test location some 150 m from the main structure and the hydrophone
was deployed at a depth of 91 m Additional background noise level readings were undertaken at a remote
control site with comparable natural environmental conditions 10 km from the Hywind test site
This measurements were used to assess noise impact for the Hywind Scotland project This study was done by
Xodus in 2015 The study by Xodus also includes suggestion on upscaling the produces sound to the
somehow bigger turbines to be used for Hywind Scotland In this study we use information from both reports for
the definition of the source strength for the sound at Hywind Tampen
441 Operational sound
Sound originating form Hywind was reported in the respective JASCO report as power spectral densities and
as 13 octave band spectral values (ref Figure 25 and Figure 38 in JASCO Measurement Report) Those data
were measured at 150m distance The Jasco report identified tonal frequencies created by the Hywind at 25Hz
and harmonics thereof with frequencies of 50 Hz and 125Hz Power spectral densities from the Jasco report
were converted to approximate sound pressure level data in third octave bins Same results as in the Xodus
report were achieved In order to get values at source spherical propagation was assumed and 435dB were
added to the values measured at 150m A 4 dB upscaling factor was used according to the suggestions made
Doc No
Valid from Rev no
Security Classification Open - Status Final Page 15 of 25
in the Xodus 2015 report A total SPL source level of 166 dB re 1microPa 1m (rms) was used for each of the
Hywwind Tampen wind turbines in the simulations
Fig 7 Spectral content of the operational noise used in the sound simulations Only those frequency bands
that show clear difference to the general ambient sound in the area are shown
Note The steps of reading out data from graphs in the Jasco report doing back calculations to source level
and the upscaling to bigger wind turbines is based on some assumptions and results in uncertainty Especially
the scaling factor of 4dB for the bigger and more powerful wind turbines is based on assumptions field
measurement on bigger floating wind turbines are not available
442 Impulsive Sound
The Hywind 1 sound study identified a transient sound measurable in the vicinity of Hywind 1 The exact origin
of this transient sound has not been identified it is assumed to be produced by tension realese in the mooring
structure It is unknown if other Hywind installations also exhibit this transient noise
This transient sound was measured above SPLpeak 160 dB re 1 microPa at a distance of 150m corresponding to
SPL of 120 to 125 dB re 1microPa The frequency of this sound extends troughout the recorded frequency range of
0-20kHz
For this study a original sound file from the Hywind I study was used for the sound source characterisation of
the snapping sound (as WAF file) This signal was scaled up to the source strength on the place of its assumed
place of origin on the shaft of the Hywind structure in 150m distance Sperical propagation laws were assumed
and 435 dB was added to the sound level measured at 150 resulting in a SPLpeak level at the source for a
individual turbine to be 203dB re 1 microPa 1m The snapping sound was reported to occur up to 23 times a
day for calculation of SEL over 24h 23 snapping events per day per wind turbine were used accumulating to
253 snapping events for all the Hywind Tampen wind turbines
There is a high uncertainty for the source strength of this transient sound mostly attributed to the unknown
position of its origin It could be stronger or weaker calculations done in this study are only a rough indication
Doc No
Valid from Rev no
Security Classification Open - Status Final Page 16 of 25
Fig 8Transient sound from Hywind expressed with relative sound pressure
Doc No
Valid from Rev no
Security Classification Open - Status Final Page 17 of 25
Fig 9 Input data for transient sound used in modelling softwareExample for HY01 Original wav file measured
at 150m distance upscaled to source level at 1 m from source
A Fast Fourier Transformation (FFT) of the sound file (Audacity V222) showed a main frequency content of
the signal between 50Hz and 10kHz (Fig 10) Lower and higher frequencies are about 10dB lower and are not
considered in the respective modelling because the contribute less than 1 to the sound energy
Doc No
Valid from Rev no
Security Classification Open - Status Final Page 18 of 25
Fig 10
45 Sound propagation solvers
Continous sound
For frequencies 125Hz to 400Hz a solver for the parabolic wave equation was used and for frequencies
above 400 Hz a solver for ray tracing Frequency for simulations was 125Hz to 16kHz
Specific settings for parabolic wave equation an ray tracer solver in dBSea are given in appendix X
Impulsive sound
For calculation of SEL A ray tracer was used throughout the frequency spectrum Frequency spectrum was
315Hz to 125kHz For calculation of SPL a split solver with parabolic wave equation up to 400Hz and a ray
tracer for higher frequencies
Doc No
Valid from Rev no
Security Classification Open - Status Final Page 19 of 25
5 Results
51 Continuous sound SPL
The sound velocity profile used for the April and July simulations resulted in less propagation loss at distances
from the sound sources for the April simulations (better propagation conditions) differences are relatively small
(Fig11) Because of this we use the simulation for April for the further assessment
Fig 11 Sound pressure levels SPLpeak for April and July simulation Highest level from all depth projected to
the surface
Doc No
Valid from Rev no
Security Classification Open - Status Final Page 20 of 25
Fig 12 Sound pressure levels SPLpeak for April across positions HY4 and HY8 (position of transect in insert)
Sound propagation around each wind turbine is almost circular with a slightly better propagation into the north-
east direction where the water depth increases Sound propagation is also fairly uniform at different water
depth (Fig 12) with a slightly reduced sound strength at the surface
In the risk assessment for possible impacts it is always the distance of the highest value that is considered and
all graphical displays show the highest value projected to the surface
If a non-impulsive sound has the potential of exceeding the peak sound pressure level threshold associates
with impulsive sound (Table 2) these tresholds are recommended for consideration according to the NOAA
guedelines
For the Hywind Tampen continuous sound none of the sound pressure thresholds for injury are
exceeded
The threshold for behavioural reaction of SPL 160 db re 1 microPa is not exceeded at any distance to the wind
turbines The lower threshold limit of SPL 120 dB re 1 microPa is about at 2000m distance to the wind mills (Fig
13) Ambient sound SPL in the area is about 112dB re 1microPa in average and 132dB re microPa at noisy days The
the indicated distance to the 120dB isopleth is also showing the audible distance at a days above average
ambient sound On days with average ambient sound levels the noise from Hywind Tampen will be audible to
animals at about 4km
Doc No
Valid from Rev no
Security Classification Open - Status Final Page 21 of 25
Fig 13 Isopleth of the 120dB re 1 microPa threshold limit for behavioural disturbance (Table 4) around the Hywind
Tampen windmills
52 Continuous sound SEL
Sound exposure patterns follow the spatial pattern for sound pressure for the unweighted SEL calculations (Fig
14 SELcum24h unweighted) There are very small differences in the sound propagation when SEL weighted
functions are use because different frequencies propagate different
Unweighted SEL and weighted SEL for all species groups from Table 2 are shown in Fig 14
Doc No
Valid from Rev no
Security Classification Open - Status Final Page 22 of 25
Fig14 Weighted SEL values for groups of marine mammals according to table 6
Table 6 NOAA risk critaria for marine mammals and relevant distances for threshold values NA shows that the
respective threshold value is not exceeded
NOAA criteria Project LE = SELcum re 1 microPa
2s
Hywind Tampen operational sound
Hearing group
range
(average)
(m)
range
max (km)
PTS Onset Threshold levels non impulsive sound
Low-Frequency (LF) Cetaceans LEp LF24h 199 dB NA NA
Mid-Frequency (MF) Cetaceans LEp MF24h 198 dB NA NA
High-Frequency (HF) Cetaceans LEp HF24h 173 dB NA NA
Phocoid Pinnipeds (PW) LEpPW24h 201 dB NA NA
Otariid Pinnipeds (OW) LEp OW24h 219 dB NA NA
TTS onset thresholds for non-impulsive sounds
Low-Frequency (LF) Cetaceans LEp LF24h 179 dB 45 52
Mid-Frequency (MF) Cetaceans LEp MF24h 178 dB NA NA
High-Frequency (HF) Cetaceans LEp HF24h 153 dB NA NA
Phocoid Pinnipeds (PW) LEpPW24h 181 dB NA NA
Otariid Pinnipeds (OW) LEp OW24h 199 dB NA NA
Doc No
Valid from Rev no
Security Classification Open - Status Final Page 23 of 25
53 Transient sound (snapping sound)
The SPLpeak at the source is with 203dB re 1 microPa just above the PTS threshold limit for high frequency
cetaceans but will drop below this threshold at a short distance (around 1 meter) to the source It is well below
threshold limits for single and multiple impulses suggested by Southall (2007) This peak value corresponds to
a SPL of 173dB re 1 microPa this is below the threshold limit for injury but above the threshold values for
behavioural disturbance of 160 dB re 1 microPa (strong reaction) and 140dB re microPa (mild reaction) The 140dB
threshold limit for weak reaction would be exceeded at distances below 160m those for the 160dB threshold
for strong reaction at 16m form the source It again has to be stressed that the available information on the
origin of the transient sound only allows a coarse estimate
Fig 15 SPL around a single turbine with indication of threshold limit for mild behavioural reaction to marine
mammals Average distance to the SPL 140 dB re 1microPa isopleth is 160m those to the SPL 160 dB re 1 microPa
isopleth is about 8m
The SELcum24h values also stay below the threshold levels for injury (Fig 16) for all groups of marine mammals
Doc No
Valid from Rev no
Security Classification Open - Status Final Page 24 of 25
Fig 16 SELcum 24 of this transient sound as unweighted and weighted SELcum24h shows that the threshold
limits for injury are not exceeded at any distance to the wind tubines
6 Risk evaluation of sound originating from Hywind Tampen windturbines
61 Continous sound evaluated on SPL and SEL metrics
The threshold limits for injury (PTS and TTS) are not exceeded in the vicinity of Hywind Tampen wind turbines
except those for low frequency cetaceans where the respective SEL threshold limit is exceeded within a radius
of 52m around each individual wind turbine This however does not pose a risk to marine mammals In order to
receiveobserve this threshold limit an animal from the group of the low frequency cetaceans has to be present
within this zone for 24hours The probability that this happens is almost zero An actively movingmigrating
animal will pass this zone within a few seconds and even a none moving animal drifting with the currents will
only be exposed for a short time The ambient noise in the area is estimated to about 112 dB re 1 microPa SPL
this means the sound created by Hywind turbines is on average not audible to marine mammals beyond a
distance of 4km
The overall risk for marine mammals from continuous sound form Hywind Tampen during operations is
evaluated as non existing
62 Transient sound
Risk assessment for the transient is based on many assumptions related to the origin of the sound and the
strength of the sound on it source It is further not established if this so called ldquosnappingrdquo sound is an inherent
property of the Hywind design or if it is a property only be found on the Hywind 1
Risk assessment is included in this study because the strength of the snapping sound is close to some of the
threshold values (SPL 180dB re 1 microPa for harassment B definition) and needs consideration in case it is an
Doc No
Valid from Rev no
Security Classification Open - Status Final Page 25 of 25
inherent property of the Hywind design It is highly recommended to verify the presence or absence of this
feature on the Hywind Scotland installation In case of absence this risk assessment has not to be repeated for
future Hywind installations
The risk is however evaluated as low in general Higher sound pressures can only be expected very close to
the sound source and the the probability of being close to the source of the transient sound is small for any
marine mammal The sound energy animals would be exposed to if staying in the are for a longer period is
also relatively low and does not pose a risk It can not be expected that animals stay for 24hours in the area
and even if they the received sound energy is below any threshold levels for injury Behavioural reactions can
be expected at relatively close distances to the wind turbines eg avoiding Though it is not expected that this
has negative impact on individuals or populations of marine mammals
Overall the risk for marine mammals originating from the transient sound is evaluated as non-existing
Due to the risk of formally exceeding some threshold levels for the transient sound it is recommended to do
sound measurements at newer Hywind installations eg in Scotland to find out if the new design of the
mooring creates similar sound or not
7 Appendix
JASCO 2011 Hywind Acoustic Measurement Report Jasco Report NO 00229
Xodus 2015 Technical Note on Underwater Noise A-100142-S20-TECH-001
NOAA (2018) 2018 Revision to Technical Guidance for Assessing the Effects of Anthropogenic Sound on
Marine Mammal Hearing (Version 2) httpswwwfisheriesnoaagovnationalmarine-mammal-
protectionmarine-mammal-acoustic-technical-guidance
Tollefsen Christina D S (2013) Reccomendations for calculatintg sound speed profiles from field data
Defence RampD Canada Atlantic Technical1048577Memorandum DRDC Atlantic TM 2013-156
Ballard MS and Lee Kevin M2017 The Acoustics of Marine Sediments Acoustics Today volume 13 issue 3
Fall 2017
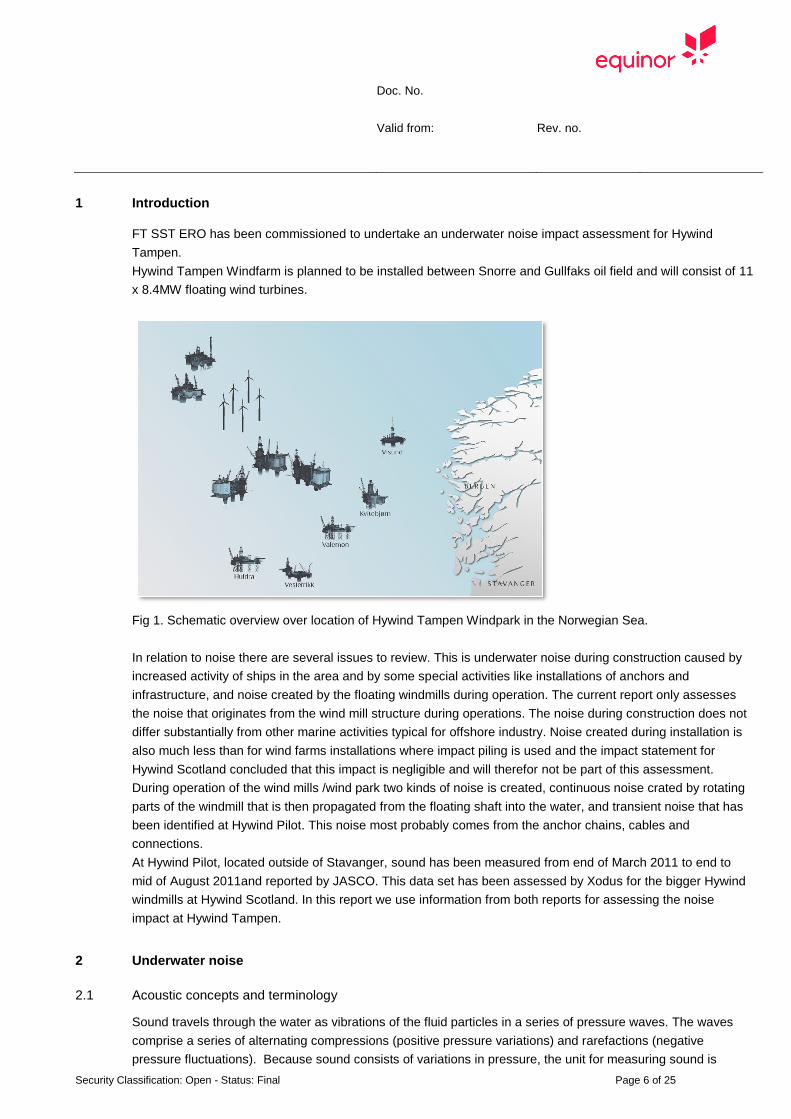
Doc No
Valid from Rev no
Security Classification Open - Status Final Page 6 of 25
1 Introduction
FT SST ERO has been commissioned to undertake an underwater noise impact assessment for Hywind
Tampen
Hywind Tampen Windfarm is planned to be installed between Snorre and Gullfaks oil field and will consist of 11
x 84MW floating wind turbines
Fig 1 Schematic overview over location of Hywind Tampen Windpark in the Norwegian Sea
In relation to noise there are several issues to review This is underwater noise during construction caused by
increased activity of ships in the area and by some special activities like installations of anchors and
infrastructure and noise created by the floating windmills during operation The current report only assesses
the noise that originates from the wind mill structure during operations The noise during construction does not
differ substantially from other marine activities typical for offshore industry Noise created during installation is
also much less than for wind farms installations where impact piling is used and the impact statement for
Hywind Scotland concluded that this impact is negligible and will therefor not be part of this assessment
During operation of the wind mills wind park two kinds of noise is created continuous noise crated by rotating
parts of the windmill that is then propagated from the floating shaft into the water and transient noise that has
been identified at Hywind Pilot This noise most probably comes from the anchor chains cables and
connections
At Hywind Pilot located outside of Stavanger sound has been measured from end of March 2011 to end to
mid of August 2011and reported by JASCO This data set has been assessed by Xodus for the bigger Hywind
windmills at Hywind Scotland In this report we use information from both reports for assessing the noise
impact at Hywind Tampen
2 Underwater noise
21 Acoustic concepts and terminology
Sound travels through the water as vibrations of the fluid particles in a series of pressure waves The waves
comprise a series of alternating compressions (positive pressure variations) and rarefactions (negative
pressure fluctuations) Because sound consists of variations in pressure the unit for measuring sound is
Doc No
Valid from Rev no
Security Classification Open - Status Final Page 7 of 25
usually referenced to a unit of pressure the Pascal (Pa) The unit usually used to describe sound is the decibel
(dB) and in the case of underwater sound the reference unit is taken as 1 μPa
Fig 2 Graphical representation of acoustic wave descriptors
There are multiple ways to report sound levels We will adhere to the ISO standard 184052017 and
recommendations given by NOAA using the following metrics and units
SPL Sound Pressure Levels RMS Applicable to continuous sounds (dB re 1 microPa)
SPLpeak Lp Sound Pressure Level zero to peak Applicaple to continuous sound exposure (dB re 1
microPa)
SELcum24h also LE Sound Exposure Level cumulated over 24h (dB re 1 microPa2 s)
dBSL Source Level This is the sound pressure level of an equivalent point source as measured at
one meter distance can be expressed as SPL SPLpeak or SEL (re 1 microPa m re 1 microPa2 s m)
22 Baseline noise
Background or ldquoambientrdquo underwater noise is generated by a number of natural sources such as rain breaking
waves wind at the surface seismic noise biological noise and thermal noise Biological sources include
marine mammals (which use sound to communicate build up an image of their environment and detect prey
and predators) as well as certain fish and shrimp Anthropogenic sources also add to the background noise
such as fishing boats ships industrial noise seismic surveys and leisure activities Generalised ambient noise
levels in the oceans has been described by Wenz 1962 spectra attributable to various noise sources (Wenz
1962) are shown in Figure 3 Brokker et all (2012) describe background noise levesl in UK wates ranging from
Doc No
Valid from Rev no
Security Classification Open - Status Final Page 8 of 25
92dBre 1 microPa (rms) under low sea state to a maximum of 132 dB re 1 microPa (rms) at sea state 3 Mean values
are at 111 to 112 dB re 1 microPa (rms) At the Hywind control site an average ambient noise level of 1215 dB re
1microPa (rms) was measured Ambient noise levels for the Tampen area are not know from direct measurements
but the area sees less traffic as the area of the Hywind control side outside Stavanger Conditions for Tampen
area assumed to be in the same range as reported by Brooker for UK waters with a mean value approximately
112 dB re 1 microPa (rms)
Fig 3 Generalised ambient noise attributable to various natural and anthropogenic noise sources (Wenz 1962)
23 Threshold values for assessing impacts
There is no regulatory framework in place on the NCS that gives requests on threshold values to be used when
assessing noise impact It is however expected to use the best available scientific knowledge
There is internationally accepted literature that defines threshold values for most of the groups of marine
organisms In this report we adhere to internationally accepted literature and guidelines and in particular to the
guidelines from NOAA (2018) giving threshold values for onset of PTS (Permanent Threshold Shift) and TTS
(Temporary Threshold Shift) PTS is an irreversible reduction in hearing sensitivity TTS is the reversible
reduction in hearing sensitivity with full recovery of hearing after exposure The NOAA guidelines work with a
so called ldquodual criteriardquo This is based on the theory that high sound pressures for impulsive sound can lead to
PTS or TTS when over a certain threshold but also sound of lower strength that is repeated frequently can
Doc No
Valid from Rev no
Security Classification Open - Status Final Page 9 of 25
lead to the same impact Dual metric thresholds using weighted cumulative sound exposure level (SELcum)
and peak sound pressure (PK) metrics for impulsive sounds As dual metrics the guidelines considers onset of
PTS to have occurred when either one of the two metrics is exceeded For non-impulsive sounds thresholds
are provided using the weighted SELcum metric where the sound energy is integrated over a 24h period
Additionally to account for the fact that different species groups use and hear sound differently marine
mammals are sub-divided into five broad hearing groups (ie LF MF HF PW and OW) (Tab1) and
thresholds in the weighted SELcum metric incorporate auditory weighting functions
Tab 1 Marine mammal hearing groups (NOAA 2018)
Doc No
Valid from Rev no
Security Classification Open - Status Final Page 10 of 25
Tab 2 Threshold values for onset of PTS as used in this report (NOAA 2018)
Tab 3 Threshold values for onset of TTS as used in this report (NOAA 2018)
The threshold criteria used in this report are in some parts more stringent than those used in the underwater
noise assessment for Hywind Scotland (Xodus 2015) This has been done because the NOAA guidelines are
Doc No
Valid from Rev no
Security Classification Open - Status Final Page 11 of 25
more recent and acknowledge the most recent literature in the field and because the NOAA guidelines are
geting increasing international attention
Threshold levels for behavioural reactions are extensively discussed in the Xodus report In this report the
same criteria are proposed (Table 4)
Table 4 Suggested marine mammal criteria for onset of disturbance (Xodus 2015)
3 Sound propagation modelling
31 Sound propagation modelling software
For sound propagation modelling the software package dBSea V 25 from Irwinn Carr consulting was used
The software uses bathymetry sediment and sound speed input data to build a 3D acoustic model of the
environment This paired with accurate sound propagation models such as dBSeaPE a Parabolic Equation
algorithm and dBSeaRay a Ray Theory algorithm make for accurate prediction of the sound propagation
Parabolic equation algorithms are known to be the most accurate for modelling low frequencies in shallow
water scenarios while ray theory algorithms deliver the best performance at higher frequencies
4 Input data sound modelling
41 Bathymetry
Bathymetry data were taken from EMODNet Bathymetry database (httpwwwemodnet-bathymetryeudata-
products) that provides bathymetry data for the area with about 100m resolution The postions of the Hywind
stucturs were taken from Hywind Tampen field layout document C219EQ-XE-00001-01 (Table 5)
Doc No
Valid from Rev no
Security Classification Open - Status Final Page 12 of 25
Table 5 Planned infrastructure coordinates for wind mill positions Please note that positions are given in
WGS84 not in ED50 as in field layout document
Fig 4 Hywind tampen placed on the bathymetry map
Name WGS84 Latitude WGS84 Longitude WGS84 UTMz31 Easting WGS84 UTMz31 Northing
HY01 61deg 21 59058 N 2deg 15 6223 E 459 99673 6 803 82959
HY02 61deg 21 12044 N 2deg 15 31773 E 460 35963 6 802 37063
HY03 61deg 20 25029 N 2deg 15 57302 E 460 72253 6 800 91167
HY04 61deg 19 38012 N 2deg 16 22809 E 461 08543 6 799 45272
HY05 61deg 18 50994 N 2deg 16 48295 E 461 44833 6 797 99376
HY06 61deg 18 3974 N 2deg 17 13760 E 461 81123 6 796 53480
HY07 61deg 18 16872 N 2deg 15 36355 E 460 36628 6 796 95000
HY08 61deg 19 3887 N 2deg 15 10846 E 460 00338 6 798 40896
HY09 61deg 19 50900 N 2deg 14 45317 E 459 64048 6 799 86792
HY10 61deg 20 37912 N 2deg 14 19766 E 459 27758 6 801 32687
HY11 61deg 21 24922 N 2deg 13 54194 E 458 91469 6 802 78583
Doc No
Valid from Rev no
Security Classification Open - Status Final Page 13 of 25
42 Sound velocity profile
Salinity temperature and pressure (depth) are the most important parameters that influence the speed of
sound in water Salinity and temperature profiles from World Ocean Database (NOAA National Centres for
Environmental Information (2005) Those data were used to calculate sound speed (Tollefsen CDS 2013)
using the following formula
c(TS z) = 14492+46T minus0055T2+00029T3
+(134minus001T)(Sminus35)+0016z
where T is the temperature in C S is the dimensionless salinity (frequently quoted as
Practical Salinity Units or PSU) and z is the depth in m From Equation 1 it is evident that the sound speed
depends most strongly on T with a weaker dependence on S and z
For each month a sound speed profile was calculated (Fig 5) Because sound is refracted towards depths of
low sound speed sound propagation differ over the seson In order to simulate sound propagation under most
different propagation conditions the sound speed profile for June and April (Fig 6)
Fig 5 Sound speed profiles representative for the area for each month For simulations sound speed profilrs
form April and June were used
Doc No
Valid from Rev no
Security Classification Open - Status Final Page 14 of 25
Fig 6 Sound speed prfiles for April (left) and July (right) as used in dBSea
For calculation of sound absorption effects in the water column average values for water temperature and
salinity for April (707decC 3513PSU) and July were used (872decC 3510PSU
43 Sea bed properties
The acoustic properties of the sea floor have influence of the amount of sound reflected from the sea floor
Bottoms with higher sound speed than the overlying water do reflect more sound back into the water column
than bottoms with lower sound speed (Ballard 2017) In this study we used information from the Equinor
ldquoHywind Tampen Substucure and Mooring System Functional requirementsrdquo report
For the model a sandy layer of 1m thickness with a sound velocity of 1650ms a density of 1900kgm and a
attenuation of 08dBwavelength as used and a clay from 1 m to infinite depth with sound velocity of 1500ms
and density of 1500kgm3 and an attenuttion of 02 dBwavelength was used
44 Sound source properties
Equinor commissioned Fugro GEOS and Jasco Applied Sciences to undertake underwater noise
measurements in the vicinity of Hywind 1 installation at a test site north-west of Stavanger Norway The
purpose of this exercise was to quantify potential underwater noise emissions form the Hywind turbines during
operation in order to inform any impact assessments what will be required for future Hywind projects
Measurements were undertaken at a test location some 150 m from the main structure and the hydrophone
was deployed at a depth of 91 m Additional background noise level readings were undertaken at a remote
control site with comparable natural environmental conditions 10 km from the Hywind test site
This measurements were used to assess noise impact for the Hywind Scotland project This study was done by
Xodus in 2015 The study by Xodus also includes suggestion on upscaling the produces sound to the
somehow bigger turbines to be used for Hywind Scotland In this study we use information from both reports for
the definition of the source strength for the sound at Hywind Tampen
441 Operational sound
Sound originating form Hywind was reported in the respective JASCO report as power spectral densities and
as 13 octave band spectral values (ref Figure 25 and Figure 38 in JASCO Measurement Report) Those data
were measured at 150m distance The Jasco report identified tonal frequencies created by the Hywind at 25Hz
and harmonics thereof with frequencies of 50 Hz and 125Hz Power spectral densities from the Jasco report
were converted to approximate sound pressure level data in third octave bins Same results as in the Xodus
report were achieved In order to get values at source spherical propagation was assumed and 435dB were
added to the values measured at 150m A 4 dB upscaling factor was used according to the suggestions made
Doc No
Valid from Rev no
Security Classification Open - Status Final Page 15 of 25
in the Xodus 2015 report A total SPL source level of 166 dB re 1microPa 1m (rms) was used for each of the
Hywwind Tampen wind turbines in the simulations
Fig 7 Spectral content of the operational noise used in the sound simulations Only those frequency bands
that show clear difference to the general ambient sound in the area are shown
Note The steps of reading out data from graphs in the Jasco report doing back calculations to source level
and the upscaling to bigger wind turbines is based on some assumptions and results in uncertainty Especially
the scaling factor of 4dB for the bigger and more powerful wind turbines is based on assumptions field
measurement on bigger floating wind turbines are not available
442 Impulsive Sound
The Hywind 1 sound study identified a transient sound measurable in the vicinity of Hywind 1 The exact origin
of this transient sound has not been identified it is assumed to be produced by tension realese in the mooring
structure It is unknown if other Hywind installations also exhibit this transient noise
This transient sound was measured above SPLpeak 160 dB re 1 microPa at a distance of 150m corresponding to
SPL of 120 to 125 dB re 1microPa The frequency of this sound extends troughout the recorded frequency range of
0-20kHz
For this study a original sound file from the Hywind I study was used for the sound source characterisation of
the snapping sound (as WAF file) This signal was scaled up to the source strength on the place of its assumed
place of origin on the shaft of the Hywind structure in 150m distance Sperical propagation laws were assumed
and 435 dB was added to the sound level measured at 150 resulting in a SPLpeak level at the source for a
individual turbine to be 203dB re 1 microPa 1m The snapping sound was reported to occur up to 23 times a
day for calculation of SEL over 24h 23 snapping events per day per wind turbine were used accumulating to
253 snapping events for all the Hywind Tampen wind turbines
There is a high uncertainty for the source strength of this transient sound mostly attributed to the unknown
position of its origin It could be stronger or weaker calculations done in this study are only a rough indication
Doc No
Valid from Rev no
Security Classification Open - Status Final Page 16 of 25
Fig 8Transient sound from Hywind expressed with relative sound pressure
Doc No
Valid from Rev no
Security Classification Open - Status Final Page 17 of 25
Fig 9 Input data for transient sound used in modelling softwareExample for HY01 Original wav file measured
at 150m distance upscaled to source level at 1 m from source
A Fast Fourier Transformation (FFT) of the sound file (Audacity V222) showed a main frequency content of
the signal between 50Hz and 10kHz (Fig 10) Lower and higher frequencies are about 10dB lower and are not
considered in the respective modelling because the contribute less than 1 to the sound energy
Doc No
Valid from Rev no
Security Classification Open - Status Final Page 18 of 25
Fig 10
45 Sound propagation solvers
Continous sound
For frequencies 125Hz to 400Hz a solver for the parabolic wave equation was used and for frequencies
above 400 Hz a solver for ray tracing Frequency for simulations was 125Hz to 16kHz
Specific settings for parabolic wave equation an ray tracer solver in dBSea are given in appendix X
Impulsive sound
For calculation of SEL A ray tracer was used throughout the frequency spectrum Frequency spectrum was
315Hz to 125kHz For calculation of SPL a split solver with parabolic wave equation up to 400Hz and a ray
tracer for higher frequencies
Doc No
Valid from Rev no
Security Classification Open - Status Final Page 19 of 25
5 Results
51 Continuous sound SPL
The sound velocity profile used for the April and July simulations resulted in less propagation loss at distances
from the sound sources for the April simulations (better propagation conditions) differences are relatively small
(Fig11) Because of this we use the simulation for April for the further assessment
Fig 11 Sound pressure levels SPLpeak for April and July simulation Highest level from all depth projected to
the surface
Doc No
Valid from Rev no
Security Classification Open - Status Final Page 20 of 25
Fig 12 Sound pressure levels SPLpeak for April across positions HY4 and HY8 (position of transect in insert)
Sound propagation around each wind turbine is almost circular with a slightly better propagation into the north-
east direction where the water depth increases Sound propagation is also fairly uniform at different water
depth (Fig 12) with a slightly reduced sound strength at the surface
In the risk assessment for possible impacts it is always the distance of the highest value that is considered and
all graphical displays show the highest value projected to the surface
If a non-impulsive sound has the potential of exceeding the peak sound pressure level threshold associates
with impulsive sound (Table 2) these tresholds are recommended for consideration according to the NOAA
guedelines
For the Hywind Tampen continuous sound none of the sound pressure thresholds for injury are
exceeded
The threshold for behavioural reaction of SPL 160 db re 1 microPa is not exceeded at any distance to the wind
turbines The lower threshold limit of SPL 120 dB re 1 microPa is about at 2000m distance to the wind mills (Fig
13) Ambient sound SPL in the area is about 112dB re 1microPa in average and 132dB re microPa at noisy days The
the indicated distance to the 120dB isopleth is also showing the audible distance at a days above average
ambient sound On days with average ambient sound levels the noise from Hywind Tampen will be audible to
animals at about 4km
Doc No
Valid from Rev no
Security Classification Open - Status Final Page 21 of 25
Fig 13 Isopleth of the 120dB re 1 microPa threshold limit for behavioural disturbance (Table 4) around the Hywind
Tampen windmills
52 Continuous sound SEL
Sound exposure patterns follow the spatial pattern for sound pressure for the unweighted SEL calculations (Fig
14 SELcum24h unweighted) There are very small differences in the sound propagation when SEL weighted
functions are use because different frequencies propagate different
Unweighted SEL and weighted SEL for all species groups from Table 2 are shown in Fig 14
Doc No
Valid from Rev no
Security Classification Open - Status Final Page 22 of 25
Fig14 Weighted SEL values for groups of marine mammals according to table 6
Table 6 NOAA risk critaria for marine mammals and relevant distances for threshold values NA shows that the
respective threshold value is not exceeded
NOAA criteria Project LE = SELcum re 1 microPa
2s
Hywind Tampen operational sound
Hearing group
range
(average)
(m)
range
max (km)
PTS Onset Threshold levels non impulsive sound
Low-Frequency (LF) Cetaceans LEp LF24h 199 dB NA NA
Mid-Frequency (MF) Cetaceans LEp MF24h 198 dB NA NA
High-Frequency (HF) Cetaceans LEp HF24h 173 dB NA NA
Phocoid Pinnipeds (PW) LEpPW24h 201 dB NA NA
Otariid Pinnipeds (OW) LEp OW24h 219 dB NA NA
TTS onset thresholds for non-impulsive sounds
Low-Frequency (LF) Cetaceans LEp LF24h 179 dB 45 52
Mid-Frequency (MF) Cetaceans LEp MF24h 178 dB NA NA
High-Frequency (HF) Cetaceans LEp HF24h 153 dB NA NA
Phocoid Pinnipeds (PW) LEpPW24h 181 dB NA NA
Otariid Pinnipeds (OW) LEp OW24h 199 dB NA NA
Doc No
Valid from Rev no
Security Classification Open - Status Final Page 23 of 25
53 Transient sound (snapping sound)
The SPLpeak at the source is with 203dB re 1 microPa just above the PTS threshold limit for high frequency
cetaceans but will drop below this threshold at a short distance (around 1 meter) to the source It is well below
threshold limits for single and multiple impulses suggested by Southall (2007) This peak value corresponds to
a SPL of 173dB re 1 microPa this is below the threshold limit for injury but above the threshold values for
behavioural disturbance of 160 dB re 1 microPa (strong reaction) and 140dB re microPa (mild reaction) The 140dB
threshold limit for weak reaction would be exceeded at distances below 160m those for the 160dB threshold
for strong reaction at 16m form the source It again has to be stressed that the available information on the
origin of the transient sound only allows a coarse estimate
Fig 15 SPL around a single turbine with indication of threshold limit for mild behavioural reaction to marine
mammals Average distance to the SPL 140 dB re 1microPa isopleth is 160m those to the SPL 160 dB re 1 microPa
isopleth is about 8m
The SELcum24h values also stay below the threshold levels for injury (Fig 16) for all groups of marine mammals
Doc No
Valid from Rev no
Security Classification Open - Status Final Page 24 of 25
Fig 16 SELcum 24 of this transient sound as unweighted and weighted SELcum24h shows that the threshold
limits for injury are not exceeded at any distance to the wind tubines
6 Risk evaluation of sound originating from Hywind Tampen windturbines
61 Continous sound evaluated on SPL and SEL metrics
The threshold limits for injury (PTS and TTS) are not exceeded in the vicinity of Hywind Tampen wind turbines
except those for low frequency cetaceans where the respective SEL threshold limit is exceeded within a radius
of 52m around each individual wind turbine This however does not pose a risk to marine mammals In order to
receiveobserve this threshold limit an animal from the group of the low frequency cetaceans has to be present
within this zone for 24hours The probability that this happens is almost zero An actively movingmigrating
animal will pass this zone within a few seconds and even a none moving animal drifting with the currents will
only be exposed for a short time The ambient noise in the area is estimated to about 112 dB re 1 microPa SPL
this means the sound created by Hywind turbines is on average not audible to marine mammals beyond a
distance of 4km
The overall risk for marine mammals from continuous sound form Hywind Tampen during operations is
evaluated as non existing
62 Transient sound
Risk assessment for the transient is based on many assumptions related to the origin of the sound and the
strength of the sound on it source It is further not established if this so called ldquosnappingrdquo sound is an inherent
property of the Hywind design or if it is a property only be found on the Hywind 1
Risk assessment is included in this study because the strength of the snapping sound is close to some of the
threshold values (SPL 180dB re 1 microPa for harassment B definition) and needs consideration in case it is an
Doc No
Valid from Rev no
Security Classification Open - Status Final Page 25 of 25
inherent property of the Hywind design It is highly recommended to verify the presence or absence of this
feature on the Hywind Scotland installation In case of absence this risk assessment has not to be repeated for
future Hywind installations
The risk is however evaluated as low in general Higher sound pressures can only be expected very close to
the sound source and the the probability of being close to the source of the transient sound is small for any
marine mammal The sound energy animals would be exposed to if staying in the are for a longer period is
also relatively low and does not pose a risk It can not be expected that animals stay for 24hours in the area
and even if they the received sound energy is below any threshold levels for injury Behavioural reactions can
be expected at relatively close distances to the wind turbines eg avoiding Though it is not expected that this
has negative impact on individuals or populations of marine mammals
Overall the risk for marine mammals originating from the transient sound is evaluated as non-existing
Due to the risk of formally exceeding some threshold levels for the transient sound it is recommended to do
sound measurements at newer Hywind installations eg in Scotland to find out if the new design of the
mooring creates similar sound or not
7 Appendix
JASCO 2011 Hywind Acoustic Measurement Report Jasco Report NO 00229
Xodus 2015 Technical Note on Underwater Noise A-100142-S20-TECH-001
NOAA (2018) 2018 Revision to Technical Guidance for Assessing the Effects of Anthropogenic Sound on
Marine Mammal Hearing (Version 2) httpswwwfisheriesnoaagovnationalmarine-mammal-
protectionmarine-mammal-acoustic-technical-guidance
Tollefsen Christina D S (2013) Reccomendations for calculatintg sound speed profiles from field data
Defence RampD Canada Atlantic Technical1048577Memorandum DRDC Atlantic TM 2013-156
Ballard MS and Lee Kevin M2017 The Acoustics of Marine Sediments Acoustics Today volume 13 issue 3
Fall 2017
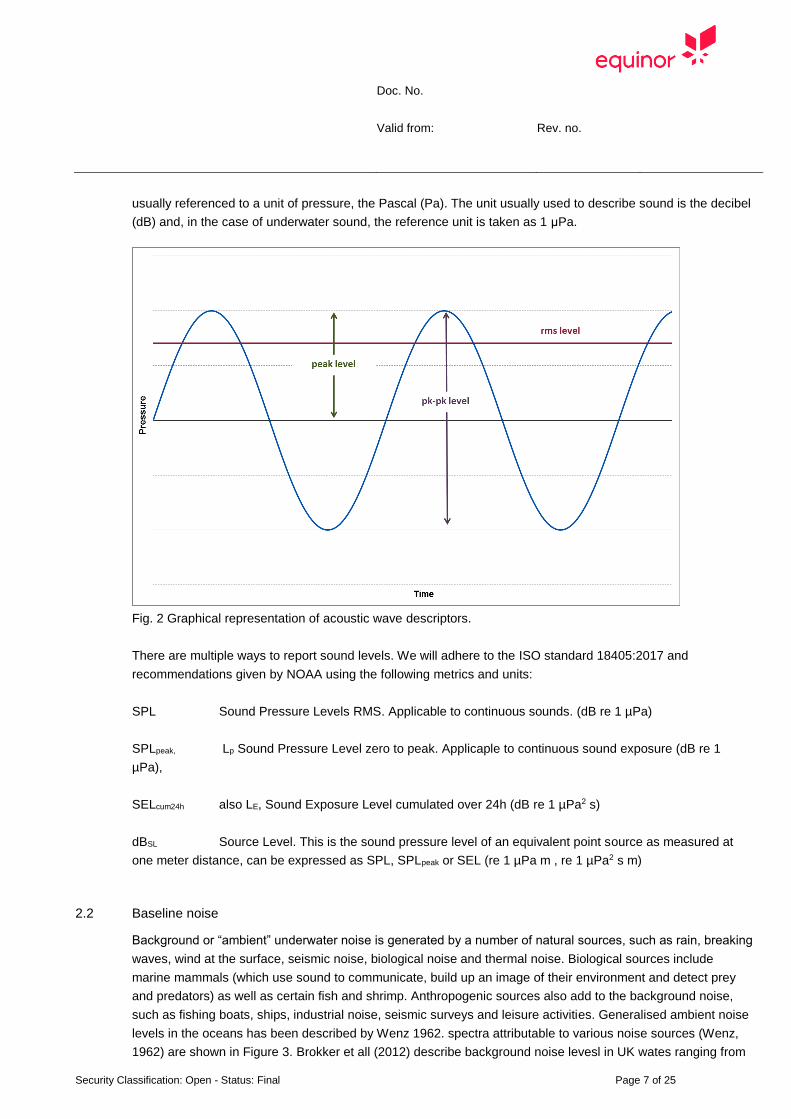
Doc No
Valid from Rev no
Security Classification Open - Status Final Page 7 of 25
usually referenced to a unit of pressure the Pascal (Pa) The unit usually used to describe sound is the decibel
(dB) and in the case of underwater sound the reference unit is taken as 1 μPa
Fig 2 Graphical representation of acoustic wave descriptors
There are multiple ways to report sound levels We will adhere to the ISO standard 184052017 and
recommendations given by NOAA using the following metrics and units
SPL Sound Pressure Levels RMS Applicable to continuous sounds (dB re 1 microPa)
SPLpeak Lp Sound Pressure Level zero to peak Applicaple to continuous sound exposure (dB re 1
microPa)
SELcum24h also LE Sound Exposure Level cumulated over 24h (dB re 1 microPa2 s)
dBSL Source Level This is the sound pressure level of an equivalent point source as measured at
one meter distance can be expressed as SPL SPLpeak or SEL (re 1 microPa m re 1 microPa2 s m)
22 Baseline noise
Background or ldquoambientrdquo underwater noise is generated by a number of natural sources such as rain breaking
waves wind at the surface seismic noise biological noise and thermal noise Biological sources include
marine mammals (which use sound to communicate build up an image of their environment and detect prey
and predators) as well as certain fish and shrimp Anthropogenic sources also add to the background noise
such as fishing boats ships industrial noise seismic surveys and leisure activities Generalised ambient noise
levels in the oceans has been described by Wenz 1962 spectra attributable to various noise sources (Wenz
1962) are shown in Figure 3 Brokker et all (2012) describe background noise levesl in UK wates ranging from
Doc No
Valid from Rev no
Security Classification Open - Status Final Page 8 of 25
92dBre 1 microPa (rms) under low sea state to a maximum of 132 dB re 1 microPa (rms) at sea state 3 Mean values
are at 111 to 112 dB re 1 microPa (rms) At the Hywind control site an average ambient noise level of 1215 dB re
1microPa (rms) was measured Ambient noise levels for the Tampen area are not know from direct measurements
but the area sees less traffic as the area of the Hywind control side outside Stavanger Conditions for Tampen
area assumed to be in the same range as reported by Brooker for UK waters with a mean value approximately
112 dB re 1 microPa (rms)
Fig 3 Generalised ambient noise attributable to various natural and anthropogenic noise sources (Wenz 1962)
23 Threshold values for assessing impacts
There is no regulatory framework in place on the NCS that gives requests on threshold values to be used when
assessing noise impact It is however expected to use the best available scientific knowledge
There is internationally accepted literature that defines threshold values for most of the groups of marine
organisms In this report we adhere to internationally accepted literature and guidelines and in particular to the
guidelines from NOAA (2018) giving threshold values for onset of PTS (Permanent Threshold Shift) and TTS
(Temporary Threshold Shift) PTS is an irreversible reduction in hearing sensitivity TTS is the reversible
reduction in hearing sensitivity with full recovery of hearing after exposure The NOAA guidelines work with a
so called ldquodual criteriardquo This is based on the theory that high sound pressures for impulsive sound can lead to
PTS or TTS when over a certain threshold but also sound of lower strength that is repeated frequently can
Doc No
Valid from Rev no
Security Classification Open - Status Final Page 9 of 25
lead to the same impact Dual metric thresholds using weighted cumulative sound exposure level (SELcum)
and peak sound pressure (PK) metrics for impulsive sounds As dual metrics the guidelines considers onset of
PTS to have occurred when either one of the two metrics is exceeded For non-impulsive sounds thresholds
are provided using the weighted SELcum metric where the sound energy is integrated over a 24h period
Additionally to account for the fact that different species groups use and hear sound differently marine
mammals are sub-divided into five broad hearing groups (ie LF MF HF PW and OW) (Tab1) and
thresholds in the weighted SELcum metric incorporate auditory weighting functions
Tab 1 Marine mammal hearing groups (NOAA 2018)
Doc No
Valid from Rev no
Security Classification Open - Status Final Page 10 of 25
Tab 2 Threshold values for onset of PTS as used in this report (NOAA 2018)
Tab 3 Threshold values for onset of TTS as used in this report (NOAA 2018)
The threshold criteria used in this report are in some parts more stringent than those used in the underwater
noise assessment for Hywind Scotland (Xodus 2015) This has been done because the NOAA guidelines are
Doc No
Valid from Rev no
Security Classification Open - Status Final Page 11 of 25
more recent and acknowledge the most recent literature in the field and because the NOAA guidelines are
geting increasing international attention
Threshold levels for behavioural reactions are extensively discussed in the Xodus report In this report the
same criteria are proposed (Table 4)
Table 4 Suggested marine mammal criteria for onset of disturbance (Xodus 2015)
3 Sound propagation modelling
31 Sound propagation modelling software
For sound propagation modelling the software package dBSea V 25 from Irwinn Carr consulting was used
The software uses bathymetry sediment and sound speed input data to build a 3D acoustic model of the
environment This paired with accurate sound propagation models such as dBSeaPE a Parabolic Equation
algorithm and dBSeaRay a Ray Theory algorithm make for accurate prediction of the sound propagation
Parabolic equation algorithms are known to be the most accurate for modelling low frequencies in shallow
water scenarios while ray theory algorithms deliver the best performance at higher frequencies
4 Input data sound modelling
41 Bathymetry
Bathymetry data were taken from EMODNet Bathymetry database (httpwwwemodnet-bathymetryeudata-
products) that provides bathymetry data for the area with about 100m resolution The postions of the Hywind
stucturs were taken from Hywind Tampen field layout document C219EQ-XE-00001-01 (Table 5)
Doc No
Valid from Rev no
Security Classification Open - Status Final Page 12 of 25
Table 5 Planned infrastructure coordinates for wind mill positions Please note that positions are given in
WGS84 not in ED50 as in field layout document
Fig 4 Hywind tampen placed on the bathymetry map
Name WGS84 Latitude WGS84 Longitude WGS84 UTMz31 Easting WGS84 UTMz31 Northing
HY01 61deg 21 59058 N 2deg 15 6223 E 459 99673 6 803 82959
HY02 61deg 21 12044 N 2deg 15 31773 E 460 35963 6 802 37063
HY03 61deg 20 25029 N 2deg 15 57302 E 460 72253 6 800 91167
HY04 61deg 19 38012 N 2deg 16 22809 E 461 08543 6 799 45272
HY05 61deg 18 50994 N 2deg 16 48295 E 461 44833 6 797 99376
HY06 61deg 18 3974 N 2deg 17 13760 E 461 81123 6 796 53480
HY07 61deg 18 16872 N 2deg 15 36355 E 460 36628 6 796 95000
HY08 61deg 19 3887 N 2deg 15 10846 E 460 00338 6 798 40896
HY09 61deg 19 50900 N 2deg 14 45317 E 459 64048 6 799 86792
HY10 61deg 20 37912 N 2deg 14 19766 E 459 27758 6 801 32687
HY11 61deg 21 24922 N 2deg 13 54194 E 458 91469 6 802 78583
Doc No
Valid from Rev no
Security Classification Open - Status Final Page 13 of 25
42 Sound velocity profile
Salinity temperature and pressure (depth) are the most important parameters that influence the speed of
sound in water Salinity and temperature profiles from World Ocean Database (NOAA National Centres for
Environmental Information (2005) Those data were used to calculate sound speed (Tollefsen CDS 2013)
using the following formula
c(TS z) = 14492+46T minus0055T2+00029T3
+(134minus001T)(Sminus35)+0016z
where T is the temperature in C S is the dimensionless salinity (frequently quoted as
Practical Salinity Units or PSU) and z is the depth in m From Equation 1 it is evident that the sound speed
depends most strongly on T with a weaker dependence on S and z
For each month a sound speed profile was calculated (Fig 5) Because sound is refracted towards depths of
low sound speed sound propagation differ over the seson In order to simulate sound propagation under most
different propagation conditions the sound speed profile for June and April (Fig 6)
Fig 5 Sound speed profiles representative for the area for each month For simulations sound speed profilrs
form April and June were used
Doc No
Valid from Rev no
Security Classification Open - Status Final Page 14 of 25
Fig 6 Sound speed prfiles for April (left) and July (right) as used in dBSea
For calculation of sound absorption effects in the water column average values for water temperature and
salinity for April (707decC 3513PSU) and July were used (872decC 3510PSU
43 Sea bed properties
The acoustic properties of the sea floor have influence of the amount of sound reflected from the sea floor
Bottoms with higher sound speed than the overlying water do reflect more sound back into the water column
than bottoms with lower sound speed (Ballard 2017) In this study we used information from the Equinor
ldquoHywind Tampen Substucure and Mooring System Functional requirementsrdquo report
For the model a sandy layer of 1m thickness with a sound velocity of 1650ms a density of 1900kgm and a
attenuation of 08dBwavelength as used and a clay from 1 m to infinite depth with sound velocity of 1500ms
and density of 1500kgm3 and an attenuttion of 02 dBwavelength was used
44 Sound source properties
Equinor commissioned Fugro GEOS and Jasco Applied Sciences to undertake underwater noise
measurements in the vicinity of Hywind 1 installation at a test site north-west of Stavanger Norway The
purpose of this exercise was to quantify potential underwater noise emissions form the Hywind turbines during
operation in order to inform any impact assessments what will be required for future Hywind projects
Measurements were undertaken at a test location some 150 m from the main structure and the hydrophone
was deployed at a depth of 91 m Additional background noise level readings were undertaken at a remote
control site with comparable natural environmental conditions 10 km from the Hywind test site
This measurements were used to assess noise impact for the Hywind Scotland project This study was done by
Xodus in 2015 The study by Xodus also includes suggestion on upscaling the produces sound to the
somehow bigger turbines to be used for Hywind Scotland In this study we use information from both reports for
the definition of the source strength for the sound at Hywind Tampen
441 Operational sound
Sound originating form Hywind was reported in the respective JASCO report as power spectral densities and
as 13 octave band spectral values (ref Figure 25 and Figure 38 in JASCO Measurement Report) Those data
were measured at 150m distance The Jasco report identified tonal frequencies created by the Hywind at 25Hz
and harmonics thereof with frequencies of 50 Hz and 125Hz Power spectral densities from the Jasco report
were converted to approximate sound pressure level data in third octave bins Same results as in the Xodus
report were achieved In order to get values at source spherical propagation was assumed and 435dB were
added to the values measured at 150m A 4 dB upscaling factor was used according to the suggestions made
Doc No
Valid from Rev no
Security Classification Open - Status Final Page 15 of 25
in the Xodus 2015 report A total SPL source level of 166 dB re 1microPa 1m (rms) was used for each of the
Hywwind Tampen wind turbines in the simulations
Fig 7 Spectral content of the operational noise used in the sound simulations Only those frequency bands
that show clear difference to the general ambient sound in the area are shown
Note The steps of reading out data from graphs in the Jasco report doing back calculations to source level
and the upscaling to bigger wind turbines is based on some assumptions and results in uncertainty Especially
the scaling factor of 4dB for the bigger and more powerful wind turbines is based on assumptions field
measurement on bigger floating wind turbines are not available
442 Impulsive Sound
The Hywind 1 sound study identified a transient sound measurable in the vicinity of Hywind 1 The exact origin
of this transient sound has not been identified it is assumed to be produced by tension realese in the mooring
structure It is unknown if other Hywind installations also exhibit this transient noise
This transient sound was measured above SPLpeak 160 dB re 1 microPa at a distance of 150m corresponding to
SPL of 120 to 125 dB re 1microPa The frequency of this sound extends troughout the recorded frequency range of
0-20kHz
For this study a original sound file from the Hywind I study was used for the sound source characterisation of
the snapping sound (as WAF file) This signal was scaled up to the source strength on the place of its assumed
place of origin on the shaft of the Hywind structure in 150m distance Sperical propagation laws were assumed
and 435 dB was added to the sound level measured at 150 resulting in a SPLpeak level at the source for a
individual turbine to be 203dB re 1 microPa 1m The snapping sound was reported to occur up to 23 times a
day for calculation of SEL over 24h 23 snapping events per day per wind turbine were used accumulating to
253 snapping events for all the Hywind Tampen wind turbines
There is a high uncertainty for the source strength of this transient sound mostly attributed to the unknown
position of its origin It could be stronger or weaker calculations done in this study are only a rough indication
Doc No
Valid from Rev no
Security Classification Open - Status Final Page 16 of 25
Fig 8Transient sound from Hywind expressed with relative sound pressure
Doc No
Valid from Rev no
Security Classification Open - Status Final Page 17 of 25
Fig 9 Input data for transient sound used in modelling softwareExample for HY01 Original wav file measured
at 150m distance upscaled to source level at 1 m from source
A Fast Fourier Transformation (FFT) of the sound file (Audacity V222) showed a main frequency content of
the signal between 50Hz and 10kHz (Fig 10) Lower and higher frequencies are about 10dB lower and are not
considered in the respective modelling because the contribute less than 1 to the sound energy
Doc No
Valid from Rev no
Security Classification Open - Status Final Page 18 of 25
Fig 10
45 Sound propagation solvers
Continous sound
For frequencies 125Hz to 400Hz a solver for the parabolic wave equation was used and for frequencies
above 400 Hz a solver for ray tracing Frequency for simulations was 125Hz to 16kHz
Specific settings for parabolic wave equation an ray tracer solver in dBSea are given in appendix X
Impulsive sound
For calculation of SEL A ray tracer was used throughout the frequency spectrum Frequency spectrum was
315Hz to 125kHz For calculation of SPL a split solver with parabolic wave equation up to 400Hz and a ray
tracer for higher frequencies
Doc No
Valid from Rev no
Security Classification Open - Status Final Page 19 of 25
5 Results
51 Continuous sound SPL
The sound velocity profile used for the April and July simulations resulted in less propagation loss at distances
from the sound sources for the April simulations (better propagation conditions) differences are relatively small
(Fig11) Because of this we use the simulation for April for the further assessment
Fig 11 Sound pressure levels SPLpeak for April and July simulation Highest level from all depth projected to
the surface
Doc No
Valid from Rev no
Security Classification Open - Status Final Page 20 of 25
Fig 12 Sound pressure levels SPLpeak for April across positions HY4 and HY8 (position of transect in insert)
Sound propagation around each wind turbine is almost circular with a slightly better propagation into the north-
east direction where the water depth increases Sound propagation is also fairly uniform at different water
depth (Fig 12) with a slightly reduced sound strength at the surface
In the risk assessment for possible impacts it is always the distance of the highest value that is considered and
all graphical displays show the highest value projected to the surface
If a non-impulsive sound has the potential of exceeding the peak sound pressure level threshold associates
with impulsive sound (Table 2) these tresholds are recommended for consideration according to the NOAA
guedelines
For the Hywind Tampen continuous sound none of the sound pressure thresholds for injury are
exceeded
The threshold for behavioural reaction of SPL 160 db re 1 microPa is not exceeded at any distance to the wind
turbines The lower threshold limit of SPL 120 dB re 1 microPa is about at 2000m distance to the wind mills (Fig
13) Ambient sound SPL in the area is about 112dB re 1microPa in average and 132dB re microPa at noisy days The
the indicated distance to the 120dB isopleth is also showing the audible distance at a days above average
ambient sound On days with average ambient sound levels the noise from Hywind Tampen will be audible to
animals at about 4km
Doc No
Valid from Rev no
Security Classification Open - Status Final Page 21 of 25
Fig 13 Isopleth of the 120dB re 1 microPa threshold limit for behavioural disturbance (Table 4) around the Hywind
Tampen windmills
52 Continuous sound SEL
Sound exposure patterns follow the spatial pattern for sound pressure for the unweighted SEL calculations (Fig
14 SELcum24h unweighted) There are very small differences in the sound propagation when SEL weighted
functions are use because different frequencies propagate different
Unweighted SEL and weighted SEL for all species groups from Table 2 are shown in Fig 14
Doc No
Valid from Rev no
Security Classification Open - Status Final Page 22 of 25
Fig14 Weighted SEL values for groups of marine mammals according to table 6
Table 6 NOAA risk critaria for marine mammals and relevant distances for threshold values NA shows that the
respective threshold value is not exceeded
NOAA criteria Project LE = SELcum re 1 microPa
2s
Hywind Tampen operational sound
Hearing group
range
(average)
(m)
range
max (km)
PTS Onset Threshold levels non impulsive sound
Low-Frequency (LF) Cetaceans LEp LF24h 199 dB NA NA
Mid-Frequency (MF) Cetaceans LEp MF24h 198 dB NA NA
High-Frequency (HF) Cetaceans LEp HF24h 173 dB NA NA
Phocoid Pinnipeds (PW) LEpPW24h 201 dB NA NA
Otariid Pinnipeds (OW) LEp OW24h 219 dB NA NA
TTS onset thresholds for non-impulsive sounds
Low-Frequency (LF) Cetaceans LEp LF24h 179 dB 45 52
Mid-Frequency (MF) Cetaceans LEp MF24h 178 dB NA NA
High-Frequency (HF) Cetaceans LEp HF24h 153 dB NA NA
Phocoid Pinnipeds (PW) LEpPW24h 181 dB NA NA
Otariid Pinnipeds (OW) LEp OW24h 199 dB NA NA
Doc No
Valid from Rev no
Security Classification Open - Status Final Page 23 of 25
53 Transient sound (snapping sound)
The SPLpeak at the source is with 203dB re 1 microPa just above the PTS threshold limit for high frequency
cetaceans but will drop below this threshold at a short distance (around 1 meter) to the source It is well below
threshold limits for single and multiple impulses suggested by Southall (2007) This peak value corresponds to
a SPL of 173dB re 1 microPa this is below the threshold limit for injury but above the threshold values for
behavioural disturbance of 160 dB re 1 microPa (strong reaction) and 140dB re microPa (mild reaction) The 140dB
threshold limit for weak reaction would be exceeded at distances below 160m those for the 160dB threshold
for strong reaction at 16m form the source It again has to be stressed that the available information on the
origin of the transient sound only allows a coarse estimate
Fig 15 SPL around a single turbine with indication of threshold limit for mild behavioural reaction to marine
mammals Average distance to the SPL 140 dB re 1microPa isopleth is 160m those to the SPL 160 dB re 1 microPa
isopleth is about 8m
The SELcum24h values also stay below the threshold levels for injury (Fig 16) for all groups of marine mammals
Doc No
Valid from Rev no
Security Classification Open - Status Final Page 24 of 25
Fig 16 SELcum 24 of this transient sound as unweighted and weighted SELcum24h shows that the threshold
limits for injury are not exceeded at any distance to the wind tubines
6 Risk evaluation of sound originating from Hywind Tampen windturbines
61 Continous sound evaluated on SPL and SEL metrics
The threshold limits for injury (PTS and TTS) are not exceeded in the vicinity of Hywind Tampen wind turbines
except those for low frequency cetaceans where the respective SEL threshold limit is exceeded within a radius
of 52m around each individual wind turbine This however does not pose a risk to marine mammals In order to
receiveobserve this threshold limit an animal from the group of the low frequency cetaceans has to be present
within this zone for 24hours The probability that this happens is almost zero An actively movingmigrating
animal will pass this zone within a few seconds and even a none moving animal drifting with the currents will
only be exposed for a short time The ambient noise in the area is estimated to about 112 dB re 1 microPa SPL
this means the sound created by Hywind turbines is on average not audible to marine mammals beyond a
distance of 4km
The overall risk for marine mammals from continuous sound form Hywind Tampen during operations is
evaluated as non existing
62 Transient sound
Risk assessment for the transient is based on many assumptions related to the origin of the sound and the
strength of the sound on it source It is further not established if this so called ldquosnappingrdquo sound is an inherent
property of the Hywind design or if it is a property only be found on the Hywind 1
Risk assessment is included in this study because the strength of the snapping sound is close to some of the
threshold values (SPL 180dB re 1 microPa for harassment B definition) and needs consideration in case it is an
Doc No
Valid from Rev no
Security Classification Open - Status Final Page 25 of 25
inherent property of the Hywind design It is highly recommended to verify the presence or absence of this
feature on the Hywind Scotland installation In case of absence this risk assessment has not to be repeated for
future Hywind installations
The risk is however evaluated as low in general Higher sound pressures can only be expected very close to
the sound source and the the probability of being close to the source of the transient sound is small for any
marine mammal The sound energy animals would be exposed to if staying in the are for a longer period is
also relatively low and does not pose a risk It can not be expected that animals stay for 24hours in the area
and even if they the received sound energy is below any threshold levels for injury Behavioural reactions can
be expected at relatively close distances to the wind turbines eg avoiding Though it is not expected that this
has negative impact on individuals or populations of marine mammals
Overall the risk for marine mammals originating from the transient sound is evaluated as non-existing
Due to the risk of formally exceeding some threshold levels for the transient sound it is recommended to do
sound measurements at newer Hywind installations eg in Scotland to find out if the new design of the
mooring creates similar sound or not
7 Appendix
JASCO 2011 Hywind Acoustic Measurement Report Jasco Report NO 00229
Xodus 2015 Technical Note on Underwater Noise A-100142-S20-TECH-001
NOAA (2018) 2018 Revision to Technical Guidance for Assessing the Effects of Anthropogenic Sound on
Marine Mammal Hearing (Version 2) httpswwwfisheriesnoaagovnationalmarine-mammal-
protectionmarine-mammal-acoustic-technical-guidance
Tollefsen Christina D S (2013) Reccomendations for calculatintg sound speed profiles from field data
Defence RampD Canada Atlantic Technical1048577Memorandum DRDC Atlantic TM 2013-156
Ballard MS and Lee Kevin M2017 The Acoustics of Marine Sediments Acoustics Today volume 13 issue 3
Fall 2017
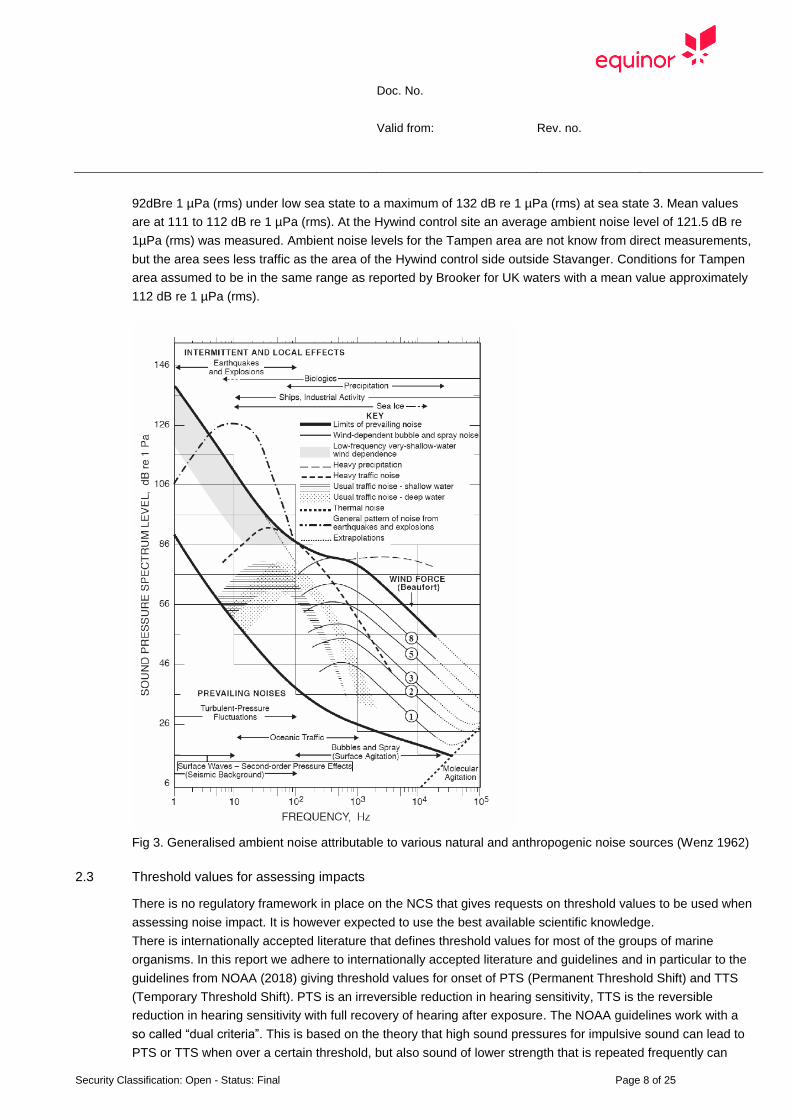
Doc No
Valid from Rev no
Security Classification Open - Status Final Page 8 of 25
92dBre 1 microPa (rms) under low sea state to a maximum of 132 dB re 1 microPa (rms) at sea state 3 Mean values
are at 111 to 112 dB re 1 microPa (rms) At the Hywind control site an average ambient noise level of 1215 dB re
1microPa (rms) was measured Ambient noise levels for the Tampen area are not know from direct measurements
but the area sees less traffic as the area of the Hywind control side outside Stavanger Conditions for Tampen
area assumed to be in the same range as reported by Brooker for UK waters with a mean value approximately
112 dB re 1 microPa (rms)
Fig 3 Generalised ambient noise attributable to various natural and anthropogenic noise sources (Wenz 1962)
23 Threshold values for assessing impacts
There is no regulatory framework in place on the NCS that gives requests on threshold values to be used when
assessing noise impact It is however expected to use the best available scientific knowledge
There is internationally accepted literature that defines threshold values for most of the groups of marine
organisms In this report we adhere to internationally accepted literature and guidelines and in particular to the
guidelines from NOAA (2018) giving threshold values for onset of PTS (Permanent Threshold Shift) and TTS
(Temporary Threshold Shift) PTS is an irreversible reduction in hearing sensitivity TTS is the reversible
reduction in hearing sensitivity with full recovery of hearing after exposure The NOAA guidelines work with a
so called ldquodual criteriardquo This is based on the theory that high sound pressures for impulsive sound can lead to
PTS or TTS when over a certain threshold but also sound of lower strength that is repeated frequently can
Doc No
Valid from Rev no
Security Classification Open - Status Final Page 9 of 25
lead to the same impact Dual metric thresholds using weighted cumulative sound exposure level (SELcum)
and peak sound pressure (PK) metrics for impulsive sounds As dual metrics the guidelines considers onset of
PTS to have occurred when either one of the two metrics is exceeded For non-impulsive sounds thresholds
are provided using the weighted SELcum metric where the sound energy is integrated over a 24h period
Additionally to account for the fact that different species groups use and hear sound differently marine
mammals are sub-divided into five broad hearing groups (ie LF MF HF PW and OW) (Tab1) and
thresholds in the weighted SELcum metric incorporate auditory weighting functions
Tab 1 Marine mammal hearing groups (NOAA 2018)
Doc No
Valid from Rev no
Security Classification Open - Status Final Page 10 of 25
Tab 2 Threshold values for onset of PTS as used in this report (NOAA 2018)
Tab 3 Threshold values for onset of TTS as used in this report (NOAA 2018)
The threshold criteria used in this report are in some parts more stringent than those used in the underwater
noise assessment for Hywind Scotland (Xodus 2015) This has been done because the NOAA guidelines are
Doc No
Valid from Rev no
Security Classification Open - Status Final Page 11 of 25
more recent and acknowledge the most recent literature in the field and because the NOAA guidelines are
geting increasing international attention
Threshold levels for behavioural reactions are extensively discussed in the Xodus report In this report the
same criteria are proposed (Table 4)
Table 4 Suggested marine mammal criteria for onset of disturbance (Xodus 2015)
3 Sound propagation modelling
31 Sound propagation modelling software
For sound propagation modelling the software package dBSea V 25 from Irwinn Carr consulting was used
The software uses bathymetry sediment and sound speed input data to build a 3D acoustic model of the
environment This paired with accurate sound propagation models such as dBSeaPE a Parabolic Equation
algorithm and dBSeaRay a Ray Theory algorithm make for accurate prediction of the sound propagation
Parabolic equation algorithms are known to be the most accurate for modelling low frequencies in shallow
water scenarios while ray theory algorithms deliver the best performance at higher frequencies
4 Input data sound modelling
41 Bathymetry
Bathymetry data were taken from EMODNet Bathymetry database (httpwwwemodnet-bathymetryeudata-
products) that provides bathymetry data for the area with about 100m resolution The postions of the Hywind
stucturs were taken from Hywind Tampen field layout document C219EQ-XE-00001-01 (Table 5)
Doc No
Valid from Rev no
Security Classification Open - Status Final Page 12 of 25
Table 5 Planned infrastructure coordinates for wind mill positions Please note that positions are given in
WGS84 not in ED50 as in field layout document
Fig 4 Hywind tampen placed on the bathymetry map
Name WGS84 Latitude WGS84 Longitude WGS84 UTMz31 Easting WGS84 UTMz31 Northing
HY01 61deg 21 59058 N 2deg 15 6223 E 459 99673 6 803 82959
HY02 61deg 21 12044 N 2deg 15 31773 E 460 35963 6 802 37063
HY03 61deg 20 25029 N 2deg 15 57302 E 460 72253 6 800 91167
HY04 61deg 19 38012 N 2deg 16 22809 E 461 08543 6 799 45272
HY05 61deg 18 50994 N 2deg 16 48295 E 461 44833 6 797 99376
HY06 61deg 18 3974 N 2deg 17 13760 E 461 81123 6 796 53480
HY07 61deg 18 16872 N 2deg 15 36355 E 460 36628 6 796 95000
HY08 61deg 19 3887 N 2deg 15 10846 E 460 00338 6 798 40896
HY09 61deg 19 50900 N 2deg 14 45317 E 459 64048 6 799 86792
HY10 61deg 20 37912 N 2deg 14 19766 E 459 27758 6 801 32687
HY11 61deg 21 24922 N 2deg 13 54194 E 458 91469 6 802 78583
Doc No
Valid from Rev no
Security Classification Open - Status Final Page 13 of 25
42 Sound velocity profile
Salinity temperature and pressure (depth) are the most important parameters that influence the speed of
sound in water Salinity and temperature profiles from World Ocean Database (NOAA National Centres for
Environmental Information (2005) Those data were used to calculate sound speed (Tollefsen CDS 2013)
using the following formula
c(TS z) = 14492+46T minus0055T2+00029T3
+(134minus001T)(Sminus35)+0016z
where T is the temperature in C S is the dimensionless salinity (frequently quoted as
Practical Salinity Units or PSU) and z is the depth in m From Equation 1 it is evident that the sound speed
depends most strongly on T with a weaker dependence on S and z
For each month a sound speed profile was calculated (Fig 5) Because sound is refracted towards depths of
low sound speed sound propagation differ over the seson In order to simulate sound propagation under most
different propagation conditions the sound speed profile for June and April (Fig 6)
Fig 5 Sound speed profiles representative for the area for each month For simulations sound speed profilrs
form April and June were used
Doc No
Valid from Rev no
Security Classification Open - Status Final Page 14 of 25
Fig 6 Sound speed prfiles for April (left) and July (right) as used in dBSea
For calculation of sound absorption effects in the water column average values for water temperature and
salinity for April (707decC 3513PSU) and July were used (872decC 3510PSU
43 Sea bed properties
The acoustic properties of the sea floor have influence of the amount of sound reflected from the sea floor
Bottoms with higher sound speed than the overlying water do reflect more sound back into the water column
than bottoms with lower sound speed (Ballard 2017) In this study we used information from the Equinor
ldquoHywind Tampen Substucure and Mooring System Functional requirementsrdquo report
For the model a sandy layer of 1m thickness with a sound velocity of 1650ms a density of 1900kgm and a
attenuation of 08dBwavelength as used and a clay from 1 m to infinite depth with sound velocity of 1500ms
and density of 1500kgm3 and an attenuttion of 02 dBwavelength was used
44 Sound source properties
Equinor commissioned Fugro GEOS and Jasco Applied Sciences to undertake underwater noise
measurements in the vicinity of Hywind 1 installation at a test site north-west of Stavanger Norway The
purpose of this exercise was to quantify potential underwater noise emissions form the Hywind turbines during
operation in order to inform any impact assessments what will be required for future Hywind projects
Measurements were undertaken at a test location some 150 m from the main structure and the hydrophone
was deployed at a depth of 91 m Additional background noise level readings were undertaken at a remote
control site with comparable natural environmental conditions 10 km from the Hywind test site
This measurements were used to assess noise impact for the Hywind Scotland project This study was done by
Xodus in 2015 The study by Xodus also includes suggestion on upscaling the produces sound to the
somehow bigger turbines to be used for Hywind Scotland In this study we use information from both reports for
the definition of the source strength for the sound at Hywind Tampen
441 Operational sound
Sound originating form Hywind was reported in the respective JASCO report as power spectral densities and
as 13 octave band spectral values (ref Figure 25 and Figure 38 in JASCO Measurement Report) Those data
were measured at 150m distance The Jasco report identified tonal frequencies created by the Hywind at 25Hz
and harmonics thereof with frequencies of 50 Hz and 125Hz Power spectral densities from the Jasco report
were converted to approximate sound pressure level data in third octave bins Same results as in the Xodus
report were achieved In order to get values at source spherical propagation was assumed and 435dB were
added to the values measured at 150m A 4 dB upscaling factor was used according to the suggestions made
Doc No
Valid from Rev no
Security Classification Open - Status Final Page 15 of 25
in the Xodus 2015 report A total SPL source level of 166 dB re 1microPa 1m (rms) was used for each of the
Hywwind Tampen wind turbines in the simulations
Fig 7 Spectral content of the operational noise used in the sound simulations Only those frequency bands
that show clear difference to the general ambient sound in the area are shown
Note The steps of reading out data from graphs in the Jasco report doing back calculations to source level
and the upscaling to bigger wind turbines is based on some assumptions and results in uncertainty Especially
the scaling factor of 4dB for the bigger and more powerful wind turbines is based on assumptions field
measurement on bigger floating wind turbines are not available
442 Impulsive Sound
The Hywind 1 sound study identified a transient sound measurable in the vicinity of Hywind 1 The exact origin
of this transient sound has not been identified it is assumed to be produced by tension realese in the mooring
structure It is unknown if other Hywind installations also exhibit this transient noise
This transient sound was measured above SPLpeak 160 dB re 1 microPa at a distance of 150m corresponding to
SPL of 120 to 125 dB re 1microPa The frequency of this sound extends troughout the recorded frequency range of
0-20kHz
For this study a original sound file from the Hywind I study was used for the sound source characterisation of
the snapping sound (as WAF file) This signal was scaled up to the source strength on the place of its assumed
place of origin on the shaft of the Hywind structure in 150m distance Sperical propagation laws were assumed
and 435 dB was added to the sound level measured at 150 resulting in a SPLpeak level at the source for a
individual turbine to be 203dB re 1 microPa 1m The snapping sound was reported to occur up to 23 times a
day for calculation of SEL over 24h 23 snapping events per day per wind turbine were used accumulating to
253 snapping events for all the Hywind Tampen wind turbines
There is a high uncertainty for the source strength of this transient sound mostly attributed to the unknown
position of its origin It could be stronger or weaker calculations done in this study are only a rough indication
Doc No
Valid from Rev no
Security Classification Open - Status Final Page 16 of 25
Fig 8Transient sound from Hywind expressed with relative sound pressure
Doc No
Valid from Rev no
Security Classification Open - Status Final Page 17 of 25
Fig 9 Input data for transient sound used in modelling softwareExample for HY01 Original wav file measured
at 150m distance upscaled to source level at 1 m from source
A Fast Fourier Transformation (FFT) of the sound file (Audacity V222) showed a main frequency content of
the signal between 50Hz and 10kHz (Fig 10) Lower and higher frequencies are about 10dB lower and are not
considered in the respective modelling because the contribute less than 1 to the sound energy
Doc No
Valid from Rev no
Security Classification Open - Status Final Page 18 of 25
Fig 10
45 Sound propagation solvers
Continous sound
For frequencies 125Hz to 400Hz a solver for the parabolic wave equation was used and for frequencies
above 400 Hz a solver for ray tracing Frequency for simulations was 125Hz to 16kHz
Specific settings for parabolic wave equation an ray tracer solver in dBSea are given in appendix X
Impulsive sound
For calculation of SEL A ray tracer was used throughout the frequency spectrum Frequency spectrum was
315Hz to 125kHz For calculation of SPL a split solver with parabolic wave equation up to 400Hz and a ray
tracer for higher frequencies
Doc No
Valid from Rev no
Security Classification Open - Status Final Page 19 of 25
5 Results
51 Continuous sound SPL
The sound velocity profile used for the April and July simulations resulted in less propagation loss at distances
from the sound sources for the April simulations (better propagation conditions) differences are relatively small
(Fig11) Because of this we use the simulation for April for the further assessment
Fig 11 Sound pressure levels SPLpeak for April and July simulation Highest level from all depth projected to
the surface
Doc No
Valid from Rev no
Security Classification Open - Status Final Page 20 of 25
Fig 12 Sound pressure levels SPLpeak for April across positions HY4 and HY8 (position of transect in insert)
Sound propagation around each wind turbine is almost circular with a slightly better propagation into the north-
east direction where the water depth increases Sound propagation is also fairly uniform at different water
depth (Fig 12) with a slightly reduced sound strength at the surface
In the risk assessment for possible impacts it is always the distance of the highest value that is considered and
all graphical displays show the highest value projected to the surface
If a non-impulsive sound has the potential of exceeding the peak sound pressure level threshold associates
with impulsive sound (Table 2) these tresholds are recommended for consideration according to the NOAA
guedelines
For the Hywind Tampen continuous sound none of the sound pressure thresholds for injury are
exceeded
The threshold for behavioural reaction of SPL 160 db re 1 microPa is not exceeded at any distance to the wind
turbines The lower threshold limit of SPL 120 dB re 1 microPa is about at 2000m distance to the wind mills (Fig
13) Ambient sound SPL in the area is about 112dB re 1microPa in average and 132dB re microPa at noisy days The
the indicated distance to the 120dB isopleth is also showing the audible distance at a days above average
ambient sound On days with average ambient sound levels the noise from Hywind Tampen will be audible to
animals at about 4km
Doc No
Valid from Rev no
Security Classification Open - Status Final Page 21 of 25
Fig 13 Isopleth of the 120dB re 1 microPa threshold limit for behavioural disturbance (Table 4) around the Hywind
Tampen windmills
52 Continuous sound SEL
Sound exposure patterns follow the spatial pattern for sound pressure for the unweighted SEL calculations (Fig
14 SELcum24h unweighted) There are very small differences in the sound propagation when SEL weighted
functions are use because different frequencies propagate different
Unweighted SEL and weighted SEL for all species groups from Table 2 are shown in Fig 14
Doc No
Valid from Rev no
Security Classification Open - Status Final Page 22 of 25
Fig14 Weighted SEL values for groups of marine mammals according to table 6
Table 6 NOAA risk critaria for marine mammals and relevant distances for threshold values NA shows that the
respective threshold value is not exceeded
NOAA criteria Project LE = SELcum re 1 microPa
2s
Hywind Tampen operational sound
Hearing group
range
(average)
(m)
range
max (km)
PTS Onset Threshold levels non impulsive sound
Low-Frequency (LF) Cetaceans LEp LF24h 199 dB NA NA
Mid-Frequency (MF) Cetaceans LEp MF24h 198 dB NA NA
High-Frequency (HF) Cetaceans LEp HF24h 173 dB NA NA
Phocoid Pinnipeds (PW) LEpPW24h 201 dB NA NA
Otariid Pinnipeds (OW) LEp OW24h 219 dB NA NA
TTS onset thresholds for non-impulsive sounds
Low-Frequency (LF) Cetaceans LEp LF24h 179 dB 45 52
Mid-Frequency (MF) Cetaceans LEp MF24h 178 dB NA NA
High-Frequency (HF) Cetaceans LEp HF24h 153 dB NA NA
Phocoid Pinnipeds (PW) LEpPW24h 181 dB NA NA
Otariid Pinnipeds (OW) LEp OW24h 199 dB NA NA
Doc No
Valid from Rev no
Security Classification Open - Status Final Page 23 of 25
53 Transient sound (snapping sound)
The SPLpeak at the source is with 203dB re 1 microPa just above the PTS threshold limit for high frequency
cetaceans but will drop below this threshold at a short distance (around 1 meter) to the source It is well below
threshold limits for single and multiple impulses suggested by Southall (2007) This peak value corresponds to
a SPL of 173dB re 1 microPa this is below the threshold limit for injury but above the threshold values for
behavioural disturbance of 160 dB re 1 microPa (strong reaction) and 140dB re microPa (mild reaction) The 140dB
threshold limit for weak reaction would be exceeded at distances below 160m those for the 160dB threshold
for strong reaction at 16m form the source It again has to be stressed that the available information on the
origin of the transient sound only allows a coarse estimate
Fig 15 SPL around a single turbine with indication of threshold limit for mild behavioural reaction to marine
mammals Average distance to the SPL 140 dB re 1microPa isopleth is 160m those to the SPL 160 dB re 1 microPa
isopleth is about 8m
The SELcum24h values also stay below the threshold levels for injury (Fig 16) for all groups of marine mammals
Doc No
Valid from Rev no
Security Classification Open - Status Final Page 24 of 25
Fig 16 SELcum 24 of this transient sound as unweighted and weighted SELcum24h shows that the threshold
limits for injury are not exceeded at any distance to the wind tubines
6 Risk evaluation of sound originating from Hywind Tampen windturbines
61 Continous sound evaluated on SPL and SEL metrics
The threshold limits for injury (PTS and TTS) are not exceeded in the vicinity of Hywind Tampen wind turbines
except those for low frequency cetaceans where the respective SEL threshold limit is exceeded within a radius
of 52m around each individual wind turbine This however does not pose a risk to marine mammals In order to
receiveobserve this threshold limit an animal from the group of the low frequency cetaceans has to be present
within this zone for 24hours The probability that this happens is almost zero An actively movingmigrating
animal will pass this zone within a few seconds and even a none moving animal drifting with the currents will
only be exposed for a short time The ambient noise in the area is estimated to about 112 dB re 1 microPa SPL
this means the sound created by Hywind turbines is on average not audible to marine mammals beyond a
distance of 4km
The overall risk for marine mammals from continuous sound form Hywind Tampen during operations is
evaluated as non existing
62 Transient sound
Risk assessment for the transient is based on many assumptions related to the origin of the sound and the
strength of the sound on it source It is further not established if this so called ldquosnappingrdquo sound is an inherent
property of the Hywind design or if it is a property only be found on the Hywind 1
Risk assessment is included in this study because the strength of the snapping sound is close to some of the
threshold values (SPL 180dB re 1 microPa for harassment B definition) and needs consideration in case it is an
Doc No
Valid from Rev no
Security Classification Open - Status Final Page 25 of 25
inherent property of the Hywind design It is highly recommended to verify the presence or absence of this
feature on the Hywind Scotland installation In case of absence this risk assessment has not to be repeated for
future Hywind installations
The risk is however evaluated as low in general Higher sound pressures can only be expected very close to
the sound source and the the probability of being close to the source of the transient sound is small for any
marine mammal The sound energy animals would be exposed to if staying in the are for a longer period is
also relatively low and does not pose a risk It can not be expected that animals stay for 24hours in the area
and even if they the received sound energy is below any threshold levels for injury Behavioural reactions can
be expected at relatively close distances to the wind turbines eg avoiding Though it is not expected that this
has negative impact on individuals or populations of marine mammals
Overall the risk for marine mammals originating from the transient sound is evaluated as non-existing
Due to the risk of formally exceeding some threshold levels for the transient sound it is recommended to do
sound measurements at newer Hywind installations eg in Scotland to find out if the new design of the
mooring creates similar sound or not
7 Appendix
JASCO 2011 Hywind Acoustic Measurement Report Jasco Report NO 00229
Xodus 2015 Technical Note on Underwater Noise A-100142-S20-TECH-001
NOAA (2018) 2018 Revision to Technical Guidance for Assessing the Effects of Anthropogenic Sound on
Marine Mammal Hearing (Version 2) httpswwwfisheriesnoaagovnationalmarine-mammal-
protectionmarine-mammal-acoustic-technical-guidance
Tollefsen Christina D S (2013) Reccomendations for calculatintg sound speed profiles from field data
Defence RampD Canada Atlantic Technical1048577Memorandum DRDC Atlantic TM 2013-156
Ballard MS and Lee Kevin M2017 The Acoustics of Marine Sediments Acoustics Today volume 13 issue 3
Fall 2017
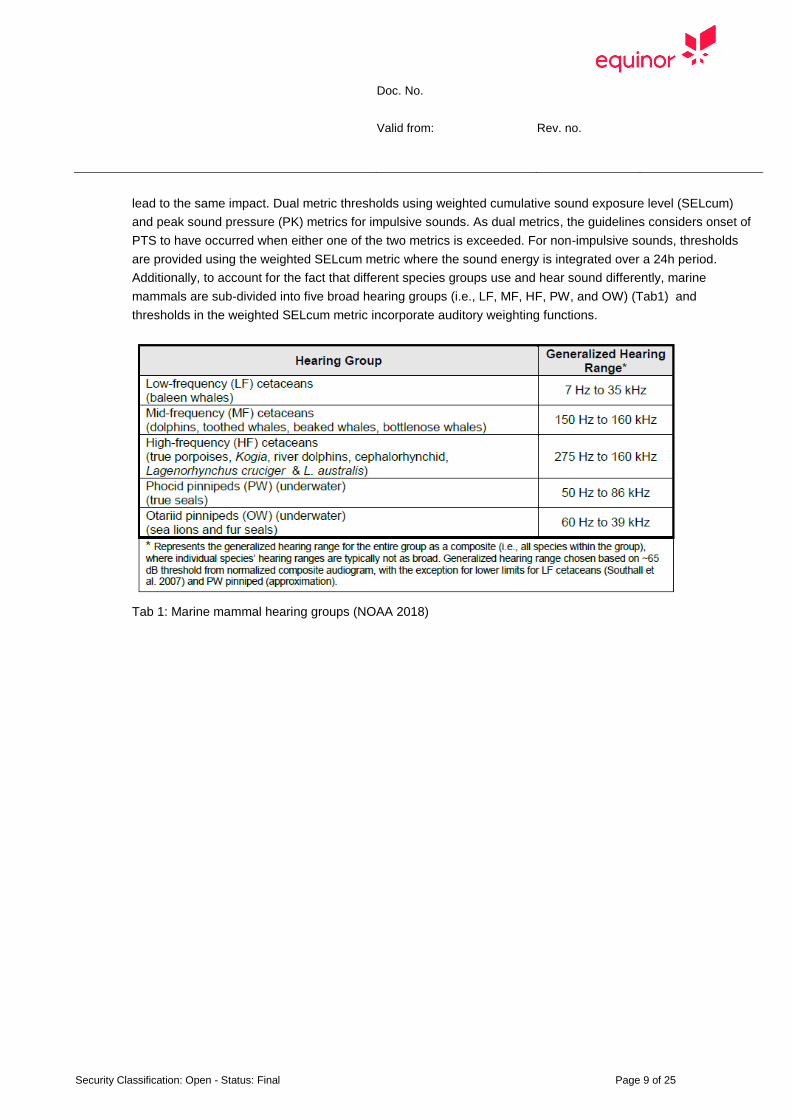
Doc No
Valid from Rev no
Security Classification Open - Status Final Page 9 of 25
lead to the same impact Dual metric thresholds using weighted cumulative sound exposure level (SELcum)
and peak sound pressure (PK) metrics for impulsive sounds As dual metrics the guidelines considers onset of
PTS to have occurred when either one of the two metrics is exceeded For non-impulsive sounds thresholds
are provided using the weighted SELcum metric where the sound energy is integrated over a 24h period
Additionally to account for the fact that different species groups use and hear sound differently marine
mammals are sub-divided into five broad hearing groups (ie LF MF HF PW and OW) (Tab1) and
thresholds in the weighted SELcum metric incorporate auditory weighting functions
Tab 1 Marine mammal hearing groups (NOAA 2018)
Doc No
Valid from Rev no
Security Classification Open - Status Final Page 10 of 25
Tab 2 Threshold values for onset of PTS as used in this report (NOAA 2018)
Tab 3 Threshold values for onset of TTS as used in this report (NOAA 2018)
The threshold criteria used in this report are in some parts more stringent than those used in the underwater
noise assessment for Hywind Scotland (Xodus 2015) This has been done because the NOAA guidelines are
Doc No
Valid from Rev no
Security Classification Open - Status Final Page 11 of 25
more recent and acknowledge the most recent literature in the field and because the NOAA guidelines are
geting increasing international attention
Threshold levels for behavioural reactions are extensively discussed in the Xodus report In this report the
same criteria are proposed (Table 4)
Table 4 Suggested marine mammal criteria for onset of disturbance (Xodus 2015)
3 Sound propagation modelling
31 Sound propagation modelling software
For sound propagation modelling the software package dBSea V 25 from Irwinn Carr consulting was used
The software uses bathymetry sediment and sound speed input data to build a 3D acoustic model of the
environment This paired with accurate sound propagation models such as dBSeaPE a Parabolic Equation
algorithm and dBSeaRay a Ray Theory algorithm make for accurate prediction of the sound propagation
Parabolic equation algorithms are known to be the most accurate for modelling low frequencies in shallow
water scenarios while ray theory algorithms deliver the best performance at higher frequencies
4 Input data sound modelling
41 Bathymetry
Bathymetry data were taken from EMODNet Bathymetry database (httpwwwemodnet-bathymetryeudata-
products) that provides bathymetry data for the area with about 100m resolution The postions of the Hywind
stucturs were taken from Hywind Tampen field layout document C219EQ-XE-00001-01 (Table 5)
Doc No
Valid from Rev no
Security Classification Open - Status Final Page 12 of 25
Table 5 Planned infrastructure coordinates for wind mill positions Please note that positions are given in
WGS84 not in ED50 as in field layout document
Fig 4 Hywind tampen placed on the bathymetry map
Name WGS84 Latitude WGS84 Longitude WGS84 UTMz31 Easting WGS84 UTMz31 Northing
HY01 61deg 21 59058 N 2deg 15 6223 E 459 99673 6 803 82959
HY02 61deg 21 12044 N 2deg 15 31773 E 460 35963 6 802 37063
HY03 61deg 20 25029 N 2deg 15 57302 E 460 72253 6 800 91167
HY04 61deg 19 38012 N 2deg 16 22809 E 461 08543 6 799 45272
HY05 61deg 18 50994 N 2deg 16 48295 E 461 44833 6 797 99376
HY06 61deg 18 3974 N 2deg 17 13760 E 461 81123 6 796 53480
HY07 61deg 18 16872 N 2deg 15 36355 E 460 36628 6 796 95000
HY08 61deg 19 3887 N 2deg 15 10846 E 460 00338 6 798 40896
HY09 61deg 19 50900 N 2deg 14 45317 E 459 64048 6 799 86792
HY10 61deg 20 37912 N 2deg 14 19766 E 459 27758 6 801 32687
HY11 61deg 21 24922 N 2deg 13 54194 E 458 91469 6 802 78583
Doc No
Valid from Rev no
Security Classification Open - Status Final Page 13 of 25
42 Sound velocity profile
Salinity temperature and pressure (depth) are the most important parameters that influence the speed of
sound in water Salinity and temperature profiles from World Ocean Database (NOAA National Centres for
Environmental Information (2005) Those data were used to calculate sound speed (Tollefsen CDS 2013)
using the following formula
c(TS z) = 14492+46T minus0055T2+00029T3
+(134minus001T)(Sminus35)+0016z
where T is the temperature in C S is the dimensionless salinity (frequently quoted as
Practical Salinity Units or PSU) and z is the depth in m From Equation 1 it is evident that the sound speed
depends most strongly on T with a weaker dependence on S and z
For each month a sound speed profile was calculated (Fig 5) Because sound is refracted towards depths of
low sound speed sound propagation differ over the seson In order to simulate sound propagation under most
different propagation conditions the sound speed profile for June and April (Fig 6)
Fig 5 Sound speed profiles representative for the area for each month For simulations sound speed profilrs
form April and June were used
Doc No
Valid from Rev no
Security Classification Open - Status Final Page 14 of 25
Fig 6 Sound speed prfiles for April (left) and July (right) as used in dBSea
For calculation of sound absorption effects in the water column average values for water temperature and
salinity for April (707decC 3513PSU) and July were used (872decC 3510PSU
43 Sea bed properties
The acoustic properties of the sea floor have influence of the amount of sound reflected from the sea floor
Bottoms with higher sound speed than the overlying water do reflect more sound back into the water column
than bottoms with lower sound speed (Ballard 2017) In this study we used information from the Equinor
ldquoHywind Tampen Substucure and Mooring System Functional requirementsrdquo report
For the model a sandy layer of 1m thickness with a sound velocity of 1650ms a density of 1900kgm and a
attenuation of 08dBwavelength as used and a clay from 1 m to infinite depth with sound velocity of 1500ms
and density of 1500kgm3 and an attenuttion of 02 dBwavelength was used
44 Sound source properties
Equinor commissioned Fugro GEOS and Jasco Applied Sciences to undertake underwater noise
measurements in the vicinity of Hywind 1 installation at a test site north-west of Stavanger Norway The
purpose of this exercise was to quantify potential underwater noise emissions form the Hywind turbines during
operation in order to inform any impact assessments what will be required for future Hywind projects
Measurements were undertaken at a test location some 150 m from the main structure and the hydrophone
was deployed at a depth of 91 m Additional background noise level readings were undertaken at a remote
control site with comparable natural environmental conditions 10 km from the Hywind test site
This measurements were used to assess noise impact for the Hywind Scotland project This study was done by
Xodus in 2015 The study by Xodus also includes suggestion on upscaling the produces sound to the
somehow bigger turbines to be used for Hywind Scotland In this study we use information from both reports for
the definition of the source strength for the sound at Hywind Tampen
441 Operational sound
Sound originating form Hywind was reported in the respective JASCO report as power spectral densities and
as 13 octave band spectral values (ref Figure 25 and Figure 38 in JASCO Measurement Report) Those data
were measured at 150m distance The Jasco report identified tonal frequencies created by the Hywind at 25Hz
and harmonics thereof with frequencies of 50 Hz and 125Hz Power spectral densities from the Jasco report
were converted to approximate sound pressure level data in third octave bins Same results as in the Xodus
report were achieved In order to get values at source spherical propagation was assumed and 435dB were
added to the values measured at 150m A 4 dB upscaling factor was used according to the suggestions made
Doc No
Valid from Rev no
Security Classification Open - Status Final Page 15 of 25
in the Xodus 2015 report A total SPL source level of 166 dB re 1microPa 1m (rms) was used for each of the
Hywwind Tampen wind turbines in the simulations
Fig 7 Spectral content of the operational noise used in the sound simulations Only those frequency bands
that show clear difference to the general ambient sound in the area are shown
Note The steps of reading out data from graphs in the Jasco report doing back calculations to source level
and the upscaling to bigger wind turbines is based on some assumptions and results in uncertainty Especially
the scaling factor of 4dB for the bigger and more powerful wind turbines is based on assumptions field
measurement on bigger floating wind turbines are not available
442 Impulsive Sound
The Hywind 1 sound study identified a transient sound measurable in the vicinity of Hywind 1 The exact origin
of this transient sound has not been identified it is assumed to be produced by tension realese in the mooring
structure It is unknown if other Hywind installations also exhibit this transient noise
This transient sound was measured above SPLpeak 160 dB re 1 microPa at a distance of 150m corresponding to
SPL of 120 to 125 dB re 1microPa The frequency of this sound extends troughout the recorded frequency range of
0-20kHz
For this study a original sound file from the Hywind I study was used for the sound source characterisation of
the snapping sound (as WAF file) This signal was scaled up to the source strength on the place of its assumed
place of origin on the shaft of the Hywind structure in 150m distance Sperical propagation laws were assumed
and 435 dB was added to the sound level measured at 150 resulting in a SPLpeak level at the source for a
individual turbine to be 203dB re 1 microPa 1m The snapping sound was reported to occur up to 23 times a
day for calculation of SEL over 24h 23 snapping events per day per wind turbine were used accumulating to
253 snapping events for all the Hywind Tampen wind turbines
There is a high uncertainty for the source strength of this transient sound mostly attributed to the unknown
position of its origin It could be stronger or weaker calculations done in this study are only a rough indication
Doc No
Valid from Rev no
Security Classification Open - Status Final Page 16 of 25
Fig 8Transient sound from Hywind expressed with relative sound pressure
Doc No
Valid from Rev no
Security Classification Open - Status Final Page 17 of 25
Fig 9 Input data for transient sound used in modelling softwareExample for HY01 Original wav file measured
at 150m distance upscaled to source level at 1 m from source
A Fast Fourier Transformation (FFT) of the sound file (Audacity V222) showed a main frequency content of
the signal between 50Hz and 10kHz (Fig 10) Lower and higher frequencies are about 10dB lower and are not
considered in the respective modelling because the contribute less than 1 to the sound energy
Doc No
Valid from Rev no
Security Classification Open - Status Final Page 18 of 25
Fig 10
45 Sound propagation solvers
Continous sound
For frequencies 125Hz to 400Hz a solver for the parabolic wave equation was used and for frequencies
above 400 Hz a solver for ray tracing Frequency for simulations was 125Hz to 16kHz
Specific settings for parabolic wave equation an ray tracer solver in dBSea are given in appendix X
Impulsive sound
For calculation of SEL A ray tracer was used throughout the frequency spectrum Frequency spectrum was
315Hz to 125kHz For calculation of SPL a split solver with parabolic wave equation up to 400Hz and a ray
tracer for higher frequencies
Doc No
Valid from Rev no
Security Classification Open - Status Final Page 19 of 25
5 Results
51 Continuous sound SPL
The sound velocity profile used for the April and July simulations resulted in less propagation loss at distances
from the sound sources for the April simulations (better propagation conditions) differences are relatively small
(Fig11) Because of this we use the simulation for April for the further assessment
Fig 11 Sound pressure levels SPLpeak for April and July simulation Highest level from all depth projected to
the surface
Doc No
Valid from Rev no
Security Classification Open - Status Final Page 20 of 25
Fig 12 Sound pressure levels SPLpeak for April across positions HY4 and HY8 (position of transect in insert)
Sound propagation around each wind turbine is almost circular with a slightly better propagation into the north-
east direction where the water depth increases Sound propagation is also fairly uniform at different water
depth (Fig 12) with a slightly reduced sound strength at the surface
In the risk assessment for possible impacts it is always the distance of the highest value that is considered and
all graphical displays show the highest value projected to the surface
If a non-impulsive sound has the potential of exceeding the peak sound pressure level threshold associates
with impulsive sound (Table 2) these tresholds are recommended for consideration according to the NOAA
guedelines
For the Hywind Tampen continuous sound none of the sound pressure thresholds for injury are
exceeded
The threshold for behavioural reaction of SPL 160 db re 1 microPa is not exceeded at any distance to the wind
turbines The lower threshold limit of SPL 120 dB re 1 microPa is about at 2000m distance to the wind mills (Fig
13) Ambient sound SPL in the area is about 112dB re 1microPa in average and 132dB re microPa at noisy days The
the indicated distance to the 120dB isopleth is also showing the audible distance at a days above average
ambient sound On days with average ambient sound levels the noise from Hywind Tampen will be audible to
animals at about 4km
Doc No
Valid from Rev no
Security Classification Open - Status Final Page 21 of 25
Fig 13 Isopleth of the 120dB re 1 microPa threshold limit for behavioural disturbance (Table 4) around the Hywind
Tampen windmills
52 Continuous sound SEL
Sound exposure patterns follow the spatial pattern for sound pressure for the unweighted SEL calculations (Fig
14 SELcum24h unweighted) There are very small differences in the sound propagation when SEL weighted
functions are use because different frequencies propagate different
Unweighted SEL and weighted SEL for all species groups from Table 2 are shown in Fig 14
Doc No
Valid from Rev no
Security Classification Open - Status Final Page 22 of 25
Fig14 Weighted SEL values for groups of marine mammals according to table 6
Table 6 NOAA risk critaria for marine mammals and relevant distances for threshold values NA shows that the
respective threshold value is not exceeded
NOAA criteria Project LE = SELcum re 1 microPa
2s
Hywind Tampen operational sound
Hearing group
range
(average)
(m)
range
max (km)
PTS Onset Threshold levels non impulsive sound
Low-Frequency (LF) Cetaceans LEp LF24h 199 dB NA NA
Mid-Frequency (MF) Cetaceans LEp MF24h 198 dB NA NA
High-Frequency (HF) Cetaceans LEp HF24h 173 dB NA NA
Phocoid Pinnipeds (PW) LEpPW24h 201 dB NA NA
Otariid Pinnipeds (OW) LEp OW24h 219 dB NA NA
TTS onset thresholds for non-impulsive sounds
Low-Frequency (LF) Cetaceans LEp LF24h 179 dB 45 52
Mid-Frequency (MF) Cetaceans LEp MF24h 178 dB NA NA
High-Frequency (HF) Cetaceans LEp HF24h 153 dB NA NA
Phocoid Pinnipeds (PW) LEpPW24h 181 dB NA NA
Otariid Pinnipeds (OW) LEp OW24h 199 dB NA NA
Doc No
Valid from Rev no
Security Classification Open - Status Final Page 23 of 25
53 Transient sound (snapping sound)
The SPLpeak at the source is with 203dB re 1 microPa just above the PTS threshold limit for high frequency
cetaceans but will drop below this threshold at a short distance (around 1 meter) to the source It is well below
threshold limits for single and multiple impulses suggested by Southall (2007) This peak value corresponds to
a SPL of 173dB re 1 microPa this is below the threshold limit for injury but above the threshold values for
behavioural disturbance of 160 dB re 1 microPa (strong reaction) and 140dB re microPa (mild reaction) The 140dB
threshold limit for weak reaction would be exceeded at distances below 160m those for the 160dB threshold
for strong reaction at 16m form the source It again has to be stressed that the available information on the
origin of the transient sound only allows a coarse estimate
Fig 15 SPL around a single turbine with indication of threshold limit for mild behavioural reaction to marine
mammals Average distance to the SPL 140 dB re 1microPa isopleth is 160m those to the SPL 160 dB re 1 microPa
isopleth is about 8m
The SELcum24h values also stay below the threshold levels for injury (Fig 16) for all groups of marine mammals
Doc No
Valid from Rev no
Security Classification Open - Status Final Page 24 of 25
Fig 16 SELcum 24 of this transient sound as unweighted and weighted SELcum24h shows that the threshold
limits for injury are not exceeded at any distance to the wind tubines
6 Risk evaluation of sound originating from Hywind Tampen windturbines
61 Continous sound evaluated on SPL and SEL metrics
The threshold limits for injury (PTS and TTS) are not exceeded in the vicinity of Hywind Tampen wind turbines
except those for low frequency cetaceans where the respective SEL threshold limit is exceeded within a radius
of 52m around each individual wind turbine This however does not pose a risk to marine mammals In order to
receiveobserve this threshold limit an animal from the group of the low frequency cetaceans has to be present
within this zone for 24hours The probability that this happens is almost zero An actively movingmigrating
animal will pass this zone within a few seconds and even a none moving animal drifting with the currents will
only be exposed for a short time The ambient noise in the area is estimated to about 112 dB re 1 microPa SPL
this means the sound created by Hywind turbines is on average not audible to marine mammals beyond a
distance of 4km
The overall risk for marine mammals from continuous sound form Hywind Tampen during operations is
evaluated as non existing
62 Transient sound
Risk assessment for the transient is based on many assumptions related to the origin of the sound and the
strength of the sound on it source It is further not established if this so called ldquosnappingrdquo sound is an inherent
property of the Hywind design or if it is a property only be found on the Hywind 1
Risk assessment is included in this study because the strength of the snapping sound is close to some of the
threshold values (SPL 180dB re 1 microPa for harassment B definition) and needs consideration in case it is an
Doc No
Valid from Rev no
Security Classification Open - Status Final Page 25 of 25
inherent property of the Hywind design It is highly recommended to verify the presence or absence of this
feature on the Hywind Scotland installation In case of absence this risk assessment has not to be repeated for
future Hywind installations
The risk is however evaluated as low in general Higher sound pressures can only be expected very close to
the sound source and the the probability of being close to the source of the transient sound is small for any
marine mammal The sound energy animals would be exposed to if staying in the are for a longer period is
also relatively low and does not pose a risk It can not be expected that animals stay for 24hours in the area
and even if they the received sound energy is below any threshold levels for injury Behavioural reactions can
be expected at relatively close distances to the wind turbines eg avoiding Though it is not expected that this
has negative impact on individuals or populations of marine mammals
Overall the risk for marine mammals originating from the transient sound is evaluated as non-existing
Due to the risk of formally exceeding some threshold levels for the transient sound it is recommended to do
sound measurements at newer Hywind installations eg in Scotland to find out if the new design of the
mooring creates similar sound or not
7 Appendix
JASCO 2011 Hywind Acoustic Measurement Report Jasco Report NO 00229
Xodus 2015 Technical Note on Underwater Noise A-100142-S20-TECH-001
NOAA (2018) 2018 Revision to Technical Guidance for Assessing the Effects of Anthropogenic Sound on
Marine Mammal Hearing (Version 2) httpswwwfisheriesnoaagovnationalmarine-mammal-
protectionmarine-mammal-acoustic-technical-guidance
Tollefsen Christina D S (2013) Reccomendations for calculatintg sound speed profiles from field data
Defence RampD Canada Atlantic Technical1048577Memorandum DRDC Atlantic TM 2013-156
Ballard MS and Lee Kevin M2017 The Acoustics of Marine Sediments Acoustics Today volume 13 issue 3
Fall 2017
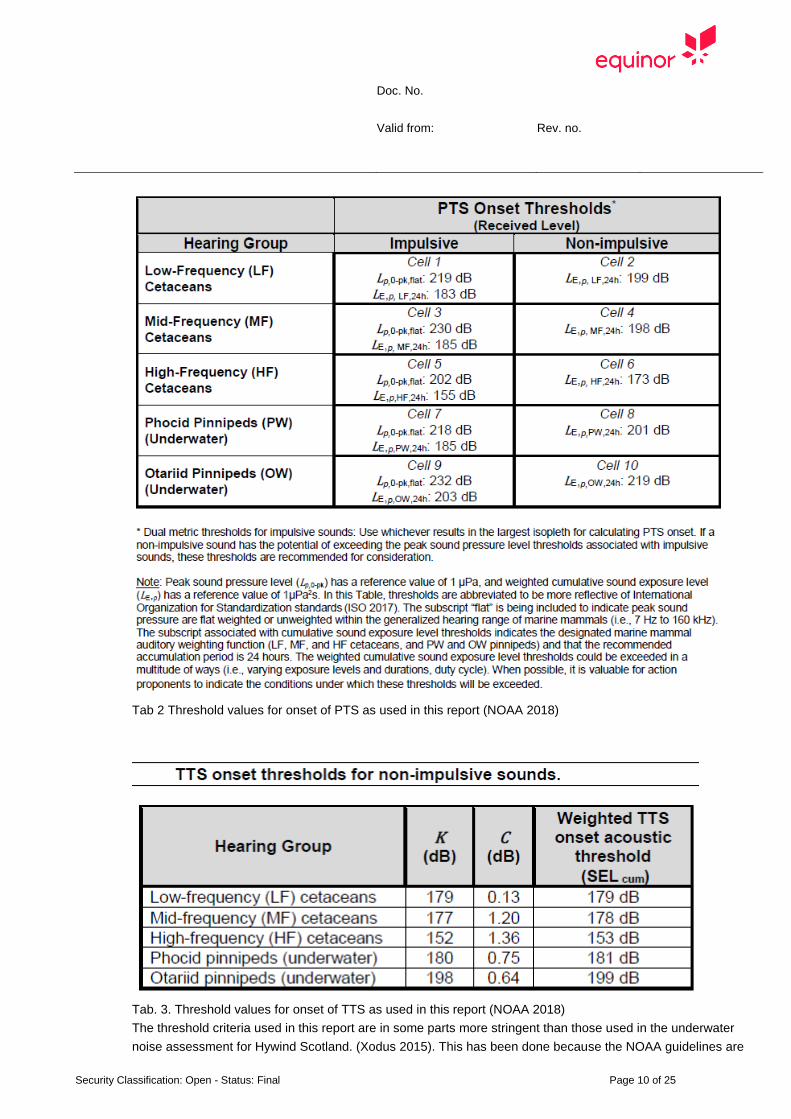
Doc No
Valid from Rev no
Security Classification Open - Status Final Page 10 of 25
Tab 2 Threshold values for onset of PTS as used in this report (NOAA 2018)
Tab 3 Threshold values for onset of TTS as used in this report (NOAA 2018)
The threshold criteria used in this report are in some parts more stringent than those used in the underwater
noise assessment for Hywind Scotland (Xodus 2015) This has been done because the NOAA guidelines are
Doc No
Valid from Rev no
Security Classification Open - Status Final Page 11 of 25
more recent and acknowledge the most recent literature in the field and because the NOAA guidelines are
geting increasing international attention
Threshold levels for behavioural reactions are extensively discussed in the Xodus report In this report the
same criteria are proposed (Table 4)
Table 4 Suggested marine mammal criteria for onset of disturbance (Xodus 2015)
3 Sound propagation modelling
31 Sound propagation modelling software
For sound propagation modelling the software package dBSea V 25 from Irwinn Carr consulting was used
The software uses bathymetry sediment and sound speed input data to build a 3D acoustic model of the
environment This paired with accurate sound propagation models such as dBSeaPE a Parabolic Equation
algorithm and dBSeaRay a Ray Theory algorithm make for accurate prediction of the sound propagation
Parabolic equation algorithms are known to be the most accurate for modelling low frequencies in shallow
water scenarios while ray theory algorithms deliver the best performance at higher frequencies
4 Input data sound modelling
41 Bathymetry
Bathymetry data were taken from EMODNet Bathymetry database (httpwwwemodnet-bathymetryeudata-
products) that provides bathymetry data for the area with about 100m resolution The postions of the Hywind
stucturs were taken from Hywind Tampen field layout document C219EQ-XE-00001-01 (Table 5)
Doc No
Valid from Rev no
Security Classification Open - Status Final Page 12 of 25
Table 5 Planned infrastructure coordinates for wind mill positions Please note that positions are given in
WGS84 not in ED50 as in field layout document
Fig 4 Hywind tampen placed on the bathymetry map
Name WGS84 Latitude WGS84 Longitude WGS84 UTMz31 Easting WGS84 UTMz31 Northing
HY01 61deg 21 59058 N 2deg 15 6223 E 459 99673 6 803 82959
HY02 61deg 21 12044 N 2deg 15 31773 E 460 35963 6 802 37063
HY03 61deg 20 25029 N 2deg 15 57302 E 460 72253 6 800 91167
HY04 61deg 19 38012 N 2deg 16 22809 E 461 08543 6 799 45272
HY05 61deg 18 50994 N 2deg 16 48295 E 461 44833 6 797 99376
HY06 61deg 18 3974 N 2deg 17 13760 E 461 81123 6 796 53480
HY07 61deg 18 16872 N 2deg 15 36355 E 460 36628 6 796 95000
HY08 61deg 19 3887 N 2deg 15 10846 E 460 00338 6 798 40896
HY09 61deg 19 50900 N 2deg 14 45317 E 459 64048 6 799 86792
HY10 61deg 20 37912 N 2deg 14 19766 E 459 27758 6 801 32687
HY11 61deg 21 24922 N 2deg 13 54194 E 458 91469 6 802 78583
Doc No
Valid from Rev no
Security Classification Open - Status Final Page 13 of 25
42 Sound velocity profile
Salinity temperature and pressure (depth) are the most important parameters that influence the speed of
sound in water Salinity and temperature profiles from World Ocean Database (NOAA National Centres for
Environmental Information (2005) Those data were used to calculate sound speed (Tollefsen CDS 2013)
using the following formula
c(TS z) = 14492+46T minus0055T2+00029T3
+(134minus001T)(Sminus35)+0016z
where T is the temperature in C S is the dimensionless salinity (frequently quoted as
Practical Salinity Units or PSU) and z is the depth in m From Equation 1 it is evident that the sound speed
depends most strongly on T with a weaker dependence on S and z
For each month a sound speed profile was calculated (Fig 5) Because sound is refracted towards depths of
low sound speed sound propagation differ over the seson In order to simulate sound propagation under most
different propagation conditions the sound speed profile for June and April (Fig 6)
Fig 5 Sound speed profiles representative for the area for each month For simulations sound speed profilrs
form April and June were used
Doc No
Valid from Rev no
Security Classification Open - Status Final Page 14 of 25
Fig 6 Sound speed prfiles for April (left) and July (right) as used in dBSea
For calculation of sound absorption effects in the water column average values for water temperature and
salinity for April (707decC 3513PSU) and July were used (872decC 3510PSU
43 Sea bed properties
The acoustic properties of the sea floor have influence of the amount of sound reflected from the sea floor
Bottoms with higher sound speed than the overlying water do reflect more sound back into the water column
than bottoms with lower sound speed (Ballard 2017) In this study we used information from the Equinor
ldquoHywind Tampen Substucure and Mooring System Functional requirementsrdquo report
For the model a sandy layer of 1m thickness with a sound velocity of 1650ms a density of 1900kgm and a
attenuation of 08dBwavelength as used and a clay from 1 m to infinite depth with sound velocity of 1500ms
and density of 1500kgm3 and an attenuttion of 02 dBwavelength was used
44 Sound source properties
Equinor commissioned Fugro GEOS and Jasco Applied Sciences to undertake underwater noise
measurements in the vicinity of Hywind 1 installation at a test site north-west of Stavanger Norway The
purpose of this exercise was to quantify potential underwater noise emissions form the Hywind turbines during
operation in order to inform any impact assessments what will be required for future Hywind projects
Measurements were undertaken at a test location some 150 m from the main structure and the hydrophone
was deployed at a depth of 91 m Additional background noise level readings were undertaken at a remote
control site with comparable natural environmental conditions 10 km from the Hywind test site
This measurements were used to assess noise impact for the Hywind Scotland project This study was done by
Xodus in 2015 The study by Xodus also includes suggestion on upscaling the produces sound to the
somehow bigger turbines to be used for Hywind Scotland In this study we use information from both reports for
the definition of the source strength for the sound at Hywind Tampen
441 Operational sound
Sound originating form Hywind was reported in the respective JASCO report as power spectral densities and
as 13 octave band spectral values (ref Figure 25 and Figure 38 in JASCO Measurement Report) Those data
were measured at 150m distance The Jasco report identified tonal frequencies created by the Hywind at 25Hz
and harmonics thereof with frequencies of 50 Hz and 125Hz Power spectral densities from the Jasco report
were converted to approximate sound pressure level data in third octave bins Same results as in the Xodus
report were achieved In order to get values at source spherical propagation was assumed and 435dB were
added to the values measured at 150m A 4 dB upscaling factor was used according to the suggestions made
Doc No
Valid from Rev no
Security Classification Open - Status Final Page 15 of 25
in the Xodus 2015 report A total SPL source level of 166 dB re 1microPa 1m (rms) was used for each of the
Hywwind Tampen wind turbines in the simulations
Fig 7 Spectral content of the operational noise used in the sound simulations Only those frequency bands
that show clear difference to the general ambient sound in the area are shown
Note The steps of reading out data from graphs in the Jasco report doing back calculations to source level
and the upscaling to bigger wind turbines is based on some assumptions and results in uncertainty Especially
the scaling factor of 4dB for the bigger and more powerful wind turbines is based on assumptions field
measurement on bigger floating wind turbines are not available
442 Impulsive Sound
The Hywind 1 sound study identified a transient sound measurable in the vicinity of Hywind 1 The exact origin
of this transient sound has not been identified it is assumed to be produced by tension realese in the mooring
structure It is unknown if other Hywind installations also exhibit this transient noise
This transient sound was measured above SPLpeak 160 dB re 1 microPa at a distance of 150m corresponding to
SPL of 120 to 125 dB re 1microPa The frequency of this sound extends troughout the recorded frequency range of
0-20kHz
For this study a original sound file from the Hywind I study was used for the sound source characterisation of
the snapping sound (as WAF file) This signal was scaled up to the source strength on the place of its assumed
place of origin on the shaft of the Hywind structure in 150m distance Sperical propagation laws were assumed
and 435 dB was added to the sound level measured at 150 resulting in a SPLpeak level at the source for a
individual turbine to be 203dB re 1 microPa 1m The snapping sound was reported to occur up to 23 times a
day for calculation of SEL over 24h 23 snapping events per day per wind turbine were used accumulating to
253 snapping events for all the Hywind Tampen wind turbines
There is a high uncertainty for the source strength of this transient sound mostly attributed to the unknown
position of its origin It could be stronger or weaker calculations done in this study are only a rough indication
Doc No
Valid from Rev no
Security Classification Open - Status Final Page 16 of 25
Fig 8Transient sound from Hywind expressed with relative sound pressure
Doc No
Valid from Rev no
Security Classification Open - Status Final Page 17 of 25
Fig 9 Input data for transient sound used in modelling softwareExample for HY01 Original wav file measured
at 150m distance upscaled to source level at 1 m from source
A Fast Fourier Transformation (FFT) of the sound file (Audacity V222) showed a main frequency content of
the signal between 50Hz and 10kHz (Fig 10) Lower and higher frequencies are about 10dB lower and are not
considered in the respective modelling because the contribute less than 1 to the sound energy
Doc No
Valid from Rev no
Security Classification Open - Status Final Page 18 of 25
Fig 10
45 Sound propagation solvers
Continous sound
For frequencies 125Hz to 400Hz a solver for the parabolic wave equation was used and for frequencies
above 400 Hz a solver for ray tracing Frequency for simulations was 125Hz to 16kHz
Specific settings for parabolic wave equation an ray tracer solver in dBSea are given in appendix X
Impulsive sound
For calculation of SEL A ray tracer was used throughout the frequency spectrum Frequency spectrum was
315Hz to 125kHz For calculation of SPL a split solver with parabolic wave equation up to 400Hz and a ray
tracer for higher frequencies
Doc No
Valid from Rev no
Security Classification Open - Status Final Page 19 of 25
5 Results
51 Continuous sound SPL
The sound velocity profile used for the April and July simulations resulted in less propagation loss at distances
from the sound sources for the April simulations (better propagation conditions) differences are relatively small
(Fig11) Because of this we use the simulation for April for the further assessment
Fig 11 Sound pressure levels SPLpeak for April and July simulation Highest level from all depth projected to
the surface
Doc No
Valid from Rev no
Security Classification Open - Status Final Page 20 of 25
Fig 12 Sound pressure levels SPLpeak for April across positions HY4 and HY8 (position of transect in insert)
Sound propagation around each wind turbine is almost circular with a slightly better propagation into the north-
east direction where the water depth increases Sound propagation is also fairly uniform at different water
depth (Fig 12) with a slightly reduced sound strength at the surface
In the risk assessment for possible impacts it is always the distance of the highest value that is considered and
all graphical displays show the highest value projected to the surface
If a non-impulsive sound has the potential of exceeding the peak sound pressure level threshold associates
with impulsive sound (Table 2) these tresholds are recommended for consideration according to the NOAA
guedelines
For the Hywind Tampen continuous sound none of the sound pressure thresholds for injury are
exceeded
The threshold for behavioural reaction of SPL 160 db re 1 microPa is not exceeded at any distance to the wind
turbines The lower threshold limit of SPL 120 dB re 1 microPa is about at 2000m distance to the wind mills (Fig
13) Ambient sound SPL in the area is about 112dB re 1microPa in average and 132dB re microPa at noisy days The
the indicated distance to the 120dB isopleth is also showing the audible distance at a days above average
ambient sound On days with average ambient sound levels the noise from Hywind Tampen will be audible to
animals at about 4km
Doc No
Valid from Rev no
Security Classification Open - Status Final Page 21 of 25
Fig 13 Isopleth of the 120dB re 1 microPa threshold limit for behavioural disturbance (Table 4) around the Hywind
Tampen windmills
52 Continuous sound SEL
Sound exposure patterns follow the spatial pattern for sound pressure for the unweighted SEL calculations (Fig
14 SELcum24h unweighted) There are very small differences in the sound propagation when SEL weighted
functions are use because different frequencies propagate different
Unweighted SEL and weighted SEL for all species groups from Table 2 are shown in Fig 14
Doc No
Valid from Rev no
Security Classification Open - Status Final Page 22 of 25
Fig14 Weighted SEL values for groups of marine mammals according to table 6
Table 6 NOAA risk critaria for marine mammals and relevant distances for threshold values NA shows that the
respective threshold value is not exceeded
NOAA criteria Project LE = SELcum re 1 microPa
2s
Hywind Tampen operational sound
Hearing group
range
(average)
(m)
range
max (km)
PTS Onset Threshold levels non impulsive sound
Low-Frequency (LF) Cetaceans LEp LF24h 199 dB NA NA
Mid-Frequency (MF) Cetaceans LEp MF24h 198 dB NA NA
High-Frequency (HF) Cetaceans LEp HF24h 173 dB NA NA
Phocoid Pinnipeds (PW) LEpPW24h 201 dB NA NA
Otariid Pinnipeds (OW) LEp OW24h 219 dB NA NA
TTS onset thresholds for non-impulsive sounds
Low-Frequency (LF) Cetaceans LEp LF24h 179 dB 45 52
Mid-Frequency (MF) Cetaceans LEp MF24h 178 dB NA NA
High-Frequency (HF) Cetaceans LEp HF24h 153 dB NA NA
Phocoid Pinnipeds (PW) LEpPW24h 181 dB NA NA
Otariid Pinnipeds (OW) LEp OW24h 199 dB NA NA
Doc No
Valid from Rev no
Security Classification Open - Status Final Page 23 of 25
53 Transient sound (snapping sound)
The SPLpeak at the source is with 203dB re 1 microPa just above the PTS threshold limit for high frequency
cetaceans but will drop below this threshold at a short distance (around 1 meter) to the source It is well below
threshold limits for single and multiple impulses suggested by Southall (2007) This peak value corresponds to
a SPL of 173dB re 1 microPa this is below the threshold limit for injury but above the threshold values for
behavioural disturbance of 160 dB re 1 microPa (strong reaction) and 140dB re microPa (mild reaction) The 140dB
threshold limit for weak reaction would be exceeded at distances below 160m those for the 160dB threshold
for strong reaction at 16m form the source It again has to be stressed that the available information on the
origin of the transient sound only allows a coarse estimate
Fig 15 SPL around a single turbine with indication of threshold limit for mild behavioural reaction to marine
mammals Average distance to the SPL 140 dB re 1microPa isopleth is 160m those to the SPL 160 dB re 1 microPa
isopleth is about 8m
The SELcum24h values also stay below the threshold levels for injury (Fig 16) for all groups of marine mammals
Doc No
Valid from Rev no
Security Classification Open - Status Final Page 24 of 25
Fig 16 SELcum 24 of this transient sound as unweighted and weighted SELcum24h shows that the threshold
limits for injury are not exceeded at any distance to the wind tubines
6 Risk evaluation of sound originating from Hywind Tampen windturbines
61 Continous sound evaluated on SPL and SEL metrics
The threshold limits for injury (PTS and TTS) are not exceeded in the vicinity of Hywind Tampen wind turbines
except those for low frequency cetaceans where the respective SEL threshold limit is exceeded within a radius
of 52m around each individual wind turbine This however does not pose a risk to marine mammals In order to
receiveobserve this threshold limit an animal from the group of the low frequency cetaceans has to be present
within this zone for 24hours The probability that this happens is almost zero An actively movingmigrating
animal will pass this zone within a few seconds and even a none moving animal drifting with the currents will
only be exposed for a short time The ambient noise in the area is estimated to about 112 dB re 1 microPa SPL
this means the sound created by Hywind turbines is on average not audible to marine mammals beyond a
distance of 4km
The overall risk for marine mammals from continuous sound form Hywind Tampen during operations is
evaluated as non existing
62 Transient sound
Risk assessment for the transient is based on many assumptions related to the origin of the sound and the
strength of the sound on it source It is further not established if this so called ldquosnappingrdquo sound is an inherent
property of the Hywind design or if it is a property only be found on the Hywind 1
Risk assessment is included in this study because the strength of the snapping sound is close to some of the
threshold values (SPL 180dB re 1 microPa for harassment B definition) and needs consideration in case it is an
Doc No
Valid from Rev no
Security Classification Open - Status Final Page 25 of 25
inherent property of the Hywind design It is highly recommended to verify the presence or absence of this
feature on the Hywind Scotland installation In case of absence this risk assessment has not to be repeated for
future Hywind installations
The risk is however evaluated as low in general Higher sound pressures can only be expected very close to
the sound source and the the probability of being close to the source of the transient sound is small for any
marine mammal The sound energy animals would be exposed to if staying in the are for a longer period is
also relatively low and does not pose a risk It can not be expected that animals stay for 24hours in the area
and even if they the received sound energy is below any threshold levels for injury Behavioural reactions can
be expected at relatively close distances to the wind turbines eg avoiding Though it is not expected that this
has negative impact on individuals or populations of marine mammals
Overall the risk for marine mammals originating from the transient sound is evaluated as non-existing
Due to the risk of formally exceeding some threshold levels for the transient sound it is recommended to do
sound measurements at newer Hywind installations eg in Scotland to find out if the new design of the
mooring creates similar sound or not
7 Appendix
JASCO 2011 Hywind Acoustic Measurement Report Jasco Report NO 00229
Xodus 2015 Technical Note on Underwater Noise A-100142-S20-TECH-001
NOAA (2018) 2018 Revision to Technical Guidance for Assessing the Effects of Anthropogenic Sound on
Marine Mammal Hearing (Version 2) httpswwwfisheriesnoaagovnationalmarine-mammal-
protectionmarine-mammal-acoustic-technical-guidance
Tollefsen Christina D S (2013) Reccomendations for calculatintg sound speed profiles from field data
Defence RampD Canada Atlantic Technical1048577Memorandum DRDC Atlantic TM 2013-156
Ballard MS and Lee Kevin M2017 The Acoustics of Marine Sediments Acoustics Today volume 13 issue 3
Fall 2017
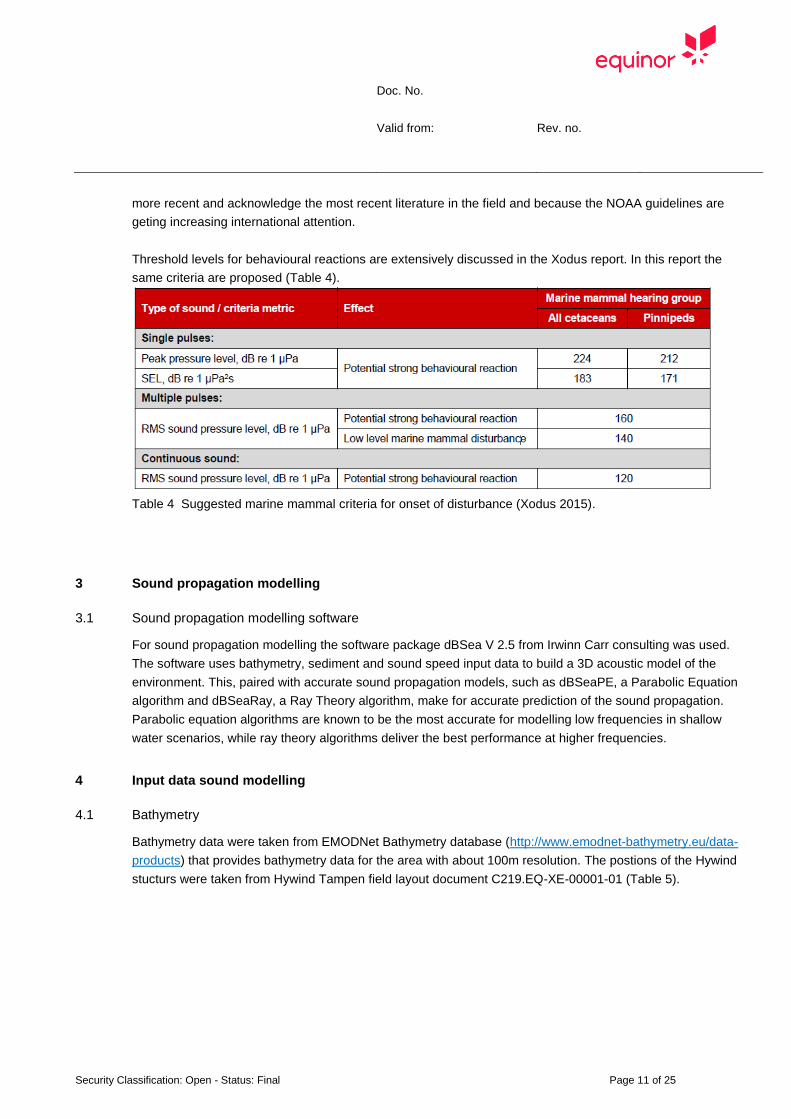
Doc No
Valid from Rev no
Security Classification Open - Status Final Page 11 of 25
more recent and acknowledge the most recent literature in the field and because the NOAA guidelines are
geting increasing international attention
Threshold levels for behavioural reactions are extensively discussed in the Xodus report In this report the
same criteria are proposed (Table 4)
Table 4 Suggested marine mammal criteria for onset of disturbance (Xodus 2015)
3 Sound propagation modelling
31 Sound propagation modelling software
For sound propagation modelling the software package dBSea V 25 from Irwinn Carr consulting was used
The software uses bathymetry sediment and sound speed input data to build a 3D acoustic model of the
environment This paired with accurate sound propagation models such as dBSeaPE a Parabolic Equation
algorithm and dBSeaRay a Ray Theory algorithm make for accurate prediction of the sound propagation
Parabolic equation algorithms are known to be the most accurate for modelling low frequencies in shallow
water scenarios while ray theory algorithms deliver the best performance at higher frequencies
4 Input data sound modelling
41 Bathymetry
Bathymetry data were taken from EMODNet Bathymetry database (httpwwwemodnet-bathymetryeudata-
products) that provides bathymetry data for the area with about 100m resolution The postions of the Hywind
stucturs were taken from Hywind Tampen field layout document C219EQ-XE-00001-01 (Table 5)
Doc No
Valid from Rev no
Security Classification Open - Status Final Page 12 of 25
Table 5 Planned infrastructure coordinates for wind mill positions Please note that positions are given in
WGS84 not in ED50 as in field layout document
Fig 4 Hywind tampen placed on the bathymetry map
Name WGS84 Latitude WGS84 Longitude WGS84 UTMz31 Easting WGS84 UTMz31 Northing
HY01 61deg 21 59058 N 2deg 15 6223 E 459 99673 6 803 82959
HY02 61deg 21 12044 N 2deg 15 31773 E 460 35963 6 802 37063
HY03 61deg 20 25029 N 2deg 15 57302 E 460 72253 6 800 91167
HY04 61deg 19 38012 N 2deg 16 22809 E 461 08543 6 799 45272
HY05 61deg 18 50994 N 2deg 16 48295 E 461 44833 6 797 99376
HY06 61deg 18 3974 N 2deg 17 13760 E 461 81123 6 796 53480
HY07 61deg 18 16872 N 2deg 15 36355 E 460 36628 6 796 95000
HY08 61deg 19 3887 N 2deg 15 10846 E 460 00338 6 798 40896
HY09 61deg 19 50900 N 2deg 14 45317 E 459 64048 6 799 86792
HY10 61deg 20 37912 N 2deg 14 19766 E 459 27758 6 801 32687
HY11 61deg 21 24922 N 2deg 13 54194 E 458 91469 6 802 78583
Doc No
Valid from Rev no
Security Classification Open - Status Final Page 13 of 25
42 Sound velocity profile
Salinity temperature and pressure (depth) are the most important parameters that influence the speed of
sound in water Salinity and temperature profiles from World Ocean Database (NOAA National Centres for
Environmental Information (2005) Those data were used to calculate sound speed (Tollefsen CDS 2013)
using the following formula
c(TS z) = 14492+46T minus0055T2+00029T3
+(134minus001T)(Sminus35)+0016z
where T is the temperature in C S is the dimensionless salinity (frequently quoted as
Practical Salinity Units or PSU) and z is the depth in m From Equation 1 it is evident that the sound speed
depends most strongly on T with a weaker dependence on S and z
For each month a sound speed profile was calculated (Fig 5) Because sound is refracted towards depths of
low sound speed sound propagation differ over the seson In order to simulate sound propagation under most
different propagation conditions the sound speed profile for June and April (Fig 6)
Fig 5 Sound speed profiles representative for the area for each month For simulations sound speed profilrs
form April and June were used
Doc No
Valid from Rev no
Security Classification Open - Status Final Page 14 of 25
Fig 6 Sound speed prfiles for April (left) and July (right) as used in dBSea
For calculation of sound absorption effects in the water column average values for water temperature and
salinity for April (707decC 3513PSU) and July were used (872decC 3510PSU
43 Sea bed properties
The acoustic properties of the sea floor have influence of the amount of sound reflected from the sea floor
Bottoms with higher sound speed than the overlying water do reflect more sound back into the water column
than bottoms with lower sound speed (Ballard 2017) In this study we used information from the Equinor
ldquoHywind Tampen Substucure and Mooring System Functional requirementsrdquo report
For the model a sandy layer of 1m thickness with a sound velocity of 1650ms a density of 1900kgm and a
attenuation of 08dBwavelength as used and a clay from 1 m to infinite depth with sound velocity of 1500ms
and density of 1500kgm3 and an attenuttion of 02 dBwavelength was used
44 Sound source properties
Equinor commissioned Fugro GEOS and Jasco Applied Sciences to undertake underwater noise
measurements in the vicinity of Hywind 1 installation at a test site north-west of Stavanger Norway The
purpose of this exercise was to quantify potential underwater noise emissions form the Hywind turbines during
operation in order to inform any impact assessments what will be required for future Hywind projects
Measurements were undertaken at a test location some 150 m from the main structure and the hydrophone
was deployed at a depth of 91 m Additional background noise level readings were undertaken at a remote
control site with comparable natural environmental conditions 10 km from the Hywind test site
This measurements were used to assess noise impact for the Hywind Scotland project This study was done by
Xodus in 2015 The study by Xodus also includes suggestion on upscaling the produces sound to the
somehow bigger turbines to be used for Hywind Scotland In this study we use information from both reports for
the definition of the source strength for the sound at Hywind Tampen
441 Operational sound
Sound originating form Hywind was reported in the respective JASCO report as power spectral densities and
as 13 octave band spectral values (ref Figure 25 and Figure 38 in JASCO Measurement Report) Those data
were measured at 150m distance The Jasco report identified tonal frequencies created by the Hywind at 25Hz
and harmonics thereof with frequencies of 50 Hz and 125Hz Power spectral densities from the Jasco report
were converted to approximate sound pressure level data in third octave bins Same results as in the Xodus
report were achieved In order to get values at source spherical propagation was assumed and 435dB were
added to the values measured at 150m A 4 dB upscaling factor was used according to the suggestions made
Doc No
Valid from Rev no
Security Classification Open - Status Final Page 15 of 25
in the Xodus 2015 report A total SPL source level of 166 dB re 1microPa 1m (rms) was used for each of the
Hywwind Tampen wind turbines in the simulations
Fig 7 Spectral content of the operational noise used in the sound simulations Only those frequency bands
that show clear difference to the general ambient sound in the area are shown
Note The steps of reading out data from graphs in the Jasco report doing back calculations to source level
and the upscaling to bigger wind turbines is based on some assumptions and results in uncertainty Especially
the scaling factor of 4dB for the bigger and more powerful wind turbines is based on assumptions field
measurement on bigger floating wind turbines are not available
442 Impulsive Sound
The Hywind 1 sound study identified a transient sound measurable in the vicinity of Hywind 1 The exact origin
of this transient sound has not been identified it is assumed to be produced by tension realese in the mooring
structure It is unknown if other Hywind installations also exhibit this transient noise
This transient sound was measured above SPLpeak 160 dB re 1 microPa at a distance of 150m corresponding to
SPL of 120 to 125 dB re 1microPa The frequency of this sound extends troughout the recorded frequency range of
0-20kHz
For this study a original sound file from the Hywind I study was used for the sound source characterisation of
the snapping sound (as WAF file) This signal was scaled up to the source strength on the place of its assumed
place of origin on the shaft of the Hywind structure in 150m distance Sperical propagation laws were assumed
and 435 dB was added to the sound level measured at 150 resulting in a SPLpeak level at the source for a
individual turbine to be 203dB re 1 microPa 1m The snapping sound was reported to occur up to 23 times a
day for calculation of SEL over 24h 23 snapping events per day per wind turbine were used accumulating to
253 snapping events for all the Hywind Tampen wind turbines
There is a high uncertainty for the source strength of this transient sound mostly attributed to the unknown
position of its origin It could be stronger or weaker calculations done in this study are only a rough indication
Doc No
Valid from Rev no
Security Classification Open - Status Final Page 16 of 25
Fig 8Transient sound from Hywind expressed with relative sound pressure
Doc No
Valid from Rev no
Security Classification Open - Status Final Page 17 of 25
Fig 9 Input data for transient sound used in modelling softwareExample for HY01 Original wav file measured
at 150m distance upscaled to source level at 1 m from source
A Fast Fourier Transformation (FFT) of the sound file (Audacity V222) showed a main frequency content of
the signal between 50Hz and 10kHz (Fig 10) Lower and higher frequencies are about 10dB lower and are not
considered in the respective modelling because the contribute less than 1 to the sound energy
Doc No
Valid from Rev no
Security Classification Open - Status Final Page 18 of 25
Fig 10
45 Sound propagation solvers
Continous sound
For frequencies 125Hz to 400Hz a solver for the parabolic wave equation was used and for frequencies
above 400 Hz a solver for ray tracing Frequency for simulations was 125Hz to 16kHz
Specific settings for parabolic wave equation an ray tracer solver in dBSea are given in appendix X
Impulsive sound
For calculation of SEL A ray tracer was used throughout the frequency spectrum Frequency spectrum was
315Hz to 125kHz For calculation of SPL a split solver with parabolic wave equation up to 400Hz and a ray
tracer for higher frequencies
Doc No
Valid from Rev no
Security Classification Open - Status Final Page 19 of 25
5 Results
51 Continuous sound SPL
The sound velocity profile used for the April and July simulations resulted in less propagation loss at distances
from the sound sources for the April simulations (better propagation conditions) differences are relatively small
(Fig11) Because of this we use the simulation for April for the further assessment
Fig 11 Sound pressure levels SPLpeak for April and July simulation Highest level from all depth projected to
the surface
Doc No
Valid from Rev no
Security Classification Open - Status Final Page 20 of 25
Fig 12 Sound pressure levels SPLpeak for April across positions HY4 and HY8 (position of transect in insert)
Sound propagation around each wind turbine is almost circular with a slightly better propagation into the north-
east direction where the water depth increases Sound propagation is also fairly uniform at different water
depth (Fig 12) with a slightly reduced sound strength at the surface
In the risk assessment for possible impacts it is always the distance of the highest value that is considered and
all graphical displays show the highest value projected to the surface
If a non-impulsive sound has the potential of exceeding the peak sound pressure level threshold associates
with impulsive sound (Table 2) these tresholds are recommended for consideration according to the NOAA
guedelines
For the Hywind Tampen continuous sound none of the sound pressure thresholds for injury are
exceeded
The threshold for behavioural reaction of SPL 160 db re 1 microPa is not exceeded at any distance to the wind
turbines The lower threshold limit of SPL 120 dB re 1 microPa is about at 2000m distance to the wind mills (Fig
13) Ambient sound SPL in the area is about 112dB re 1microPa in average and 132dB re microPa at noisy days The
the indicated distance to the 120dB isopleth is also showing the audible distance at a days above average
ambient sound On days with average ambient sound levels the noise from Hywind Tampen will be audible to
animals at about 4km
Doc No
Valid from Rev no
Security Classification Open - Status Final Page 21 of 25
Fig 13 Isopleth of the 120dB re 1 microPa threshold limit for behavioural disturbance (Table 4) around the Hywind
Tampen windmills
52 Continuous sound SEL
Sound exposure patterns follow the spatial pattern for sound pressure for the unweighted SEL calculations (Fig
14 SELcum24h unweighted) There are very small differences in the sound propagation when SEL weighted
functions are use because different frequencies propagate different
Unweighted SEL and weighted SEL for all species groups from Table 2 are shown in Fig 14
Doc No
Valid from Rev no
Security Classification Open - Status Final Page 22 of 25
Fig14 Weighted SEL values for groups of marine mammals according to table 6
Table 6 NOAA risk critaria for marine mammals and relevant distances for threshold values NA shows that the
respective threshold value is not exceeded
NOAA criteria Project LE = SELcum re 1 microPa
2s
Hywind Tampen operational sound
Hearing group
range
(average)
(m)
range
max (km)
PTS Onset Threshold levels non impulsive sound
Low-Frequency (LF) Cetaceans LEp LF24h 199 dB NA NA
Mid-Frequency (MF) Cetaceans LEp MF24h 198 dB NA NA
High-Frequency (HF) Cetaceans LEp HF24h 173 dB NA NA
Phocoid Pinnipeds (PW) LEpPW24h 201 dB NA NA
Otariid Pinnipeds (OW) LEp OW24h 219 dB NA NA
TTS onset thresholds for non-impulsive sounds
Low-Frequency (LF) Cetaceans LEp LF24h 179 dB 45 52
Mid-Frequency (MF) Cetaceans LEp MF24h 178 dB NA NA
High-Frequency (HF) Cetaceans LEp HF24h 153 dB NA NA
Phocoid Pinnipeds (PW) LEpPW24h 181 dB NA NA
Otariid Pinnipeds (OW) LEp OW24h 199 dB NA NA
Doc No
Valid from Rev no
Security Classification Open - Status Final Page 23 of 25
53 Transient sound (snapping sound)
The SPLpeak at the source is with 203dB re 1 microPa just above the PTS threshold limit for high frequency
cetaceans but will drop below this threshold at a short distance (around 1 meter) to the source It is well below
threshold limits for single and multiple impulses suggested by Southall (2007) This peak value corresponds to
a SPL of 173dB re 1 microPa this is below the threshold limit for injury but above the threshold values for
behavioural disturbance of 160 dB re 1 microPa (strong reaction) and 140dB re microPa (mild reaction) The 140dB
threshold limit for weak reaction would be exceeded at distances below 160m those for the 160dB threshold
for strong reaction at 16m form the source It again has to be stressed that the available information on the
origin of the transient sound only allows a coarse estimate
Fig 15 SPL around a single turbine with indication of threshold limit for mild behavioural reaction to marine
mammals Average distance to the SPL 140 dB re 1microPa isopleth is 160m those to the SPL 160 dB re 1 microPa
isopleth is about 8m
The SELcum24h values also stay below the threshold levels for injury (Fig 16) for all groups of marine mammals
Doc No
Valid from Rev no
Security Classification Open - Status Final Page 24 of 25
Fig 16 SELcum 24 of this transient sound as unweighted and weighted SELcum24h shows that the threshold
limits for injury are not exceeded at any distance to the wind tubines
6 Risk evaluation of sound originating from Hywind Tampen windturbines
61 Continous sound evaluated on SPL and SEL metrics
The threshold limits for injury (PTS and TTS) are not exceeded in the vicinity of Hywind Tampen wind turbines
except those for low frequency cetaceans where the respective SEL threshold limit is exceeded within a radius
of 52m around each individual wind turbine This however does not pose a risk to marine mammals In order to
receiveobserve this threshold limit an animal from the group of the low frequency cetaceans has to be present
within this zone for 24hours The probability that this happens is almost zero An actively movingmigrating
animal will pass this zone within a few seconds and even a none moving animal drifting with the currents will
only be exposed for a short time The ambient noise in the area is estimated to about 112 dB re 1 microPa SPL
this means the sound created by Hywind turbines is on average not audible to marine mammals beyond a
distance of 4km
The overall risk for marine mammals from continuous sound form Hywind Tampen during operations is
evaluated as non existing
62 Transient sound
Risk assessment for the transient is based on many assumptions related to the origin of the sound and the
strength of the sound on it source It is further not established if this so called ldquosnappingrdquo sound is an inherent
property of the Hywind design or if it is a property only be found on the Hywind 1
Risk assessment is included in this study because the strength of the snapping sound is close to some of the
threshold values (SPL 180dB re 1 microPa for harassment B definition) and needs consideration in case it is an
Doc No
Valid from Rev no
Security Classification Open - Status Final Page 25 of 25
inherent property of the Hywind design It is highly recommended to verify the presence or absence of this
feature on the Hywind Scotland installation In case of absence this risk assessment has not to be repeated for
future Hywind installations
The risk is however evaluated as low in general Higher sound pressures can only be expected very close to
the sound source and the the probability of being close to the source of the transient sound is small for any
marine mammal The sound energy animals would be exposed to if staying in the are for a longer period is
also relatively low and does not pose a risk It can not be expected that animals stay for 24hours in the area
and even if they the received sound energy is below any threshold levels for injury Behavioural reactions can
be expected at relatively close distances to the wind turbines eg avoiding Though it is not expected that this
has negative impact on individuals or populations of marine mammals
Overall the risk for marine mammals originating from the transient sound is evaluated as non-existing
Due to the risk of formally exceeding some threshold levels for the transient sound it is recommended to do
sound measurements at newer Hywind installations eg in Scotland to find out if the new design of the
mooring creates similar sound or not
7 Appendix
JASCO 2011 Hywind Acoustic Measurement Report Jasco Report NO 00229
Xodus 2015 Technical Note on Underwater Noise A-100142-S20-TECH-001
NOAA (2018) 2018 Revision to Technical Guidance for Assessing the Effects of Anthropogenic Sound on
Marine Mammal Hearing (Version 2) httpswwwfisheriesnoaagovnationalmarine-mammal-
protectionmarine-mammal-acoustic-technical-guidance
Tollefsen Christina D S (2013) Reccomendations for calculatintg sound speed profiles from field data
Defence RampD Canada Atlantic Technical1048577Memorandum DRDC Atlantic TM 2013-156
Ballard MS and Lee Kevin M2017 The Acoustics of Marine Sediments Acoustics Today volume 13 issue 3
Fall 2017
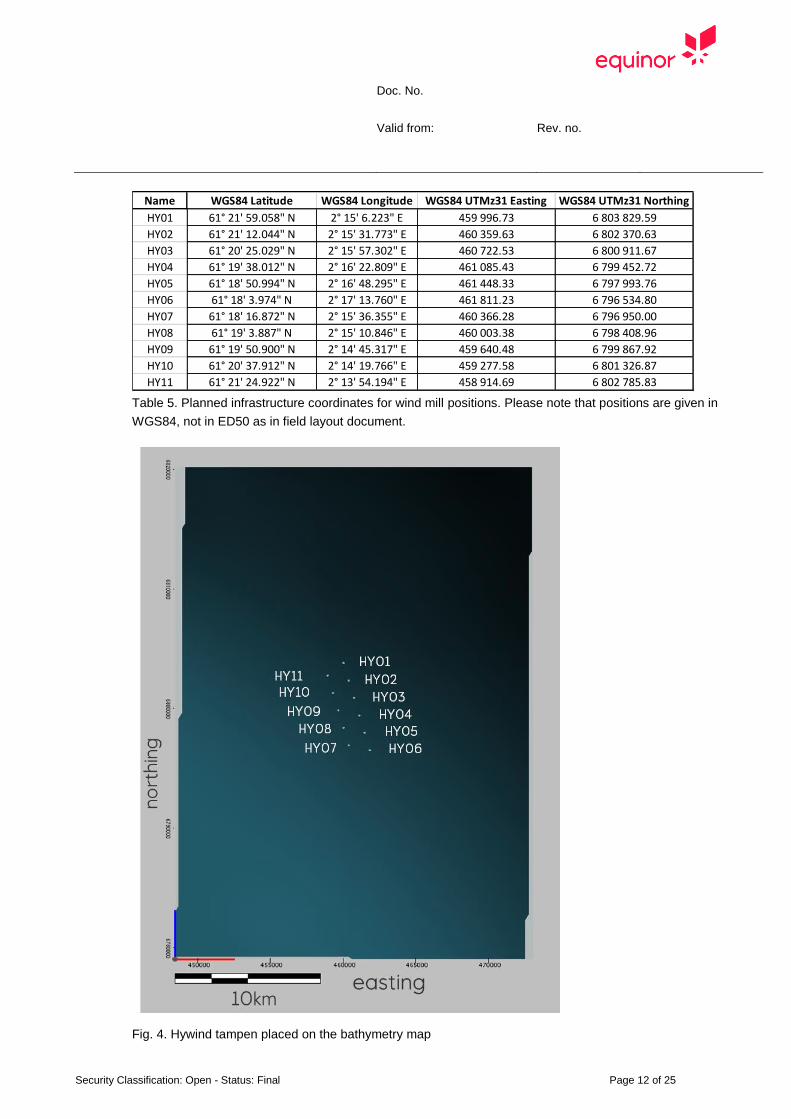
Doc No
Valid from Rev no
Security Classification Open - Status Final Page 12 of 25
Table 5 Planned infrastructure coordinates for wind mill positions Please note that positions are given in
WGS84 not in ED50 as in field layout document
Fig 4 Hywind tampen placed on the bathymetry map
Name WGS84 Latitude WGS84 Longitude WGS84 UTMz31 Easting WGS84 UTMz31 Northing
HY01 61deg 21 59058 N 2deg 15 6223 E 459 99673 6 803 82959
HY02 61deg 21 12044 N 2deg 15 31773 E 460 35963 6 802 37063
HY03 61deg 20 25029 N 2deg 15 57302 E 460 72253 6 800 91167
HY04 61deg 19 38012 N 2deg 16 22809 E 461 08543 6 799 45272
HY05 61deg 18 50994 N 2deg 16 48295 E 461 44833 6 797 99376
HY06 61deg 18 3974 N 2deg 17 13760 E 461 81123 6 796 53480
HY07 61deg 18 16872 N 2deg 15 36355 E 460 36628 6 796 95000
HY08 61deg 19 3887 N 2deg 15 10846 E 460 00338 6 798 40896
HY09 61deg 19 50900 N 2deg 14 45317 E 459 64048 6 799 86792
HY10 61deg 20 37912 N 2deg 14 19766 E 459 27758 6 801 32687
HY11 61deg 21 24922 N 2deg 13 54194 E 458 91469 6 802 78583
Doc No
Valid from Rev no
Security Classification Open - Status Final Page 13 of 25
42 Sound velocity profile
Salinity temperature and pressure (depth) are the most important parameters that influence the speed of
sound in water Salinity and temperature profiles from World Ocean Database (NOAA National Centres for
Environmental Information (2005) Those data were used to calculate sound speed (Tollefsen CDS 2013)
using the following formula
c(TS z) = 14492+46T minus0055T2+00029T3
+(134minus001T)(Sminus35)+0016z
where T is the temperature in C S is the dimensionless salinity (frequently quoted as
Practical Salinity Units or PSU) and z is the depth in m From Equation 1 it is evident that the sound speed
depends most strongly on T with a weaker dependence on S and z
For each month a sound speed profile was calculated (Fig 5) Because sound is refracted towards depths of
low sound speed sound propagation differ over the seson In order to simulate sound propagation under most
different propagation conditions the sound speed profile for June and April (Fig 6)
Fig 5 Sound speed profiles representative for the area for each month For simulations sound speed profilrs
form April and June were used
Doc No
Valid from Rev no
Security Classification Open - Status Final Page 14 of 25
Fig 6 Sound speed prfiles for April (left) and July (right) as used in dBSea
For calculation of sound absorption effects in the water column average values for water temperature and
salinity for April (707decC 3513PSU) and July were used (872decC 3510PSU
43 Sea bed properties
The acoustic properties of the sea floor have influence of the amount of sound reflected from the sea floor
Bottoms with higher sound speed than the overlying water do reflect more sound back into the water column
than bottoms with lower sound speed (Ballard 2017) In this study we used information from the Equinor
ldquoHywind Tampen Substucure and Mooring System Functional requirementsrdquo report
For the model a sandy layer of 1m thickness with a sound velocity of 1650ms a density of 1900kgm and a
attenuation of 08dBwavelength as used and a clay from 1 m to infinite depth with sound velocity of 1500ms
and density of 1500kgm3 and an attenuttion of 02 dBwavelength was used
44 Sound source properties
Equinor commissioned Fugro GEOS and Jasco Applied Sciences to undertake underwater noise
measurements in the vicinity of Hywind 1 installation at a test site north-west of Stavanger Norway The
purpose of this exercise was to quantify potential underwater noise emissions form the Hywind turbines during
operation in order to inform any impact assessments what will be required for future Hywind projects
Measurements were undertaken at a test location some 150 m from the main structure and the hydrophone
was deployed at a depth of 91 m Additional background noise level readings were undertaken at a remote
control site with comparable natural environmental conditions 10 km from the Hywind test site
This measurements were used to assess noise impact for the Hywind Scotland project This study was done by
Xodus in 2015 The study by Xodus also includes suggestion on upscaling the produces sound to the
somehow bigger turbines to be used for Hywind Scotland In this study we use information from both reports for
the definition of the source strength for the sound at Hywind Tampen
441 Operational sound
Sound originating form Hywind was reported in the respective JASCO report as power spectral densities and
as 13 octave band spectral values (ref Figure 25 and Figure 38 in JASCO Measurement Report) Those data
were measured at 150m distance The Jasco report identified tonal frequencies created by the Hywind at 25Hz
and harmonics thereof with frequencies of 50 Hz and 125Hz Power spectral densities from the Jasco report
were converted to approximate sound pressure level data in third octave bins Same results as in the Xodus
report were achieved In order to get values at source spherical propagation was assumed and 435dB were
added to the values measured at 150m A 4 dB upscaling factor was used according to the suggestions made
Doc No
Valid from Rev no
Security Classification Open - Status Final Page 15 of 25
in the Xodus 2015 report A total SPL source level of 166 dB re 1microPa 1m (rms) was used for each of the
Hywwind Tampen wind turbines in the simulations
Fig 7 Spectral content of the operational noise used in the sound simulations Only those frequency bands
that show clear difference to the general ambient sound in the area are shown
Note The steps of reading out data from graphs in the Jasco report doing back calculations to source level
and the upscaling to bigger wind turbines is based on some assumptions and results in uncertainty Especially
the scaling factor of 4dB for the bigger and more powerful wind turbines is based on assumptions field
measurement on bigger floating wind turbines are not available
442 Impulsive Sound
The Hywind 1 sound study identified a transient sound measurable in the vicinity of Hywind 1 The exact origin
of this transient sound has not been identified it is assumed to be produced by tension realese in the mooring
structure It is unknown if other Hywind installations also exhibit this transient noise
This transient sound was measured above SPLpeak 160 dB re 1 microPa at a distance of 150m corresponding to
SPL of 120 to 125 dB re 1microPa The frequency of this sound extends troughout the recorded frequency range of
0-20kHz
For this study a original sound file from the Hywind I study was used for the sound source characterisation of
the snapping sound (as WAF file) This signal was scaled up to the source strength on the place of its assumed
place of origin on the shaft of the Hywind structure in 150m distance Sperical propagation laws were assumed
and 435 dB was added to the sound level measured at 150 resulting in a SPLpeak level at the source for a
individual turbine to be 203dB re 1 microPa 1m The snapping sound was reported to occur up to 23 times a
day for calculation of SEL over 24h 23 snapping events per day per wind turbine were used accumulating to
253 snapping events for all the Hywind Tampen wind turbines
There is a high uncertainty for the source strength of this transient sound mostly attributed to the unknown
position of its origin It could be stronger or weaker calculations done in this study are only a rough indication
Doc No
Valid from Rev no
Security Classification Open - Status Final Page 16 of 25
Fig 8Transient sound from Hywind expressed with relative sound pressure
Doc No
Valid from Rev no
Security Classification Open - Status Final Page 17 of 25
Fig 9 Input data for transient sound used in modelling softwareExample for HY01 Original wav file measured
at 150m distance upscaled to source level at 1 m from source
A Fast Fourier Transformation (FFT) of the sound file (Audacity V222) showed a main frequency content of
the signal between 50Hz and 10kHz (Fig 10) Lower and higher frequencies are about 10dB lower and are not
considered in the respective modelling because the contribute less than 1 to the sound energy
Doc No
Valid from Rev no
Security Classification Open - Status Final Page 18 of 25
Fig 10
45 Sound propagation solvers
Continous sound
For frequencies 125Hz to 400Hz a solver for the parabolic wave equation was used and for frequencies
above 400 Hz a solver for ray tracing Frequency for simulations was 125Hz to 16kHz
Specific settings for parabolic wave equation an ray tracer solver in dBSea are given in appendix X
Impulsive sound
For calculation of SEL A ray tracer was used throughout the frequency spectrum Frequency spectrum was
315Hz to 125kHz For calculation of SPL a split solver with parabolic wave equation up to 400Hz and a ray
tracer for higher frequencies
Doc No
Valid from Rev no
Security Classification Open - Status Final Page 19 of 25
5 Results
51 Continuous sound SPL
The sound velocity profile used for the April and July simulations resulted in less propagation loss at distances
from the sound sources for the April simulations (better propagation conditions) differences are relatively small
(Fig11) Because of this we use the simulation for April for the further assessment
Fig 11 Sound pressure levels SPLpeak for April and July simulation Highest level from all depth projected to
the surface
Doc No
Valid from Rev no
Security Classification Open - Status Final Page 20 of 25
Fig 12 Sound pressure levels SPLpeak for April across positions HY4 and HY8 (position of transect in insert)
Sound propagation around each wind turbine is almost circular with a slightly better propagation into the north-
east direction where the water depth increases Sound propagation is also fairly uniform at different water
depth (Fig 12) with a slightly reduced sound strength at the surface
In the risk assessment for possible impacts it is always the distance of the highest value that is considered and
all graphical displays show the highest value projected to the surface
If a non-impulsive sound has the potential of exceeding the peak sound pressure level threshold associates
with impulsive sound (Table 2) these tresholds are recommended for consideration according to the NOAA
guedelines
For the Hywind Tampen continuous sound none of the sound pressure thresholds for injury are
exceeded
The threshold for behavioural reaction of SPL 160 db re 1 microPa is not exceeded at any distance to the wind
turbines The lower threshold limit of SPL 120 dB re 1 microPa is about at 2000m distance to the wind mills (Fig
13) Ambient sound SPL in the area is about 112dB re 1microPa in average and 132dB re microPa at noisy days The
the indicated distance to the 120dB isopleth is also showing the audible distance at a days above average
ambient sound On days with average ambient sound levels the noise from Hywind Tampen will be audible to
animals at about 4km
Doc No
Valid from Rev no
Security Classification Open - Status Final Page 21 of 25
Fig 13 Isopleth of the 120dB re 1 microPa threshold limit for behavioural disturbance (Table 4) around the Hywind
Tampen windmills
52 Continuous sound SEL
Sound exposure patterns follow the spatial pattern for sound pressure for the unweighted SEL calculations (Fig
14 SELcum24h unweighted) There are very small differences in the sound propagation when SEL weighted
functions are use because different frequencies propagate different
Unweighted SEL and weighted SEL for all species groups from Table 2 are shown in Fig 14
Doc No
Valid from Rev no
Security Classification Open - Status Final Page 22 of 25
Fig14 Weighted SEL values for groups of marine mammals according to table 6
Table 6 NOAA risk critaria for marine mammals and relevant distances for threshold values NA shows that the
respective threshold value is not exceeded
NOAA criteria Project LE = SELcum re 1 microPa
2s
Hywind Tampen operational sound
Hearing group
range
(average)
(m)
range
max (km)
PTS Onset Threshold levels non impulsive sound
Low-Frequency (LF) Cetaceans LEp LF24h 199 dB NA NA
Mid-Frequency (MF) Cetaceans LEp MF24h 198 dB NA NA
High-Frequency (HF) Cetaceans LEp HF24h 173 dB NA NA
Phocoid Pinnipeds (PW) LEpPW24h 201 dB NA NA
Otariid Pinnipeds (OW) LEp OW24h 219 dB NA NA
TTS onset thresholds for non-impulsive sounds
Low-Frequency (LF) Cetaceans LEp LF24h 179 dB 45 52
Mid-Frequency (MF) Cetaceans LEp MF24h 178 dB NA NA
High-Frequency (HF) Cetaceans LEp HF24h 153 dB NA NA
Phocoid Pinnipeds (PW) LEpPW24h 181 dB NA NA
Otariid Pinnipeds (OW) LEp OW24h 199 dB NA NA
Doc No
Valid from Rev no
Security Classification Open - Status Final Page 23 of 25
53 Transient sound (snapping sound)
The SPLpeak at the source is with 203dB re 1 microPa just above the PTS threshold limit for high frequency
cetaceans but will drop below this threshold at a short distance (around 1 meter) to the source It is well below
threshold limits for single and multiple impulses suggested by Southall (2007) This peak value corresponds to
a SPL of 173dB re 1 microPa this is below the threshold limit for injury but above the threshold values for
behavioural disturbance of 160 dB re 1 microPa (strong reaction) and 140dB re microPa (mild reaction) The 140dB
threshold limit for weak reaction would be exceeded at distances below 160m those for the 160dB threshold
for strong reaction at 16m form the source It again has to be stressed that the available information on the
origin of the transient sound only allows a coarse estimate
Fig 15 SPL around a single turbine with indication of threshold limit for mild behavioural reaction to marine
mammals Average distance to the SPL 140 dB re 1microPa isopleth is 160m those to the SPL 160 dB re 1 microPa
isopleth is about 8m
The SELcum24h values also stay below the threshold levels for injury (Fig 16) for all groups of marine mammals
Doc No
Valid from Rev no
Security Classification Open - Status Final Page 24 of 25
Fig 16 SELcum 24 of this transient sound as unweighted and weighted SELcum24h shows that the threshold
limits for injury are not exceeded at any distance to the wind tubines
6 Risk evaluation of sound originating from Hywind Tampen windturbines
61 Continous sound evaluated on SPL and SEL metrics
The threshold limits for injury (PTS and TTS) are not exceeded in the vicinity of Hywind Tampen wind turbines
except those for low frequency cetaceans where the respective SEL threshold limit is exceeded within a radius
of 52m around each individual wind turbine This however does not pose a risk to marine mammals In order to
receiveobserve this threshold limit an animal from the group of the low frequency cetaceans has to be present
within this zone for 24hours The probability that this happens is almost zero An actively movingmigrating
animal will pass this zone within a few seconds and even a none moving animal drifting with the currents will
only be exposed for a short time The ambient noise in the area is estimated to about 112 dB re 1 microPa SPL
this means the sound created by Hywind turbines is on average not audible to marine mammals beyond a
distance of 4km
The overall risk for marine mammals from continuous sound form Hywind Tampen during operations is
evaluated as non existing
62 Transient sound
Risk assessment for the transient is based on many assumptions related to the origin of the sound and the
strength of the sound on it source It is further not established if this so called ldquosnappingrdquo sound is an inherent
property of the Hywind design or if it is a property only be found on the Hywind 1
Risk assessment is included in this study because the strength of the snapping sound is close to some of the
threshold values (SPL 180dB re 1 microPa for harassment B definition) and needs consideration in case it is an
Doc No
Valid from Rev no
Security Classification Open - Status Final Page 25 of 25
inherent property of the Hywind design It is highly recommended to verify the presence or absence of this
feature on the Hywind Scotland installation In case of absence this risk assessment has not to be repeated for
future Hywind installations
The risk is however evaluated as low in general Higher sound pressures can only be expected very close to
the sound source and the the probability of being close to the source of the transient sound is small for any
marine mammal The sound energy animals would be exposed to if staying in the are for a longer period is
also relatively low and does not pose a risk It can not be expected that animals stay for 24hours in the area
and even if they the received sound energy is below any threshold levels for injury Behavioural reactions can
be expected at relatively close distances to the wind turbines eg avoiding Though it is not expected that this
has negative impact on individuals or populations of marine mammals
Overall the risk for marine mammals originating from the transient sound is evaluated as non-existing
Due to the risk of formally exceeding some threshold levels for the transient sound it is recommended to do
sound measurements at newer Hywind installations eg in Scotland to find out if the new design of the
mooring creates similar sound or not
7 Appendix
JASCO 2011 Hywind Acoustic Measurement Report Jasco Report NO 00229
Xodus 2015 Technical Note on Underwater Noise A-100142-S20-TECH-001
NOAA (2018) 2018 Revision to Technical Guidance for Assessing the Effects of Anthropogenic Sound on
Marine Mammal Hearing (Version 2) httpswwwfisheriesnoaagovnationalmarine-mammal-
protectionmarine-mammal-acoustic-technical-guidance
Tollefsen Christina D S (2013) Reccomendations for calculatintg sound speed profiles from field data
Defence RampD Canada Atlantic Technical1048577Memorandum DRDC Atlantic TM 2013-156
Ballard MS and Lee Kevin M2017 The Acoustics of Marine Sediments Acoustics Today volume 13 issue 3
Fall 2017
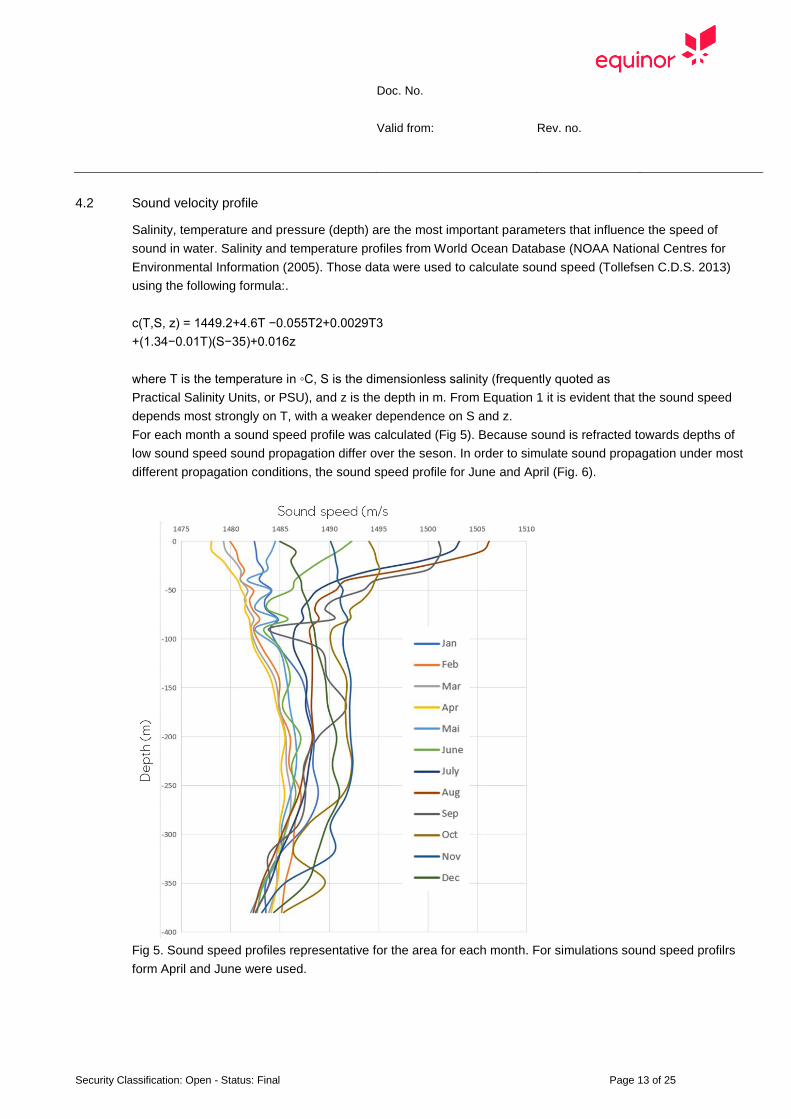
Doc No
Valid from Rev no
Security Classification Open - Status Final Page 13 of 25
42 Sound velocity profile
Salinity temperature and pressure (depth) are the most important parameters that influence the speed of
sound in water Salinity and temperature profiles from World Ocean Database (NOAA National Centres for
Environmental Information (2005) Those data were used to calculate sound speed (Tollefsen CDS 2013)
using the following formula
c(TS z) = 14492+46T minus0055T2+00029T3
+(134minus001T)(Sminus35)+0016z
where T is the temperature in C S is the dimensionless salinity (frequently quoted as
Practical Salinity Units or PSU) and z is the depth in m From Equation 1 it is evident that the sound speed
depends most strongly on T with a weaker dependence on S and z
For each month a sound speed profile was calculated (Fig 5) Because sound is refracted towards depths of
low sound speed sound propagation differ over the seson In order to simulate sound propagation under most
different propagation conditions the sound speed profile for June and April (Fig 6)
Fig 5 Sound speed profiles representative for the area for each month For simulations sound speed profilrs
form April and June were used
Doc No
Valid from Rev no
Security Classification Open - Status Final Page 14 of 25
Fig 6 Sound speed prfiles for April (left) and July (right) as used in dBSea
For calculation of sound absorption effects in the water column average values for water temperature and
salinity for April (707decC 3513PSU) and July were used (872decC 3510PSU
43 Sea bed properties
The acoustic properties of the sea floor have influence of the amount of sound reflected from the sea floor
Bottoms with higher sound speed than the overlying water do reflect more sound back into the water column
than bottoms with lower sound speed (Ballard 2017) In this study we used information from the Equinor
ldquoHywind Tampen Substucure and Mooring System Functional requirementsrdquo report
For the model a sandy layer of 1m thickness with a sound velocity of 1650ms a density of 1900kgm and a
attenuation of 08dBwavelength as used and a clay from 1 m to infinite depth with sound velocity of 1500ms
and density of 1500kgm3 and an attenuttion of 02 dBwavelength was used
44 Sound source properties
Equinor commissioned Fugro GEOS and Jasco Applied Sciences to undertake underwater noise
measurements in the vicinity of Hywind 1 installation at a test site north-west of Stavanger Norway The
purpose of this exercise was to quantify potential underwater noise emissions form the Hywind turbines during
operation in order to inform any impact assessments what will be required for future Hywind projects
Measurements were undertaken at a test location some 150 m from the main structure and the hydrophone
was deployed at a depth of 91 m Additional background noise level readings were undertaken at a remote
control site with comparable natural environmental conditions 10 km from the Hywind test site
This measurements were used to assess noise impact for the Hywind Scotland project This study was done by
Xodus in 2015 The study by Xodus also includes suggestion on upscaling the produces sound to the
somehow bigger turbines to be used for Hywind Scotland In this study we use information from both reports for
the definition of the source strength for the sound at Hywind Tampen
441 Operational sound
Sound originating form Hywind was reported in the respective JASCO report as power spectral densities and
as 13 octave band spectral values (ref Figure 25 and Figure 38 in JASCO Measurement Report) Those data
were measured at 150m distance The Jasco report identified tonal frequencies created by the Hywind at 25Hz
and harmonics thereof with frequencies of 50 Hz and 125Hz Power spectral densities from the Jasco report
were converted to approximate sound pressure level data in third octave bins Same results as in the Xodus
report were achieved In order to get values at source spherical propagation was assumed and 435dB were
added to the values measured at 150m A 4 dB upscaling factor was used according to the suggestions made
Doc No
Valid from Rev no
Security Classification Open - Status Final Page 15 of 25
in the Xodus 2015 report A total SPL source level of 166 dB re 1microPa 1m (rms) was used for each of the
Hywwind Tampen wind turbines in the simulations
Fig 7 Spectral content of the operational noise used in the sound simulations Only those frequency bands
that show clear difference to the general ambient sound in the area are shown
Note The steps of reading out data from graphs in the Jasco report doing back calculations to source level
and the upscaling to bigger wind turbines is based on some assumptions and results in uncertainty Especially
the scaling factor of 4dB for the bigger and more powerful wind turbines is based on assumptions field
measurement on bigger floating wind turbines are not available
442 Impulsive Sound
The Hywind 1 sound study identified a transient sound measurable in the vicinity of Hywind 1 The exact origin
of this transient sound has not been identified it is assumed to be produced by tension realese in the mooring
structure It is unknown if other Hywind installations also exhibit this transient noise
This transient sound was measured above SPLpeak 160 dB re 1 microPa at a distance of 150m corresponding to
SPL of 120 to 125 dB re 1microPa The frequency of this sound extends troughout the recorded frequency range of
0-20kHz
For this study a original sound file from the Hywind I study was used for the sound source characterisation of
the snapping sound (as WAF file) This signal was scaled up to the source strength on the place of its assumed
place of origin on the shaft of the Hywind structure in 150m distance Sperical propagation laws were assumed
and 435 dB was added to the sound level measured at 150 resulting in a SPLpeak level at the source for a
individual turbine to be 203dB re 1 microPa 1m The snapping sound was reported to occur up to 23 times a
day for calculation of SEL over 24h 23 snapping events per day per wind turbine were used accumulating to
253 snapping events for all the Hywind Tampen wind turbines
There is a high uncertainty for the source strength of this transient sound mostly attributed to the unknown
position of its origin It could be stronger or weaker calculations done in this study are only a rough indication
Doc No
Valid from Rev no
Security Classification Open - Status Final Page 16 of 25
Fig 8Transient sound from Hywind expressed with relative sound pressure
Doc No
Valid from Rev no
Security Classification Open - Status Final Page 17 of 25
Fig 9 Input data for transient sound used in modelling softwareExample for HY01 Original wav file measured
at 150m distance upscaled to source level at 1 m from source
A Fast Fourier Transformation (FFT) of the sound file (Audacity V222) showed a main frequency content of
the signal between 50Hz and 10kHz (Fig 10) Lower and higher frequencies are about 10dB lower and are not
considered in the respective modelling because the contribute less than 1 to the sound energy
Doc No
Valid from Rev no
Security Classification Open - Status Final Page 18 of 25
Fig 10
45 Sound propagation solvers
Continous sound
For frequencies 125Hz to 400Hz a solver for the parabolic wave equation was used and for frequencies
above 400 Hz a solver for ray tracing Frequency for simulations was 125Hz to 16kHz
Specific settings for parabolic wave equation an ray tracer solver in dBSea are given in appendix X
Impulsive sound
For calculation of SEL A ray tracer was used throughout the frequency spectrum Frequency spectrum was
315Hz to 125kHz For calculation of SPL a split solver with parabolic wave equation up to 400Hz and a ray
tracer for higher frequencies
Doc No
Valid from Rev no
Security Classification Open - Status Final Page 19 of 25
5 Results
51 Continuous sound SPL
The sound velocity profile used for the April and July simulations resulted in less propagation loss at distances
from the sound sources for the April simulations (better propagation conditions) differences are relatively small
(Fig11) Because of this we use the simulation for April for the further assessment
Fig 11 Sound pressure levels SPLpeak for April and July simulation Highest level from all depth projected to
the surface
Doc No
Valid from Rev no
Security Classification Open - Status Final Page 20 of 25
Fig 12 Sound pressure levels SPLpeak for April across positions HY4 and HY8 (position of transect in insert)
Sound propagation around each wind turbine is almost circular with a slightly better propagation into the north-
east direction where the water depth increases Sound propagation is also fairly uniform at different water
depth (Fig 12) with a slightly reduced sound strength at the surface
In the risk assessment for possible impacts it is always the distance of the highest value that is considered and
all graphical displays show the highest value projected to the surface
If a non-impulsive sound has the potential of exceeding the peak sound pressure level threshold associates
with impulsive sound (Table 2) these tresholds are recommended for consideration according to the NOAA
guedelines
For the Hywind Tampen continuous sound none of the sound pressure thresholds for injury are
exceeded
The threshold for behavioural reaction of SPL 160 db re 1 microPa is not exceeded at any distance to the wind
turbines The lower threshold limit of SPL 120 dB re 1 microPa is about at 2000m distance to the wind mills (Fig
13) Ambient sound SPL in the area is about 112dB re 1microPa in average and 132dB re microPa at noisy days The
the indicated distance to the 120dB isopleth is also showing the audible distance at a days above average
ambient sound On days with average ambient sound levels the noise from Hywind Tampen will be audible to
animals at about 4km
Doc No
Valid from Rev no
Security Classification Open - Status Final Page 21 of 25
Fig 13 Isopleth of the 120dB re 1 microPa threshold limit for behavioural disturbance (Table 4) around the Hywind
Tampen windmills
52 Continuous sound SEL
Sound exposure patterns follow the spatial pattern for sound pressure for the unweighted SEL calculations (Fig
14 SELcum24h unweighted) There are very small differences in the sound propagation when SEL weighted
functions are use because different frequencies propagate different
Unweighted SEL and weighted SEL for all species groups from Table 2 are shown in Fig 14
Doc No
Valid from Rev no
Security Classification Open - Status Final Page 22 of 25
Fig14 Weighted SEL values for groups of marine mammals according to table 6
Table 6 NOAA risk critaria for marine mammals and relevant distances for threshold values NA shows that the
respective threshold value is not exceeded
NOAA criteria Project LE = SELcum re 1 microPa
2s
Hywind Tampen operational sound
Hearing group
range
(average)
(m)
range
max (km)
PTS Onset Threshold levels non impulsive sound
Low-Frequency (LF) Cetaceans LEp LF24h 199 dB NA NA
Mid-Frequency (MF) Cetaceans LEp MF24h 198 dB NA NA
High-Frequency (HF) Cetaceans LEp HF24h 173 dB NA NA
Phocoid Pinnipeds (PW) LEpPW24h 201 dB NA NA
Otariid Pinnipeds (OW) LEp OW24h 219 dB NA NA
TTS onset thresholds for non-impulsive sounds
Low-Frequency (LF) Cetaceans LEp LF24h 179 dB 45 52
Mid-Frequency (MF) Cetaceans LEp MF24h 178 dB NA NA
High-Frequency (HF) Cetaceans LEp HF24h 153 dB NA NA
Phocoid Pinnipeds (PW) LEpPW24h 181 dB NA NA
Otariid Pinnipeds (OW) LEp OW24h 199 dB NA NA
Doc No
Valid from Rev no
Security Classification Open - Status Final Page 23 of 25
53 Transient sound (snapping sound)
The SPLpeak at the source is with 203dB re 1 microPa just above the PTS threshold limit for high frequency
cetaceans but will drop below this threshold at a short distance (around 1 meter) to the source It is well below
threshold limits for single and multiple impulses suggested by Southall (2007) This peak value corresponds to
a SPL of 173dB re 1 microPa this is below the threshold limit for injury but above the threshold values for
behavioural disturbance of 160 dB re 1 microPa (strong reaction) and 140dB re microPa (mild reaction) The 140dB
threshold limit for weak reaction would be exceeded at distances below 160m those for the 160dB threshold
for strong reaction at 16m form the source It again has to be stressed that the available information on the
origin of the transient sound only allows a coarse estimate
Fig 15 SPL around a single turbine with indication of threshold limit for mild behavioural reaction to marine
mammals Average distance to the SPL 140 dB re 1microPa isopleth is 160m those to the SPL 160 dB re 1 microPa
isopleth is about 8m
The SELcum24h values also stay below the threshold levels for injury (Fig 16) for all groups of marine mammals
Doc No
Valid from Rev no
Security Classification Open - Status Final Page 24 of 25
Fig 16 SELcum 24 of this transient sound as unweighted and weighted SELcum24h shows that the threshold
limits for injury are not exceeded at any distance to the wind tubines
6 Risk evaluation of sound originating from Hywind Tampen windturbines
61 Continous sound evaluated on SPL and SEL metrics
The threshold limits for injury (PTS and TTS) are not exceeded in the vicinity of Hywind Tampen wind turbines
except those for low frequency cetaceans where the respective SEL threshold limit is exceeded within a radius
of 52m around each individual wind turbine This however does not pose a risk to marine mammals In order to
receiveobserve this threshold limit an animal from the group of the low frequency cetaceans has to be present
within this zone for 24hours The probability that this happens is almost zero An actively movingmigrating
animal will pass this zone within a few seconds and even a none moving animal drifting with the currents will
only be exposed for a short time The ambient noise in the area is estimated to about 112 dB re 1 microPa SPL
this means the sound created by Hywind turbines is on average not audible to marine mammals beyond a
distance of 4km
The overall risk for marine mammals from continuous sound form Hywind Tampen during operations is
evaluated as non existing
62 Transient sound
Risk assessment for the transient is based on many assumptions related to the origin of the sound and the
strength of the sound on it source It is further not established if this so called ldquosnappingrdquo sound is an inherent
property of the Hywind design or if it is a property only be found on the Hywind 1
Risk assessment is included in this study because the strength of the snapping sound is close to some of the
threshold values (SPL 180dB re 1 microPa for harassment B definition) and needs consideration in case it is an
Doc No
Valid from Rev no
Security Classification Open - Status Final Page 25 of 25
inherent property of the Hywind design It is highly recommended to verify the presence or absence of this
feature on the Hywind Scotland installation In case of absence this risk assessment has not to be repeated for
future Hywind installations
The risk is however evaluated as low in general Higher sound pressures can only be expected very close to
the sound source and the the probability of being close to the source of the transient sound is small for any
marine mammal The sound energy animals would be exposed to if staying in the are for a longer period is
also relatively low and does not pose a risk It can not be expected that animals stay for 24hours in the area
and even if they the received sound energy is below any threshold levels for injury Behavioural reactions can
be expected at relatively close distances to the wind turbines eg avoiding Though it is not expected that this
has negative impact on individuals or populations of marine mammals
Overall the risk for marine mammals originating from the transient sound is evaluated as non-existing
Due to the risk of formally exceeding some threshold levels for the transient sound it is recommended to do
sound measurements at newer Hywind installations eg in Scotland to find out if the new design of the
mooring creates similar sound or not
7 Appendix
JASCO 2011 Hywind Acoustic Measurement Report Jasco Report NO 00229
Xodus 2015 Technical Note on Underwater Noise A-100142-S20-TECH-001
NOAA (2018) 2018 Revision to Technical Guidance for Assessing the Effects of Anthropogenic Sound on
Marine Mammal Hearing (Version 2) httpswwwfisheriesnoaagovnationalmarine-mammal-
protectionmarine-mammal-acoustic-technical-guidance
Tollefsen Christina D S (2013) Reccomendations for calculatintg sound speed profiles from field data
Defence RampD Canada Atlantic Technical1048577Memorandum DRDC Atlantic TM 2013-156
Ballard MS and Lee Kevin M2017 The Acoustics of Marine Sediments Acoustics Today volume 13 issue 3
Fall 2017
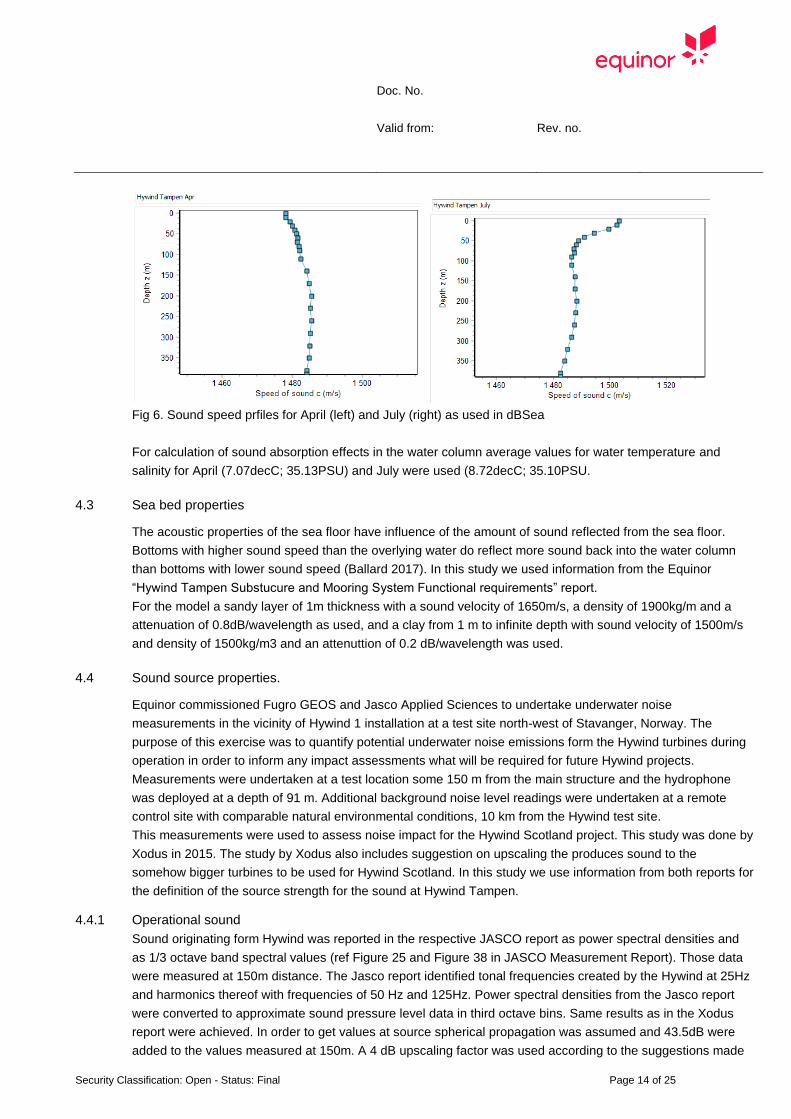
Doc No
Valid from Rev no
Security Classification Open - Status Final Page 14 of 25
Fig 6 Sound speed prfiles for April (left) and July (right) as used in dBSea
For calculation of sound absorption effects in the water column average values for water temperature and
salinity for April (707decC 3513PSU) and July were used (872decC 3510PSU
43 Sea bed properties
The acoustic properties of the sea floor have influence of the amount of sound reflected from the sea floor
Bottoms with higher sound speed than the overlying water do reflect more sound back into the water column
than bottoms with lower sound speed (Ballard 2017) In this study we used information from the Equinor
ldquoHywind Tampen Substucure and Mooring System Functional requirementsrdquo report
For the model a sandy layer of 1m thickness with a sound velocity of 1650ms a density of 1900kgm and a
attenuation of 08dBwavelength as used and a clay from 1 m to infinite depth with sound velocity of 1500ms
and density of 1500kgm3 and an attenuttion of 02 dBwavelength was used
44 Sound source properties
Equinor commissioned Fugro GEOS and Jasco Applied Sciences to undertake underwater noise
measurements in the vicinity of Hywind 1 installation at a test site north-west of Stavanger Norway The
purpose of this exercise was to quantify potential underwater noise emissions form the Hywind turbines during
operation in order to inform any impact assessments what will be required for future Hywind projects
Measurements were undertaken at a test location some 150 m from the main structure and the hydrophone
was deployed at a depth of 91 m Additional background noise level readings were undertaken at a remote
control site with comparable natural environmental conditions 10 km from the Hywind test site
This measurements were used to assess noise impact for the Hywind Scotland project This study was done by
Xodus in 2015 The study by Xodus also includes suggestion on upscaling the produces sound to the
somehow bigger turbines to be used for Hywind Scotland In this study we use information from both reports for
the definition of the source strength for the sound at Hywind Tampen
441 Operational sound
Sound originating form Hywind was reported in the respective JASCO report as power spectral densities and
as 13 octave band spectral values (ref Figure 25 and Figure 38 in JASCO Measurement Report) Those data
were measured at 150m distance The Jasco report identified tonal frequencies created by the Hywind at 25Hz
and harmonics thereof with frequencies of 50 Hz and 125Hz Power spectral densities from the Jasco report
were converted to approximate sound pressure level data in third octave bins Same results as in the Xodus
report were achieved In order to get values at source spherical propagation was assumed and 435dB were
added to the values measured at 150m A 4 dB upscaling factor was used according to the suggestions made
Doc No
Valid from Rev no
Security Classification Open - Status Final Page 15 of 25
in the Xodus 2015 report A total SPL source level of 166 dB re 1microPa 1m (rms) was used for each of the
Hywwind Tampen wind turbines in the simulations
Fig 7 Spectral content of the operational noise used in the sound simulations Only those frequency bands
that show clear difference to the general ambient sound in the area are shown
Note The steps of reading out data from graphs in the Jasco report doing back calculations to source level
and the upscaling to bigger wind turbines is based on some assumptions and results in uncertainty Especially
the scaling factor of 4dB for the bigger and more powerful wind turbines is based on assumptions field
measurement on bigger floating wind turbines are not available
442 Impulsive Sound
The Hywind 1 sound study identified a transient sound measurable in the vicinity of Hywind 1 The exact origin
of this transient sound has not been identified it is assumed to be produced by tension realese in the mooring
structure It is unknown if other Hywind installations also exhibit this transient noise
This transient sound was measured above SPLpeak 160 dB re 1 microPa at a distance of 150m corresponding to
SPL of 120 to 125 dB re 1microPa The frequency of this sound extends troughout the recorded frequency range of
0-20kHz
For this study a original sound file from the Hywind I study was used for the sound source characterisation of
the snapping sound (as WAF file) This signal was scaled up to the source strength on the place of its assumed
place of origin on the shaft of the Hywind structure in 150m distance Sperical propagation laws were assumed
and 435 dB was added to the sound level measured at 150 resulting in a SPLpeak level at the source for a
individual turbine to be 203dB re 1 microPa 1m The snapping sound was reported to occur up to 23 times a
day for calculation of SEL over 24h 23 snapping events per day per wind turbine were used accumulating to
253 snapping events for all the Hywind Tampen wind turbines
There is a high uncertainty for the source strength of this transient sound mostly attributed to the unknown
position of its origin It could be stronger or weaker calculations done in this study are only a rough indication
Doc No
Valid from Rev no
Security Classification Open - Status Final Page 16 of 25
Fig 8Transient sound from Hywind expressed with relative sound pressure
Doc No
Valid from Rev no
Security Classification Open - Status Final Page 17 of 25
Fig 9 Input data for transient sound used in modelling softwareExample for HY01 Original wav file measured
at 150m distance upscaled to source level at 1 m from source
A Fast Fourier Transformation (FFT) of the sound file (Audacity V222) showed a main frequency content of
the signal between 50Hz and 10kHz (Fig 10) Lower and higher frequencies are about 10dB lower and are not
considered in the respective modelling because the contribute less than 1 to the sound energy
Doc No
Valid from Rev no
Security Classification Open - Status Final Page 18 of 25
Fig 10
45 Sound propagation solvers
Continous sound
For frequencies 125Hz to 400Hz a solver for the parabolic wave equation was used and for frequencies
above 400 Hz a solver for ray tracing Frequency for simulations was 125Hz to 16kHz
Specific settings for parabolic wave equation an ray tracer solver in dBSea are given in appendix X
Impulsive sound
For calculation of SEL A ray tracer was used throughout the frequency spectrum Frequency spectrum was
315Hz to 125kHz For calculation of SPL a split solver with parabolic wave equation up to 400Hz and a ray
tracer for higher frequencies
Doc No
Valid from Rev no
Security Classification Open - Status Final Page 19 of 25
5 Results
51 Continuous sound SPL
The sound velocity profile used for the April and July simulations resulted in less propagation loss at distances
from the sound sources for the April simulations (better propagation conditions) differences are relatively small
(Fig11) Because of this we use the simulation for April for the further assessment
Fig 11 Sound pressure levels SPLpeak for April and July simulation Highest level from all depth projected to
the surface
Doc No
Valid from Rev no
Security Classification Open - Status Final Page 20 of 25
Fig 12 Sound pressure levels SPLpeak for April across positions HY4 and HY8 (position of transect in insert)
Sound propagation around each wind turbine is almost circular with a slightly better propagation into the north-
east direction where the water depth increases Sound propagation is also fairly uniform at different water
depth (Fig 12) with a slightly reduced sound strength at the surface
In the risk assessment for possible impacts it is always the distance of the highest value that is considered and
all graphical displays show the highest value projected to the surface
If a non-impulsive sound has the potential of exceeding the peak sound pressure level threshold associates
with impulsive sound (Table 2) these tresholds are recommended for consideration according to the NOAA
guedelines
For the Hywind Tampen continuous sound none of the sound pressure thresholds for injury are
exceeded
The threshold for behavioural reaction of SPL 160 db re 1 microPa is not exceeded at any distance to the wind
turbines The lower threshold limit of SPL 120 dB re 1 microPa is about at 2000m distance to the wind mills (Fig
13) Ambient sound SPL in the area is about 112dB re 1microPa in average and 132dB re microPa at noisy days The
the indicated distance to the 120dB isopleth is also showing the audible distance at a days above average
ambient sound On days with average ambient sound levels the noise from Hywind Tampen will be audible to
animals at about 4km
Doc No
Valid from Rev no
Security Classification Open - Status Final Page 21 of 25
Fig 13 Isopleth of the 120dB re 1 microPa threshold limit for behavioural disturbance (Table 4) around the Hywind
Tampen windmills
52 Continuous sound SEL
Sound exposure patterns follow the spatial pattern for sound pressure for the unweighted SEL calculations (Fig
14 SELcum24h unweighted) There are very small differences in the sound propagation when SEL weighted
functions are use because different frequencies propagate different
Unweighted SEL and weighted SEL for all species groups from Table 2 are shown in Fig 14
Doc No
Valid from Rev no
Security Classification Open - Status Final Page 22 of 25
Fig14 Weighted SEL values for groups of marine mammals according to table 6
Table 6 NOAA risk critaria for marine mammals and relevant distances for threshold values NA shows that the
respective threshold value is not exceeded
NOAA criteria Project LE = SELcum re 1 microPa
2s
Hywind Tampen operational sound
Hearing group
range
(average)
(m)
range
max (km)
PTS Onset Threshold levels non impulsive sound
Low-Frequency (LF) Cetaceans LEp LF24h 199 dB NA NA
Mid-Frequency (MF) Cetaceans LEp MF24h 198 dB NA NA
High-Frequency (HF) Cetaceans LEp HF24h 173 dB NA NA
Phocoid Pinnipeds (PW) LEpPW24h 201 dB NA NA
Otariid Pinnipeds (OW) LEp OW24h 219 dB NA NA
TTS onset thresholds for non-impulsive sounds
Low-Frequency (LF) Cetaceans LEp LF24h 179 dB 45 52
Mid-Frequency (MF) Cetaceans LEp MF24h 178 dB NA NA
High-Frequency (HF) Cetaceans LEp HF24h 153 dB NA NA
Phocoid Pinnipeds (PW) LEpPW24h 181 dB NA NA
Otariid Pinnipeds (OW) LEp OW24h 199 dB NA NA
Doc No
Valid from Rev no
Security Classification Open - Status Final Page 23 of 25
53 Transient sound (snapping sound)
The SPLpeak at the source is with 203dB re 1 microPa just above the PTS threshold limit for high frequency
cetaceans but will drop below this threshold at a short distance (around 1 meter) to the source It is well below
threshold limits for single and multiple impulses suggested by Southall (2007) This peak value corresponds to
a SPL of 173dB re 1 microPa this is below the threshold limit for injury but above the threshold values for
behavioural disturbance of 160 dB re 1 microPa (strong reaction) and 140dB re microPa (mild reaction) The 140dB
threshold limit for weak reaction would be exceeded at distances below 160m those for the 160dB threshold
for strong reaction at 16m form the source It again has to be stressed that the available information on the
origin of the transient sound only allows a coarse estimate
Fig 15 SPL around a single turbine with indication of threshold limit for mild behavioural reaction to marine
mammals Average distance to the SPL 140 dB re 1microPa isopleth is 160m those to the SPL 160 dB re 1 microPa
isopleth is about 8m
The SELcum24h values also stay below the threshold levels for injury (Fig 16) for all groups of marine mammals
Doc No
Valid from Rev no
Security Classification Open - Status Final Page 24 of 25
Fig 16 SELcum 24 of this transient sound as unweighted and weighted SELcum24h shows that the threshold
limits for injury are not exceeded at any distance to the wind tubines
6 Risk evaluation of sound originating from Hywind Tampen windturbines
61 Continous sound evaluated on SPL and SEL metrics
The threshold limits for injury (PTS and TTS) are not exceeded in the vicinity of Hywind Tampen wind turbines
except those for low frequency cetaceans where the respective SEL threshold limit is exceeded within a radius
of 52m around each individual wind turbine This however does not pose a risk to marine mammals In order to
receiveobserve this threshold limit an animal from the group of the low frequency cetaceans has to be present
within this zone for 24hours The probability that this happens is almost zero An actively movingmigrating
animal will pass this zone within a few seconds and even a none moving animal drifting with the currents will
only be exposed for a short time The ambient noise in the area is estimated to about 112 dB re 1 microPa SPL
this means the sound created by Hywind turbines is on average not audible to marine mammals beyond a
distance of 4km
The overall risk for marine mammals from continuous sound form Hywind Tampen during operations is
evaluated as non existing
62 Transient sound
Risk assessment for the transient is based on many assumptions related to the origin of the sound and the
strength of the sound on it source It is further not established if this so called ldquosnappingrdquo sound is an inherent
property of the Hywind design or if it is a property only be found on the Hywind 1
Risk assessment is included in this study because the strength of the snapping sound is close to some of the
threshold values (SPL 180dB re 1 microPa for harassment B definition) and needs consideration in case it is an
Doc No
Valid from Rev no
Security Classification Open - Status Final Page 25 of 25
inherent property of the Hywind design It is highly recommended to verify the presence or absence of this
feature on the Hywind Scotland installation In case of absence this risk assessment has not to be repeated for
future Hywind installations
The risk is however evaluated as low in general Higher sound pressures can only be expected very close to
the sound source and the the probability of being close to the source of the transient sound is small for any
marine mammal The sound energy animals would be exposed to if staying in the are for a longer period is
also relatively low and does not pose a risk It can not be expected that animals stay for 24hours in the area
and even if they the received sound energy is below any threshold levels for injury Behavioural reactions can
be expected at relatively close distances to the wind turbines eg avoiding Though it is not expected that this
has negative impact on individuals or populations of marine mammals
Overall the risk for marine mammals originating from the transient sound is evaluated as non-existing
Due to the risk of formally exceeding some threshold levels for the transient sound it is recommended to do
sound measurements at newer Hywind installations eg in Scotland to find out if the new design of the
mooring creates similar sound or not
7 Appendix
JASCO 2011 Hywind Acoustic Measurement Report Jasco Report NO 00229
Xodus 2015 Technical Note on Underwater Noise A-100142-S20-TECH-001
NOAA (2018) 2018 Revision to Technical Guidance for Assessing the Effects of Anthropogenic Sound on
Marine Mammal Hearing (Version 2) httpswwwfisheriesnoaagovnationalmarine-mammal-
protectionmarine-mammal-acoustic-technical-guidance
Tollefsen Christina D S (2013) Reccomendations for calculatintg sound speed profiles from field data
Defence RampD Canada Atlantic Technical1048577Memorandum DRDC Atlantic TM 2013-156
Ballard MS and Lee Kevin M2017 The Acoustics of Marine Sediments Acoustics Today volume 13 issue 3
Fall 2017
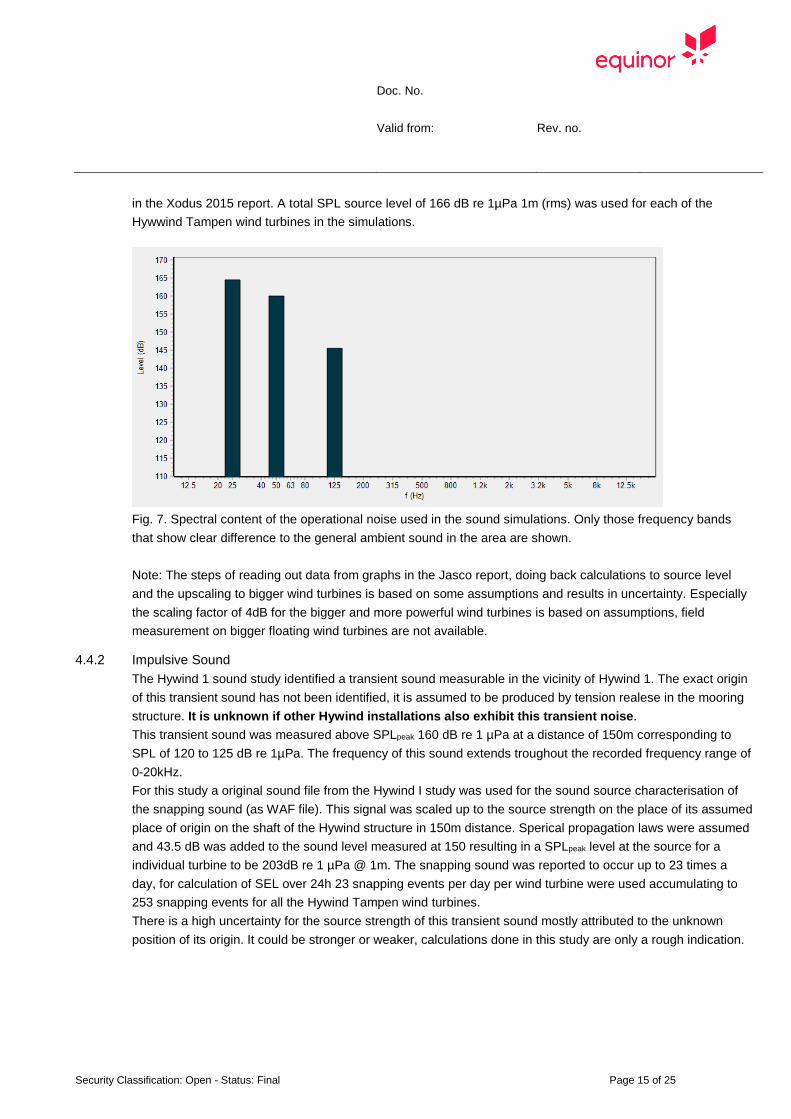
Doc No
Valid from Rev no
Security Classification Open - Status Final Page 15 of 25
in the Xodus 2015 report A total SPL source level of 166 dB re 1microPa 1m (rms) was used for each of the
Hywwind Tampen wind turbines in the simulations
Fig 7 Spectral content of the operational noise used in the sound simulations Only those frequency bands
that show clear difference to the general ambient sound in the area are shown
Note The steps of reading out data from graphs in the Jasco report doing back calculations to source level
and the upscaling to bigger wind turbines is based on some assumptions and results in uncertainty Especially
the scaling factor of 4dB for the bigger and more powerful wind turbines is based on assumptions field
measurement on bigger floating wind turbines are not available
442 Impulsive Sound
The Hywind 1 sound study identified a transient sound measurable in the vicinity of Hywind 1 The exact origin
of this transient sound has not been identified it is assumed to be produced by tension realese in the mooring
structure It is unknown if other Hywind installations also exhibit this transient noise
This transient sound was measured above SPLpeak 160 dB re 1 microPa at a distance of 150m corresponding to
SPL of 120 to 125 dB re 1microPa The frequency of this sound extends troughout the recorded frequency range of
0-20kHz
For this study a original sound file from the Hywind I study was used for the sound source characterisation of
the snapping sound (as WAF file) This signal was scaled up to the source strength on the place of its assumed
place of origin on the shaft of the Hywind structure in 150m distance Sperical propagation laws were assumed
and 435 dB was added to the sound level measured at 150 resulting in a SPLpeak level at the source for a
individual turbine to be 203dB re 1 microPa 1m The snapping sound was reported to occur up to 23 times a
day for calculation of SEL over 24h 23 snapping events per day per wind turbine were used accumulating to
253 snapping events for all the Hywind Tampen wind turbines
There is a high uncertainty for the source strength of this transient sound mostly attributed to the unknown
position of its origin It could be stronger or weaker calculations done in this study are only a rough indication
Doc No
Valid from Rev no
Security Classification Open - Status Final Page 16 of 25
Fig 8Transient sound from Hywind expressed with relative sound pressure
Doc No
Valid from Rev no
Security Classification Open - Status Final Page 17 of 25
Fig 9 Input data for transient sound used in modelling softwareExample for HY01 Original wav file measured
at 150m distance upscaled to source level at 1 m from source
A Fast Fourier Transformation (FFT) of the sound file (Audacity V222) showed a main frequency content of
the signal between 50Hz and 10kHz (Fig 10) Lower and higher frequencies are about 10dB lower and are not
considered in the respective modelling because the contribute less than 1 to the sound energy
Doc No
Valid from Rev no
Security Classification Open - Status Final Page 18 of 25
Fig 10
45 Sound propagation solvers
Continous sound
For frequencies 125Hz to 400Hz a solver for the parabolic wave equation was used and for frequencies
above 400 Hz a solver for ray tracing Frequency for simulations was 125Hz to 16kHz
Specific settings for parabolic wave equation an ray tracer solver in dBSea are given in appendix X
Impulsive sound
For calculation of SEL A ray tracer was used throughout the frequency spectrum Frequency spectrum was
315Hz to 125kHz For calculation of SPL a split solver with parabolic wave equation up to 400Hz and a ray
tracer for higher frequencies
Doc No
Valid from Rev no
Security Classification Open - Status Final Page 19 of 25
5 Results
51 Continuous sound SPL
The sound velocity profile used for the April and July simulations resulted in less propagation loss at distances
from the sound sources for the April simulations (better propagation conditions) differences are relatively small
(Fig11) Because of this we use the simulation for April for the further assessment
Fig 11 Sound pressure levels SPLpeak for April and July simulation Highest level from all depth projected to
the surface
Doc No
Valid from Rev no
Security Classification Open - Status Final Page 20 of 25
Fig 12 Sound pressure levels SPLpeak for April across positions HY4 and HY8 (position of transect in insert)
Sound propagation around each wind turbine is almost circular with a slightly better propagation into the north-
east direction where the water depth increases Sound propagation is also fairly uniform at different water
depth (Fig 12) with a slightly reduced sound strength at the surface
In the risk assessment for possible impacts it is always the distance of the highest value that is considered and
all graphical displays show the highest value projected to the surface
If a non-impulsive sound has the potential of exceeding the peak sound pressure level threshold associates
with impulsive sound (Table 2) these tresholds are recommended for consideration according to the NOAA
guedelines
For the Hywind Tampen continuous sound none of the sound pressure thresholds for injury are
exceeded
The threshold for behavioural reaction of SPL 160 db re 1 microPa is not exceeded at any distance to the wind
turbines The lower threshold limit of SPL 120 dB re 1 microPa is about at 2000m distance to the wind mills (Fig
13) Ambient sound SPL in the area is about 112dB re 1microPa in average and 132dB re microPa at noisy days The
the indicated distance to the 120dB isopleth is also showing the audible distance at a days above average
ambient sound On days with average ambient sound levels the noise from Hywind Tampen will be audible to
animals at about 4km
Doc No
Valid from Rev no
Security Classification Open - Status Final Page 21 of 25
Fig 13 Isopleth of the 120dB re 1 microPa threshold limit for behavioural disturbance (Table 4) around the Hywind
Tampen windmills
52 Continuous sound SEL
Sound exposure patterns follow the spatial pattern for sound pressure for the unweighted SEL calculations (Fig
14 SELcum24h unweighted) There are very small differences in the sound propagation when SEL weighted
functions are use because different frequencies propagate different
Unweighted SEL and weighted SEL for all species groups from Table 2 are shown in Fig 14
Doc No
Valid from Rev no
Security Classification Open - Status Final Page 22 of 25
Fig14 Weighted SEL values for groups of marine mammals according to table 6
Table 6 NOAA risk critaria for marine mammals and relevant distances for threshold values NA shows that the
respective threshold value is not exceeded
NOAA criteria Project LE = SELcum re 1 microPa
2s
Hywind Tampen operational sound
Hearing group
range
(average)
(m)
range
max (km)
PTS Onset Threshold levels non impulsive sound
Low-Frequency (LF) Cetaceans LEp LF24h 199 dB NA NA
Mid-Frequency (MF) Cetaceans LEp MF24h 198 dB NA NA
High-Frequency (HF) Cetaceans LEp HF24h 173 dB NA NA
Phocoid Pinnipeds (PW) LEpPW24h 201 dB NA NA
Otariid Pinnipeds (OW) LEp OW24h 219 dB NA NA
TTS onset thresholds for non-impulsive sounds
Low-Frequency (LF) Cetaceans LEp LF24h 179 dB 45 52
Mid-Frequency (MF) Cetaceans LEp MF24h 178 dB NA NA
High-Frequency (HF) Cetaceans LEp HF24h 153 dB NA NA
Phocoid Pinnipeds (PW) LEpPW24h 181 dB NA NA
Otariid Pinnipeds (OW) LEp OW24h 199 dB NA NA
Doc No
Valid from Rev no
Security Classification Open - Status Final Page 23 of 25
53 Transient sound (snapping sound)
The SPLpeak at the source is with 203dB re 1 microPa just above the PTS threshold limit for high frequency
cetaceans but will drop below this threshold at a short distance (around 1 meter) to the source It is well below
threshold limits for single and multiple impulses suggested by Southall (2007) This peak value corresponds to
a SPL of 173dB re 1 microPa this is below the threshold limit for injury but above the threshold values for
behavioural disturbance of 160 dB re 1 microPa (strong reaction) and 140dB re microPa (mild reaction) The 140dB
threshold limit for weak reaction would be exceeded at distances below 160m those for the 160dB threshold
for strong reaction at 16m form the source It again has to be stressed that the available information on the
origin of the transient sound only allows a coarse estimate
Fig 15 SPL around a single turbine with indication of threshold limit for mild behavioural reaction to marine
mammals Average distance to the SPL 140 dB re 1microPa isopleth is 160m those to the SPL 160 dB re 1 microPa
isopleth is about 8m
The SELcum24h values also stay below the threshold levels for injury (Fig 16) for all groups of marine mammals
Doc No
Valid from Rev no
Security Classification Open - Status Final Page 24 of 25
Fig 16 SELcum 24 of this transient sound as unweighted and weighted SELcum24h shows that the threshold
limits for injury are not exceeded at any distance to the wind tubines
6 Risk evaluation of sound originating from Hywind Tampen windturbines
61 Continous sound evaluated on SPL and SEL metrics
The threshold limits for injury (PTS and TTS) are not exceeded in the vicinity of Hywind Tampen wind turbines
except those for low frequency cetaceans where the respective SEL threshold limit is exceeded within a radius
of 52m around each individual wind turbine This however does not pose a risk to marine mammals In order to
receiveobserve this threshold limit an animal from the group of the low frequency cetaceans has to be present
within this zone for 24hours The probability that this happens is almost zero An actively movingmigrating
animal will pass this zone within a few seconds and even a none moving animal drifting with the currents will
only be exposed for a short time The ambient noise in the area is estimated to about 112 dB re 1 microPa SPL
this means the sound created by Hywind turbines is on average not audible to marine mammals beyond a
distance of 4km
The overall risk for marine mammals from continuous sound form Hywind Tampen during operations is
evaluated as non existing
62 Transient sound
Risk assessment for the transient is based on many assumptions related to the origin of the sound and the
strength of the sound on it source It is further not established if this so called ldquosnappingrdquo sound is an inherent
property of the Hywind design or if it is a property only be found on the Hywind 1
Risk assessment is included in this study because the strength of the snapping sound is close to some of the
threshold values (SPL 180dB re 1 microPa for harassment B definition) and needs consideration in case it is an
Doc No
Valid from Rev no
Security Classification Open - Status Final Page 25 of 25
inherent property of the Hywind design It is highly recommended to verify the presence or absence of this
feature on the Hywind Scotland installation In case of absence this risk assessment has not to be repeated for
future Hywind installations
The risk is however evaluated as low in general Higher sound pressures can only be expected very close to
the sound source and the the probability of being close to the source of the transient sound is small for any
marine mammal The sound energy animals would be exposed to if staying in the are for a longer period is
also relatively low and does not pose a risk It can not be expected that animals stay for 24hours in the area
and even if they the received sound energy is below any threshold levels for injury Behavioural reactions can
be expected at relatively close distances to the wind turbines eg avoiding Though it is not expected that this
has negative impact on individuals or populations of marine mammals
Overall the risk for marine mammals originating from the transient sound is evaluated as non-existing
Due to the risk of formally exceeding some threshold levels for the transient sound it is recommended to do
sound measurements at newer Hywind installations eg in Scotland to find out if the new design of the
mooring creates similar sound or not
7 Appendix
JASCO 2011 Hywind Acoustic Measurement Report Jasco Report NO 00229
Xodus 2015 Technical Note on Underwater Noise A-100142-S20-TECH-001
NOAA (2018) 2018 Revision to Technical Guidance for Assessing the Effects of Anthropogenic Sound on
Marine Mammal Hearing (Version 2) httpswwwfisheriesnoaagovnationalmarine-mammal-
protectionmarine-mammal-acoustic-technical-guidance
Tollefsen Christina D S (2013) Reccomendations for calculatintg sound speed profiles from field data
Defence RampD Canada Atlantic Technical1048577Memorandum DRDC Atlantic TM 2013-156
Ballard MS and Lee Kevin M2017 The Acoustics of Marine Sediments Acoustics Today volume 13 issue 3
Fall 2017
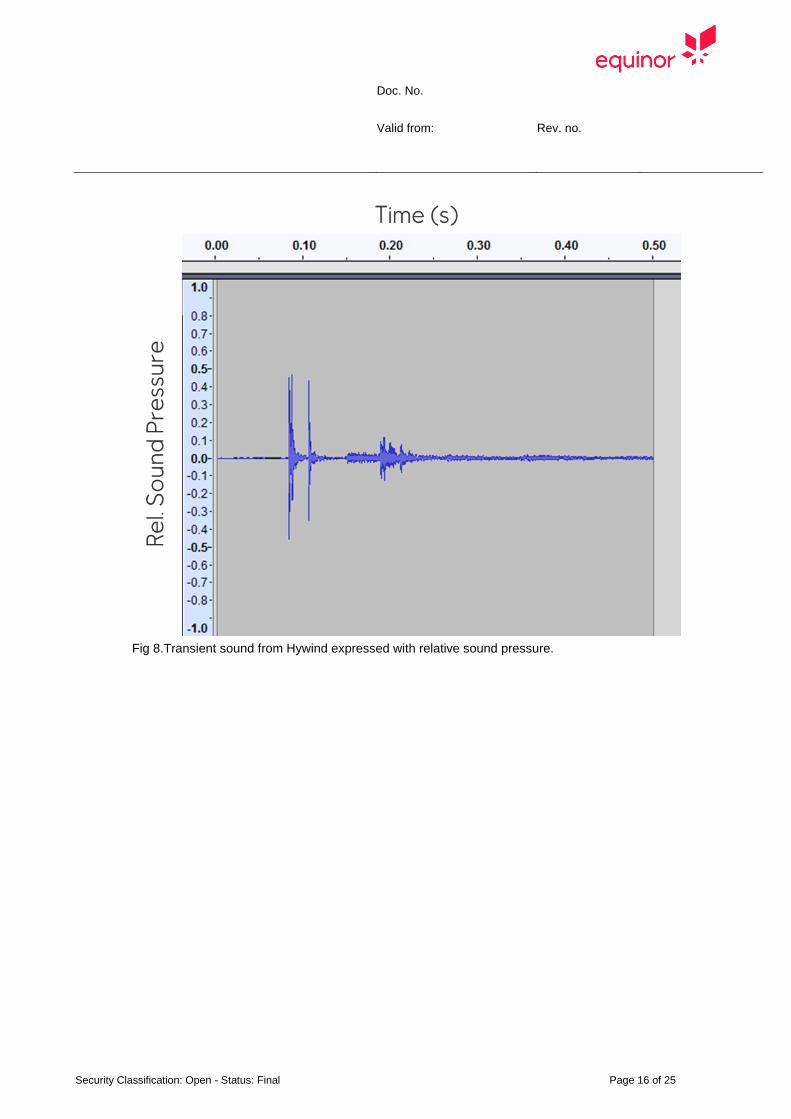
Doc No
Valid from Rev no
Security Classification Open - Status Final Page 16 of 25
Fig 8Transient sound from Hywind expressed with relative sound pressure
Doc No
Valid from Rev no
Security Classification Open - Status Final Page 17 of 25
Fig 9 Input data for transient sound used in modelling softwareExample for HY01 Original wav file measured
at 150m distance upscaled to source level at 1 m from source
A Fast Fourier Transformation (FFT) of the sound file (Audacity V222) showed a main frequency content of
the signal between 50Hz and 10kHz (Fig 10) Lower and higher frequencies are about 10dB lower and are not
considered in the respective modelling because the contribute less than 1 to the sound energy
Doc No
Valid from Rev no
Security Classification Open - Status Final Page 18 of 25
Fig 10
45 Sound propagation solvers
Continous sound
For frequencies 125Hz to 400Hz a solver for the parabolic wave equation was used and for frequencies
above 400 Hz a solver for ray tracing Frequency for simulations was 125Hz to 16kHz
Specific settings for parabolic wave equation an ray tracer solver in dBSea are given in appendix X
Impulsive sound
For calculation of SEL A ray tracer was used throughout the frequency spectrum Frequency spectrum was
315Hz to 125kHz For calculation of SPL a split solver with parabolic wave equation up to 400Hz and a ray
tracer for higher frequencies
Doc No
Valid from Rev no
Security Classification Open - Status Final Page 19 of 25
5 Results
51 Continuous sound SPL
The sound velocity profile used for the April and July simulations resulted in less propagation loss at distances
from the sound sources for the April simulations (better propagation conditions) differences are relatively small
(Fig11) Because of this we use the simulation for April for the further assessment
Fig 11 Sound pressure levels SPLpeak for April and July simulation Highest level from all depth projected to
the surface
Doc No
Valid from Rev no
Security Classification Open - Status Final Page 20 of 25
Fig 12 Sound pressure levels SPLpeak for April across positions HY4 and HY8 (position of transect in insert)
Sound propagation around each wind turbine is almost circular with a slightly better propagation into the north-
east direction where the water depth increases Sound propagation is also fairly uniform at different water
depth (Fig 12) with a slightly reduced sound strength at the surface
In the risk assessment for possible impacts it is always the distance of the highest value that is considered and
all graphical displays show the highest value projected to the surface
If a non-impulsive sound has the potential of exceeding the peak sound pressure level threshold associates
with impulsive sound (Table 2) these tresholds are recommended for consideration according to the NOAA
guedelines
For the Hywind Tampen continuous sound none of the sound pressure thresholds for injury are
exceeded
The threshold for behavioural reaction of SPL 160 db re 1 microPa is not exceeded at any distance to the wind
turbines The lower threshold limit of SPL 120 dB re 1 microPa is about at 2000m distance to the wind mills (Fig
13) Ambient sound SPL in the area is about 112dB re 1microPa in average and 132dB re microPa at noisy days The
the indicated distance to the 120dB isopleth is also showing the audible distance at a days above average
ambient sound On days with average ambient sound levels the noise from Hywind Tampen will be audible to
animals at about 4km
Doc No
Valid from Rev no
Security Classification Open - Status Final Page 21 of 25
Fig 13 Isopleth of the 120dB re 1 microPa threshold limit for behavioural disturbance (Table 4) around the Hywind
Tampen windmills
52 Continuous sound SEL
Sound exposure patterns follow the spatial pattern for sound pressure for the unweighted SEL calculations (Fig
14 SELcum24h unweighted) There are very small differences in the sound propagation when SEL weighted
functions are use because different frequencies propagate different
Unweighted SEL and weighted SEL for all species groups from Table 2 are shown in Fig 14
Doc No
Valid from Rev no
Security Classification Open - Status Final Page 22 of 25
Fig14 Weighted SEL values for groups of marine mammals according to table 6
Table 6 NOAA risk critaria for marine mammals and relevant distances for threshold values NA shows that the
respective threshold value is not exceeded
NOAA criteria Project LE = SELcum re 1 microPa
2s
Hywind Tampen operational sound
Hearing group
range
(average)
(m)
range
max (km)
PTS Onset Threshold levels non impulsive sound
Low-Frequency (LF) Cetaceans LEp LF24h 199 dB NA NA
Mid-Frequency (MF) Cetaceans LEp MF24h 198 dB NA NA
High-Frequency (HF) Cetaceans LEp HF24h 173 dB NA NA
Phocoid Pinnipeds (PW) LEpPW24h 201 dB NA NA
Otariid Pinnipeds (OW) LEp OW24h 219 dB NA NA
TTS onset thresholds for non-impulsive sounds
Low-Frequency (LF) Cetaceans LEp LF24h 179 dB 45 52
Mid-Frequency (MF) Cetaceans LEp MF24h 178 dB NA NA
High-Frequency (HF) Cetaceans LEp HF24h 153 dB NA NA
Phocoid Pinnipeds (PW) LEpPW24h 181 dB NA NA
Otariid Pinnipeds (OW) LEp OW24h 199 dB NA NA
Doc No
Valid from Rev no
Security Classification Open - Status Final Page 23 of 25
53 Transient sound (snapping sound)
The SPLpeak at the source is with 203dB re 1 microPa just above the PTS threshold limit for high frequency
cetaceans but will drop below this threshold at a short distance (around 1 meter) to the source It is well below
threshold limits for single and multiple impulses suggested by Southall (2007) This peak value corresponds to
a SPL of 173dB re 1 microPa this is below the threshold limit for injury but above the threshold values for
behavioural disturbance of 160 dB re 1 microPa (strong reaction) and 140dB re microPa (mild reaction) The 140dB
threshold limit for weak reaction would be exceeded at distances below 160m those for the 160dB threshold
for strong reaction at 16m form the source It again has to be stressed that the available information on the
origin of the transient sound only allows a coarse estimate
Fig 15 SPL around a single turbine with indication of threshold limit for mild behavioural reaction to marine
mammals Average distance to the SPL 140 dB re 1microPa isopleth is 160m those to the SPL 160 dB re 1 microPa
isopleth is about 8m
The SELcum24h values also stay below the threshold levels for injury (Fig 16) for all groups of marine mammals
Doc No
Valid from Rev no
Security Classification Open - Status Final Page 24 of 25
Fig 16 SELcum 24 of this transient sound as unweighted and weighted SELcum24h shows that the threshold
limits for injury are not exceeded at any distance to the wind tubines
6 Risk evaluation of sound originating from Hywind Tampen windturbines
61 Continous sound evaluated on SPL and SEL metrics
The threshold limits for injury (PTS and TTS) are not exceeded in the vicinity of Hywind Tampen wind turbines
except those for low frequency cetaceans where the respective SEL threshold limit is exceeded within a radius
of 52m around each individual wind turbine This however does not pose a risk to marine mammals In order to
receiveobserve this threshold limit an animal from the group of the low frequency cetaceans has to be present
within this zone for 24hours The probability that this happens is almost zero An actively movingmigrating
animal will pass this zone within a few seconds and even a none moving animal drifting with the currents will
only be exposed for a short time The ambient noise in the area is estimated to about 112 dB re 1 microPa SPL
this means the sound created by Hywind turbines is on average not audible to marine mammals beyond a
distance of 4km
The overall risk for marine mammals from continuous sound form Hywind Tampen during operations is
evaluated as non existing
62 Transient sound
Risk assessment for the transient is based on many assumptions related to the origin of the sound and the
strength of the sound on it source It is further not established if this so called ldquosnappingrdquo sound is an inherent
property of the Hywind design or if it is a property only be found on the Hywind 1
Risk assessment is included in this study because the strength of the snapping sound is close to some of the
threshold values (SPL 180dB re 1 microPa for harassment B definition) and needs consideration in case it is an
Doc No
Valid from Rev no
Security Classification Open - Status Final Page 25 of 25
inherent property of the Hywind design It is highly recommended to verify the presence or absence of this
feature on the Hywind Scotland installation In case of absence this risk assessment has not to be repeated for
future Hywind installations
The risk is however evaluated as low in general Higher sound pressures can only be expected very close to
the sound source and the the probability of being close to the source of the transient sound is small for any
marine mammal The sound energy animals would be exposed to if staying in the are for a longer period is
also relatively low and does not pose a risk It can not be expected that animals stay for 24hours in the area
and even if they the received sound energy is below any threshold levels for injury Behavioural reactions can
be expected at relatively close distances to the wind turbines eg avoiding Though it is not expected that this
has negative impact on individuals or populations of marine mammals
Overall the risk for marine mammals originating from the transient sound is evaluated as non-existing
Due to the risk of formally exceeding some threshold levels for the transient sound it is recommended to do
sound measurements at newer Hywind installations eg in Scotland to find out if the new design of the
mooring creates similar sound or not
7 Appendix
JASCO 2011 Hywind Acoustic Measurement Report Jasco Report NO 00229
Xodus 2015 Technical Note on Underwater Noise A-100142-S20-TECH-001
NOAA (2018) 2018 Revision to Technical Guidance for Assessing the Effects of Anthropogenic Sound on
Marine Mammal Hearing (Version 2) httpswwwfisheriesnoaagovnationalmarine-mammal-
protectionmarine-mammal-acoustic-technical-guidance
Tollefsen Christina D S (2013) Reccomendations for calculatintg sound speed profiles from field data
Defence RampD Canada Atlantic Technical1048577Memorandum DRDC Atlantic TM 2013-156
Ballard MS and Lee Kevin M2017 The Acoustics of Marine Sediments Acoustics Today volume 13 issue 3
Fall 2017
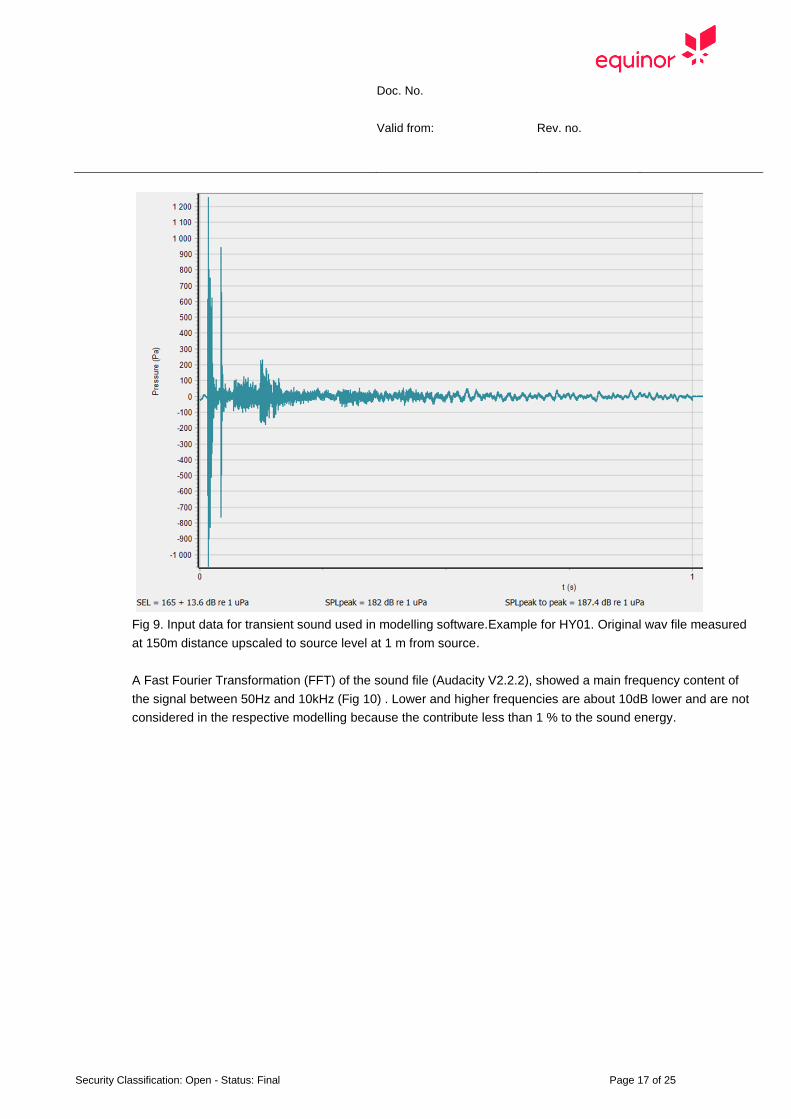
Doc No
Valid from Rev no
Security Classification Open - Status Final Page 17 of 25
Fig 9 Input data for transient sound used in modelling softwareExample for HY01 Original wav file measured
at 150m distance upscaled to source level at 1 m from source
A Fast Fourier Transformation (FFT) of the sound file (Audacity V222) showed a main frequency content of
the signal between 50Hz and 10kHz (Fig 10) Lower and higher frequencies are about 10dB lower and are not
considered in the respective modelling because the contribute less than 1 to the sound energy
Doc No
Valid from Rev no
Security Classification Open - Status Final Page 18 of 25
Fig 10
45 Sound propagation solvers
Continous sound
For frequencies 125Hz to 400Hz a solver for the parabolic wave equation was used and for frequencies
above 400 Hz a solver for ray tracing Frequency for simulations was 125Hz to 16kHz
Specific settings for parabolic wave equation an ray tracer solver in dBSea are given in appendix X
Impulsive sound
For calculation of SEL A ray tracer was used throughout the frequency spectrum Frequency spectrum was
315Hz to 125kHz For calculation of SPL a split solver with parabolic wave equation up to 400Hz and a ray
tracer for higher frequencies
Doc No
Valid from Rev no
Security Classification Open - Status Final Page 19 of 25
5 Results
51 Continuous sound SPL
The sound velocity profile used for the April and July simulations resulted in less propagation loss at distances
from the sound sources for the April simulations (better propagation conditions) differences are relatively small
(Fig11) Because of this we use the simulation for April for the further assessment
Fig 11 Sound pressure levels SPLpeak for April and July simulation Highest level from all depth projected to
the surface
Doc No
Valid from Rev no
Security Classification Open - Status Final Page 20 of 25
Fig 12 Sound pressure levels SPLpeak for April across positions HY4 and HY8 (position of transect in insert)
Sound propagation around each wind turbine is almost circular with a slightly better propagation into the north-
east direction where the water depth increases Sound propagation is also fairly uniform at different water
depth (Fig 12) with a slightly reduced sound strength at the surface
In the risk assessment for possible impacts it is always the distance of the highest value that is considered and
all graphical displays show the highest value projected to the surface
If a non-impulsive sound has the potential of exceeding the peak sound pressure level threshold associates
with impulsive sound (Table 2) these tresholds are recommended for consideration according to the NOAA
guedelines
For the Hywind Tampen continuous sound none of the sound pressure thresholds for injury are
exceeded
The threshold for behavioural reaction of SPL 160 db re 1 microPa is not exceeded at any distance to the wind
turbines The lower threshold limit of SPL 120 dB re 1 microPa is about at 2000m distance to the wind mills (Fig
13) Ambient sound SPL in the area is about 112dB re 1microPa in average and 132dB re microPa at noisy days The
the indicated distance to the 120dB isopleth is also showing the audible distance at a days above average
ambient sound On days with average ambient sound levels the noise from Hywind Tampen will be audible to
animals at about 4km
Doc No
Valid from Rev no
Security Classification Open - Status Final Page 21 of 25
Fig 13 Isopleth of the 120dB re 1 microPa threshold limit for behavioural disturbance (Table 4) around the Hywind
Tampen windmills
52 Continuous sound SEL
Sound exposure patterns follow the spatial pattern for sound pressure for the unweighted SEL calculations (Fig
14 SELcum24h unweighted) There are very small differences in the sound propagation when SEL weighted
functions are use because different frequencies propagate different
Unweighted SEL and weighted SEL for all species groups from Table 2 are shown in Fig 14
Doc No
Valid from Rev no
Security Classification Open - Status Final Page 22 of 25
Fig14 Weighted SEL values for groups of marine mammals according to table 6
Table 6 NOAA risk critaria for marine mammals and relevant distances for threshold values NA shows that the
respective threshold value is not exceeded
NOAA criteria Project LE = SELcum re 1 microPa
2s
Hywind Tampen operational sound
Hearing group
range
(average)
(m)
range
max (km)
PTS Onset Threshold levels non impulsive sound
Low-Frequency (LF) Cetaceans LEp LF24h 199 dB NA NA
Mid-Frequency (MF) Cetaceans LEp MF24h 198 dB NA NA
High-Frequency (HF) Cetaceans LEp HF24h 173 dB NA NA
Phocoid Pinnipeds (PW) LEpPW24h 201 dB NA NA
Otariid Pinnipeds (OW) LEp OW24h 219 dB NA NA
TTS onset thresholds for non-impulsive sounds
Low-Frequency (LF) Cetaceans LEp LF24h 179 dB 45 52
Mid-Frequency (MF) Cetaceans LEp MF24h 178 dB NA NA
High-Frequency (HF) Cetaceans LEp HF24h 153 dB NA NA
Phocoid Pinnipeds (PW) LEpPW24h 181 dB NA NA
Otariid Pinnipeds (OW) LEp OW24h 199 dB NA NA
Doc No
Valid from Rev no
Security Classification Open - Status Final Page 23 of 25
53 Transient sound (snapping sound)
The SPLpeak at the source is with 203dB re 1 microPa just above the PTS threshold limit for high frequency
cetaceans but will drop below this threshold at a short distance (around 1 meter) to the source It is well below
threshold limits for single and multiple impulses suggested by Southall (2007) This peak value corresponds to
a SPL of 173dB re 1 microPa this is below the threshold limit for injury but above the threshold values for
behavioural disturbance of 160 dB re 1 microPa (strong reaction) and 140dB re microPa (mild reaction) The 140dB
threshold limit for weak reaction would be exceeded at distances below 160m those for the 160dB threshold
for strong reaction at 16m form the source It again has to be stressed that the available information on the
origin of the transient sound only allows a coarse estimate
Fig 15 SPL around a single turbine with indication of threshold limit for mild behavioural reaction to marine
mammals Average distance to the SPL 140 dB re 1microPa isopleth is 160m those to the SPL 160 dB re 1 microPa
isopleth is about 8m
The SELcum24h values also stay below the threshold levels for injury (Fig 16) for all groups of marine mammals
Doc No
Valid from Rev no
Security Classification Open - Status Final Page 24 of 25
Fig 16 SELcum 24 of this transient sound as unweighted and weighted SELcum24h shows that the threshold
limits for injury are not exceeded at any distance to the wind tubines
6 Risk evaluation of sound originating from Hywind Tampen windturbines
61 Continous sound evaluated on SPL and SEL metrics
The threshold limits for injury (PTS and TTS) are not exceeded in the vicinity of Hywind Tampen wind turbines
except those for low frequency cetaceans where the respective SEL threshold limit is exceeded within a radius
of 52m around each individual wind turbine This however does not pose a risk to marine mammals In order to
receiveobserve this threshold limit an animal from the group of the low frequency cetaceans has to be present
within this zone for 24hours The probability that this happens is almost zero An actively movingmigrating
animal will pass this zone within a few seconds and even a none moving animal drifting with the currents will
only be exposed for a short time The ambient noise in the area is estimated to about 112 dB re 1 microPa SPL
this means the sound created by Hywind turbines is on average not audible to marine mammals beyond a
distance of 4km
The overall risk for marine mammals from continuous sound form Hywind Tampen during operations is
evaluated as non existing
62 Transient sound
Risk assessment for the transient is based on many assumptions related to the origin of the sound and the
strength of the sound on it source It is further not established if this so called ldquosnappingrdquo sound is an inherent
property of the Hywind design or if it is a property only be found on the Hywind 1
Risk assessment is included in this study because the strength of the snapping sound is close to some of the
threshold values (SPL 180dB re 1 microPa for harassment B definition) and needs consideration in case it is an
Doc No
Valid from Rev no
Security Classification Open - Status Final Page 25 of 25
inherent property of the Hywind design It is highly recommended to verify the presence or absence of this
feature on the Hywind Scotland installation In case of absence this risk assessment has not to be repeated for
future Hywind installations
The risk is however evaluated as low in general Higher sound pressures can only be expected very close to
the sound source and the the probability of being close to the source of the transient sound is small for any
marine mammal The sound energy animals would be exposed to if staying in the are for a longer period is
also relatively low and does not pose a risk It can not be expected that animals stay for 24hours in the area
and even if they the received sound energy is below any threshold levels for injury Behavioural reactions can
be expected at relatively close distances to the wind turbines eg avoiding Though it is not expected that this
has negative impact on individuals or populations of marine mammals
Overall the risk for marine mammals originating from the transient sound is evaluated as non-existing
Due to the risk of formally exceeding some threshold levels for the transient sound it is recommended to do
sound measurements at newer Hywind installations eg in Scotland to find out if the new design of the
mooring creates similar sound or not
7 Appendix
JASCO 2011 Hywind Acoustic Measurement Report Jasco Report NO 00229
Xodus 2015 Technical Note on Underwater Noise A-100142-S20-TECH-001
NOAA (2018) 2018 Revision to Technical Guidance for Assessing the Effects of Anthropogenic Sound on
Marine Mammal Hearing (Version 2) httpswwwfisheriesnoaagovnationalmarine-mammal-
protectionmarine-mammal-acoustic-technical-guidance
Tollefsen Christina D S (2013) Reccomendations for calculatintg sound speed profiles from field data
Defence RampD Canada Atlantic Technical1048577Memorandum DRDC Atlantic TM 2013-156
Ballard MS and Lee Kevin M2017 The Acoustics of Marine Sediments Acoustics Today volume 13 issue 3
Fall 2017
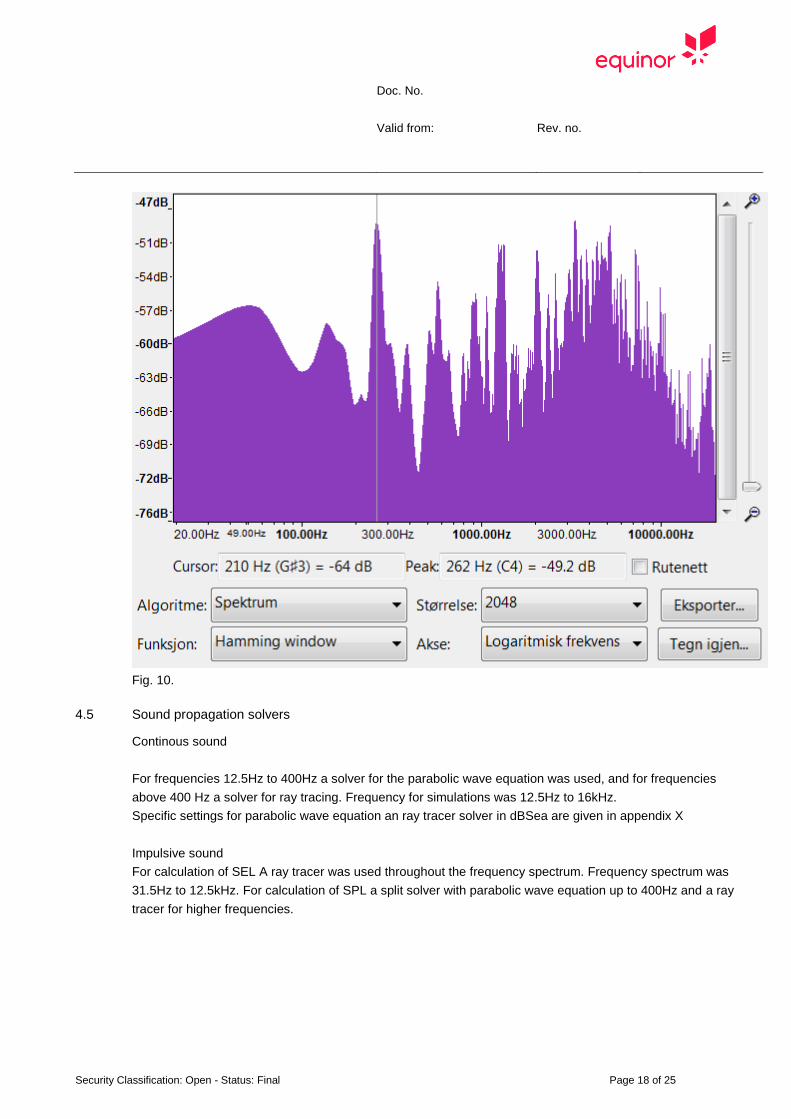
Doc No
Valid from Rev no
Security Classification Open - Status Final Page 18 of 25
Fig 10
45 Sound propagation solvers
Continous sound
For frequencies 125Hz to 400Hz a solver for the parabolic wave equation was used and for frequencies
above 400 Hz a solver for ray tracing Frequency for simulations was 125Hz to 16kHz
Specific settings for parabolic wave equation an ray tracer solver in dBSea are given in appendix X
Impulsive sound
For calculation of SEL A ray tracer was used throughout the frequency spectrum Frequency spectrum was
315Hz to 125kHz For calculation of SPL a split solver with parabolic wave equation up to 400Hz and a ray
tracer for higher frequencies
Doc No
Valid from Rev no
Security Classification Open - Status Final Page 19 of 25
5 Results
51 Continuous sound SPL
The sound velocity profile used for the April and July simulations resulted in less propagation loss at distances
from the sound sources for the April simulations (better propagation conditions) differences are relatively small
(Fig11) Because of this we use the simulation for April for the further assessment
Fig 11 Sound pressure levels SPLpeak for April and July simulation Highest level from all depth projected to
the surface
Doc No
Valid from Rev no
Security Classification Open - Status Final Page 20 of 25
Fig 12 Sound pressure levels SPLpeak for April across positions HY4 and HY8 (position of transect in insert)
Sound propagation around each wind turbine is almost circular with a slightly better propagation into the north-
east direction where the water depth increases Sound propagation is also fairly uniform at different water
depth (Fig 12) with a slightly reduced sound strength at the surface
In the risk assessment for possible impacts it is always the distance of the highest value that is considered and
all graphical displays show the highest value projected to the surface
If a non-impulsive sound has the potential of exceeding the peak sound pressure level threshold associates
with impulsive sound (Table 2) these tresholds are recommended for consideration according to the NOAA
guedelines
For the Hywind Tampen continuous sound none of the sound pressure thresholds for injury are
exceeded
The threshold for behavioural reaction of SPL 160 db re 1 microPa is not exceeded at any distance to the wind
turbines The lower threshold limit of SPL 120 dB re 1 microPa is about at 2000m distance to the wind mills (Fig
13) Ambient sound SPL in the area is about 112dB re 1microPa in average and 132dB re microPa at noisy days The
the indicated distance to the 120dB isopleth is also showing the audible distance at a days above average
ambient sound On days with average ambient sound levels the noise from Hywind Tampen will be audible to
animals at about 4km
Doc No
Valid from Rev no
Security Classification Open - Status Final Page 21 of 25
Fig 13 Isopleth of the 120dB re 1 microPa threshold limit for behavioural disturbance (Table 4) around the Hywind
Tampen windmills
52 Continuous sound SEL
Sound exposure patterns follow the spatial pattern for sound pressure for the unweighted SEL calculations (Fig
14 SELcum24h unweighted) There are very small differences in the sound propagation when SEL weighted
functions are use because different frequencies propagate different
Unweighted SEL and weighted SEL for all species groups from Table 2 are shown in Fig 14
Doc No
Valid from Rev no
Security Classification Open - Status Final Page 22 of 25
Fig14 Weighted SEL values for groups of marine mammals according to table 6
Table 6 NOAA risk critaria for marine mammals and relevant distances for threshold values NA shows that the
respective threshold value is not exceeded
NOAA criteria Project LE = SELcum re 1 microPa
2s
Hywind Tampen operational sound
Hearing group
range
(average)
(m)
range
max (km)
PTS Onset Threshold levels non impulsive sound
Low-Frequency (LF) Cetaceans LEp LF24h 199 dB NA NA
Mid-Frequency (MF) Cetaceans LEp MF24h 198 dB NA NA
High-Frequency (HF) Cetaceans LEp HF24h 173 dB NA NA
Phocoid Pinnipeds (PW) LEpPW24h 201 dB NA NA
Otariid Pinnipeds (OW) LEp OW24h 219 dB NA NA
TTS onset thresholds for non-impulsive sounds
Low-Frequency (LF) Cetaceans LEp LF24h 179 dB 45 52
Mid-Frequency (MF) Cetaceans LEp MF24h 178 dB NA NA
High-Frequency (HF) Cetaceans LEp HF24h 153 dB NA NA
Phocoid Pinnipeds (PW) LEpPW24h 181 dB NA NA
Otariid Pinnipeds (OW) LEp OW24h 199 dB NA NA
Doc No
Valid from Rev no
Security Classification Open - Status Final Page 23 of 25
53 Transient sound (snapping sound)
The SPLpeak at the source is with 203dB re 1 microPa just above the PTS threshold limit for high frequency
cetaceans but will drop below this threshold at a short distance (around 1 meter) to the source It is well below
threshold limits for single and multiple impulses suggested by Southall (2007) This peak value corresponds to
a SPL of 173dB re 1 microPa this is below the threshold limit for injury but above the threshold values for
behavioural disturbance of 160 dB re 1 microPa (strong reaction) and 140dB re microPa (mild reaction) The 140dB
threshold limit for weak reaction would be exceeded at distances below 160m those for the 160dB threshold
for strong reaction at 16m form the source It again has to be stressed that the available information on the
origin of the transient sound only allows a coarse estimate
Fig 15 SPL around a single turbine with indication of threshold limit for mild behavioural reaction to marine
mammals Average distance to the SPL 140 dB re 1microPa isopleth is 160m those to the SPL 160 dB re 1 microPa
isopleth is about 8m
The SELcum24h values also stay below the threshold levels for injury (Fig 16) for all groups of marine mammals
Doc No
Valid from Rev no
Security Classification Open - Status Final Page 24 of 25
Fig 16 SELcum 24 of this transient sound as unweighted and weighted SELcum24h shows that the threshold
limits for injury are not exceeded at any distance to the wind tubines
6 Risk evaluation of sound originating from Hywind Tampen windturbines
61 Continous sound evaluated on SPL and SEL metrics
The threshold limits for injury (PTS and TTS) are not exceeded in the vicinity of Hywind Tampen wind turbines
except those for low frequency cetaceans where the respective SEL threshold limit is exceeded within a radius
of 52m around each individual wind turbine This however does not pose a risk to marine mammals In order to
receiveobserve this threshold limit an animal from the group of the low frequency cetaceans has to be present
within this zone for 24hours The probability that this happens is almost zero An actively movingmigrating
animal will pass this zone within a few seconds and even a none moving animal drifting with the currents will
only be exposed for a short time The ambient noise in the area is estimated to about 112 dB re 1 microPa SPL
this means the sound created by Hywind turbines is on average not audible to marine mammals beyond a
distance of 4km
The overall risk for marine mammals from continuous sound form Hywind Tampen during operations is
evaluated as non existing
62 Transient sound
Risk assessment for the transient is based on many assumptions related to the origin of the sound and the
strength of the sound on it source It is further not established if this so called ldquosnappingrdquo sound is an inherent
property of the Hywind design or if it is a property only be found on the Hywind 1
Risk assessment is included in this study because the strength of the snapping sound is close to some of the
threshold values (SPL 180dB re 1 microPa for harassment B definition) and needs consideration in case it is an
Doc No
Valid from Rev no
Security Classification Open - Status Final Page 25 of 25
inherent property of the Hywind design It is highly recommended to verify the presence or absence of this
feature on the Hywind Scotland installation In case of absence this risk assessment has not to be repeated for
future Hywind installations
The risk is however evaluated as low in general Higher sound pressures can only be expected very close to
the sound source and the the probability of being close to the source of the transient sound is small for any
marine mammal The sound energy animals would be exposed to if staying in the are for a longer period is
also relatively low and does not pose a risk It can not be expected that animals stay for 24hours in the area
and even if they the received sound energy is below any threshold levels for injury Behavioural reactions can
be expected at relatively close distances to the wind turbines eg avoiding Though it is not expected that this
has negative impact on individuals or populations of marine mammals
Overall the risk for marine mammals originating from the transient sound is evaluated as non-existing
Due to the risk of formally exceeding some threshold levels for the transient sound it is recommended to do
sound measurements at newer Hywind installations eg in Scotland to find out if the new design of the
mooring creates similar sound or not
7 Appendix
JASCO 2011 Hywind Acoustic Measurement Report Jasco Report NO 00229
Xodus 2015 Technical Note on Underwater Noise A-100142-S20-TECH-001
NOAA (2018) 2018 Revision to Technical Guidance for Assessing the Effects of Anthropogenic Sound on
Marine Mammal Hearing (Version 2) httpswwwfisheriesnoaagovnationalmarine-mammal-
protectionmarine-mammal-acoustic-technical-guidance
Tollefsen Christina D S (2013) Reccomendations for calculatintg sound speed profiles from field data
Defence RampD Canada Atlantic Technical1048577Memorandum DRDC Atlantic TM 2013-156
Ballard MS and Lee Kevin M2017 The Acoustics of Marine Sediments Acoustics Today volume 13 issue 3
Fall 2017
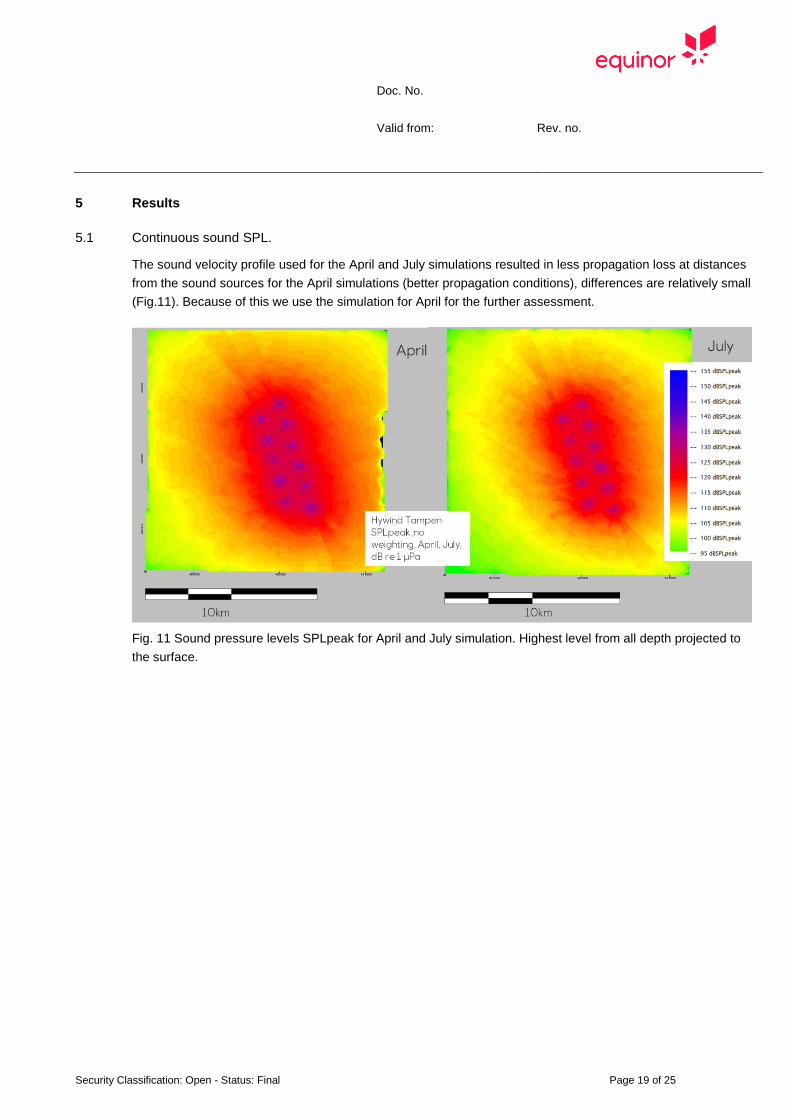
Doc No
Valid from Rev no
Security Classification Open - Status Final Page 19 of 25
5 Results
51 Continuous sound SPL
The sound velocity profile used for the April and July simulations resulted in less propagation loss at distances
from the sound sources for the April simulations (better propagation conditions) differences are relatively small
(Fig11) Because of this we use the simulation for April for the further assessment
Fig 11 Sound pressure levels SPLpeak for April and July simulation Highest level from all depth projected to
the surface
Doc No
Valid from Rev no
Security Classification Open - Status Final Page 20 of 25
Fig 12 Sound pressure levels SPLpeak for April across positions HY4 and HY8 (position of transect in insert)
Sound propagation around each wind turbine is almost circular with a slightly better propagation into the north-
east direction where the water depth increases Sound propagation is also fairly uniform at different water
depth (Fig 12) with a slightly reduced sound strength at the surface
In the risk assessment for possible impacts it is always the distance of the highest value that is considered and
all graphical displays show the highest value projected to the surface
If a non-impulsive sound has the potential of exceeding the peak sound pressure level threshold associates
with impulsive sound (Table 2) these tresholds are recommended for consideration according to the NOAA
guedelines
For the Hywind Tampen continuous sound none of the sound pressure thresholds for injury are
exceeded
The threshold for behavioural reaction of SPL 160 db re 1 microPa is not exceeded at any distance to the wind
turbines The lower threshold limit of SPL 120 dB re 1 microPa is about at 2000m distance to the wind mills (Fig
13) Ambient sound SPL in the area is about 112dB re 1microPa in average and 132dB re microPa at noisy days The
the indicated distance to the 120dB isopleth is also showing the audible distance at a days above average
ambient sound On days with average ambient sound levels the noise from Hywind Tampen will be audible to
animals at about 4km
Doc No
Valid from Rev no
Security Classification Open - Status Final Page 21 of 25
Fig 13 Isopleth of the 120dB re 1 microPa threshold limit for behavioural disturbance (Table 4) around the Hywind
Tampen windmills
52 Continuous sound SEL
Sound exposure patterns follow the spatial pattern for sound pressure for the unweighted SEL calculations (Fig
14 SELcum24h unweighted) There are very small differences in the sound propagation when SEL weighted
functions are use because different frequencies propagate different
Unweighted SEL and weighted SEL for all species groups from Table 2 are shown in Fig 14
Doc No
Valid from Rev no
Security Classification Open - Status Final Page 22 of 25
Fig14 Weighted SEL values for groups of marine mammals according to table 6
Table 6 NOAA risk critaria for marine mammals and relevant distances for threshold values NA shows that the
respective threshold value is not exceeded
NOAA criteria Project LE = SELcum re 1 microPa
2s
Hywind Tampen operational sound
Hearing group
range
(average)
(m)
range
max (km)
PTS Onset Threshold levels non impulsive sound
Low-Frequency (LF) Cetaceans LEp LF24h 199 dB NA NA
Mid-Frequency (MF) Cetaceans LEp MF24h 198 dB NA NA
High-Frequency (HF) Cetaceans LEp HF24h 173 dB NA NA
Phocoid Pinnipeds (PW) LEpPW24h 201 dB NA NA
Otariid Pinnipeds (OW) LEp OW24h 219 dB NA NA
TTS onset thresholds for non-impulsive sounds
Low-Frequency (LF) Cetaceans LEp LF24h 179 dB 45 52
Mid-Frequency (MF) Cetaceans LEp MF24h 178 dB NA NA
High-Frequency (HF) Cetaceans LEp HF24h 153 dB NA NA
Phocoid Pinnipeds (PW) LEpPW24h 181 dB NA NA
Otariid Pinnipeds (OW) LEp OW24h 199 dB NA NA
Doc No
Valid from Rev no
Security Classification Open - Status Final Page 23 of 25
53 Transient sound (snapping sound)
The SPLpeak at the source is with 203dB re 1 microPa just above the PTS threshold limit for high frequency
cetaceans but will drop below this threshold at a short distance (around 1 meter) to the source It is well below
threshold limits for single and multiple impulses suggested by Southall (2007) This peak value corresponds to
a SPL of 173dB re 1 microPa this is below the threshold limit for injury but above the threshold values for
behavioural disturbance of 160 dB re 1 microPa (strong reaction) and 140dB re microPa (mild reaction) The 140dB
threshold limit for weak reaction would be exceeded at distances below 160m those for the 160dB threshold
for strong reaction at 16m form the source It again has to be stressed that the available information on the
origin of the transient sound only allows a coarse estimate
Fig 15 SPL around a single turbine with indication of threshold limit for mild behavioural reaction to marine
mammals Average distance to the SPL 140 dB re 1microPa isopleth is 160m those to the SPL 160 dB re 1 microPa
isopleth is about 8m
The SELcum24h values also stay below the threshold levels for injury (Fig 16) for all groups of marine mammals
Doc No
Valid from Rev no
Security Classification Open - Status Final Page 24 of 25
Fig 16 SELcum 24 of this transient sound as unweighted and weighted SELcum24h shows that the threshold
limits for injury are not exceeded at any distance to the wind tubines
6 Risk evaluation of sound originating from Hywind Tampen windturbines
61 Continous sound evaluated on SPL and SEL metrics
The threshold limits for injury (PTS and TTS) are not exceeded in the vicinity of Hywind Tampen wind turbines
except those for low frequency cetaceans where the respective SEL threshold limit is exceeded within a radius
of 52m around each individual wind turbine This however does not pose a risk to marine mammals In order to
receiveobserve this threshold limit an animal from the group of the low frequency cetaceans has to be present
within this zone for 24hours The probability that this happens is almost zero An actively movingmigrating
animal will pass this zone within a few seconds and even a none moving animal drifting with the currents will
only be exposed for a short time The ambient noise in the area is estimated to about 112 dB re 1 microPa SPL
this means the sound created by Hywind turbines is on average not audible to marine mammals beyond a
distance of 4km
The overall risk for marine mammals from continuous sound form Hywind Tampen during operations is
evaluated as non existing
62 Transient sound
Risk assessment for the transient is based on many assumptions related to the origin of the sound and the
strength of the sound on it source It is further not established if this so called ldquosnappingrdquo sound is an inherent
property of the Hywind design or if it is a property only be found on the Hywind 1
Risk assessment is included in this study because the strength of the snapping sound is close to some of the
threshold values (SPL 180dB re 1 microPa for harassment B definition) and needs consideration in case it is an
Doc No
Valid from Rev no
Security Classification Open - Status Final Page 25 of 25
inherent property of the Hywind design It is highly recommended to verify the presence or absence of this
feature on the Hywind Scotland installation In case of absence this risk assessment has not to be repeated for
future Hywind installations
The risk is however evaluated as low in general Higher sound pressures can only be expected very close to
the sound source and the the probability of being close to the source of the transient sound is small for any
marine mammal The sound energy animals would be exposed to if staying in the are for a longer period is
also relatively low and does not pose a risk It can not be expected that animals stay for 24hours in the area
and even if they the received sound energy is below any threshold levels for injury Behavioural reactions can
be expected at relatively close distances to the wind turbines eg avoiding Though it is not expected that this
has negative impact on individuals or populations of marine mammals
Overall the risk for marine mammals originating from the transient sound is evaluated as non-existing
Due to the risk of formally exceeding some threshold levels for the transient sound it is recommended to do
sound measurements at newer Hywind installations eg in Scotland to find out if the new design of the
mooring creates similar sound or not
7 Appendix
JASCO 2011 Hywind Acoustic Measurement Report Jasco Report NO 00229
Xodus 2015 Technical Note on Underwater Noise A-100142-S20-TECH-001
NOAA (2018) 2018 Revision to Technical Guidance for Assessing the Effects of Anthropogenic Sound on
Marine Mammal Hearing (Version 2) httpswwwfisheriesnoaagovnationalmarine-mammal-
protectionmarine-mammal-acoustic-technical-guidance
Tollefsen Christina D S (2013) Reccomendations for calculatintg sound speed profiles from field data
Defence RampD Canada Atlantic Technical1048577Memorandum DRDC Atlantic TM 2013-156
Ballard MS and Lee Kevin M2017 The Acoustics of Marine Sediments Acoustics Today volume 13 issue 3
Fall 2017
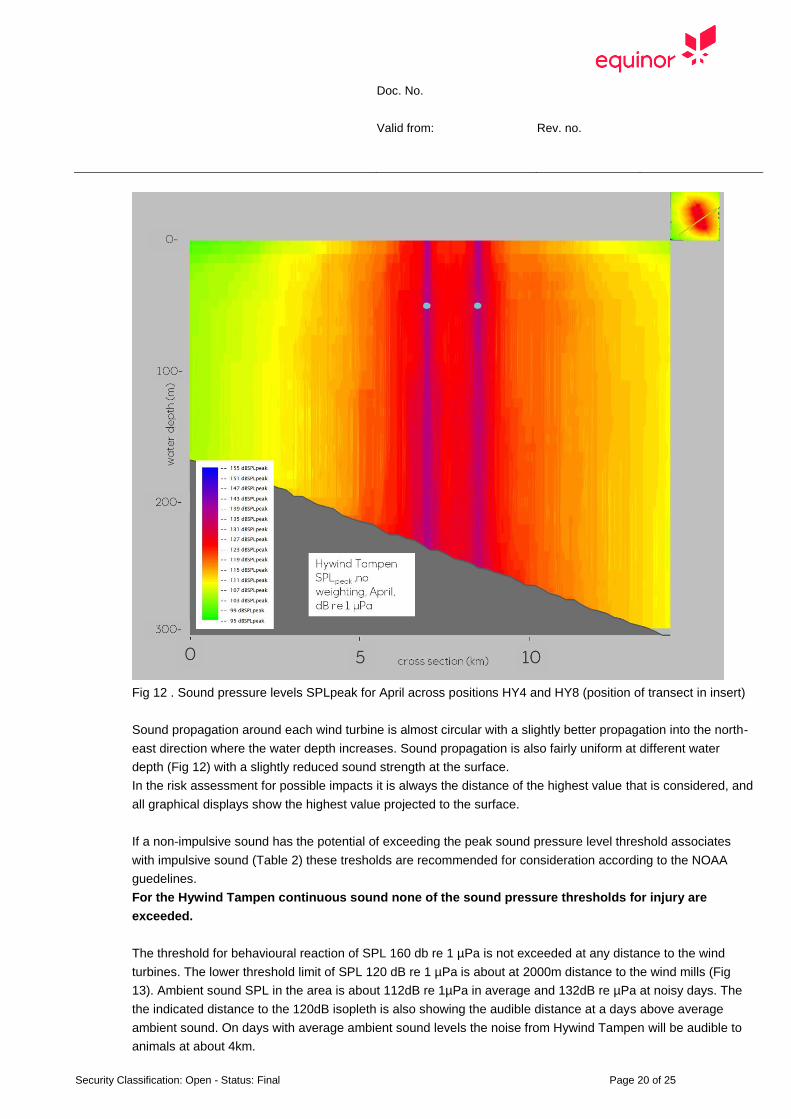
Doc No
Valid from Rev no
Security Classification Open - Status Final Page 20 of 25
Fig 12 Sound pressure levels SPLpeak for April across positions HY4 and HY8 (position of transect in insert)
Sound propagation around each wind turbine is almost circular with a slightly better propagation into the north-
east direction where the water depth increases Sound propagation is also fairly uniform at different water
depth (Fig 12) with a slightly reduced sound strength at the surface
In the risk assessment for possible impacts it is always the distance of the highest value that is considered and
all graphical displays show the highest value projected to the surface
If a non-impulsive sound has the potential of exceeding the peak sound pressure level threshold associates
with impulsive sound (Table 2) these tresholds are recommended for consideration according to the NOAA
guedelines
For the Hywind Tampen continuous sound none of the sound pressure thresholds for injury are
exceeded
The threshold for behavioural reaction of SPL 160 db re 1 microPa is not exceeded at any distance to the wind
turbines The lower threshold limit of SPL 120 dB re 1 microPa is about at 2000m distance to the wind mills (Fig
13) Ambient sound SPL in the area is about 112dB re 1microPa in average and 132dB re microPa at noisy days The
the indicated distance to the 120dB isopleth is also showing the audible distance at a days above average
ambient sound On days with average ambient sound levels the noise from Hywind Tampen will be audible to
animals at about 4km
Doc No
Valid from Rev no
Security Classification Open - Status Final Page 21 of 25
Fig 13 Isopleth of the 120dB re 1 microPa threshold limit for behavioural disturbance (Table 4) around the Hywind
Tampen windmills
52 Continuous sound SEL
Sound exposure patterns follow the spatial pattern for sound pressure for the unweighted SEL calculations (Fig
14 SELcum24h unweighted) There are very small differences in the sound propagation when SEL weighted
functions are use because different frequencies propagate different
Unweighted SEL and weighted SEL for all species groups from Table 2 are shown in Fig 14
Doc No
Valid from Rev no
Security Classification Open - Status Final Page 22 of 25
Fig14 Weighted SEL values for groups of marine mammals according to table 6
Table 6 NOAA risk critaria for marine mammals and relevant distances for threshold values NA shows that the
respective threshold value is not exceeded
NOAA criteria Project LE = SELcum re 1 microPa
2s
Hywind Tampen operational sound
Hearing group
range
(average)
(m)
range
max (km)
PTS Onset Threshold levels non impulsive sound
Low-Frequency (LF) Cetaceans LEp LF24h 199 dB NA NA
Mid-Frequency (MF) Cetaceans LEp MF24h 198 dB NA NA
High-Frequency (HF) Cetaceans LEp HF24h 173 dB NA NA
Phocoid Pinnipeds (PW) LEpPW24h 201 dB NA NA
Otariid Pinnipeds (OW) LEp OW24h 219 dB NA NA
TTS onset thresholds for non-impulsive sounds
Low-Frequency (LF) Cetaceans LEp LF24h 179 dB 45 52
Mid-Frequency (MF) Cetaceans LEp MF24h 178 dB NA NA
High-Frequency (HF) Cetaceans LEp HF24h 153 dB NA NA
Phocoid Pinnipeds (PW) LEpPW24h 181 dB NA NA
Otariid Pinnipeds (OW) LEp OW24h 199 dB NA NA
Doc No
Valid from Rev no
Security Classification Open - Status Final Page 23 of 25
53 Transient sound (snapping sound)
The SPLpeak at the source is with 203dB re 1 microPa just above the PTS threshold limit for high frequency
cetaceans but will drop below this threshold at a short distance (around 1 meter) to the source It is well below
threshold limits for single and multiple impulses suggested by Southall (2007) This peak value corresponds to
a SPL of 173dB re 1 microPa this is below the threshold limit for injury but above the threshold values for
behavioural disturbance of 160 dB re 1 microPa (strong reaction) and 140dB re microPa (mild reaction) The 140dB
threshold limit for weak reaction would be exceeded at distances below 160m those for the 160dB threshold
for strong reaction at 16m form the source It again has to be stressed that the available information on the
origin of the transient sound only allows a coarse estimate
Fig 15 SPL around a single turbine with indication of threshold limit for mild behavioural reaction to marine
mammals Average distance to the SPL 140 dB re 1microPa isopleth is 160m those to the SPL 160 dB re 1 microPa
isopleth is about 8m
The SELcum24h values also stay below the threshold levels for injury (Fig 16) for all groups of marine mammals
Doc No
Valid from Rev no
Security Classification Open - Status Final Page 24 of 25
Fig 16 SELcum 24 of this transient sound as unweighted and weighted SELcum24h shows that the threshold
limits for injury are not exceeded at any distance to the wind tubines
6 Risk evaluation of sound originating from Hywind Tampen windturbines
61 Continous sound evaluated on SPL and SEL metrics
The threshold limits for injury (PTS and TTS) are not exceeded in the vicinity of Hywind Tampen wind turbines
except those for low frequency cetaceans where the respective SEL threshold limit is exceeded within a radius
of 52m around each individual wind turbine This however does not pose a risk to marine mammals In order to
receiveobserve this threshold limit an animal from the group of the low frequency cetaceans has to be present
within this zone for 24hours The probability that this happens is almost zero An actively movingmigrating
animal will pass this zone within a few seconds and even a none moving animal drifting with the currents will
only be exposed for a short time The ambient noise in the area is estimated to about 112 dB re 1 microPa SPL
this means the sound created by Hywind turbines is on average not audible to marine mammals beyond a
distance of 4km
The overall risk for marine mammals from continuous sound form Hywind Tampen during operations is
evaluated as non existing
62 Transient sound
Risk assessment for the transient is based on many assumptions related to the origin of the sound and the
strength of the sound on it source It is further not established if this so called ldquosnappingrdquo sound is an inherent
property of the Hywind design or if it is a property only be found on the Hywind 1
Risk assessment is included in this study because the strength of the snapping sound is close to some of the
threshold values (SPL 180dB re 1 microPa for harassment B definition) and needs consideration in case it is an
Doc No
Valid from Rev no
Security Classification Open - Status Final Page 25 of 25
inherent property of the Hywind design It is highly recommended to verify the presence or absence of this
feature on the Hywind Scotland installation In case of absence this risk assessment has not to be repeated for
future Hywind installations
The risk is however evaluated as low in general Higher sound pressures can only be expected very close to
the sound source and the the probability of being close to the source of the transient sound is small for any
marine mammal The sound energy animals would be exposed to if staying in the are for a longer period is
also relatively low and does not pose a risk It can not be expected that animals stay for 24hours in the area
and even if they the received sound energy is below any threshold levels for injury Behavioural reactions can
be expected at relatively close distances to the wind turbines eg avoiding Though it is not expected that this
has negative impact on individuals or populations of marine mammals
Overall the risk for marine mammals originating from the transient sound is evaluated as non-existing
Due to the risk of formally exceeding some threshold levels for the transient sound it is recommended to do
sound measurements at newer Hywind installations eg in Scotland to find out if the new design of the
mooring creates similar sound or not
7 Appendix
JASCO 2011 Hywind Acoustic Measurement Report Jasco Report NO 00229
Xodus 2015 Technical Note on Underwater Noise A-100142-S20-TECH-001
NOAA (2018) 2018 Revision to Technical Guidance for Assessing the Effects of Anthropogenic Sound on
Marine Mammal Hearing (Version 2) httpswwwfisheriesnoaagovnationalmarine-mammal-
protectionmarine-mammal-acoustic-technical-guidance
Tollefsen Christina D S (2013) Reccomendations for calculatintg sound speed profiles from field data
Defence RampD Canada Atlantic Technical1048577Memorandum DRDC Atlantic TM 2013-156
Ballard MS and Lee Kevin M2017 The Acoustics of Marine Sediments Acoustics Today volume 13 issue 3
Fall 2017
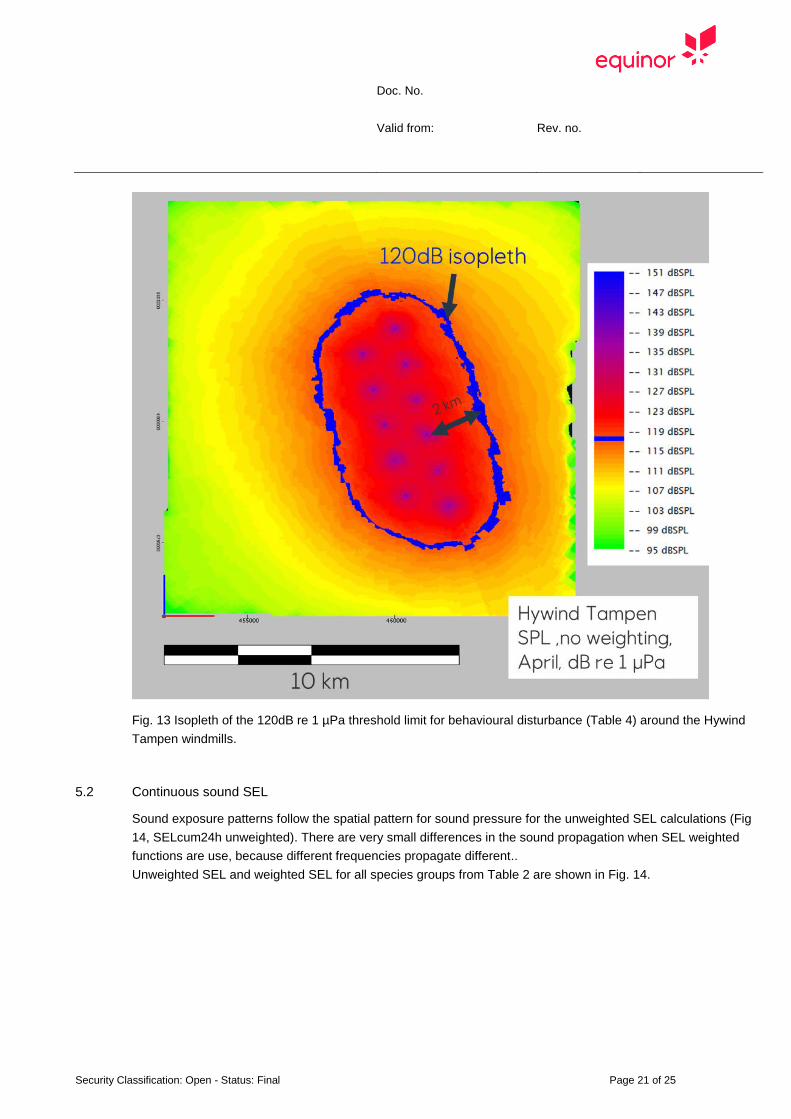
Doc No
Valid from Rev no
Security Classification Open - Status Final Page 21 of 25
Fig 13 Isopleth of the 120dB re 1 microPa threshold limit for behavioural disturbance (Table 4) around the Hywind
Tampen windmills
52 Continuous sound SEL
Sound exposure patterns follow the spatial pattern for sound pressure for the unweighted SEL calculations (Fig
14 SELcum24h unweighted) There are very small differences in the sound propagation when SEL weighted
functions are use because different frequencies propagate different
Unweighted SEL and weighted SEL for all species groups from Table 2 are shown in Fig 14
Doc No
Valid from Rev no
Security Classification Open - Status Final Page 22 of 25
Fig14 Weighted SEL values for groups of marine mammals according to table 6
Table 6 NOAA risk critaria for marine mammals and relevant distances for threshold values NA shows that the
respective threshold value is not exceeded
NOAA criteria Project LE = SELcum re 1 microPa
2s
Hywind Tampen operational sound
Hearing group
range
(average)
(m)
range
max (km)
PTS Onset Threshold levels non impulsive sound
Low-Frequency (LF) Cetaceans LEp LF24h 199 dB NA NA
Mid-Frequency (MF) Cetaceans LEp MF24h 198 dB NA NA
High-Frequency (HF) Cetaceans LEp HF24h 173 dB NA NA
Phocoid Pinnipeds (PW) LEpPW24h 201 dB NA NA
Otariid Pinnipeds (OW) LEp OW24h 219 dB NA NA
TTS onset thresholds for non-impulsive sounds
Low-Frequency (LF) Cetaceans LEp LF24h 179 dB 45 52
Mid-Frequency (MF) Cetaceans LEp MF24h 178 dB NA NA
High-Frequency (HF) Cetaceans LEp HF24h 153 dB NA NA
Phocoid Pinnipeds (PW) LEpPW24h 181 dB NA NA
Otariid Pinnipeds (OW) LEp OW24h 199 dB NA NA
Doc No
Valid from Rev no
Security Classification Open - Status Final Page 23 of 25
53 Transient sound (snapping sound)
The SPLpeak at the source is with 203dB re 1 microPa just above the PTS threshold limit for high frequency
cetaceans but will drop below this threshold at a short distance (around 1 meter) to the source It is well below
threshold limits for single and multiple impulses suggested by Southall (2007) This peak value corresponds to
a SPL of 173dB re 1 microPa this is below the threshold limit for injury but above the threshold values for
behavioural disturbance of 160 dB re 1 microPa (strong reaction) and 140dB re microPa (mild reaction) The 140dB
threshold limit for weak reaction would be exceeded at distances below 160m those for the 160dB threshold
for strong reaction at 16m form the source It again has to be stressed that the available information on the
origin of the transient sound only allows a coarse estimate
Fig 15 SPL around a single turbine with indication of threshold limit for mild behavioural reaction to marine
mammals Average distance to the SPL 140 dB re 1microPa isopleth is 160m those to the SPL 160 dB re 1 microPa
isopleth is about 8m
The SELcum24h values also stay below the threshold levels for injury (Fig 16) for all groups of marine mammals
Doc No
Valid from Rev no
Security Classification Open - Status Final Page 24 of 25
Fig 16 SELcum 24 of this transient sound as unweighted and weighted SELcum24h shows that the threshold
limits for injury are not exceeded at any distance to the wind tubines
6 Risk evaluation of sound originating from Hywind Tampen windturbines
61 Continous sound evaluated on SPL and SEL metrics
The threshold limits for injury (PTS and TTS) are not exceeded in the vicinity of Hywind Tampen wind turbines
except those for low frequency cetaceans where the respective SEL threshold limit is exceeded within a radius
of 52m around each individual wind turbine This however does not pose a risk to marine mammals In order to
receiveobserve this threshold limit an animal from the group of the low frequency cetaceans has to be present
within this zone for 24hours The probability that this happens is almost zero An actively movingmigrating
animal will pass this zone within a few seconds and even a none moving animal drifting with the currents will
only be exposed for a short time The ambient noise in the area is estimated to about 112 dB re 1 microPa SPL
this means the sound created by Hywind turbines is on average not audible to marine mammals beyond a
distance of 4km
The overall risk for marine mammals from continuous sound form Hywind Tampen during operations is
evaluated as non existing
62 Transient sound
Risk assessment for the transient is based on many assumptions related to the origin of the sound and the
strength of the sound on it source It is further not established if this so called ldquosnappingrdquo sound is an inherent
property of the Hywind design or if it is a property only be found on the Hywind 1
Risk assessment is included in this study because the strength of the snapping sound is close to some of the
threshold values (SPL 180dB re 1 microPa for harassment B definition) and needs consideration in case it is an
Doc No
Valid from Rev no
Security Classification Open - Status Final Page 25 of 25
inherent property of the Hywind design It is highly recommended to verify the presence or absence of this
feature on the Hywind Scotland installation In case of absence this risk assessment has not to be repeated for
future Hywind installations
The risk is however evaluated as low in general Higher sound pressures can only be expected very close to
the sound source and the the probability of being close to the source of the transient sound is small for any
marine mammal The sound energy animals would be exposed to if staying in the are for a longer period is
also relatively low and does not pose a risk It can not be expected that animals stay for 24hours in the area
and even if they the received sound energy is below any threshold levels for injury Behavioural reactions can
be expected at relatively close distances to the wind turbines eg avoiding Though it is not expected that this
has negative impact on individuals or populations of marine mammals
Overall the risk for marine mammals originating from the transient sound is evaluated as non-existing
Due to the risk of formally exceeding some threshold levels for the transient sound it is recommended to do
sound measurements at newer Hywind installations eg in Scotland to find out if the new design of the
mooring creates similar sound or not
7 Appendix
JASCO 2011 Hywind Acoustic Measurement Report Jasco Report NO 00229
Xodus 2015 Technical Note on Underwater Noise A-100142-S20-TECH-001
NOAA (2018) 2018 Revision to Technical Guidance for Assessing the Effects of Anthropogenic Sound on
Marine Mammal Hearing (Version 2) httpswwwfisheriesnoaagovnationalmarine-mammal-
protectionmarine-mammal-acoustic-technical-guidance
Tollefsen Christina D S (2013) Reccomendations for calculatintg sound speed profiles from field data
Defence RampD Canada Atlantic Technical1048577Memorandum DRDC Atlantic TM 2013-156
Ballard MS and Lee Kevin M2017 The Acoustics of Marine Sediments Acoustics Today volume 13 issue 3
Fall 2017
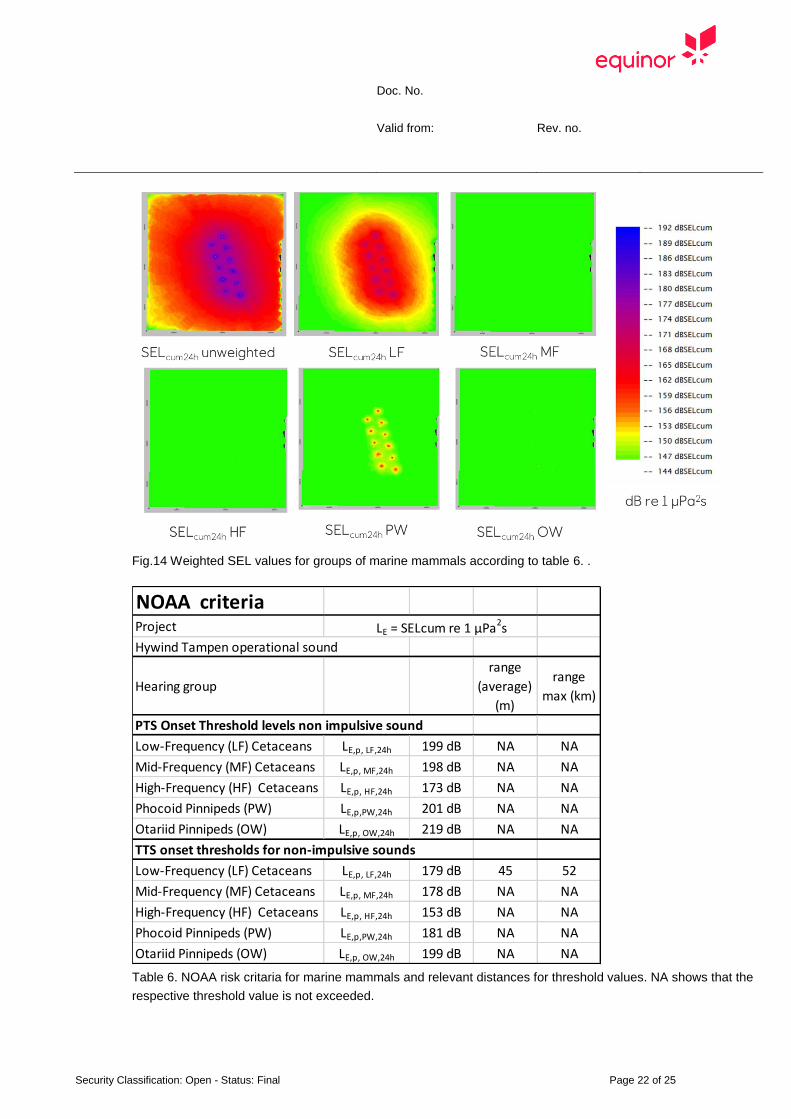
Doc No
Valid from Rev no
Security Classification Open - Status Final Page 22 of 25
Fig14 Weighted SEL values for groups of marine mammals according to table 6
Table 6 NOAA risk critaria for marine mammals and relevant distances for threshold values NA shows that the
respective threshold value is not exceeded
NOAA criteria Project LE = SELcum re 1 microPa
2s
Hywind Tampen operational sound
Hearing group
range
(average)
(m)
range
max (km)
PTS Onset Threshold levels non impulsive sound
Low-Frequency (LF) Cetaceans LEp LF24h 199 dB NA NA
Mid-Frequency (MF) Cetaceans LEp MF24h 198 dB NA NA
High-Frequency (HF) Cetaceans LEp HF24h 173 dB NA NA
Phocoid Pinnipeds (PW) LEpPW24h 201 dB NA NA
Otariid Pinnipeds (OW) LEp OW24h 219 dB NA NA
TTS onset thresholds for non-impulsive sounds
Low-Frequency (LF) Cetaceans LEp LF24h 179 dB 45 52
Mid-Frequency (MF) Cetaceans LEp MF24h 178 dB NA NA
High-Frequency (HF) Cetaceans LEp HF24h 153 dB NA NA
Phocoid Pinnipeds (PW) LEpPW24h 181 dB NA NA
Otariid Pinnipeds (OW) LEp OW24h 199 dB NA NA
Doc No
Valid from Rev no
Security Classification Open - Status Final Page 23 of 25
53 Transient sound (snapping sound)
The SPLpeak at the source is with 203dB re 1 microPa just above the PTS threshold limit for high frequency
cetaceans but will drop below this threshold at a short distance (around 1 meter) to the source It is well below
threshold limits for single and multiple impulses suggested by Southall (2007) This peak value corresponds to
a SPL of 173dB re 1 microPa this is below the threshold limit for injury but above the threshold values for
behavioural disturbance of 160 dB re 1 microPa (strong reaction) and 140dB re microPa (mild reaction) The 140dB
threshold limit for weak reaction would be exceeded at distances below 160m those for the 160dB threshold
for strong reaction at 16m form the source It again has to be stressed that the available information on the
origin of the transient sound only allows a coarse estimate
Fig 15 SPL around a single turbine with indication of threshold limit for mild behavioural reaction to marine
mammals Average distance to the SPL 140 dB re 1microPa isopleth is 160m those to the SPL 160 dB re 1 microPa
isopleth is about 8m
The SELcum24h values also stay below the threshold levels for injury (Fig 16) for all groups of marine mammals
Doc No
Valid from Rev no
Security Classification Open - Status Final Page 24 of 25
Fig 16 SELcum 24 of this transient sound as unweighted and weighted SELcum24h shows that the threshold
limits for injury are not exceeded at any distance to the wind tubines
6 Risk evaluation of sound originating from Hywind Tampen windturbines
61 Continous sound evaluated on SPL and SEL metrics
The threshold limits for injury (PTS and TTS) are not exceeded in the vicinity of Hywind Tampen wind turbines
except those for low frequency cetaceans where the respective SEL threshold limit is exceeded within a radius
of 52m around each individual wind turbine This however does not pose a risk to marine mammals In order to
receiveobserve this threshold limit an animal from the group of the low frequency cetaceans has to be present
within this zone for 24hours The probability that this happens is almost zero An actively movingmigrating
animal will pass this zone within a few seconds and even a none moving animal drifting with the currents will
only be exposed for a short time The ambient noise in the area is estimated to about 112 dB re 1 microPa SPL
this means the sound created by Hywind turbines is on average not audible to marine mammals beyond a
distance of 4km
The overall risk for marine mammals from continuous sound form Hywind Tampen during operations is
evaluated as non existing
62 Transient sound
Risk assessment for the transient is based on many assumptions related to the origin of the sound and the
strength of the sound on it source It is further not established if this so called ldquosnappingrdquo sound is an inherent
property of the Hywind design or if it is a property only be found on the Hywind 1
Risk assessment is included in this study because the strength of the snapping sound is close to some of the
threshold values (SPL 180dB re 1 microPa for harassment B definition) and needs consideration in case it is an
Doc No
Valid from Rev no
Security Classification Open - Status Final Page 25 of 25
inherent property of the Hywind design It is highly recommended to verify the presence or absence of this
feature on the Hywind Scotland installation In case of absence this risk assessment has not to be repeated for
future Hywind installations
The risk is however evaluated as low in general Higher sound pressures can only be expected very close to
the sound source and the the probability of being close to the source of the transient sound is small for any
marine mammal The sound energy animals would be exposed to if staying in the are for a longer period is
also relatively low and does not pose a risk It can not be expected that animals stay for 24hours in the area
and even if they the received sound energy is below any threshold levels for injury Behavioural reactions can
be expected at relatively close distances to the wind turbines eg avoiding Though it is not expected that this
has negative impact on individuals or populations of marine mammals
Overall the risk for marine mammals originating from the transient sound is evaluated as non-existing
Due to the risk of formally exceeding some threshold levels for the transient sound it is recommended to do
sound measurements at newer Hywind installations eg in Scotland to find out if the new design of the
mooring creates similar sound or not
7 Appendix
JASCO 2011 Hywind Acoustic Measurement Report Jasco Report NO 00229
Xodus 2015 Technical Note on Underwater Noise A-100142-S20-TECH-001
NOAA (2018) 2018 Revision to Technical Guidance for Assessing the Effects of Anthropogenic Sound on
Marine Mammal Hearing (Version 2) httpswwwfisheriesnoaagovnationalmarine-mammal-
protectionmarine-mammal-acoustic-technical-guidance
Tollefsen Christina D S (2013) Reccomendations for calculatintg sound speed profiles from field data
Defence RampD Canada Atlantic Technical1048577Memorandum DRDC Atlantic TM 2013-156
Ballard MS and Lee Kevin M2017 The Acoustics of Marine Sediments Acoustics Today volume 13 issue 3
Fall 2017
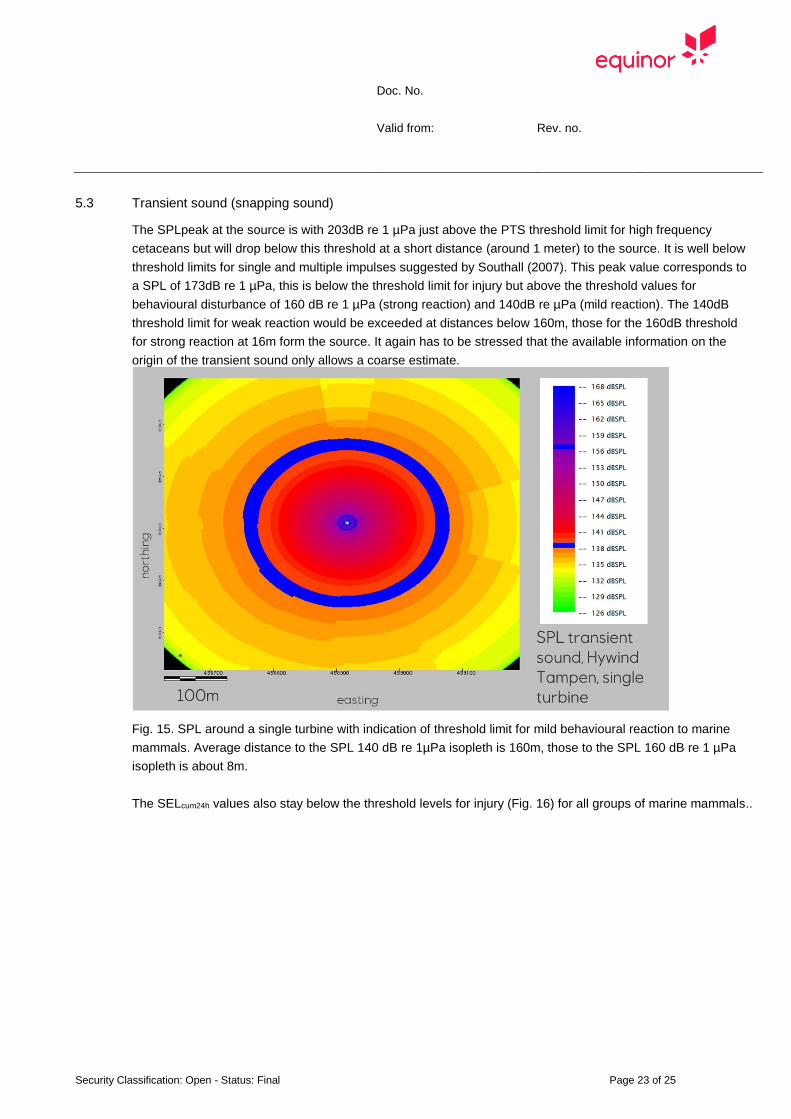
Doc No
Valid from Rev no
Security Classification Open - Status Final Page 23 of 25
53 Transient sound (snapping sound)
The SPLpeak at the source is with 203dB re 1 microPa just above the PTS threshold limit for high frequency
cetaceans but will drop below this threshold at a short distance (around 1 meter) to the source It is well below
threshold limits for single and multiple impulses suggested by Southall (2007) This peak value corresponds to
a SPL of 173dB re 1 microPa this is below the threshold limit for injury but above the threshold values for
behavioural disturbance of 160 dB re 1 microPa (strong reaction) and 140dB re microPa (mild reaction) The 140dB
threshold limit for weak reaction would be exceeded at distances below 160m those for the 160dB threshold
for strong reaction at 16m form the source It again has to be stressed that the available information on the
origin of the transient sound only allows a coarse estimate
Fig 15 SPL around a single turbine with indication of threshold limit for mild behavioural reaction to marine
mammals Average distance to the SPL 140 dB re 1microPa isopleth is 160m those to the SPL 160 dB re 1 microPa
isopleth is about 8m
The SELcum24h values also stay below the threshold levels for injury (Fig 16) for all groups of marine mammals
Doc No
Valid from Rev no
Security Classification Open - Status Final Page 24 of 25
Fig 16 SELcum 24 of this transient sound as unweighted and weighted SELcum24h shows that the threshold
limits for injury are not exceeded at any distance to the wind tubines
6 Risk evaluation of sound originating from Hywind Tampen windturbines
61 Continous sound evaluated on SPL and SEL metrics
The threshold limits for injury (PTS and TTS) are not exceeded in the vicinity of Hywind Tampen wind turbines
except those for low frequency cetaceans where the respective SEL threshold limit is exceeded within a radius
of 52m around each individual wind turbine This however does not pose a risk to marine mammals In order to
receiveobserve this threshold limit an animal from the group of the low frequency cetaceans has to be present
within this zone for 24hours The probability that this happens is almost zero An actively movingmigrating
animal will pass this zone within a few seconds and even a none moving animal drifting with the currents will
only be exposed for a short time The ambient noise in the area is estimated to about 112 dB re 1 microPa SPL
this means the sound created by Hywind turbines is on average not audible to marine mammals beyond a
distance of 4km
The overall risk for marine mammals from continuous sound form Hywind Tampen during operations is
evaluated as non existing
62 Transient sound
Risk assessment for the transient is based on many assumptions related to the origin of the sound and the
strength of the sound on it source It is further not established if this so called ldquosnappingrdquo sound is an inherent
property of the Hywind design or if it is a property only be found on the Hywind 1
Risk assessment is included in this study because the strength of the snapping sound is close to some of the
threshold values (SPL 180dB re 1 microPa for harassment B definition) and needs consideration in case it is an
Doc No
Valid from Rev no
Security Classification Open - Status Final Page 25 of 25
inherent property of the Hywind design It is highly recommended to verify the presence or absence of this
feature on the Hywind Scotland installation In case of absence this risk assessment has not to be repeated for
future Hywind installations
The risk is however evaluated as low in general Higher sound pressures can only be expected very close to
the sound source and the the probability of being close to the source of the transient sound is small for any
marine mammal The sound energy animals would be exposed to if staying in the are for a longer period is
also relatively low and does not pose a risk It can not be expected that animals stay for 24hours in the area
and even if they the received sound energy is below any threshold levels for injury Behavioural reactions can
be expected at relatively close distances to the wind turbines eg avoiding Though it is not expected that this
has negative impact on individuals or populations of marine mammals
Overall the risk for marine mammals originating from the transient sound is evaluated as non-existing
Due to the risk of formally exceeding some threshold levels for the transient sound it is recommended to do
sound measurements at newer Hywind installations eg in Scotland to find out if the new design of the
mooring creates similar sound or not
7 Appendix
JASCO 2011 Hywind Acoustic Measurement Report Jasco Report NO 00229
Xodus 2015 Technical Note on Underwater Noise A-100142-S20-TECH-001
NOAA (2018) 2018 Revision to Technical Guidance for Assessing the Effects of Anthropogenic Sound on
Marine Mammal Hearing (Version 2) httpswwwfisheriesnoaagovnationalmarine-mammal-
protectionmarine-mammal-acoustic-technical-guidance
Tollefsen Christina D S (2013) Reccomendations for calculatintg sound speed profiles from field data
Defence RampD Canada Atlantic Technical1048577Memorandum DRDC Atlantic TM 2013-156
Ballard MS and Lee Kevin M2017 The Acoustics of Marine Sediments Acoustics Today volume 13 issue 3
Fall 2017
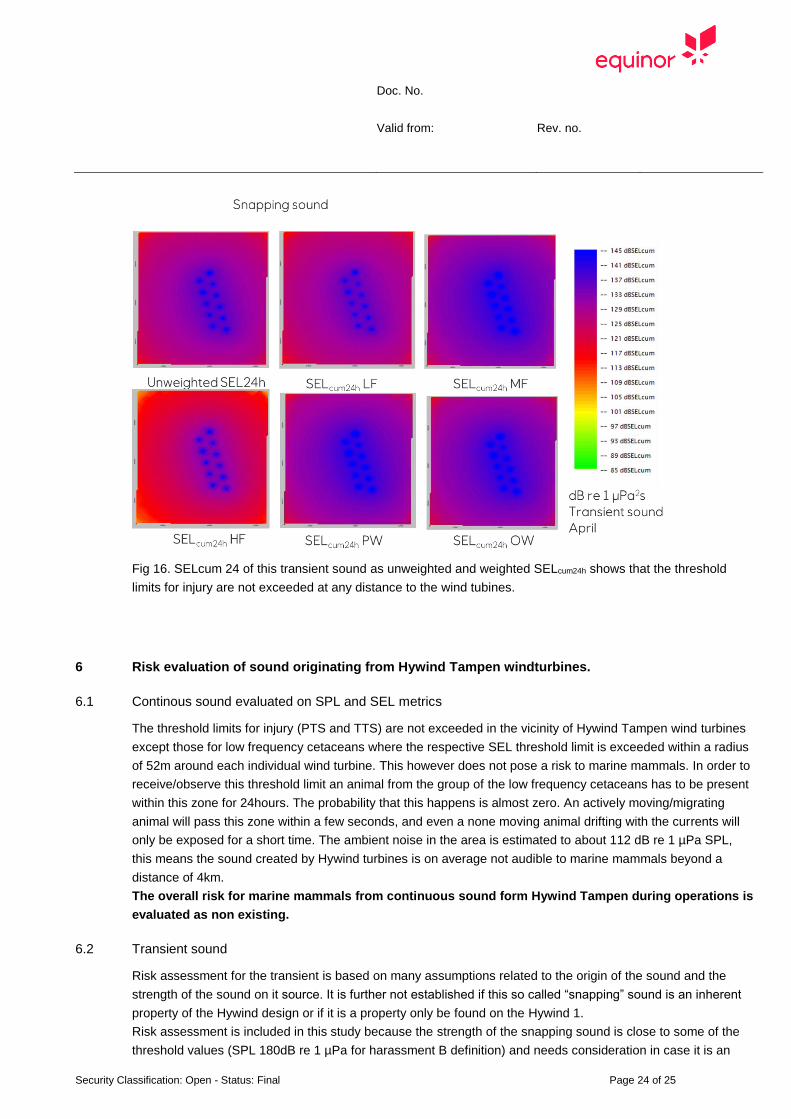
Doc No
Valid from Rev no
Security Classification Open - Status Final Page 24 of 25
Fig 16 SELcum 24 of this transient sound as unweighted and weighted SELcum24h shows that the threshold
limits for injury are not exceeded at any distance to the wind tubines
6 Risk evaluation of sound originating from Hywind Tampen windturbines
61 Continous sound evaluated on SPL and SEL metrics
The threshold limits for injury (PTS and TTS) are not exceeded in the vicinity of Hywind Tampen wind turbines
except those for low frequency cetaceans where the respective SEL threshold limit is exceeded within a radius
of 52m around each individual wind turbine This however does not pose a risk to marine mammals In order to
receiveobserve this threshold limit an animal from the group of the low frequency cetaceans has to be present
within this zone for 24hours The probability that this happens is almost zero An actively movingmigrating
animal will pass this zone within a few seconds and even a none moving animal drifting with the currents will
only be exposed for a short time The ambient noise in the area is estimated to about 112 dB re 1 microPa SPL
this means the sound created by Hywind turbines is on average not audible to marine mammals beyond a
distance of 4km
The overall risk for marine mammals from continuous sound form Hywind Tampen during operations is
evaluated as non existing
62 Transient sound
Risk assessment for the transient is based on many assumptions related to the origin of the sound and the
strength of the sound on it source It is further not established if this so called ldquosnappingrdquo sound is an inherent
property of the Hywind design or if it is a property only be found on the Hywind 1
Risk assessment is included in this study because the strength of the snapping sound is close to some of the
threshold values (SPL 180dB re 1 microPa for harassment B definition) and needs consideration in case it is an
Doc No
Valid from Rev no
Security Classification Open - Status Final Page 25 of 25
inherent property of the Hywind design It is highly recommended to verify the presence or absence of this
feature on the Hywind Scotland installation In case of absence this risk assessment has not to be repeated for
future Hywind installations
The risk is however evaluated as low in general Higher sound pressures can only be expected very close to
the sound source and the the probability of being close to the source of the transient sound is small for any
marine mammal The sound energy animals would be exposed to if staying in the are for a longer period is
also relatively low and does not pose a risk It can not be expected that animals stay for 24hours in the area
and even if they the received sound energy is below any threshold levels for injury Behavioural reactions can
be expected at relatively close distances to the wind turbines eg avoiding Though it is not expected that this
has negative impact on individuals or populations of marine mammals
Overall the risk for marine mammals originating from the transient sound is evaluated as non-existing
Due to the risk of formally exceeding some threshold levels for the transient sound it is recommended to do
sound measurements at newer Hywind installations eg in Scotland to find out if the new design of the
mooring creates similar sound or not
7 Appendix
JASCO 2011 Hywind Acoustic Measurement Report Jasco Report NO 00229
Xodus 2015 Technical Note on Underwater Noise A-100142-S20-TECH-001
NOAA (2018) 2018 Revision to Technical Guidance for Assessing the Effects of Anthropogenic Sound on
Marine Mammal Hearing (Version 2) httpswwwfisheriesnoaagovnationalmarine-mammal-
protectionmarine-mammal-acoustic-technical-guidance
Tollefsen Christina D S (2013) Reccomendations for calculatintg sound speed profiles from field data
Defence RampD Canada Atlantic Technical1048577Memorandum DRDC Atlantic TM 2013-156
Ballard MS and Lee Kevin M2017 The Acoustics of Marine Sediments Acoustics Today volume 13 issue 3
Fall 2017
Related Documents