Permeability evolution due to dissolution and precipitation of carbonates using reactive transport modeling in pore networks Juan P. Nogues, 1 Jeffrey P. Fitts, 2 Michael A. Celia, 2 and Catherine A. Peters 2 Received 25 January 2013 ; revised 5 August 2013 ; accepted 13 August 2013 ; published 23 September 2013. [1] A reactive transport model was developed to simulate reaction of carbonates within a pore network for the high-pressure CO 2 -acidified conditions relevant to geological carbon sequestration. The pore network was based on a synthetic oolithic dolostone. Simulation results produced insights that can inform continuum-scale models regarding reaction- induced changes in permeability and porosity. As expected, permeability increased extensively with dissolution caused by high concentrations of carbonic acid, but neither pH nor calcite saturation state alone was a good predictor of the effects, as may sometimes be the case. Complex temporal evolutions of interstitial brine chemistry and network structure led to the counterintuitive finding that a far-from-equilibrium solution produced less permeability change than a nearer-to-equilibrium solution at the same pH. This was explained by the pH buffering that increased carbonate ion concentration and inhibited further reaction. Simulations of different flow conditions produced a nonunique set of permeability-porosity relationships. Diffusive-dominated systems caused dissolution to be localized near the inlet, leading to substantial porosity change but relatively small permeability change. For the same extent of porosity change caused from advective transport, the domain changed uniformly, leading to a large permeability change. Regarding precipitation, permeability changes happen much slower compared to dissolution-induced changes and small amounts of precipitation, even if located only near the inlet, can lead to large changes in permeability. Exponent values for a power law that relates changes in permeability and porosity ranged from 2 to 10, but a value of 6 held constant when conditions led to uniform changes throughout the domain. Citation : Nogues, J. P., J. P. Fitts, M. A. Celia, and C. A. Peters (2013), Permeability evolution due to dissolution and precipitation of carbonates using reactive transport modeling in pore networks, Water Resour. Res., 49, 6006–6021, doi:10.1002/wrcr.20486. 1. Introduction [2] Over the last decade, numerous studies have been undertaken to understand the physics that govern the trans- port of supercritical CO 2 in the subsurface and its subse- quent trapping or leakage in the context of geological carbon sequestration [Bachu and Adams, 2003; Birkholzer et al., 2009 ; Brosse et al., 2010; Burton et al., 2008; Celia et al., 2011; Doughty and Pruess, 2004; Grimstad et al., 2009; Nogues et al., 2012; Pawar et al., 2009; Pruess et al., 2003]. All of these studies have considered static ma- terial properties, such as permeability and porosity, for geo- logic formations and leakage pathways. The evolution of permeability and porosity due to geochemical reactions has yet to be considered in models that consider leakage risks. To do so, transport models must incorporate methods for predicting dynamic material properties either by numeri- cally upscaling constitutive relationships, developing sim- plified empirical rules or by using multiscale/multiphysics methods (as the one developed by Flemisch et al. [2011]). All of these methods would require an understanding of the reactions that can substantially alter the rock matrix, and the different ways the rock matrix evolves under different conditions. [3] The relevant geochemical reactions that can substan- tially alter the rock matrix are those between CO 2 -acidified brines and carbonate minerals because these reactions are sufficiently fast and potentially lead to changes in the per- meability and porosity in short time scales [Assayag et al., 2009; Ellis et al., 2013, 2011; Luquot and Gouze, 2009; Noiriel et al., 2004; Noiriel et al., 2005; Smith et al., 2012]. In a geological sequestration operation, carbon diox- ide dissolves into the resident brine forming carbonic acid. The resulting thermodynamic state of disequilibrium drives dissolution of the mineral matrix. This then has the effect of releasing cations, such as Ca 2þ , Mg 2þ , or Fe 3þ from the mineral matrix, which may buffer the acid to some extent. When these reactions occur in caprock sealing formations that overlay CO 2 injection formations, permeability and po- rosity changes may jeopardize the trapping mechanisms 1 Now at Facultad Politecnica, Universidad Nacional de Asunci on, Paraguay. 2 Department of Civil and Environmental Engineering, Princeton University, Princeton, New Jersey, USA. Corresponding author: C. A. Peters, Department of Civil and Environ- mental Engineering, Princeton University, Olden Street, E-Quad, Prince- ton, NJ 08544, USA. ([email protected]) ©2013. American Geophysical Union. All Rights Reserved. 0043-1397/13/10.1002/wrcr.20486 6006 WATER RESOURCES RESEARCH, VOL. 49, 6006–6021, doi :10.1002/wrcr.20486, 2013

Welcome message from author
This document is posted to help you gain knowledge. Please leave a comment to let me know what you think about it! Share it to your friends and learn new things together.
Transcript
Permeability evolution due to dissolution and precipitation ofcarbonates using reactive transport modeling in pore networks
Juan P. Nogues,1 Jeffrey P. Fitts,2 Michael A. Celia,2 and Catherine A. Peters2
Received 25 January 2013; revised 5 August 2013; accepted 13 August 2013; published 23 September 2013.
[1] A reactive transport model was developed to simulate reaction of carbonates within apore network for the high-pressure CO2-acidified conditions relevant to geological carbonsequestration. The pore network was based on a synthetic oolithic dolostone. Simulationresults produced insights that can inform continuum-scale models regarding reaction-induced changes in permeability and porosity. As expected, permeability increasedextensively with dissolution caused by high concentrations of carbonic acid, but neither pHnor calcite saturation state alone was a good predictor of the effects, as may sometimes bethe case. Complex temporal evolutions of interstitial brine chemistry and network structureled to the counterintuitive finding that a far-from-equilibrium solution produced lesspermeability change than a nearer-to-equilibrium solution at the same pH. This wasexplained by the pH buffering that increased carbonate ion concentration and inhibitedfurther reaction. Simulations of different flow conditions produced a nonunique set ofpermeability-porosity relationships. Diffusive-dominated systems caused dissolution to belocalized near the inlet, leading to substantial porosity change but relatively smallpermeability change. For the same extent of porosity change caused from advectivetransport, the domain changed uniformly, leading to a large permeability change. Regardingprecipitation, permeability changes happen much slower compared to dissolution-inducedchanges and small amounts of precipitation, even if located only near the inlet, can lead tolarge changes in permeability. Exponent values for a power law that relates changes inpermeability and porosity ranged from 2 to 10, but a value of 6 held constant whenconditions led to uniform changes throughout the domain.
Citation: Nogues, J. P., J. P. Fitts, M. A. Celia, and C. A. Peters (2013), Permeability evolution due to dissolution and precipitation ofcarbonates using reactive transport modeling in pore networks, Water Resour. Res., 49, 6006–6021, doi:10.1002/wrcr.20486.
1. Introduction
[2] Over the last decade, numerous studies have beenundertaken to understand the physics that govern the trans-port of supercritical CO2 in the subsurface and its subse-quent trapping or leakage in the context of geologicalcarbon sequestration [Bachu and Adams, 2003; Birkholzeret al., 2009; Brosse et al., 2010; Burton et al., 2008; Celiaet al., 2011; Doughty and Pruess, 2004; Grimstad et al.,2009; Nogues et al., 2012; Pawar et al., 2009; Pruesset al., 2003]. All of these studies have considered static ma-terial properties, such as permeability and porosity, for geo-logic formations and leakage pathways. The evolution ofpermeability and porosity due to geochemical reactions hasyet to be considered in models that consider leakage risks.
To do so, transport models must incorporate methods forpredicting dynamic material properties either by numeri-cally upscaling constitutive relationships, developing sim-plified empirical rules or by using multiscale/multiphysicsmethods (as the one developed by Flemisch et al. [2011]).All of these methods would require an understanding of thereactions that can substantially alter the rock matrix, andthe different ways the rock matrix evolves under differentconditions.
[3] The relevant geochemical reactions that can substan-tially alter the rock matrix are those between CO2-acidifiedbrines and carbonate minerals because these reactions aresufficiently fast and potentially lead to changes in the per-meability and porosity in short time scales [Assayag et al.,2009; Ellis et al., 2013, 2011; Luquot and Gouze, 2009;Noiriel et al., 2004; Noiriel et al., 2005; Smith et al.,2012]. In a geological sequestration operation, carbon diox-ide dissolves into the resident brine forming carbonic acid.The resulting thermodynamic state of disequilibrium drivesdissolution of the mineral matrix. This then has the effectof releasing cations, such as Ca2þ, Mg2þ, or Fe3þ from themineral matrix, which may buffer the acid to some extent.When these reactions occur in caprock sealing formationsthat overlay CO2 injection formations, permeability and po-rosity changes may jeopardize the trapping mechanisms
1Now at Facultad Politecnica, Universidad Nacional de Asunci�on,Paraguay.
2Department of Civil and Environmental Engineering, PrincetonUniversity, Princeton, New Jersey, USA.
Corresponding author: C. A. Peters, Department of Civil and Environ-mental Engineering, Princeton University, Olden Street, E-Quad, Prince-ton, NJ 08544, USA. ([email protected])
©2013. American Geophysical Union. All Rights Reserved.0043-1397/13/10.1002/wrcr.20486
6006
WATER RESOURCES RESEARCH, VOL. 49, 6006–6021, doi:10.1002/wrcr.20486, 2013
considered for reliable CO2 storage. Conversely, there arescenarios in which mixing of fluids creates thermodynamicdisequilibrium that drives precipitation of carbonate miner-als, thereby reducing porosity [Emmanuel and Berkowitz,2005; Xu et al., 2005; Zhang et al., 2010].
[4] Several modeling studies have examined the role ofgeochemical reactions and their effects on permeability andporosity within the context of geological carbon sequestra-tion. For instance, Gherardi et al. [2007] simulated changesin porosity in carbonate-rich shales due to the geochemicalreactions between calcium-rich waters and resident brine,using the TOUGH-REACT simulator [Xu et al., 2006].Through numerical experiments, they found conditions thatcaused the porosity at the boundary between formationrock and caprock to decrease from 15% to 0% porosity dueto precipitation of calcite. Andre et al. [2007] used theTOUGH-REACT simulator as well, to study CO2 storagein the carbonate-rich Dogger aquifer in the Paris Basin,France. They saw that when CO2-saturated water wasinjected, the porosity near the injection well increased sig-nificantly due to dissolution of the porous material. Finally,Liu et al. [2011] used TOUGH-REACT to model CO2
injection in the Mt. Simon sandstone formation, USA. LikeAndre et al. [2007], they saw a dissolution front caused bythe acidified brine. In general, most of these studies haveshown that the geochemical reactions between CO2-richbrines and carbonate rocks have effects on the permeabilityand porosity due to the dissolution or precipitation of car-bonate minerals.
[5] All of the reactive transport models used in the previ-ous studies described the interplay of geochemical reac-tions and transport at the continuum or Darcy scale.Permeability is a continuum-scale property that manifestsfrom the collective conductivities of flow between manypores, and thus is sensitive to reaction-induced alterationsat the pore scale. Furthermore, it can be argued that geo-chemical reactions are best described at the pore scalebecause they are driven by small-scale chemical gradientsand because heterogeneities in porous rocks create variabil-ity in local chemical conditions [Kim et al., 2011; Li et al.,2006; Steefel et al., 2005]. Reactive-transport modeling inpore networks is an approach in which geochemical reac-tions and transport of species is modeled at the pore scaleenabling simulation of the effects of the small-scale hetero-geneities, and simulation of permeability and porosity forthe entire domain.
[6] At the pore scale, relevant studies have found that (i)dissolution and precipitation of carbonate minerals canoccur simultaneously [Kang et al., 2010]; (ii) at the scaleof a single pore the reduction in flow area is proportional tothe reactive and convective processes [Li et al., 2010]; and(iii) mixing of disparate waters can lead to precipitationand reduction in porosity [Tartakovsky et al., 2007]. Szymc-zak and Ladd [2009] performed pore-scale simulations in2-D and showed that the creation and evolution of worm-holes had a close dependence on the relationships betweenreaction and flow rates. None of these pore-scale studieslinked the changes in mineral volume fraction (or porosity)to changes in permeability. Moreover, their results mainlyfocused on regular or periodic networks in one or twodimensions or systems, where pore-to-pore heterogeneitywas not taken into consideration. Algive et al. [2012]
developed a methodology to use a reactive pore networkmodel to extract upscaling factors to tie the pore-scaleeffects of reactive transport to the core-scale values of per-meability and porosity. Their work simplified the geochem-istry and transport by incorporating most geochemicaldynamics and transport into dimensionless variables, and indoing so prevented a full description of the different physi-cal and chemical parameters. Mehmani et al. [2012] devel-oped a novel approach that coupled several pore-scalemodels using mortar coupling domain decomposition tostudy the evolution of precipitation-induced cementation ofcalcite. They were able to study large changes in perme-ability and porosity by coupling of 64 pore-scale models(1 mm � 1 mm � 1 mm each) but with a limited descrip-tion of the chemistry represented by two main parameters,the Damkohler number (Da) and an ‘‘alpha’’ parameterwhich described the deviation from equilibrium of the pre-cipitation reaction. Mehmani et al. [2012] showed that alow Da and ‘‘alpha’’ number created precipitation at theinlet of the network and that a high Da and ‘‘alpha’’ combi-nation created more uniform precipitation. More recently,the work by Yoon et al. [2013] was able to simulate CaCO3
precipitation due to transverse mixing in a 2-D microfluidicpore network. They captured the essential physiochemicaldynamics of precipitation that was characterized by a fastinitial precipitation rate that leveled off as the mixing washindered.
[7] In this study, we present a new reactive transportmodel that simulates carbonic acid-driven reactions in a3-D network of pores in order to predict the changes in per-meability and porosity at the continuum scale. Through aseries of simulations, the main questions that are addressedare: (1) How do the degree of acidity and the calcite satura-tion state, controlled by the amount of CO2 and calcium ininflowing waters, affect the changes in permeability andporosity? (2) What are the effects, on the network perme-ability and porosity, of different flow conditions (i.e., pres-sure gradients)? (3) How do different patterns of mixingreactive boundary waters promote precipitation and reduc-tion in permeability and porosity? and (4) How do singleparameter power law equations perform when predictingthe evolution of permeability due to porosity changes?Ultimately, these four questions help tackle the more gen-eral question of what are the most plausible changes thatcan occur in a CO2 sequestration operation.
[8] The pore network used in this study was developedwith the aid of the algorithm proposed by Raoof and Has-sanizadeh [2010]. The pore network structure was based ona statistical characterization of a synthetic microcomputed-tomography (�-CT) image of an oolithic dolostone fromBiswal et al. [2009]. To focus on the effects of physical het-erogeneity, i.e., pore volumes and pore throats, the networkwas spatially uniform with respect to mineralology. The re-active transport model developed for this work accounts forreactions of acidic fluids with both carbonates and alumino-silicates. The model predicts evolution of pore sizes andpore-to-pore conductivities. In this paper, we presentnumerous simulation results focused on the permeability-altering effects of different chemical, flow and mixing con-ditions. The findings are examined in the context ofsubcontinuum-scale variations in geochemical conditionsand reaction rates.
NOGUES ET AL.: PERMEABILITY EVOLUTION DUE TO REACTION OF CARBONATES
6007
2. Pore Network Creation
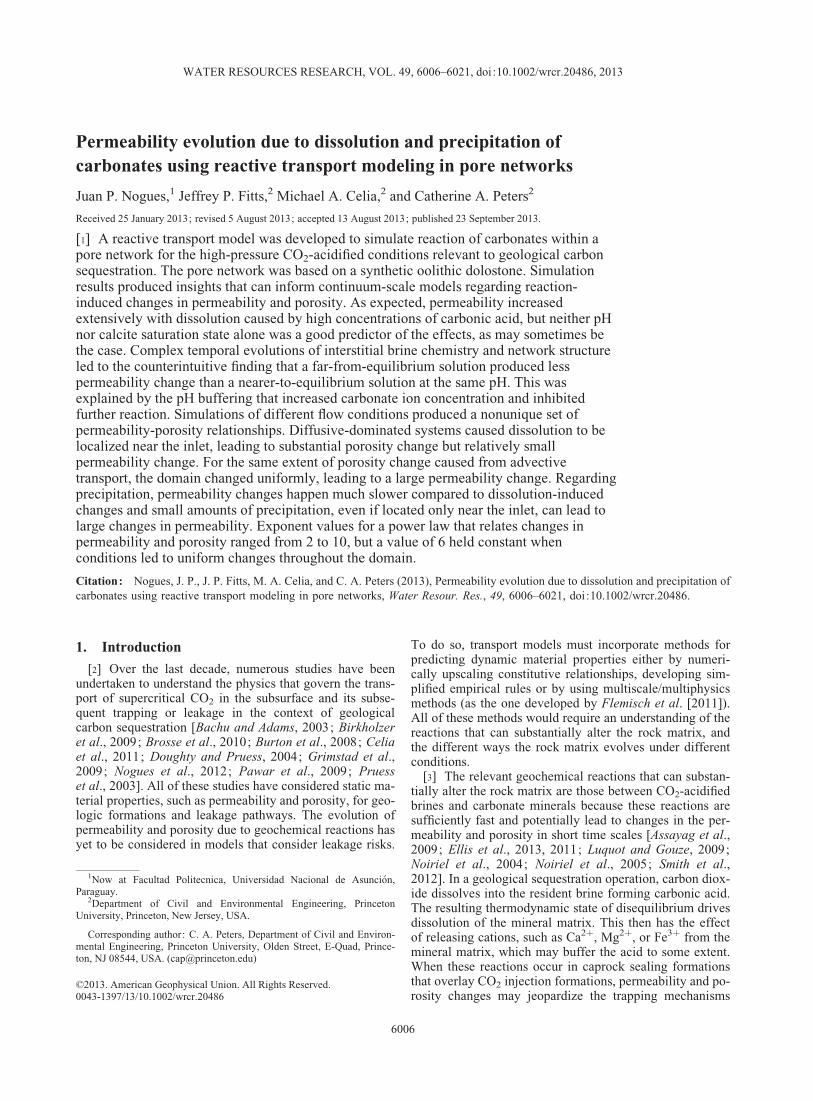
[9] The random pore network used in this study relies onthe algorithm presented by Raoof and Hassanizadeh [2010]where each pore body can have a maximum of 26 connec-tions along 13 different directions within a regular cubiclattice. To accurately represent a carbonate rock we usedstatistics derived from a synthetic 3-D m-CT image of adolomitized oolithic grainstone (Figure 1a) developed byBiswal et al. [2009], which follows a stochastic geometrymodel known as a germ-grain model [see Biswal et al.,2007]. The statistics were extracted using the 3DMA-Rocksoftware package [Lindquist et al., 1996; Shin et al., 2005].The statistical distributions of pore volumes, pore-to-poreconnections, pore surface areas, and pore center coordi-nates are shown in Figure 1. The extracted network con-sisted of 20,128 pores with an average coordinationnumber of 5, and an average pore volume size of 4.0 �10�13 m3. The coordination number refers to the number ofconnection a pore has, for instance, a coordination numberof 4 means that a pore is connected to four other pores.
[10] For this study, a smaller network was created inorder to have a faster computational model. The network isa cube that is 1.87 mm in length on each axis and is com-posed of 1728 pores. The porosity (�) is defined as,
� ¼
XiVi
VTð1Þ
where Vi (L3) corresponds to the volume of pore i and VT
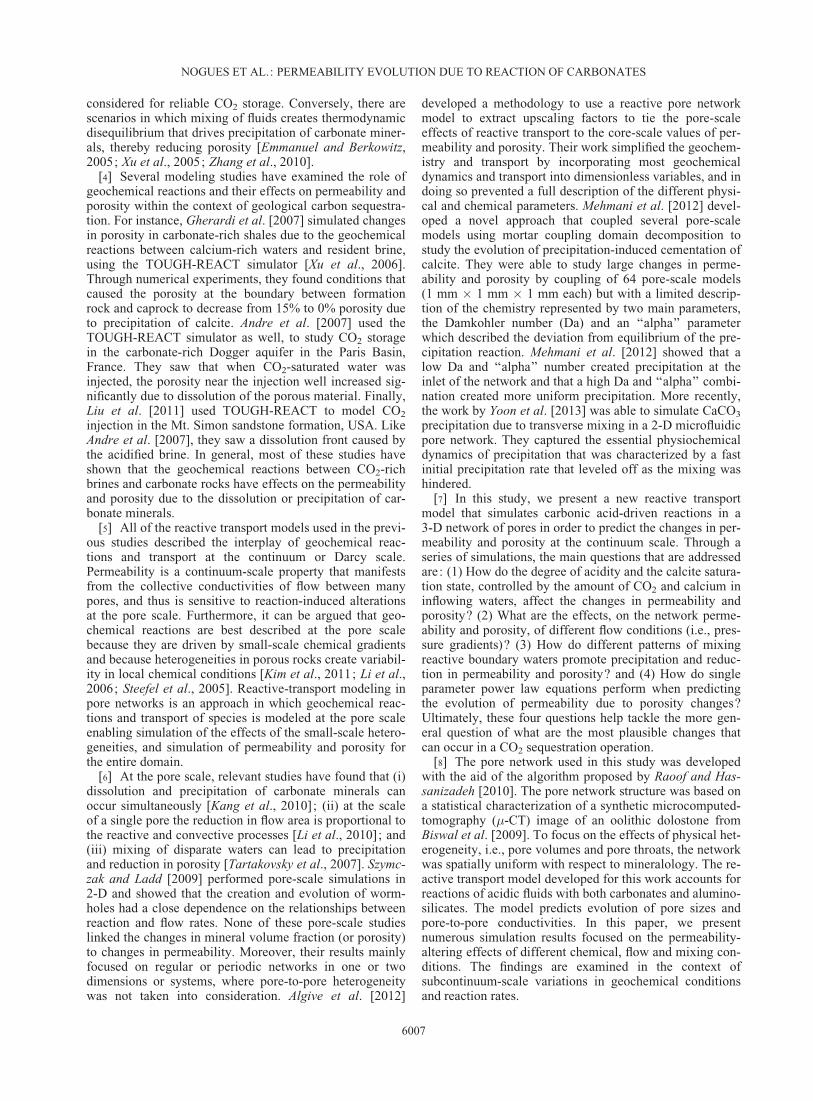
(L3) is the constant network volume. Table 1 outlines theproperties of the network. A representation of the networkin a stick-and-ball format is shown in Figure 2, along withhistograms of pore volumes and coordination numbers. Thepore volume histogram in Figure 2b matches with the origi-nal pore volume histogram from the 3-D synthetic m-CTimage (Figure 1d). For our model, we chose to have more
tortuosity in the network, therefore the coordination num-ber distribution does not match exactly the ones from the 3-D synthetic m-CT image, though the values come from thesame population.
[11] For the model in this study, we have assumed thatall pore throats are cylindrical in shape and have a charac-teristic diameter, which is used to calculate the conductiv-ity across the pores. Moreover, these connecting throats areused only in the calculation of the conductivity value thatfeed into the pressure equation; they do not hold any vol-ume within the system. The conductivity, Cij (L4TM�1)between pores i and j is defined by the Hagen-Poisueilleequation [Sutera, 1993] for an incompressible fluid,
Cij ¼d4
ij�
128�lijð2Þ
where dij is the diameter (L) of the ‘‘effective’’ cylinderconnecting pores i and j ; lij is the distance (L) between thecentroids of adjacent pores; and � is the viscosity(MT�1L�1) of the flowing fluid. The initial pore-to-poreconductivities of the network were assigned using themethods developed by Li et al. [2006]. Conductivities weresampled from a lognormal distribution in which there iscorrelation with the total volume of adjacent pores. In this
Figure 1. Synthetic dolomitized oolithic grainstone from Biswal et al. [2009] and the correspondingstatistics derived using 3DMA-Rock: (a) Three-dimensional m-CT image, (b) histogram of pore coordi-nation numbers, (c) histogram of pore body surface areas, (d) histogram of pore body volumes, and (e)pore surface area versus pore volume.
Table 1. System Properties of the Pore Network Along with theMineral Abundances Within the Network
System Properties Mineral % by Volume
Initial porosity 0.133 Albite 5Initial permeability (m2) 8.16E-15 Anorthite 5Side of network cube (mm) 1.87 Calcite 10System volume (m3) 6.53E-09 Dolomite 60Total number of pores 1,728 Kaolinite 5
Quartz 15
NOGUES ET AL.: PERMEABILITY EVOLUTION DUE TO REACTION OF CARBONATES
6008
work, the geometric mean of Cij was chosen such that theintrinsic permeability of the system would be around 10�14
m2 (10 mD). The geometric standard deviation of Cij wasequal to unity.
[12] The solid matrix comprises of five reactive mineralsplus quartz in the relative amounts shown in Table 1. Thecarbonate minerals that dominate carbonate formations arecalcite and dolomite [Al-Jaroudi et al., 2007; Mukherji andYoung, 1973; Stehli and Hower, 1961]. A dolostone is inits majority dolomite (50–90%), with 3–10% clays [Usen-mez et al., 1988]. For this study, the mineralogy assigned tothe entire network was distributed uniformly. Each pore inthe system was allotted mineral volumes according to therelative amounts in Table 1.
[13] In the work of Peters [2009], it was shown that thesurface area coverage by authigenic clay minerals in con-solidated grainstones can be substantially larger than therelative abundance of these clay minerals on a volume ba-sis. For this work, we selected surface area allocations thatare consistent with those trends. We allotted 50% of thesurface area to kaolinite, while dolomite received 10% andboth anorthite and albite received 5% of the surface areaeach. Since calcite is considered to be at equilibrium, sur-face area was not needed to calculate reaction rate.
3. Reactive Transport Modeling
[14] The reactive transport model developed for thiswork has as its main purpose the modeling of permeabilityand porosity evolution due to carbonic acid-driven precipi-tation and dissolutions in a pore network system. Themodel development follows methods previously presented[Li et al., 2006; Kim et al., 2011]; this work is distinct inthe focus on carbonates, which are present in large amountsand which are relatively highly reactive, and with the addedcapability to account for changes to the pore volumesinduced by precipitation and dissolution of mineral phases.
The reactive transport architecture follows that of theSTOMP ECKEChem model [White and McGrail, 2005]and proposed by Fang et al. [2003]. The two processes oftransport and geochemical reaction/speciation are separatedand solved sequentially in a noniterative manner, a methodpresented by Steefel and MacQuarrie [1996] under thename of Sequential Non-Iterative Approach (SNIA). A sen-sitivity analysis was done to choose the adequate time stepof the model and justify the sequential approach—the timestep was fixed at a value at which the system porosity andpermeability evolution did not change significantly fromprevious time steps. The model first solves the pressureequation, which provides the pore-to-pore fluid flow veloc-ities, under the assumption of an incompressible andconstant-density fluid. Then, the solute transport equationsare solved for the selected basis components. After the newcomponent concentrations are determined, a geochemicalbatch reactor module is applied to each pore element.Finally, the model accounts for the changes in volume andpore-to-pore conductivity due to precipitation or dissolu-tion of minerals. The model processes involved are outlinedbelow, with details given in Nogues [2012].
3.1. Reactive Species
[15] The model considers a total of 18 aqueous speciesand 5 mineral species. Through the Tableau method the ba-sis components were determined to be the total carbonate-bearing species, CT, the total calcium-bearing species,CaT, the total magnesium-bearing species, MgT, the totalsilica-bearing species, SiT, the total aluminum-bearing spe-cies, AlT, the total chloride-bearing species, ClT, and thetotal sodium-bearing species, NaT. In our model, wereplace the total aqueous protons concentration, HT, by thecharge balance equation in order to reduce the number ofequations we solve when considering transport. In additionto the eight mole and charge balance equations, there were
Figure 2. (a) Ball and stick representation of the network with a cross-sectional slice of the pore-to-pore connectivity, (b) histogram of network pore volumes, and (c) histogram of network coordinationnumbers.
NOGUES ET AL.: PERMEABILITY EVOLUTION DUE TO REACTION OF CARBONATES
6009
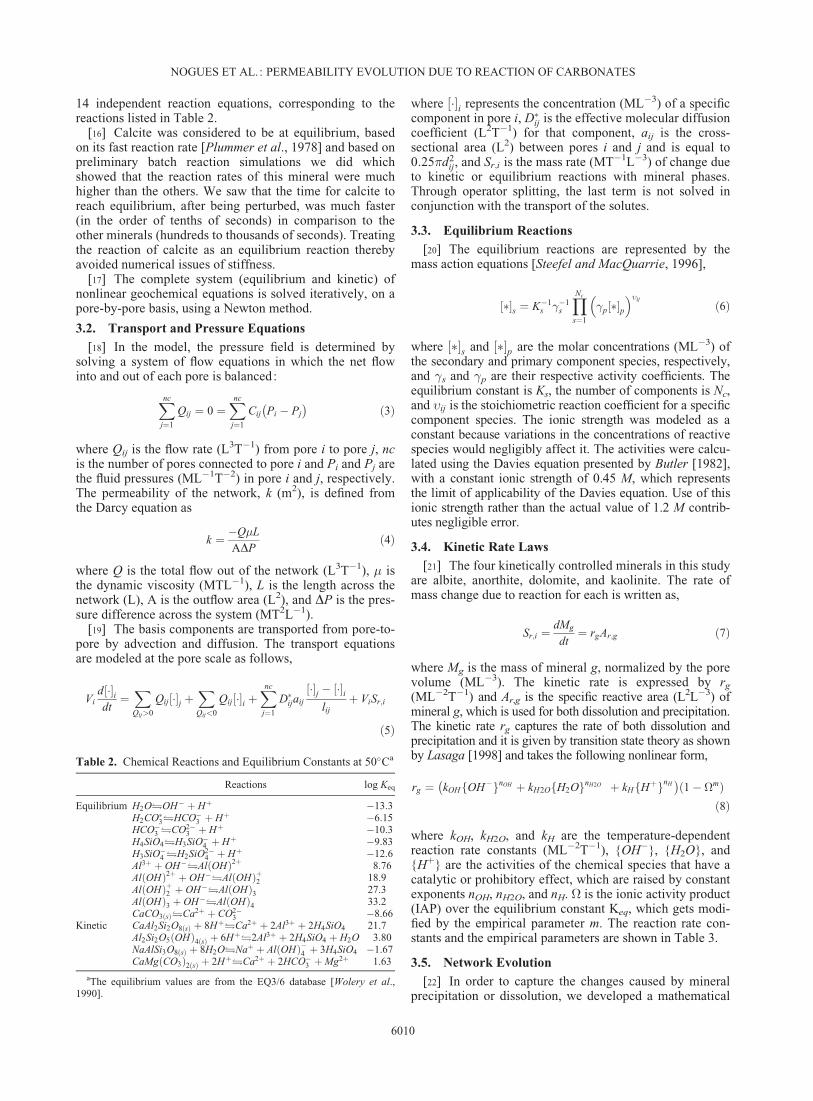
14 independent reaction equations, corresponding to thereactions listed in Table 2.
[16] Calcite was considered to be at equilibrium, basedon its fast reaction rate [Plummer et al., 1978] and based onpreliminary batch reaction simulations we did whichshowed that the reaction rates of this mineral were muchhigher than the others. We saw that the time for calcite toreach equilibrium, after being perturbed, was much faster(in the order of tenths of seconds) in comparison to theother minerals (hundreds to thousands of seconds). Treatingthe reaction of calcite as an equilibrium reaction therebyavoided numerical issues of stiffness.
[17] The complete system (equilibrium and kinetic) ofnonlinear geochemical equations is solved iteratively, on apore-by-pore basis, using a Newton method.
3.2. Transport and Pressure Equations
[18] In the model, the pressure field is determined bysolving a system of flow equations in which the net flowinto and out of each pore is balanced:
Xnc
j¼1
Qij ¼ 0 ¼Xnc
j¼1
Cij Pi � Pj
� �ð3Þ
where Qij is the flow rate (L3T�1) from pore i to pore j, ncis the number of pores connected to pore i and Pi and Pj arethe fluid pressures (ML�1T�2) in pore i and j, respectively.The permeability of the network, k (m2), is defined fromthe Darcy equation as
k ¼ �Q�L
ADPð4Þ
where Q is the total flow out of the network (L3T�1), � isthe dynamic viscosity (MTL�1), L is the length across thenetwork (L), A is the outflow area (L2), and DP is the pres-sure difference across the system (MT2L�1).
[19] The basis components are transported from pore-to-pore by advection and diffusion. The transport equationsare modeled at the pore scale as follows,
Vid �½ �idt¼XQij>0
Qij �½ �j þXQij<0
Qij �½ �i þXnc
j¼1
D�ijaij
�½ �j � �½ �ilij
þ ViSr;i
ð5Þ
where �½ �i represents the concentration (ML�3) of a specificcomponent in pore i, D�ij is the effective molecular diffusioncoefficient (L2T�1) for that component, aij is the cross-sectional area (L2) between pores i and j and is equal to0:25�d2
ij, and Sr;i is the mass rate (MT�1L�3) of change dueto kinetic or equilibrium reactions with mineral phases.Through operator splitting, the last term is not solved inconjunction with the transport of the solutes.
3.3. Equilibrium Reactions
[20] The equilibrium reactions are represented by themass action equations [Steefel and MacQuarrie, 1996],
�½ �s ¼ K�1s ��1
s
YNc
s¼1
�p �½ �p� ��ij
ð6Þ
where �½ �s and �½ �p are the molar concentrations (ML�3) ofthe secondary and primary component species, respectively,and �s and �p are their respective activity coefficients. Theequilibrium constant is Ks, the number of components is Nc,and �ij is the stoichiometric reaction coefficient for a specificcomponent species. The ionic strength was modeled as aconstant because variations in the concentrations of reactivespecies would negligibly affect it. The activities were calcu-lated using the Davies equation presented by Butler [1982],with a constant ionic strength of 0.45 M, which representsthe limit of applicability of the Davies equation. Use of thisionic strength rather than the actual value of 1.2 M contrib-utes negligible error.
3.4. Kinetic Rate Laws
[21] The four kinetically controlled minerals in this studyare albite, anorthite, dolomite, and kaolinite. The rate ofmass change due to reaction for each is written as,
Sr;i ¼dMg
dt¼ rgAr;g ð7Þ
where Mg is the mass of mineral g, normalized by the porevolume (ML�3). The kinetic rate is expressed by rg
(ML�2T�1) and Ar,g is the specific reactive area (L2L�3) ofmineral g, which is used for both dissolution and precipitation.The kinetic rate rg captures the rate of both dissolution andprecipitation and it is given by transition state theory as shownby Lasaga [1998] and takes the following nonlinear form,
rg ¼ kOH OH�f gnOH þ kH2O H2Of gnH2O þ kH Hþf gnH� �
1� �mð Þð8Þ
where kOH, kH2O, and kH are the temperature-dependentreaction rate constants (ML�2T�1), {OH�}, {H2O}, and{Hþ} are the activities of the chemical species that have acatalytic or prohibitory effect, which are raised by constantexponents nOH, nH2O, and nH. � is the ionic activity product(IAP) over the equilibrium constant Keq, which gets modi-fied by the empirical parameter m. The reaction rate con-stants and the empirical parameters are shown in Table 3.
3.5. Network Evolution
[22] In order to capture the changes caused by mineralprecipitation or dissolution, we developed a mathematical
Table 2. Chemical Reactions and Equilibrium Constants at 50�Ca
Reactions log Keq
Equilibrium H2O�OH� þ Hþ �13.3H2CO�3�HCO�3 þ Hþ �6.15HCO�3�CO2�
3 þ Hþ �10.3H4SiO4�H3SiO�4 þ Hþ �9.83H3SiO�4�H2SiO2�
4 þ Hþ �12.6Al3þ þ OH��Al OHð Þ2þ 8.76Al OHð Þ2þ þ OH��Al OHð Þþ2 18.9Al OHð Þþ2 þ OH��Al OHð Þ3 27.3Al OHð Þ3 þ OH��Al OHð Þ4 33.2CaCO3 sð Þ�Ca2þ þ CO2�
3 �8.66Kinetic CaAl2Si2O8 sð Þ þ 8Hþ�Ca2þ þ 2Al3þ þ 2H4SiO4 21.7
Al2Si2O5 OHð Þ4 sð Þ þ 6Hþ�2Al3þ þ 2H4SiO4 þ H2O 3.80NaAlSi3O8 sð Þ þ 8H2O�Naþ þ Al OHð Þ�4 þ 3H4SiO4 �1.67CaMg CO3ð Þ2 sð Þ þ 2Hþ�Ca2þ þ 2HCO�3 þMg2þ 1.63
aThe equilibrium values are from the EQ3/6 database [Wolery et al.,1990].
NOGUES ET AL.: PERMEABILITY EVOLUTION DUE TO REACTION OF CARBONATES
6010
construct to modify the pore-to-pore conductivities byrelating these changes to changes in pore volumes. Themathematical construct was chosen following the concep-tual understanding that pore throat diameters are likelyrelated to the volumes of the connected pores. For a givenpore, as its pore volume is reduced or increased, each porethroat diameter associated with that pore body is updatedusing the following equation,
dnewij ¼ dprior
ij þ dpriorij
V newi � V prior
i
V priori
þV new
j � V priorj
V priorj
" #ð9Þ
where dnewij and dprior
ij are the new and prior throat diameter(L) connecting pore i and j, respectively. Equation (9) isconsistent with the original method of assigning conductiv-ities, which was based on the assumption that there is a cor-relation between the pore body volumes and the size of thethroats connecting them. Limit constraints are in place toprevent precipitated mineral to occupy more space than theoriginal pore volume, and flow in the pore is preventedonce 99% of the pore volume has been filled.
[23] The fraction of the pore surface area assigned toeach mineral is scaled down or up as minerals dissolve orprecipitate. If a mineral does not exist but it is thermody-namically favored to precipitate, the model assigns a mini-mal fraction of the surface area to it. The evolution of thefraction of surface area follows an equation similar to equa-tion (9) in which the fraction is scaled by the relative min-eral volume in that specific pore.
[24] It is important to note that the while the surface areafractions assigned to different minerals do change, themodel does not change the total surface area. The choice tomodel the total surface area as unchanged is one of conven-ience. This modeling choice has negligible impact on thesimulation results because the reaction rate of the most im-portant reactive mineral, calcite, is independent of surfacearea because it is modeled as being at equilibrium.
4. Simulation Methods
[25] In all the simulations, flow was driven in the x direc-tion (Figure 2a) by imposing pressure boundary conditionsat the boundaries, with no-flow conditions on the other fourboundaries. In order to prevent boundary effects to affectthe evolution of the pore network, diffusion of ions fromthe outlet boundary into the domain was prohibited. In
order to have comparable systems each simulation was runfor 10,000 injected pore volumes through the entire net-work—effectively removing the dependency of time in theanalysis. In all the simulations, the initial condition chosenfor the chemical composition of the resident brine wasclose to equilibrium with respect to calcite and dolomite(Table 4).
4.1. Changes in Permeability and Porosity Due toDifferent CaT and CT Concentrations
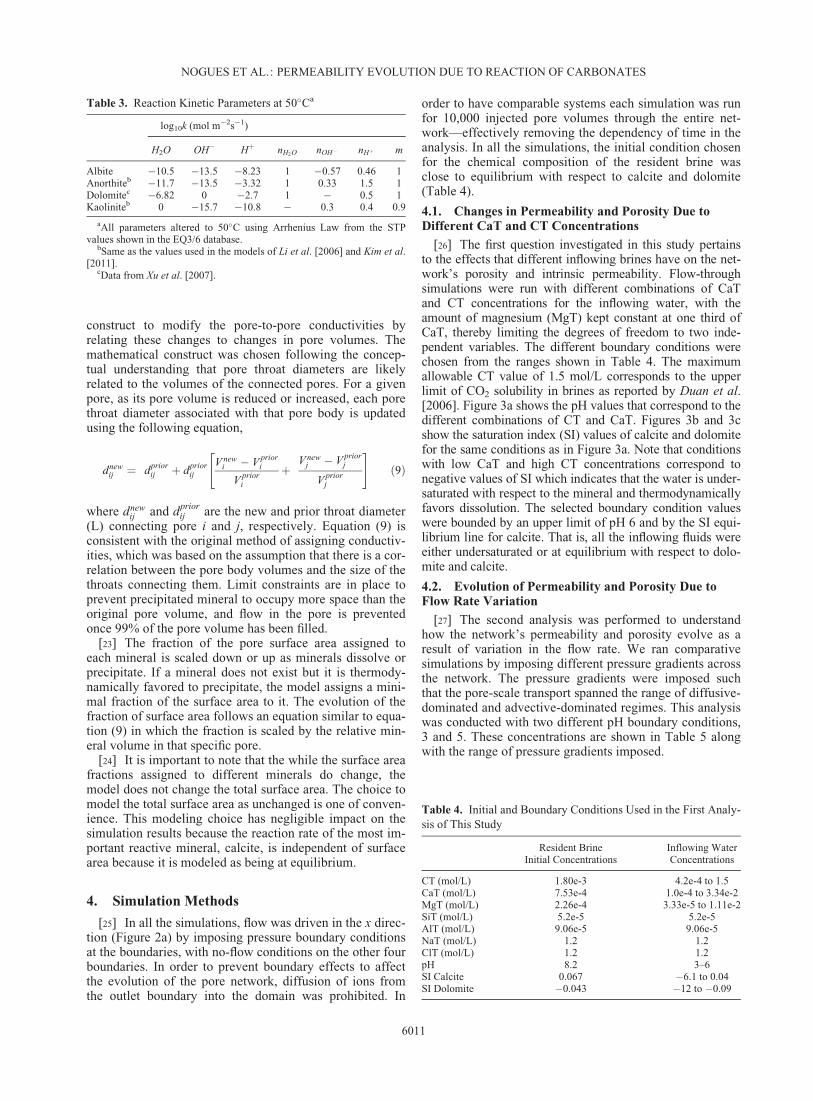
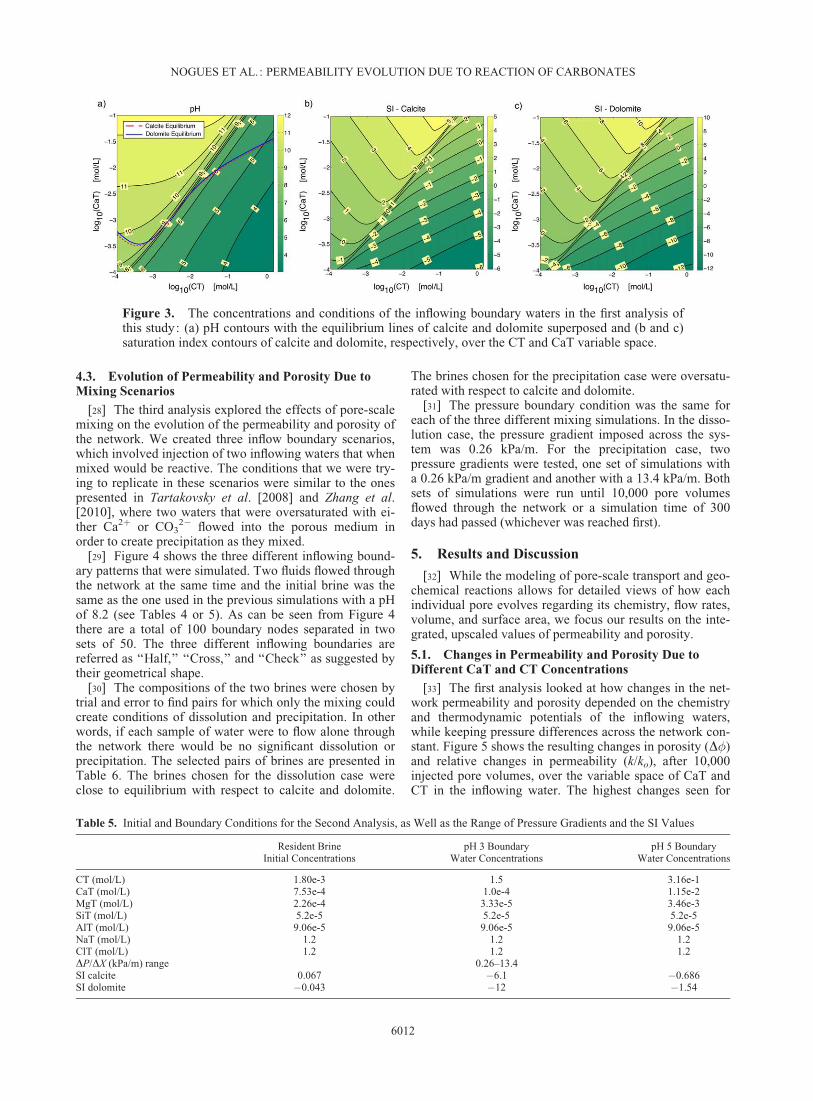
[26] The first question investigated in this study pertainsto the effects that different inflowing brines have on the net-work’s porosity and intrinsic permeability. Flow-throughsimulations were run with different combinations of CaTand CT concentrations for the inflowing water, with theamount of magnesium (MgT) kept constant at one third ofCaT, thereby limiting the degrees of freedom to two inde-pendent variables. The different boundary conditions werechosen from the ranges shown in Table 4. The maximumallowable CT value of 1.5 mol/L corresponds to the upperlimit of CO2 solubility in brines as reported by Duan et al.[2006]. Figure 3a shows the pH values that correspond to thedifferent combinations of CT and CaT. Figures 3b and 3cshow the saturation index (SI) values of calcite and dolomitefor the same conditions as in Figure 3a. Note that conditionswith low CaT and high CT concentrations correspond tonegative values of SI which indicates that the water is under-saturated with respect to the mineral and thermodynamicallyfavors dissolution. The selected boundary condition valueswere bounded by an upper limit of pH 6 and by the SI equi-librium line for calcite. That is, all the inflowing fluids wereeither undersaturated or at equilibrium with respect to dolo-mite and calcite.
4.2. Evolution of Permeability and Porosity Due toFlow Rate Variation
[27] The second analysis was performed to understandhow the network’s permeability and porosity evolve as aresult of variation in the flow rate. We ran comparativesimulations by imposing different pressure gradients acrossthe network. The pressure gradients were imposed suchthat the pore-scale transport spanned the range of diffusive-dominated and advective-dominated regimes. This analysiswas conducted with two different pH boundary conditions,3 and 5. These concentrations are shown in Table 5 alongwith the range of pressure gradients imposed.
Table 3. Reaction Kinetic Parameters at 50�Ca
log10k (mol m�2s�1)
H2O OH� Hþ nH2O nOH� nHþ m
Albite �10.5 �13.5 �8.23 1 �0.57 0.46 1Anorthiteb �11.7 �13.5 �3.32 1 0.33 1.5 1Dolomitec �6.82 0 �2.7 1 � 0.5 1Kaoliniteb 0 �15.7 �10.8 � 0.3 0.4 0.9
aAll parameters altered to 50�C using Arrhenius Law from the STPvalues shown in the EQ3/6 database.
bSame as the values used in the models of Li et al. [2006] and Kim et al.[2011].
cData from Xu et al. [2007].
Table 4. Initial and Boundary Conditions Used in the First Analy-sis of This Study
Resident BrineInitial Concentrations
Inflowing WaterConcentrations
CT (mol/L) 1.80e-3 4.2e-4 to 1.5CaT (mol/L) 7.53e-4 1.0e-4 to 3.34e-2MgT (mol/L) 2.26e-4 3.33e-5 to 1.11e-2SiT (mol/L) 5.2e-5 5.2e-5AlT (mol/L) 9.06e-5 9.06e-5NaT (mol/L) 1.2 1.2ClT (mol/L) 1.2 1.2pH 8.2 3–6SI Calcite 0.067 �6.1 to 0.04SI Dolomite �0.043 �12 to �0.09
NOGUES ET AL.: PERMEABILITY EVOLUTION DUE TO REACTION OF CARBONATES
6011
4.3. Evolution of Permeability and Porosity Due toMixing Scenarios
[28] The third analysis explored the effects of pore-scalemixing on the evolution of the permeability and porosity ofthe network. We created three inflow boundary scenarios,which involved injection of two inflowing waters that whenmixed would be reactive. The conditions that we were try-ing to replicate in these scenarios were similar to the onespresented in Tartakovsky et al. [2008] and Zhang et al.[2010], where two waters that were oversaturated with ei-ther Ca2þ or CO3
2� flowed into the porous medium inorder to create precipitation as they mixed.
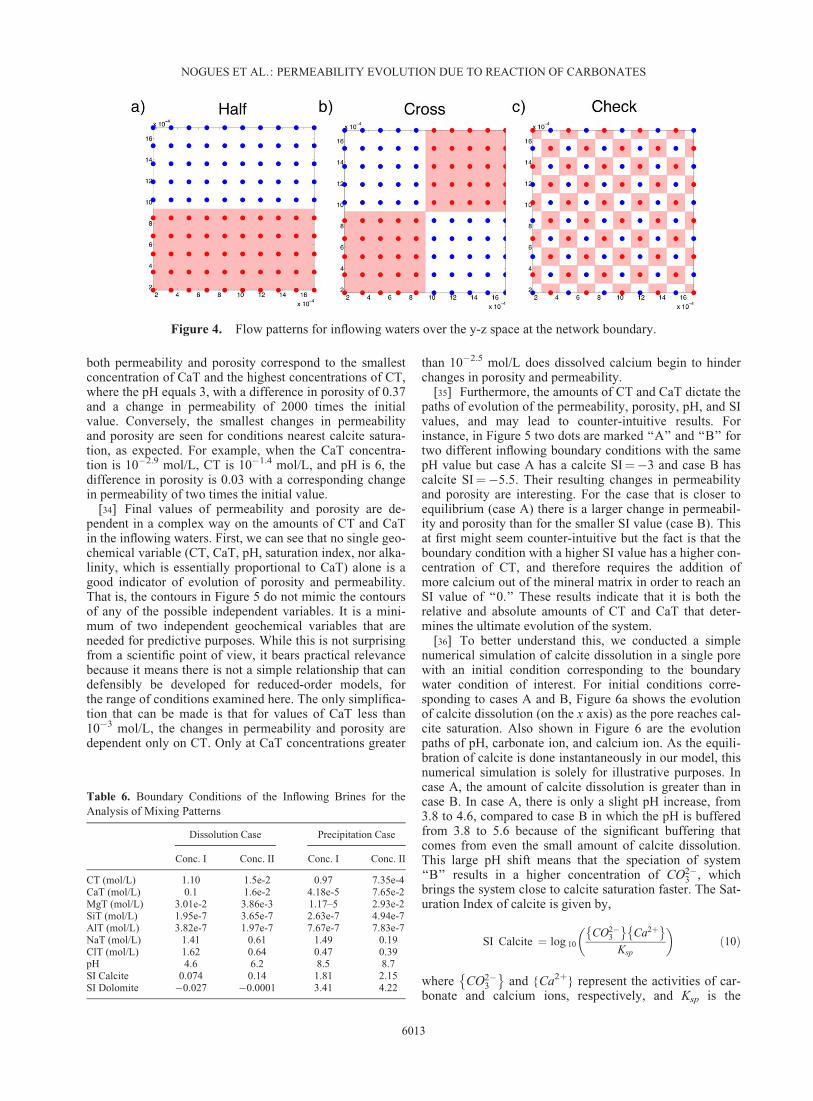
[29] Figure 4 shows the three different inflowing bound-ary patterns that were simulated. Two fluids flowed throughthe network at the same time and the initial brine was thesame as the one used in the previous simulations with a pHof 8.2 (see Tables 4 or 5). As can be seen from Figure 4there are a total of 100 boundary nodes separated in twosets of 50. The three different inflowing boundaries arereferred as ‘‘Half,’’ ‘‘Cross,’’ and ‘‘Check’’ as suggested bytheir geometrical shape.
[30] The compositions of the two brines were chosen bytrial and error to find pairs for which only the mixing couldcreate conditions of dissolution and precipitation. In otherwords, if each sample of water were to flow alone throughthe network there would be no significant dissolution orprecipitation. The selected pairs of brines are presented inTable 6. The brines chosen for the dissolution case wereclose to equilibrium with respect to calcite and dolomite.
The brines chosen for the precipitation case were oversatu-rated with respect to calcite and dolomite.
[31] The pressure boundary condition was the same foreach of the three different mixing simulations. In the disso-lution case, the pressure gradient imposed across the sys-tem was 0.26 kPa/m. For the precipitation case, twopressure gradients were tested, one set of simulations witha 0.26 kPa/m gradient and another with a 13.4 kPa/m. Bothsets of simulations were run until 10,000 pore volumesflowed through the network or a simulation time of 300days had passed (whichever was reached first).
5. Results and Discussion
[32] While the modeling of pore-scale transport and geo-chemical reactions allows for detailed views of how eachindividual pore evolves regarding its chemistry, flow rates,volume, and surface area, we focus our results on the inte-grated, upscaled values of permeability and porosity.
5.1. Changes in Permeability and Porosity Due toDifferent CaT and CT Concentrations
[33] The first analysis looked at how changes in the net-work permeability and porosity depended on the chemistryand thermodynamic potentials of the inflowing waters,while keeping pressure differences across the network con-stant. Figure 5 shows the resulting changes in porosity (D�)and relative changes in permeability (k/ko), after 10,000injected pore volumes, over the variable space of CaT andCT in the inflowing water. The highest changes seen for
Table 5. Initial and Boundary Conditions for the Second Analysis, as Well as the Range of Pressure Gradients and the SI Values
Resident BrineInitial Concentrations
pH 3 BoundaryWater Concentrations
pH 5 BoundaryWater Concentrations
CT (mol/L) 1.80e-3 1.5 3.16e-1CaT (mol/L) 7.53e-4 1.0e-4 1.15e-2MgT (mol/L) 2.26e-4 3.33e-5 3.46e-3SiT (mol/L) 5.2e-5 5.2e-5 5.2e-5AlT (mol/L) 9.06e-5 9.06e-5 9.06e-5NaT (mol/L) 1.2 1.2 1.2ClT (mol/L) 1.2 1.2 1.2DP/DX (kPa/m) range 0.26–13.4SI calcite 0.067 �6.1 �0.686SI dolomite �0.043 �12 �1.54
Figure 3. The concentrations and conditions of the inflowing boundary waters in the first analysis ofthis study: (a) pH contours with the equilibrium lines of calcite and dolomite superposed and (b and c)saturation index contours of calcite and dolomite, respectively, over the CT and CaT variable space.
NOGUES ET AL.: PERMEABILITY EVOLUTION DUE TO REACTION OF CARBONATES
6012
both permeability and porosity correspond to the smallestconcentration of CaT and the highest concentrations of CT,where the pH equals 3, with a difference in porosity of 0.37and a change in permeability of 2000 times the initialvalue. Conversely, the smallest changes in permeabilityand porosity are seen for conditions nearest calcite satura-tion, as expected. For example, when the CaT concentra-tion is 10�2.9 mol/L, CT is 10�1.4 mol/L, and pH is 6, thedifference in porosity is 0.03 with a corresponding changein permeability of two times the initial value.
[34] Final values of permeability and porosity are de-pendent in a complex way on the amounts of CT and CaTin the inflowing waters. First, we can see that no single geo-chemical variable (CT, CaT, pH, saturation index, nor alka-linity, which is essentially proportional to CaT) alone is agood indicator of evolution of porosity and permeability.That is, the contours in Figure 5 do not mimic the contoursof any of the possible independent variables. It is a mini-mum of two independent geochemical variables that areneeded for predictive purposes. While this is not surprisingfrom a scientific point of view, it bears practical relevancebecause it means there is not a simple relationship that candefensibly be developed for reduced-order models, forthe range of conditions examined here. The only simplifica-tion that can be made is that for values of CaT less than10�3 mol/L, the changes in permeability and porosity aredependent only on CT. Only at CaT concentrations greater
than 10�2.5 mol/L does dissolved calcium begin to hinderchanges in porosity and permeability.
[35] Furthermore, the amounts of CT and CaT dictate thepaths of evolution of the permeability, porosity, pH, and SIvalues, and may lead to counter-intuitive results. Forinstance, in Figure 5 two dots are marked ‘‘A’’ and ‘‘B’’ fortwo different inflowing boundary conditions with the samepH value but case A has a calcite SI¼�3 and case B hascalcite SI¼�5.5. Their resulting changes in permeabilityand porosity are interesting. For the case that is closer toequilibrium (case A) there is a larger change in permeabil-ity and porosity than for the smaller SI value (case B). Thisat first might seem counter-intuitive but the fact is that theboundary condition with a higher SI value has a higher con-centration of CT, and therefore requires the addition ofmore calcium out of the mineral matrix in order to reach anSI value of ‘‘0.’’ These results indicate that it is both therelative and absolute amounts of CT and CaT that deter-mines the ultimate evolution of the system.
[36] To better understand this, we conducted a simplenumerical simulation of calcite dissolution in a single porewith an initial condition corresponding to the boundarywater condition of interest. For initial conditions corre-sponding to cases A and B, Figure 6a shows the evolutionof calcite dissolution (on the x axis) as the pore reaches cal-cite saturation. Also shown in Figure 6 are the evolutionpaths of pH, carbonate ion, and calcium ion. As the equili-bration of calcite is done instantaneously in our model, thisnumerical simulation is solely for illustrative purposes. Incase A, the amount of calcite dissolution is greater than incase B. In case A, there is only a slight pH increase, from3.8 to 4.6, compared to case B in which the pH is bufferedfrom 3.8 to 5.6 because of the significant buffering thatcomes from even the small amount of calcite dissolution.This large pH shift means that the speciation of system‘‘B’’ results in a higher concentration of CO2�
3 , whichbrings the system close to calcite saturation faster. The Sat-uration Index of calcite is given by,
SI Calcite ¼ log 10CO2�
3
� �Ca2þ� �
Ksp
� ð10Þ
where CO2�3
� �and {Ca2þ} represent the activities of car-
bonate and calcium ions, respectively, and Ksp is the
Table 6. Boundary Conditions of the Inflowing Brines for theAnalysis of Mixing Patterns
Dissolution Case Precipitation Case
Conc. I Conc. II Conc. I Conc. II
CT (mol/L) 1.10 1.5e-2 0.97 7.35e-4CaT (mol/L) 0.1 1.6e-2 4.18e-5 7.65e-2MgT (mol/L) 3.01e-2 3.86e-3 1.17–5 2.93e-2SiT (mol/L) 1.95e-7 3.65e-7 2.63e-7 4.94e-7AlT (mol/L) 3.82e-7 1.97e-7 7.67e-7 7.83e-7NaT (mol/L) 1.41 0.61 1.49 0.19ClT (mol/L) 1.62 0.64 0.47 0.39pH 4.6 6.2 8.5 8.7SI Calcite 0.074 0.14 1.81 2.15SI Dolomite �0.027 �0.0001 3.41 4.22
Figure 4. Flow patterns for inflowing waters over the y-z space at the network boundary.
NOGUES ET AL.: PERMEABILITY EVOLUTION DUE TO REACTION OF CARBONATES
6013
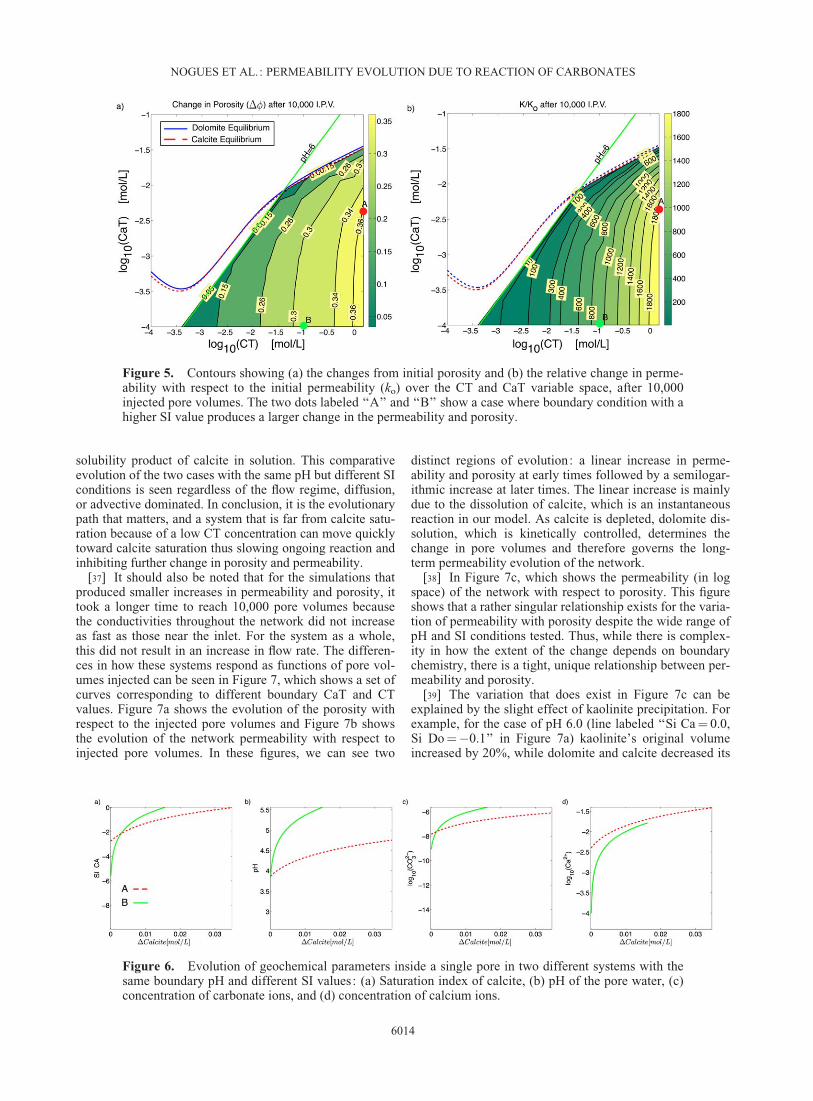
solubility product of calcite in solution. This comparativeevolution of the two cases with the same pH but different SIconditions is seen regardless of the flow regime, diffusion,or advective dominated. In conclusion, it is the evolutionarypath that matters, and a system that is far from calcite satu-ration because of a low CT concentration can move quicklytoward calcite saturation thus slowing ongoing reaction andinhibiting further change in porosity and permeability.
[37] It should also be noted that for the simulations thatproduced smaller increases in permeability and porosity, ittook a longer time to reach 10,000 pore volumes becausethe conductivities throughout the network did not increaseas fast as those near the inlet. For the system as a whole,this did not result in an increase in flow rate. The differen-ces in how these systems respond as functions of pore vol-umes injected can be seen in Figure 7, which shows a set ofcurves corresponding to different boundary CaT and CTvalues. Figure 7a shows the evolution of the porosity withrespect to the injected pore volumes and Figure 7b showsthe evolution of the network permeability with respect toinjected pore volumes. In these figures, we can see two
distinct regions of evolution: a linear increase in perme-ability and porosity at early times followed by a semilogar-ithmic increase at later times. The linear increase is mainlydue to the dissolution of calcite, which is an instantaneousreaction in our model. As calcite is depleted, dolomite dis-solution, which is kinetically controlled, determines thechange in pore volumes and therefore governs the long-term permeability evolution of the network.
[38] In Figure 7c, which shows the permeability (in logspace) of the network with respect to porosity. This figureshows that a rather singular relationship exists for the varia-tion of permeability with porosity despite the wide range ofpH and SI conditions tested. Thus, while there is complex-ity in how the extent of the change depends on boundarychemistry, there is a tight, unique relationship between per-meability and porosity.
[39] The variation that does exist in Figure 7c can beexplained by the slight effect of kaolinite precipitation. Forexample, for the case of pH 6.0 (line labeled ‘‘Si Ca¼ 0.0,Si Do¼�0.1’’ in Figure 7a) kaolinite’s original volumeincreased by 20%, while dolomite and calcite decreased its
Figure 6. Evolution of geochemical parameters inside a single pore in two different systems with thesame boundary pH and different SI values: (a) Saturation index of calcite, (b) pH of the pore water, (c)concentration of carbonate ions, and (d) concentration of calcium ions.
Figure 5. Contours showing (a) the changes from initial porosity and (b) the relative change in perme-ability with respect to the initial permeability (ko) over the CT and CaT variable space, after 10,000injected pore volumes. The two dots labeled ‘‘A’’ and ‘‘B’’ show a case where boundary condition with ahigher SI value produces a larger change in the permeability and porosity.
NOGUES ET AL.: PERMEABILITY EVOLUTION DUE TO REACTION OF CARBONATES
6014
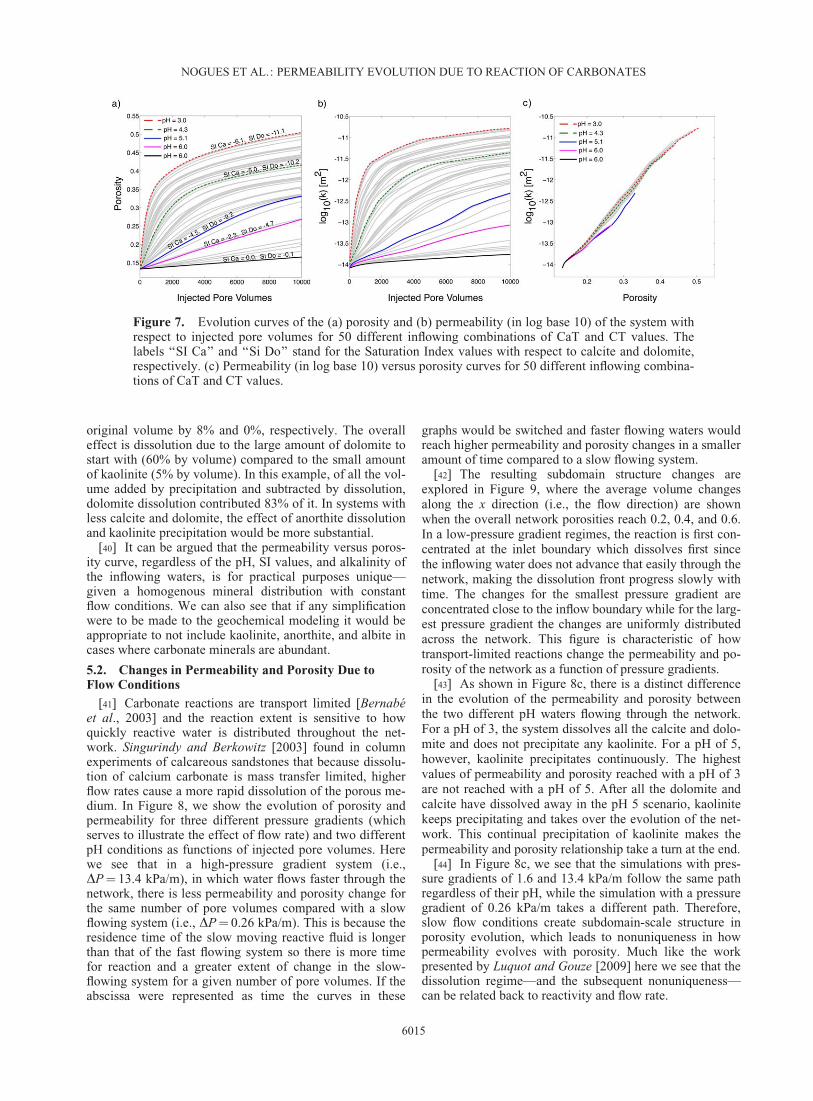
original volume by 8% and 0%, respectively. The overalleffect is dissolution due to the large amount of dolomite tostart with (60% by volume) compared to the small amountof kaolinite (5% by volume). In this example, of all the vol-ume added by precipitation and subtracted by dissolution,dolomite dissolution contributed 83% of it. In systems withless calcite and dolomite, the effect of anorthite dissolutionand kaolinite precipitation would be more substantial.
[40] It can be argued that the permeability versus poros-ity curve, regardless of the pH, SI values, and alkalinity ofthe inflowing waters, is for practical purposes unique—given a homogenous mineral distribution with constantflow conditions. We can also see that if any simplificationwere to be made to the geochemical modeling it would beappropriate to not include kaolinite, anorthite, and albite incases where carbonate minerals are abundant.
5.2. Changes in Permeability and Porosity Due toFlow Conditions
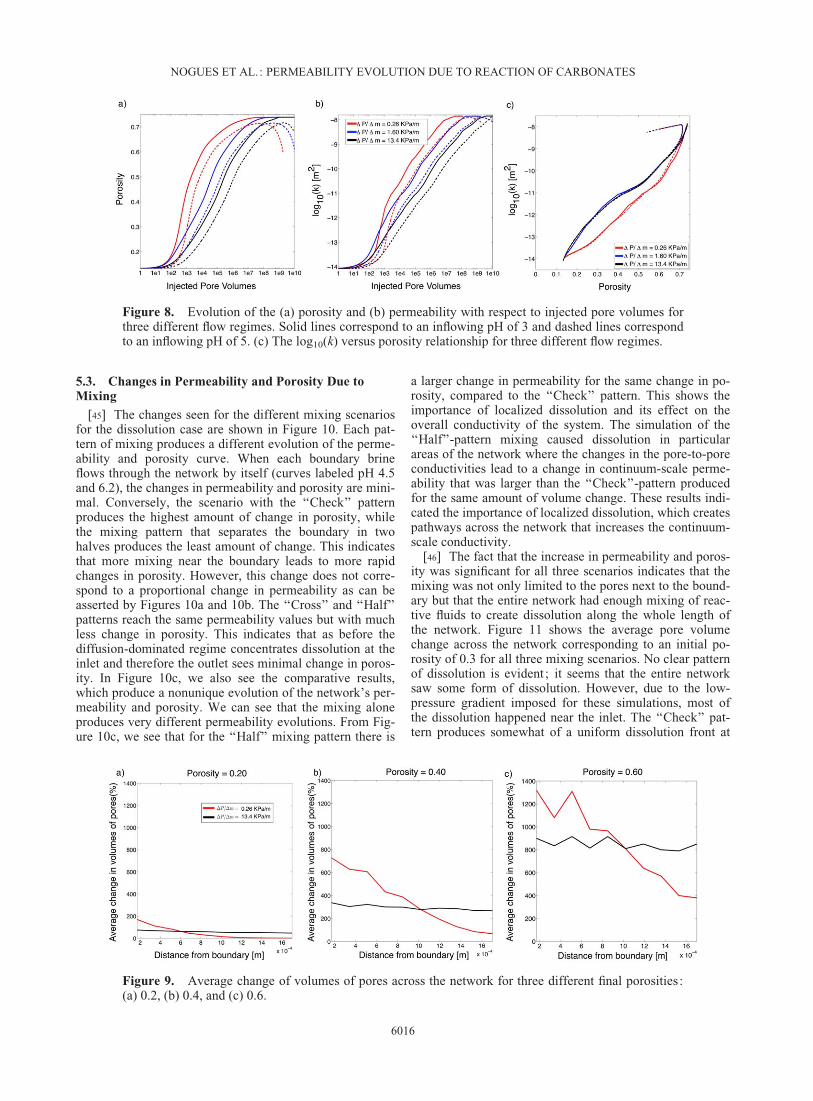
[41] Carbonate reactions are transport limited [Bernab�eet al., 2003] and the reaction extent is sensitive to howquickly reactive water is distributed throughout the net-work. Singurindy and Berkowitz [2003] found in columnexperiments of calcareous sandstones that because dissolu-tion of calcium carbonate is mass transfer limited, higherflow rates cause a more rapid dissolution of the porous me-dium. In Figure 8, we show the evolution of porosity andpermeability for three different pressure gradients (whichserves to illustrate the effect of flow rate) and two differentpH conditions as functions of injected pore volumes. Herewe see that in a high-pressure gradient system (i.e.,DP¼ 13.4 kPa/m), in which water flows faster through thenetwork, there is less permeability and porosity change forthe same number of pore volumes compared with a slowflowing system (i.e., DP¼ 0.26 kPa/m). This is because theresidence time of the slow moving reactive fluid is longerthan that of the fast flowing system so there is more timefor reaction and a greater extent of change in the slow-flowing system for a given number of pore volumes. If theabscissa were represented as time the curves in these
graphs would be switched and faster flowing waters wouldreach higher permeability and porosity changes in a smalleramount of time compared to a slow flowing system.
[42] The resulting subdomain structure changes areexplored in Figure 9, where the average volume changesalong the x direction (i.e., the flow direction) are shownwhen the overall network porosities reach 0.2, 0.4, and 0.6.In a low-pressure gradient regimes, the reaction is first con-centrated at the inlet boundary which dissolves first sincethe inflowing water does not advance that easily through thenetwork, making the dissolution front progress slowly withtime. The changes for the smallest pressure gradient areconcentrated close to the inflow boundary while for the larg-est pressure gradient the changes are uniformly distributedacross the network. This figure is characteristic of howtransport-limited reactions change the permeability and po-rosity of the network as a function of pressure gradients.
[43] As shown in Figure 8c, there is a distinct differencein the evolution of the permeability and porosity betweenthe two different pH waters flowing through the network.For a pH of 3, the system dissolves all the calcite and dolo-mite and does not precipitate any kaolinite. For a pH of 5,however, kaolinite precipitates continuously. The highestvalues of permeability and porosity reached with a pH of 3are not reached with a pH of 5. After all the dolomite andcalcite have dissolved away in the pH 5 scenario, kaolinitekeeps precipitating and takes over the evolution of the net-work. This continual precipitation of kaolinite makes thepermeability and porosity relationship take a turn at the end.
[44] In Figure 8c, we see that the simulations with pres-sure gradients of 1.6 and 13.4 kPa/m follow the same pathregardless of their pH, while the simulation with a pressuregradient of 0.26 kPa/m takes a different path. Therefore,slow flow conditions create subdomain-scale structure inporosity evolution, which leads to nonuniqueness in howpermeability evolves with porosity. Much like the workpresented by Luquot and Gouze [2009] here we see that thedissolution regime—and the subsequent nonuniqueness—can be related back to reactivity and flow rate.
Figure 7. Evolution curves of the (a) porosity and (b) permeability (in log base 10) of the system withrespect to injected pore volumes for 50 different inflowing combinations of CaT and CT values. Thelabels ‘‘SI Ca’’ and ‘‘Si Do’’ stand for the Saturation Index values with respect to calcite and dolomite,respectively. (c) Permeability (in log base 10) versus porosity curves for 50 different inflowing combina-tions of CaT and CT values.
NOGUES ET AL.: PERMEABILITY EVOLUTION DUE TO REACTION OF CARBONATES
6015
5.3. Changes in Permeability and Porosity Due toMixing
[45] The changes seen for the different mixing scenariosfor the dissolution case are shown in Figure 10. Each pat-tern of mixing produces a different evolution of the perme-ability and porosity curve. When each boundary brineflows through the network by itself (curves labeled pH 4.5and 6.2), the changes in permeability and porosity are mini-mal. Conversely, the scenario with the ‘‘Check’’ patternproduces the highest amount of change in porosity, whilethe mixing pattern that separates the boundary in twohalves produces the least amount of change. This indicatesthat more mixing near the boundary leads to more rapidchanges in porosity. However, this change does not corre-spond to a proportional change in permeability as can beasserted by Figures 10a and 10b. The ‘‘Cross’’ and ‘‘Half’’patterns reach the same permeability values but with muchless change in porosity. This indicates that as before thediffusion-dominated regime concentrates dissolution at theinlet and therefore the outlet sees minimal change in poros-ity. In Figure 10c, we also see the comparative results,which produce a nonunique evolution of the network’s per-meability and porosity. We can see that the mixing aloneproduces very different permeability evolutions. From Fig-ure 10c, we see that for the ‘‘Half’’ mixing pattern there is
a larger change in permeability for the same change in po-rosity, compared to the ‘‘Check’’ pattern. This shows theimportance of localized dissolution and its effect on theoverall conductivity of the system. The simulation of the‘‘Half’’-pattern mixing caused dissolution in particularareas of the network where the changes in the pore-to-poreconductivities lead to a change in continuum-scale perme-ability that was larger than the ‘‘Check’’-pattern producedfor the same amount of volume change. These results indi-cated the importance of localized dissolution, which createspathways across the network that increases the continuum-scale conductivity.
[46] The fact that the increase in permeability and poros-ity was significant for all three scenarios indicates that themixing was not only limited to the pores next to the bound-ary but that the entire network had enough mixing of reac-tive fluids to create dissolution along the whole length ofthe network. Figure 11 shows the average pore volumechange across the network corresponding to an initial po-rosity of 0.3 for all three mixing scenarios. No clear patternof dissolution is evident ; it seems that the entire networksaw some form of dissolution. However, due to the low-pressure gradient imposed for these simulations, most ofthe dissolution happened near the inlet. The ‘‘Check’’ pat-tern produces somewhat of a uniform dissolution front at
Figure 9. Average change of volumes of pores across the network for three different final porosities:(a) 0.2, (b) 0.4, and (c) 0.6.
Figure 8. Evolution of the (a) porosity and (b) permeability with respect to injected pore volumes forthree different flow regimes. Solid lines correspond to an inflowing pH of 3 and dashed lines correspondto an inflowing pH of 5. (c) The log10(k) versus porosity relationship for three different flow regimes.
NOGUES ET AL.: PERMEABILITY EVOLUTION DUE TO REACTION OF CARBONATES
6016
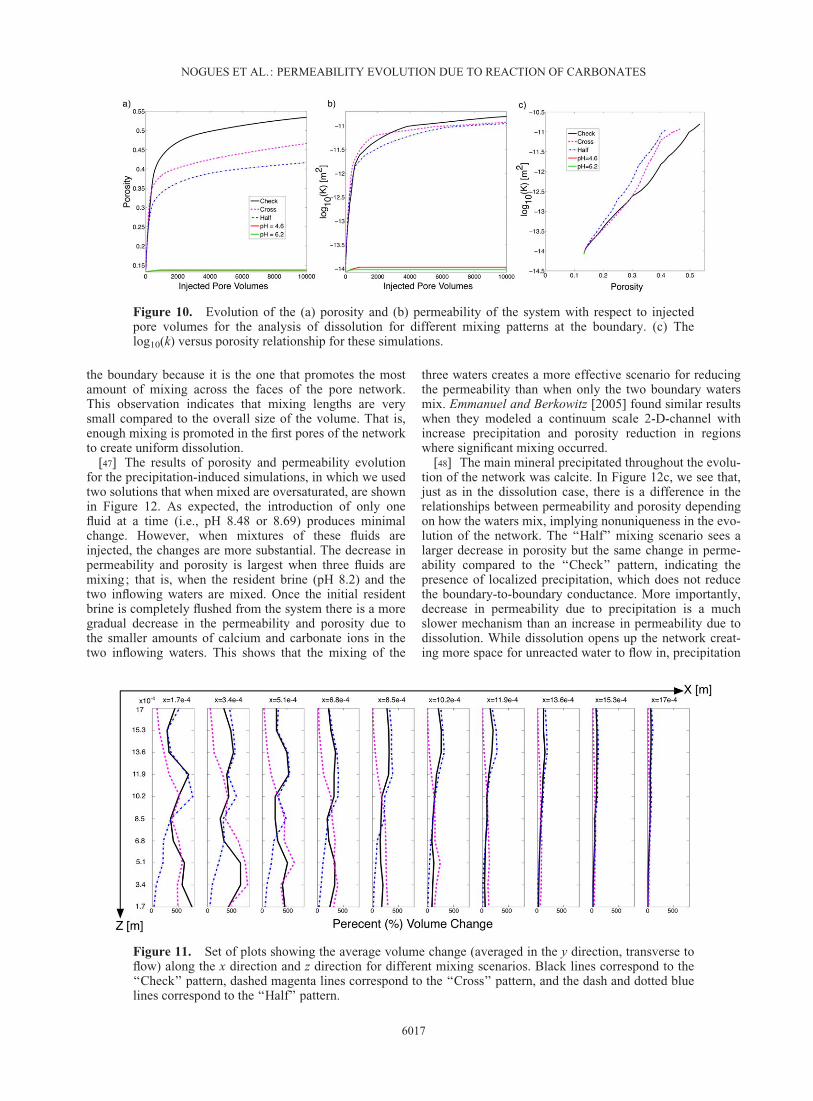
the boundary because it is the one that promotes the mostamount of mixing across the faces of the pore network.This observation indicates that mixing lengths are verysmall compared to the overall size of the volume. That is,enough mixing is promoted in the first pores of the networkto create uniform dissolution.
[47] The results of porosity and permeability evolutionfor the precipitation-induced simulations, in which we usedtwo solutions that when mixed are oversaturated, are shownin Figure 12. As expected, the introduction of only onefluid at a time (i.e., pH 8.48 or 8.69) produces minimalchange. However, when mixtures of these fluids areinjected, the changes are more substantial. The decrease inpermeability and porosity is largest when three fluids aremixing; that is, when the resident brine (pH 8.2) and thetwo inflowing waters are mixed. Once the initial residentbrine is completely flushed from the system there is a moregradual decrease in the permeability and porosity due tothe smaller amounts of calcium and carbonate ions in thetwo inflowing waters. This shows that the mixing of the
three waters creates a more effective scenario for reducingthe permeability than when only the two boundary watersmix. Emmanuel and Berkowitz [2005] found similar resultswhen they modeled a continuum scale 2-D-channel withincrease precipitation and porosity reduction in regionswhere significant mixing occurred.
[48] The main mineral precipitated throughout the evolu-tion of the network was calcite. In Figure 12c, we see that,just as in the dissolution case, there is a difference in therelationships between permeability and porosity dependingon how the waters mix, implying nonuniqueness in the evo-lution of the network. The ‘‘Half’’ mixing scenario sees alarger decrease in porosity but the same change in perme-ability compared to the ‘‘Check’’ pattern, indicating thepresence of localized precipitation, which does not reducethe boundary-to-boundary conductance. More importantly,decrease in permeability due to precipitation is a muchslower mechanism than an increase in permeability due todissolution. While dissolution opens up the network creat-ing more space for unreacted water to flow in, precipitation
Figure 10. Evolution of the (a) porosity and (b) permeability of the system with respect to injectedpore volumes for the analysis of dissolution for different mixing patterns at the boundary. (c) Thelog10(k) versus porosity relationship for these simulations.
Figure 11. Set of plots showing the average volume change (averaged in the y direction, transverse toflow) along the x direction and z direction for different mixing scenarios. Black lines correspond to the‘‘Check’’ pattern, dashed magenta lines correspond to the ‘‘Cross’’ pattern, and the dash and dotted bluelines correspond to the ‘‘Half’’ pattern.
NOGUES ET AL.: PERMEABILITY EVOLUTION DUE TO REACTION OF CARBONATES
6017
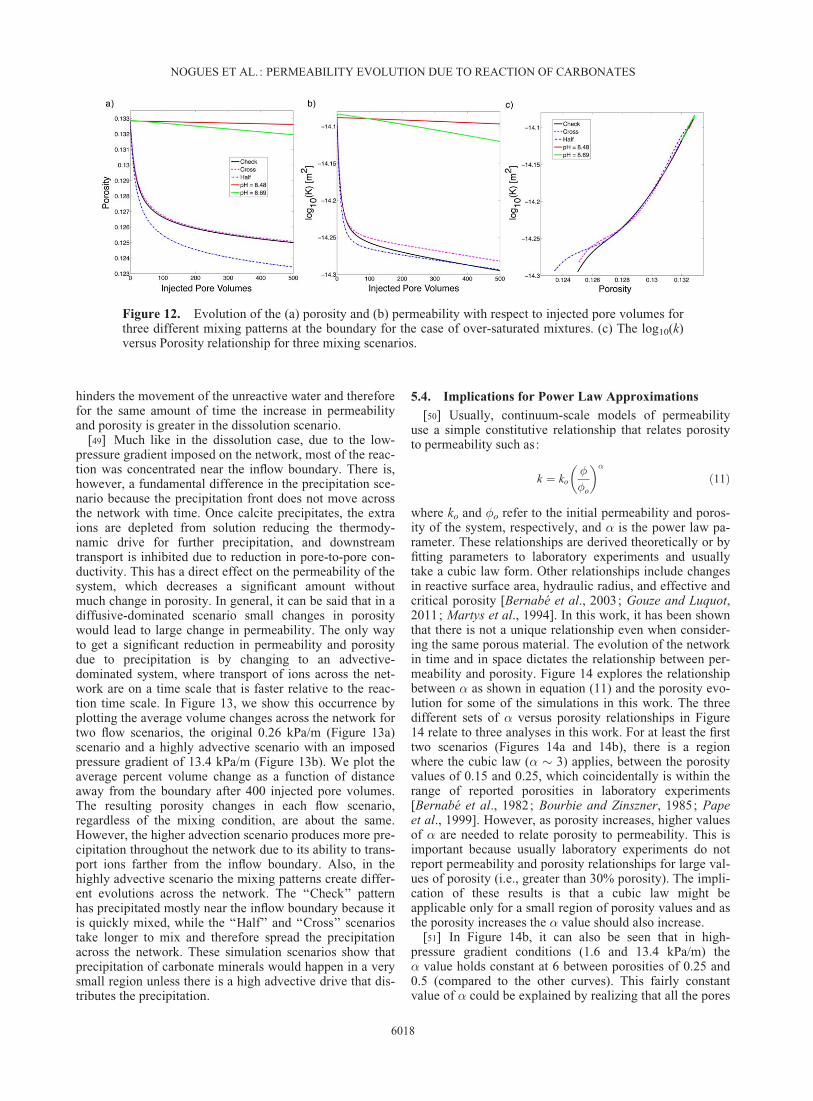
hinders the movement of the unreactive water and thereforefor the same amount of time the increase in permeabilityand porosity is greater in the dissolution scenario.
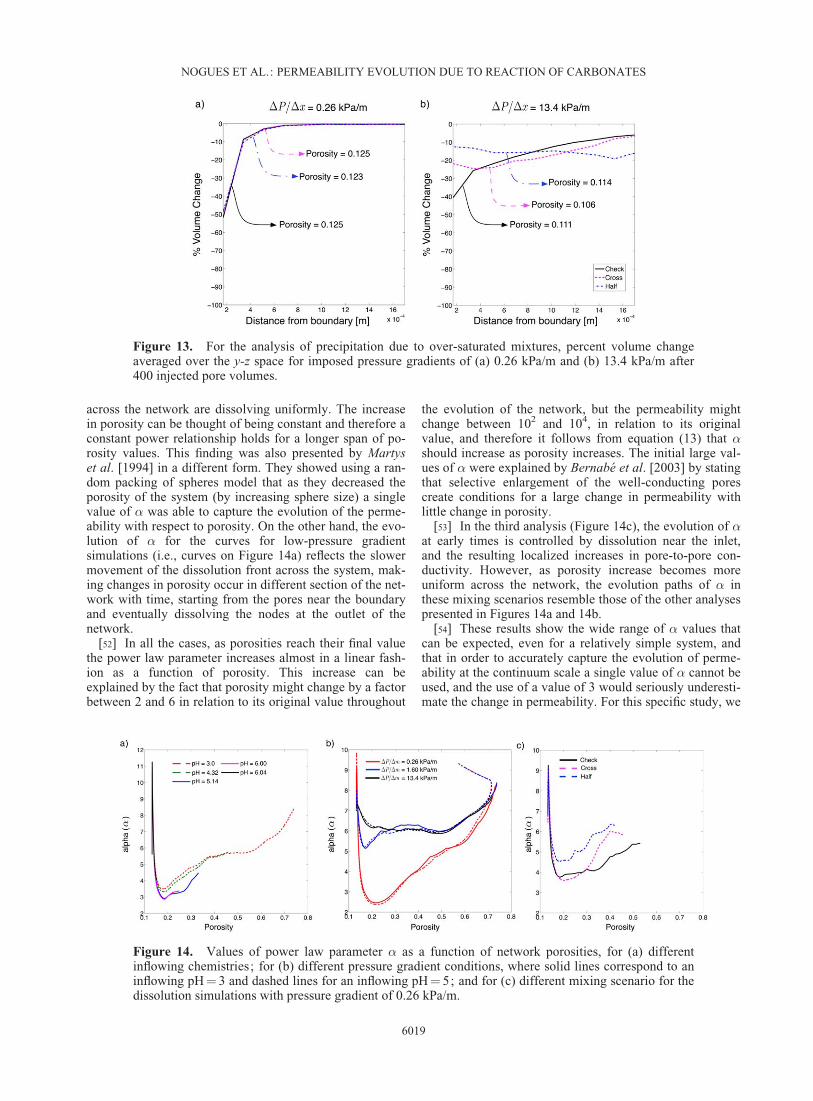
[49] Much like in the dissolution case, due to the low-pressure gradient imposed on the network, most of the reac-tion was concentrated near the inflow boundary. There is,however, a fundamental difference in the precipitation sce-nario because the precipitation front does not move acrossthe network with time. Once calcite precipitates, the extraions are depleted from solution reducing the thermody-namic drive for further precipitation, and downstreamtransport is inhibited due to reduction in pore-to-pore con-ductivity. This has a direct effect on the permeability of thesystem, which decreases a significant amount withoutmuch change in porosity. In general, it can be said that in adiffusive-dominated scenario small changes in porositywould lead to large change in permeability. The only wayto get a significant reduction in permeability and porositydue to precipitation is by changing to an advective-dominated system, where transport of ions across the net-work are on a time scale that is faster relative to the reac-tion time scale. In Figure 13, we show this occurrence byplotting the average volume changes across the network fortwo flow scenarios, the original 0.26 kPa/m (Figure 13a)scenario and a highly advective scenario with an imposedpressure gradient of 13.4 kPa/m (Figure 13b). We plot theaverage percent volume change as a function of distanceaway from the boundary after 400 injected pore volumes.The resulting porosity changes in each flow scenario,regardless of the mixing condition, are about the same.However, the higher advection scenario produces more pre-cipitation throughout the network due to its ability to trans-port ions farther from the inflow boundary. Also, in thehighly advective scenario the mixing patterns create differ-ent evolutions across the network. The ‘‘Check’’ patternhas precipitated mostly near the inflow boundary because itis quickly mixed, while the ‘‘Half’’ and ‘‘Cross’’ scenariostake longer to mix and therefore spread the precipitationacross the network. These simulation scenarios show thatprecipitation of carbonate minerals would happen in a verysmall region unless there is a high advective drive that dis-tributes the precipitation.
5.4. Implications for Power Law Approximations
[50] Usually, continuum-scale models of permeabilityuse a simple constitutive relationship that relates porosityto permeability such as:
k ¼ ko�
�o
� �ð11Þ
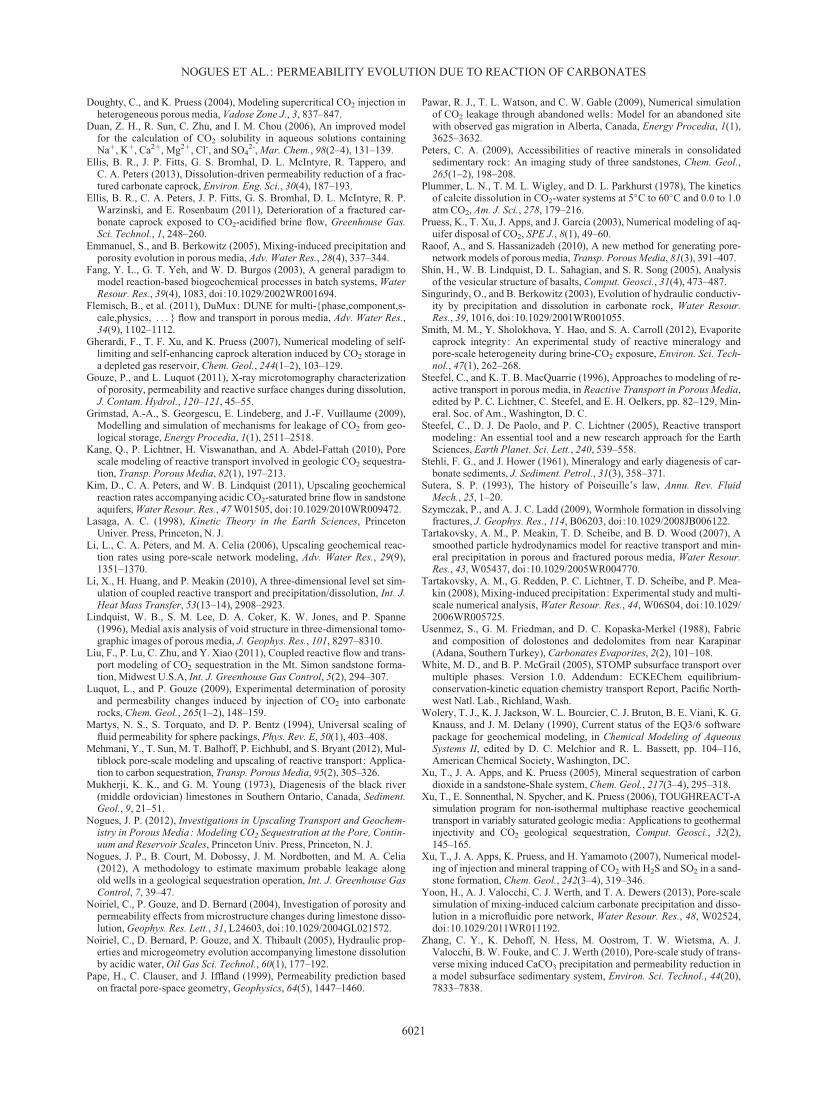
where ko and �o refer to the initial permeability and poros-ity of the system, respectively, and � is the power law pa-rameter. These relationships are derived theoretically or byfitting parameters to laboratory experiments and usuallytake a cubic law form. Other relationships include changesin reactive surface area, hydraulic radius, and effective andcritical porosity [Bernab�e et al., 2003; Gouze and Luquot,2011; Martys et al., 1994]. In this work, it has been shownthat there is not a unique relationship even when consider-ing the same porous material. The evolution of the networkin time and in space dictates the relationship between per-meability and porosity. Figure 14 explores the relationshipbetween � as shown in equation (11) and the porosity evo-lution for some of the simulations in this work. The threedifferent sets of � versus porosity relationships in Figure14 relate to three analyses in this work. For at least the firsttwo scenarios (Figures 14a and 14b), there is a regionwhere the cubic law (� � 3) applies, between the porosityvalues of 0.15 and 0.25, which coincidentally is within therange of reported porosities in laboratory experiments[Bernab�e et al., 1982; Bourbie and Zinszner, 1985; Papeet al., 1999]. However, as porosity increases, higher valuesof � are needed to relate porosity to permeability. This isimportant because usually laboratory experiments do notreport permeability and porosity relationships for large val-ues of porosity (i.e., greater than 30% porosity). The impli-cation of these results is that a cubic law might beapplicable only for a small region of porosity values and asthe porosity increases the � value should also increase.
[51] In Figure 14b, it can also be seen that in high-pressure gradient conditions (1.6 and 13.4 kPa/m) the� value holds constant at 6 between porosities of 0.25 and0.5 (compared to the other curves). This fairly constantvalue of � could be explained by realizing that all the pores
Figure 12. Evolution of the (a) porosity and (b) permeability with respect to injected pore volumes forthree different mixing patterns at the boundary for the case of over-saturated mixtures. (c) The log10(k)versus Porosity relationship for three mixing scenarios.
NOGUES ET AL.: PERMEABILITY EVOLUTION DUE TO REACTION OF CARBONATES
6018
across the network are dissolving uniformly. The increasein porosity can be thought of being constant and therefore aconstant power relationship holds for a longer span of po-rosity values. This finding was also presented by Martyset al. [1994] in a different form. They showed using a ran-dom packing of spheres model that as they decreased theporosity of the system (by increasing sphere size) a singlevalue of � was able to capture the evolution of the perme-ability with respect to porosity. On the other hand, the evo-lution of � for the curves for low-pressure gradientsimulations (i.e., curves on Figure 14a) reflects the slowermovement of the dissolution front across the system, mak-ing changes in porosity occur in different section of the net-work with time, starting from the pores near the boundaryand eventually dissolving the nodes at the outlet of thenetwork.
[52] In all the cases, as porosities reach their final valuethe power law parameter increases almost in a linear fash-ion as a function of porosity. This increase can beexplained by the fact that porosity might change by a factorbetween 2 and 6 in relation to its original value throughout
the evolution of the network, but the permeability mightchange between 102 and 104, in relation to its originalvalue, and therefore it follows from equation (13) that �should increase as porosity increases. The initial large val-ues of � were explained by Bernab�e et al. [2003] by statingthat selective enlargement of the well-conducting porescreate conditions for a large change in permeability withlittle change in porosity.
[53] In the third analysis (Figure 14c), the evolution of �at early times is controlled by dissolution near the inlet,and the resulting localized increases in pore-to-pore con-ductivity. However, as porosity increase becomes moreuniform across the network, the evolution paths of � inthese mixing scenarios resemble those of the other analysespresented in Figures 14a and 14b.
[54] These results show the wide range of � values thatcan be expected, even for a relatively simple system, andthat in order to accurately capture the evolution of perme-ability at the continuum scale a single value of � cannot beused, and the use of a value of 3 would seriously underesti-mate the change in permeability. For this specific study, we
Figure 14. Values of power law parameter � as a function of network porosities, for (a) differentinflowing chemistries; for (b) different pressure gradient conditions, where solid lines correspond to aninflowing pH¼ 3 and dashed lines for an inflowing pH¼ 5; and for (c) different mixing scenario for thedissolution simulations with pressure gradient of 0.26 kPa/m.
Figure 13. For the analysis of precipitation due to over-saturated mixtures, percent volume changeaveraged over the y-z space for imposed pressure gradients of (a) 0.26 kPa/m and (b) 13.4 kPa/m after400 injected pore volumes.
NOGUES ET AL.: PERMEABILITY EVOLUTION DUE TO REACTION OF CARBONATES
6019
see that the value of � can take values from as low 2.5 upto values of 10. In general, the values of � start high thenquickly drop down to its lowest value (�2 or 3) and thenslowly move up to a maximum value (�5–9). The approachtaken to represent the evolution of permeability at the con-tinuum scale can be achieved either by carrying more infor-mation from the pore scale in order to know a priori theright � values to choose (i.e., pH/SI regime, mixing sce-nario, boundary conditions, etc.) or making scaling argu-ments that would eliminate the least likely scenarios. In theexamples here, the high-pressure gradient versus the low-pressure gradient curves can be used as bounding curves ofthe possible � values. The results shown coincide with thelaboratory experiments by Gouze and Luquot [2011], whichfound a range of values to fit a power law relationship thatlinked porosity to permeability. They found much like wehave that this parameter was dependent on the type of rock,the flow conditions, and the reactivity of the system.
6. Conclusions
[55] This study investigated the evolution of continuum-scale parameters, permeability and porosity, induced bytransport and reactions at the pore scale. The methodologydeveloped for this study consists of modeling the transportof CO2-rich waters in a pore network model, the subse-quent chemical reactions that occur with primary or sec-ondary minerals and the change in pore volumes that affectcontinuum-scale parameters. This study showed how thepermeability and porosity of a pore network evolvesdepending on the chemical reactivity of the inflowingwater, the transport processes that dominate the system(i.e., advective versus diffusive), and the mixing patternsthat might occur within a network.
[56] Overall there are six major conclusions that can bemade from this study: (1) In general, the higher the solu-tion concentration of carbonic acid in the inflowing water,the faster the system dissolves, with the caveat that themore calcium ions in solution, the less dissolution occurs.Neither the calcite saturation index nor any other singlegeochemical variable, alone, is sufficient to predict theextent of porosity change. (2) Despite the complexity in theeffect of solution chemistry on the extent of change in po-rosity and permeability, the relationship of the permeabilityto the porosity of the network can be said to be unique, fora given flow condition and a similar porous structure as theone modeled in this work with homogenous mineral distri-bution. (3) In a CO2 sequestration operation, it is morelikely for dissolution to occur than precipitation due to theanticipated high concentration of CT and the low values ofSI and pH that occur. (4) Slow flow conditions create non-unique porosity-permeability relationships, whereas fastflow conditions produce a unique porosity-permeabilityrelationship because these conditions produce uniformchanges across the domain. (5) Mixing waters that are bythemselves unreactive can create conditions of precipita-tion or dissolution. The larger the spatial extent of mixingof these waters within the network, the larger the change inpermeability and porosity. (6) Using a power law relation-ship with a single exponent parameter (e.g., cubic law) toequate a porosity change to a permeability change may notcapture the correct evolution of the network permeability.
The constant values that this parameter takes are between 2and 10 and depend on the flow rate and geochemistry of thesystem, but a value of 6 may be representative of high flowrate conditions.
[57] These insights illuminate the complex phenomenainvolved in the modification of material properties of a po-rous medium when CO2-rich waters react with carbonaterocks. The insights offered are to be considered when, inthe future, continuum-scale models try to account fordynamic material properties that might affect the trappingcapabilities of carbonate formations within a geologicalsequestration of CO2 framework.
[58] Acknowledgments. This project was supported through fundingfrom the U.S. Department of Energy under award DE-FE0000749 and DE-FG02–09ER64748. The authors also wish to acknowledge Rudolf Hilferfrom the University of Stuttgart for providing the synthetic m-CT imagesof the carbonate rock, and Brent Lindquist from Stony Brook Universityfor processing the m-CT image using 3DMA-Rock.
ReferencesAl-Jaroudi, S. S., A. Ul-Hamid, A.-R. I. Mohammed, and S. Saner (2007),
Use of X-ray powder diffraction for quantitative analysis of carbonaterock reservoir samples, Powder Technol., 175(3), 115–121.
Algive, L., S. Bekri, F. H. Nader, O. Lerat, and O. Vizika (2012), Impact ofdiagenetic alterations of the petrphysical and multiphase flow propertiesof carbonate rocks using a reactive pore network modeling approach, OilGas Sci. Technol., 67(1), 147–160.
Andre, L., P. Audigane, M. Azaroual, and A. Menjoz (2007), Numericalmodeling of fluid-rock chemical interactions at the supercritical CO2-liq-uid interface during CO2 injection into a carbonate reservoir, the Doggeraquifer (Paris Basin, France), Energy Convers. Manage., 48(6), 1782–1797.
Assayag, N., J. Matter, M. Ader, D. Goldberg, and P. Agrinier (2009),Water-rock interactions during a CO2 injection field-test: Implicationson host rock dissolution and alteration effects, Chem. Geol., 265(1–2),227–235.
Bachu, S., and J. J. Adams (2003), Sequestration of CO2 in geologicalmedia in response to climate change: Capacity of deep saline aquifers tosequester CO2 in solution, Energy Convers. Manage., 44(20), 3151–3175.
Bernab�e, Y., W. F. Brace, and B. Evans (1982), Permeability, porosity andpore geometry of hot-pressed calcite, Mech. Mater, 1(3), 173–183.
Bernab�e, Y., U. Mok, and B. Evans (2003), Permeability-porosity relation-ships in rocks subjected to various evolution processes, Pure Appl. Geo-phys., 160(5), 937–960.
Birkholzer, J. T., Q. Zhou, and C.-F. Tsang (2009), Large-scale impact ofCO2 storage in deep saline aquifers: A sensitivity study on pressureresponse in stratified systems, Int. J. Greenhouse Gas Control, 3(2),181–194.
Biswal, B., P. E. Oren, R. Held, S. Bakke, and R. Hilfer (2007), Stochasticmultiscale model for carbonate rocks, Phys. Rev. E, 75(6), 061303-1–061303-5.
Biswal, B., R. J. Held, V. Khanna, J. Wang, and R. Hilfer (2009), Towardsprecise prediction of transport properties from synthetic computer to-mography of reconstructed porous media, Phys. Rev. E, 80(4), 041301-1–041301-13.
Bourbie, T., and B. Zinszner (1985), Hydrualic and acoustic properties as afunction of porosity in fontainebleau sandstone, J. Geophys. Res.,90(B13), 11,524–11,532.
Brosse, E., et al. (2010), Selection and characterization of geological sitesable to host a pilot-scale CO2 storage in the paris basin (GeoCarbone-PICOREF), Oil Gas Sci. Technol., 65(3), 375–403.
Burton, M., N. Kumar, and S. L. Bryant (2008), Time-dependent injectivityduring CO2 storage in aquifers, in SPE/DOE Symposium on ImprovedOil Recovery, SPE Paper 113937, pp. 1–15, Tulsa, Okla.
Butler, J. N. (1982), Carbon Dioxide Equilibria and their Applications,Addison-Wesley, Reading, Mass.
Celia, M. A., J. M. Nordbotten, B. Court, M. Dobossy, and S. Bachu(2011), Field-scale application of a semi-analytical model for estimationof CO2 and brine leakage along old wells, Int. J. Greenhouse Gas Con-trol, 5(2), 257–269.
NOGUES ET AL.: PERMEABILITY EVOLUTION DUE TO REACTION OF CARBONATES
6020
Doughty, C., and K. Pruess (2004), Modeling supercritical CO2 injection inheterogeneous porous media, Vadose Zone J., 3, 837–847.
Duan, Z. H., R. Sun, C. Zhu, and I. M. Chou (2006), An improved modelfor the calculation of CO2 solubility in aqueous solutions containingNaþ, Kþ, Ca2þ, Mg2þ, Cl-, and SO4
2-, Mar. Chem., 98(2–4), 131–139.Ellis, B. R., J. P. Fitts, G. S. Bromhal, D. L. McIntyre, R. Tappero, and
C. A. Peters (2013), Dissolution-driven permeability reduction of a frac-tured carbonate caprock, Environ. Eng. Sci., 30(4), 187–193.
Ellis, B. R., C. A. Peters, J. P. Fitts, G. S. Bromhal, D. L. McIntyre, R. P.Warzinski, and E. Rosenbaum (2011), Deterioration of a fractured car-bonate caprock exposed to CO2-acidified brine flow, Greenhouse Gas.Sci. Technol., 1, 248–260.
Emmanuel, S., and B. Berkowitz (2005), Mixing-induced precipitation andporosity evolution in porous media, Adv. Water Res., 28(4), 337–344.
Fang, Y. L., G. T. Yeh, and W. D. Burgos (2003), A general paradigm tomodel reaction-based biogeochemical processes in batch systems, WaterResour. Res., 39(4), 1083, doi:10.1029/2002WR001694.
Flemisch, B., et al. (2011), DuMux: DUNE for multi-{phase,component,s-cale,physics, . . . } flow and transport in porous media, Adv. Water Res.,34(9), 1102–1112.
Gherardi, F., T. F. Xu, and K. Pruess (2007), Numerical modeling of self-limiting and self-enhancing caprock alteration induced by CO2 storage ina depleted gas reservoir, Chem. Geol., 244(1–2), 103–129.
Gouze, P., and L. Luquot (2011), X-ray microtomography characterizationof porosity, permeability and reactive surface changes during dissolution,J. Contam. Hydrol., 120–121, 45–55.
Grimstad, A.-A., S. Georgescu, E. Lindeberg, and J.-F. Vuillaume (2009),Modelling and simulation of mechanisms for leakage of CO2 from geo-logical storage, Energy Procedia, 1(1), 2511–2518.
Kang, Q., P. Lichtner, H. Viswanathan, and A. Abdel-Fattah (2010), Porescale modeling of reactive transport involved in geologic CO2 sequestra-tion, Transp. Porous Media, 82(1), 197–213.
Kim, D., C. A. Peters, and W. B. Lindquist (2011), Upscaling geochemicalreaction rates accompanying acidic CO2-saturated brine flow in sandstoneaquifers, Water Resour. Res., 47 W01505, doi:10.1029/2010WR009472.
Lasaga, A. C. (1998), Kinetic Theory in the Earth Sciences, PrincetonUniver. Press, Princeton, N. J.
Li, L., C. A. Peters, and M. A. Celia (2006), Upscaling geochemical reac-tion rates using pore-scale network modeling, Adv. Water Res., 29(9),1351–1370.
Li, X., H. Huang, and P. Meakin (2010), A three-dimensional level set sim-ulation of coupled reactive transport and precipitation/dissolution, Int. J.Heat Mass Transfer, 53(13–14), 2908–2923.
Lindquist, W. B., S. M. Lee, D. A. Coker, K. W. Jones, and P. Spanne(1996), Medial axis analysis of void structure in three-dimensional tomo-graphic images of porous media, J. Geophys. Res., 101, 8297–8310.
Liu, F., P. Lu, C. Zhu, and Y. Xiao (2011), Coupled reactive flow and trans-port modeling of CO2 sequestration in the Mt. Simon sandstone forma-tion, Midwest U.S.A, Int. J. Greenhouse Gas Control, 5(2), 294–307.
Luquot, L., and P. Gouze (2009), Experimental determination of porosityand permeability changes induced by injection of CO2 into carbonaterocks, Chem. Geol., 265(1–2), 148–159.
Martys, N. S., S. Torquato, and D. P. Bentz (1994), Universal scaling offluid permeability for sphere packings, Phys. Rev. E, 50(1), 403–408.
Mehmani, Y., T. Sun, M. T. Balhoff, P. Eichhubl, and S. Bryant (2012), Mul-tiblock pore-scale modeling and upscaling of reactive transport: Applica-tion to carbon sequestration, Transp. Porous Media, 95(2), 305–326.
Mukherji, K. K., and G. M. Young (1973), Diagenesis of the black river(middle ordovician) limestones in Southern Ontario, Canada, Sediment.Geol., 9, 21–51.
Nogues, J. P. (2012), Investigations in Upscaling Transport and Geochem-istry in Porous Media: Modeling CO2 Sequestration at the Pore, Contin-uum and Reservoir Scales, Princeton Univ. Press, Princeton, N. J.
Nogues, J. P., B. Court, M. Dobossy, J. M. Nordbotten, and M. A. Celia(2012), A methodology to estimate maximum probable leakage alongold wells in a geological sequestration operation, Int. J. Greenhouse GasControl, 7, 39–47.
Noiriel, C., P. Gouze, and D. Bernard (2004), Investigation of porosity andpermeability effects from microstructure changes during limestone disso-lution, Geophys. Res. Lett., 31, L24603, doi:10.1029/2004GL021572.
Noiriel, C., D. Bernard, P. Gouze, and X. Thibault (2005), Hydraulic prop-erties and microgeometry evolution accompanying limestone dissolutionby acidic water, Oil Gas Sci. Technol., 60(1), 177–192.
Pape, H., C. Clauser, and J. Iffland (1999), Permeability prediction basedon fractal pore-space geometry, Geophysics, 64(5), 1447–1460.
Pawar, R. J., T. L. Watson, and C. W. Gable (2009), Numerical simulationof CO2 leakage through abandoned wells: Model for an abandoned sitewith observed gas migration in Alberta, Canada, Energy Procedia, 1(1),3625–3632.
Peters, C. A. (2009), Accessibilities of reactive minerals in consolidatedsedimentary rock: An imaging study of three sandstones, Chem. Geol.,265(1–2), 198–208.
Plummer, L. N., T. M. L. Wigley, and D. L. Parkhurst (1978), The kineticsof calcite dissolution in CO2-water systems at 5�C to 60�C and 0.0 to 1.0atm CO2, Am. J. Sci., 278, 179–216.
Pruess, K., T. Xu, J. Apps, and J. Garcia (2003), Numerical modeling of aq-uifer disposal of CO2, SPE J., 8(1), 49–60.
Raoof, A., and S. Hassanizadeh (2010), A new method for generating pore-network models of porous media, Transp. Porous Media, 81(3), 391–407.
Shin, H., W. B. Lindquist, D. L. Sahagian, and S. R. Song (2005), Analysisof the vesicular structure of basalts, Comput. Geosci., 31(4), 473–487.
Singurindy, O., and B. Berkowitz (2003), Evolution of hydraulic conductiv-ity by precipitation and dissolution in carbonate rock, Water Resour.Res., 39, 1016, doi:10.1029/2001WR001055.
Smith, M. M., Y. Sholokhova, Y. Hao, and S. A. Carroll (2012), Evaporitecaprock integrity: An experimental study of reactive mineralogy andpore-scale heterogeneity during brine-CO2 exposure, Environ. Sci. Tech-nol., 47(1), 262–268.
Steefel, C., and K. T. B. MacQuarrie (1996), Approaches to modeling of re-active transport in porous media, in Reactive Transport in Porous Media,edited by P. C. Lichtner, C. Steefel, and E. H. Oelkers, pp. 82–129, Min-eral. Soc. of Am., Washington, D. C.
Steefel, C., D. J. De Paolo, and P. C. Lichtner (2005), Reactive transportmodeling: An essential tool and a new research approach for the EarthSciences, Earth Planet. Sci. Lett., 240, 539–558.
Stehli, F. G., and J. Hower (1961), Mineralogy and early diagenesis of car-bonate sediments, J. Sediment. Petrol., 31(3), 358–371.
Sutera, S. P. (1993), The history of Poiseuille’s law, Annu. Rev. FluidMech., 25, 1–20.
Szymczak, P., and A. J. C. Ladd (2009), Wormhole formation in dissolvingfractures, J. Geophys. Res., 114, B06203, doi:10.1029/2008JB006122.
Tartakovsky, A. M., P. Meakin, T. D. Scheibe, and B. D. Wood (2007), Asmoothed particle hydrodynamics model for reactive transport and min-eral precipitation in porous and fractured porous media, Water Resour.Res., 43, W05437, doi:10.1029/2005WR004770.
Tartakovsky, A. M., G. Redden, P. C. Lichtner, T. D. Scheibe, and P. Mea-kin (2008), Mixing-induced precipitation: Experimental study and multi-scale numerical analysis, Water Resour. Res., 44, W06S04, doi:10.1029/2006WR005725.
Usenmez, S., G. M. Friedman, and D. C. Kopaska-Merkel (1988), Fabricand composition of dolostones and dedolomites from near Karapinar(Adana, Southern Turkey), Carbonates Evaporites, 2(2), 101–108.
White, M. D., and B. P. McGrail (2005), STOMP subsurface transport overmultiple phases. Version 1.0. Addendum: ECKEChem equilibrium-conservation-kinetic equation chemistry transport Report, Pacific North-west Natl. Lab., Richland, Wash.
Wolery, T. J., K. J. Jackson, W. L. Bourcier, C. J. Bruton, B. E. Viani, K. G.Knauss, and J. M. Delany (1990), Current status of the EQ3/6 softwarepackage for geochemical modeling, in Chemical Modeling of AqueousSystems II, edited by D. C. Melchior and R. L. Bassett, pp. 104–116,American Chemical Society, Washington, DC.
Xu, T., J. A. Apps, and K. Pruess (2005), Mineral sequestration of carbondioxide in a sandstone-Shale system, Chem. Geol., 217(3–4), 295–318.
Xu, T., E. Sonnenthal, N. Spycher, and K. Pruess (2006), TOUGHREACT-Asimulation program for non-isothermal multiphase reactive geochemicaltransport in variably saturated geologic media: Applications to geothermalinjectivity and CO2 geological sequestration, Comput. Geosci., 32(2),145–165.
Xu, T., J. A. Apps, K. Pruess, and H. Yamamoto (2007), Numerical model-ing of injection and mineral trapping of CO2 with H2S and SO2 in a sand-stone formation, Chem. Geol., 242(3–4), 319–346.
Yoon, H., A. J. Valocchi, C. J. Werth, and T. A. Dewers (2013), Pore-scalesimulation of mixing-induced calcium carbonate precipitation and disso-lution in a microfluidic pore network, Water Resour. Res., 48, W02524,doi:10.1029/2011WR011192.
Zhang, C. Y., K. Dehoff, N. Hess, M. Oostrom, T. W. Wietsma, A. J.Valocchi, B. W. Fouke, and C. J. Werth (2010), Pore-scale study of trans-verse mixing induced CaCO3 precipitation and permeability reduction ina model subsurface sedimentary system, Environ. Sci. Technol., 44(20),7833–7838.
NOGUES ET AL.: PERMEABILITY EVOLUTION DUE TO REACTION OF CARBONATES
6021
Related Documents