Node-Specific Triad Pattern Mining for Complex-Network Analysis Marco Winkler Institute for Theoretical Physics University of Wuerzburg Am Hubland, 97074 Wuerzburg, Germany Email: [email protected] Joerg Reichardt Institute for Theoretical Physics University of Wuerzburg Am Hubland, 97074 Wuerzburg, Germany Email: [email protected] Abstract—The mining of graphs in terms of their local sub- structure is a well-established methodology to analyze networks. It was hypothesized that motifs - subgraph patterns which appear significantly more often than expected at random - play a key role for the ability of a system to perform its task. Yet the framework commonly used for motif-detection averages over the local environments of all nodes. Therefore, it remains unclear whether motifs are overrepresented in the whole system or only in certain regions. In this contribution, we overcome this limitation by mining node-specific triad patterns. For every vertex, the abundance of each triad pattern is considered only in triads it participates in. We investigate systems of various fields and find that motifs are distributed highly heterogeneously. In particular we focus on the feed-forward loop motif which has been alleged to play a key role in biological networks. I. I NTRODUCTION The concept of networks has been successfully applied to model the interactions between entities in complex systems of various fields. The topological structure of interactions among the constituents of complex many particle systems is intimately linked to system function and global system properties. A major branch of networks research aims to elucidate this link between structure and function. Generally, pairwise relations between nodes, so-called dyads, are considered the fundamental building blocks of complex networks. Erd¨ os-Renyi graphs [1], the configuration model [2], stochastic block models [3], [4], [5] and degree corrected block models [6] all fall into the class of dyadic models. The basic assumption underlying dyadic models is that dyads are conditionally independent given the model’s parameters. However, the assumption of dyadic independence as a general paradigm of network modeling seems questionable. For example, in a social context, the idea that the relation of Alice and Bob be independent from the relation of Alice and Charlie seems to go against experience, especially if Published in IEEE ICDMW 2014. c 2014 IEEE. Personal use of this mate- rial is permitted. Permission from IEEE must be obtained for all other uses, in any current or future media, including reprinting/republishing this material for advertising or promotional purposes, creating new collective works, for resale or redistribution to servers or lists, or reuse of any copyrighted component of this work in other works. Fig. 1. All 13 possible connected non-isomorphic triadic subgraphs (subgraph patterns) in directed unweighted networks. the relation is of romantic type. Similarly, triadic closure, or the large clustering coefficient observed in many networks, hints at a dependence between the connections in a network. Generalizing these ideas, during the last decade the systematic study of higher order sub-network structure has attracted much attention [7], [8], [9], [10], [11], [12]. Subgraph patterns which occur significantly more often than expected at random, so called motifs, have been hypothesized to serve as the acutal building blocks of many network topologies [7]. The framework commonly applied to analyze local network structure detects an average over- or underrepresentation of subgraph patterns for the whole system. Yet, especially for larger complex networks, there may be areas in which one structural pattern is of importance, whereas in different regions other patterns are relevant. The contribution of this work is to overcome this limitation by introducing a framework for node- specific pattern mining. More specifically, instead of mining frequent subgraph patterns of the whole system, we investigate the neighborhood of every single node separately. I.e. for every node we consider only triads it participates in. In this paper, we further apply our new tool to multiple real-world data sets by analyzing their node-specific triad patterns. We show that for many systems their motifs are distributed highly heterogenously. The remainder of this work will be organized as follows. In Section II we briefly review work related to the analysis of networks in terms of their local substructure. In Section III we describe our methodology of node-specific pattern mining. Results obtained from experiments on real datasets will be presented in Section IV. II. RELATED WORK In the context of local subgraph analysis, most attention has been devoted to the investigation of triadic subgraphs [7], [13], [8], [9], [10]. Apart from node permutations, there are 13 distinct connected triad patterns in directed unweighted arXiv:1410.1594v2 [cs.SI] 15 Jan 2015

Welcome message from author
This document is posted to help you gain knowledge. Please leave a comment to let me know what you think about it! Share it to your friends and learn new things together.
Transcript
Node-Specific Triad Pattern Mining forComplex-Network Analysis
Marco WinklerInstitute for Theoretical Physics
University of WuerzburgAm Hubland, 97074 Wuerzburg, GermanyEmail: [email protected]
Joerg ReichardtInstitute for Theoretical Physics
University of WuerzburgAm Hubland, 97074 Wuerzburg, GermanyEmail: [email protected]
Abstract—The mining of graphs in terms of their local sub-structure is a well-established methodology to analyze networks.It was hypothesized that motifs - subgraph patterns which appearsignificantly more often than expected at random - play a keyrole for the ability of a system to perform its task. Yet theframework commonly used for motif-detection averages over thelocal environments of all nodes. Therefore, it remains unclearwhether motifs are overrepresented in the whole system or onlyin certain regions.
In this contribution, we overcome this limitation by miningnode-specific triad patterns. For every vertex, the abundance ofeach triad pattern is considered only in triads it participates in.We investigate systems of various fields and find that motifs aredistributed highly heterogeneously. In particular we focus on thefeed-forward loop motif which has been alleged to play a keyrole in biological networks.
I. INTRODUCTION
The concept of networks has been successfully applied tomodel the interactions between entities in complex systems ofvarious fields. The topological structure of interactions amongthe constituents of complex many particle systems is intimatelylinked to system function and global system properties. Amajor branch of networks research aims to elucidate this linkbetween structure and function.
Generally, pairwise relations between nodes, so-calleddyads, are considered the fundamental building blocks ofcomplex networks. Erdos-Renyi graphs [1], the configurationmodel [2], stochastic block models [3], [4], [5] and degreecorrected block models [6] all fall into the class of dyadicmodels. The basic assumption underlying dyadic models isthat dyads are conditionally independent given the model’sparameters.
However, the assumption of dyadic independence as ageneral paradigm of network modeling seems questionable.For example, in a social context, the idea that the relationof Alice and Bob be independent from the relation of Aliceand Charlie seems to go against experience, especially if
Published in IEEE ICDMW 2014. c©2014 IEEE. Personal use of this mate-rial is permitted. Permission from IEEE must be obtained for all other uses, inany current or future media, including reprinting/republishing this material foradvertising or promotional purposes, creating new collective works, for resaleor redistribution to servers or lists, or reuse of any copyrighted component ofthis work in other works.
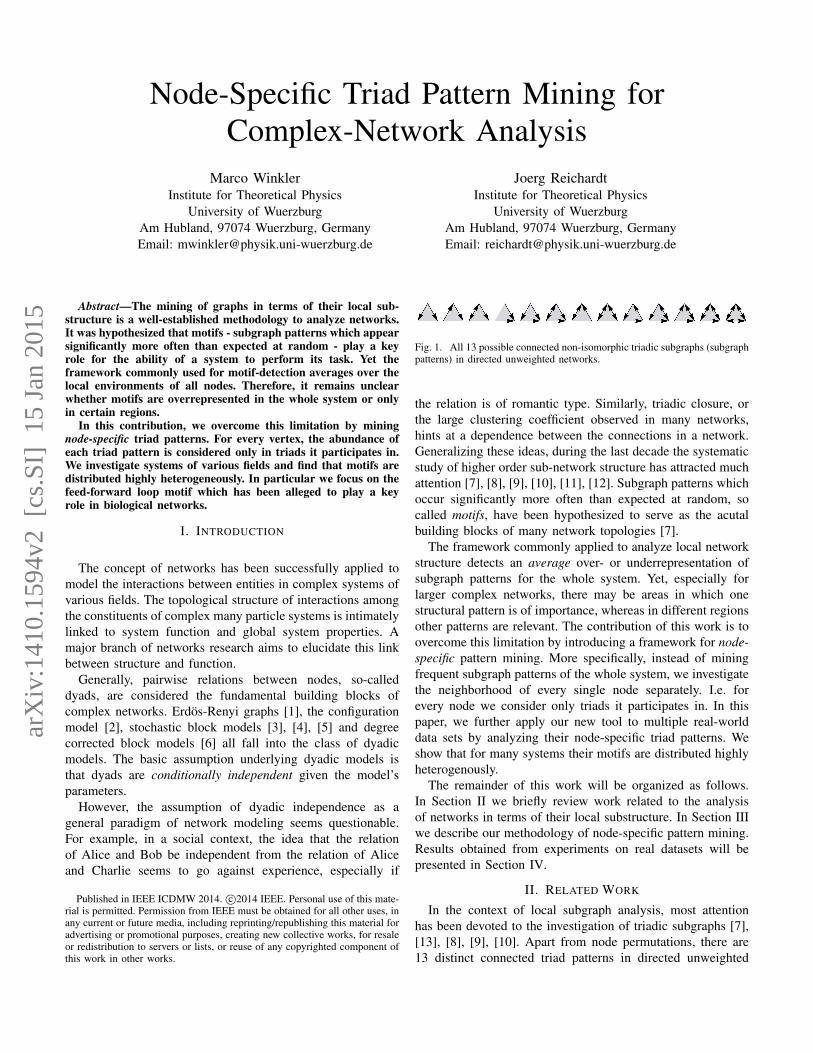
Fig. 1. All 13 possible connected non-isomorphic triadic subgraphs (subgraphpatterns) in directed unweighted networks.
the relation is of romantic type. Similarly, triadic closure, orthe large clustering coefficient observed in many networks,hints at a dependence between the connections in a network.Generalizing these ideas, during the last decade the systematicstudy of higher order sub-network structure has attracted muchattention [7], [8], [9], [10], [11], [12]. Subgraph patterns whichoccur significantly more often than expected at random, socalled motifs, have been hypothesized to serve as the acutalbuilding blocks of many network topologies [7].
The framework commonly applied to analyze local networkstructure detects an average over- or underrepresentation ofsubgraph patterns for the whole system. Yet, especially forlarger complex networks, there may be areas in which onestructural pattern is of importance, whereas in different regionsother patterns are relevant. The contribution of this work is toovercome this limitation by introducing a framework for node-specific pattern mining. More specifically, instead of miningfrequent subgraph patterns of the whole system, we investigatethe neighborhood of every single node separately. I.e. forevery node we consider only triads it participates in. In thispaper, we further apply our new tool to multiple real-worlddata sets by analyzing their node-specific triad patterns. Weshow that for many systems their motifs are distributed highlyheterogenously.
The remainder of this work will be organized as follows.In Section II we briefly review work related to the analysisof networks in terms of their local substructure. In Section IIIwe describe our methodology of node-specific pattern mining.Results obtained from experiments on real datasets will bepresented in Section IV.
II. RELATED WORK
In the context of local subgraph analysis, most attentionhas been devoted to the investigation of triadic subgraphs [7],[13], [8], [9], [10]. Apart from node permutations, there are13 distinct connected triad patterns in directed unweighted
arX
iv:1
410.
1594
v2 [
cs.S
I] 1
5 Ja
n 20
15
networks as shown in Figure 1. It was found that certainpatterns of third-order subgraphs occur significantly morefrequently than expected in an ensemble of networks with thesame degree distributions as the original network.
Over- and underrepresentation of pattern i in a graph isquantified through a Z-score
Zi =Noriginal,i − 〈Nrand,i〉
σrand,i. (1)
Noriginal,i is the number of appearances of pattern i over allpossible 3-tuples of nodes in the original network. Samplingfrom the ensemble of randomized networks yields the averageoccurrence 〈Nrand,i〉 of that pattern and the respective standarddeviation σrand,i. Thus, the Z-scores represent a measure forthe significance of an over- or underrepresentation for eachpattern i shown in Figure 1.
Hence, every network can be assigned a vector ~Z whosecomponents comprise the Z-scores of all possible triad pat-terns. Significant patterns are referred to as ’motifs’ [7]. Fur-ther, one commonly refers to the normalized Z-vector as the’significance profile’, ~SP = ~Z/
√∑i Z
2i . This normalization
makes systems of different sizes comparable [7].A multitude of real-world systems has been examined in
terms of their triadic Z-score profiles [8], [14], [15], [16] and itwas found that systems with similar tasks tend to have similarZ-score profiles and thus exhibit the same motifs. Therefore, itwas conjectured that their structural evolution may have beendetermined by the relevance of these motif patterns. Hence,motifs, rather than independent links, have been suspected toserve as the basic entities of complex network structure [7]. Inparticular, the role of the ’feed-forward loop’ pattern ( ) hasbeen discussed intensively in the field [13], [17], [18], [19].It has been alleged to play a key role for systems to reliablyperform information-processing tasks.
However, there has also been ongoing discussion about theexpressive power of the subgraph-analysis described above[20]. E.g. latent-variable models might offer an explanation formany of the observed motif distributions. The randomizationemployed in the subgraph-mining process ignores all meso-scopic structure, potentially present in the system. Hence, partsof the non-vanishing Z-scores may stem from such structure[21], [22]. Comparison of a network with block structure to anull model which does not account for such groups may resultin over- or underrepresentations of patterns which are morethan less artifacts of the mesoscopic structure. It was furthershown that there are pairwise correlations in the Z-scoresof the subgraph patterns in Figure 1 which occur solely forstatistical reasons and therefore have to be taken into accountwhen interpreting the functional role of motif patterns [23],[24].
In the present work we aim to further unravel the role oftriad motifs in complex networks. We introduce a methodologyfor node-specific pattern mining which allows us to localizethe regions of a graph in which the instances of a motifpredominantely appear. Thus, it is possible to identify andremove the nodes and links which eventually make a certain
1 2 3 4 5 6 7 8 9 10 11 12 13 14 15
16 17 18 19 20 21 22 23 24 25 26 27 28 29 30
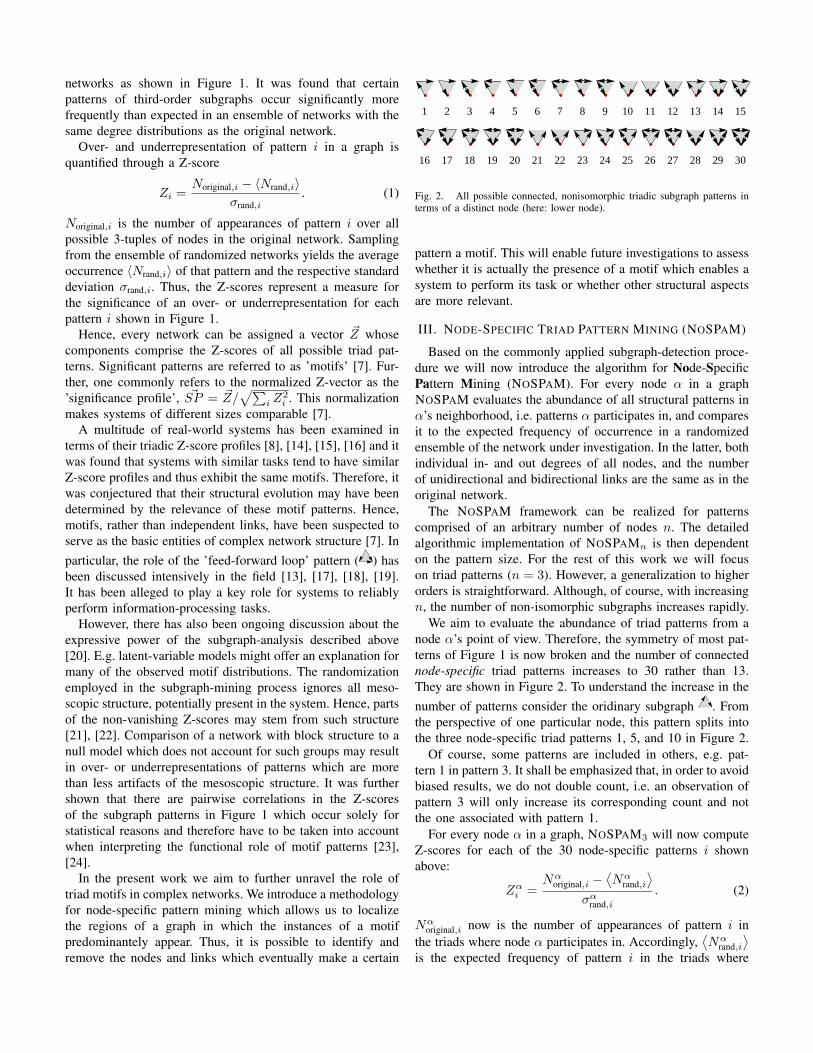
Fig. 2. All possible connected, nonisomorphic triadic subgraph patterns interms of a distinct node (here: lower node).
pattern a motif. This will enable future investigations to assesswhether it is actually the presence of a motif which enables asystem to perform its task or whether other structural aspectsare more relevant.
III. NODE-SPECIFIC TRIAD PATTERN MINING (NOSPAM)
Based on the commonly applied subgraph-detection proce-dure we will now introduce the algorithm for Node-SpecificPattern Mining (NOSPAM). For every node α in a graphNOSPAM evaluates the abundance of all structural patterns inα’s neighborhood, i.e. patterns α participates in, and comparesit to the expected frequency of occurrence in a randomizedensemble of the network under investigation. In the latter, bothindividual in- and out degrees of all nodes, and the numberof unidirectional and bidirectional links are the same as in theoriginal network.
The NOSPAM framework can be realized for patternscomprised of an arbitrary number of nodes n. The detailedalgorithmic implementation of NOSPAMn is then dependenton the pattern size. For the rest of this work we will focuson triad patterns (n = 3). However, a generalization to higherorders is straightforward. Although, of course, with increasingn, the number of non-isomorphic subgraphs increases rapidly.
We aim to evaluate the abundance of triad patterns from anode α’s point of view. Therefore, the symmetry of most pat-terns of Figure 1 is now broken and the number of connectednode-specific triad patterns increases to 30 rather than 13.They are shown in Figure 2. To understand the increase in thenumber of patterns consider the oridinary subgraph . Fromthe perspective of one particular node, this pattern splits intothe three node-specific triad patterns 1, 5, and 10 in Figure 2.
Of course, some patterns are included in others, e.g. pat-tern 1 in pattern 3. It shall be emphasized that, in order to avoidbiased results, we do not double count, i.e. an observation ofpattern 3 will only increase its corresponding count and notthe one associated with pattern 1.
For every node α in a graph, NOSPAM3 will now computeZ-scores for each of the 30 node-specific patterns i shownabove:
Zαi =Nα
original,i −⟨Nα
rand,i
⟩σαrand,i
. (2)
Nαoriginal,i now is the number of appearances of pattern i in
the triads where node α participates in. Accordingly,⟨Nα
rand,i
⟩is the expected frequency of pattern i in the triads where
node α is part of in the randomized ensemble. σαrand,i is thecorresponding standard deviation.
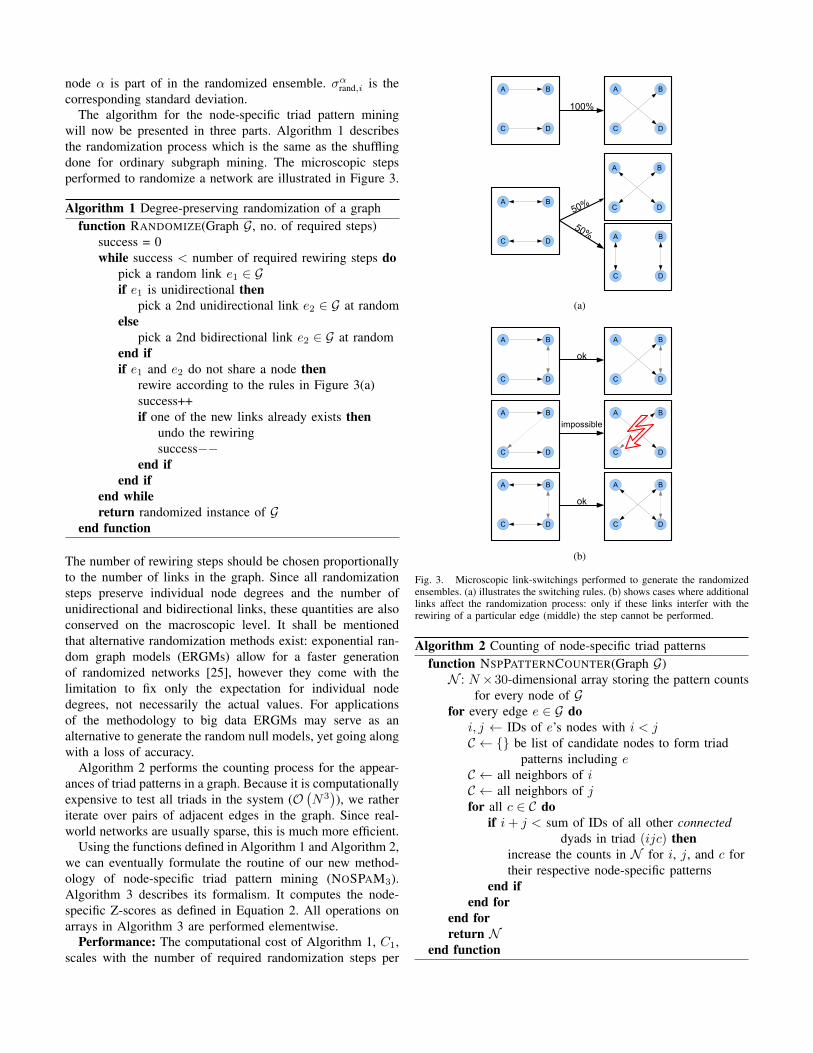
The algorithm for the node-specific triad pattern miningwill now be presented in three parts. Algorithm 1 describesthe randomization process which is the same as the shufflingdone for ordinary subgraph mining. The microscopic stepsperformed to randomize a network are illustrated in Figure 3.
Algorithm 1 Degree-preserving randomization of a graphfunction RANDOMIZE(Graph G, no. of required steps)
success = 0while success < number of required rewiring steps do
pick a random link e1 ∈ Gif e1 is unidirectional then
pick a 2nd unidirectional link e2 ∈ G at randomelse
pick a 2nd bidirectional link e2 ∈ G at randomend ifif e1 and e2 do not share a node then
rewire according to the rules in Figure 3(a)success++if one of the new links already exists then
undo the rewiringsuccess−−
end ifend if
end whilereturn randomized instance of G
end function
The number of rewiring steps should be chosen proportionallyto the number of links in the graph. Since all randomizationsteps preserve individual node degrees and the number ofunidirectional and bidirectional links, these quantities are alsoconserved on the macroscopic level. It shall be mentionedthat alternative randomization methods exist: exponential ran-dom graph models (ERGMs) allow for a faster generationof randomized networks [25], however they come with thelimitation to fix only the expectation for individual nodedegrees, not necessarily the actual values. For applicationsof the methodology to big data ERGMs may serve as analternative to generate the random null models, yet going alongwith a loss of accuracy.
Algorithm 2 performs the counting process for the appear-ances of triad patterns in a graph. Because it is computationallyexpensive to test all triads in the system (O
(N3)), we rather
iterate over pairs of adjacent edges in the graph. Since real-world networks are usually sparse, this is much more efficient.
Using the functions defined in Algorithm 1 and Algorithm 2,we can eventually formulate the routine of our new method-ology of node-specific triad pattern mining (NOSPAM3).Algorithm 3 describes its formalism. It computes the node-specific Z-scores as defined in Equation 2. All operations onarrays in Algorithm 3 are performed elementwise.
Performance: The computational cost of Algorithm 1, C1,scales with the number of required randomization steps per
A B
C D
A B
C D
A B
C D
A B
C D
A B
C D
50%
50%
100%
(a)
A B
C D
A B
C D
ok
A B
C D
A B
C D
impossible
A B
C D
A B
C D
ok
(b)
Fig. 3. Microscopic link-switchings performed to generate the randomizedensembles. (a) illustrates the switching rules. (b) shows cases where additionallinks affect the randomization process: only if these links interfer with therewiring of a particular edge (middle) the step cannot be performed.
Algorithm 2 Counting of node-specific triad patternsfunction NSPPATTERNCOUNTER(Graph G)N : N ×30-dimensional array storing the pattern counts
for every node of Gfor every edge e ∈ G do
i, j ← IDs of e’s nodes with i < jC ← {} be list of candidate nodes to form triad
patterns including eC ← all neighbors of iC ← all neighbors of jfor all c ∈ C do
if i+ j < sum of IDs of all other connecteddyads in triad (ijc) then
increase the counts in N for i, j, and c fortheir respective node-specific patterns
end ifend for
end forreturn N
end function
Algorithm 3 Node-specific triad pattern mining (NOSPAM3)
function NOSPAM(Graph G, # required rewiring steps,# randomized instances)Noriginal ← NSPPATTERNCOUNTER(G)Nrand ← {}Nsq,rand ← {}for # randomized instances doG ← RANDOMIZE(G, # required rewiring steps)counts ← NSPPATTERNCOUNTER(G)Nrand ← Nrand+ countsNsq,rand ← Nsq,rand+ counts ∗ counts
end forNrand ← Nrand/(#randomized instances)Nsq,rand ← Nsq,rand/(#randomized instances)σrand ←
√Nsq,rand − (Nrand ∗ Nrand)
Z ← (Noriginal −Nrand)/σrandreturn Z
end function
instance, which should be chosen proportionally to the numberof edges E in the graph G, i.e. C1 = O (E).
Algorithm 2 iterates over all edges of G and their adjacentedges. Therefore, it is C2 = O (E · kmax) ≤ O
(E2)
wherekmax is the maximum node degree in G. In real-world networkskmax is usually much smaller than E.
Finally, the total computational cost of NOSPAM3 (Al-gorithm 3) depends on the desired number of randomizednetwork instances I . Algorithm 2 is invoked (1 + I) times,Algorithm 1 is invoked I times. Hence, the total computationalcost is
CNOSPAM3= O (I · E · kmax) . (3)
Further, it shall be mentioned that NOSPAM3 is parallelize-able straightforwardly since the evaluations in terms of therandomized network instances can be executed independentlyof each other.
IV. RESULTS
We will now present results obtained from the application ofNOSPAM3 to peer-reviewed real-world datasets. All networksare directed and edges are treated as unweighted. An imple-mentation of the pattern-mining program is made publicallyavailable online [26].
Yeast transcriptional [27], [28]: 688 nodes, 1,079 edges.Transcriptional network of the yeast S. Cerevisiae. Nodes aregenes, edges point from regulating genes to regulated genes.It is not distinguished between activation and repression.
E. Coli transcriptional [27], [17]: 423 nodes, 519 edges.Nodes are operons, each edge is directed from an operon thatencodes a transcription factor to an operon that it directlyregulates (an operon is one or more genes transcribed on thesame mRNA).
Neural network of C. Elegans [29], [30]: 279 nodes,2,194 edges. Nodes are the neurons of the largest connected
component in the somatic nervous system. Edges describe thechemical synapses between the neurons.
Scientific citations [31], [32]: 27,700 nodes, 352,807 edges.Nodes are high-energy physics papers on the arXiv, submittedbetween January 1993 and April 2003. Edges from node A toB indicate that paper A cites paper B. Although it may seemunintuitive, there are papers citing each other.
Political blogs [33], [34]: 1,224 nodes, 19,025 edges.Largest connected component of a network where the nodesare political blogs. Edges represent links between the blogsrecorded over a period of two months preceding the 2004 USPresidential election.
French book [27], [8]: 8,325 nodes, 24,295 edges. Word-adjacency network of a French book. Nodes are words, anedge from node A to B indicates that word B directly followsword A at least once in the text.
Spanish book [27], [8]: 11,586 nodes, 45,129 edges. Word-adjacency network of a Spanish book.
A. Node-specific vs. ordinary triadic Z-score profiles
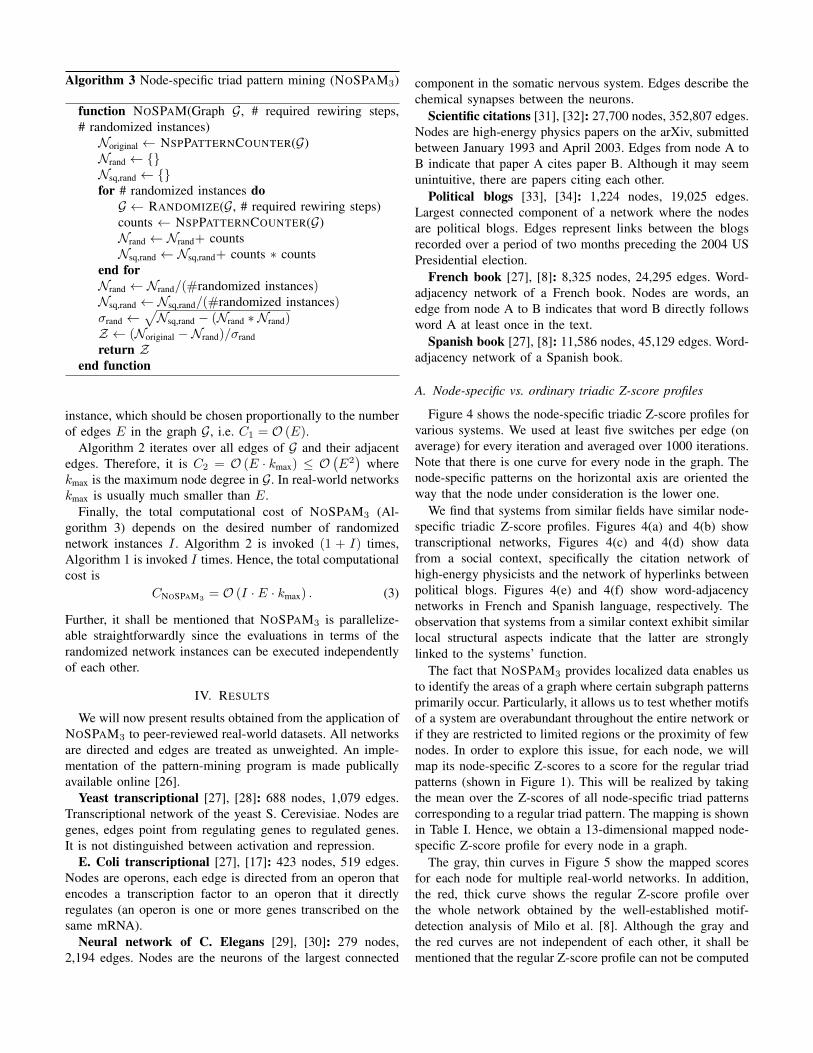
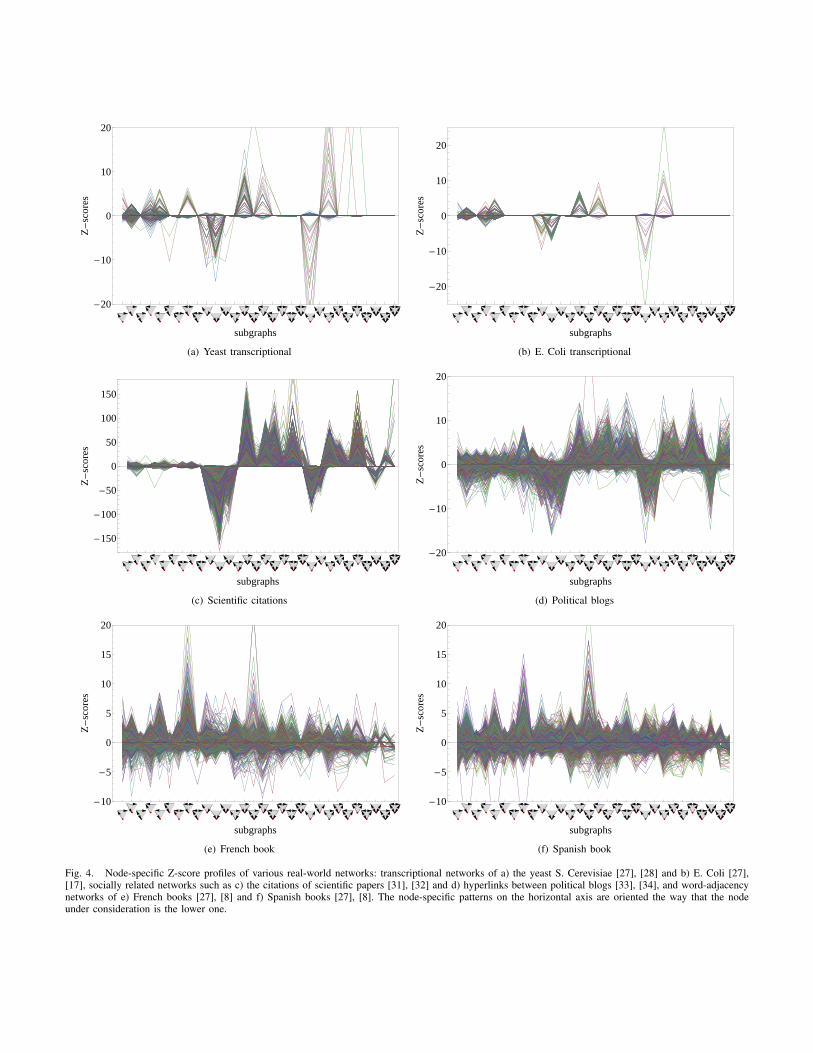
Figure 4 shows the node-specific triadic Z-score profiles forvarious systems. We used at least five switches per edge (onaverage) for every iteration and averaged over 1000 iterations.Note that there is one curve for every node in the graph. Thenode-specific patterns on the horizontal axis are oriented theway that the node under consideration is the lower one.
We find that systems from similar fields have similar node-specific triadic Z-score profiles. Figures 4(a) and 4(b) showtranscriptional networks, Figures 4(c) and 4(d) show datafrom a social context, specifically the citation network ofhigh-energy physicists and the network of hyperlinks betweenpolitical blogs. Figures 4(e) and 4(f) show word-adjacencynetworks in French and Spanish language, respectively. Theobservation that systems from a similar context exhibit similarlocal structural aspects indicate that the latter are stronglylinked to the systems’ function.
The fact that NOSPAM3 provides localized data enables usto identify the areas of a graph where certain subgraph patternsprimarily occur. Particularly, it allows us to test whether motifsof a system are overabundant throughout the entire network orif they are restricted to limited regions or the proximity of fewnodes. In order to explore this issue, for each node, we willmap its node-specific Z-scores to a score for the regular triadpatterns (shown in Figure 1). This will be realized by takingthe mean over the Z-scores of all node-specific triad patternscorresponding to a regular triad pattern. The mapping is shownin Table I. Hence, we obtain a 13-dimensional mapped node-specific Z-score profile for every node in a graph.
The gray, thin curves in Figure 5 show the mapped scoresfor each node for multiple real-world networks. In addition,the red, thick curve shows the regular Z-score profile overthe whole network obtained by the well-established motif-detection analysis of Milo et al. [8]. Although the gray andthe red curves are not independent of each other, it shall bementioned that the regular Z-score profile can not be computed
-20
-10
0
10
20
subgraphs
Z-
scor
es
(a) Yeast transcriptional
-20
-10
0
10
20
subgraphs
Z-
scor
es
(b) E. Coli transcriptional
-150
-100
-50
0
50
100
150
subgraphs
Z-
scor
es
(c) Scientific citations
-20
-10
0
10
20
subgraphs
Z-
scor
es
(d) Political blogs
-10
-5
0
5
10
15
20
subgraphs
Z-
scor
es
(e) French book
-10
-5
0
5
10
15
20
subgraphs
Z-
scor
es
(f) Spanish book
Fig. 4. Node-specific Z-score profiles of various real-world networks: transcriptional networks of a) the yeast S. Cerevisiae [27], [28] and b) E. Coli [27],[17], socially related networks such as c) the citations of scientific papers [31], [32] and d) hyperlinks between political blogs [33], [34], and word-adjacencynetworks of e) French books [27], [8] and f) Spanish books [27], [8]. The node-specific patterns on the horizontal axis are oriented the way that the nodeunder consideration is the lower one.
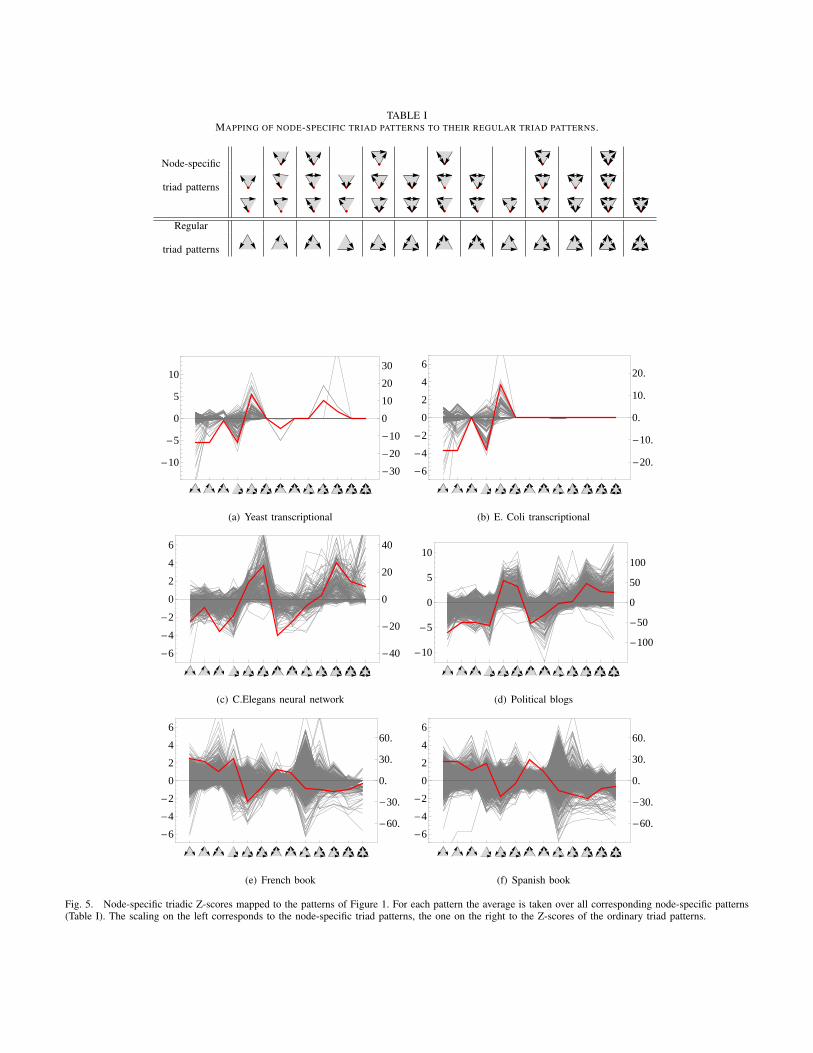
TABLE IMAPPING OF NODE-SPECIFIC TRIAD PATTERNS TO THEIR REGULAR TRIAD PATTERNS.
Node-specific
triad patterns
Regular
triad patterns
-10
-5
0
5
10
-30
-20
-10
0
10
20
30
(a) Yeast transcriptional
-6
-4
-2
0
2
4
6
-20.
-10.
0.
10.
20.
(b) E. Coli transcriptional
-6
-4
-2
0
2
4
6
-40
-20
0
20
40
(c) C.Elegans neural network
-10
-5
0
5
10
-100
-50
0
50
100
(d) Political blogs
-6
-4
-2
0
2
4
6
-60.
-30.
0.
30.
60.
(e) French book
-6
-4
-2
0
2
4
6
-60.
-30.
0.
30.
60.
(f) Spanish book
Fig. 5. Node-specific triadic Z-scores mapped to the patterns of Figure 1. For each pattern the average is taken over all corresponding node-specific patterns(Table I). The scaling on the left corresponds to the node-specific triad patterns, the one on the right to the Z-scores of the ordinary triad patterns.
from the gray curves directly. In particular it is not the meanof the latters.
It can be observed that even though a pattern may beoverrepresented referring to the system as a whole, it maystill be underrepresented in the neighborhood of certain nodes.Moreover, there are patterns with a rather low regular Z-score, while there are both nodes with a strong positive andnodes with a strong negative contribution to the pattern. Thesecontradictory effects seem to compensate each other on thesystem level. The decribed phenomenon can be particularlyobserved in the word-adjacency networks in Figures 5(e)and 5(f), especially for the loop pattern ( ).
B. Heterogeneity of motif distributions
To further investigate whether motifs appear homogenouslydistributed over a graph we will devote ourselves to the feed-forward loop (FFL) pattern ( ). The FFL is one of thepatterns which has been studied most intensively with respectto its relevance for systems to reliably perform their functions[13], [17], [18], [19]. Specifically in transcriptional regulationnetworks it was argued that the FFL pattern might playan important role for facilitating its information-processingtasks [13].
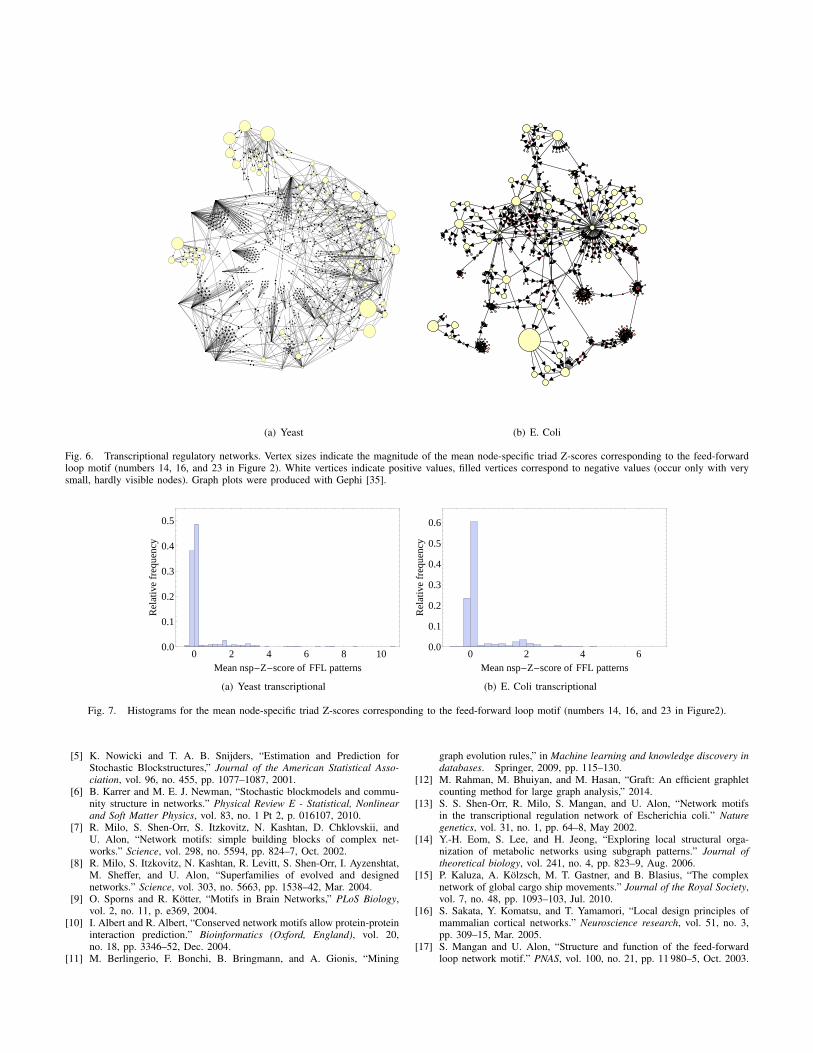
Figure 6 shows two of those transcriptional regulationnetworks. In both of them the FFL is a motif. Vertex sizesare scaled by the magnitude of the averaged node-specific Z-scores of the three patterns corresponding to the FFL. Positivecontributions are shown with bright vertices, negative ones arefilled (do only occur with very small magnitude, i.e. very smallnode sizes). Apparently there are no nodes in the networkswith a significant negative contribution to the FFL. Yet, neitheris the pattern homogenously overrepresented throughout thewhole system, although it is a motif. In fact, for most nodesthe FFL-subgraph structure does not seems to play any rolewhatsoever. In contrast, there are few nodes with a ratherstrong contribution to the FFL eventually making it a motif ofthe entire system.
This effect becomes even clearer when considering his-tograms over the nodes’ FFL contributions of the two systems.Figure 7(a) shows the histogram of S. Cerevisiae, Figure 7(b)the one of E. Coli. Both exhibit a strong peak around zeroindicating that most nodes do not participate in FFL structuressignificantly. Only very few nodes have a large mean node-specific triadic Z-score for the patterns corresponding to theFFL.
There are two potential implications which can be derivedfrom these observations: One could be that the FFL motif isactually not that important for the systems to work reliably.The second consequence could be that in fact very few nodesare critical for the system to work the way it is supposed todo. In the second case system would be very prone to failureof these crucial vertices. It may be subject to future researchto further investigate these possible implications for dynamicalprocesses on different topologies and under node failure.
V. CONCLUSIONS
With this work we have introduced a novel tool for theanalysis of complex networks in terms of their local sub-structure. Existing methods have focussed on the detectionof patterns, which appear more frequently than expected fora random null model, over the network as a whole. However,it has remained unclear whether these network motifs areoverrepresented homogenously over the systems or whetherthey are bound to the neighborhood of certain nodes in thenetworks.
To overcome this limitation we introduced the frameworkof node-specific pattern mining, NOSPAM. Rather than aver-aging over the local topology of the entire system, for everynode in the graph, we evaluate Z-score profiles which describethe nodes’ individual local topologies.
For the analyis of real-world data sets we appliedNOSPAM3 which analyzes the local topology in terms oftriadic subgraph patterns. We found that systems of similarfields tend to have similar node-specific triadic Z-score profilesindicating that local structural aspects are intimately connectedwith the systems’ function.
Considering the mean contribution of node-specific triadicZ-scores to their respective ordinary triad patterns we foundthat the appearance of certain subgraphs is distributed highlyheterougenously for many systems. This observation wassupported by investigating the appearance of the feed-forwardloop (FFL) pattern in more detail for transcriptional regulationnetworks in which it is a motif. The functional relevanceof the FFL for systems to properly perform their task hasbeen discussed intensively in complex networks research. Itwas conjectured that the FFL plays a key role for systemsto process information. The fact that it appears highly het-erogenously distributed over the graphs raises the questionabout its actual role for the systems. Will their function besignificantly shortened when these nodes fail or are motifs infact not important to such an extent? And how is the evolutionof dynamical processes on systems affected by nodes withcertain subgraph characteristics? To answer these questionswill be subject to future research.
It may be further promising to adapt the analysis to signednetworks in order to investigate issues related to social balanceresearch. Moreover, the NOSPAM analysis of a network yieldsa new set of structural features for each node. Using theseproperties as inputs for clustering, classification, or role-detection algorithms can give rise to a better understandingof network designs and to improve link prediction on graphs.
REFERENCES
[1] P. Erdos and A. Renyi, “On random graphs, I,” Publicationes Mathe-maticae (Debrecen), vol. 6, pp. 290–297, 1959.
[2] M. Molloy and B. Reed, “A critical point for random graphs with agiven degree sequence,” Random Structures & Algorithms, vol. 6, no.2-3, pp. 161–180, Mar. 1995.
[3] P. W. Holland, K. B. Laskey, and S. Leinhardt, “Stochastic blockmodels:First steps,” Social Networks, vol. 5, no. 2, pp. 109–137, Jun. 1983.
[4] Y. J. Wang and G. Y. Wong, “Stochastic Blockmodels for DirectedGraphs,” Journal of the American Statistical Association, vol. 82, no.397, pp. 8–19, 1987.
(a) Yeast (b) E. Coli
Fig. 6. Transcriptional regulatory networks. Vertex sizes indicate the magnitude of the mean node-specific triad Z-scores corresponding to the feed-forwardloop motif (numbers 14, 16, and 23 in Figure 2). White vertices indicate positive values, filled vertices correspond to negative values (occur only with verysmall, hardly visible nodes). Graph plots were produced with Gephi [35].
0 2 4 6 8 100.0
0.1
0.2
0.3
0.4
0.5
Mean nsp-Z-score of FFL patterns
Rel
ativ
efr
eque
ncy
(a) Yeast transcriptional
0 2 4 60.0
0.1
0.2
0.3
0.4
0.5
0.6
Mean nsp-Z-score of FFL patterns
Rel
ativ
efr
eque
ncy
(b) E. Coli transcriptional
Fig. 7. Histograms for the mean node-specific triad Z-scores corresponding to the feed-forward loop motif (numbers 14, 16, and 23 in Figure2).
[5] K. Nowicki and T. A. B. Snijders, “Estimation and Prediction forStochastic Blockstructures,” Journal of the American Statistical Asso-ciation, vol. 96, no. 455, pp. 1077–1087, 2001.
[6] B. Karrer and M. E. J. Newman, “Stochastic blockmodels and commu-nity structure in networks.” Physical Review E - Statistical, Nonlinearand Soft Matter Physics, vol. 83, no. 1 Pt 2, p. 016107, 2010.
[7] R. Milo, S. Shen-Orr, S. Itzkovitz, N. Kashtan, D. Chklovskii, andU. Alon, “Network motifs: simple building blocks of complex net-works.” Science, vol. 298, no. 5594, pp. 824–7, Oct. 2002.
[8] R. Milo, S. Itzkovitz, N. Kashtan, R. Levitt, S. Shen-Orr, I. Ayzenshtat,M. Sheffer, and U. Alon, “Superfamilies of evolved and designednetworks.” Science, vol. 303, no. 5663, pp. 1538–42, Mar. 2004.
[9] O. Sporns and R. Kotter, “Motifs in Brain Networks,” PLoS Biology,vol. 2, no. 11, p. e369, 2004.
[10] I. Albert and R. Albert, “Conserved network motifs allow protein-proteininteraction prediction.” Bioinformatics (Oxford, England), vol. 20,no. 18, pp. 3346–52, Dec. 2004.
[11] M. Berlingerio, F. Bonchi, B. Bringmann, and A. Gionis, “Mining
graph evolution rules,” in Machine learning and knowledge discovery indatabases. Springer, 2009, pp. 115–130.
[12] M. Rahman, M. Bhuiyan, and M. Hasan, “Graft: An efficient graphletcounting method for large graph analysis,” 2014.
[13] S. S. Shen-Orr, R. Milo, S. Mangan, and U. Alon, “Network motifsin the transcriptional regulation network of Escherichia coli.” Naturegenetics, vol. 31, no. 1, pp. 64–8, May 2002.
[14] Y.-H. Eom, S. Lee, and H. Jeong, “Exploring local structural orga-nization of metabolic networks using subgraph patterns.” Journal oftheoretical biology, vol. 241, no. 4, pp. 823–9, Aug. 2006.
[15] P. Kaluza, A. Kolzsch, M. T. Gastner, and B. Blasius, “The complexnetwork of global cargo ship movements.” Journal of the Royal Society,vol. 7, no. 48, pp. 1093–103, Jul. 2010.
[16] S. Sakata, Y. Komatsu, and T. Yamamori, “Local design principles ofmammalian cortical networks.” Neuroscience research, vol. 51, no. 3,pp. 309–15, Mar. 2005.
[17] S. Mangan and U. Alon, “Structure and function of the feed-forwardloop network motif.” PNAS, vol. 100, no. 21, pp. 11 980–5, Oct. 2003.
[18] S. Mangan, A. Zaslaver, and U. Alon, “The coherent feedforward loopserves as a sign-sensitive delay element in transcription networks.”Journal of molecular biology, vol. 334, no. 2, pp. 197–204, Nov. 2003.
[19] U. Alon, “Network motifs: theory and experimental approaches.” Naturereviews. Genetics, vol. 8, no. 6, pp. 450–61, Jun. 2007.
[20] Y. Artzy-Randrup, S. J. Fleishman, N. Ben-Tal, and L. Stone, “Commenton ”Network motifs: simple building blocks of complex networks” and”Superfamilies of evolved and designed networks”.” Science, vol. 305,no. 5687, p. 1107; author reply 1107, Aug. 2004.
[21] J. Reichardt, R. Alamino, and D. Saad, “The Interplay between Micro-scopic and Mesoscopic Structures in Complex Networks,” PLoS ONE,vol. 6, no. 8, p. e21282, Aug. 2011.
[22] M. E. Beber, C. Fretter, S. Jain, N. Sonnenschein, M. Muller-Hannemann, and M.-T. Hutt, “Artefacts in statistical analyses of networkmotifs: general framework and application to metabolic networks.”Journal of the Royal Society, vol. 9, no. 77, pp. 3426–35, Dec. 2012.
[23] R. Ginoza and A. Mugler, “Network motifs come in sets: Correlationsin the randomization process,” Physical Review E, vol. 82, no. 1, pp.1–6, Jul. 2010.
[24] M. Winkler and J. Reichardt, “Motifs in triadic random graphs basedon Steiner triple systems,” Physical Review E, vol. 88, no. 2, p. 022805,Aug. 2013.
[25] T. De Bie, “Maximum entropy models and subjective interestingness: anapplication to tiles in binary databases,” Data Mining and KnowledgeDiscovery, vol. 23, no. 3, pp. 407–446, 2011.
[26] M. Winkler, “Personal Website,” http://www.mwinkler.eu, 2014.[27] U. Alon, “Uri Alon Lab,” http://www.weizmann.ac.il/mcb/UriAlon/,
2012.[28] M. C. Costanzo, “YPDTM, PombePDTM and WormPDTM: model or-
ganism volumes of the BioKnowledgeTM Library, an integrated resourcefor protein information,” Nucleic Acids Research, vol. 29, no. 1, pp. 75–79, Jan. 2001.
[29] L. R. Varshney, B. L. Chen, E. Paniagua, D. H. Hall, and D. B.Chklovskii, “Structural properties of the Caenorhabditis elegans neu-ronal network.” PLoS computational biology, vol. 7, no. 2, p. e1001066,Jan. 2011.
[30] Z. Alton, L. Herndon, C. Crocker, R. Lints, and D. Hall,“http://www.wormatlas.org,” 2002-2012.
[31] J. Gehrke, P. Ginsparg, and J. Kleinberg, “Overview of the 2003 kddcup,” SIGKDD Explor. Newsl., vol. 5, no. 2, pp. 149–151, Dec. 2003.
[32] J. Leskovec, J. Kleinberg, and C. Faloutsos, “Graphs over time: Densi-fication laws, shrinking diameters and possible explanations,” in Proc.of the 11th ACM SIGKDD Internat. Conf. on Knowledge Discovery inData Mining. New York, NY, USA: ACM, 2005, pp. 177–187.
[33] M. E. J. Newman, “http://www-personal.umich.edu/∼mejn/netdata/,”2012.
[34] L. A. Adamic and N. Glance, “The political blogosphere and the 2004US election: divided they blog,” in Proceedings of the 3rd internationalworkshop on Link discovery. ACM, 2005, pp. 36–43.
[35] M. Bastian, S. Heymann, and M. Jacomy, “Gephi: An open sourcesoftware for exploring and manipulating networks,” International AAAIConference on Weblogs and Social Media, 2009.
Related Documents