† † † † • • • † hal-00300143, version 1 - 17 Jul 2008 Author manuscript, published in "IEICE Transactions on Communications E89-B, 2 (2006) 289-296" DOI : 10.1093/ietcom/e89-b.2.289

Welcome message from author
This document is posted to help you gain knowledge. Please leave a comment to let me know what you think about it! Share it to your friends and learn new things together.
Transcript
IEICE TRANS. COMMUN., VOL.E85�B, NO.2 FEBRUARY 20061
PAPER Special Issue on Multimedia QoS Evaluation and Management Technologies
No reference and reduced reference video quality metrics forend to end QoS monitoring
Patrick LE CALLET†, Christian VIARD-GAUDIN†, Stéphane PÉCHARD†,and Émilie CAILLAULT†, Nonmembers
SUMMARY This paper describes an objective measurementmethod designed to assess the perceived quality for digital videos.The proposed approach can be used either in the context of a re-duced reference quality assessment or in the more challengingsituation where no reference is available. In that way, it canbe deployed in a QoS monitoring strategy in order to controlthe end-user perceived quality. The originality of the approachrelies on the very limited computation resources which are in-volved, such a system could be integrated quite easily in a realtime application. It uses a convolutional neural network (CNN)that allows a continuous time scoring of the video. Experimentsconducted on di�erent MPEG-2 videos, with bit rates rangingfrom 2 to 6 Mbits/s, show the e�ectiveness of the proposed ap-proach. More speci�cally, a linear correlation criterion, betweenobjective and subjective scoring, ranging from 0.90 up to 0.95has been obtained on a set of typical TV videos in the case of areduced reference assessment. Without any reference to the orig-inal video, the correlation criteria remains quite satisfying sinceit still lies between 0.85 and 0.90, which is quite high with re-spect to the di�culty of the task, and equivalent and more insome cases than the traditional PSNR, which is a full referencemeasurement.key words: convolutional neural network, video quality assess-ment, MPEG 2, temporal pooling.
1. Introduction
Objective video quality assessment means to computeautomatically quality scores well correlated with theones given by human observers. Such metrics can pro-vide quality control of the compressed images and moregenerally Quality of Service (QoS) for image transmis-sion and especially broadcasting. Image quality metricscan be divided in three categories :
• full reference metrics (FR), which require the orig-inal image and the distorted image,
• reduced reference metrics (RR), which require adescription into some parameters of the originalimage and of the distorted image,
• and, no reference (NR) metrics, which only requirethe distorted image.
FR metrics have been intensively studied in liter-ature. Ideally, they should be generic (suitable for any
Manuscript received April 20, 2005.Manuscript revised August 12, 2005.Final manuscript received October 19, 2005.†The authors are with IRCCyN, University of Nantes,
France
kind of distortions) and so allow coding schemes com-parison. A particularly important issue in multimediastreaming application refers to in-service metrics withno-intrusive set-up, which allow to monitor and controlsystems while they are in operation. In such broad-casting purpose, with an emitter and a receiver, onlyRR and NR metrics are convenient for QoS monitor-ing since transmitting the whole reference image is notrealistic at all. For such applications, NR metrics arethe best choices since no extra data is added to the bit-stream. The fact that neither the full reference video,nor some of its features are available for comparisonmakes an accurate assessment much more di�cult. RRmetrics represent good alternatives since the reducedreference can be coded and embedded in the bitstreamand therefore constitutes a practical approach to qual-ity evaluation, as long as the reduced reference size isnot too large.
Other important issues in QoS monitoring are thecomplexity and the real time exploitation of the qualityscore. One may preferred to get one score for a longduration sequence (typically height seconds as in FRVQEG Test plan) while one may required to get qualityscore more often (one or two scores per second).
This paper presents metrics for color video qualityassessment that provide quality values at a rate of twoscores per second according to the data obtained fromsubjective tests under a SSCQE protocol with hiddenreference removal and used for the performance assess-ment of the proposed metric. The video quality assess-ment system proposed in this work can be consideredeither as a NR metric or as a RR metric. In both cases,it corresponds to a very light system, allowing real timeprocessing. In the RR case, since it is based on com-parison of representations at both encoder and decoderside (only at the decoder side for NR), we have takencare to compute low complexity feature on the decoderside. Low complexity is not necessary at the encoderside since features can be computed o�-line. Obviously,the RR system can be a much more accurate metric.
Section 2 gives a short overview of methods forobjective quality assessment of videos that have beenproposed in the literature. The proposed system is pre-sented in section 3, whereas section 4 focuses on theneural network architecture. Section 5 reports on ex-perimental results, demonstrating the method opera-
hal-0
0300
143,
ver
sion
1 -
17 J
ul 2
008
Author manuscript, published in "IEICE Transactions on Communications E89-B, 2 (2006) 289-296" DOI : 10.1093/ietcom/e89-b.2.289

2IEICE TRANS. COMMUN., VOL.E85�B, NO.2 FEBRUARY 2006
tion under di�erent conditions and for di�erent inputsources.
2. Related works
Peak Signal-to-Noise Ratio (PSNR) is currently widelyused as a universal objective quality metrics. How-ever, it is a pixel based �delity metric, which doesnot always match well with the perceived picture qual-ity. In the past decades, many objective quality met-rics for measuring video impairments have been inves-tigated [1]. Most of them used perceptual models tosimulate the human visual system (HVS) and weightthe impairments according to their visibility. Unfor-tunately, the HVS is so complex that existing percep-tual models could not match to the real HVS well, andthus could not provide accurate rating of video qual-ity. Another approach tried to exploit the propertiesof known artifacts, such as blocking artifacts, usingfeature extraction and model parameterization. Thisclass of measure method focuses on the particular typeof artifacts [2], [3] so it is normally more accurate thanperceptual model based metrics. Due to QoS moni-toring needs, such approach have been also proposedfor RR and NR video quality metric like in [4] and [5].However, it does not possess universality. Some authorsintend to overcome this limitation using hybrid systemsthat involve feature extraction of coding artifacts andneural network systems capable of learning human per-ception as available from subjective tests. For example,a neural-based approach tested on VQEG (Video Qual-ity Experts Group) test sequences is presented in [6].This system, which is of RR type, process a 20-inputfeature vector that is forwarded to a radial basis func-tion neural network (RBFNN) for classi�cation. Onelimitation of this system is that the sequential natureof video is not taken into account, the RBFNN pro-cess data coming from a single frame, which is not verylikely to correspond to HVS. With the work presentedhere, we extend the contribution of the NN, in order tomix the contribution of the features corresponding tosuccessive frames. We have recently [7] presented theadvantage of such an approach in the RR metric frame-work. In this paper, we not only extend the techniqueto the �eld of NR metric but also consider modi�cationof the previous RR metric to address low complexityrequirements for QoS monitoring.
3. The proposed video quality metric
Objective features are continuously extracted fromvideo streams on a frame-by-frame basis; they feedthe convolutional neural network estimating the cor-responding perceived quality. In order to take into ac-count color in our metric according to the human vi-sual system, we use at the front end of the featuresextraction a decomposition into the three components
Fig. 1 Proposed video quality assessment system
of the Krauskopf's color space [8]. So, each featureis computed on each of the three components of thecolor space. Each feature represents a scalar value forthe entire frame, so it corresponds to a full integra-tion along the spatial dimension. As can be seen inFig. 1, the same computations are done independentlyon both the distorted video sequence and the referencesequence, this is done in the case of the RR metric.But in the case of a NR metric, such a scheme allowsto restrict quite easily the system to the left part ofFig. 1.
We have selected from the literature [9]�[11] a setof N = 4 features that are well suited in order to sum upthe content of a frame. Voluntarily, these features havebeen chosen from models proposed for VQEG FR-TV I.They are probably not the best but our goal is to showthat the way to pool such features can considerablyimprove the performance of a quality metric compar-ing to usual method (linear combination or Minkowskisummation). Three of these features are totally contentdependent (regarding frequency and temporal content).The last feature is more focused on distortion a priorirelated to blocking e�ect. Each of these 4 features iscomputed independently on the three perceptual com-ponents, they are presented in more details in the nextsub-sections. Consequently, the global size of the fea-
hal-0
0300
143,
ver
sion
1 -
17 J
ul 2
008

LE CALLET et al.: NO REFERENCE AND REDUCED REFERENCE VIDEO QUALITY METRICS FOR END TO END QOS MONITORING3
ture vector describing every frame is at most 3×4 = 12features. For the RR metric, in order to preserve lowcomplexity at the decoder side, we have selected onlyone feature, so the global size of the feature vector isonly three scalar value.
3.1 Frequency content features (GHV and GHV P )
The two �rst features, termed as GHV and GHV P ,are derived from the work of [9], they represent thespectrum content of the videos. They have been pre-viously elaborated to detect the blurring artifacts butare also sensitive to tiling distortions. These twofeatures are computed from the two-dimensional his-togram SIH(r, q) where r is the magnitude of the gra-dient vector, and q is the orientation of the gradientvector with respect to the horizontal axis and SIH(r, q)is the number of pixels in the gradient image whose gra-dient radius and angle is r and q, respectively.
The feature GHV whose value increases as thenumber or sharpness of horizontal and vertical edgesincrease is given as:
GHV =1p
∑r
∑
θ
SIH(r, θ) · r (1)
with 0 < Ca ≤ r ≤ Cb and θ = kπ2 , (k = 0, 1, 2, 3) where
r and q are as de�ned above, Ca and Cb are clippinglimits and p is the number of pixels in the image.
In order to separate blurring from tiling, theGHV P feature that characterizes the edge content ofthe image without the inclusion of horizontal and ver-tical edges is also computed:
GHV P =1p
∑r
∑
θ
SIH(r, θ) · r (2)
with 0 < Ca ≤ r ≤ Cb and θ 6= kπ2 , (k = 0, 1, 2, 3).
3.2 Temporal content feature: Power of frame di�er-ence (P )
The next extracted feature, P , is derived from thework of [10]. They consider the following distortions:�icker, jadder, moving blurred images, random noiseand edge jitter, and de�ne linear combinations of somedistortion factors using properties of visual perception.These combinations, which are explicitly de�ned intheir work, are based on the power of the frame dif-ference images computed respectively on the originaland on the distorted video sequences. In our work,we will just keep the computation of the power of theframe di�erence and use it as an input feature for theNN. It will be the responsibility of the NN to model thedistortions. The following computations are proceeded:
Frame di�erence:
d(t, m, n) = I(t,m, n)− I(t− 1,m, n) (3)
Power of frame di�erence:
P (t) =all∑
m,n
{d(t, m, n)}2 (4)
3.3 Blocking measure (B)
This last measurement is mainly dedicated to exhibitblocking e�ects. It is based on the method proposedin [11], which has been recently simpli�ed [12]. Theyapply 1-D FFTs to horizontal and vertical di�erence sig-nals or rows and columns in the image to estimate theaverage horizontal and vertical power spectra. Peaks inthese spectra due to 8×8 block structures are identi�edby their locations in the spectra. The power spectraof the underlying non-blocky images are approximatedby median-�ltering these curves. The overall blocki-ness measure, feature B, is then computed as the dif-ference between these power spectra at the locationsof the peaks. Integration of masking e�ects is possi-ble with this scheme while it has not been used in ourimplementation.
4. Neural network architecture
The last stage of the system, presented in Fig. 1, cor-responds to the feature combination and the temporalpooling of the feature vector sequence. Designing such amodel is not straightforward. Ideally, approaches basedon models of the human visual system (HVS) are themost general and potentially most accurate ones [13].However, the HVS is extremely complex, and many ofits properties are still not well understood today, specif-ically when one desires to take into account the tempo-ral dimension of videos. Besides, implementing thesemodels is computationally expensive due to their com-plexity.
To overcome these di�culties, we propose to basethis function on a learning algorithm that will be capa-ble of generalizing the observed behavior from a collec-tion of subjective tests. As a trade-o� between an ex-plicit model that would require an in-depth knowledgeof the HVS and a complete black-box system ignoringall the a priori knowledge, we introduced a neural net(NN) approach using a constrained architecture that iswell suited to mimic the temporal integration of dis-tortions. This architecture corresponds to a time delayneural network (TDNN), which performs convolutionfunctions on the video sequence. It allows to model thefollowing behaviors [14]: 1) assessor's reaction timesare subject to delays; 2) time-consecutive frames tendto interfere with one another, and 3) the most recentframes of a sequence have a greater e�ect on the overallquality rating. The idea is to perform the same kind ofcomputation at every place in the video stream basedon a local receptive �eld. This is typically the prin-ciples involved with convolutional NN (CNN) [15]. In
hal-0
0300
143,
ver
sion
1 -
17 J
ul 2
008

4IEICE TRANS. COMMUN., VOL.E85�B, NO.2 FEBRUARY 2006
our case, the convolution kernels will be de�ned alongthe temporal axis, leading to the so-called Time DelayNeural Network (TDNN). TDNNs are well suited to se-quential signal processing [16]. They allow to preservethe sequential nature of data, in contrast with stan-dard multilayer perceptron (MLP) where the topologyof the input is entirely ignored. On the contrary, videosequences have a strong local structure: frames that aretemporally nearby are highly correlated. Local corre-lations are the reasons for the well-known advantagesof extracting and combining local features before pro-cessing temporal objects. With CNN, a given neurondetects a particular local feature of the video stream.It performs a weighted sum of its inputs followed bya non-linear squashing function (sigmoid). Its recep-tive �eld is restricted to a limited time window. Thesame neuron is reused along the time axis to detectthe presence or absence of the same feature at di�erentposition of the video stream. A complete convolutionallayer is composed of several feature maps, so that multi-ple features can be extracted at each temporal position.This weight sharing technique greatly reduces the num-ber of free parameters and hence trained networks runmuch faster and require much less memory than fullyconnected NN. With local receptive �elds, neurons canextract elementary visual distortions in videos. Thesedistortions are then combined by the subsequent layersin order to detect high-order features.
In addition to the TDNN layers, the upper layersare standard fully connected layers. With this appli-cation, the last layer consists of a single neuron fullyconnected to the previous layer; the output of this neu-ron will be trained to estimate the Di�erential MeanOpinion Score (DMOS) value as it has been computedfrom human observers subjective scoring. A detailedview of the TDNN architecture is presented in Fig. 2.
The weight matrixes w, where indexes l, f , and t inFig. 2 refer to layer, feature, and time position withinthe architecture, are learnt during the training step. Ituses a standard stochastic gradient back-propagationalgorithm adapted to respect the constraints of weightsharing [17]. The main change here is the computa-tion of the local gradient of the backpropagated errorsignal with respect to the shared weights. Consideringthat every feature contains in fact a single neuron withmultiple instances, the local gradient for this neuronis simply the summation of the local gradients over allinstances of it [15].
From this general architecture, many parametershave to be de�ned to customize a speci�c learning ma-chine. Di�erent values for these parameters have beenexperimented, the selected values being given below:
• number of layers of the extraction sub-system (2),• size of one layer with respect to the time axis (T =
125 frames, i.e. 5s),• size of one layer with respect to the feature axis
Fig. 2 Generic TDNN architecture
(nb_feat = 20),• size of the convolution �eld with respect to the
time axis (field = 20),• temporal delay between two convolution �elds
(delay = 5),• number of layers of the MLP sub-system (3),• numbers of neurons of the hidden layer (50).
For example, the number of layers has been setglobally to 4, including 2 layers for the local featureextraction sub-system, and 3 for the fully connectedNN at the upper level, which correspond to one inputlayer � actually, the output layer of the TDNN sub-system, one hidden layer and an output layer with asingle neuron. Time e�ect on the visual system is cer-tainly di�cult to model precisely. We assumed thatbeyond 5 seconds there is no signi�cant contribution tothe continuous perceived quality, it is the upper limitthat our model enables. The NN has then the respon-sibility to weight accordingly the di�erent frames em-bedded within this 5 second sequence. Consequently,the value of T , which refers to the number of framesinvolved in the computation of a score, has been set toT = 5s×25 f/s = 125 frames.
5. Experimental results
5.1 Material available for training and testing
In order to train the TDNN we have used subjectivequality assessment material provided by TDF. Thismaterial is composed of four reference videos of about
hal-0
0300
143,
ver
sion
1 -
17 J
ul 2
008

LE CALLET et al.: NO REFERENCE AND REDUCED REFERENCE VIDEO QUALITY METRICS FOR END TO END QOS MONITORING5
Video # Bit rates # video Averagename video (Mbits/s) scoring CI/2 %Cooking 4 2, 3, 3.5, 5 1440 13.7Football 6 2, 3, 3.5, 4, 5, 6 2160 13.2Horses 4 2, 2t, 3, 3t 1440 14.2
t = transcodedRoad 3 2, 3, 6 1080 13.1
Table 1 Video sequences
three minutes long, (named Road, Cooking, Horses andFootball), and 17 di�erent distorted sequences, each ofthem corresponding to encoded and/or transcoded ref-erence videos in MPEG2 at di�erent rates (see Tab. 1for details). For all of these video sequences, TDF hasprovided the corresponding subjective assessments re-sults obtained with human observers. Subjective testswere running with 15 observers using a SSCQE protocolwith hidden reference removal in normalized conditionsand environment according to recommendations ITU-R BT.500-10. Subjective scores (MOS) consist of aquality rating sampled twice a second. It is easy to de-rive DMOS (di�erence of MOS between two conditions)with an associated Con�dence Interval (CI) obtainedaccording to subjective measurement procedures. Inour case, the reference sequence has been produced byTDF using a MPEG codec at a bit rate of 8 Mbits/swhich ensures a very high quality, although in somecircumstances, impairments could be perceptible whencompared with the uncompressed original videos. So,the system is �tted in order to compare quality lossbetween 8 Mbits/s and more severe rates.
To share this material between a training and atesting database, a separate video content is associatedwith the training and the testing video sequences. Con-sidering the four sets of video contents (Road, Cooking,Horses and Football), sequentially, we trained the sys-tem on three out four of these sequences and testedit on the remaining sequences. For example: Foot-ball, Horses, Road (13 videos) compose the trainingset, and the test set is composed of the remaining groupof videos, in this case: Cooking (4 videos). With thisprocedure, we are sure that the sets of images of thetraining set and test set come from disjoint video con-tents.
5.2 PSNR performance
Although Peak-Signal-to-Noise-Ratio (PSNR) is a FRindicator to assess the quality of reconstructed images,it has the advantage of being an easy and well knownmeasurement to evaluate the performance of a com-pression technique. Table 2 provides the absolute valueof the Linear Correlation Coe�cient (LCC), betweenDMOS and PSNR for the four testing databases. Weproduce two PSNR values per second by computing themean of the obtained frame by frame PSNR for half asecond.
Test Cooking Football Horses Roaddatabase
LCC 0.915 0.863 0.875 0.788PSNR/DMOS
Table 2 Full Reference PSNR metric
Fig. 3 PSNR metric, scatter gram of Road videos
5.3 Quality assessment results
As a measure of performance of the proposed objec-tive scoring method, three main indicators will be pre-sented. One will be the root mean squared error on thetest set, de�ned as:
Jrmse =
√√√√ 1N
N∑t=1
Jt (5)
where N is the number of scores computed on the testvideo sequences, and Jt is the network cost function,which is expressed as:
Jt = (DMOSt −Gt)2 (6)
where DMOSt is the actual subjective score derivedexperimentally from the panel of observers and Gt isthe output of the TDNN.
The second indicator is the Linear Correlation Co-e�cient (LCC), which expresses the monotony betweenDMOS and objective scoring. The third one representsthe percentage of the marks given by the TDNN thatlays inside ± CI
2 con�dence interval margins (Count).For PSNR, it is only possible to compute LCC.
We have conducted two main sets of experiments.The �rst one is dedicated to evaluate the NR system,where only features extracted from the distorted videosare used, the number of which being 12 per frame(3×4 = 12). Synthesized results are given in Tab. 3 forthe four possible test sets, and a more detailed exampleis illustrated in Fig. 4 and 5. From Tab. 3, it can be
hal-0
0300
143,
ver
sion
1 -
17 J
ul 2
008
6IEICE TRANS. COMMUN., VOL.E85�B, NO.2 FEBRUARY 2006
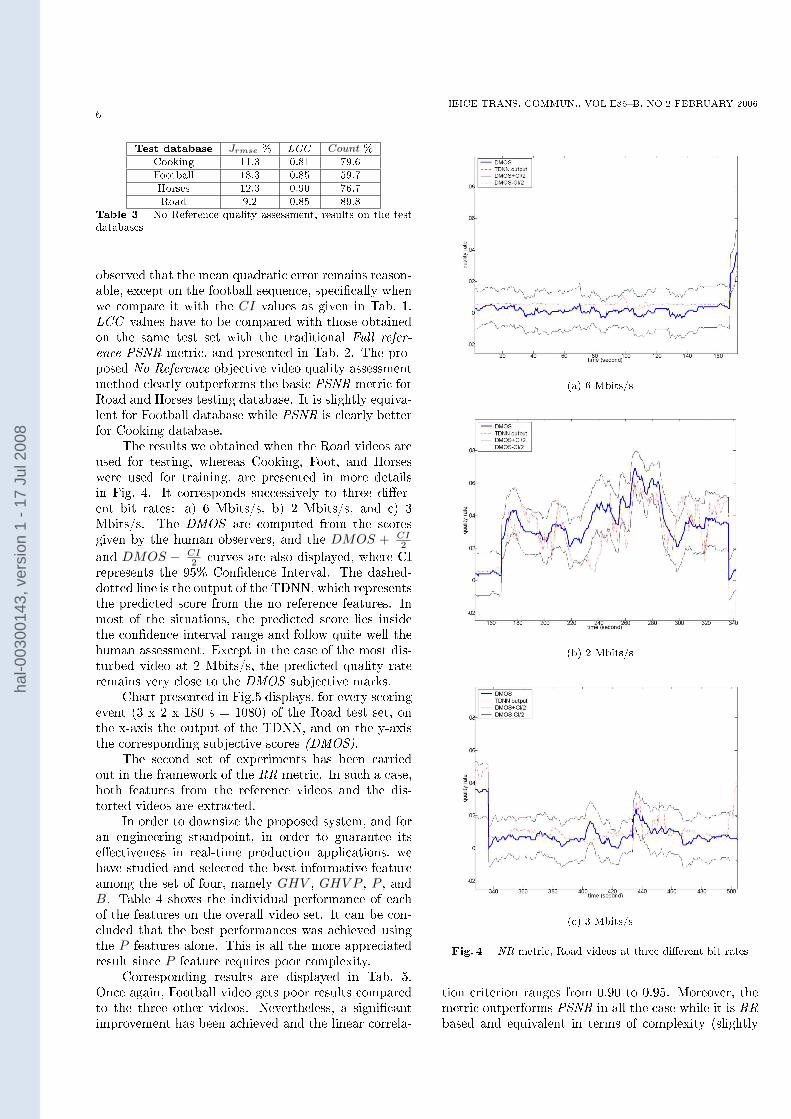
Test database Jrmse % LCC Count %Cooking 11.3 0.81 79.6Football 18.3 0.85 59.7Horses 12.3 0.90 76.7Road 9.2 0.85 89.8
Table 3 No Reference quality assessment, results on the testdatabases
observed that the mean quadratic error remains reason-able, except on the football sequence, speci�cally whenwe compare it with the CI values as given in Tab. 1.LCC values have to be compared with those obtainedon the same test set with the traditional Full refer-ence PSNR metric, and presented in Tab. 2. The pro-posed No Reference objective video quality assessmentmethod clearly outperforms the basic PSNR metric forRoad and Horses testing database. It is slightly equiva-lent for Football database while PSNR is clearly betterfor Cooking database.
The results we obtained when the Road videos areused for testing, whereas Cooking, Foot, and Horseswere used for training, are presented in more detailsin Fig. 4. It corresponds successively to three di�er-ent bit rates: a) 6 Mbits/s, b) 2 Mbits/s, and c) 3Mbits/s. The DMOS are computed from the scoresgiven by the human observers, and the DMOS + CI
2
and DMOS − CI2 curves are also displayed, where CI
represents the 95% Con�dence Interval. The dashed-dotted line is the output of the TDNN, which representsthe predicted score from the no reference features. Inmost of the situations, the predicted score lies insidethe con�dence interval range and follow quite well thehuman assessment. Except in the case of the most dis-turbed video at 2 Mbits/s, the predicted quality rateremains very close to the DMOS subjective marks.
Chart presented in Fig.5 displays, for every scoringevent (3 x 2 x 180 s = 1080) of the Road test set, onthe x-axis the output of the TDNN, and on the y-axisthe corresponding subjective scores (DMOS).
The second set of experiments has been carriedout in the framework of the RR metric. In such a case,both features from the reference videos and the dis-torted videos are extracted.
In order to downsize the proposed system, and foran engineering standpoint, in order to guarantee itse�ectiveness in real-time production applications, wehave studied and selected the best informative featureamong the set of four, namely GHV , GHV P , P , andB. Table 4 shows the individual performance of eachof the features on the overall video set. It can be con-cluded that the best performances was achieved usingthe P features alone. This is all the more appreciatedresult since P feature requires poor complexity.
Corresponding results are displayed in Tab. 5.Once again, Football video gets poor results comparedto the three other videos. Nevertheless, a signi�cantimprovement has been achieved and the linear correla-
(a) 6 Mbits/s
(b) 2 Mbits/s
(c) 3 Mbits/s
Fig. 4 NR metric, Road videos at three di�erent bit rates
tion criterion ranges from 0.90 to 0.95. Moreover, themetric outperforms PSNR in all the case while it is RRbased and equivalent in terms of complexity (slightly
hal-0
0300
143,
ver
sion
1 -
17 J
ul 2
008

LE CALLET et al.: NO REFERENCE AND REDUCED REFERENCE VIDEO QUALITY METRICS FOR END TO END QOS MONITORING7
Fig. 5 NR metric, scatter gram of Road videos (1080 points)
Feature selected Jrmse % LCC Count %GHV 11.9 0.83 73.1
GHV P 11.2 0.86 77.5P 9.6 0.91 79.1B 13.8 0.78 67.1
Table 4 Feature sensitivity w.r.t to Reference quality assess-ment, results on the global test database
Test database Jrmse % LCC Count %Cooking 6.11 0.95 90.1Football 12.9 0.94 61.6Horses 6.8 0.95 87.6Road 7.8 0.90 92.0
Table 5 Reduced Reference quality assessment, results on eachvideo of the test databases
more due to the Neural Network propagation). The re-sults we obtained when the four Road videos are usedfor testing (last row of Table 5), whereas Cooking, Foot-ball, and Horses were used for training, are presentedin Fig. 6.
Figure 7 clearly illustrates the high correlationrate, which reaches 0.90, between the subjective DMOSvalues and the objective values computed with the pro-posed RR metric.
6. Conclusion
In this paper, we have demonstrated that TDNN can beused to asses the perceived quality of video sequencesby realizing a non-linear mapping between non subjec-tive features extracted on the video frames and sub-jective grades. More generally, it provides a methodto combine features and to achieve temporal pooling.The method could be easily declined with other fea-tures. We have validated our approach using quitea large database that is composed of di�erent videocontents and di�erent bit rates. Reference videos wasbased on a 8 Mbits/s bit rate whereas distorted videoshave been produced with a bit rate varying from 2 to 6
(a) Road video, 6 Mbits/s
(b) Road video, 2 Mbits/s
(c) Road video, 3 Mbits/s
Fig. 6 RR metric, Road videos at three di�erent bit rates
Mbits/s. On the test set, which was independent of thelearning set, a linear correlation criteria ranging from0.90 to 0.95 has been obtained between the output of
hal-0
0300
143,
ver
sion
1 -
17 J
ul 2
008

8IEICE TRANS. COMMUN., VOL.E85�B, NO.2 FEBRUARY 2006
Fig. 7 RR metric, scatter gram of Road videos (1080 points)
the RR system and the subjective score provided byhuman observers. When we restrict the inputs to thefeatures coming from the distorted videos in order tode�ne a fully NR system, the correlation drops downto 0.85-0.90, it is still higher than the PSNR measure-ment, which was between 0.78 and 0.91. It shows aremarkable generalization capability of the neural net-work. The key factor of the proposed architecture relieson the set of convolutional neurons, which slides alongthe time axis sharing the same set of weights. Theyallow to perform the time integration function, whichis not obvious to model and for that reason not alwaystaken into account in other systems without introduc-ing tremendous complexity. As a comparison, when asingle frame (T = 1 instead of 125) is used to carry outthe computation of the objective score, the results wegot are really worst: the correlation was around 0.80for the 4 test videos with the RR system using the Pfeature alone (to be compared with 0.90�0.95).
We have in mind to extend this system along twodirections. One would be to take into account moregeneral degradations than those due to lossy compres-sion algorithms. Speci�cally, a complementary set offeatures sensitive to transmission errors has to be de-�ned, and of course, for the training purpose, a newdatabase including such kind of errors should be avail-able. The second extension consists in replacing thespatial integration that is carried out during the fea-ture extraction process by a learning stage that willbe incorporated in the neural architecture. The samekind of approach, with convolutional neurons could beused. It leads to Space Displacement Neural Network(SDNN), which has already been used with success andcombined with TDNN, for example in document imageprocessing [17].
Acknowledgments
The authors wish to thank TDF for providing the
databases used in the experiments related in this pa-per.
References
[1] A.B. Watson, J. Hu, and J.F. McGowan III, �DVQ: A dig-ital video quality metric based on human vision,� Journalof Electronic Imaging, vol.10, no.1, pp.20�29, 2001.
[2] H.R. Wu and M. Yuen, �A generalize block-edge impairmentmetric for video coding,� IEEE Signal Processing Letters,pp.317�320, 1997.
[3] S.A. Karunasekera and N.G. Kingsbury, �A distortion mea-sure for blocking artifacts in image based on human visualsensitivity,� IEEE Transactions on Image Processing, vol.4,no.6, pp.713�724, 1995.
[4] J. Caviedes and F. Oberti, �No-reference quality metric fordegraded and enhanced video,� Proc. SPIE Visual Commu-nications and Image Processing, 2003.
[5] M. Farias, No-reference and reduced reference video qualitymetrics : new Contributions, Ph.D. thesis, University ofCalifornia, 2004.
[6] S. Yao, W. Lin, Z. Lu, E. Ong, and X. Yang, �Video qual-ity assessment using neural network based on multi-featureextraction,� Proc. SPIE Visual Communications and Im-age Processing, ed. T. Ebrahimi and T. Sikora, pp.604�612,2003.
[7] P. Le Callet, C. Viard-Gaudin, and D. Barba, �Continu-ous quality assessment of MPEG2 video with reduced ref-erence,� First International Workshop on Video Process-ing and Quality Metrics for Consumer electronics, Phoenix,2005.
[8] D.R. Williams, J. Krauskopf, and D.W. Heeley, �Cardinaldirections of color space,� Vision Research, vol.22, pp.1123�1131, 1982.
[9] D. Melcher and S. Wolf, Objective Measures for Detect-ing Digital Tiling. Document Number: T1A1.5/95-104,http://www.its.bldrdoc.gov, 1995.
[10] T. Yamashita, M. Kameda, and M. Miyahara, �An Objec-tive Picture Quality Scale for Video Images (PQSvideo) �De�nition of Distortion Factors,� Visual Communicationsand Image Processing 2000, Proceedings of SPIE, pp.801�809, 2000.
[11] Z. Wang, A.C. Bovik, and B. Evans, �Blind Measurementof Blocking Artefact in Images,� International Conferenceon Image Processing, pp.981�984, 2000.
[12] Z. Wang, H.R. Sheikh, and A.C. Bovik, �No-Reference Per-ceptual Quality Assessment Quality of JPEG CompressedImages,� International Conference on Image Processing,2002.
[13] S. Winkler, �Issues in Vision Modeling for PerceptualVideo Quality Assessment,� Signal Processing, vol.78, no.2,pp.231�252, 1999.
[14] P. Gastaldo, S. Rovetta, and R. Zunino, �Objective Qual-ity Assessment of MPEG-2 Video Streams by Using CBPNeural Networks,� IEEE Transactions on Neural Networks,vol.13, no.4, pp.939�947, 2002.
[15] C.M. Bishop, Neural Networks for Pattern Recognition,pp.116�161, ISBN 0-19-853849-9, Oxford University Press,1995.
[16] A. Waibel, T. Hanazawa, G. Hinton, K. Shikan, andK. Lang, �Phoneme recognition using time-delay neural net-works,� IEEE Transactions on Acoustics, Speech and SignalProcessing, vol.3, pp.328�339, 1989.
[17] Y. LeCun, L. Bottou, Y. Bengio, and P. Ha�ner, �Gradient-Based Learning Applied to Document Recognition,� Pro-ceedings of the IEEE, vol.86, no.11, pp.2278�2324, 1998.
hal-0
0300
143,
ver
sion
1 -
17 J
ul 2
008
LE CALLET et al.: NO REFERENCE AND REDUCED REFERENCE VIDEO QUALITY METRICS FOR END TO END QOS MONITORING9
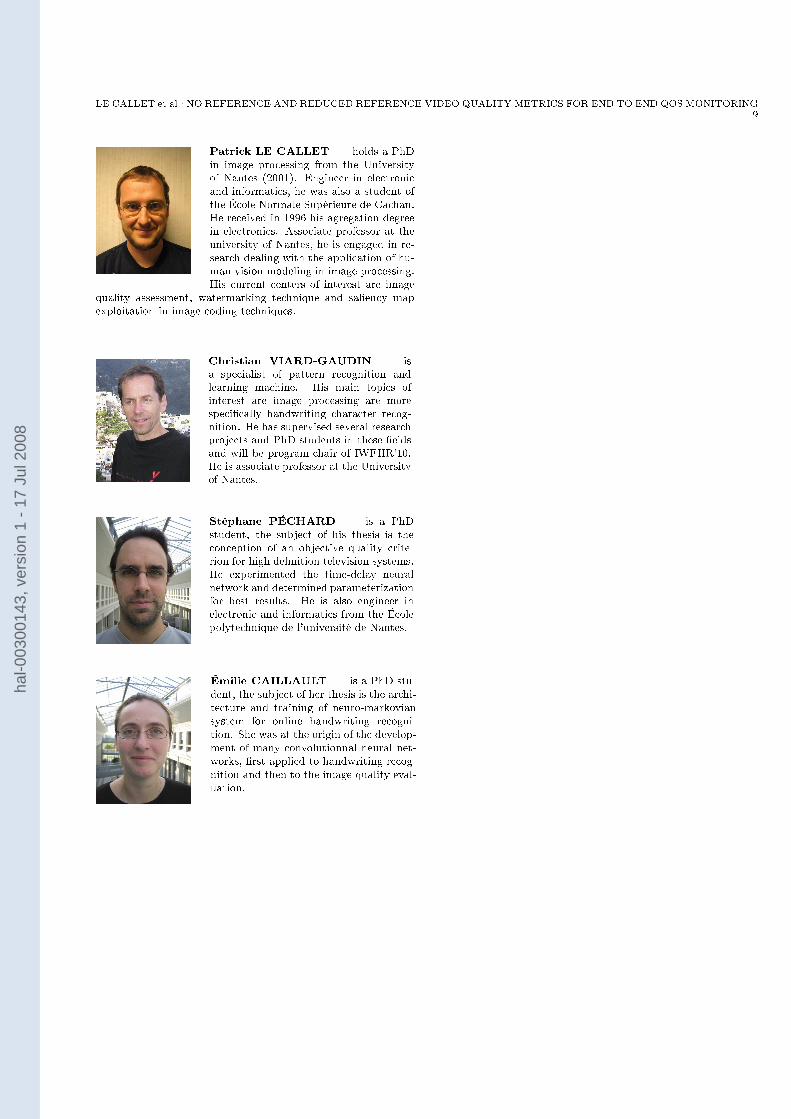
Patrick LE CALLET holds a PhDin image processing from the Universityof Nantes (2001). Engineer in electronicand informatics, he was also a student ofthe École Normale Supérieure de Cachan.He received in 1996 his agregation degreein electronics. Associate professor at theuniversity of Nantes, he is engaged in re-search dealing with the application of hu-man vision modeling in image processing.His current centers of interest are image
quality assessment, watermarking technique and saliency mapexploitation in image coding techniques.
Christian VIARD-GAUDIN isa specialist of pattern recognition andlearning machine. His main topics ofinterest are image processing are morespeci�cally handwriting character recog-nition. He has supervised several researchprojects and PhD students in these �eldsand will be program chair of IWFHR'10.He is associate professor at the Universityof Nantes.
Stéphane PÉCHARD is a PhDstudent, the subject of his thesis is theconception of an objective quality crite-rion for high de�nition television systems.He experimented the time-delay neuralnetwork and determined parameterizationfor best results. He is also engineer inelectronic and informatics from the Écolepolytechnique de l'université de Nantes.
Émilie CAILLAULT is a PhD stu-dent, the subject of her thesis is the archi-tecture and training of neuro-markoviansystem for online handwriting recogni-tion. She was at the origin of the develop-ment of many convolutionnal neural net-works, �rst applied to handwriting recog-nition and then to the image quality eval-uation.
hal-0
0300
143,
ver
sion
1 -
17 J
ul 2
008
Related Documents