No health without mental health Mental health dashboard DH – Leading the nation’s health and care December 2013

Welcome message from author
This document is posted to help you gain knowledge. Please leave a comment to let me know what you think about it! Share it to your friends and learn new things together.
Transcript
No health without mental healthMental health dashboard
DH – Leading the nation’s health and careDecember 2013

2
Contents
Foreword by the Minister of State 5
Introduction 6
No health without mental health – Mental health dashboard summary 8
Objective 1: More people have better mental health 9
Objective 1: summary 10
Self-reported wellbeing 11
Self-reported wellbeing – Warwick–Edinburgh Mental Wellbeing Scale (WEMWBS) 14
Prevalence of mental health problems 16
Sickness absence 18
Homelessness 20
Absolute low income 22
Illicit drug use 24
Objective 2: More people with mental health problems will recover 25
Objective 2: summary 26
IAPT: Improving Access to Psychological Therapies 27
Employment of people with mental health problems 28
Employment of people with serious mental illness 30
Living in stable and appropriate accommodation 32
Social care related quality of life (SCRQoL) for people with mental health problems 34

3
Contents (cont)
Objective 3: More people with mental health problems will have better physical health 36
Objective 3: summary 37
Excess mortality in people with serious mental illness 38
Comorbid long term physical health conditions among people with long term mental health problems 40
Comorbid long term mental health problems among people with long term physical health conditions 42
Mental health and alcohol misuse 44
Mental health and obesity 46
Mental health and smoking 48
Objective 4: More people will have a positive experience of care and support 50
Objective 4: summary 51
Detention and compulsory treatment 52
Patient experience of community mental health services 54
Satisfaction with services for people with mental health related social care needs 56
People feeling supported to manage their condition 58
Objective 5: Fewer people will suffer avoidable harm 60
Objective 5: summary 61
Safety incidents in mental health services 62
Suicide 63

4
Contents (cont)
Objective 6: Fewer people will experience stigma and discrimination 64
Objective 6: summary 65
Mental health related knowledge amongst the general public 66
People’s experience of discrimination 68
Notes 69

5
Foreword by the Minister of State
Mental health and wellbeing is everyone’s business. The ‘No health without mental health’ strategy emphasises that good mental health and resilience are fundamental to our physical health, our relationships, our education and training, our work and to achieving our potential. Roughly one in six of us is experiencing a mental health problem at any one time and mental health problems are estimated to cost the economy £105 billion per year.
‘No health without mental health’ set six objectives to improve mental health outcomes. The ‘No health without mental health’ implementation framework set out what local organisations can do to translate these objectives into reality and how Government and national organisations would support them in doing this.
As the new organisations in the health and care system begin their work, it is vital that everyone at local level and national level remains focused on these outcomes. One important way Government can support this is by providing a clear picture of the progress we are making – working across the system as a whole – to implement the strategy and improve mental health for all.
That is why I am so pleased to launch this mental health dashboard, which for the first time, brings together information about progress towards the objectives of the ‘No health without mental health’ strategy in one place.
I am confident this resource will be of value to everyone involved in efforts to improve outcomes and to everyone who has an interest in understanding whether these efforts are making a difference.
6
Introduction
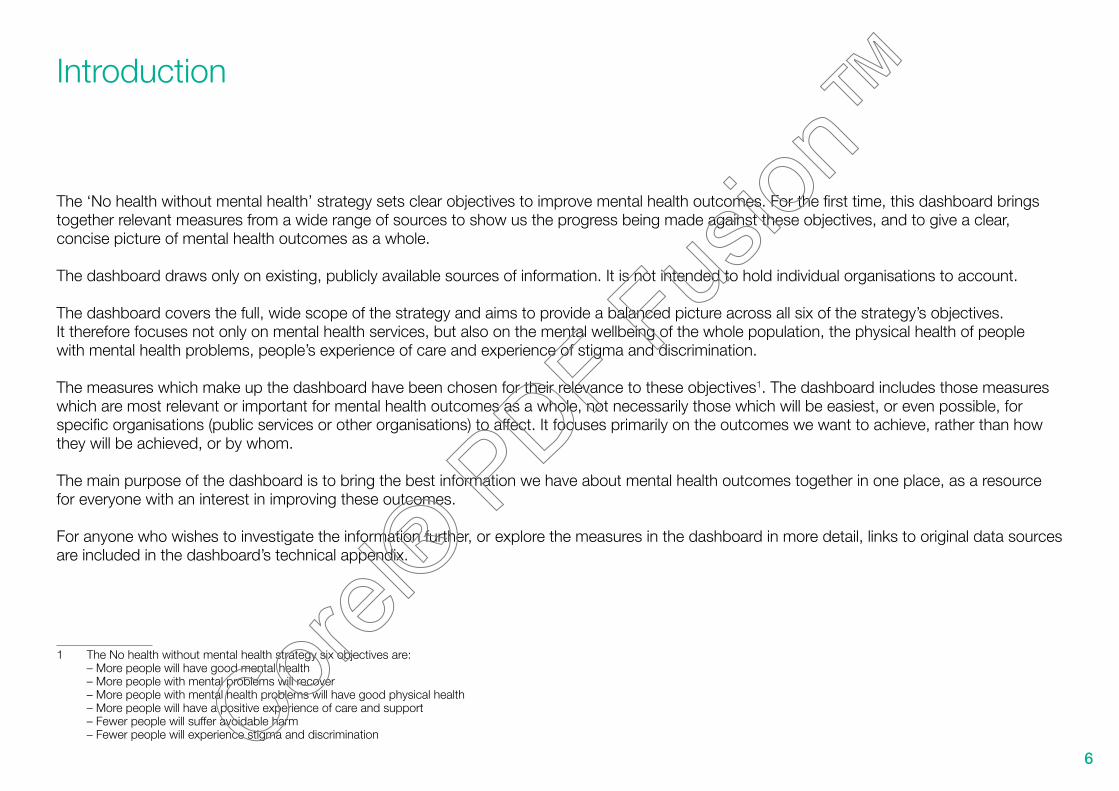
The ‘No health without mental health’ strategy sets clear objectives to improve mental health outcomes. For the first time, this dashboard brings together relevant measures from a wide range of sources to show us the progress being made against these objectives, and to give a clear, concise picture of mental health outcomes as a whole.
The dashboard draws only on existing, publicly available sources of information. It is not intended to hold individual organisations to account.
The dashboard covers the full, wide scope of the strategy and aims to provide a balanced picture across all six of the strategy’s objectives. It therefore focuses not only on mental health services, but also on the mental wellbeing of the whole population, the physical health of people with mental health problems, people’s experience of care and experience of stigma and discrimination.
The measures which make up the dashboard have been chosen for their relevance to these objectives1. The dashboard includes those measures which are most relevant or important for mental health outcomes as a whole, not necessarily those which will be easiest, or even possible, for specific organisations (public services or other organisations) to affect. It focuses primarily on the outcomes we want to achieve, rather than how they will be achieved, or by whom.
The main purpose of the dashboard is to bring the best information we have about mental health outcomes together in one place, as a resource for everyone with an interest in improving these outcomes.
For anyone who wishes to investigate the information further, or explore the measures in the dashboard in more detail, links to original data sources are included in the dashboard’s technical appendix.
1 The No health without mental health strategy six objectives are:– More people will have good mental health– More people with mental problems will recover– More people with mental health problems will have good physical health– More people will have a positive experience of care and support– Fewer people will suffer avoidable harm– Fewer people will experience stigma and discrimination

7
Relationship to the outcomes frameworks
The dashboard is consistent with the three outcomes frameworks2. It builds on the mental health aspects of all three frameworks to illustrate how the NHS, public health and social care systems can contribute to the implementation of the strategy. More information on how the dashboard relates to the outcomes frameworks is set out in the ‘No health without mental health’ implementation framework3.
The dashboard is not a performance management tool and does not create any performance management requirements or duties. A significant proportion of the dashboard measures are drawn from the outcomes frameworks. For these measures, it is possible to identify specifically the organisations which are responsible for their improvement. However, this responsibility arises from an indicator’s presence in an outcomes framework, rather than from its inclusion in the dashboard.
Supporting analysis
The dashboard’s supporting analysis, the technical appendix, presents more detailed information on the data sources used. Each dashboard measure includes analysis of a small number of the most relevant Equality Act (2010) protected characteristics, based on the data which is currently available. Links to data which will allow additional analysis are included in the dashboard technical appendix.
We hope the dashboard will be useful for commissioners and providers to determine the issues that might be important for action and improvement at a local level. All of the information in the dashboard is publicly available, so anyone wishing to analyse the measures in more detail will be able to do so.
Developing the dashboard
This dashboard provides a baseline. We will build on this picture in future years. By assessing how these mental health outcomes are changing, we will be able to monitor the progress in implementing the strategy for particular groups and in relation to equality in mental health.
The dashboard includes a number of ‘placeholder’ indicators, for which data will be available in future years. These show how we intend to develop and strengthen the dashboard over time. They include measures of key aspects of mental health outcomes, such as recovery, which the strategy and implementation framework identified as vital for the future development of the system as a whole.
However, we are also aware of the need for stability and consistency in what the dashboard measures. Our objectives and commitment – and the mental health outcomes which matter to people – will not change. We therefore intend to keep future changes to a minimum.
2 The three outcomes frameworks are – NHS, public health and adult social care3 https://www.gov.uk/government/publications/national-framework-to-improve-mental-health-and-wellbeing
8
No health without mental healthMental health dashboard
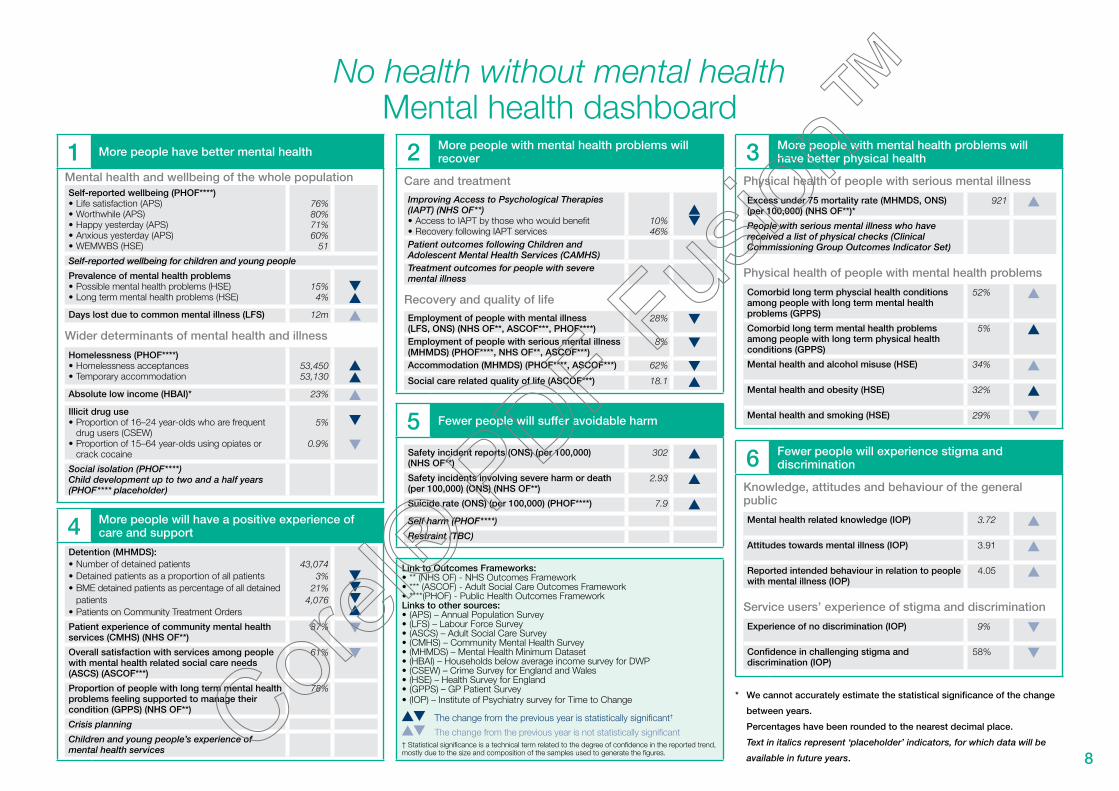
1 More people have better mental health
Mental health and wellbeing of the whole populationSelf-reported wellbeing (PHOF****)•�Life satisfaction (APS)•�Worthwhile (APS)•�Happy yesterday (APS)•�Anxious yesterday (APS)•�WEMWBS (HSE)
76%80%71%60%
51
Self-reported wellbeing for children and young people
Prevalence of mental health problems•�Possible mental health problems (HSE)•�Long term mental health problems (HSE)
15%4%
Days lost due to common mental illness (LFS) 12m
Wider determinants of mental health and illness
Homelessness (PHOF****)•�Homelessness acceptances•�Temporary accommodation
53,45053,130
Absolute low income (HBAI)* 23%
Illicit drug use•�Proportion of 16–24 year-olds who are frequent
drug users (CSEW)•�Proportion of 15–64 year-olds using opiates or
crack cocaine
5%
0.9%
Social isolation (PHOF****)Child development up to two and a half years (PHOF**** placeholder)
4 More people will have a positive experience of care and support
Detention (MHMDS):•�Number of detained patients•�Detained patients as a proportion of all patients•�BME detained patients as percentage of all detained
patients•�Patients on Community Treatment Orders
43,0743%
21%4,076
Patient experience of community mental health services (CMHS) (NHS OF**)
87%
Overall satisfaction with services among people with mental health related social care needs (ASCS) (ASCOF***)
61%
Proportion of people with long term mental health problems feeling supported to manage their condition (GPPS) (NHS OF**)
78%
Crisis planning
Children and young people’s experience of mental health services
2 More people with mental health problems will recover
Care and treatment
Improving Access to Psychological Therapies (IAPT) (NHS OF**)•�Access to IAPT by those who would benefit•�Recovery following IAPT services
10%46%
Patient outcomes following Children and Adolescent Mental Health Services (CAMHS)Treatment outcomes for people with severe mental illness
Recovery and quality of life
Employment of people with mental illness (LFS, ONS) (NHS OF**, ASCOF***, PHOF****)
28%
Employment of people with serious mental illness (MHMDS) (PHOF****, NHS OF**, ASCOF***)
8%
Accommodation (MHMDS) (PHOF****, ASCOF***) 62%
Social care related quality of life (ASCOF***) 18.1
5 Fewer people will suffer avoidable harm
Safety incident reports (ONS) (per 100,000) (NHS OF**)
302
Safety incidents involving severe harm or death (per 100,000) (ONS) (NHS OF**)
2.93
Suicide rate (ONS) (per 100,000) (PHOF****) 7.9
Self harm (PHOF****)
Restraint (TBC)
Link to Outcomes Frameworks:•�** (NHS OF) - NHS Outcomes Framework•�*** (ASCOF) - Adult Social Care Outcomes Framework•�****(PHOF) - Public Health Outcomes FrameworkLinks to other sources:•�(APS) – Annual Population Survey•�(LFS) – Labour Force Survey•�(ASCS) – Adult Social Care Survey•�(CMHS) – Community Mental Health Survey•�(MHMDS) – Mental Health Minimum Dataset•�(HBAI) – Households below average income survey for DWP•�(CSEW) – Crime Survey for England and Wales•�(HSE) – Health Survey for England•�(GPPS) – GP Patient Survey•�(IOP) – Institute of Psychiatry survey for Time to Change
The change from the previous year is statistically significant†
The change from the previous year is not statistically significant† Statistical significance is a technical term related to the degree of confidence in the reported trend, mostly due to the size and composition of the samples used to generate the figures.
3 More people with mental health problems will have better physical health
Physical health of people with serious mental illness
Excess under 75 mortality rate (MHMDS, ONS) (per 100,000) (NHS OF**)*
921
People with serious mental illness who have received a list of physical checks (Clinical Commissioning Group Outcomes Indicator Set)
Physical health of people with mental health problems
Comorbid long term physcial health conditions among people with long term mental health problems (GPPS)
52%
Comorbid long term mental health problems among people with long term physical health conditions (GPPS)
5%
Mental health and alcohol misuse (HSE) 34%
Mental health and obesity (HSE) 32%
Mental health and smoking (HSE) 29%
6 Fewer people will experience stigma and discrimination
Knowledge, attitudes and behaviour of the general public
Mental health related knowledge (IOP) 3.72
Attitudes towards mental illness (IOP) 3.91
Reported intended behaviour in relation to people with mental illness (IOP)
4.05
Service users’ experience of stigma and discrimination
Experience of no discrimination (IOP) 9%
Confidence in challenging stigma and discrimination (IOP)
58%
* We cannot accurately estimate the statistical significance of the change
between years.
Percentages have been rounded to the nearest decimal place.
Text in italics represent ‘placeholder’ indicators, for which data will be
available in future years.

9
Objective 1:
More people have better mental health

10
No health without mental healthMental health dashboard
1 More people have better mental healthMental health and wellbeing of the whole population
Indicator Data source Links to outcomes framework
Latest year Previous year Trend
Self-reported wellbeing•� Life satisfaction•� Worthwhile•� Happy yesterday•� Anxious yesterday
Annual Population Survey (APS) PHOF75.9%
80%71.1%60.1%
WEMWBS Health Survey for England (HSE) 51
Prevalence of mental health problems•� Possible mental health problems (HSE)•� Long term mental health problems (HSE)
Health Survey for England (HSE) 14.6%4.2%
16.3%4.1%
Days lost due to common mental illness Labour Force Survey (LFS) 12m 11.7m
Wider determinants of mental health and illness
Homelessness (PHOF)•� Homelessness acceptances•� Temporary accommodation
Quarterly P1E (homelessness) returns PHOF 53,45053,130
48,51048,920
Absolute low income (HBAI)* Households Below Average Income (HBAI) 23% 22%
Illicit drug use•� Proportion of 16–24 year-olds who are frequent
drug users (CSEW)•� Proportion of 15–64 year-olds using opiates or
crack cocaine
Crime Survey for England and Wales (CSEW)National Treatment Agency for Substance Misuse
5.1%
0.87%
7.0%
0.89%
* We cannot accurately estimate the statistical significance of the change between the years

11
Self-reported wellbeing1
Figure 1: Proportion of people that responded positively in the four wellbeing questions by gender – 2011/12
Figure 2: Proportion of people that responded positively in the four wellbeing questions by economic activity – 2011/12
Life satisfaction
90%
80%
70%
60%
50%
40%
30%
20%
10%
0%Worthwhile Felt happy
yesterdayDid not feel
anxious yesterday
Men
Women
In employment
Economically inactive
Unemployed
0%
10%
20%
30%
40%
50%
60%
70%
80%
90%
Did not feelanxious yesterday
Felt happyyesterday
WorthwhileLife satisfaction
Commentary
•� Women responded more positively to feeling ‘worthwhile’ but reported higher levels of anxiety. For the other two questions, variations in responses by gender were statistically insignificant. •� Positive responses from those in employment, or economically inactive, were between 5 and 25 percentage points higher than those unemployed on all four questions.Source: Office for National Statistics Annual Population Survey
The context and more information
•� ‘No health without mental health – a cross-government mental health outcomes strategy for people of all ages’ commits explicitly to improving mental wellbeing for the whole population. https://www.gov.uk/government/publications/the-mental-health-strategy-for-england
•� Subjective wellbeing is measured as part of the ‘Public Health Outcomes Framework for England 2013 to 2016’.https://www.gov.uk/government/publications/healthy-lives-healthy-people-improving-outcomes-and-supporting-transparencyhttp://www.phoutcomes.info/
•� ‘No health without mental health: implementation framework’ suggests what NHS, public health organisations, local authorities and others can do to improve wellbeing in their areas. https://www.gov.uk/government/publications/national-framework-to-improve-mental-health-and-wellbeing

12
Figure 3: Distribution of responses to the four wellbeing questions (1) – 2011/12
Figure 4: Distribution of responses to the four wellbeing questions (2) – 2011/12
High (9–10)
Medium (7–8)
Low (5–6)
Very low (0–4)
0% 0%Happy yesterdayWorthwhileLife satisfaction Anxious yesterday
10%
20%
30%
40%
50%
60%
70%
80%
90%
100%
Low (0–1)
Medium (2–3)
High (4–5)
Very high (6–10)
10%
20%
30%
40%
50%
60%
70%
80%
90%
100%
Commentary
•� Positive responses to the ‘Did not feel anxious yesterday’ question were lower than the three other wellbeing questions.
The context and more information
•� ‘No health without mental health – a cross-government mental health outcomes strategy for people of all ages’ commits explicitly to improving mental wellbeing for the whole population. https://www.gov.uk/government/publications/the-mental-health-strategy-for-england
•� Subjective wellbeing is measured as part of the ‘Public Health Outcomes Framework for England 2013 to 2016’.https://www.gov.uk/government/publications/healthy-lives-healthy-people-improving-outcomes-and-supporting-transparencyhttp://www.phoutcomes.info/
•� ‘No health without mental health: implementation framework’ suggests what NHS, public health organisations, local authorities and others can do to improve wellbeing in their areas. https://www.gov.uk/government/publications/national-framework-to-improve-mental-health-and-wellbeing

13
Figure 5: Proportion of people that responded positively in the four wellbeing questions by age (1) – 2011/12
Figure 6: Proportion of people that responded positively in the four wellbeing questions by age (2) – 2011/12
Life satisfaction(medium and high)
Worthwhile(medium and high)
Happy yesterday(medium and high)
0%
10%
20%
30%
40%
50%
60%
70%
80%
90%
80+70–7960–6950–5940–4930–3920–2916–19
Anxious yesterday(medium and low)
0%
10%
20%
30%
40%
50%
60%
70%
80%
80+70–7960–6950–5940–4930–3920–2916–19
Commentary
•� Positive responses to the ‘Did not feel anxious yesterday’ question were lower than the three other wellbeing questions, across all age groups. •� Those who responded less positively on all four questions were mostly in the 40–59 age group. Source: Office for National Statistics Annual Population Survey
The context and more information
•� ‘No health without mental health – a cross-government mental health outcomes strategy for people of all ages’ commits explicitly to improving mental wellbeing for the whole population. https://www.gov.uk/government/publications/the-mental-health-strategy-for-england
•� Subjective wellbeing is measured as part of the ‘Public Health Outcomes Framework for England 2013 to 2016’.https://www.gov.uk/government/publications/healthy-lives-healthy-people-improving-outcomes-and-supporting-transparencyhttp://www.phoutcomes.info/
•� ‘No health without mental health: implementation framework’ suggests what NHS, public health organisations, local authorities and others can do to improve wellbeing in their areas. https://www.gov.uk/government/publications/national-framework-to-improve-mental-health-and-wellbeing
14
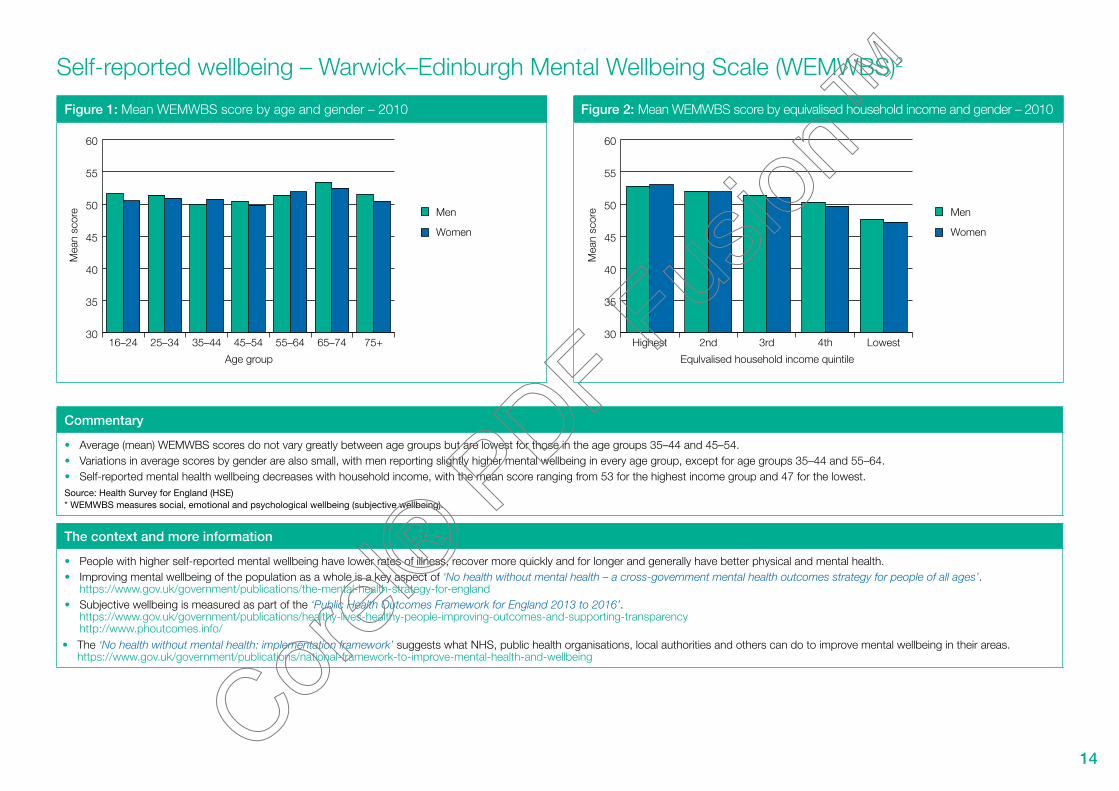
Self-reported wellbeing – Warwick–Edinburgh Mental Wellbeing Scale (WEMWBS)2
Figure 1: Mean WEMWBS score by age and gender – 2010 Figure 2: Mean WEMWBS score by equivalised household income and gender – 2010
Men
Women
Age group
Mea
n sc
ore
30
35
40
45
50
55
60
75+65–7455–6445–5435–4425–3416–24
Men
Women
Equlvalised household income quintile
Mea
n sc
ore
30
35
40
45
50
55
60
Lowest4th3rd2ndHighest
Commentary
•� Average (mean) WEMWBS scores do not vary greatly between age groups but are lowest for those in the age groups 35–44 and 45–54. •� Variations in average scores by gender are also small, with men reporting slightly higher mental wellbeing in every age group, except for age groups 35–44 and 55–64.•� Self-reported mental health wellbeing decreases with household income, with the mean score ranging from 53 for the highest income group and 47 for the lowest. Source: Health Survey for England (HSE) * WEMWBS measures social, emotional and psychological wellbeing (subjective wellbeing).
The context and more information
•� People with higher self-reported mental wellbeing have lower rates of illness, recover more quickly and for longer and generally have better physical and mental health.•� Improving mental wellbeing of the population as a whole is a key aspect of ‘No health without mental health – a cross-government mental health outcomes strategy for people of all ages’.
https://www.gov.uk/government/publications/the-mental-health-strategy-for-england•� Subjective wellbeing is measured as part of the ‘Public Health Outcomes Framework for England 2013 to 2016’.
https://www.gov.uk/government/publications/healthy-lives-healthy-people-improving-outcomes-and-supporting-transparency http://www.phoutcomes.info/The ‘No health without mental health: implementation framework’ suggests what NHS, public health organisations, local authorities and others can do to improve mental wellbeing in their areas. https://www.gov.uk/government/publications/national-framework-to-improve-mental-health-and-wellbeing
•

15
Figure 3: WEMWBS score distribution – 2010
WEMWBS score
Per
cent
Base: Aged 16 and over
6
5
4
3
2
1
014 20 30 40 50 60 70
Commentary
•� Self-reported mental health wellbeing scores were recorded on a maximum/minimum range of 14–70 but over half of responses were in the range 47–58. Scores of 55 and 56 were recorded by the largest number of people (just over 5% for each score).
Source: Health Survey for England (HSE)* WEMWBS measures social, emotional and psychological wellbeing (subjective wellbeing).
The context and more information
•� People with higher self-reported mental wellbeing have lower rates of illness, recover more quickly and for longer and generally have better physical and mental health.•� Improving mental wellbeing of the population as a whole is a key aspect of ‘No health without mental health – a cross-government mental health outcomes strategy for people of all ages’.
https://www.gov.uk/government/publications/the-mental-health-strategy-for-england•� Subjective wellbeing is measured as part of the ‘Public Health Outcomes Framework for England 2013 to 2016’.
https://www.gov.uk/government/publications/healthy-lives-healthy-people-improving-outcomes-and-supporting-transparency http://www.phoutcomes.info/
•� The ‘No health without mental health: implementation framework’ suggests what NHS, public health organisations, local authorities and others can do to improve mental wellbeing in their areas. https://www.gov.uk/government/publications/national-framework-to-improve-mental-health-and-wellbeing

16
Prevalence of mental health problems3
Figure 1: Prevalence of mental health problems (3) – 2003–2010 Figure 2: Prevalence of mental health problems by age groups – 2010
Possible mental health problems
Long term mental health problems
0%
5%
10%
15%
20%
25%
30%
35%
20102009200820072006200520042003
Possible mental health problems
Long term mental health problems
0%
2%
4%
6%
8%
10%
12%
14%
16%
18%
20%
75+65–7455–6445–5435–4425–3416–24
Commentary
•� The self-reported prevalence of both possible mental health problems and long term mental health problems has been increasing slowly over the last decade. The last two years has seen a relatively sharp variation, but overall the trend is maintained.
•� The prevalence of long term mental health problems is lowest in age groups 65–74 and 75+ (both are below 2%) and highest for age groups 45–54 and 55–64 (both are almost 6%).•� The prevalence of possible mental health problems is lowest in age groups 65–74 (below 10%) and highest for age groups 45–54 (almost 18%). Source: Health Survey for England (HSE)
The context and more information
•� ‘No health without mental health – a cross-government mental health outcomes strategy for people of all ages’ promotes reducing the prevalence of mental health problems https://www.gov.uk/government/publications/the-mental-health-strategy-for-england
•� A more detailed measure of prevalence is contained in the seven-yearly Adult Psychiatric Morbidity Survey. http://www.hscic.gov.uk/pubs/psychiatricmorbidity07
•� The ‘No health without mental health: implementation framework’ suggests what local organisations can do to prevent mental health problems, to intervene early and to prevent more serious problems developing. https://www.gov.uk/government/publications/national-framework-to-improve-mental-health-and-wellbeing

17
Figure 3: Prevalence of mental health problems by gender – 2010 Figure 4: Prevalence of mental health problems by income group – 2010
Possible mental health problems
Long term mentalhealth problems
0%
2%
4%
6%
8%
10%
12%
14%
16%
18%
FemalesMales
Possible mental health problems
Long term mental health problems
0% 5% 10% 15% 20% 25% 30%
Lowest quintile
Second lowest quintile
Middle quintile
Second highest quintile
Highest quintile
Commentary
•� The prevalence of long term and possible mental health problems in women is higher than that for men, with differences of about 1 and 2 percentage points respectively. •� The prevalence of possible and long term mental health problems is significantly higher in the lowest income group. Source: Health Survey for England (HSE)
The context and more information
•� ‘No health without mental health – a cross-government mental health outcomes strategy for people of all ages’ promotes reducing the prevalence of mental health problems https://www.gov.uk/government/publications/the-mental-health-strategy-for-england
•� A more detailed measure of prevalence is contained in the seven-yearly Adult Psychiatric Morbidity Survey. http://www.hscic.gov.uk/pubs/psychiatricmorbidity07
•� The ‘No health without mental health: implementation framework’ suggests what local organisations can do to prevent mental health problems, to intervene early and to prevent more serious problems developing. https://www.gov.uk/government/publications/national-framework-to-improve-mental-health-and-wellbeing
18
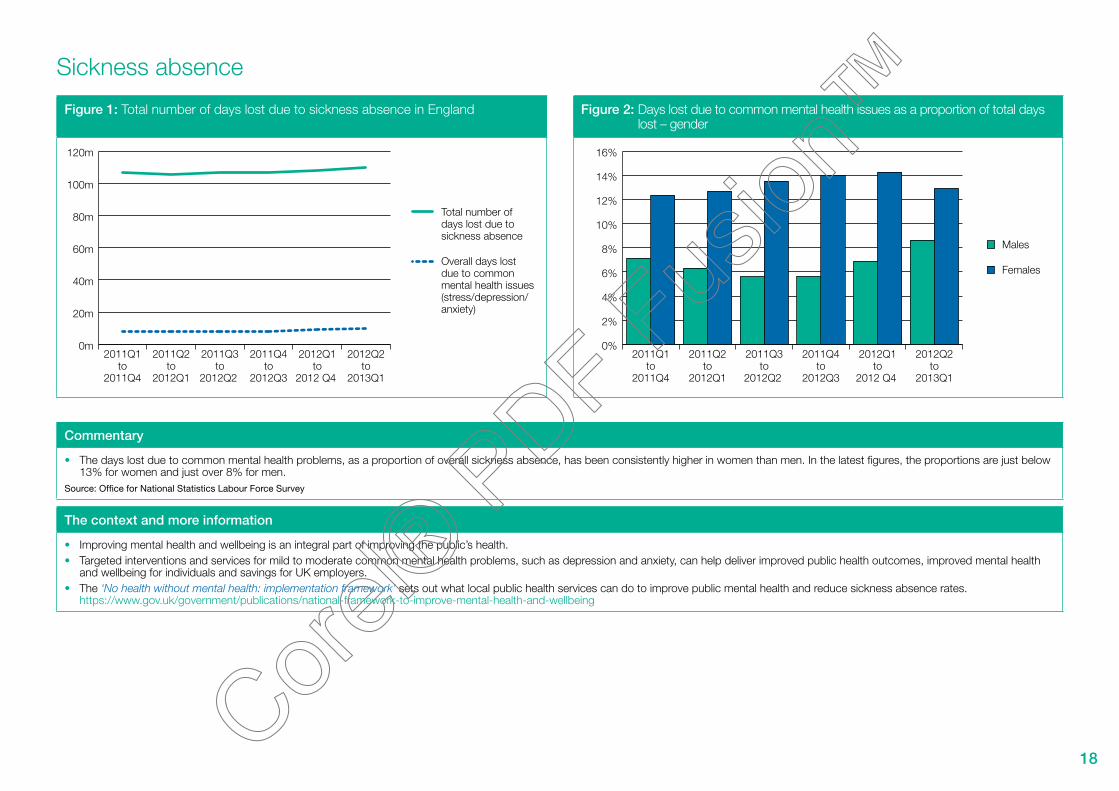
Sickness absence
Figure 1: Total number of days lost due to sickness absence in England Figure 2: Days lost due to common mental health issues as a proportion of total days lost – gender
Total number of days lost due to sickness absence
Overall days lost due to common mental health issues (stress/depression/anxiety)
0m
20m
40m
60m
80m
100m
120m
2012Q2to
2013Q1
2012Q1to
2012 Q4
2011Q4to
2012Q3
2011Q3to
2012Q2
2011Q2to
2012Q1
2011Q1to
2011Q4
Males
Females
0%
2%
4%
6%
8%
10%
12%
14%
16%
2012Q2to
2013Q1
2012Q1to
2012 Q4
2011Q4to
2012Q3
2011Q3to
2012Q2
2011Q2to
2012Q1
2011Q1to
2011Q4
Commentary
•� The days lost due to common mental health problems, as a proportion of overall sickness absence, has been consistently higher in women than men. In the latest figures, the proportions are just below 13% for women and just over 8% for men.
Source: Office for National Statistics Labour Force Survey
The context and more information
•� Improving mental health and wellbeing is an integral part of improving the public’s health.•� Targeted interventions and services for mild to moderate common mental health problems, such as depression and anxiety, can help deliver improved public health outcomes, improved mental health
and wellbeing for individuals and savings for UK employers. •� The ‘No health without mental health: implementation framework’ sets out what local public health services can do to improve public mental health and reduce sickness absence rates.
https://www.gov.uk/government/publications/national-framework-to-improve-mental-health-and-wellbeing

19
Figure 3: Days lost due to common mental health issues as a proportion of total days lost – age group
20–34
35–49
50–64
0%
2%
4%
6%
8%
10%
12%
14%
2012Q2to
2013Q1
2012Q1to
2012 Q4
2011Q4to
2012Q3
2011Q3to
2012Q2
2011Q2to
2012Q1
2011Q1to
2011Q4
Commentary
•� Those people in age group 50–64 have consistently shown the lowest proportion of days lost over the recent survey periods.Source: Office for National Statistics Labour Force Survey
The context and more information
•� Improving mental health and wellbeing is an integral part of improving the public’s health.•� Targeted interventions and services for mild to moderate common mental health problems, such as depression and anxiety, can help deliver improved public health outcomes, improved mental health
and wellbeing for individuals and savings for UK employers. •� The ‘No health without mental health: implementation framework’ sets out what local public health services can do to improve public mental health and reduce sickness absence rates.
https://www.gov.uk/government/publications/national-framework-to-improve-mental-health-and-wellbeing

20
Homelessness4
Figure 1: Homelessness trend 1998–2012 Figure 2: Temporary accommodation and total acceptances broken down by ethnicity, 2011
Number intemporaryaccommodation
Homelessnessacceptance
Num
ber
in te
mpo
rary
acc
omm
odat
ion
Hom
eles
snes
s ac
cept
ance
0
5,000
10,000
15,000
20,000
25,000
30,000
35,000
40,000
0
20,000
40,000
60,000
80,000
100,000
120,000
2012
-Q1
2011
-Q1
2010
-Q1
2009
-Q1
2008
-Q1
2007
-Q1
2006
-Q1
2005
-Q1
2004
-Q1
2003
-Q1
2002
-Q1
2001
-Q1
2000
-Q1
1999
-Q1
1998
-Q1
Homelessness acceptance: A household found to be eligible, homeless through no fault of their own and in priority need.Temporary accommodation: Households in accommodation arranged by local authorities pending enquiries or after being accepted as homeless under the 1996 Housing Act
BME
White
0%
10%
20%
30%
40%
50%
60%
70%
80%
90%
100%
Generalpopulation
Temporaryaccommodation
Totalacceptances
Commentary
•� A steep decline in homeless households in ‘priority need’ and those in temporary accommodation between 2003 and 2010 has stalled. Figures from 2010 show both are now starting to rise. •� People from BME groups represent around a third of homeless households in ‘priority need’ and around half of all people in temporary accommodation.Source: National statistics – Department for Communities and Local Government
The context and more information
•� A safe and secure place to live is essential for everybody’s health and wellbeing. For many people, poor mental health is linked to insecure, poor quality and overcrowded housing and homelessness.•� Homeless households, or households in temporary accommodation, can have greater health needs than the population as a whole, including mental health needs.•� The cross-government ministerial working group on homelessness report ‘Making every contact count – A joint approach to preventing homelessness’, published August 2012, emphasises that poor
mental health is a key risk factor and set out how local agencies can identify people at risk and make sure they can access help to prevent them becoming homeless. https://www.gov.uk/government/publications/making-every-contact-count-a-joint-approach-to-preventing-homelessness
•� Housing organisations, service commissioners and providers, have a key role in working with NHS organisations to provide integrated support for people with mental health problems. The ‘No health without mental health: implementation framework’ highlights what housing organisations can do to support people with mental health problems and housing needs. https://www.gov.uk/government/publications/national-framework-to-improve-mental-health-and-wellbeing

21
Figure 3: Total acceptances and temporary accommodation broken down by household type, 2011
Totalacceptances
Temporaryaccommdation
0%
5%
10%
15%
20%
25%
30%
35%
40%
45%
50%
Couple with dependent
children
All other household
groups
Male applicant
Lone parent household with dependent children
One person household
Female applicant
Male applicant
Female applicant
Commentary
•� Lone female applicants with dependent children are the most common household types for both temporary accommodation and homeless households.Source: National statistics – Department for Communities and Local Government
* Homelessness acceptance: A household found to be eligible, homeless through no fault of their own and in priority need.Temporary accommodation: Households in accommodation arranged by local authorities pending enquiries or after being accepted as homeless under the 1996 Housing Act
The context and more information
•� A safe and secure place to live is essential for everybody’s health and wellbeing. For many people, poor mental health is linked to insecure, poor quality and overcrowded housing and homelessness.•� Homeless households, or households in temporary accommodation, can have greater health needs than the population as a whole, including mental health needs.•� The cross-government ministerial working group on homelessness report ‘Making every contact count – A joint approach to preventing homelessness’, published August 2012, emphasises that poor
mental health is a key risk factor and sets out how local agencies can identify people at risk and make sure they can access help to prevent them becoming homeless. https://www.gov.uk/government/publications/making-every-contact-count-a-joint-approach-to-preventing-homelessness
•� Housing organisations, service commissioners and providers, have a key role in working with NHS organisations to provide integrated support for people with mental health problems. The ‘No health without mental health: implementation framework’ highlights what housing organisations can do to support people with mental health problems and housing needs. https://www.gov.uk/government/publications/national-framework-to-improve-mental-health-and-wellbeing

22
Absolute low income5
Figure 1: Percentage of individuals falling below 60% of median income (real terms) – 1998/99–2010/11
Figure 2: Composition of low-income groups (after housing costs) – 2010/11
After housing costs
Before housing costs
0%
5%
10%
15%
20%
25%
30%
35%
2011
/12
2010
/11
2009
/10
2008
/09
2007
/08
2006
/07
2005
/06
2004
/05
2003
/04
2002
/03
2001
/02
2000
/01
1999
/00
1998
/99
Householdsbelow 60%of medianincome
Allhouseholds
0%
5%
10%
15%
20%
25%
30%
35%
40%
Wor
kless
, oth
er
inacti
ve
Wor
kless
, one
or
mor
e une
mplo
yed
Wor
kless
, one
or
mor
e age
d 60
or o
ver
No ful
l-tim
e, on
e
or m
ore i
n PT
work
Couple
, one
FT w
ork,
one n
ot w
orkin
g
Couple
, one
FT,
one p
art-t
ime (
PT) wor
k
Single/
coup
le all
in
FT w
ork
One o
r mor
e full
-tim
e
(FT) s
elf-e
mplo
yed
Commentary
•� The proportion of people in households with an income below 60% of median income has decreased by 29% since 1998/9 (after housing costs) but in the most recent figures there are signs the trend is reversing.
•� Of the low-income groups, those in the workless and other inactive group are the greatest proportion (over 20%) and couples who are working full or part-time are the smallest proportion (about 5%).Source: Households Below Average Income (HBAI) dataset
The context and more information
•� Income inequality is a determinant of mental health. Social and economic inequalities influence health and wellbeing and risk of mental health problems. Those with the lowest income are at increased risk of mental health problems compared with the general population.
•� The focus on income over the last decades has ignored the root causes of poverty. The ‘Social Justice: transforming lives’ Government strategy is about making sure that everybody is able to take their first step on the social ladder whatever their circumstance. https://www.gov.uk/government/publications/social-justice-transforming-lives
•� ‘No health without mental health – a cross-government mental health outcomes strategy for people of all ages’ promotes localised methods of commissioning and delivery of services to make sure that mental health conditions are not addressed in isolation, but as a part of the wider issues facing an individual or family. https://www.gov.uk/government/publications/the-mental-health-strategy-for-england
•� The ‘No health without mental health: implementation framework’ includes how health and care organisations can come together with others to provide an integrated response for people with mental health needs. https://www.gov.uk/government/publications/national-framework-to-improve-mental-health-and-wellbeing

23
Figure 3: Composition of low-income groups by family type (after housing costs) – 2010/11
Households below60% of median income
All households
0%
5%
10%
15%
20%
25%
30%
35%
40%
Singlewithoutchildren
Singlewith
children
Couplewithoutchildren
Couplewith
children
Singlepensioner
Pensionercouple
Commentary
•� Of the low-income groups, the family type of couples with children are the greatest proportion (just over 35%) and pensioners single or couple are the smallest proportion (just over 5% each). Source: Households Below Average Income (HBAI) dataset
The context and more information
•� Income inequality is a determinant of mental health. Social and economic inequalities influence health and wellbeing and risk of mental health problems. Those with the lowest income are at increased risk of mental health problems compared with the general population.
•� The focus on income over the last decades has ignored the root causes of poverty. The ‘Social Justice: transforming lives’ Government strategy is about making sure that everybody is able to take their first step on the social ladder whatever their circumstance. https://www.gov.uk/government/publications/social-justice-transforming-lives
•� ‘No health without mental health – a cross-government mental health outcomes strategy for people of all ages’ promotes localised methods of commissioning and delivery of services to make sure that mental health conditions are not addressed in isolation but as a part of the wider issues facing an individual or family. https://www.gov.uk/government/publications/the-mental-health-strategy-for-england
•� The ‘No health without mental health: implementation framework’ includes how health and care organisations can come together with others to provide an integrated response for people with mental health needs. https://www.gov.uk/government/publications/national-framework-to-improve-mental-health-and-wellbeing

24
Illicit drug use6
Figure 1: The proportion of 16–24 year-olds classified as frequent drug users – 2002/03 – 2012/13
Figure 2: The proportion of 15–64 year-olds reporting using opiates or crack cocaine – 2005/06 – 2010/11
0%
2%
4%
6%
8%
10%
12%
14%
2012
/13
2011
/12
2010
/11
2009
/10
2008
/09
2007
/08
2006
/07
2005
/06
2004
/05
2003
/04
2002
/03 0.0%
0.2%
0.4%
0.6%
0.8%
1.0%
1.2%
2010/112009/102008/092006/072005/06
Commentary
•� The proportion of 16–24 year-olds classified as frequent drug users has fallen sharply and more than halved since 2002/03. It is currently at around 5%.•� The proportion of 15–64 year-olds using opiates or crack cocaine has fallen steadily, by over 12%, between 2005/06 and to 2010/11.Source: Crime Survey for England and Wales, Home Office; National and Regional Estimates of the Prevalence of Opiate and/or Crack Cocaine use, National Treatment Agency for Substance Misuse.
The context and more information
•� Although there is still debate as to whether there is a causal link between illicit drug use and the development of long term psychosis, it is well established that the course of psychosis is adversely affected by substance misuse, resulting in a more prolonged and serious condition.
•� The chart focuses on 16–24 year-olds as the Crime Survey for England and Wales has consistently shown that drug usage is higher among young people than for the adult population as a whole.•� The ‘No health without mental health: implementation framework’ sets out what local organisations can do to tackle the wider determinants of mental illness.
https://www.gov.uk/government/publications/national-framework-to-improve-mental-health-and-wellbeing

25
Objective 2:
More people with mental health problems will recover

26
No health without mental healthMental health dashboard
2 More people with mental health problems will recover
Indicator Data source Links to outcomes framework
Latest year Previous year Trend
Care and treatment
IAPT•� Access to IAPT by those who would benefit•� Recovery following IAPT services
Improving access to psychological therapies, key performance indicators (IAPT KPIs), IC
NHS OF9.8%
45.9%8.6%
46.1%
Recovery and quality of life
Employment of people with mental illness Labour Force Survey and ONS PHOF, NHS OF, ASCOF
27.7% 29.5%
Employment of people with serious mental illness
Mental Health Minimum Dataset (MHMDS)
PHOF, NHS OF, ASCOF
7.9% 8.8%
Accommodation Mental Health Minimum Dataset (MHMDS)
PHOF, ASCOF 61.7% 63.3%
Social care related quality of life Adult Social Care Survey (ASCS) ASCOF 18.1 17.9

27
IAPT: Improving Access to Psychological Therapies7
Figure 1: Access rate to IAPT services Figure 2: Recovery rates following IAPT
0%
2%
4%
6%
8%
10%
12%
2012/13(Q4 provisional)
2011/122010/112009/100%
36%
38%
40%
42%
44%
46%
48%
Q4Q3Q2Q1Q4Q3Q2Q1Q4Q3Q2Q12010/11 2011/12 2012/13
Commentary
•� Access to IAPT services is calculated on a quarterly basis and aggregated to provide an annual figure. Access on an annual basis has increased significantly from 3% in 2009/10 to almost 10% in 2012/13. These figures show more people than ever before are benefitting from IAPT services but there is more to do to reach the Government’s ambition for over 900,000 people to access these services each year by 2015.
•� The recovery rate has increased significantly from around 39.3% in Q1 2010/11 to around 45.9% in Q2 2012/13. Source: Improving Access to Psychological Therapies (IAPT) dataset.
Access rate is defined as the proportion of people entering treatment against the level of need in the general population (i.e. the prevalence of depression and anxiety in the population).
The recovery rate refers to the proportion of people who complete treatment and consequently move to recovery.
The context and more information
•� The ‘No health without mental health: implementation framework’ sets out what providers of mental health services, adult social care services and children’s services can do to make sure that everyone has timely access to evidence-based psychological therapies.
•� The ‘No health without mental health: implementation framework’ also makes clear the need to go further to ensure a choice of NICE approved therapies are commissioned and provided in all areas of the country, accessible to all, including older people and people from BME communities.https://www.gov.uk/government/publications/national-framework-to-improve-mental-health-and-wellbeing

28
Employment of people with mental health problems8
Figure 1: Employment rate of people with mental health problems – 2007– 2011 Figure 2: Employment rate of people with mental health problems by gender – 2007–2011
General population
People with mentalhealth problems
0%
10%
20%
30%
40%
50%
60%
70%
80%
2011(Q1+Q2)
2010200920082007
General population
People with mentalhealth problems
0%
10%
20%
30%
40%
50%
60%
70%
80%
90%
Fem
ales
Mal
es
Fem
ales
Mal
es
Fem
ales
Mal
es
Fem
ales
Mal
es
Fem
ales
Mal
es
2007 2008 2009 2010 2011(Q1+Q2)
Commentary
•� Around 28% of people with mental health problems are employed, compared to around 70% of the general population.•� Differences in employment rates by gender are lower among those with mental health problems than in the general population.Source: ONS Labour Force Survey
The context and more information
•� The incidence of mental health problems – including in young people – can increase in times of economic and employment uncertainty, as can the rate of suicide. •� An employment indicator is included in the NHS Outcomes Framework 2013–14
https://www.gov.uk/government/uploads/system/uploads/attachment_data/file/127106/121109-NHS-Outcomes-Framework-2013-14.pdfhttp://indicators.ic.nhs.uk/webview/
•� ‘No health without mental health – a cross-government mental health outcomes strategy for people of all ages’ makes clear the mental health benefits of gaining and retaining employment. https://www.gov.uk/government/publications/the-mental-health-strategy-for-england
•� The ‘No health without mental health: implementation framework’ sets out what employers, employment support organisations, NHS providers and others can do to support people with mental health problems to gain employment.https://www.gov.uk/government/publications/national-framework-to-improve-mental-health-and-wellbeing
29
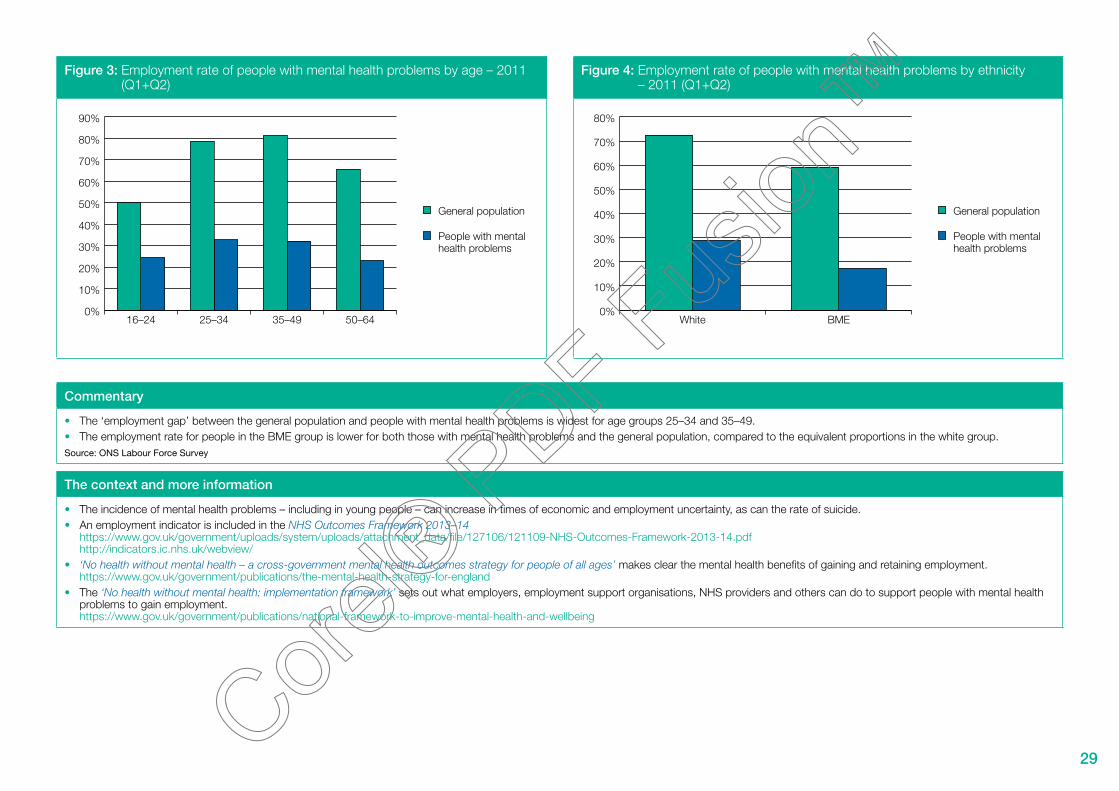
Figure 3: Employment rate of people with mental health problems by age – 2011 (Q1+Q2)
Figure 4: Employment rate of people with mental health problems by ethnicity – 2011 (Q1+Q2)
General population
People with mentalhealth problems
0%
10%
20%
30%
40%
50%
60%
70%
80%
90%
50–6435–4925–3416–24
General population
People with mentalhealth problems
0%
10%
20%
30%
40%
50%
60%
70%
80%
BMEWhite
Commentary
•� The ‘employment gap’ between the general population and people with mental health problems is widest for age groups 25–34 and 35–49.•� The employment rate for people in the BME group is lower for both those with mental health problems and the general population, compared to the equivalent proportions in the white group.Source: ONS Labour Force Survey
The context and more information
•� The incidence of mental health problems – including in young people – can increase in times of economic and employment uncertainty, as can the rate of suicide. •� An employment indicator is included in the NHS Outcomes Framework 2013–14
https://www.gov.uk/government/uploads/system/uploads/attachment_data/file/127106/121109-NHS-Outcomes-Framework-2013-14.pdfhttp://indicators.ic.nhs.uk/webview/
•� ‘No health without mental health – a cross-government mental health outcomes strategy for people of all ages’ makes clear the mental health benefits of gaining and retaining employment. https://www.gov.uk/government/publications/the-mental-health-strategy-for-england
•� The ‘No health without mental health: implementation framework’ sets out what employers, employment support organisations, NHS providers and others can do to support people with mental health problems to gain employment.https://www.gov.uk/government/publications/national-framework-to-improve-mental-health-and-wellbeing
30
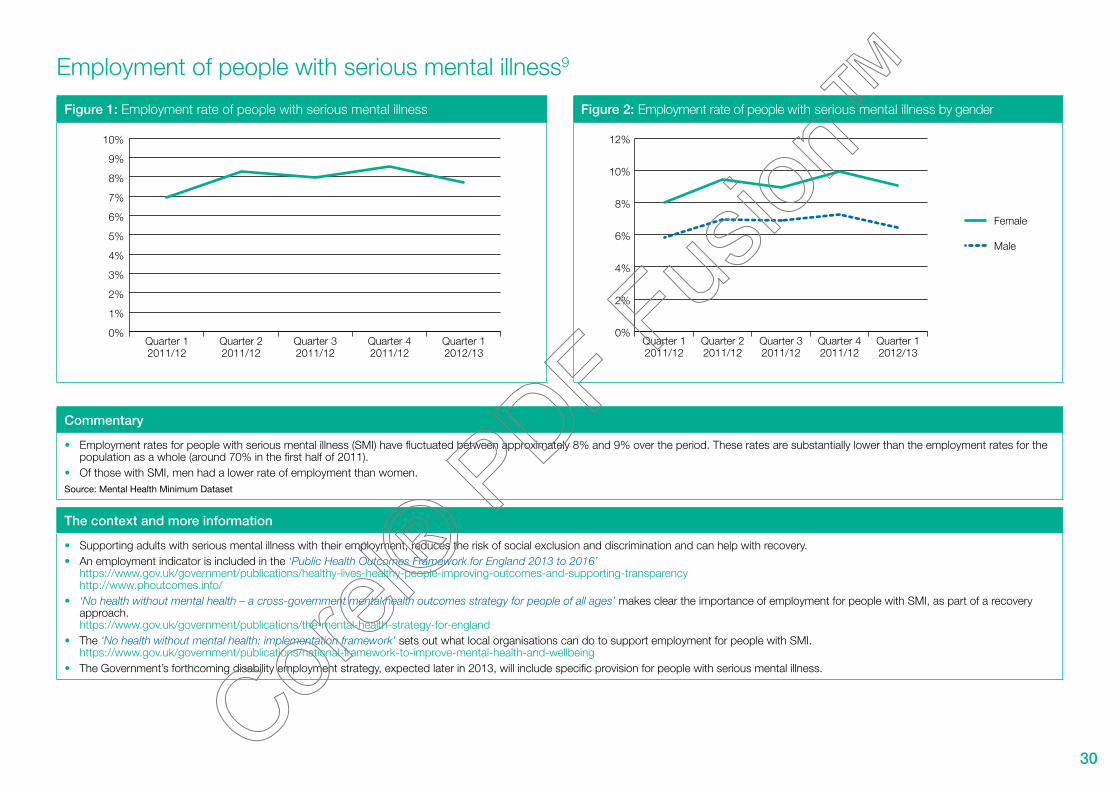
Employment of people with serious mental illness9
Figure 1: Employment rate of people with serious mental illness Figure 2: Employment rate of people with serious mental illness by gender
0%
1%
2%
3%
4%
5%
6%
7%
8%
9%
10%
Quarter 12012/13
Quarter 42011/12
Quarter 32011/12
Quarter 22011/12
Quarter 12011/12
Female
Male
0%
2%
4%
6%
8%
10%
12%
Quarter 12012/13
Quarter 42011/12
Quarter 32011/12
Quarter 22011/12
Quarter 12011/12
Commentary
•� Employment rates for people with serious mental illness (SMI) have fluctuated between approximately 8% and 9% over the period. These rates are substantially lower than the employment rates for the population as a whole (around 70% in the first half of 2011).
•� Of those with SMI, men had a lower rate of employment than women.Source: Mental Health Minimum Dataset
The context and more information
•� Supporting adults with serious mental illness with their employment, reduces the risk of social exclusion and discrimination and can help with recovery.•� An employment indicator is included in the ‘Public Health Outcomes Framework for England 2013 to 2016’
https://www.gov.uk/government/publications/healthy-lives-healthy-people-improving-outcomes-and-supporting-transparencyhttp://www.phoutcomes.info/
•� ‘No health without mental health – a cross-government mental health outcomes strategy for people of all ages’ makes clear the importance of employment for people with SMI, as part of a recovery approach. https://www.gov.uk/government/publications/the-mental-health-strategy-for-england
•� The ‘No health without mental health: implementation framework’ sets out what local organisations can do to support employment for people with SMI.https://www.gov.uk/government/publications/national-framework-to-improve-mental-health-and-wellbeing
•� The Government’s forthcoming disability employment strategy, expected later in 2013, will include specific provision for people with serious mental illness.

31
Figure 3: Employment rate of people with serious mental illness by age Figure 4: Employment rate of people with serious mental illness by ethnicity
18 to 35
36 to 69
0%
2%
4%
6%
8%
10%
12%
Quarter 12012/13
Quarter 42011/12
Quarter 32011/12
Quarter 22011/12
Quarter 12011/12
White
BME
0%
1%
2%
3%
4%
5%
6%
7%
8%
9%
10%
Quarter 12012/13
Quarter 42011/12
Quarter 32011/12
Quarter 22011/12
Quarter 12011/12
Commentary
•� People with SMI in the age group 18–35 had a higher employment rate compared to those in the age group 36–69 (10% vs 7%). •� Of those with SMI, people from BME groups had a lower rate of employment than those from white backgrounds. Source: Mental Health Minimum Dataset
The context and more information
•� Supporting adults with serious mental illness with their employment, reduces the risk of social exclusion and discrimination and can help with recovery.•� An employment indicator is included in the ‘Public Health Outcomes Framework for England 2013 to 2016’
https://www.gov.uk/government/publications/healthy-lives-healthy-people-improving-outcomes-and-supporting-transparencyhttp://www.phoutcomes.info/
•� ‘No health without mental health – a cross-government mental health outcomes strategy for people of all ages’ makes clear the importance of employment for people with SMI, as part of a recovery approach. https://www.gov.uk/government/publications/the-mental-health-strategy-for-england
•� The ‘No health without mental health: implementation framework’ sets out what local organisations can do to support employment for people with SMI.https://www.gov.uk/government/publications/national-framework-to-improve-mental-health-and-wellbeing
•� The Government’s forthcoming disability employment strategy will include specific provision for people with SMI and is expected later in 2013.

32
Living in stable and appropriate accommodation10
Figure 1: Proportion of people with mental health problems in stable and appropriate accommodation
Figure 2: Proportion of people with mental health problems in stable and appropriate accommodation by gender
0%
10%
20%
30%
40%
50%
60%
70%
Quarter 12012/13
Quarter 42011/12
Quarter 32011/12
Quarter 22011/12
Quarter 12011/12
Female
Male
0%
10%
20%
30%
40%
50%
60%
70%
Quarter 12012/13
Quarter 42011/12
Quarter 32011/12
Quarter 22011/12
Quarter 12011/12
Commentary
•� The latest figures show an increase in the proportion of people with mental health problems who live in stable and appropriate accommodation from 47% (at 2011/12 Q1) to 62% (at 2012/13 Q1). •� Analysis of these figures by gender shows a similar improvement for both genders during this period. In the latest figures, the difference by gender is 4 percentage points.Source: Mental Health Minimum Data Set
The context and more information
•� Poor, unstable housing and accommodation or homelessness can contribute to the development of mental health problems, or can make existing mental health problems more difficult to manage. •� Housing organisations, health and social service commissioners and providers, have a key role in working together to provide integrated support for people with mental health problems. The ‘No health
without mental health: implementation framework’ highlights what organisations can do to support people with mental health problems and housing needs. https://www.gov.uk/government/publications/national-framework-to-improve-mental-health-and-wellbeing
•� Measures in ‘The Adult Social Care Outcomes Framework 2013/14’ and the ‘The Public Health Outcomes Framework for England 2013 to 2016’ intend to improve outcomes for people with mental health problems, by demonstrating the proportion of people who live in stable and appropriate accommodation.https://www.gov.uk/government/uploads/system/uploads/attachment_data/file/141627/The-Adult-Social-Care-Outcomes-Framework-2013-14.pdfhttps://www.gov.uk/government/publications/healthy-lives-healthy-people-improving-outcomes-and-supporting-transparencyhttps://indicators.ic.nhs.uk/webview/http://www.phoutcomes.info/

33
Figure 3: Proportion of people with mental health problems in stable and appropriate accommodation by age
Figure 4: Proportion of people with mental health problems in stable and appropriate accommodation by ethnicity
18 to 35
36 to 69
0%
10%
20%
30%
40%
50%
60%
70%
Quarter 12012/13
Quarter 42011/12
Quarter 32011/12
Quarter 22011/12
Quarter 12011/12
BME
White
0%
10%
20%
30%
40%
50%
60%
70%
80%
Quarter 12012/13
Quarter 42011/12
Quarter 32011/12
Quarter 22011/12
Quarter 12011/12
Commentary
•� Analysis of these figures by ethnicity and age group shows a similar improvement for all groups during this period. •� For the latest figures, variations within ethnicity and age group are between 8 and 4 percentage points. Source: Mental Health Minimum Data Set
The context and more information
•� Poor, unstable housing and accommodation or homelessness can contribute to the development of mental health problems, or can make existing mental health problems more difficult to manage. •� Housing organisations, health and social service commissioners and providers, have a key role in working together to provide integrated support for people with mental health problems.
The ‘No health without mental health: implementation framework’ highlights what organisations can do to support people with mental health problems and housing needs. https://www.gov.uk/government/publications/national-framework-to-improve-mental-health-and-wellbeing
•� Measures in ‘The Adult Social Care Outcomes Framework 2013/14’ and the ‘The Public Health Outcomes Framework for England 2013 to 2016’ intend to improve outcomes for people with mental health problems, by demonstrating the proportion of people who live in stable and appropriate accommodation.https://www.gov.uk/government/uploads/system/uploads/attachment_data/file/141627/The-Adult-Social-Care-Outcomes-Framework-2013-14.pdfhttps://www.gov.uk/government/publications/healthy-lives-healthy-people-improving-outcomes-and-supporting-transparencyhttps://indicators.ic.nhs.uk/webview/http://www.phoutcomes.info/

34
Social care related quality of life (SCRQoL) for people with mental health related social care needs11
Figure 1: Social care related quality of life – client group Figure 2: Social care related quality of life – gender
2010/11
2011/12
0
5
10
15
20
25
Learning disabilitiesPhysical disabilitiesMental health
Males
Females
0
17
18
19
20
21
22
23
24
25
Learning disabilitiesPhysical disabilitiesMental health
Commentary
•� The Social Care Related Quality of Life (SCRQoL) average score was lowest for people with mental health related social care needs, compared with those for people with physical health problems or learning disabilities.
•� For those with mental health related social care needs, the SCRQoL average score was slightly lower for females compared to males. For those with physical health problems or learning disabilities, females’ average SCRQoL scores were somewhat higher.
Source: Adult Social Care Survey (ASCS)
* The SCRQoL indicator measures responses to eight survey questions relating to social care quality of life for control, dignity, personal care, food and nutrition, safety, occupation, social participation and accommodation.
The context and more information
•� For people with mental health problems, quality of life is often limited by an ability to pursue the different aspects of social care related quality of life, often due to environmental, and sometimes financial, barriers. Broadening opportunities for people with mental illness and developing ‘independence’, ‘choice’ and ‘control’ improves mental health outcomes.
•� A key principle of the ‘No health without mental health: implementation framework’ is that public services work together around the needs and aspirations of people and communities.https://www.gov.uk/government/publications/national-framework-to-improve-mental-health-and-wellbeing
•� Measures in ‘The Adult Social Care Outcomes Framework 2013/14’ support a focus on empowerment, choice and control, with direct measures on personalisation and control, as well as measures of employment and accommodation for people with a learning disability and people with mental health problems. https://www.gov.uk/government/uploads/system/uploads/attachment_data/file/141627/The-Adult-Social-Care-Outcomes-Framework-2013-14.pdfhttps://indicators.ic.nhs.uk/webview/
35
Figure 3: Social care related quality of life – ethnicity Figure 4: Social care related quality of life – age
0
5
10
15
20
25
BMEWhite0
2
4
6
8
10
12
14
16
18
20
85+75–8465–7455–6445–5435–4425–3418–24
Commentary
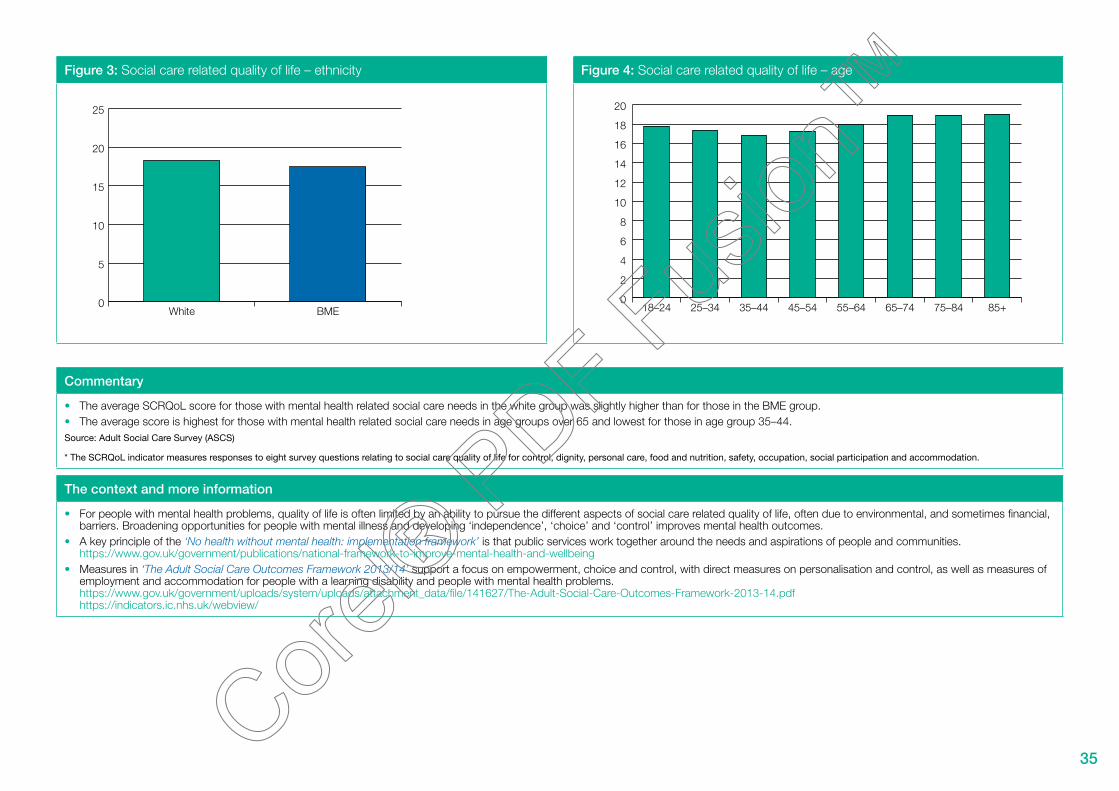
•� The average SCRQoL score for those with mental health related social care needs in the white group was slightly higher than for those in the BME group.•� The average score is highest for those with mental health related social care needs in age groups over 65 and lowest for those in age group 35–44.Source: Adult Social Care Survey (ASCS)
* The SCRQoL indicator measures responses to eight survey questions relating to social care quality of life for control, dignity, personal care, food and nutrition, safety, occupation, social participation and accommodation.
The context and more information
•� For people with mental health problems, quality of life is often limited by an ability to pursue the different aspects of social care related quality of life, often due to environmental, and sometimes financial, barriers. Broadening opportunities for people with mental illness and developing ‘independence’, ‘choice’ and ‘control’ improves mental health outcomes.
•� A key principle of the ‘No health without mental health: implementation framework’ is that public services work together around the needs and aspirations of people and communities.https://www.gov.uk/government/publications/national-framework-to-improve-mental-health-and-wellbeing
•� Measures in ‘The Adult Social Care Outcomes Framework 2013/14’ support a focus on empowerment, choice and control, with direct measures on personalisation and control, as well as measures of employment and accommodation for people with a learning disability and people with mental health problems. https://www.gov.uk/government/uploads/system/uploads/attachment_data/file/141627/The-Adult-Social-Care-Outcomes-Framework-2013-14.pdfhttps://indicators.ic.nhs.uk/webview/

36
Objective 3:
More people with mental health problems will havebetter physical health

37
No health without mental healthMental health dashboard
3 More people with mental health problems will have better physical health
Indicator Data source Links to outcomes framework
Latest year Previous year Trend
Physical health of people with serious mental illness
Excess under 75 mortality rate (per 100,000 population)
MHMDS linked over years to ONS death registrations
NHS OF 921 891
Physical health of people with mental health problems
Comorbid long term physical health conditions among people with long term mental health problems
GP Patient Survey (GPPS) – 51.9% 51.6%
Comorbid long term mental health conditions among people with long term phsyical health problems
GP Patient Survey (GPPS) – 5% 4.8%
Mental health and alcohol misuse Health Survey for England (HSE) – 34% 32%
Mental health and obesity Health Survey for England (HSE) – 32% 26%
Mental health and smoking Health Survey for England (HSE) – 29% 31%

38
Excess mortality in people with serious mental illness12
Figure 1: Excess under 75 mortality rate in adults with serious mental illness (per 100,000 population)
Figure 2: Excess under 75 mortality rate in adults with serious mental illness by gender (per 100,000 population)
Serious mentalillness (a)
Excess under 75mortality rate(=a-b)
Generalpopulation (b)
0
200
400
600
800
1,000
1,200
1,400
1,600
2010/112009/102008/09
0
200
400
600
800
1,000
1,200
FemaleMaleFemaleMaleFemaleMale
2008/09 2009/10 2010/11
Commentary
•� In 2010/11, the under-75 mortality rate for people with serious mental illness was 1,323 (per 100,000 of the population) compared with 402 for the general population. The excess mortality rate of 921 is a 3% reduction from the 2008/09 rate.
•� The excess under-75 mortality rate has been much higher for men compared to women for each year from 2008/09 to 2010/11, with the latest excess rates being 1,114 for men and 730 for women. Source: Mental Health Minimum Data Set, ONS death registrations and mid-year population estimates
The context and more information
•� Having a mental health problem increases the risk of physical ill health, avoidable harm and suicide.•� Indicators in the ‘NHS Outcomes Framework 2013–14’ and the ‘Public Health Outcomes Framework for England 2013 to 2016’ for reducing excess under-75 mortality in adults with serious mental
health illness will show progress in improving physical health for people with mental health problems. https://www.gov.uk/government/publications/healthy-lives-healthy-people-improving-outcomes-and-supporting-transparency. https://www.gov.uk/government/uploads/system/uploads/attachment_data/file/127106/121109-NHS-Outcomes-Framework-2013-14.pdfhttps://indicators.ic.nhs.uk/webview/http://www.phoutcomes.info/
•� A continuing focus on reducing suicide rates in people with mental health problems, and the population in general, will be critical. The inclusion of suicide as an indicator within the ‘Public Health Outcomes Framework for England 2013 to 2016’ will help track national progress against our overall objective to reduce the suicide rate. ‘Preventing suicide in England – A cross-government outcomes strategy to save lives’, published September 2012, outlines shared objectives for action. https://www.gov.uk/government/publications/healthy-lives-healthy-people-improving-outcomes-and-supporting-transparencyhttps://www.gov.uk/government/publications/suicide-prevention-strategy-launched

39
Figure 3: Excess under 75 mortality rate in adults with serious mental illness by age groups (per 100,000 population)
0
500
1,000
1,500
2,000
2,500
3,000
3,500
4,000
4,500
70–7460–6950–5940–4930–3918–29
Commentary
•� The excess under-75 mortality rate increases with age. The excess mortality rate ranges from around 136 for individuals aged 18–29, to 4,239 for individuals aged 70–74 with serious mental illness (per 100,000 population).
Source: Mental Health Minimum Data Set, ONS death registrations and mid-year population estimates
The context and more information
•� Having a mental health problem increases the risk of physical ill health, avoidable harm and suicide.•� Indicators in the ‘NHS Outcomes Framework 2013–14’ and the ‘Public Health Outcomes Framework for England 2013 to 2016’ for reducing excess under-75 mortality in adults with serious mental
health illness will show progress in improving physical health for people with mental health problems. https://www.gov.uk/government/publications/healthy-lives-healthy-people-improving-outcomes-and-supporting-transparency. https://www.gov.uk/government/uploads/system/uploads/attachment_data/file/127106/121109-NHS-Outcomes-Framework-2013-14.pdfhttps://indicators.ic.nhs.uk/webview/http://www.phoutcomes.info/
•� A continuing focus on reducing suicide rates in people with mental health problems, and the population in general, will be critical. The inclusion of suicide as an indicator within the ‘Public Health Outcomes Framework for England 2013 to 2016’ will help track national progress against our overall objective to reduce the suicide rate. ‘Preventing suicide in England – A cross-government outcomes strategy to save lives’, published September 2012, outlines shared objectives for action. https://www.gov.uk/government/publications/healthy-lives-healthy-people-improving-outcomes-and-supporting-transparencyhttp://www.phoutcomes.info/https://www.gov.uk/government/publications/suicide-prevention-strategy-launched

40
Comorbid long term physical health conditions among people with long term mental health problems13
Figure 1: Proportion of people with a long term mental health condition who also have a long term physical condition
Figure 2: Proportion of people with a long term mental health condition who also have a long term physical condition by gender
People with long termmental health problem
Overall population
0%
42%
44%
46%
48%
50%
52%
54%
2011/12 Wave2+2012/13 Wave1
2011/12Wave1+Wave2
People with long termmental health problem
Overall population
0%
42%
44%
46%
48%
50%
52%
54%
FemaleMale
Commentary
•� Compared to the overall population, a higher proportion of people with long term mental health problems have an additional long term physical condition.•� Of people with LTMH problems, women are slightly more likely than men to have an additional long term physical condition.Source: GP patient survey
The context and more information
•� The public health white paper ‘Healthy Lives, Healthy People’ is the first public health strategy to give equal weight to both mental and physical health. Mental health also features strongly in ‘Public Health England – Our priorities for 2013/14’, committing to develop a national programme on mental health in public health that supports the cross-government strategy ‘No health without mental health’. The document prioritises the promotion of mental wellbeing, prevention of mental health problems and the prevention of suicide, along with improving the wellbeing of those living with, and recovering from, mental illness. https://www.gov.uk/government/publications/healthy-lives-healthy-people-our-strategy-for-public-health-in-englandhttps://www.gov.uk/government/uploads/system/uploads/attachment_data/file/192676/Our_priorities_final.pdfhttps://www.gov.uk/government/uploads/system/uploads/attachment_data/file/135457/dh_124058.pdf.pdf
•� ‘Preventing suicide in England – A cross-government outcomes strategy to save lives’, highlights treating mental and physical health as equally important in the context of suicide prevention. This will have implications for the management of care for people who self-harm and for effective 24-hour responses to mental health crises.https://www.gov.uk/government/publications/suicide-prevention-strategy-launched
41
Figure 3: Proportion of people with a long term mental health condition who also have a long term physical condition by area of deprivation
Figure 4: Proportion of people with a long term mental health condition who also have a long term physical condition by age groups
People with long termmental health problem
Overall population
0%
10%
20%
30%
40%
50%
60%
Least deprivedModerately deprivedMost deprived
People with long termmental health problem
Overall population
0%
10%
20%
30%
40%
50%
60%
70%
80%
90%
85+75–8465–7455–6445–5435–4425–3418–24
Commentary
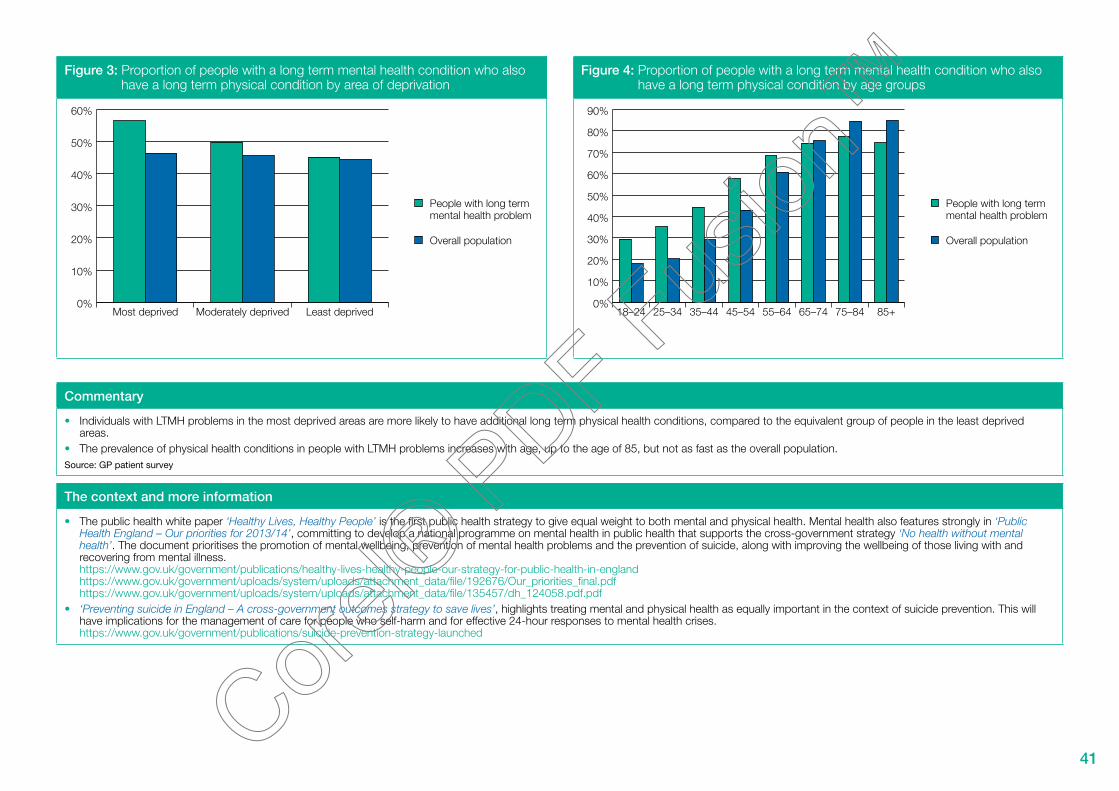
•� Individuals with LTMH problems in the most deprived areas are more likely to have additional long term physical health conditions, compared to the equivalent group of people in the least deprived areas.
•� The prevalence of physical health conditions in people with LTMH problems increases with age, up to the age of 85, but not as fast as the overall population.Source: GP patient survey
The context and more information
•� The public health white paper ‘Healthy Lives, Healthy People’ is the first public health strategy to give equal weight to both mental and physical health. Mental health also features strongly in ‘Public Health England – Our priorities for 2013/14’, committing to develop a national programme on mental health in public health that supports the cross-government strategy ‘No health without mental health’. The document prioritises the promotion of mental wellbeing, prevention of mental health problems and the prevention of suicide, along with improving the wellbeing of those living with and recovering from mental illness. https://www.gov.uk/government/publications/healthy-lives-healthy-people-our-strategy-for-public-health-in-englandhttps://www.gov.uk/government/uploads/system/uploads/attachment_data/file/192676/Our_priorities_final.pdfhttps://www.gov.uk/government/uploads/system/uploads/attachment_data/file/135457/dh_124058.pdf.pdf
•� ‘Preventing suicide in England – A cross-government outcomes strategy to save lives’, highlights treating mental and physical health as equally important in the context of suicide prevention. This will have implications for the management of care for people who self-harm and for effective 24-hour responses to mental health crises.https://www.gov.uk/government/publications/suicide-prevention-strategy-launched

42
Comorbid long term mental health problems among people with long term physical health conditions13
Figure 1: Proportion of people with long term physical health conditions who also have a long term mental health condition
Figure 2: Proportion of people with long term physical health conditions who also have a long term mental health condition by gender
People with long termphysical condition
Overall population
0%
1%
2%
3%
4%
5%
6%
7%
8%
2011/12 Wave2+2012/13 Wave1
2011/12Wave2+ Wave1
People with long termphysical condition
Overall population
0%
1%
2%
3%
4%
5%
6%
FemaleMale
Commentary
•� Compared to the overall population, a higher proportion of people with a long term physical condition have additional long term mental health problems.•� Of people with a long term physical condition, women are slightly more likely than men to have additional long term mental health problems.Source: GP patient survey
The context and more information
•� It is not possible to improve the nation’s general health or respond effectively to the challenge of long term conditions without tackling mental health issues. •� Routine assessment for depression as part of personalised care planning for people with long term conditions, can help reduce inequalities and help people to have a better quality of life.•� Targeted interventions for both the physical health needs of people with mental health problems, and mental health support for people with physical health problems, especially long term conditions is
important. The ‘No health without mental health: implementation framework’ explains how co-location of staff or multi-disciplinary teams can help achieve this. https://www.gov.uk/government/publications/national-framework-to-improve-mental-health-and-wellbeing

43
Figure 3: Proportion of people with long term physical health conditions who also have a long term mental health condition by area of deprivation
Figure 4: Proportion of people with long term physical health conditions who also have a long term mental health condition by age
People with long termphysical condition
Overall population
0%
1%
2%
3%
4%
5%
6%
7%
8%
Least deprivedModerately deprivedMost deprived
People with long termphysical condition
Overall population
0%
1%
2%
3%
4%
5%
6%
7%
8%
9%
10%
85+75–8465–7455–6445–5435–4425–3418–24
Commentary
•� Individuals with a long term physical condition who live in the most deprived areas are more likely to have additional mental health conditions, compared to individuals who live in the least deprived areas.
•� The prevalence of long term mental health conditions in people with long term physical conditions is highest in the age groups up to and including ‘45–54’.Source: GP patient survey
The context and more information
•� It is not possible to improve the nation’s general health or respond effectively to the challenge of long term conditions without tackling mental health issues. •� Routine assessment for depression as part of personalised care planning for people with long term conditions, can help reduce inequalities and help people to have a better quality of life.•� Targeted interventions for both the physical health needs of people with mental health problems and mental health support for people with physical health problems, especially long term conditions,
is important. The ‘No health without mental health: implementation framework’ explains how co-location of staff or multi-disciplinary teams can help achieve this. https://www.gov.uk/government/publications/national-framework-to-improve-mental-health-and-wellbeing

44
Mental health and alcohol misuse14
Figure 1: Mental health and alcohol misuse – 2003–2010 Figure 2: Alcohol misuse by age groups – 2010
Possible mentalhealth problems
General population
0%
5%
10%
15%
20%
25%
30%
35%
40%
20102009200820072006200520042003
Possible mentalhealth problems
General population
0%
10%
20%
30%
40%
50%
60%
70%
80%
65+55–6445–5435–4425–3416–24
Commentary
•� Alcohol misuse is more prominent in people with possible mental health problems, compared to the general population. •� The rate is higher for adults of working age with possible mental health problems, but the trend reverses for older people. Source: Health Survey for England (HSE)
The context and more information
•� There is a clear association between having a mental illness and alcohol dependence – if you drink too much, you put your mental health at risk. If you have a mental health problem, you are more likely to drink at levels that put your health at risk.
•� The Government’s Alcohol Strategy, published in March 2012, sets out a wide range of actions being taken forward to tackle excessive alcohol consumption. It highlights the clear association between mental illness and drug and alcohol misuse, and that an effective approach locally requires partnership working and an integrated approach, providing patient-centred services to meet individual need.
•� Helping people to live longer and more healthy lives by reducing preventable deaths and the burden of ill health associated with smoking, high blood pressure, obesity, poor diet, poor mental health, insufficient exercise and alcohol, is one of the five high level priorities for Public Health England in 2013/14 https://www.gov.uk/government/uploads/system/uploads/attachment_data/file/192676/Our_priorities_final.pdf
•� An alcohol related indicator is included in the ‘Public Health Outcomes Framework for England 2013 to 2016’https://www.gov.uk/government/publications/healthy-lives-healthy-people-improving-outcomes-and-supporting-transparencyhttp://www.phoutcomes.info/

45
Figure 3: Alcohol misuse by income group – 2010 Figure 4: Alcohol misuse by gender – 2010
Possible mentalhealth problems
General population
0%
5%
10%
15%
20%
25%
30%
35%
40%
45%
Second highestand
highest quintile
Middlequintile
Lowest andsecond lowest
quintile
Possible mentalhealth problems
General population
0%
5%
10%
15%
20%
25%
30%
35%
40%
FemalesMales
Commentary
•� Alcohol misuse rates are highest for people with possible mental health problems that belong to the lowest two income quintiles.•� Alcohol misuse rates are higher for men from both groups – people with possible mental health problems and the general population. Differences in alcohol misuse rates between men and women are
bigger in the general population.Source: Health Survey for England (HSE)
The context and more information
•� There is a clear association between having a mental illness and increasing risk of alcohol dependence – if you drink too much, you put your mental health at risk. If you have a mental health problem, you are more likely to drink at levels that put your health at risk.
•� The Government’s Alcohol Strategy, published in March 2012, sets out a wide range of actions being taken forward to tackle excessive alcohol consumption. It highlights the clear association between mental illness and drug and alcohol misuse, and that an effective approach locally requires partnership working and an integrated approach, providing patient-centred services to meet individual need.
•� Helping people to live longer and more healthy lives by reducing preventable deaths and the burden of ill health associated with smoking, high blood pressure, obesity, poor diet, poor mental health, insufficient exercise and alcohol, is one of the five high level priorities for Public Health England in 2013/14 https://www.gov.uk/government/uploads/system/uploads/attachment_data/file/192676/Our_priorities_final.pdf
•� An alcohol related indicator is included in the ‘Public Health Outcomes Framework for England 2013 to 2016’https://www.gov.uk/government/publications/healthy-lives-healthy-people-improving-outcomes-and-supporting-transparencyhttp://www.phoutcomes.info/

46
Mental health and obesity15
Figure 1: Mental health and obesity – 2003–2010 Figure 2: Prevalence of obesity by age groups – 2010
Possible mentalhealth problems
General population
0%
5%
10%
15%
20%
25%
30%
35%
20102009200820072006200520042003
Possible mentalhealth problems
General population
0%
5%
10%
15%
20%
25%
30%
35%
40%
45%
75+65–7455–6445–5435–4425–3416–24
Commentary
•� People with possible mental health problems are slightly more likely to be obese than the general population (32% vs 26% in 2010). This has been the pattern over the last seven years and the latest figures show the gap widening.
•� In the latest figures, those with possible mental health problems are more likely to be obese for each age group. People in age group 55–64 are most likely to be obese. Those with possible mental health problems in this age group (alongside 45–54 and 75+) show the largest gap in likelihood of obesity, when compared with the general population.
Source: Health Survey for England (HSE)
The context and more information
•� Excess weight is a major risk factor for diseases such as type 2 diabetes, cancer and heart disease. Alongside the serious ill-health it can cause, it can reduce people’s prospects in life, affecting their self-esteem and their underlying mental health.
•� Tackling obesity is a priority for Government and ‘The call to action on obesity in England’ sets out the overall approach and the role that different partners can play https://www.gov.uk/government/publications/healthy-lives-healthy-people-a-call-to-action-on-obesity-in-england
•� The call to action includes national ambitions for a downward trend in obesity in children and adults by 2020. This is mirrored by two indicators in the Public Health Outcomes Framework on excess weight in children and adults https://www.gov.uk/government/publications/healthy-lives-healthy-people-improving-outcomes-and-supporting-transparencyhttp://www.phoutcomes.info/

47
Figure 3: Prevalence of obesity by gender – 2010 Figure 4: Prevalence of obesity by income group – 2010
Possible mentalhealth problems
General population
0%
5%
10%
15%
20%
25%
30%
35%
FemalesMales
Generalpopulation
Possible mentalhealth problems
0% 10% 20% 30% 40% 50%
Lowest quintile
Second lowest quintile
Middle quintile
Second highest quintile
Highest quintile
Commentary
•� In the latest figures, those with possible mental health problems are more likely to be obese for both genders. Of those with possible mental health problems, obesity is more prevalent among women compared to men.
•� People in the lowest income quintile are most likely to be obese. In this quintile, the gap for those with possible mental health problems compared with the general population (40% vs 30%) is the greatest. In the highest quintile income group the gap is very small.
Source: Health Survey for England (HSE)
The context and more information
•� Excess weight is a major risk factor for diseases such as type 2 diabetes, cancer and heart disease. Alongside the serious ill-health it can cause, it can reduce people’s prospects in life, affecting their self-esteem and their underlying mental health.
•� Tackling obesity is a priority for Government and ‘The call to action on obesity in England’ sets out the overall approach and the role that different partners can play https://www.gov.uk/government/publications/healthy-lives-healthy-people-a-call-to-action-on-obesity-in-england
•� The call to action includes national ambitions for a downward trend in obesity in children and adults by 2020. This is mirrored by two indicators in the Public Health Outcomes Framework on excess weight in children and adults https://www.gov.uk/government/publications/healthy-lives-healthy-people-improving-outcomes-and-supporting-transparencyhttp://www.phoutcomes.info/
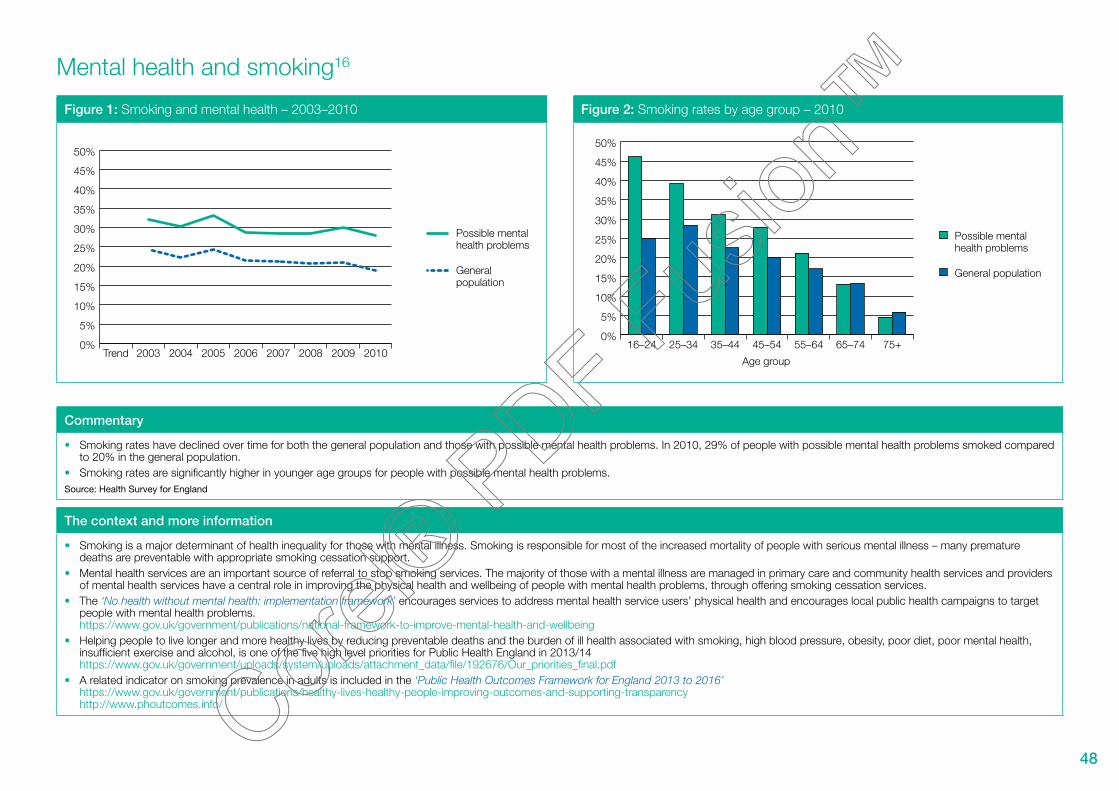
48
Mental health and smoking16
Figure 1: Smoking and mental health – 2003–2010 Figure 2: Smoking rates by age group – 2010
Possible mentalhealth problems
General population
0%
5%
10%
15%
20%
25%
30%
35%
40%
45%
50%
20102009200820072006200520042003Trend
Possible mentalhealth problems
General population
Age group
0%
5%
10%
15%
20%
25%
30%
35%
40%
45%
50%
75+65–7455–6445–5435–4425–3416–24
Commentary
•� Smoking rates have declined over time for both the general population and those with possible mental health problems. In 2010, 29% of people with possible mental health problems smoked compared to 20% in the general population.
•� Smoking rates are significantly higher in younger age groups for people with possible mental health problems. Source: Health Survey for England
The context and more information
•� Smoking is a major determinant of health inequality for those with mental illness. Smoking is responsible for most of the increased mortality of people with serious mental illness – many premature deaths are preventable with appropriate smoking cessation support.
•� Mental health services are an important source of referral to stop smoking services. The majority of those with a mental illness are managed in primary care and community health services and providers of mental health services have a central role in improving the physical health and wellbeing of people with mental health problems, through offering smoking cessation services.
•� The ‘No health without mental health: implementation framework’ encourages services to address mental health service users’ physical health and encourages local public health campaigns to target people with mental health problems.https://www.gov.uk/government/publications/national-framework-to-improve-mental-health-and-wellbeing
•� Helping people to live longer and more healthy lives by reducing preventable deaths and the burden of ill health associated with smoking, high blood pressure, obesity, poor diet, poor mental health, insufficient exercise and alcohol, is one of the five high level priorities for Public Health England in 2013/14https://www.gov.uk/government/uploads/system/uploads/attachment_data/file/192676/Our_priorities_final.pdf
•� A related indicator on smoking prevalence in adults is included in the ‘Public Health Outcomes Framework for England 2013 to 2016’https://www.gov.uk/government/publications/healthy-lives-healthy-people-improving-outcomes-and-supporting-transparencyhttp://www.phoutcomes.info/
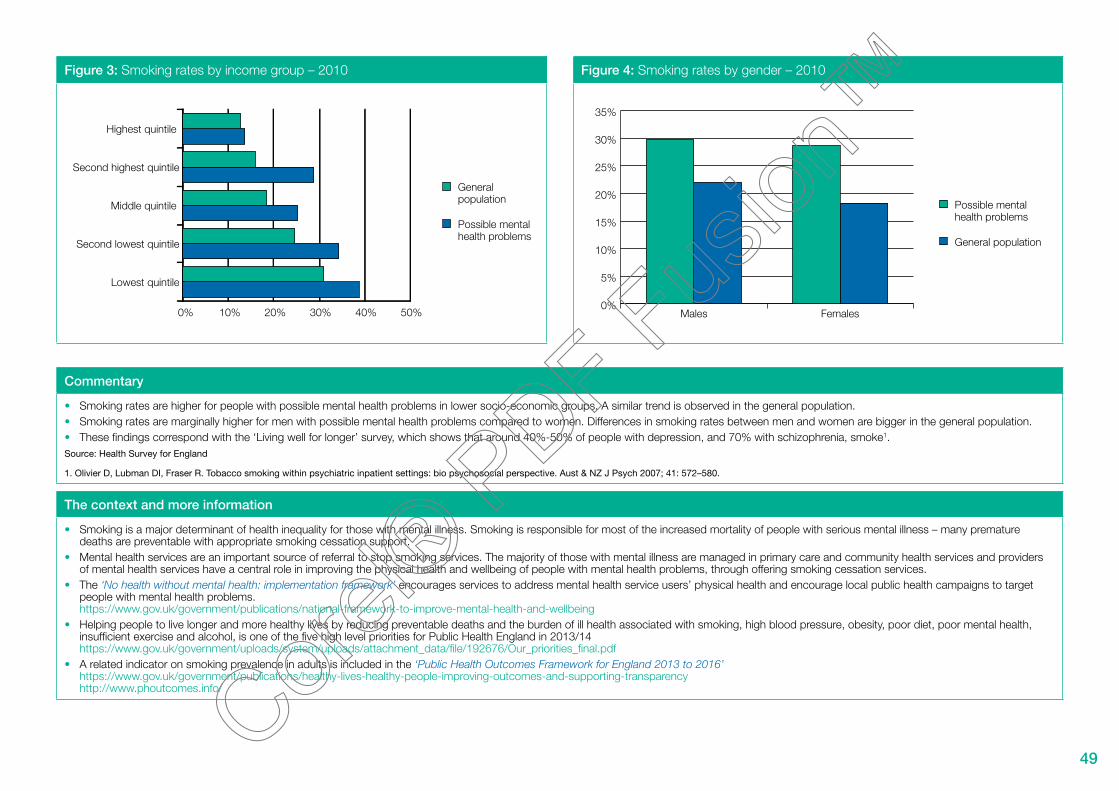
49
Figure 3: Smoking rates by income group – 2010 Figure 4: Smoking rates by gender – 2010
Generalpopulation
Possible mentalhealth problems
0% 10% 20% 30% 40% 50%
Lowest quintile
Second lowest quintile
Middle quintile
Second highest quintile
Highest quintile
Possible mentalhealth problems
General population
0%
5%
10%
15%
20%
25%
30%
35%
FemalesMales
Commentary
•� Smoking rates are higher for people with possible mental health problems in lower socio-economic groups. A similar trend is observed in the general population.•� Smoking rates are marginally higher for men with possible mental health problems compared to women. Differences in smoking rates between men and women are bigger in the general population.•� These findings correspond with the ‘Living well for longer’ survey, which shows that around 40%-50% of people with depression, and 70% with schizophrenia, smoke1. Source: Health Survey for England
1. Olivier D, Lubman DI, Fraser R. Tobacco smoking within psychiatric inpatient settings: bio psychosocial perspective. Aust & NZ J Psych 2007; 41: 572–580.
The context and more information
•� Smoking is a major determinant of health inequality for those with mental illness. Smoking is responsible for most of the increased mortality of people with serious mental illness – many premature deaths are preventable with appropriate smoking cessation support.
•� Mental health services are an important source of referral to stop smoking services. The majority of those with mental illness are managed in primary care and community health services and providers of mental health services have a central role in improving the physical health and wellbeing of people with mental health problems, through offering smoking cessation services.
•� The ‘No health without mental health: implementation framework’ encourages services to address mental health service users’ physical health and encourage local public health campaigns to target people with mental health problems.https://www.gov.uk/government/publications/national-framework-to-improve-mental-health-and-wellbeing
•� Helping people to live longer and more healthy lives by reducing preventable deaths and the burden of ill health associated with smoking, high blood pressure, obesity, poor diet, poor mental health, insufficient exercise and alcohol, is one of the five high level priorities for Public Health England in 2013/14https://www.gov.uk/government/uploads/system/uploads/attachment_data/file/192676/Our_priorities_final.pdf
•� A related indicator on smoking prevalence in adults is included in the ‘Public Health Outcomes Framework for England 2013 to 2016’https://www.gov.uk/government/publications/healthy-lives-healthy-people-improving-outcomes-and-supporting-transparencyhttp://www.phoutcomes.info/

50
Objective 4:
More people will have a positive experience of care and support
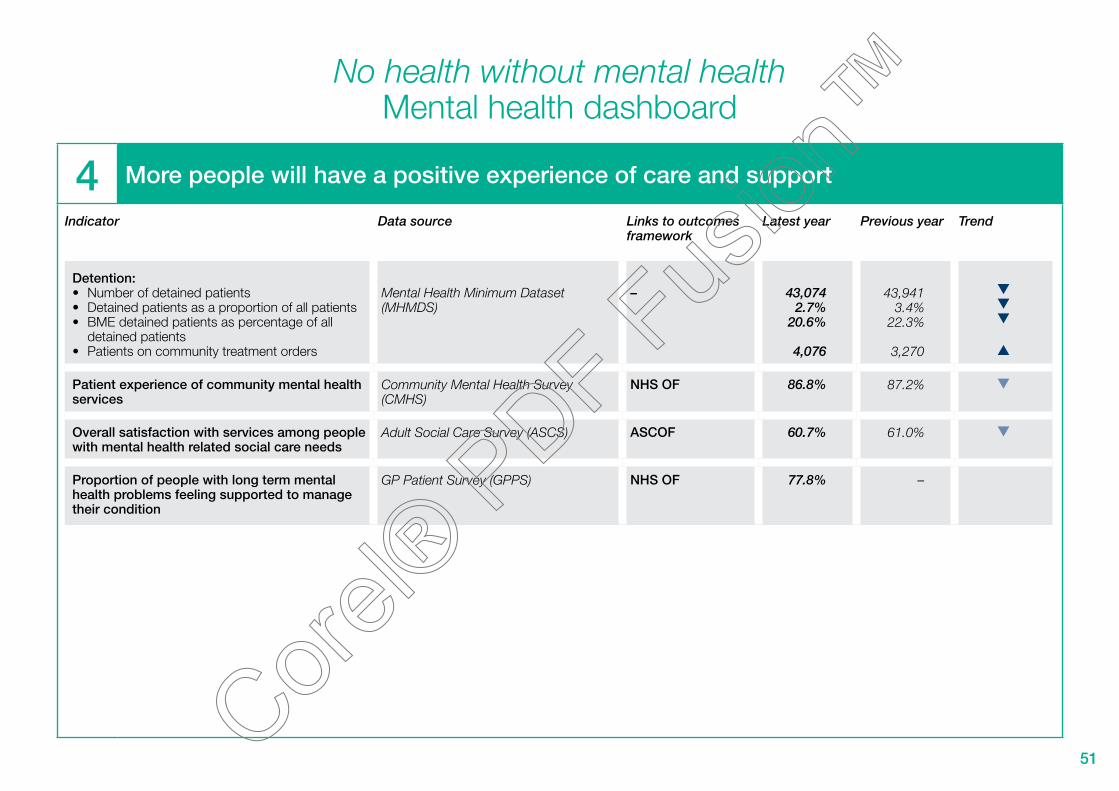
51
No health without mental healthMental health dashboard
4 More people will have a positive experience of care and support
Indicator
Detention:•� Number of detained patients•� Detained patients as a proportion of all patients•� BME detained patients as percentage of all
detained patients•� Patients on community treatment orders
Patient experience of community mental health services
Overall satisfaction with services among people with mental health related social care needs
Proportion of people with long term mental health problems feeling supported to manage their condition
Data source
Mental Health Minimum Dataset (MHMDS)
Community Mental Health Survey (CMHS)
Adult Social Care Survey (ASCS)
GP Patient Survey (GPPS)
Links to outcomes framework
–
NHS OF
ASCOF
NHS OF
Latest year
43,0742.7%
20.6%
4,076
86.8%
60.7%
77.8%
Previous year
43,9413.4%
22.3%
3,270
87.2%
61.0%
–
Trend

52
Detention and compulsory treatment17
Figure 1: Number of detained patients Figure 2: Detained patients as a proportion of all mental health patients and inpatients
0
42,000
42,500
43,000
43,500
44,000
44,500
2011/122010/112009/10
Detained patients asa proportion of all mental health patients
Detained patients asa proportion of allmental health inpatients
0%
5%
10%
15%
20%
25%
30%
35%
40%
45%
2011/122010/112009/10
Commentary
•� The number of detained patients has fluctuated over the last three years and in the latest figures is just over 43,000. •� The number of detained patients as a proportion of all mental health patients decreased between 2010/11 and 2011/12, while as a proportion of all mental health inpatients it increased in the same
period.Source: Mental Health Minimum Data Set (MHMDS)
The context and more information
•� ‘The abandoned illness – A report by the Schizophrenia Commission’ reported that ‘too much is spent on secure care, with many people staying too long in expensive units when they are well enough to start back on the route to the community’.http://www.rethink.org/media/514093/TSC_main_report_14_nov.pdf
•� For people with a serious mental health problem, primary care services play an important role in supporting their physical health. The ‘No health without mental health: implementation framework’ details what primary care providers can do to recognise people at risk of developing mental health problems and provide appropriate early interventions. https://www.gov.uk/government/publications/national-framework-to-improve-mental-health-and-wellbeing

53
Figure 3: BME detained patients as a proportion of all detained patients Figure 4: Number of patients in community treatment orders (CTOs)
0%
5%
10%
15%
20%
25%
30%
2011/122010/112009/100
500
1,000
1,500
2,000
2,500
3,000
3,500
4,000
4,500
2011/122010/112009/10
Commentary
•� BME detained patients as a proportion of all detained patients decreased slightly between 2010/11 and 2011/12 (22% compared to 21%).•� Between 2009/10 and 2011/12 the number of patients subject to community treatment orders doubled (2,000 and 4,076).Source: Mental Health Minimum Data Set (MHMDS)
The context and more information
•� ‘The abandoned illness – A report by the Schizophrenia Commission’ reported that ‘too much is spent on secure care, with many people staying too long in expensive units when they are well enough to start back on the route to the community’.http://www.rethink.org/media/514093/TSC_main_report_14_nov.pdf
•� For people with a serious mental health problem, primary care services play an important role in supporting their physical health. The ‘No health without mental health: implementation framework’ details what primary care providers can do to recognise people at risk of developing mental health problems and provide appropriate early interventions. https://www.gov.uk/government/publications/national-framework-to-improve-mental-health-and-wellbeing

54
Patient experience of community mental health services18
Figure 1: Patient experience of community mental health services Figure 2: Patient experience of secondary mental health services compared to other NHS services
0%
81%
82%
83%
84%
85%
86%
87%
88%
89%
90%
201120100%
55%
60%
65%
70%
75%
80%
85%
90%
Community mentalhealth services
NHS dentalservices
GP out ofhours services
GP services
Commentary
•� There has been a slight decrease in the proportion of patients who felt satisfied with community mental health services from 87.2% in 2010, to 86.8% in 2011.•� Compared to NHS dental services and GP services, a slightly lower proportion of patients were satisfied with community mental health services. Source: Care Quality Commission Community Mental Health Services Survey
The context and more information
•� Services should be designed around the needs of individuals, ensuring appropriate, effective transition between services when necessary, without discriminatory, professional, organisation or location barriers getting in the way.
•� The ‘No health without mental health: implementation framework’ highlights what local authorities can do to involve the local community, including those with mental health problems, their families and carers, in the co-production of service pathways and in service design. This includes providing clear and accessible communication regarding how people’s views and priorities are taken into account. https://www.gov.uk/government/publications/national-framework-to-improve-mental-health-and-wellbeing
•� Patient experience of community mental health services is an indicator in the NHS Outcomes Framework 2013–14 https://www.gov.uk/government/uploads/system/uploads/attachment_data/file/127106/121109-NHS-Outcomes-Framework-2013-14.pdfhttp://indicators.ic.nhs.uk/webview/

55
Figure 3: Variation in patient experience of community mental health services by providers 2011
0%
78%
80%
82%
84%
86%
88%
90%
92%
94%
Commentary
•� In the latest figures, the proportion of patients who felt satisfied with their treatment showed variation between trusts ranging between 82% and 91.4%. Source: Care Quality Commission Community Mental Health Services Survey
The context and more information
•� Services should be designed around the needs of individuals, ensuring appropriate, effective transition between services when necessary, without discriminatory, professional, organisation or location barriers getting in the way.
•� The ‘No health without mental health: implementation framework’ highlights what local authorities can do to involve the local community, including those with mental health problems, their families and carers, in the co-production of service pathways and in service design. This includes providing clear and accessible communication regarding how people’s views and priorities are taken into account. https://www.gov.uk/government/publications/national-framework-to-improve-mental-health-and-wellbeing
•� Patient experience of community mental health services is an indicator in the NHS Outcomes Framework 2013–14 https://www.gov.uk/government/uploads/system/uploads/attachment_data/file/127106/121109-NHS-Outcomes-Framework-2013-14.pdfhttp://indicators.ic.nhs.uk/webview/
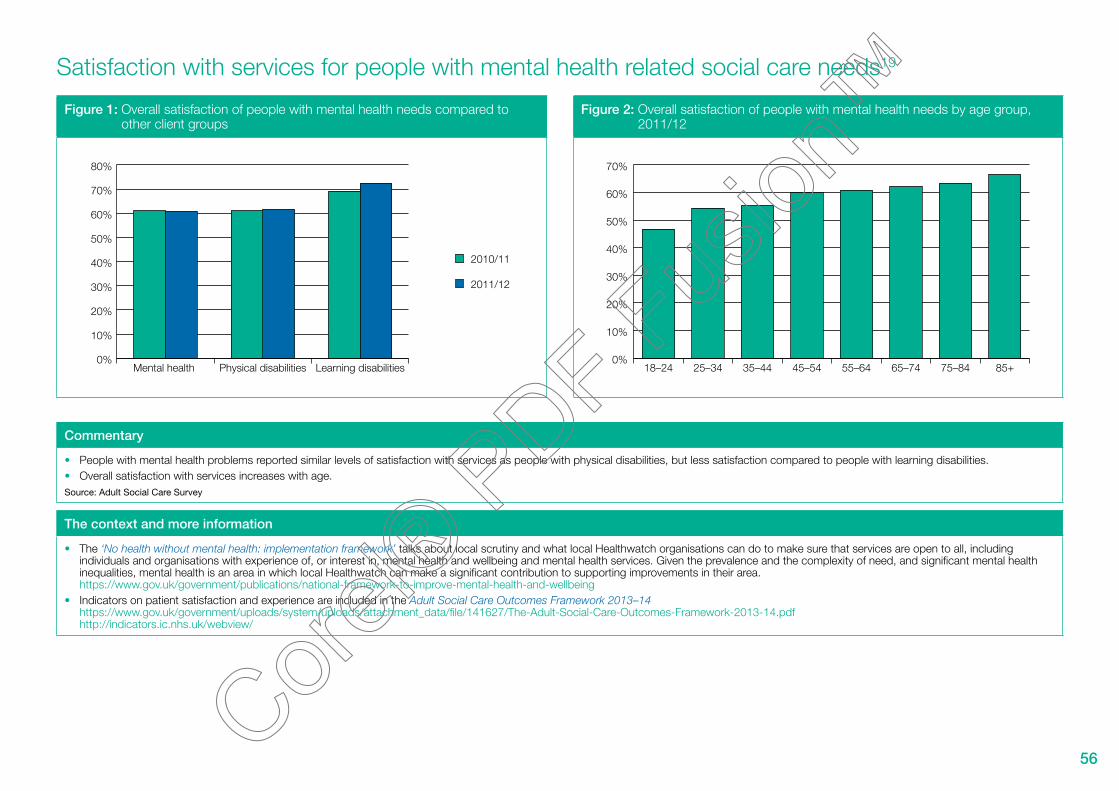
56
Satisfaction with services for people with mental health related social care needs19
Figure 1: Overall satisfaction of people with mental health needs compared to other client groups
Figure 2: Overall satisfaction of people with mental health needs by age group, 2011/12
2010/11
2011/12
0%
10%
20%
30%
40%
50%
60%
70%
80%
Learning disabilitiesPhysical disabilitiesMental health 0%
10%
20%
30%
40%
50%
60%
70%
85+75–8465–7455–6445–5435–4425–3418–24
Commentary
•� People with mental health problems reported similar levels of satisfaction with services as people with physical disabilities, but less satisfaction compared to people with learning disabilities.•� Overall satisfaction with services increases with age. Source: Adult Social Care Survey
The context and more information
•� The ‘No health without mental health: implementation framework’ talks about local scrutiny and what local Healthwatch organisations can do to make sure that services are open to all, including individuals and organisations with experience of, or interest in, mental health and wellbeing and mental health services. Given the prevalence and the complexity of need, and significant mental health inequalities, mental health is an area in which local Healthwatch can make a significant contribution to supporting improvements in their area. https://www.gov.uk/government/publications/national-framework-to-improve-mental-health-and-wellbeing
•� Indicators on patient satisfaction and experience are included in the Adult Social Care Outcomes Framework 2013–14https://www.gov.uk/government/uploads/system/uploads/attachment_data/file/141627/The-Adult-Social-Care-Outcomes-Framework-2013-14.pdfhttp://indicators.ic.nhs.uk/webview/

57
Figure 3: Overall satisfaction of people with mental health needs by ethnicity Figure 4: Overall satisfaction of people with mental health needs by gender
White
BME
0%
10%
20%
30%
40%
50%
60%
70%
2011/122010/11
2010/11
2011/12
0%
10%
20%
30%
40%
50%
60%
70%
80%
FemalesMales
Commentary
•� There is a significant difference in the level of satisfaction with services between people from white and BME backgrounds. There has been a drop in the levels of satisfaction with services for BME people.
•� Satisfaction with services of people with mental health needs is higher for females than for males.Source: Adult Social Care Survey
The context and more information
•� The ‘No health without mental health: implementation framework’ talks about local scrutiny and what local Healthwatch organisations can do to make sure that services are open to all, including individuals and organisations with experience of, or interest in, mental health and wellbeing and mental health services. Given the prevalence and the complexity of need, and significant mental health inequalities, mental health is an area in which local Healthwatch can make a significant contribution to supporting improvements in their area. https://www.gov.uk/government/publications/national-framework-to-improve-mental-health-and-wellbeing
•� Indicators on patient satisfaction and experience are included in the Adult Social Care Outcomes Framework 2013–14https://www.gov.uk/government/uploads/system/uploads/attachment_data/file/141627/The-Adult-Social-Care-Outcomes-Framework-2013-14.pdfhttp://indicators.ic.nhs.uk/webview/

58
People feeling supported to manage their condition20
Figure 1: Feeling supported – distribution of responses 2012 Figure 2: Feeling supported – age groups 2012
Don’t know/can’t say
I have not neededsuch support
No
Yes, to some extent
Yes, definitely
0%
10%
20%
30%
40%
50%
60%
70%
80%
90%
100%
Long term condition but nolong term mental health problem
Long term mentalhealth problem
Long term mentalhealth problem
Long termcondition but no long term mentalhealth problem
0%
65%
70%
75%
80%
85%
90%
85+75–8465–7455–6445–5435–4425–3418–24
Commentary
•� In 2012, around 37% of people with long term mental health problems felt definitely supported to manage their condition. Around 32% felt supported to some extent and around 20% felt not supported. The equivalent figures for people with other long term conditions were 41%, 25% and 11% respectively.
•� The percentage of people who feel supported to manage their long term mental health problem increases with age. Source: GP Patient Survey
The context and more information
•� Feeling sufficiently supported to manage a mental health problem improves recovery outcomes and is an important indicator of people’s experience of care.•� The ‘No health without mental health: implementation framework’ details what providers of mental health services can do to improve choice, recovery and personalisation for people with mental health
problems. This includes considering how service users’ perceptions of recovery can be incorporated into all elements of clinical practice and working to make sure people have appropriate support and access to advice and information. https://www.gov.uk/government/publications/national-framework-to-improve-mental-health-and-wellbeing
•� Recovery-oriented services aim to support people to build lives for themselves outside of mental health services, with an emphasis on hope, control and opportunity. The Implementing Recovery through Organisational Change programme provides tools to assess how well they are doing and take steps to become more recovery-oriented. http://www.imroc.org/
•� The proportion of people feeling supported to manage their condition is an indicator in the NHS Outcomes Framework 2013–14https://www.gov.uk/government/uploads/system/uploads/attachment_data/file/127106/121109-NHS-Outcomes-Framework-2013-14.pdfhttps://indicators.ic.nhs.uk/webview/

59
Figure 3: Feeling supported – ethnicity 2012 Figure 4: Feeling supported – sexual orientation 2012
Long term mentalhealth problem
Long term conditionother than long term mental health problem
0%
10%
20%
30%
40%
50%
60%
70%
80%
90%
BMEWhite
Heterosexual
Lesbian, gay,bisexual andtransgender
0%
70%
75%
80%
85%
90%
Long term condition other than long term mental health problem
Long termmental health problem
Commentary
•� Individuals from a white ethnic group felt more supported to manage their condition than those from a BME group.•� Lesbian, gay, bisexual and transgender (LGBT) people felt less supported than heterosexual people to manage their mental health problem.Source: GP Patient Survey
The context and more information
•� Feeling sufficiently supported to manage a mental health problem improves recovery outcomes and is an important indicator of people’s experience of care.•� The ‘No health without mental health: implementation framework’ details what providers of mental health services can do to improve choice, recovery and personalisation for people with mental health
problems. This includes considering how service users’ perceptions of recovery can be incorporated into all elements of clinical practice and working to makesure people have appropriate support and access to advice and information. https://www.gov.uk/government/publications/national-framework-to-improve-mental-health-and-wellbeing
•� Recovery-oriented services aim to support people to build lives for themselves outside of mental health services, with an emphasis on hope, control and opportunity. The Implementing Recovery through Organisational Change programme provides tools to assess how well they are doing and take steps to become more recovery-oriented. http://www.imroc.org/
•� The proportion of people feeling supported to manage their condition is an indicator in the NHS Outcomes Framework 2013–14https://www.gov.uk/government/uploads/system/uploads/attachment_data/file/127106/121109-NHS-Outcomes-Framework-2013-14.pdfhttps://indicators.ic.nhs.uk/webview/

60
Objective 5:
Fewer people will suffer avoidable harm

61
No health without mental healthMental health dashboard
5 Fewer people will suffer avoidable harm
Indicator Data source Links to outcomes Latest year Previous year Trendframework
Safety incidents reported (per 100,000 population)
National Reporting and Learning Service – ONS
NHS OF302 280
Safety incidents involving severe harm or death (per 100,000 population)
National Reporting and Learning Service – ONS
NHS OF 2.93 2.85
Suicide rate (per 100,000 population) ONS Mortality data PH OF 7.9 7.8

62
Safety incidents in mental health services
Figure 1: Patient safety incident reports (per 100,000 population) – trend 2007–2010
Figure 2: Patient safety incident reports (per 100,000 population) – ‘severe harm’ or death – trend 2007–2010
0
50
100
150
200
250
300
350
20102009200820070.0
0.5
1.0
1.5
2.0
2.5
3.0
3.5
4.0
4.5
2010200920082007
Commentary
•� Between 2007 and 2010, the reported safety incidents by mental health services increased by around a third, from 229 to 302, per 100,000 population.•� In the same period, the reported cases categorised as ‘severe harm’ or ‘death’ decreased from 3.9 to 2.9 per 100,000. However, it is not clear why there was a sharp drop between 2008 and 2009. Source: National Reporting and Learning Service – National Patient Safety Agency, Population statistics Office for National Statistics
The context and more information
•� Reported safety incidents for severe harm or death help to provide a picture of avoidable harm. Increased reporting can be an indicator of a need for commissioners and providers of mental health services to improve their crisis and safety planning.
•� The ‘No health without mental health: implementation framework’ highlights examples of good practice for keeping people safe, including strengthening clinical practice, risk management and continuity of care; joint crisis and safety planning with service users; and providing evidence based training for the workforce in relation to suicide and self-harm awareness and prevention. https://www.gov.uk/government/publications/national-framework-to-improve-mental-health-and-wellbeing
•� The National Patient Safety Agency has published a number of toolkits to help health services prevent suicide. Separate toolkits and supporting materials have been developed for mental health services, community mental health, emergency departments, ambulance services and general practice. http://www.nhsconfed.org/Publications/briefings/Pages/Preventing-suicide.aspx
•� Police forces can play an important role in identifying people with mental health issues. They can make sure their officers are aware of the support available to them to help identify potential mental health problems and deal with known issues. This includes appropriate use of their powers under Sections 135 and 136 of the Mental Health Act, of local policies on health-based places of safety, and of liaison and diversion services.
•� ‘Safety incidents reported’ and ‘safety incidents involving severe harm or death’ are indicators in the ‘NHS Outcomes Framework 2013–14’https://www.gov.uk/government/uploads/system/uploads/attachment_data/file/127106/121109-NHS-Outcomes-Framework-2013-14.pdfhttps://indicators.ic.nhs.uk/webview/

63
Suicide
Figure 1: Suicide rate trend 1995–2011 (per 100,000 population) England – 3 years average
Figure 2: Suicide rate (per 100,000 population) – by gender and age groups 2009–2011
0
2
4
6
8
10
12
14
16
Females
All
Males
2009
-11
2008
-10
2007
-09
2006
-08
2005
-07
2004
-06
2003
-05
2002
-04
2001
-03
2000
-02
1999
-01
1998
-00
1997
-99
1996
-98
1995
-97
Males
Females
0
5
10
15
20
25
85 +
80–8
4
75–7
9
70–7
4
65–6
9
60–6
4
55–5
9
50–5
4
45–4
9
40–4
4
35–3
9
30–3
4
25–2
9
20–2
4
15–1
9
10–1
4
0–9
Commentary
•� In 2009–2011 the suicide rate for males and females in England was 12.3 and 3.7 respectively (per 100,000 population). For both men and women, the suicide rates fell since about 1998–2000. However, this seems to have tailed off in recent years with rates remaining fairly steady since 2005–2007 and signs of a slight upwards trend in the most recent figures for men.
•� The suicide rate varies between age groups and over time. In 2009–2011, the rates were highest among males aged 35–54 and females aged 35–59.Source: Indicator calculated by Public Health Observatories using Office for National Statistics annual death extracts and mid-year estimates of population
The context and more information
•� There are many ways in which services, communities, individuals and society as a whole can help to prevent suicides. •� ‘Preventing suicide in England – A cross-government outcomes strategy to save lives’, published September 2012, outlines shared objectives for action.
https://www.gov.uk/government/publications/suicide-prevention-strategy-launched•� Public Health England will support work on suicide prevention, as one of the key public health challenges in improving mental health and wellbeing, in support of the suicide prevention strategy for
England. •� The inclusion of suicide as an indicator within the ‘Public Health Outcomes Framework for England 2013 to 2016’ will help to track national progress against our overall objective to reduce the suicide
rate.https://www.gov.uk/government/publications/healthy-lives-healthy-people-improving-outcomes-and-supporting-transparencyhttp://www.phoutcomes.info/
•� The e-learning packages for non-health professionals, being developed as part of the Interpersonal Psychotherapy for Adolescents (IPT-A) programme, will help all those working with children (eg police officers, teachers, GPs) recognise and support children and young people with mental health problems. The e-portal will also include specific support materials in relation to self-harm, suicide and risk in children and young people. The e-learning packages are expected to launch in spring 2014. http://www.rcpch.ac.uk/training-examinations-professional-development/continuing-professional-development-cpd/current-edu-1

64
Objective 6:
Fewer people will experience stigma and discrimination

65
No health without mental healthMental health dashboard
6 Fewer people will experience stigma and discrimination
Indicator Data source
Knowledge, attitudes and behaviour of the general public
Mental health related knowledge National attitudes to mental illness survey, Institute of Psychiatry (IOP)
Attitudes towards mental illness National attitudes to mental illness survey, IOP
Reported intended behaviour in relation to National attitudes to mental illness people with mental illness survey, IOP
Service users’ experience of stigma and discrimination
Experience of no discrimination Viewpoint survey, IOP
Confidence in challenging stigma and Viewpoint survey, IOPdiscrimination
Links to outcomes framework
–
–
–
–
–
Latest year
3.72
3.91
4.05
9.0%
57.8%
Previous year
3.63
3.89
3.99
11.8%
61.2%
Trend

66
Mental health related knowledge amongst the general public21,22,23
Figure 1: Mean mental health related knowledge item score amongst the general public 2009–2012
Figure 2: Mean community attitudes towards mental illness (CAMI) item score 2009–2012
0
3.60
3.65
3.70
3.75
3.80
3.85
3.90
3.95
4.00
20122011201020090
3.60
3.65
3.70
3.75
3.80
3.85
3.90
3.95
4.00
2012201120102009
Commentary
•� There were no significant improvements in overall knowledge score between 2009 and 2012.•� Public attitudes did not show a significant improvement between 2009 and 2012, either.Source: National attitudes to mental illness survey. Additional analysis conducted by IOP.
The context and more information
•� Achieving a shared vision to put mental health on par with physical health means making sure people can access the support and treatment they need, but it also means doing more to tackle stigma and improve attitudes to mental health across the whole of society – including local services, businesses and communities. Improving mental health related knowledge among the general public helps to increase understanding and reduce mental health stigma and discrimination.
•� The work of Public Health England will help grow and build improved awareness, understanding and capacity in mental health and wellbeing across the life course, to improve overall outcomes for public mental health. https://www.gov.uk/government/uploads/system/uploads/attachment_data/file/192676/Our_priorities_final.pdf

67
Figure 3: Mean intended behaviour scale item score amongst the general public 2009–2012
0
3.6
3.7
3.8
3.9
4.0
4.1
2012201120102009
Commentary
•� Public responses regarding intended behaviour in relation to people with mental illness showed a very slight improvement between 2009 and 2012.Source: National attitudes to mental illness survey. Additional analysis conducted by IOP. All analyses controlled for gender, age, socioeconomic status and familiarity with mental health problems.
The context and more information
•� Achieving a shared vision to put mental health on par with physical health means making sure people can access the support and treatment they need, but it also means doing more to tackle stigma and improve attitudes to mental health across the whole of society – including local services, businesses and communities. Improving mental health related knowledge among the general public helps to increase understanding and reduce mental health stigma and discrimination.
•� The work of Public Health England will help grow and build improved awareness, understanding and capacity in mental health and wellbeing across the life course, to improve overall outcomes for public mental health. https://www.gov.uk/government/uploads/system/uploads/attachment_data/file/192676/Our_priorities_final.pdf

68
People’s experience of discrimination
Figure 1: Proportion of people who use secondary mental health services experiencing no discrimination 2008–2012
Figure 2: Proportion of people who use secondary mental health services who feel more confident in tackling stigma and discrimination than a year ago 2010–2012
0
2
4
6
8
10
12
14
20122011201020092008
Per
cent
exp
erie
ncei
ng n
o di
scrim
inat
ion
Participants 2010
Participants 2011
Participants 2012
Per
cent
of p
artic
ipan
ts
0
10
20
30
40
50
60
70
UnsureNo more confidentMore confident
Commentary
•� The proportion of secondary mental health service users reporting no discrimination has increased from 9% in 2008 to 13% in 2009, but the trend has reversed since – with the latest figures showing 9%.•� In all three years, more than half of people who use secondary mental health services reported feeling more confident than a year ago to tackle stigma and discrimination. However, the proportion of
positive responses has decreased over the period, from 63% in 2010 to 58% in 2012.Source: National attitudes to mental illness survey. Additional analysis conducted by IOP.
The context and more information
•� Ensuring fewer people experience stigma and discrimination is an objective of the ‘No health without mental health: implementation framework’https://www.gov.uk/government/publications/national-framework-to-improve-mental-health-and-wellbeing
•� We can tackle stigma and discrimination faced by people with mental health problems by encouraging more individuals and organisations to join the Time to Change campaign. http://www.time-to-change.org.uk/
69
Notes
1. Self-reported wellbeing
Indicators based on the following four questions:
•� overall, how satisfied are you with your life nowadays?
•� overall, how happy did you feel yesterday?
•� overall, to what extent do you feel the things you do in your life are worthwhile?
•� overall, how anxious did you feel yesterday?
Responses are given on a scale of 0–10 (where 0 is ‘not at all satisfied/happy/anxious/worthwhile’ and 10 is ‘completely satisfied/happy/anxious/worthwhile’).
‘Positive responses’ refers to people that responded ‘high’ or ‘medium’ in the above questions on ‘life satisfaction’, ‘feeling worthwhile’ and ‘feeling happy yesterday’ and ‘medium’ or ‘low’ in the question on ‘feeling anxious yesterday’.
2. Self-reported wellbeing – Warwick–Edinburgh Mental Wellbeing Scale (WEMWBS)
WEMWBS measures wellbeing using responses to 14 positively worded items. Responses are summed to give a score in the range 14–70 where a higher score corresponds to a higher level of wellbeing.

70
3. Prevalence of mental health problems
Two definitions of mental health problems:
1) People with a long term mental health condition are defined as people who answered ‘yes’ to the question ‘Do you have any long-standing illness, disability or infirmity’ and subsequently reporting ‘Long term mental health disorders’.
2) People with possible mental health problems are defined as people with a score four or greater in the General Health Questionnaire 12 (GHQ12).
4. Homelessness
Two indicators for statutory homelessness:
•� homelessness acceptance: A household found to be eligible, homeless through no fault of their own and in priority need.
•� temporary accommodation: Households in accommodation arranged by local authorities pending enquiries or after being accepted as homeless under the 1996 Housing Act.
The number of households in temporary accommodation is a snapshot at the end of the quarter.
5. Absolute low income
The indicator is presented as the proportion of individuals in households in the UK with incomes below 60 per cent of 2010/11 median net disposable household income held constant in real terms a) before housing costs (BHC) and b) after housing costs (AHC).
6. Illicit drug use
Frequent use refers to use of any drug more than once a month in the last year.
Figure 1 focuses on 16–24 year-olds as the Crime Survey for England and Wales has consistently shown that drug usage is higher among young people than for the adult population as a whole.

71
7. IAPT: Improving Access to Psychological Therapies
Access rate is defined as the proportion of people entering treatment against the level of need in the general population (the level of prevalence addressed or ‘captured’ by referral routes). The level of need in the general adult population is known as the rate of prevalence, defined by the Psychiatric Morbidity Survey 2000. For common mental health conditions treated in IAPT services, it is expected that a minimum of 15% of those in need would willingly enter treatment if available.
The recovery rate refers to the proportion of people who complete treatment who are moving to recovery, i.e. the number of people not at caseness at their last session, as a proportion of people who were at caseness at their first session.
8. Employment of people with mental illness
The numerator includes: number of people with mental illness in employment and of working age. It includes those who are employees, self-employed, in training programmes, or are unpaid family workers, who have a mental illness such as depression, bad nerves, anxiety, severe or specific learning difficulties (mental handicap), phobia, panics or other nervous disorders, expected to last more than a year.
9. Employment of people with serious mental illness
Numerator: The number of adults (aged 18–69) in the denominator in paid employment (i.e. those recorded as ‘employed’) at the time of their most recent assessment, formal review or other multi-disciplinary care planning meeting, in a financial year. Include only those whose assessments or reviews were carried out during the reference period. The reference period is the last 12 months working back from the end of the reported quarter. Denominator: Adults ‘in contact with secondary mental health services’ is defined as those aged 18–69 who are receiving secondary mental health services and who are on the care programme approach (CPA).
10. Living in stable and appropriate accommodation
Adults ‘in contact with secondary mental health services’ is defined as those aged 18–69 who are receiving secondary mental health services and who are on the care programme approach (CPA).
11. Social care related quality of life (SCRQoL) for people with mental health problems
Social care related quality of life is a composite measure, based on responses to eight domains (control, dignity, personal care, food and nutrition, safety, occupation, social participation and accommodation). Each of the questions has four possible answers, which are equated with having: no unmet needs in a specific life area or domain (the ideal state); needs adequately met; some needs met and no needs met.
72
12. Excess mortality in people with serious mental illness
Adults with serious mental illnesses are defined as anyone aged 18 or over, who has been in contact with secondary mental care services in the current financial year, or in either of the two previous financial years, who is alive at the beginning of the current financial year.
13. Comorbidity between long term mental and physical health problems
Long term physical conditions include the following long term conditions: angina, arthritis, asthma, cancer, diabetes, epilepsy, high blood pressure, kidney or liver disease, long term back problem, long term neurological problem.
14. Mental health and alcohol misuse
Prevalence of alcohol misuse is identified by reporting consumption of 8 alcohol units for males and 6 units for females, on the heaviest day in the last week.
15. Mental health and obesity
People are considered obese when their body mass index (BMI) exceeds 30kg/m2.
16. Mental health and smoking
Smoking rates refers to people who are current smokers.
17. Detention and compulsory treatment
This indicator refers to people who were inpatients and were subject to the Mental Health Act (at some point during the year) as a proportion of all people accessing NHS-funded specialist mental health services.
Between 2009–11 the indicator includes people in supervised community treatments (SCTs). In 2011/12, due to a change in methodology, the people included are those in community treatment orders (CTOs).

73
18. Patient experience of community mental health services
The indicator is a composite, calculated as the average of four survey questions from the community mental health survey. The questions relate to patients’ experience of contact with a health and social care worker. The questions are:
Thinking about the last time you saw this NHS health worker or social care worker for your mental health condition:
•� did this person listen carefully to you?
•� did this person take your views into account?
•� did you have trust and confidence in this person?
•� did this person treat you with respect and dignity?
For each provider, an average weighted score (by age and sex) is calculated for each of the questions. Overall trust scores are calculated as a simple average of the four question scores. National scores are calculated by a simple average of the overall trust scores.
19. Satisfaction with services for people with mental health related social care needs
The measure is defined by determining the percentage of all those responding ‘I am extremely satisfied’ or ‘I am very satisfied’ to the question: ‘Overall, how satisfied or dissatisfied are you with the care and support services you receive?’
20. People feeling supported to manage their condition
Measure shows responses to the question: ‘In the last 6 months, have you had enough support from local services or organisations to help you manage your long term condition(s)?’
21. Mental health related knowledge amongst the general public
The mental health knowledge schedule (MAKS) comprises six statements on: help seeking recognition, support, employment, treatment and recovery. Respondents specify agreement with each statement on a 5-point scale from ‘strongly agree’ to ‘strongly disagree’, with ‘don’t know’ as an additional response option. Higher MAKS scores indicate greater knowledge.

74
22. Attitudes towards mental illness
The questionnaire includes 26 items from the 40-item community attitudes towards the mentally ill scale (CAMI) and an added item on employment-related attitudes. Items refer to attitudes about social exclusion, benevolence, tolerance and support for community mental health care and were rated from 1 (strong disagreement) to 5 (strong agreement). Higher CAMI scores indicate less stigmatising attitudes.
23. Reported and intended behaviour
Behaviour is measured by the reported and intended behaviour scale (RIBS). Changes in reported and intended behaviour are assessed among four different contexts (domains comprised: living with, working with, living nearby and continuing a relationship with someone with a mental health problem). Four intended behaviour items assess the level of intended future contact with people with mental health problems and an additional four reported behaviour items assess past or current contacts. For reported behaviour items, respondents answer with ‘yes’, ‘no’ or ‘don’t know’. For intended behaviour items, respondents specify agreement with each statement on a 5-point scale from ‘strongly agree’ to ‘strongly disagree’, with ‘don’t know’ as an additional response option. Higher scores indicate more favourable intended behaviour.
Related Documents