3A NMT WORKSHOP NMT infrastructure: Bicycle-based Transit Oriented Development (B-TOD) SEAN COOKE 35 th Southern African Transport Conference

Welcome message from author
This document is posted to help you gain knowledge. Please leave a comment to let me know what you think about it! Share it to your friends and learn new things together.
Transcript
3A NMT WORKSHOP
NMT infrastructure: Bicycle-based Transit Oriented Development (B-TOD)
SEAN COOKE
35th Southern African Transport Conference
2Bicycle-based Transit
Oriented Development (B-TOD)
Transit oriented development (TOD)
Density articulation
NMT integration
Bicycle-based TOD
Conclusion

01 TRANSIT ORIENTED
DEVELOPMENT

4
Transit-oriented development

5
Marks 2016
Transit-oriented development

02 DENSITY
ARTICULATION

7
Suzuki et al 2013
Density articulation
Los AngelesGross base density = 24 persons/ha
PT + NMT mode share = 12%
Revenue-to-cost ratio = <30%
CuritibaGross base density = 30 persons/ha
PT + NMT mode share = 56%
Revenue-to-cost ratio = >95%
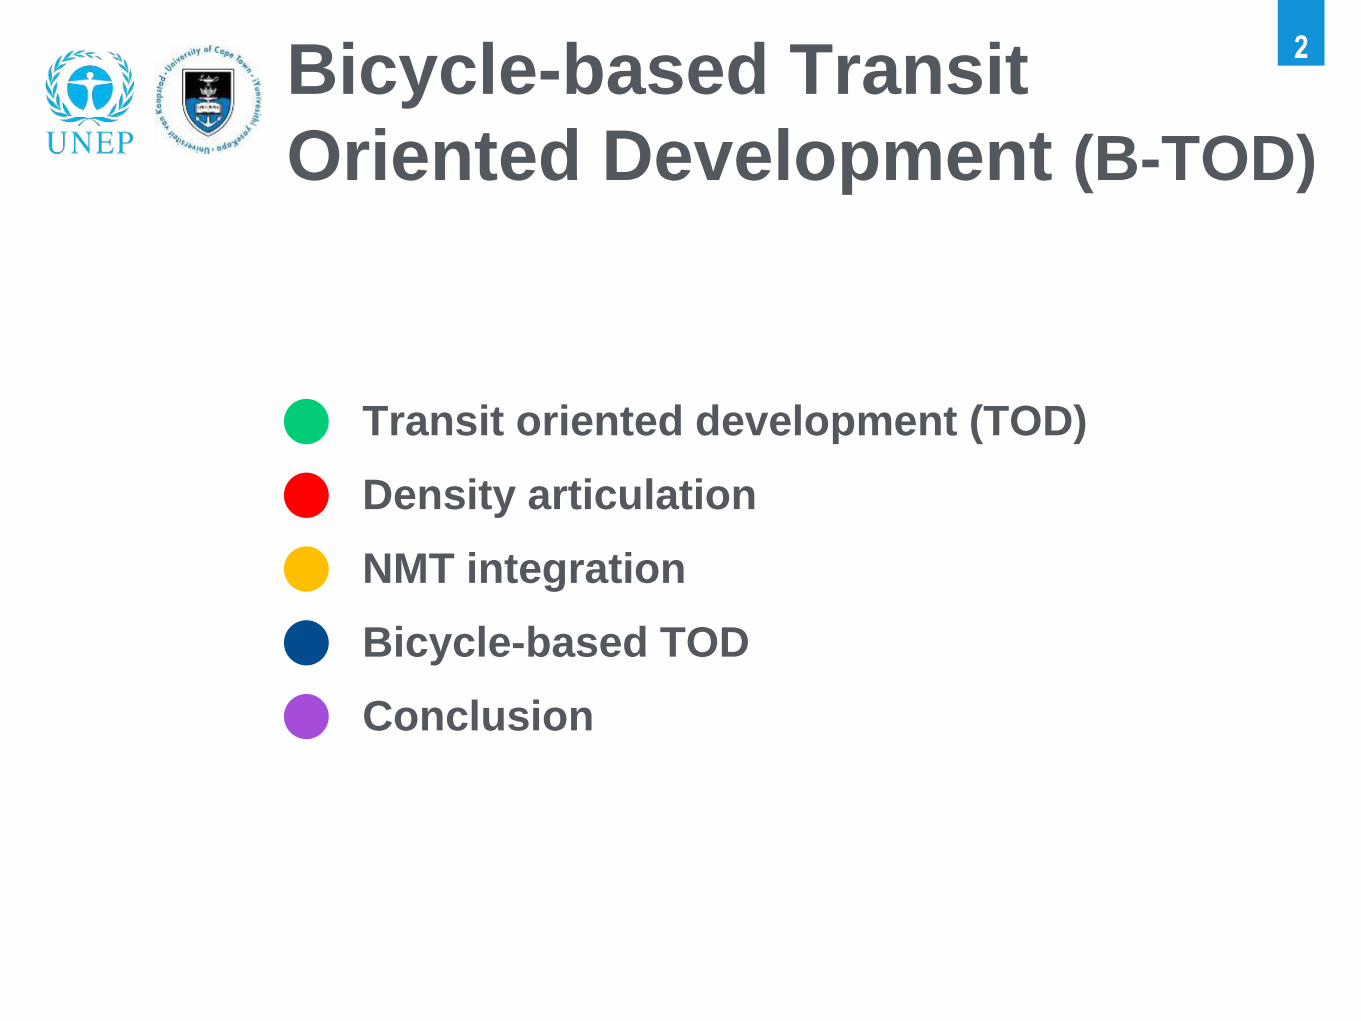
South African Cities Network 2011
8
South African context
9
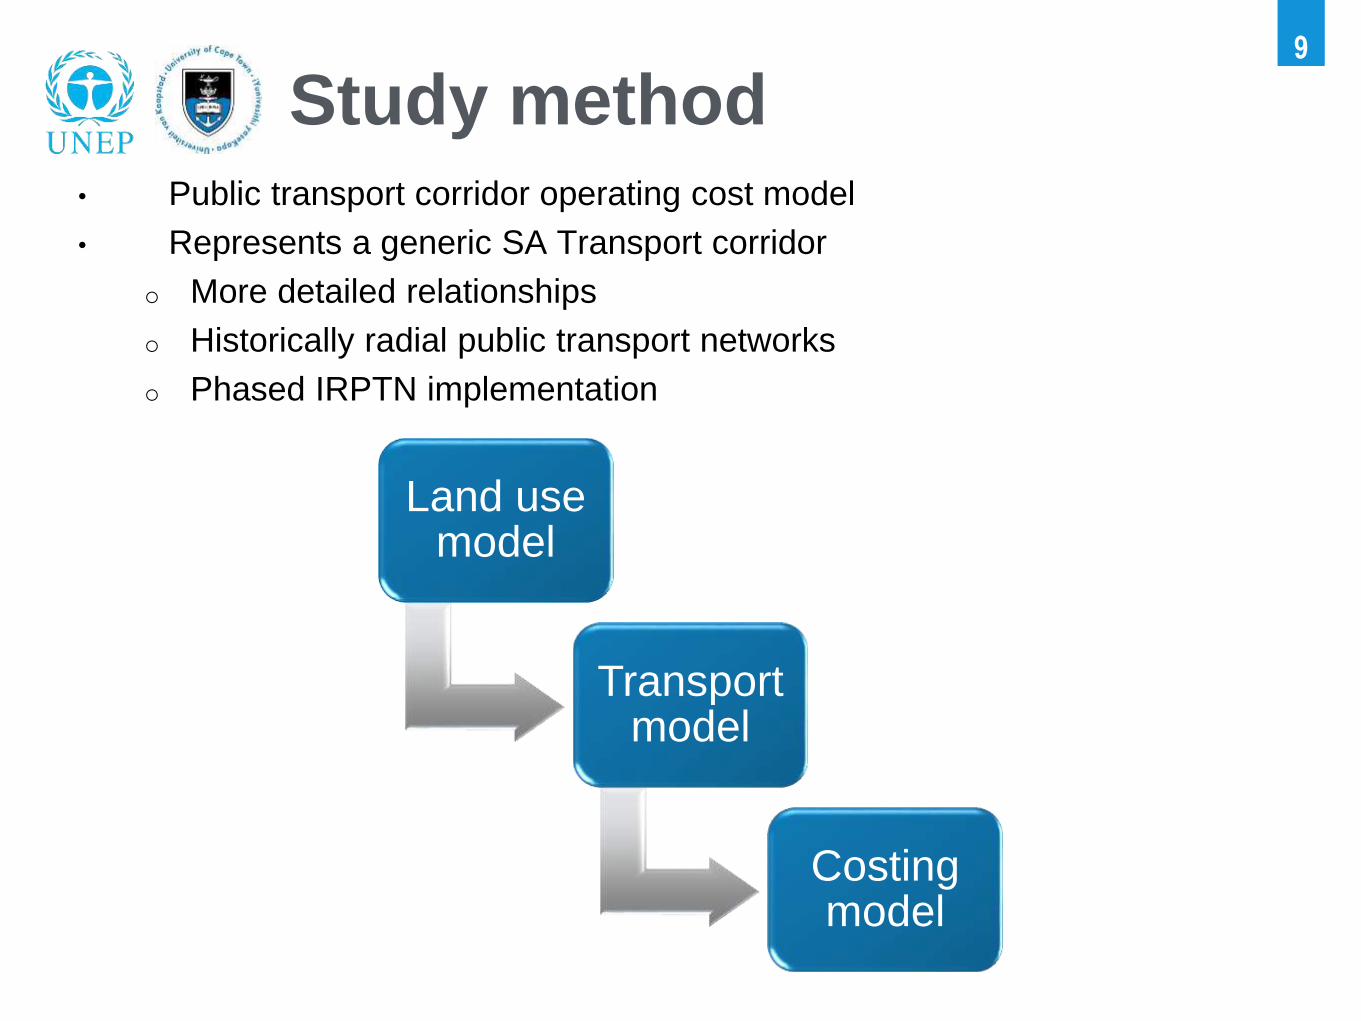
• Public transport corridor operating cost model
• Represents a generic SA Transport corridor
o More detailed relationships
o Historically radial public transport networks
o Phased IRPTN implementation
Study method
Land use model
Transport model
Costing model

10
Density articulation
• 42 TAZs
• 84% coverage
• Walking distance: 1km
• 20km trunk length
42
CBD10
1 40
2
5 9 13 17 21 25 29 33 41
3
4
5
6
26 302 38
1
1 39
37
1 2 3 4 5 6 7 8 9
28 29 30 31 32 33 34 35 36
34
3 7 11 15 19 23 27 34 35
2 6
5
10 14
4
18 223
6
20% 43% 80%
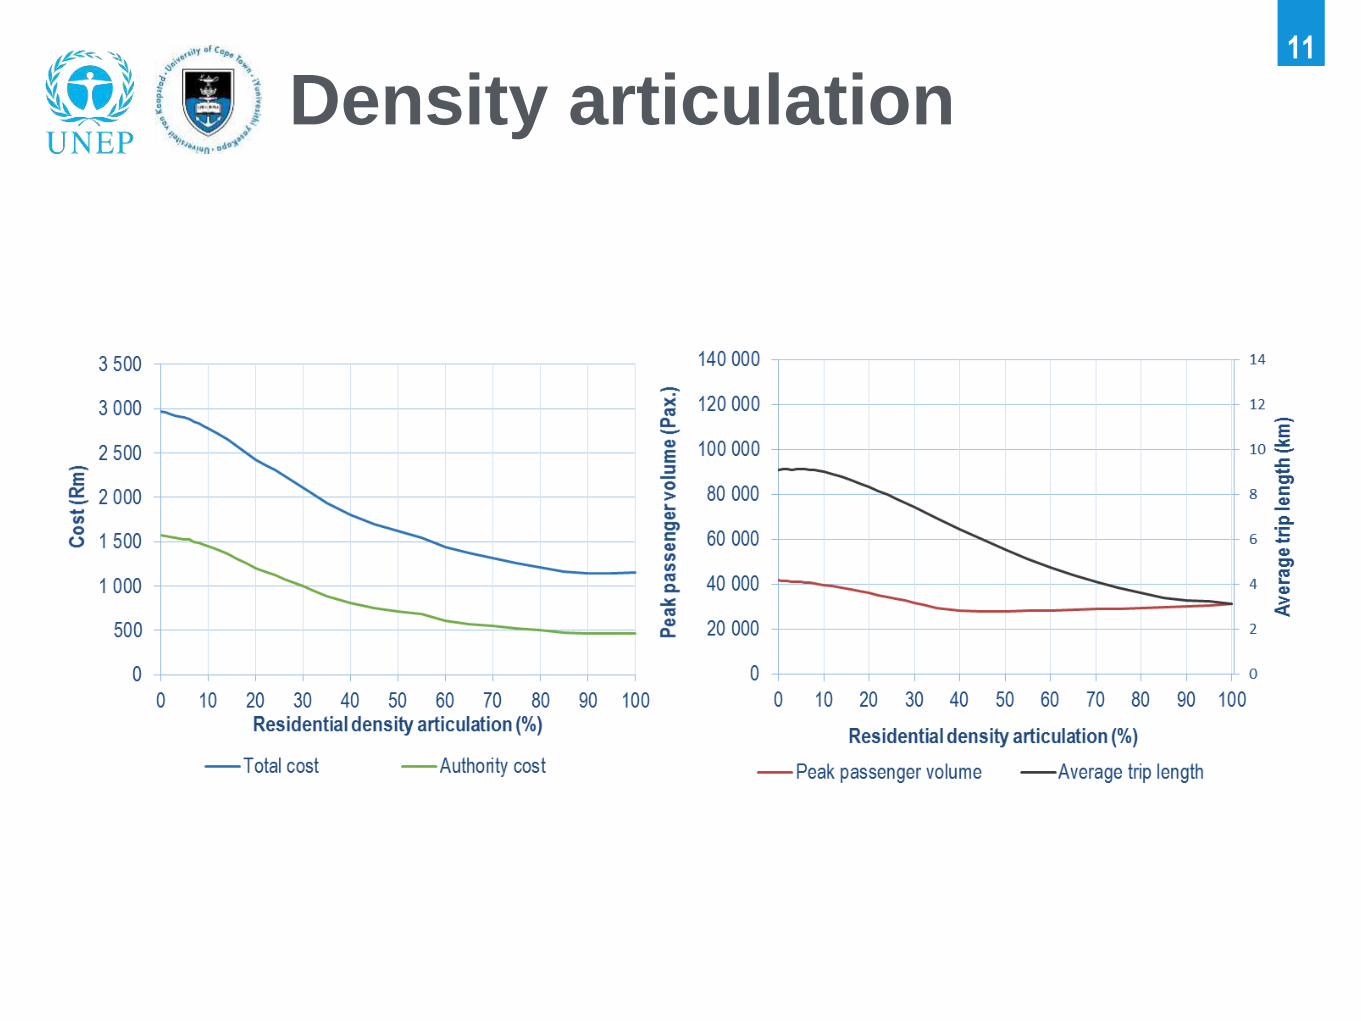
11
Density articulation
03 ROLE OF NMT IN
TOD

Daniels and Mulley 2011
Pedestrian access13
5 min 10 min

Bicycle access14
Adapted from Lee, Choi & Leem 2015
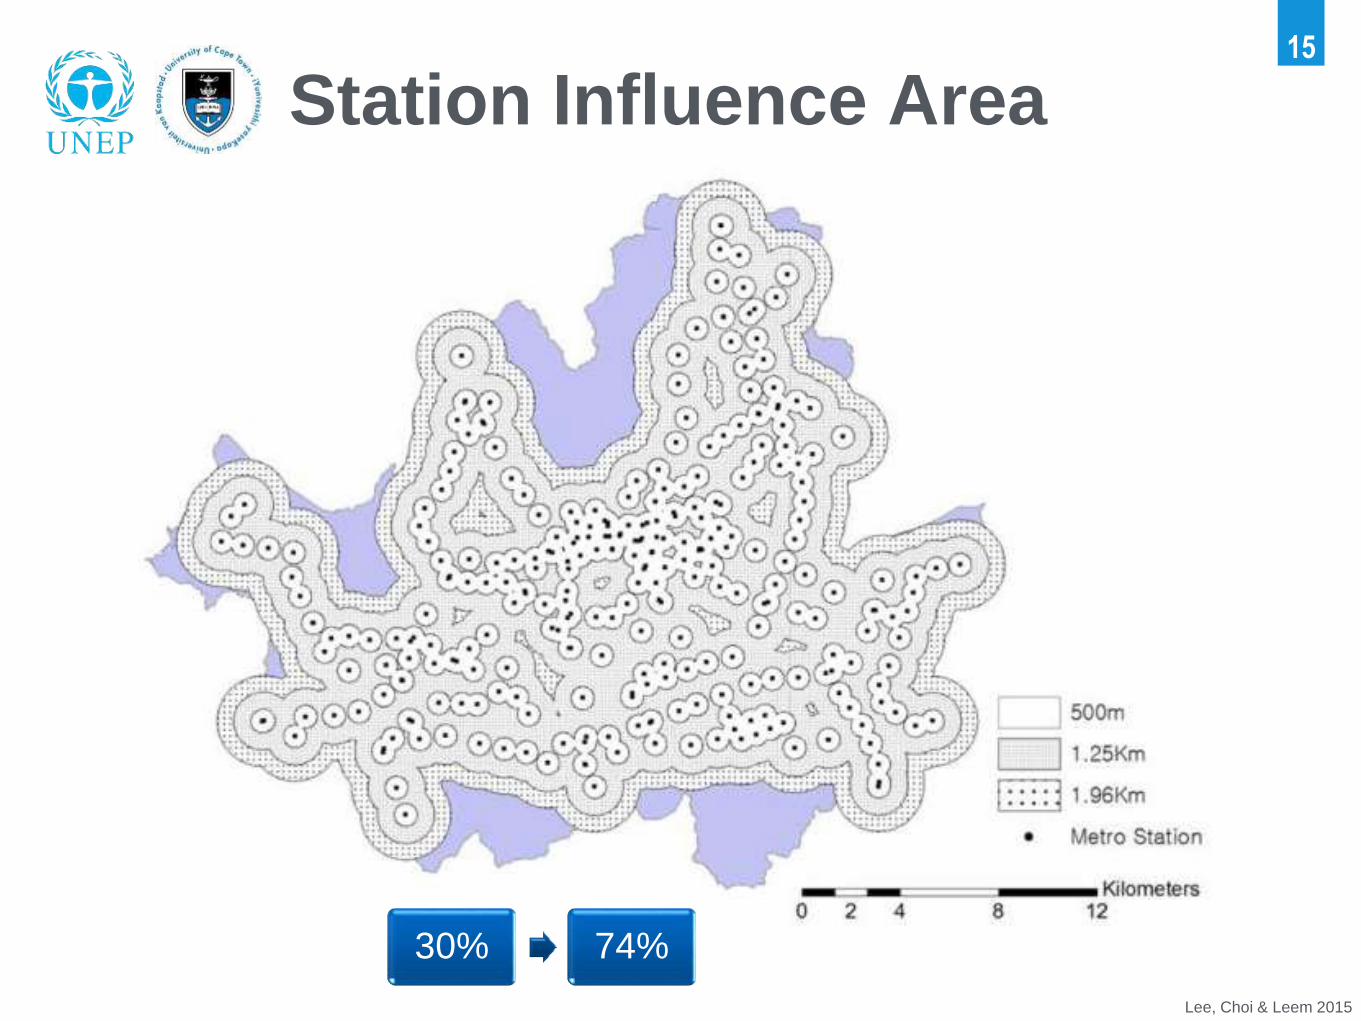
Lee, Choi & Leem 2015
Station Influence Area15
30% 74%

04 BICYCLE-BASED
TOD

17
Bogota CicloRuta NMT network

18
Bicycle-based TOD
Adapted from Lee, Choi & Leem 2015

Cooke 2016
19
40% 78% 90%
Bicycle-based TOD
20% 43% 80%

Pedestrian-based TOD
TOD area 43% of corridor (assuming even density)
Cooke 2016
Bicycle-based TOD20
Bicycle-based TOD
TOD area 78% of corridor (assuming even density)
1,000 km catchment 3,000 m catchment
33% cost reduction

Cooke 2016
21
Bicycle-based TOD
Targeted Areas
SOUTH AFRICAN CITY / MUNICIPALITY
Cape Town Tshwane Joburg NMB eThekwini
(CoCT,
2012)(CoT, 2012) (CoJ, 2010)
(NMB,
2007)
(eThekwini,
2013)
Public Transport Trunk
Corridors (persons/ha)208 150 232 238 209
Bulman 2015

05 CONCLUSION€ £
¥ $
Related Documents