NMR spectroscopy and mass spectrometry in metabolomics analysis of Salvia Bruna de Falco . Virginia Lanzotti Received: 29 October 2017 / Accepted: 24 January 2018 / Published online: 17 February 2018 Ó Springer Science+Business Media B.V., part of Springer Nature 2018 Abstract The interest in using the ‘-omics’ approach for nutrition, agriculture, food science and human health have seen an explosive growth in the last years. Particularly, metabolomics analysis is becoming an integral part of a system biological approach for investigating organisms. In this review, the limitations and advantages of NMR spectroscopy and mass spectrometry were discussed in details using the study reported in the literature on different Salvia species (S. hispanica, S. miltiorrhiza, S. officinalis, S. runcinata and S. stenophylla). Both approaches identify and quantify several classes of compounds but not the complete metabolite profile of the plant. A combined approach of these two powerful techniques provides better results allowing to determine both primary and secondary metabolites. Keywords Metabolomics Á Salvia Á Sage Á NMR Á MS Á Multivariate data analyses Introduction Over the past few years, the ‘-omics’ fields have seen an explosive growth opening new perspectives for biological research purpose. The development of analytical instrumentations, data processing and chemometric tools simplify the study of complex biological systems on a large-scale. Metabolomics, together with other ‘-omics’ disciplines such as genomics, transcriptomics, and proteomics, is becom- ing an integral part of a system biological approach for investigating organisms. Figure 1 reports the classifi- cation of the ‘-omics’ technologies and the correlation among them. Although transcriptome represents the process for protein synthesis, an increase in mRNA levels does not always correspond to an increase in proteins due to a number of post-transcriptional regulation mechanisms (Kendrick 2014; Vogel and Marcotte 2012). Therefore, changes in transcriptome or proteome do not always reflect alterations in biochemical phenotypes. For this reason, the associ- ation of metabolomics to the other analytical areas of genomics, transcriptomics and proteomics constitute a very powerful tool to study biological systems. Metabolomics is the ‘-omic’ studying the whole metabolome in a cell, tissue or organism from both qualitative and quantitative point of view. The interest in using metabolomics for nutrition, agriculture, food science, human health and drug discovery has seen an exponential increase in the last years. In fact, the number of publications containing the term ‘‘metabo- lomics’’ is constantly growing. In the whole metabolome, there are two groups of compounds, primary metabolites and secondary ones. Primary metabolites are ubiquitous compounds B. de Falco Á V. Lanzotti (&) Dipartimento di Agraria, Universita ` di Napoli Federico II, Via Universita ` 100, 80055 Portici, Naples, Italy e-mail: [email protected] 123 Phytochem Rev (2018) 17:951–972 https://doi.org/10.1007/s11101-018-9550-8

Welcome message from author
This document is posted to help you gain knowledge. Please leave a comment to let me know what you think about it! Share it to your friends and learn new things together.
Transcript

NMR spectroscopy and mass spectrometry in metabolomicsanalysis of Salvia
Bruna de Falco . Virginia Lanzotti
Received: 29 October 2017 / Accepted: 24 January 2018 / Published online: 17 February 2018
� Springer Science+Business Media B.V., part of Springer Nature 2018
Abstract The interest in using the ‘-omics’ approach
for nutrition, agriculture, food science and human
health have seen an explosive growth in the last years.
Particularly, metabolomics analysis is becoming an
integral part of a system biological approach for
investigating organisms. In this review, the limitations
and advantages of NMR spectroscopy and mass
spectrometry were discussed in details using the study
reported in the literature on different Salvia species (S.
hispanica, S. miltiorrhiza, S. officinalis, S. runcinata
and S. stenophylla). Both approaches identify and
quantify several classes of compounds but not the
complete metabolite profile of the plant. A combined
approach of these two powerful techniques provides
better results allowing to determine both primary and
secondary metabolites.
Keywords Metabolomics � Salvia � Sage � NMR �MS � Multivariate data analyses
Introduction
Over the past few years, the ‘-omics’ fields have seen
an explosive growth opening new perspectives for
biological research purpose. The development of
analytical instrumentations, data processing and
chemometric tools simplify the study of complex
biological systems on a large-scale. Metabolomics,
together with other ‘-omics’ disciplines such as
genomics, transcriptomics, and proteomics, is becom-
ing an integral part of a system biological approach for
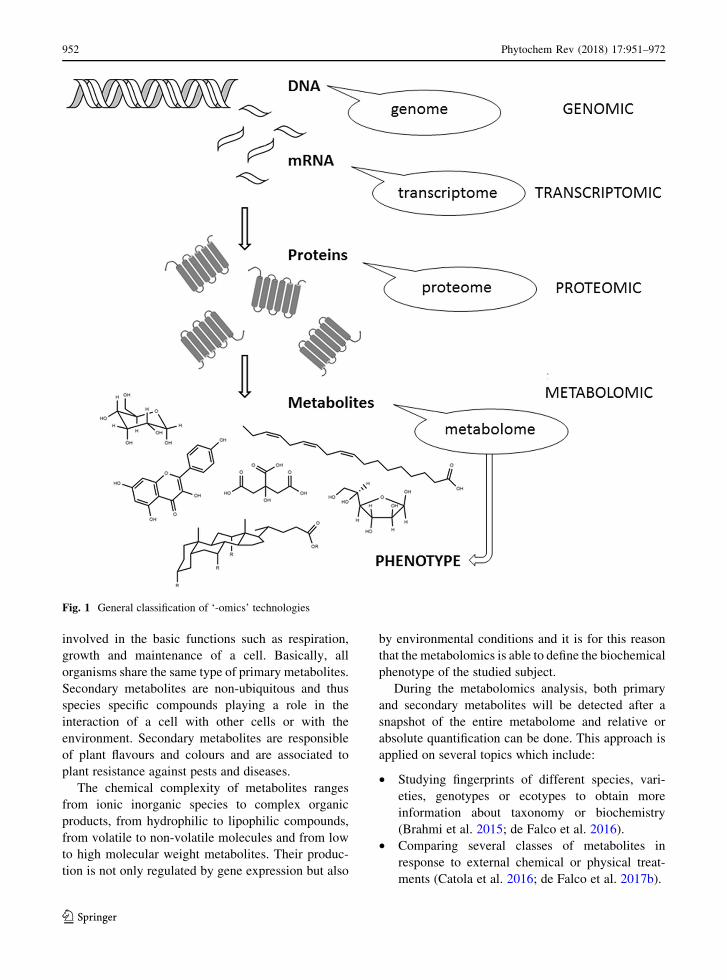
investigating organisms. Figure 1 reports the classifi-
cation of the ‘-omics’ technologies and the correlation
among them. Although transcriptome represents the
process for protein synthesis, an increase in mRNA
levels does not always correspond to an increase in
proteins due to a number of post-transcriptional
regulation mechanisms (Kendrick 2014; Vogel and
Marcotte 2012). Therefore, changes in transcriptome
or proteome do not always reflect alterations in
biochemical phenotypes. For this reason, the associ-
ation of metabolomics to the other analytical areas of
genomics, transcriptomics and proteomics constitute a
very powerful tool to study biological systems.
Metabolomics is the ‘-omic’ studying the whole
metabolome in a cell, tissue or organism from both
qualitative and quantitative point of view. The interest
in using metabolomics for nutrition, agriculture, food
science, human health and drug discovery has seen an
exponential increase in the last years. In fact, the
number of publications containing the term ‘‘metabo-
lomics’’ is constantly growing.
In the whole metabolome, there are two groups of
compounds, primary metabolites and secondary ones.
Primary metabolites are ubiquitous compounds
B. de Falco � V. Lanzotti (&)
Dipartimento di Agraria, Universita di Napoli Federico II,
Via Universita 100, 80055 Portici, Naples, Italy
e-mail: [email protected]
123
Phytochem Rev (2018) 17:951–972
https://doi.org/10.1007/s11101-018-9550-8(0123456789().,-volV)(0123456789().,-volV)
involved in the basic functions such as respiration,
growth and maintenance of a cell. Basically, all
organisms share the same type of primary metabolites.
Secondary metabolites are non-ubiquitous and thus
species specific compounds playing a role in the
interaction of a cell with other cells or with the
environment. Secondary metabolites are responsible
of plant flavours and colours and are associated to
plant resistance against pests and diseases.
The chemical complexity of metabolites ranges
from ionic inorganic species to complex organic
products, from hydrophilic to lipophilic compounds,
from volatile to non-volatile molecules and from low
to high molecular weight metabolites. Their produc-
tion is not only regulated by gene expression but also
by environmental conditions and it is for this reason
that the metabolomics is able to define the biochemical
phenotype of the studied subject.
During the metabolomics analysis, both primary
and secondary metabolites will be detected after a
snapshot of the entire metabolome and relative or
absolute quantification can be done. This approach is
applied on several topics which include:
• Studying fingerprints of different species, vari-
eties, genotypes or ecotypes to obtain more
information about taxonomy or biochemistry
(Brahmi et al. 2015; de Falco et al. 2016).
• Comparing several classes of metabolites in
response to external chemical or physical treat-
ments (Catola et al. 2016; de Falco et al. 2017b).
Fig. 1 General classification of ‘-omics’ technologies
952 Phytochem Rev (2018) 17:951–972
123
• Highlighting differences and similarities between
the metabolite content of mutants or transgenic
plants and their wild-type counterparts (Kristensen
et al. 2005).
• Monitoring developmental processes such as
metabolic transition from immature to ripe fruit
(Aharoni et al. 2002).
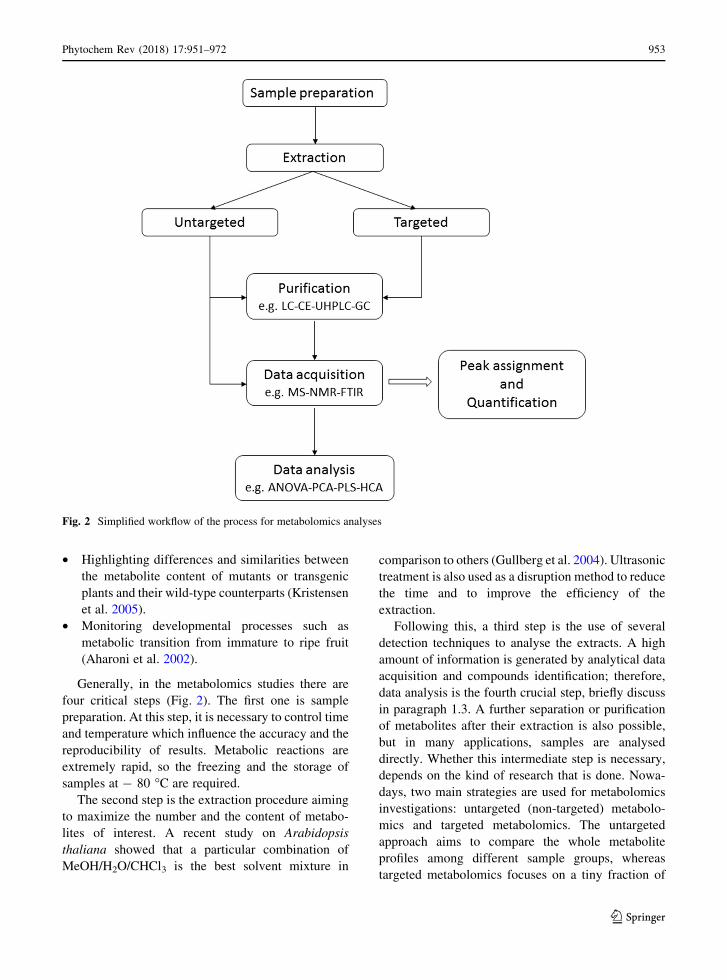
Generally, in the metabolomics studies there are
four critical steps (Fig. 2). The first one is sample
preparation. At this step, it is necessary to control time
and temperature which influence the accuracy and the
reproducibility of results. Metabolic reactions are
extremely rapid, so the freezing and the storage of
samples at - 80 �C are required.
The second step is the extraction procedure aiming
to maximize the number and the content of metabo-
lites of interest. A recent study on Arabidopsis
thaliana showed that a particular combination of
MeOH/H2O/CHCl3 is the best solvent mixture in
comparison to others (Gullberg et al. 2004). Ultrasonic
treatment is also used as a disruption method to reduce
the time and to improve the efficiency of the
extraction.
Following this, a third step is the use of several
detection techniques to analyse the extracts. A high
amount of information is generated by analytical data
acquisition and compounds identification; therefore,
data analysis is the fourth crucial step, briefly discuss
in paragraph 1.3. A further separation or purification
of metabolites after their extraction is also possible,
but in many applications, samples are analysed
directly. Whether this intermediate step is necessary,
depends on the kind of research that is done. Nowa-
days, two main strategies are used for metabolomics
investigations: untargeted (non-targeted) metabolo-
mics and targeted metabolomics. The untargeted
approach aims to compare the whole metabolite
profiles among different sample groups, whereas
targeted metabolomics focuses on a tiny fraction of
Fig. 2 Simplified workflow of the process for metabolomics analyses
Phytochem Rev (2018) 17:951–972 953
123
the metabolome analysing a specific group of com-
pounds related to a specific metabolic pathway (e.g.,
fatty acids, amino acids or phytochemicals) (Son et al.
2008; Vrhovsek et al. 2012). For this purpose, one or
few metabolites are selected after a high number of
purifications and all other compounds are ignored.
This approach is used to study know compounds and
to get general information on the presence of unknown
compounds in the analyzed material. However, to
determine the chemical structure of compounds never
reported in the literature it is necessary to obtain them
as pure metabolites and to subject them to the classic
spectroscopic and chemical analytical method.
Metabolomics aims to identify and quantify the
overall metabolome. To achieve this objective, several
analytical approaches can be used, each of them with
advantages and disadvantages. They can be grouped as
follows:
• chromatographic methods: liquid chromatography
(LC), high-performance LC (HPLC); ultra-high
performance LC (UHPLC), gas chromatography
(GC), capillary electrophoresis (CE), thin layer
chromatography (TLC);
• mass spectrometry (MS);
• spectroscopy: nuclear magnetic resonance spec-
troscopy (NMR); fourier transform infra-red (FT-
IR); ultraviolet methods (UV).
Each technique, mentioned above, can be applied at
two different levels. The first level is a qualitative
study in which the signals observed are assigned to
specific metabolites with the help of standard com-
pounds, data literature and different libraries (Smith
et al. 2005; http://www.hdscience.com). Conse-
quently, the second level of analysis is the measure-
ment of relative or absolute amounts of the detected
components based respectively on spectra integration
or calibration curves of internal standard. A compro-
mise between speed, selectivity and sensitivity should
be found between all these methods to select the most
suitable approach, although a combination of two or
more of them is also used to provide complementary
information and to reduce sample complexity. For
example, LC/MS with atmospheric pressure ioniza-
tion (API) is also applied to metabolomics study, but
only a relatively small number of analytes can be
detected. Specifically, the production of pseudo-
molecular ions ([M ? H]? or [M - H]-) depends on
several factors and it is not always easy to predict
which one will be produced. In addition, many com-
pounds do not ionize optimally and for this reason LC/
MS is more suited for metabolites which ionize simi-
larly under the same condition. A rapid and non-de-
structive technique is the FT-IR, based on the
stretching and bending vibration of chemical bonds
irradiated by the light (usually 4000–400 cm-1).
Although it does not require a complex sample
preparation, its sensitivity is not as high as that of the
other techniques. However, in the last few years,
several studies have been undertaken using FT-IR to
diagnose disease or dysfunction and to acquire meta-
bolic profiling of body fluids (Lemes et al. 2016; Iso-
gawa et al. 2014). On the contrary, in other research
fields, such as plant science and food chemistry,
metabolomics studies by NMR and MS have been
mostly applied. This review assesses the limitations
and advantages of NMR spectroscopy and gas chro-
matography–mass spectrometry in metabolomics
analyses, providing a description of these analytical
techniques and their application to the metabolite
profiling of Salvia species.
NMR based metabolomics
In detail, NMR spectroscopy is a physical measure-
ment of the resonances of atoms with a non-zero
magnetic moment, such as 1H, 13C, 15N, 19F, 31P in a
strong magnetic field. The application of a magnetic
field on the nuclei of these atoms causes the promotion
of electrons from low-energy to high-energy spin
states and the subsequent emission of radiation during
the relaxation process. It is a non-destructive tech-
nique with high reproducibility in which compounds
and extracts have a highly specific spectrum. Its
sensitivity can be improved by the application of high
and uniform magnetic fields (frequencies commonly
used range between 300 and 700 MHz). The sensitiv-
ity of NMR also depends on the abundance of isotope
studied and time of analysis. The most sensitive
isotopes are 1H, 19F and 31P, but the last two nuclei can
only be found in a restricted number of compounds.
For this reason, 1H is the preferred nuclei for
metabolites fingerprinting studies. The only variables
are the solvents used which depend on the polarity of
the extract analysed. In the 1H NMR sample there is
always much more solvent than substance, so deuter-
ated solvents, such as D2O, CD3OD and CDCl3, are
954 Phytochem Rev (2018) 17:951–972
123
used to minimize the solvent signal in the spectra.
During the spectrum acquisition, pH and temperature
must be controlled to avoid shifts of the proton signals.
Normally, the temperature is set on the spectrometer
before the start of sample acquisition, while pH is kept
constant by the use of a buffering agent, such as
KH2PO4, and sodium deuteroxide. The chemical shifts
in 1H NMR spectra (0–10 ppm) are assigned to a
specific metabolite. The major limitation of the NMR
spectroscopy is the low sensitivity. Therefore, larger
amounts of sample are required for NMR analyses
than those required for other techniques. However, the
introduction of the new analytical instrumentations,
such as the use of microprobe and cryoprobe,
improves the detection of signals that are not normally
detected with a conventional probehead. In the first
case, using a 1 mm microprobe it is possible to analyse
very small quantities of a sample diluted in 10 ll
rather than 500 ll (5 mm) to get a better quality of the
spectra. Whereas, in the second case the probehead is
cooled down to 20 K with a cryogen (liquid helium) to
increase the signal to noise ratio.
The signals can be reported along two frequency
axes to produce a two-dimensional spectrum (2D)
which can be either homonuclear, if the correlation
comes from the same nucleus (usually 1H–1H), or
heteronuclear if on the frequency axes there are two
different nuclei (usually 1H–13C). The 2D-NMR
experiments are very useful in the case of an extensive
signal overlap in some regions of the proton spectra,
such as sugar region.
After spectra acquisition and compounds identifi-
cation with pure standard and data from literature, the
quantification is performed. Usually, DSS (dimethyl-
4-silapentane sodium sulfonate) and TMS (tetram-
ethylsilane) are used both as reference for the calibra-
tion of NMR shifts (resonating at 0.00 ppm) and as
internal standard, for aqueous and organic fractions,
respectively.
The integrated area under the peaks is calculated
and compared to the peak intensity of the internal
standard. Certain regions of the spectrum, such as
those containing solvent signals, are typically
excluded from the binning process.
Once completed the identification and quantifica-
tion analyses, the statistical analyses can be applied to
interpret the huge amount of data.
MS based metabolomics
A more sensitive tool is GC–MS, which is widely
applied in metabolomics because of its high specificity
and sensitivity for suitable analyte classes. This
technique, similarly to LC/MS, is based on the
separation and detection of ions, according to their
mass–charge (m/z) ratio. A limitation of gas chro-
matography coupled with mass spectrometry is that
not all injected components will pass through the
column, because of different physico-chemical prop-
erties of the analytes (polarity, stability, molecular
mass, volatility, etc.). Several components therefore
remain in the injector or in the column, causing the
whole system to respond differently after each injec-
tion. However, this can be avoided if all samples are
derivatized at room or higher temperature before the
analysis in order to reduce their polarity. After
derivatization, the volatility and thermal stability of
the compounds are thus provided, allowing their
elution at high temperatures without decomposition.
In particular, compounds containing active hydro-
gens, such as –OH, –SH, –NH and –COOH should be
derivatized prior to GC–MS analysis. Derivatization
can be achieved by three general reactions, which are
alkylation, acylation and silylation (Orata 2012).
Usually, silylation is the most suitable reaction for
non-volatile compounds for GC analysis. As shown in
Fig. 3a, b, after silylation, an active hydrogen is
substituted by a silyl group. It is important to underline
that, despite derivatization, still numerous compounds
will not pass through a GC-column due to their high
molecular weight. Moreover, an oximation reaction is
recommended, prior to silylation, in polar extracts
containing sugars. It is well known that sugars like
fructose and glucose have different chemical struc-
tures in water solution with the predominance of cyclic
forms. To reduce the tautomerism, which can produce
multiple peaks for the same compound on the chro-
matogram, the oximation is required (Shepherd et al.
2007) thus converting the carbonyl groups of aldehy-
des and ketones into oximes (see the reaction in
Fig. 3c, d). There are several oximation and silylation
reagents which can be used, but recent studies have
shown that methoxyamine hydrochloride and N-
methyl-N-(trimethylsilyl)-trifluoroacetamide are the
most appropriate for metabolomics studies (Dettmer
et al. 2007; Ruiz-Matute et al. 2011).
Phytochem Rev (2018) 17:951–972 955
123

These reactions are moisture sensitive therefore the
sample must be completely dried. Thus, preparing MS
samples is higher time-consuming compared to NMR,
and more likely to generate unrepresentative samples.
On the other hand, one of the most important
advantage of using GC–MS compared to NMR is the
very small amount of derivatised samples necessary
for the analysis (typical injection volumes of 1 ll) to
give high resolution spectra.
Salvia species
The genus Salvia consists of ca 900 species (Ayerza
and Coates 2005) and its name comes from the latin
word ‘‘salvere’’, referring to the curative properties of
this plant. Nowadays, some species are still used all
over the world for their nutritional properties and their
beneficial effects on human health. Qualitative and
quantitative differences described for the metabolites
profile of the same genotype could be attributed to
different technical issues, such as harvesting season,
extraction methods, environmental factors, including
altitude, climate and rainfall, abiotic or salt stress, and
nutrient availability. Qualitative analysis by NMR
spectroscopy has been obtained by 2D experiments,
comparison of chemical shifts with standard com-
pounds and with data reported in the literature. In
Table 1 the typical identification peaks of the major
metabolites from Salvia are listed. Peak integration
and use of internal standards allowed respectively the
relative and absolute quantification. Regarding MS
identification, qualitative data were obtained by com-
parison with retention times and m/z values of
Fig. 3 Derivatization steps prior to GC–MS analysis: a Silyla-
tion reactions between hydrophilic groups and trimethylsilyl
(TMS) reagent (Nu = nucleophile), b silylation reaction
mechanism, c oximation reaction of aldehyde and ketone (e.g.
open chain form of glucose and fructose), d reaction mechanism
between methoxyamine hydrochloride and a generic aldehyde
956 Phytochem Rev (2018) 17:951–972
123
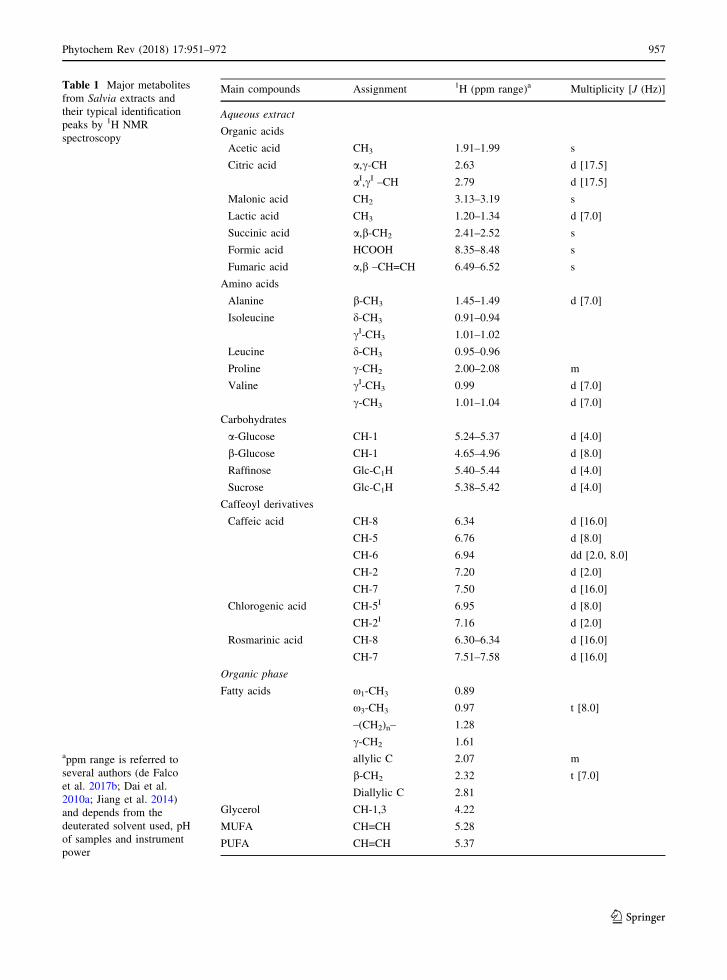
Table 1 Major metabolites
from Salvia extracts and
their typical identification
peaks by 1H NMR
spectroscopy
appm range is referred to
several authors (de Falco
et al. 2017b; Dai et al.
2010a; Jiang et al. 2014)
and depends from the
deuterated solvent used, pH
of samples and instrument
power
Main compounds Assignment 1H (ppm range)a Multiplicity [J (Hz)]
Aqueous extract
Organic acids
Acetic acid CH3 1.91–1.99 s
Citric acid a,c-CH 2.63 d [17.5]
aI,cI –CH 2.79 d [17.5]
Malonic acid CH2 3.13–3.19 s
Lactic acid CH3 1.20–1.34 d [7.0]
Succinic acid a,b-CH2 2.41–2.52 s
Formic acid HCOOH 8.35–8.48 s
Fumaric acid a,b –CH=CH 6.49–6.52 s
Amino acids
Alanine b-CH3 1.45–1.49 d [7.0]
Isoleucine d-CH3 0.91–0.94
cI-CH3 1.01–1.02
Leucine d-CH3 0.95–0.96
Proline c-CH2 2.00–2.08 m
Valine cI-CH3 0.99 d [7.0]
c-CH3 1.01–1.04 d [7.0]
Carbohydrates
a-Glucose CH-1 5.24–5.37 d [4.0]
b-Glucose CH-1 4.65–4.96 d [8.0]
Raffinose Glc-C1H 5.40–5.44 d [4.0]
Sucrose Glc-C1H 5.38–5.42 d [4.0]
Caffeoyl derivatives
Caffeic acid CH-8 6.34 d [16.0]
CH-5 6.76 d [8.0]
CH-6 6.94 dd [2.0, 8.0]
CH-2 7.20 d [2.0]
CH-7 7.50 d [16.0]
Chlorogenic acid CH-5I 6.95 d [8.0]
CH-2I 7.16 d [2.0]
Rosmarinic acid CH-8 6.30–6.34 d [16.0]
CH-7 7.51–7.58 d [16.0]
Organic phase
Fatty acids x1-CH3 0.89
x3-CH3 0.97 t [8.0]
–(CH2)n– 1.28
c-CH2 1.61
allylic C 2.07 m
b-CH2 2.32 t [7.0]
Diallylic C 2.81
Glycerol CH-1,3 4.22
MUFA CH=CH 5.28
PUFA CH=CH 5.37
Phytochem Rev (2018) 17:951–972 957
123
standard compounds available in laboratory and in
data libraries. As for NMR, peak integration and use of
internal standards allowed respectively the relative
and absolute quantification to determine the metabo-
lite profile of Salvia.
Salvia hispanica
Salvia hispanicaL., also known as Chia, is a medicinal
and dietary plant species used since ancient times by
Mayan and Aztec. In the last years, researches have
focused their attention especially on Chia dry inde-
hiscent fruits, which are commonly called seeds
(Bochicchio et al. 2015; Capitani et al. 2016; Jam-
boonsri et al. 2012). Chia seeds possess a very
important role as functional food because of their
chemical composition (de Falco et al. 2017a). Seeds
are composed by total dietary fiber, contain up to 40%
of oil with high content of unsaturated fatty acids, of
which a-linolenic acid is the most abundant one
(Ayerza and Coates 2005). Moreover, they are a good
source of proteins, vitamins, minerals and antioxidants
(de Falco et al. 2017a). There are very few scientific
papers about metabolomics studies of Chia. In the
most recent one, the metabolite profile of seven Chia
(S. hispanica L.) seeds populations, three commercial
(two black, and one white) and four early flowering
genotypes (G3, G8, G17, W13.1, three black and one
white, respectively), was investigated by NMR spec-
troscopy (de Falco et al. 2017b). The chemical
composition of the different genotypes was investi-
gated both from qualitative and quantitative point of
view, through the identification of major metabolites
by 1H NMR analyses and the integration of NMR
spectra followed by chemometrics tool. The research
aimed at evaluating also the effect of agronomic
management, such as fertilization with mineral nitro-
gen, on the metabolite composition of the commercial
genotype. Several organic acids, free amino acids,
carbohydrates, fatty acids and phenols were identified
(Table 2) and results showed that apolar organic
extracts were mainly composed of mono- and polyun-
saturated fatty acids. The principal component anal-
yses (PCA) plot separated the samples showing
significant differences for signals related to carbohy-
drates, which were overall most abundant in commer-
cial black genotype, while the analysis of seeds,
cultivated at different nitrogen supply, showed a
decrease in the content of carbohydrates and
flavonoids, and an increase of aliphatic amino acids.
The obtained data demonstrated that the 1H NMR
spectroscopy, followed by multivariate data analysis,
can provide a detailed metabolite profile of biological
samples, defining the main classes of organic com-
pounds and selecting the best sample for food
companies based on its nutraceuticals content. Amato
et al. (2015) studied the metabolite profile of Chia
leaves fertilized and not fertilized by using HPLC–
ESI–MS. More recently de Falco et al. (2018a)
investigated the yield and metabolic profile of the
seeds of two chia populations, one commercial black
(B) and one long-day flowering genotype (G8), in
response to two irrigation levels. The analysis was
performed by ultrasound assisted extraction (UAE) of
seeds followed by gas chromatography–mass spec-
trometry (GC/MS) analysis. Differences in fatty acids
and the major classes of organic compounds have been
observed due to both genotype and irrigation, espe-
cially in the non-polar phase where irrigated samples
showed a higher content of a-linolenic and other fatty
acids and a lower oleic/linoleic ratio. Another recent
study by de Falco et al. (2018b) analyzed for the first
time the Chia metabolomics in response to mutation
by the same technical approach. Mutants showed
higher seed yield than commercial seeds and mutation
affects chemical composition increasing nutraceutical
properties. These results showed that metabolomics
untargeted analysis is a very powerful methods to
evaluate mutation but also to verify the effect of
agronomic management such as fertilization and
irrigation.
Salvia miltiorrhiza
S. miltiorrhiza Bunge, also known as red sage or
Danshen, is a traditional Chinese medicinal herb used
in the treatments of cardiovascular and liver diseases
due to its antioxidant properties (Chen et al. 2000;
Sugiyama et al. 2002; Wasser et al. 1998; Zhang et al.
1990). In particular, its dry roots are widely used in
phytomedicine for the treatments of several diseases,
such as atherosclerosis, myocardial ischemia and
hepatic fibrosis, due to specific metabolites including
salvianolic acids and the diterpenoids named tanshi-
nones (Sieveking et al. 2005; Sugiyama et al. 2002).
For example, tanshinones have been reported to
possess antimicrobial activities against plant patho-
gens (Zhao et al. 2011), while tanshinone IIA exerts
958 Phytochem Rev (2018) 17:951–972
123

Table 2 Metabolomics approach applied on different part of Salvia hispanica
Part of the
plant
Analytical
techniques
Data
analysis
Metabolites Quantity References
Seeds 1H-NMR PCA a-Glucose 63.2–73.3%* de Falco et al.
(2017b)
Seeds 1H-NMR PCA c-Aminobutyrate 2.4–4.7%* de Falco et al.
(2017b)
Leaves HPLC–ESI–MS ANOVA Acetyl orientin n.i. Amato et al. (2015)
Leaves HPLC–ESI–MS ANOVA Acetyl orientin derivative n.i. Amato et al. (2015)
Leaves HPLC–ESI–MS ANOVA Acetyl vitexin n.i. Amato et al. (2015)
Leaves HPLC–ESI–MS ANOVA Acetyl vitexin derivative n.i. Amato et al. (2015)
Seeds 1H-NMR PCA Alanine 1.5–4.2%* de Falco et al.
(2017b)
Leaves HPLC–ESI–MS ANOVA Apigenin-7-O-glucoside n.i. Amato et al. (2015)
Leaves HPLC–ESI–MS ANOVA Apigenin-C-pentose n.i. Amato et al. (2015)
Leaves HPLC–ESI–MS ANOVA Apigenin-O-glucuronide n.i. Amato et al. (2015)
Seeds 1H-NMR PCA Aspartate 1.9–2.9%* de Falco et al.
(2017b)
Seeds 1H-NMR PCA Caffeic acid 2.2–4.6%* de Falco et al.
(2017b)
Leaves HPLC–ESI–MS ANOVA Caffeic acid n.i. Amato et al. (2015)
Seeds 1H-NMR PCA Chlorogenic acid 4–6.9%* de Falco et al.
(2017b)
Leaves HPLC–ESI–MS ANOVA Chlorogenic acid n.i. Amato et al. (2015)
Seeds 1H-NMR PCA Citrate 3.3–7.4%* de Falco et al.
(2017b)
Leaves HPLC–ESI–MS ANOVA Coumaric acid-O-hexose n.i. Amato et al. (2015)
Leaves HPLC–ESI–MS ANOVA Coumaroyl quinic acid-1 n.i. Amato et al. (2015)
Leaves HPLC–ESI–MS ANOVA Coumaroyl quinic acid-2 n.i. Amato et al. (2015)
Leaves HPLC–ESI–MS ANOVA Dihydrosinapic acid-O-hexose n.i. Amato et al. (2015)
Leaves HPLC–ESI–MS ANOVA Dimethyl quercetin n.i. Amato et al. (2015)
Leaves HPLC–ESI–MS ANOVA Ellagic acid-O-hexose n.i. Amato et al. (2015)
Leaves HPLC–ESI–MS ANOVA Ferulic acid derivative n.i. Amato et al. (2015)
Seeds 1H-NMR PCA Formate 0.1–4.2%* de Falco et al.
(2017b)
Seeds 1H-NMR PCA Fumarate 0.2–9.1%* de Falco et al.
(2017b)
Seeds 1H-NMR PCA Genistein 1.4–3.0%* de Falco et al.
(2017b)
Seeds 1H-NMR PCA Isoleucine 1.8–3.2%* de Falco et al.
(2017b)
Leaves HPLC–ESI–MS ANOVA Kaempferol-O-hexose
desoxyhexose
n.i. Amato et al. (2015)
Seeds 1H-NMR PCA Lactate 0.5–1.7%* de Falco et al.
(2017b)
Seeds 1H-NMR PCA Leucine 0.7–1.2%* de Falco et al.
(2017b)
Leaves HPLC–ESI–MS ANOVA Luteolin-O-hexose n.i. Amato et al. (2015)
Leaves HPLC–ESI–MS ANOVA Luteolin-7-O-glucoside n.i. Amato et al. (2015)
Leaves HPLC–ESI–MS ANOVA Luteolin-O-glucuronide n.i. Amato et al. (2015)
Phytochem Rev (2018) 17:951–972 959
123

vasorelaxative, antiarrhythmic and anti-cancer activ-
ities (Gao et al. 2008; Gong et al. 2010; Sun et al.
2008). Primary metabolites such as carbohydrates,
amino acids and organic acids are essential for plant
growth and maintenance of cells. However, liquid
chromatography coupled with mass spectrometry
(LC–MS) methods are more suitable for secondary
metabolites such as polyphenolic acids and diter-
penoids. To establish a method for detecting in a one-
step procedure both primary and secondary metabo-
lites in S. miltiorrhiza, Jiang et al. (2014) used 1H-
NMR fingerprint coupled with sparse partial-least-
squares discriminant analysis (sPLS-DA). Metabolites
were quantified and their levels evaluated by Kruskal–
Wallis tests. In this study, S. miltiorrhiza root extracts
were collected from four different regions of China
(Zhongjiang, Linqu, Bozhou and Anguo). Twenty-six
primary and secondary metabolites were identified
and metabolomics studies suggest that malonate and
succinate can be possibly recognised as the key
markers for discriminating the geographical origin of
S. miltiorrhiza roots. Dai et al. (2010a) analyzed the
metabolite compositions of three cultivars of S.
miltiorrhiza Bunge roots and a cultivar obtained from
four different growing locations using NMR coupled
to LC–DAD–MS methods to assess the effectiveness
of these combined approaches in plant metabolomics.
They also acquired 1H–1H COSY, 1H–1H TOCSY, 1H
J-resolved, 1H–13C HSQC and 1H–13C HMBC 2D
NMR spectra on selected samples for resonance
assignment purposes. The results showed that the
metabolome was dominated by 4 polyphenolic acids
Table 2 continued
Part of the
plant
Analytical
techniques
Data
analysis
Metabolites Quantity References
Seeds 1H-NMR PCA Malonate 0.7–2%* de Falco et al.
(2017b)
Seeds 1H-NMR PCA N-Acetylglutamate 2.4–4.8%* de Falco et al.
(2017b)
Leaves HPLC–ESI–MS ANOVA Naringenin n.i. Amato et al. (2015)
Leaves HPLC–ESI–MS ANOVA Orientin (luteolin-6-C-glucoside) n.i. Amato et al. (2015)
Leaves HPLC–ESI–MS ANOVA Orientin derivative n.i. Amato et al. (2015)
Seeds 1H-NMR PCA Proline 1.8–3.7%* de Falco et al.
(2017b)
Seeds 1H-NMR PCA Quercetin 1.2–2.7%* de Falco et al.
(2017b)
Leaves HPLC–ESI–MS ANOVA Quercetin methyl ether n.i. Amato et al. (2015)
Leaves HPLC–ESI–MS ANOVA Quercetin-O-hexose desoxyhexose n.i. Amato et al. (2015)
Seeds 1H-NMR PCA Raffinose 82.4–103.8%* de Falco et al.
(2017b)
Seeds 1H-NMR PCA Rosmarinic acid 9.2–14%* de Falco et al.
(2017b)
Leaves HPLC–ESI–MS ANOVA Rosmarinic acid n.i. Amato et al. (2015)
Leaves HPLC–ESI–MS ANOVA Salvianolic acid F isomer n.i. Amato et al. (2015)
Seeds 1H-NMR PCA Succinate 1.6–3.8%* de Falco et al.
(2017b)
Seeds 1H-NMR PCA Sucrose 59.5–78.5%* de Falco et al.
(2017b)
Seeds 1H-NMR PCA Valine 2.7–4.5%* de Falco et al.
(2017b)
Leaves HPLC–ESI–MS ANOVA Vitexin (apigenin-8-C glucoside) n.i. Amato et al. (2015)
Leaves HPLC–ESI–MS ANOVA Vitexin derivative n.i. Amato et al. (2015)
n.i. not indicated
*Range metabolite contents in S. hispanica extracts from different genotypes
960 Phytochem Rev (2018) 17:951–972
123
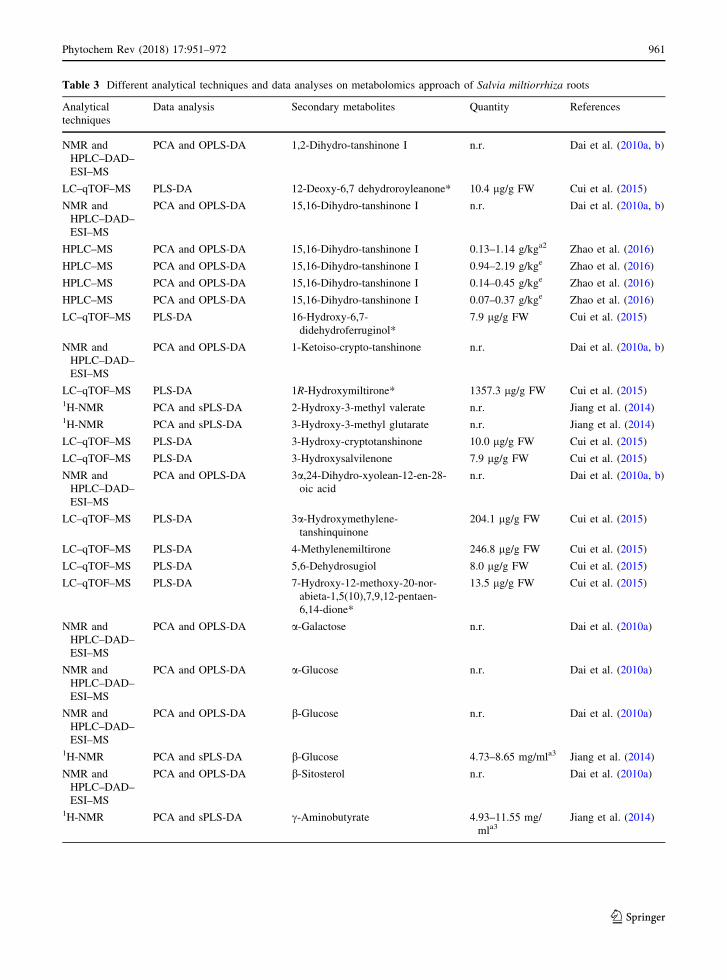
Table 3 Different analytical techniques and data analyses on metabolomics approach of Salvia miltiorrhiza roots
Analytical
techniques
Data analysis Secondary metabolites Quantity References
NMR and
HPLC–DAD–
ESI–MS
PCA and OPLS-DA 1,2-Dihydro-tanshinone I n.r. Dai et al. (2010a, b)
LC–qTOF–MS PLS-DA 12-Deoxy-6,7 dehydroroyleanone* 10.4 lg/g FW Cui et al. (2015)
NMR and
HPLC–DAD–
ESI–MS
PCA and OPLS-DA 15,16-Dihydro-tanshinone I n.r. Dai et al. (2010a, b)
HPLC–MS PCA and OPLS-DA 15,16-Dihydro-tanshinone I 0.13–1.14 g/kga2 Zhao et al. (2016)
HPLC–MS PCA and OPLS-DA 15,16-Dihydro-tanshinone I 0.94–2.19 g/kge Zhao et al. (2016)
HPLC–MS PCA and OPLS-DA 15,16-Dihydro-tanshinone I 0.14–0.45 g/kge Zhao et al. (2016)
HPLC–MS PCA and OPLS-DA 15,16-Dihydro-tanshinone I 0.07–0.37 g/kge Zhao et al. (2016)
LC–qTOF–MS PLS-DA 16-Hydroxy-6,7-
didehydroferruginol*
7.9 lg/g FW Cui et al. (2015)
NMR and
HPLC–DAD–
ESI–MS
PCA and OPLS-DA 1-Ketoiso-crypto-tanshinone n.r. Dai et al. (2010a, b)
LC–qTOF–MS PLS-DA 1R-Hydroxymiltirone* 1357.3 lg/g FW Cui et al. (2015)1H-NMR PCA and sPLS-DA 2-Hydroxy-3-methyl valerate n.r. Jiang et al. (2014)1H-NMR PCA and sPLS-DA 3-Hydroxy-3-methyl glutarate n.r. Jiang et al. (2014)
LC–qTOF–MS PLS-DA 3-Hydroxy-cryptotanshinone 10.0 lg/g FW Cui et al. (2015)
LC–qTOF–MS PLS-DA 3-Hydroxysalvilenone 7.9 lg/g FW Cui et al. (2015)
NMR and
HPLC–DAD–
ESI–MS
PCA and OPLS-DA 3a,24-Dihydro-xyolean-12-en-28-
oic acid
n.r. Dai et al. (2010a, b)
LC–qTOF–MS PLS-DA 3a-Hydroxymethylene-
tanshinquinone
204.1 lg/g FW Cui et al. (2015)
LC–qTOF–MS PLS-DA 4-Methylenemiltirone 246.8 lg/g FW Cui et al. (2015)
LC–qTOF–MS PLS-DA 5,6-Dehydrosugiol 8.0 lg/g FW Cui et al. (2015)
LC–qTOF–MS PLS-DA 7-Hydroxy-12-methoxy-20-nor-
abieta-1,5(10),7,9,12-pentaen-
6,14-dione*
13.5 lg/g FW Cui et al. (2015)
NMR and
HPLC–DAD–
ESI–MS
PCA and OPLS-DA a-Galactose n.r. Dai et al. (2010a)
NMR and
HPLC–DAD–
ESI–MS
PCA and OPLS-DA a-Glucose n.r. Dai et al. (2010a)
NMR and
HPLC–DAD–
ESI–MS
PCA and OPLS-DA b-Glucose n.r. Dai et al. (2010a)
1H-NMR PCA and sPLS-DA b-Glucose 4.73–8.65 mg/mla3 Jiang et al. (2014)
NMR and
HPLC–DAD–
ESI–MS
PCA and OPLS-DA b-Sitosterol n.r. Dai et al. (2010a)
1H-NMR PCA and sPLS-DA c-Aminobutyrate 4.93–11.55 mg/
mla3Jiang et al. (2014)
Phytochem Rev (2018) 17:951–972 961
123
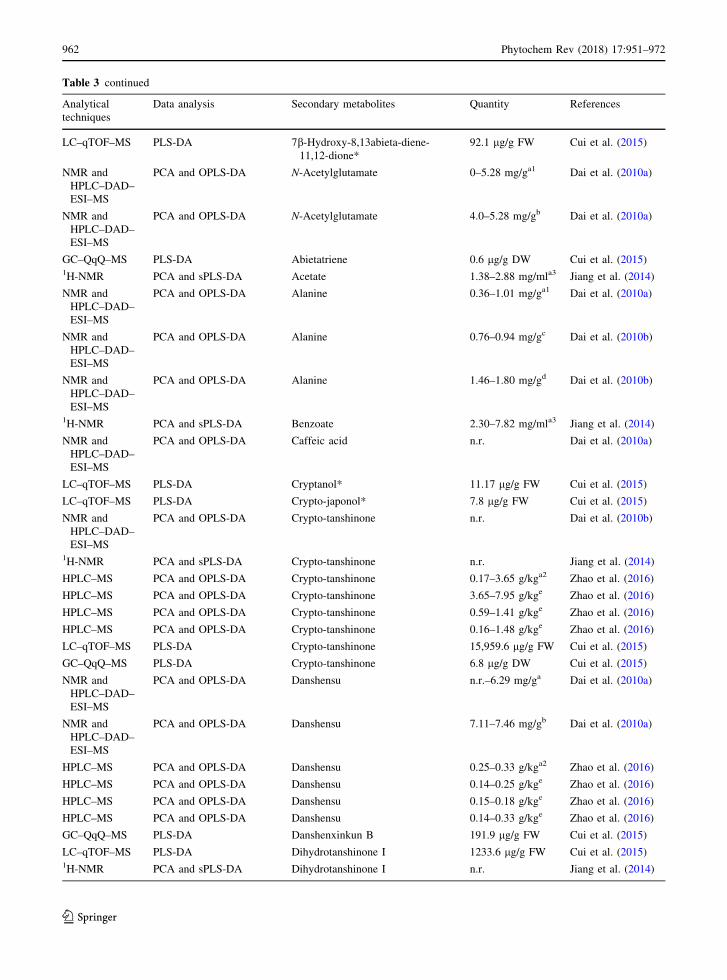
Table 3 continued
Analytical
techniques
Data analysis Secondary metabolites Quantity References
LC–qTOF–MS PLS-DA 7b-Hydroxy-8,13abieta-diene-
11,12-dione*
92.1 lg/g FW Cui et al. (2015)
NMR and
HPLC–DAD–
ESI–MS
PCA and OPLS-DA N-Acetylglutamate 0–5.28 mg/ga1 Dai et al. (2010a)
NMR and
HPLC–DAD–
ESI–MS
PCA and OPLS-DA N-Acetylglutamate 4.0–5.28 mg/gb Dai et al. (2010a)
GC–QqQ–MS PLS-DA Abietatriene 0.6 lg/g DW Cui et al. (2015)1H-NMR PCA and sPLS-DA Acetate 1.38–2.88 mg/mla3 Jiang et al. (2014)
NMR and
HPLC–DAD–
ESI–MS
PCA and OPLS-DA Alanine 0.36–1.01 mg/ga1 Dai et al. (2010a)
NMR and
HPLC–DAD–
ESI–MS
PCA and OPLS-DA Alanine 0.76–0.94 mg/gc Dai et al. (2010b)
NMR and
HPLC–DAD–
ESI–MS
PCA and OPLS-DA Alanine 1.46–1.80 mg/gd Dai et al. (2010b)
1H-NMR PCA and sPLS-DA Benzoate 2.30–7.82 mg/mla3 Jiang et al. (2014)
NMR and
HPLC–DAD–
ESI–MS
PCA and OPLS-DA Caffeic acid n.r. Dai et al. (2010a)
LC–qTOF–MS PLS-DA Cryptanol* 11.17 lg/g FW Cui et al. (2015)
LC–qTOF–MS PLS-DA Crypto-japonol* 7.8 lg/g FW Cui et al. (2015)
NMR and
HPLC–DAD–
ESI–MS
PCA and OPLS-DA Crypto-tanshinone n.r. Dai et al. (2010b)
1H-NMR PCA and sPLS-DA Crypto-tanshinone n.r. Jiang et al. (2014)
HPLC–MS PCA and OPLS-DA Crypto-tanshinone 0.17–3.65 g/kga2 Zhao et al. (2016)
HPLC–MS PCA and OPLS-DA Crypto-tanshinone 3.65–7.95 g/kge Zhao et al. (2016)
HPLC–MS PCA and OPLS-DA Crypto-tanshinone 0.59–1.41 g/kge Zhao et al. (2016)
HPLC–MS PCA and OPLS-DA Crypto-tanshinone 0.16–1.48 g/kge Zhao et al. (2016)
LC–qTOF–MS PLS-DA Crypto-tanshinone 15,959.6 lg/g FW Cui et al. (2015)
GC–QqQ–MS PLS-DA Crypto-tanshinone 6.8 lg/g DW Cui et al. (2015)
NMR and
HPLC–DAD–
ESI–MS
PCA and OPLS-DA Danshensu n.r.–6.29 mg/ga Dai et al. (2010a)
NMR and
HPLC–DAD–
ESI–MS
PCA and OPLS-DA Danshensu 7.11–7.46 mg/gb Dai et al. (2010a)
HPLC–MS PCA and OPLS-DA Danshensu 0.25–0.33 g/kga2 Zhao et al. (2016)
HPLC–MS PCA and OPLS-DA Danshensu 0.14–0.25 g/kge Zhao et al. (2016)
HPLC–MS PCA and OPLS-DA Danshensu 0.15–0.18 g/kge Zhao et al. (2016)
HPLC–MS PCA and OPLS-DA Danshensu 0.14–0.33 g/kge Zhao et al. (2016)
GC–QqQ–MS PLS-DA Danshenxinkun B 191.9 lg/g FW Cui et al. (2015)
LC–qTOF–MS PLS-DA Dihydrotanshinone I 1233.6 lg/g FW Cui et al. (2015)1H-NMR PCA and sPLS-DA Dihydrotanshinone I n.r. Jiang et al. (2014)
962 Phytochem Rev (2018) 17:951–972
123

Table 3 continued
Analytical
techniques
Data analysis Secondary metabolites Quantity References
GC–QqQ–MS PLS-DA Ferruginol 29.5 lg/g DW Cui et al. (2015)
NMR and
HPLC–DAD–
ESI–MS
PCA and OPLS-DA Ferulic acid n.r. Dai et al. (2010a)
NMR and
HPLC–DAD–
ESI–MS
PCA and OPLS-DA Glutamine 4.86–45.23 mg/ga1 Dai et al. (2010a)
NMR and
HPLC–DAD–
ESI–MS
PCA and OPLS-DA Glutamine 4.0–9.21 mg/gb Dai et al. (2010a)
NMR and
HPLC–DAD–
ESI–MS
PCA and OPLS-DA Glutamine 27.71–47.28 mg/gc Dai et al. (2010b)
NMR and
HPLC–DAD–
ESI–MS
PCA and OPLS-DA Glutamine 14.45–1.30 mg/gd Dai et al. (2010b)
1H-NMR PCA and sPLS-DA Histidine 0.38–1.88 mg/mla3 Jiang et al. (2014)
LC–qTOF–MS PLS-DA Hydroxytanshinone IIA 200.4 lg/g FW Cui et al. (2015)
NMR and
HPLC–DAD–
ESI–MS
PCA and OPLS-DA Isoleucine 0.37–0.95 mg/ga1 Dai et al. (2010a)
NMR and
HPLC–DAD–
ESI–MS
PCA and OPLS-DA Isoleucine 0.94–1.06 mg/gc Dai et al. (2010b)
LC–qTOF–MS PLS-DA Isotanshinone IIA 107.1 lg/g FW Cui et al. (2015)
NMR and
HPLC–DAD–
ESI–MS
PCA and OPLS-DA Lactate 0.48–0.95 mg/ga1 Dai et al. (2010a)
NMR and
HPLC–DAD–
ESI–MS
PCA and OPLS-DA Lactate 1.18–1.30 mg/gc Dai et al. (2010b)
NMR and
HPLC–DAD–
ESI–MS
PCA and OPLS-DA Lactate 1.14–2.43 mg/gd Dai et al. (2010b)
NMR and
HPLC–DAD–
ESI–MS
PCA and OPLS-DA Lithospermic acid 4.12–9.49 mg/ga Dai et al. (2010a)
NMR and
HPLC–DAD–
ESI–MS
PCA and OPLS-DA Lithospermic acid 8.07–10.41 mg/gb Dai et al. (2010a)
NMR and
HPLC–DAD–
ESI–MS
PCA and OPLS-DA Lithospermic acid 3.17–8.70 mg/gc Dai et al. (2010b)
NMR and
HPLC–DAD–
ESI–MS
PCA and OPLS-DA Lithospermic acid 4.45–5.03 mg/gd Dai et al. (2010b)
HPLC–MS PCA and OPLS-DA Lithospermic acid 1.44–2.96 g/kga2 Zhao et al. (2016)
HPLC–MS PCA and OPLS-DA Lithospermic acid 1.71–2.82 g/kge Zhao et al. (2016)
HPLC–MS PCA and OPLS-DA Lithospermic acid 1.11–1.73 g/kge Zhao et al. (2016)
HPLC–MS PCA and OPLS-DA Lithospermic acid 0.95–2.96 g/kge Zhao et al. (2016)
Phytochem Rev (2018) 17:951–972 963
123
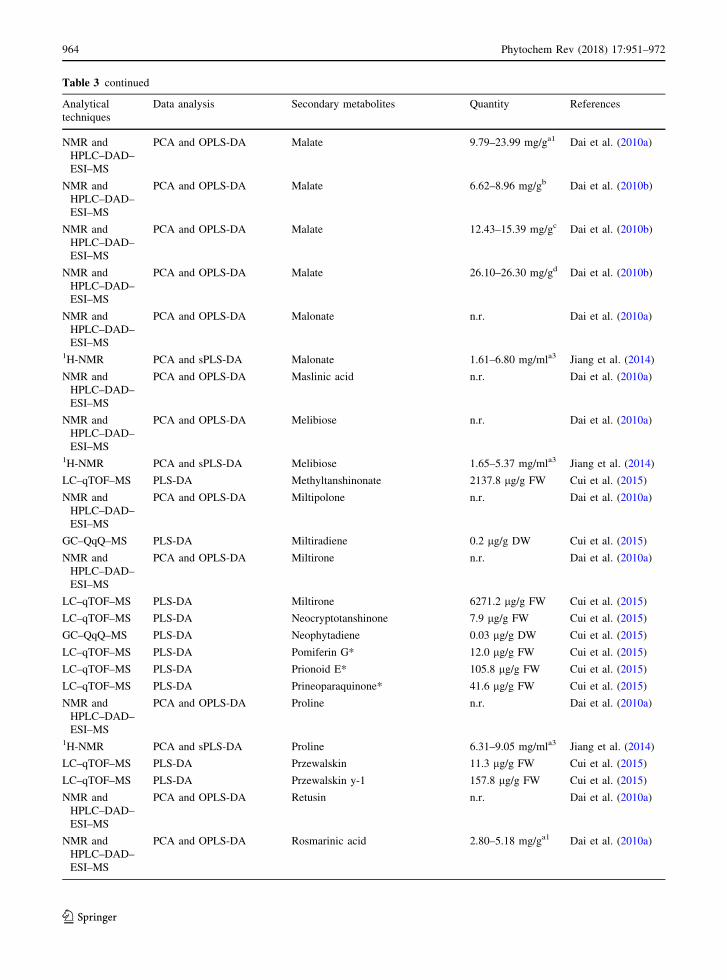
Table 3 continued
Analytical
techniques
Data analysis Secondary metabolites Quantity References
NMR and
HPLC–DAD–
ESI–MS
PCA and OPLS-DA Malate 9.79–23.99 mg/ga1 Dai et al. (2010a)
NMR and
HPLC–DAD–
ESI–MS
PCA and OPLS-DA Malate 6.62–8.96 mg/gb Dai et al. (2010b)
NMR and
HPLC–DAD–
ESI–MS
PCA and OPLS-DA Malate 12.43–15.39 mg/gc Dai et al. (2010b)
NMR and
HPLC–DAD–
ESI–MS
PCA and OPLS-DA Malate 26.10–26.30 mg/gd Dai et al. (2010b)
NMR and
HPLC–DAD–
ESI–MS
PCA and OPLS-DA Malonate n.r. Dai et al. (2010a)
1H-NMR PCA and sPLS-DA Malonate 1.61–6.80 mg/mla3 Jiang et al. (2014)
NMR and
HPLC–DAD–
ESI–MS
PCA and OPLS-DA Maslinic acid n.r. Dai et al. (2010a)
NMR and
HPLC–DAD–
ESI–MS
PCA and OPLS-DA Melibiose n.r. Dai et al. (2010a)
1H-NMR PCA and sPLS-DA Melibiose 1.65–5.37 mg/mla3 Jiang et al. (2014)
LC–qTOF–MS PLS-DA Methyltanshinonate 2137.8 lg/g FW Cui et al. (2015)
NMR and
HPLC–DAD–
ESI–MS
PCA and OPLS-DA Miltipolone n.r. Dai et al. (2010a)
GC–QqQ–MS PLS-DA Miltiradiene 0.2 lg/g DW Cui et al. (2015)
NMR and
HPLC–DAD–
ESI–MS
PCA and OPLS-DA Miltirone n.r. Dai et al. (2010a)
LC–qTOF–MS PLS-DA Miltirone 6271.2 lg/g FW Cui et al. (2015)
LC–qTOF–MS PLS-DA Neocryptotanshinone 7.9 lg/g FW Cui et al. (2015)
GC–QqQ–MS PLS-DA Neophytadiene 0.03 lg/g DW Cui et al. (2015)
LC–qTOF–MS PLS-DA Pomiferin G* 12.0 lg/g FW Cui et al. (2015)
LC–qTOF–MS PLS-DA Prionoid E* 105.8 lg/g FW Cui et al. (2015)
LC–qTOF–MS PLS-DA Prineoparaquinone* 41.6 lg/g FW Cui et al. (2015)
NMR and
HPLC–DAD–
ESI–MS
PCA and OPLS-DA Proline n.r. Dai et al. (2010a)
1H-NMR PCA and sPLS-DA Proline 6.31–9.05 mg/mla3 Jiang et al. (2014)
LC–qTOF–MS PLS-DA Przewalskin 11.3 lg/g FW Cui et al. (2015)
LC–qTOF–MS PLS-DA Przewalskin y-1 157.8 lg/g FW Cui et al. (2015)
NMR and
HPLC–DAD–
ESI–MS
PCA and OPLS-DA Retusin n.r. Dai et al. (2010a)
NMR and
HPLC–DAD–
ESI–MS
PCA and OPLS-DA Rosmarinic acid 2.80–5.18 mg/ga1 Dai et al. (2010a)
964 Phytochem Rev (2018) 17:951–972
123

Table 3 continued
Analytical
techniques
Data analysis Secondary metabolites Quantity References
NMR and
HPLC–DAD–
ESI–MS
PCA and OPLS-DA Rosmarinic acid 2.82–3.22 mg/gb Dai et al. (2010a)
NMR and
HPLC–DAD–
ESI–MS
PCA and OPLS-DA Rosmarinic acid 1.80–7.06 mg/gc Dai et al. (2010b)
NMR and
HPLC–DAD–
ESI–MS
PCA and OPLS-DA Rosmarinic acid 4.19–4.66 mg/gd Dai et al. (2010b)
HPLC–MS PCA and OPLS-DA Rosmarinic acid 2.38–5.34 g/kga2 Zhao et al. (2016)
HPLC–MS PCA and OPLS-DA Rosmarinic acid 1.90–3.98 g/kge Zhao et al. (2016)
HPLC–MS PCA and OPLS-DA Rosmarinic acid 1.51–2.51 g/kge Zhao et al. (2016)
HPLC–MS PCA and OPLS-DA Rosmarinic acid 1.22–5.34 g/kge Zhao et al. (2016)1H-NMR PCA and sPLS-DA Rosmarinic acid n.r. Jiang et al. (2014)
NMR and
HPLC–DAD–
ESI–MS
PCA and OPLS-DA Raffinose 316.03–426.63 mg/
ga1Dai et al. (2010a)
NMR and
HPLC–DAD–
ESI–MS
PCA and OPLS-DA Raffinose 351.41–495.55 mg/
gbDai et al. (2010a)
NMR and
HPLC–DAD–
ESI–MS
PCA and OPLS-DA Raffinose 321.13–436.92 mg/
gcDai et al. (2010b)
NMR and
HPLC–DAD–
ESI–MS
PCA and OPLS-DA Raffinose 290.67–311.14 mg/
gdDai et al. (2010b)
1H-NMR PCA and sPLS-DA Raffinose 20.11–72.81 mg/
mla3Jiang et al. (2014)
1H-NMR PCA and sPLS-DA Salvianic acid 3.16–9.34 mg/mla3 Jiang et al. (2014)
NMR and
HPLC–DAD–
ESI–MS
PCA and OPLS-DA Salvianolic acid B 68.07–134.23 mg/
ga1Dai et al. (2010a)
NMR and
HPLC–DAD–
ESI–MS
PCA and OPLS-DA Salvianolic acid B 58.79–65.01 mg/gb Dai et al. (2010a)
NMR and
HPLC–DAD–
ESI–MS
PCA and OPLS-DA Salvianolic acid B 28.68–130.0 mg/gc Dai et al. (2010b)
NMR and
HPLC–DAD–
ESI–MS
PCA and OPLS-DA Salvianolic acid B 81.79–87.08 mg/gd Dai et al. (2010b)
1H-NMR PCA and sPLS-DA Salvianolic acid B 11.03–29.91 mg/
mla3Jiang et al. (2014)
NMR and
HPLC–DAD–
ESI–MS
PCA and OPLS-DA Salvianolic acid F n.r. Dai et al. (2010a)
NMR and
HPLC–DAD–
ESI–MS
PCA and OPLS-DA Salvianolic acid H/I n.r. Dai et al. (2010a)
HPLC–MS PCA and OPLS-DA Salvianolic acid H/I 39.2349.13 g/kga2 Zhao et al. (2016)
Phytochem Rev (2018) 17:951–972 965
123
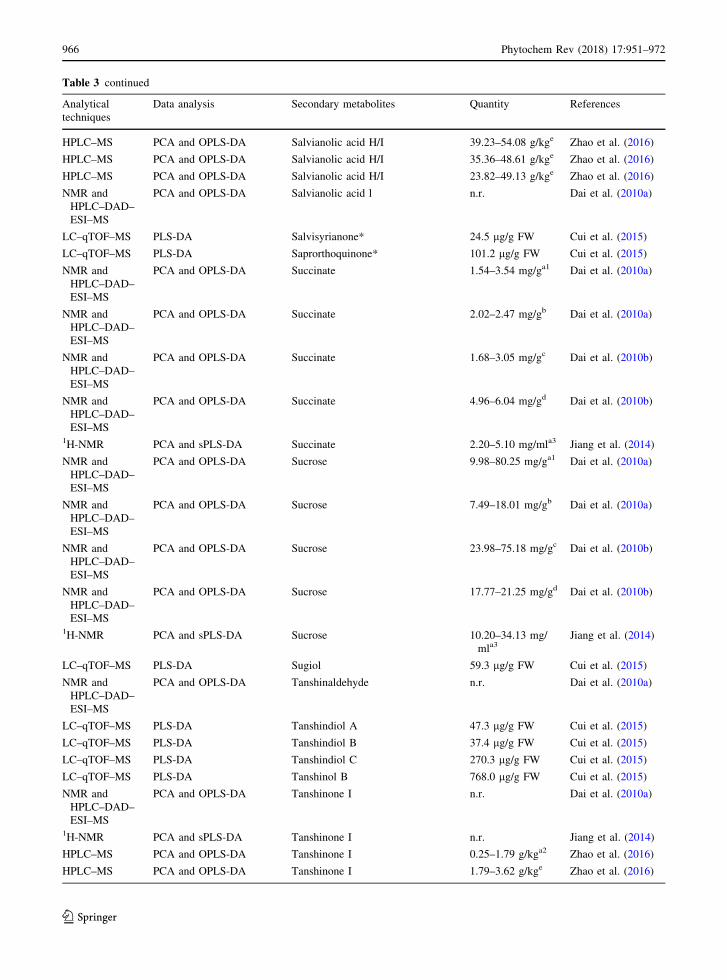
Table 3 continued
Analytical
techniques
Data analysis Secondary metabolites Quantity References
HPLC–MS PCA and OPLS-DA Salvianolic acid H/I 39.23–54.08 g/kge Zhao et al. (2016)
HPLC–MS PCA and OPLS-DA Salvianolic acid H/I 35.36–48.61 g/kge Zhao et al. (2016)
HPLC–MS PCA and OPLS-DA Salvianolic acid H/I 23.82–49.13 g/kge Zhao et al. (2016)
NMR and
HPLC–DAD–
ESI–MS
PCA and OPLS-DA Salvianolic acid l n.r. Dai et al. (2010a)
LC–qTOF–MS PLS-DA Salvisyrianone* 24.5 lg/g FW Cui et al. (2015)
LC–qTOF–MS PLS-DA Saprorthoquinone* 101.2 lg/g FW Cui et al. (2015)
NMR and
HPLC–DAD–
ESI–MS
PCA and OPLS-DA Succinate 1.54–3.54 mg/ga1 Dai et al. (2010a)
NMR and
HPLC–DAD–
ESI–MS
PCA and OPLS-DA Succinate 2.02–2.47 mg/gb Dai et al. (2010a)
NMR and
HPLC–DAD–
ESI–MS
PCA and OPLS-DA Succinate 1.68–3.05 mg/gc Dai et al. (2010b)
NMR and
HPLC–DAD–
ESI–MS
PCA and OPLS-DA Succinate 4.96–6.04 mg/gd Dai et al. (2010b)
1H-NMR PCA and sPLS-DA Succinate 2.20–5.10 mg/mla3 Jiang et al. (2014)
NMR and
HPLC–DAD–
ESI–MS
PCA and OPLS-DA Sucrose 9.98–80.25 mg/ga1 Dai et al. (2010a)
NMR and
HPLC–DAD–
ESI–MS
PCA and OPLS-DA Sucrose 7.49–18.01 mg/gb Dai et al. (2010a)
NMR and
HPLC–DAD–
ESI–MS
PCA and OPLS-DA Sucrose 23.98–75.18 mg/gc Dai et al. (2010b)
NMR and
HPLC–DAD–
ESI–MS
PCA and OPLS-DA Sucrose 17.77–21.25 mg/gd Dai et al. (2010b)
1H-NMR PCA and sPLS-DA Sucrose 10.20–34.13 mg/
mla3Jiang et al. (2014)
LC–qTOF–MS PLS-DA Sugiol 59.3 lg/g FW Cui et al. (2015)
NMR and
HPLC–DAD–
ESI–MS
PCA and OPLS-DA Tanshinaldehyde n.r. Dai et al. (2010a)
LC–qTOF–MS PLS-DA Tanshindiol A 47.3 lg/g FW Cui et al. (2015)
LC–qTOF–MS PLS-DA Tanshindiol B 37.4 lg/g FW Cui et al. (2015)
LC–qTOF–MS PLS-DA Tanshindiol C 270.3 lg/g FW Cui et al. (2015)
LC–qTOF–MS PLS-DA Tanshinol B 768.0 lg/g FW Cui et al. (2015)
NMR and
HPLC–DAD–
ESI–MS
PCA and OPLS-DA Tanshinone I n.r. Dai et al. (2010a)
1H-NMR PCA and sPLS-DA Tanshinone I n.r. Jiang et al. (2014)
HPLC–MS PCA and OPLS-DA Tanshinone I 0.25–1.79 g/kga2 Zhao et al. (2016)
HPLC–MS PCA and OPLS-DA Tanshinone I 1.79–3.62 g/kge Zhao et al. (2016)
966 Phytochem Rev (2018) 17:951–972
123
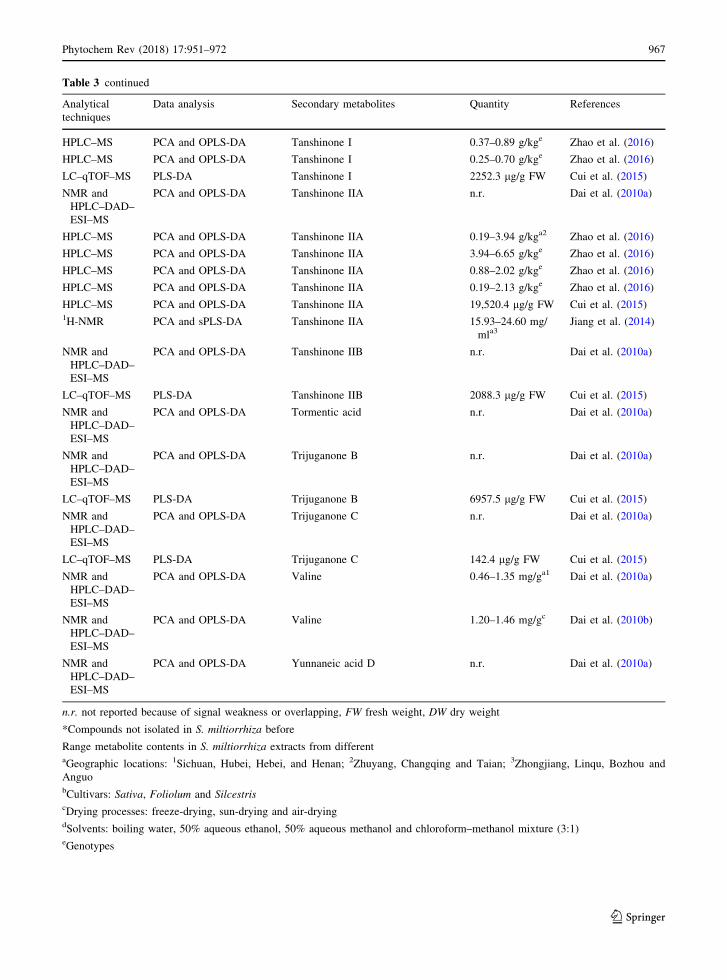
Table 3 continued
Analytical
techniques
Data analysis Secondary metabolites Quantity References
HPLC–MS PCA and OPLS-DA Tanshinone I 0.37–0.89 g/kge Zhao et al. (2016)
HPLC–MS PCA and OPLS-DA Tanshinone I 0.25–0.70 g/kge Zhao et al. (2016)
LC–qTOF–MS PLS-DA Tanshinone I 2252.3 lg/g FW Cui et al. (2015)
NMR and
HPLC–DAD–
ESI–MS
PCA and OPLS-DA Tanshinone IIA n.r. Dai et al. (2010a)
HPLC–MS PCA and OPLS-DA Tanshinone IIA 0.19–3.94 g/kga2 Zhao et al. (2016)
HPLC–MS PCA and OPLS-DA Tanshinone IIA 3.94–6.65 g/kge Zhao et al. (2016)
HPLC–MS PCA and OPLS-DA Tanshinone IIA 0.88–2.02 g/kge Zhao et al. (2016)
HPLC–MS PCA and OPLS-DA Tanshinone IIA 0.19–2.13 g/kge Zhao et al. (2016)
HPLC–MS PCA and OPLS-DA Tanshinone IIA 19,520.4 lg/g FW Cui et al. (2015)1H-NMR PCA and sPLS-DA Tanshinone IIA 15.93–24.60 mg/
mla3Jiang et al. (2014)
NMR and
HPLC–DAD–
ESI–MS
PCA and OPLS-DA Tanshinone IIB n.r. Dai et al. (2010a)
LC–qTOF–MS PLS-DA Tanshinone IIB 2088.3 lg/g FW Cui et al. (2015)
NMR and
HPLC–DAD–
ESI–MS
PCA and OPLS-DA Tormentic acid n.r. Dai et al. (2010a)
NMR and
HPLC–DAD–
ESI–MS
PCA and OPLS-DA Trijuganone B n.r. Dai et al. (2010a)
LC–qTOF–MS PLS-DA Trijuganone B 6957.5 lg/g FW Cui et al. (2015)
NMR and
HPLC–DAD–
ESI–MS
PCA and OPLS-DA Trijuganone C n.r. Dai et al. (2010a)
LC–qTOF–MS PLS-DA Trijuganone C 142.4 lg/g FW Cui et al. (2015)
NMR and
HPLC–DAD–
ESI–MS
PCA and OPLS-DA Valine 0.46–1.35 mg/ga1 Dai et al. (2010a)
NMR and
HPLC–DAD–
ESI–MS
PCA and OPLS-DA Valine 1.20–1.46 mg/gc Dai et al. (2010b)
NMR and
HPLC–DAD–
ESI–MS
PCA and OPLS-DA Yunnaneic acid D n.r. Dai et al. (2010a)
n.r. not reported because of signal weakness or overlapping, FW fresh weight, DW dry weight
*Compounds not isolated in S. miltiorrhiza before
Range metabolite contents in S. miltiorrhiza extracts from differentaGeographic locations: 1Sichuan, Hubei, Hebei, and Henan; 2Zhuyang, Changqing and Taian; 3Zhongjiang, Linqu, Bozhou and
AnguobCultivars: Sativa, Foliolum and SilcestriscDrying processes: freeze-drying, sun-drying and air-dryingdSolvents: boiling water, 50% aqueous ethanol, 50% aqueous methanol and chloroform–methanol mixture (3:1)eGenotypes
Phytochem Rev (2018) 17:951–972 967
123
including salvianolic acid B, lithospermic acid, ros-
marinic acid and danshensu along with 28 primary
metabolites including 5 sugars, 8 carboxylic acids, 10
amino acids and choline, while N-acetylglutamate,
aspartate and fumarate were detected for the first time
in this plant (Table 3). Moreover, their finding showed
differences for samples from different locations and
between three ecotypes in both NMR and LC–MS
spectra. These results indicated that a combined
approach of NMR and LC–MS provides different
but complementary information. In particular, NMR
methods were effective to quantitatively detect both
primary and secondary metabolites, whereas LC–
DAD–MS methods were excellent for the detection of
minor secondary metabolites. They demonstrated that
these combined methods provide an excellent
approach for targeted analysis of plant secondary
metabolite compositions associated with growing
environments and ecotypic cultivars. In another paper,
Dai et al. (2010b) demonstrated by using the same
combined methods how the metabolite profile of
S.miltiorrhiza roots changes with water depletion,
different drying processes, and different extraction
solvents. The fresh roots were subjected to freeze-
drying after snap-frozen in liquid nitrogen, sun-drying
and air-drying, while to investigate the effects of
extraction solvents on the salvia roots metabolites, the
same dried raw materials were extracted ultrasonically
with boiling water (solvent A), 50% aqueous ethanol
(solvent B), 50% aqueous methanol (solvent C) and
chloroform–methanol mixture (3:1, v/v) (solvent D),
respectively. The PCA scores plot of NMR data
showed that, compared with extracts from solvent A,B
and C, chloroform–methanol extracts contained high
amounts of the diterpenoids tanshinone I, 15,16-
dihydrotanshinone I, 1,2-dihydrotanshinone I and
cryptotanshinone but less amounts of sugars, amino
acids and salvianolic acid B. Furthermore, the raffi-
nose levels increased during the sun-drying process
but decreased during the air-drying process. The sun-
dried samples contained significant lower levels of
polyphenolic acids (e.g., rosmarinic acid and sal-
vianolic acid B) and tanshinones than the air-dried
ones. These findings strongly suggest the importance
of metabolisms in plant adaptation to osmotic stress.
Zhao et al. (2016) also studied the metabolite compo-
sition of different genotypes of S. miltiorrhiza roots,
growing in different geographical area of China
(Zhuyang, Changqing and Taian). They demonstrated
that LC/MS-based metabolomics is a holistic and
effective method to monitor variations of the bioactive
compounds, showing how the contents of phenolic
acids and tanshinones were affected by locations as
well as genotypes. Specifically, genotypes grown in
Zhuyang as compared to those grown in Changqing
and Taian had higher phenolic acids and tanshinones
content (Table 3). Another work on S. miltiorrhiza
roots was conducted by Cui et al. (2015) who reported
the characterization of the enzymatic families in
tanshinone production in roots versus aerial tissues.
Investigation of gene structure, positive selection,
molecular docking, and mutational analysis were
performed to clarify the functional diversity of diter-
pene synthases, which play a very important role in
diterpenoid biosynthesis. Moreover, they provide a
metabolomics approach with two independent analyt-
ical methods for the detection of all metabolites of two
extracts: UHPLC–qTOF–MS and GC–QqQ–MS anal-
ysis for methanol and hexane extracts, respectively
(Cui et al. 2015). GC–QqQ–MS analysis was used for
the identification of metabolites not detectable with
the UHPLC–qTOF–MS method, because of their
hydrophobicity (Table 3). The UHPLC–ESI–qTOF–
MS methods revealing 39 metabolites, while GC–EI–
QqQ–MS 19. After identification and quantification,
statistical analyses were performed with PLS-DA.
Salvia officinalis
S. officinalis is traditionally used as culinary herb, in
beverages, as herbal product in the form of herbal teas,
or extracts, in cosmetics and perfumery. Its composi-
tion and biological activities have been the subject of
previous reports (Baricevic and Bartol 2000; El-Feky
and Aboulthana 2016). In particular, this plant is rich
in essential oils, with main constituents a- and b-
thujone, camphor, 1,8-cineole and borneol. (Baydar
et al. 2013; Seidler-Lozykowska et al. 2015). S.
officinalis is also rich in polyphenolic compounds,
including rosmarinic acid, carnosic acid, carnosol,
chlorogenic and salvianolic acids (Tounekti and
Munne-Bosch 2012; El-Feky and Aboulthana 2016).
Sarrou et al. (2017) established a reliable tools to
characterize the genomic and metabolic diversity in S.
officinalis leaves grown in Greece. Based on the
difference at the genomic level and in metabolic
fingerprints, they used as selecting criteria the high
polyphenol content and the essential oil composition
968 Phytochem Rev (2018) 17:951–972
123
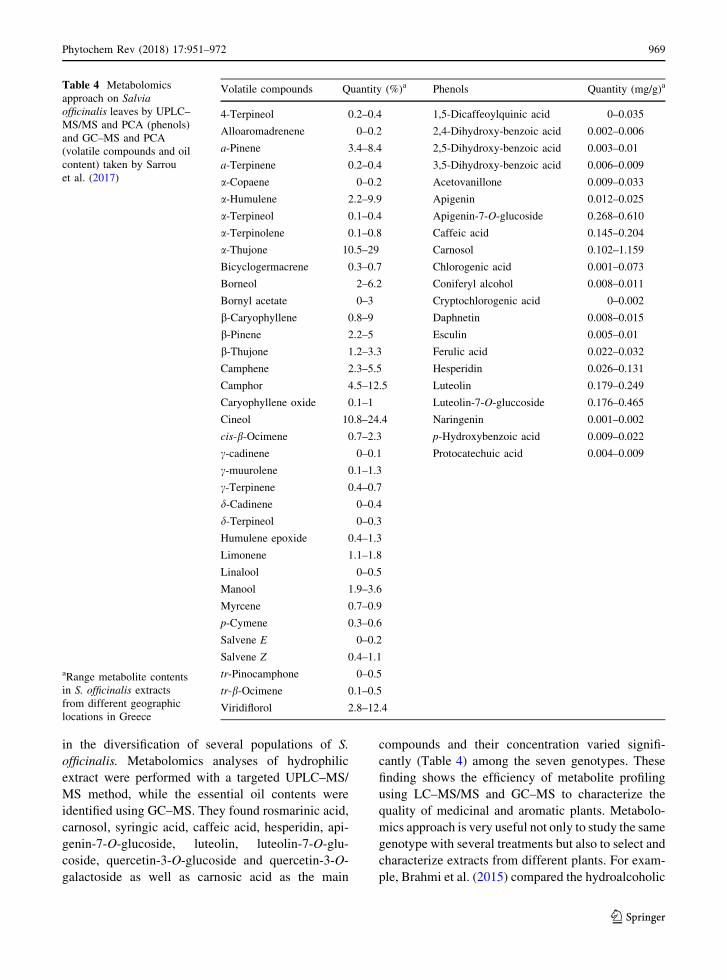
in the diversification of several populations of S.
officinalis. Metabolomics analyses of hydrophilic
extract were performed with a targeted UPLC–MS/
MS method, while the essential oil contents were
identified using GC–MS. They found rosmarinic acid,
carnosol, syringic acid, caffeic acid, hesperidin, api-
genin-7-O-glucoside, luteolin, luteolin-7-O-glu-
coside, quercetin-3-O-glucoside and quercetin-3-O-
galactoside as well as carnosic acid as the main
compounds and their concentration varied signifi-
cantly (Table 4) among the seven genotypes. These
finding shows the efficiency of metabolite profiling
using LC–MS/MS and GC–MS to characterize the
quality of medicinal and aromatic plants. Metabolo-
mics approach is very useful not only to study the same
genotype with several treatments but also to select and
characterize extracts from different plants. For exam-
ple, Brahmi et al. (2015) compared the hydroalcoholic
Table 4 Metabolomics
approach on Salvia
officinalis leaves by UPLC–
MS/MS and PCA (phenols)
and GC–MS and PCA
(volatile compounds and oil
content) taken by Sarrou
et al. (2017)
aRange metabolite contents
in S. officinalis extracts
from different geographic
locations in Greece
Volatile compounds Quantity (%)a Phenols Quantity (mg/g)a
4-Terpineol 0.2–0.4 1,5-Dicaffeoylquinic acid 0–0.035
Alloaromadrenene 0–0.2 2,4-Dihydroxy-benzoic acid 0.002–0.006
a-Pinene 3.4–8.4 2,5-Dihydroxy-benzoic acid 0.003–0.01
a-Terpinene 0.2–0.4 3,5-Dihydroxy-benzoic acid 0.006–0.009
a-Copaene 0–0.2 Acetovanillone 0.009–0.033
a-Humulene 2.2–9.9 Apigenin 0.012–0.025
a-Terpineol 0.1–0.4 Apigenin-7-O-glucoside 0.268–0.610
a-Terpinolene 0.1–0.8 Caffeic acid 0.145–0.204
a-Thujone 10.5–29 Carnosol 0.102–1.159
Bicyclogermacrene 0.3–0.7 Chlorogenic acid 0.001–0.073
Borneol 2–6.2 Coniferyl alcohol 0.008–0.011
Bornyl acetate 0–3 Cryptochlorogenic acid 0–0.002
b-Caryophyllene 0.8–9 Daphnetin 0.008–0.015
b-Pinene 2.2–5 Esculin 0.005–0.01
b-Thujone 1.2–3.3 Ferulic acid 0.022–0.032
Camphene 2.3–5.5 Hesperidin 0.026–0.131
Camphor 4.5–12.5 Luteolin 0.179–0.249
Caryophyllene oxide 0.1–1 Luteolin-7-O-gluccoside 0.176–0.465
Cineol 10.8–24.4 Naringenin 0.001–0.002
cis-b-Ocimene 0.7–2.3 p-Hydroxybenzoic acid 0.009–0.022
c-cadinene 0–0.1 Protocatechuic acid 0.004–0.009
c-muurolene 0.1–1.3
c-Terpinene 0.4–0.7
d-Cadinene 0–0.4
d-Terpineol 0–0.3
Humulene epoxide 0.4–1.3
Limonene 1.1–1.8
Linalool 0–0.5
Manool 1.9–3.6
Myrcene 0.7–0.9
p-Cymene 0.3–0.6
Salvene E 0–0.2
Salvene Z 0.4–1.1
tr-Pinocamphone 0–0.5
tr-b-Ocimene 0.1–0.5
Viridiflorol 2.8–12.4
Phytochem Rev (2018) 17:951–972 969
123

extracts of eleven Algerian medicinal plants (Aloysia
triphylla, Apium graveolens, Coriandrum sativum,
Laurus nobilis, Lavandula officinalis, Marrubium
vulgare, Mentha spicata, Inula viscosa, Petroselinum
crispum, Salvia officinalis, and Thymus vulgaris)
through 1H NMR spectroscopy. Whereas, Mattoli
et al. (2006) determined the metabolic profile of eight
different plants (Cimicifuga racemosa, Filipendula
vulgaris, Helichrysum italicum, Spiraea ulmaria,
Filipendula ulmaria, Salvia officinalis, Helianthus
annuus, Achillea millefolium) obtained through ESI–
MS and NMR spectroscopy. They found that the
positive ion ESI spectra of the extracts were highly
complicated in all cases, in contrast, the negative ion
ESI mass spectra were much better defined. In the
PCA plot different samples of the same species appear
well clustered and separated from the other species,
while the aromatic region of NMR spectra were less
useful for the detection of clusters among the different
species. For this reason, they selected the ESI–MS
method, particularly with negative ion mode, as
reliable metabolomics fingerprint for a group of plants.
Other species
The untargeted metabolomics approach provided
reliable and objective techniques in the chemotaxo-
nomic evaluation of several Salvia species. For
example, Sandasi et al. (2012) compared two species
of Salvia (S. runcinata and S. stenophylla) by using
mid-infrared spectroscopy (MIRS) and GC–MS meth-
ods. Results showed that MIRS produced better
clustering patterns compared to GC–MS. Moreover,
S. runcinata showed greater intra-species chemical
variation compared to S. stenophylla using both
methods.
Data analysis
The untargeted metabolomics data, obtained by the
identification and quantification of as many metabo-
lites as possible, is subsequently statistically pro-
cessed. Statistical approaches require replicates of
samples preparation. Usually, multivariate data anal-
ysis (MVDA) techniques are used to maximize
classification of samples. Principal components anal-
ysis (PCA), partial least square (PLS), hierarchical
cluster analysis (HCA) and self-organizing mapping
(SOM) have been extensively employed as statistical
tools for metabolomics. PCA is a useful approach to
reduce the dimensionality of a large data set and is the
most used chemometric tool as clustering technique.
PCA describes the variance between original variables
(in this case metabolites concentrations) through a
linear combination of new variables, which are
principal components (PC), identifying how samples
are different from each other and which variables
(metabolites concentrations) contribute most to this
difference. On the contrary, PLS regression is more
used to create a prediction model in metabolomics
studies (Tarachiwin et al. 2008). In general, PLS is
used to show the information contained in two data
sets (X = predictor matrix, Y = response matrix),
while PLS discriminant analysis (PLS-DA) is a classic
PLS regression where the response variables are
qualitative (Y = categories of the samples). Sparse
partial-least-squares discriminant analysis (sPLS-DA)
allows variable selection in a one-step procedure,
improving interpretability via valuable graphical out-
puts (Jiang et al. 2014). HCA is also used frequently in
metabolomics and measures the distance between
rows or columns of a data matrix. This approach can
be employed with an agglomerative or a divisive
method and data are presented in a diagram known as
dendrogram. SOM is a noncluster method widely used
for genomics and transcriptomics (Abe et al. 2003;
Hirai et al. 2004), but more recently it was also applied
to monitor metabolic dynamics in rice leaves (Sato
et al. 2008).
Conclusion
This review presents the metabolomics approaches
applied to different species of Salvia. Within several
techniques, NMR spectroscopy and mass spectrome-
try analysis were the most employed by researchers.
For this reason, the major advantages and limitations
of these analytical tools were discussed in details. In
conclusion, mass spectrometry, particularly GC–MS,
has a detection threshold of 10-12 mol, which is more
sensitive than 1H NMR spectroscopy where a value of
10-6 mol is observed. In both analytical methods,
extraction step is required, but all classes of com-
pounds must be derivatized in GC–MS analysis, which
takes additional time, processing, and variance in
970 Phytochem Rev (2018) 17:951–972
123
comparison to the NMR tool. Although NMR spec-
troscopy is a non-destructive technique, it is not the
most suitable for the identification of lipids and
volatile compounds, for which MS provides better
results. Therefore, a single analytical method will not
provide the best result for metabolomics analyses and
a combined approach, such as parallel MS and NMR
analyses on the same sample, would be an ideal way to
increase the detection of different classes of
metabolites.
References
Abe T, Kanaya S, Kinouchi M, Ichiba Y, Kozuki T, Ikemura T
(2003) Informatics for unveiling hidden genome signa-
tures. Genome Res 13:693–702
Aharoni A, Ric de Vos CH, Verhoeven HA, Maliepaard CA,
Kruppa G, Bino R, Goodenowe D (2002) Non-targeted
metabolomics profiling using Fourier transform ion
cyclotron mass spectrometry (FTMS). OMICS 6:217–234
Amato M, Caruso MC, Guzzo F, Galgano F, Commisso M,
Bochicchio R, Labella R, Favati F (2015) Nutritional
quality of seeds and leaf metabolites of Chia (Salvia his-
panica L.) from Southern Italy. Eur Food Res Technol
241:615–625
Ayerza R, Coates W (2005) Chia: rediscovering a forgotten crop
of the Aztecs. The University of Arizona Press, Tucson
Baricevic D, Bartol T (2000) The biological/pharmacological
activity of the Salvia genus. In: Kintzios SE (ed) Sage, the
genus Salvia. OPA, Harwood Academic Publishers,
Amsterdam, pp 141–178
Baydar H, Sangun Kemal M, Erbas S, Kara N (2013) Com-
parison of aroma compounds in distilled and extracted
products of sage (Salvia officinalis L.). J Essent Oil Bear
Plants 16:39–44
Bochicchio R, Philips TD, Lovelli S, Labella R, Galgano F, Di
Marsico A, Perniola M, Amato M (2015) Innovative crop
productions for healthy food: the case of chia (Salvia his-
panica L.). In: Vastola A (ed) The sustainability of agro-
food and natural resource systems in the mediterranean
basin 2015. Springer, Berlin, pp 15–27
Brahmi N, Scognamiglio M, Pacifico S, Mekhoukhe A, Madani
K, Fiorentino A, Monaco P (2015) 1H NMR based meta-
bolic profiling of eleven Algerian aromatic plants and
evaluation of their antioxidant and cytotoxic properties.
Food Res Int 76:334–341
Capitani MI, Matus-Basto A, Ruiz-Ruiz JC, Santiago-Garcıa JL,
Betancur-Ancona DA, Nolasco SM, Tomas MC, Segura-
Campos MR (2016) Characterization of biodegradable
films based on Salvia hispanica L. protein and mucilage.
Food Bioprocess Technol 9:1276–1286
Catola S, Marino G, Emiliani G, Huseynova T, Musayev M,
Akparov Z, Maserti BE (2016) Physiological and meta-
bolomics analysis of Punica granatum (L.) under drought
stress. Planta 243:441–449
Chen C, Tang HR, Sutcliffe LH, Belton PS (2000) Green tea
polyphenols react with 1,1-diphenyl-2-picrylhydrazyl free
radicals in the bilayer of liposomes: direct evidence from
electron spin resonance studies. J Agric Food Chem
48:5710–5714
Cui G, Duan L, Jin B, Qian J, Xue Z, Shen G, Snyder JH, Song J,
Chen S, Huang L, Peters RJ, Qi X (2015) Functional
divergence of diterpene syntheses in the medicinal plant
Salvia miltiorrhiza Bunge. Plant Physiol 169:1607–1618
Dai H, Xiao C, Liu H, Hao F, Tang H (2010a) Combined NMR
and LC–DAD–MS analysis reveals comprehensive
metabonomic variations for three phenotypic cultivars of
Salvia Miltiorrhiza Bunge. J Proteome Res 9:1565–1578
Dai H, Xiao C, Liu H, Tang H (2010b) Combined NMR and LC-
MS analysis reveals the metabonomic changes in Salvia
miltiorrhiza Bunge induced by water depletion. J Proteome
Res 9:1460–1475
de Falco B, Incerti G, Pepe R, Amato M, Lanzotti V (2016)
Metabolomics fingerprinting of Romaneschi globe arti-
chokes by NMR spectroscopy and multivariate data anal-
ysis. Phytochem Anal 27:304–314
de Falco B, Amato M, Lanzotti V (2017a) Chia seeds products:
an overview. Phytochem Rev 16:745–760
de Falco B, Incerti G, Bochicchio R, Phillips TD, Amato M,
Lanzotti V (2017b) Metabolomics analysis of Salvia his-
panica seeds using NMR spectroscopy and multivariate
data analysis. Ind Crop Prod 99:86–96
de Falco B, Fiore A, Bochicchio R, Amato M, Lanzotti V
(2018a) Metabolomic Analysis by UAE-GC MS and
antioxidant activity of Salvia hispanica (L.) seeds grown
under different irrigation regimes. Ind Crop Prod
112:584–592
de Falco B, Fiore A, Rossi R, Amato M, Lanzotti V (2018b)
Metabolomics driven analysis by UAEGC–MS and
antioxidant activity of Chia (Salvia hispanica L.) com-
mercial and mutant seeds. Food Chem 254:137–143
Dettmer K, Aronov PA, Hammock BD (2007) Mass spectrom-
etry-based metabolomics. Mass Spectrom Rev 26:51–78
El-Feky AM, Aboulthana WM (2016) Phytochemical and bio-
chemical studies of sage (Salvia officinalis L.). UK J Pharm
Biosci 45:56–62
Gao J, Yang G, Pi R, Li R, Wang P, Zhang H, Le K, Chen S, Liu
P (2008) Tanshinone IIA protects neonatal rat cardiomy-
ocytes from adriamycin-induced apoptosis. Transl Res
151:79–87
Gong Y, Li YL, Lu Y, Li LL, Abdolmaleky H, Blackburn GL,
Zhou JR (2010) Bioactive tanshinones in Salvia miltior-
rhiza inhibit the growth of prostate cancer cells in vitro and
in mice. Int J Cancer 129:1042–1052
Gullberg J, Jonsson P, Nordstrom A, Sjostrom M, Moritz T
(2004) Design of experiments: an efficient strategy to
identify factors influencing extraction and derivatization of
Arabidopsis thaliana samples in metabolomics studies
with gas chromatography/mass spectrometry. Anal Bio-
chem 331:283–295
Hirai MY, Yano M, Goodenowe DB, Kanaya S, Kimura T,
Awazuhara M, Arita M, Fujiwara T, Saito K (2004) Inte-
gration of transcriptomics and metabolomics for under-
standing of global responses to nutritional stresses in
Arabidopsis thaliana. Proc Natl Acad Sci
101:10205–10210
Phytochem Rev (2018) 17:951–972 971
123

Isogawa M, Yoshida S, Shimozawa N (2014) Evaluation of
fourier transform infrared spectroscopy for diagnosis of
peroxisomal diseases with abnormal very-long-chain fatty
acid metabolism. Am J Anal Chem 5:359–366
Jamboonsri W, Phillips TD, Geneve RL, Cahill JP, Hildebrand
DF (2012) Extending the range of an ancient crop, Salvia
hispanica L.—a new x3 source. Gen Resour Crop Evolut
59:171–178
Jiang M, Wang C, Zhang Y, Feng Y, Wang Y, Zhu Y (2014)
Sparse partial-least-squares discriminant analysis for dif-
ferent geographical origins of Salvia miltiorrhiza by 1H-
NMR-based metabolomics. Phytochem Anal 25:50–58
Kendrick N (2014) A gene’s mRNA level does not usually
predict its protein level. Kendrick Laboratories, Madison
Kristensen C, Morant M, Olsen CE, Ekstrøm CT, Galbraith DW,
Møller BL, Bak S (2005) Metabolic engineering of dhurrin
in transgenic Arabidopsis plants with marginal inadvertent
effects on the metabolome and transcriptome. Proc Natl
Acad Sci 102:1779–1784
Lemes LC, Junior C, Cesar P, Strixino JF, Aguiar J, Raniero L
(2016) Analysis of serum cortisol levels by Fourier
Transform Infrared Spectroscopy for diagnosis of stress in
athletes. Res Biomed Eng 32:293–300
Mattoli L, Cangi F, Maidecchi A, Ghiara C, Ragazzi E, Tubaro
M, Stella L, Fisato Traldi P (2006) Metabolomics finger-
printing of plant extracts. J Mass Spectrom 41:1534–1545
Orata F (2012) Derivatization reactions and reagents for gas
chromatography analysis advanced gas chromatography.
In: Mohd MA (ed) Advanced gas chromatography: pro-
gress in agricultural, biomedical and industrial applica-
tions. In Tech, Rijeka. ISBN 978-953-51-0298-4
Ruiz-Matute AI, Hernandez-Hernandez O, Rodrıguez-Sanchez
S, Sanz ML, Martınez-Castro I (2011) Derivatization of
carbohydrates for GC and GC–MS analyses. J Chromatogr
B 879:1226–1240
Sandasi M, Kamatou GP, Viljoen AM (2012) An untargeted
metabolomics approach in the chemotaxonomic assess-
ment of two Salvia species as a potential source of a-bis-
abolol. Phytochemistry 84:94–101
Sarrou E, Ganopoulos I, Xanthopoulou A, Masuero D, Martens
S, Madesis P, Chatzopoulou P (2017) Genetic diversity and
metabolic profile of Salvia officinalis populations: impli-
cations for advanced breeding strategies. Planta
246(2):201–215
Sato S, Arita M, Soga T, Nishioka T, Tomita M (2008) Time-
resolved metabolomics reveals metabolic modulation in
rice foliage. BMC Syst Biol 2:51
Seidler-Lozykowska K, Mordalski R, Krol D, Bocianowski J,
Karpinska E (2015) Yield and quality of sage herb (Salvia
officinalis L.) from organic cultivation. Biol Agric Hortic
31:53–60
Shepherd T, Dobson G, Verrall SR, Conner S, Griffiths DW,
McNicol JW, Davies HV, Stewart D (2007) Potato
metabolomics by GC–MS: what are the limiting factors?
Metabolomics 3:475–488
Sieveking DP, Woo KS, Fung KP, Lundman P, Nakhla S,
Celermajer DS (2005) Chinese herbs danshen and gegen
modulate key early atherogenic events in vitro. Int J Car-
diol 105:40–45
Smith CA, O’Maille G, Want EJ, Qin C, Trauger SA, Brandon
TR, Custodio DE, Abagyan R, Siuzdak G (2005) METLIN:
a metabolite mass spectral database. Ther Drug Monit
27:747–751
Son HS, Kim KM, Van Den Berg F, Hwang GS, Park WM, Lee
CH, Hong YS (2008) 1H nuclear magnetic resonance-based
metabolomics characterization of wines by grape varieties
and production areas. J Agric Food Chem 56:8007–8016
Sugiyama A, Zhu BM, Takahara A, Satoh Y, Hashimoto K
(2002) Cardiac effects of Salvia miltiorrhiza/Dalbergia
odorifera mixture, an intravenously applicable Chinese
medicine widely used for patients with ischemic heart
disease in China. Circ J 66:182–184
Sun DD, Wang HC, Wang XB, Luo Y, Jin ZX, Li ZC, Li GR,
Dong MQ (2008) Tanshinone IIA: a new activator of
human cardiac KCNQ1/KCNE1 (IKs) potassium channels.
Eur J Pharmacol 590:317–321
Tarachiwin L, Masako O, Fukusaki E (2008) Quality evaluation
and prediction of Citrullus lanatus by 1H NMR-based
metabolomics and multivariate analysis. J Agric Food
Chem 56:5827–5835
Tounekti T, Munne-Bosch S (2012) Enhanced phenolic diter-
penes antioxidant levels through non-transgenic approa-
ches. Crit Rev Plant Sci 31:505–519
Vogel C, Marcotte EM (2012) Insights into the regulation of
protein abundance from proteomic and transcriptomic
analyses. Nat Rev Gen 13:227–232
Vrhovsek U, Masuero D, Gasperotti M, Franceschi P, Caputi L,
Viola R, Mattivi F (2012) A versatile targeted metabo-
lomics method for the rapid quantification of multiple
classes of phenolics in fruits and beverages. J Agric Food
Chem 60:8831–8840
Wasser S, Ho JMS, Ang HK, Tan CEL (1998) Salvia miltior-
rhiza reduces experimentally-induced hepatic fibrosis in
rats. J Hepatol 29:760–771
Zhang KQ, Bao YD, Wu P, Rosen RT, Ho CT (1990) Antiox-
idative components of Tanshen (Salvia Miltiorrhiza
Bunge). J Agric Food Chem 38:1194–1197
Zhao JL, Mou Y, Li PQ, Wu JY, Zhou LG (2011) Diterpenoid
tanshinones and phenolic acids from cultured gairy roots of
Salvia miltiorrhiza Bunge and their antimicrobial activi-
ties. Molecules 16:2259–2267
Zhao Q, Song Z, Fang X, Pan Y, Guo L, Liu T, Wang J (2016)
Effect of genotype and environment on Salvia miltiorrhiza
roots using LC/MS-based metabolomics. Molecules
21:414
972 Phytochem Rev (2018) 17:951–972
123
Related Documents