NMR-based urine analysis in rats: Prediction of proximal tubule kidney toxicity and phospholipidosis Short title: Prediction of proximal tubule kidney toxicity and phospholipidosis Kai Lienemann 1 , Thomas Plötz 1 , Sabine Pestel 2,* 1 Intelligent Systems Group, Dortmund University of Technology, Otto-Hahn-Strasse 8, D- 44221 Dortmund, Germany 2 Group General Pharmacology, Department Drug Discovery Support, Boehringer-Ingelheim Pharma GmbH & Co. KG, D-88397 Biberach an der Riss, Germany * Corresponding author: Dr. Sabine Pestel Boehringer-Ingelheim Pharma GmbH & Co. KG Drug Discovery Support, General Pharmacology Birkendorffer Str. 65 D-88397 Biberach an der Riss Germany Phone: **49-7351-544397 Fax: **49-7351-545177 E-mail: [email protected]

Welcome message from author
This document is posted to help you gain knowledge. Please leave a comment to let me know what you think about it! Share it to your friends and learn new things together.
Transcript
NMR-based urine analysis in rats: Prediction of proximal tubule kidney
toxicity and phospholipidosis
Short title: Prediction of proximal tubule kidney toxicity and phospholipidosis
Kai Lienemann1, Thomas Plötz1, Sabine Pestel2,*
1 Intelligent Systems Group, Dortmund University of Technology, Otto-Hahn-Strasse 8, D-
44221 Dortmund, Germany
2 Group General Pharmacology, Department Drug Discovery Support, Boehringer-Ingelheim
Pharma GmbH & Co. KG, D-88397 Biberach an der Riss, Germany
* Corresponding author:
Dr. Sabine Pestel
Boehringer-Ingelheim Pharma GmbH & Co. KG
Drug Discovery Support, General Pharmacology
Birkendorffer Str. 65
D-88397 Biberach an der Riss
Germany
Phone: **49-7351-544397
Fax: **49-7351-545177
E-mail: [email protected]
2
Abstract
Introduction: The aim of safety pharmacology is early detection of compound-induced side
effects. NMR-based urine analysis followed by multivariate data analysis (metabonomics)
identifies efficiently differences between toxic and non-toxic compounds; but in most cases
multiple administrations of the test compound are necessary. We tested the feasibility of
detecting proximal tubule kidney toxicity and phospholipidosis with metabonomics
techniques after single compound administration as an early safety pharmacology approach.
Methods: Rats were treated orally, intravenously, inhalatively or intraperitoneally with
different test compounds. Urine was collected at 0-8 h and 8-24 h after compound
administration, and 1H NMR-patterns were recorded from the samples. Variation of post-
processing and feature extraction methods led to different views on the data. Support Vector
Machines were trained on these different data sets and then aggregated as experts in an
Ensemble. Finally, validity was monitored with a cross-validation study using a training,
validation, and test data set. Results: Proximal tubule kidney toxicity could be predicted with
reasonable total classification accuracy (85 %), specificity (88 %) and sensitivity (78 %). In
comparison to alternative histological studies, results were obtained quicker, compound need
was reduced, and very importantly fewer animals were needed. In contrast, the induction of
phospholipidosis by the test compounds could not be predicted using NMR-based urine
analysis or the previously published biomarker PAG. Discussion: NMR-based urine analysis
was shown to effectively predict proximal tubule kidney toxicity after single compound
administration in rats. Thus, this experimental design allows early detection of toxicity risks
with relatively low amounts of compound in a reasonably short period of time.
Key terms: biomarker; ensemble; kidney; metabolomics; metabonomics; methods; rat; side-
effect; support vector machine; toxicity
3
1. Introduction
The two main reasons for drug candidates to fail in clinics are lack of efficacy and
unacceptable side-effects / toxicities. The actual trend in the pharmaceutical industry is to
identify risks as early as possible – therefore different methods are under investigation. In
addition, the number of animals needed should be reduced. The general aim of safety
pharmacology is to identify possible side-effects from drug candidates after single compound
administration (ICH 7A safety pharmacology guidelines; FDA, 2001).
Metabonomic studies can be used to identify compounds with an unacceptable toxicity
(Holmes et al., 2000; Lindon et al., 2004) or to rank compounds as early as possible according
to their risk to induce toxicities (Robertson et al., 2000). Most studies use serum or urine
samples after multiple treatments of rats, but studies with single compound administration
have also been described to be successful (Holmes et al., 1998b). To our knowledge, no
models with single compound administration and adequate sensitivity are available for routine
testing of acute toxicities. Liver and kidney toxicity can be predicted after single compound
administration using clinical chemistry (Pestel et al., 2006), but unfortunately sensitivity is
relatively low (own unpublished results, see also Discussion 4.5). It was thus the aim to
establish a NMR-based metabonomics method using urine from rats after single compound
administration, and to validate it for selected toxicities.
As the first model, proximal tubule kidney toxicity was chosen, since damage of the proximal
tubule is the most often observed effect in the kidney after administration of pharmacological
compounds, which is thought to be caused by the high compound concentration in the loop of
Henle (Miller 2002). As the second model, phospholipidosis was chosen since it develops
slower and histological signs are often detected very late in the compound development
process. In both cases, earlier identification of a possible risk is desirable. For earlier detection
of phospholipidosis cellular in vitro models (Niai et al., 2007) may be used, while in vivo
methods, which integrate inter-organ communication, actually focus on the measurement of
biomarkers, such as phenylacetylglycine (PAG), citrate, 2-oxoglutarate (Nicholls et al., 2000)
4
or different lipids, such as bismonoacylglycerol phosphate (BMP) (Baronas et al., 2007,
Mortuza et al., 2003), which are critically discussed in the expert field, mostly due to the
small databases typically used for their identification in literature. To our knowledge only
PAG is easy to quantify from NMR spectra and is published to be predictive after single
compound administration (Nicholls et al., 2000). Thus we tested this marker using our data
set.
Our general goal is to highly automate the analysis of urine derived NMR spectra. We
therefore developed a procedure that utilizes statistical pattern recognition methods.
Interpreting the NMR spectra as high-dimensional real-valued data, numerical classification
with respect to the two selected toxicities was applied. We utilized Support Vector Machines
(SVMs) (Schölkopf & Smola 2002) in order to classify the spectra as non-toxic or toxic with
regard to certain toxicity. Aiming at a robust classification procedure we additionally
investigated the effectiveness of classifier Ensembles. Therefore, the results from different
experts (i.e. classifiers from varying views on the original data) were combined to get an
overall decision regarding a putative toxicity. In order to obtain these different views, we
varied 1) the post-processing of NMR spectra by using different normalization strategies, and
2) the feature extraction process by using variants of Partial Least Squares (PLS)
transformation (Wold 1966). The final Ensemble prediction was performed by majority
voting of an automatically optimized selection of all available experts. Additionally, a final
classification of compounds at a certain dose is realized by using the averaged results from all
sample-wise predictions. This results in a final Ensemble model with increased classification
performance in comparison with traditional single SVMs.
2. Methods
2.1. Animals
Hannover Wistar rats CRL:WI(GIx/BRL/HAN)IGS BR were obtained from Charles River
(Sulzfeld, Germany). They were kept on a 12 h day/night rhythm (light from 6 a.m. to 6 p.m.)
5
for 4 to 10 days prior to the experiments. Rat food (autoclaved standard rat chow from
Provimi Kliba, Kaiseraugst, Switzerland) and water was offered ad libitum. Treatment of the
animals followed the German Law on the Protection of Animals and was performed with
permission of the state animal welfare committee.
2.2. Experimental design
Rats of either sex (n=8 per dose group), weighing 180-210 g (males 8 weeks old, females 9
weeks old) were used. The groups were treated with different compounds or vehicles either
orally (10 mL/kg), intravenously (2 mL/kg), intraperitoneally (10 mL/kg) or inhalatively
(administered within one minute). For intravenous or intraperitoneal administrations,
osmolality was adjusted to 300 mosmol by adding glucose and NaCl in equal osmotically
active amounts.
The animals were housed in metabolic cages with free access to water. Urine was collected at
8 h and 24 h after administration of compound or vehicle. Urine volume was determined, and
for measurement of parameters in clinical chemistry urine was taken directly without any
additives. For measurement of spectra with 1H NMR spectroscopy urine was buffered with a
phosphate buffer (320 mM Na2HPO4, 80 mM NaH2PO4, 4 mM NaN3, 100 µM DSS, 9 %
D2O; adjustment to the final pH of 7.4 with HCl) and frozen at -20°C until 1H NMR
spectroscopy.
2.3. Clinical chemistry
Measurements of creatinine and urea were performed using a Konelab 60i from Thermo
Electron Corporation OY (Vantaa, Finland). The test kits were supplied by Thermo Electron
Corporation OY, and the analyses and methodologies were used following the Konelab
Chemistry Information Manual 12A/2003 from March 2003.
6
Creatinine concentrations were measured by a modified enzymatic rate Jaffé method (Jaffe
1886): Creatinine formed a red colored complex in alkaline picrate solution, and the rate of
complex formation is measured spectrophotometrically at 510 nm.
Urea concentrations were measured by an enzymatic rate method: Urea was hydrolyzed by
urease to ammonia and hydrogen carbonate. Glutamate dehydrogenase catalyzed the
condensation of ammonia and 2-oxoglutarate to glutamate with the concomitant equimolar
oxidation of NADH to NAD. The removal of NADH was measured spectrophotometrically at
340 nm.
2.4. 1H NMR spectroscopy
The NMR measurements were performed at LipoFIT Analytic GmbH (Regensburg,
Germany) (on a fee-for-service base) on a 600 MHz NMR spectrometer (Bruker Biospin
GmbH, Rheinstetten, Germany) equipped with a triple resonance cryoprobe. A 1D 1H-NOE
pulse sequence was applied using water presaturation, a relaxation delay of 1 s, a mixing time
of 10 ms and a total pulse sequence recycle time of ~6.5 s. For every experiment 32 scans
were recorded with 128k data points per FID and a spectral width of 20 ppm. The raw data
(FIDs) were processed applying an exponential weighting function (line-broadening factor of
0.3 Hz) and 256k complex data points (zero filling). The transformed spectra were referenced
to DSS and a standardized manual phase and baseline correction was applied (TOPSPIN 1.3
from Bruker).
2.5. Quantification of phenylacetylglycine (PAG)
The quantification of PAG was performed by LipoFIT Analytic GmbH (on a fee-for-service
base), and was accomplished by a specially designed algorithm for line-shape analysis. A set
of NMR-signals characteristic for PAG was fitted by this software and peak area was
determined by integration. The total concentration was then calculated by the use of data
obtained by defined calibration samples of known concentration measured beforehand.
7
Possible errors due to automatic processing, such as peak recognition, were avoided by
manual control of the peaks subjected to quantification. The limit of detection was 0.01
mg/mL, accuracy of the results in the range of 0.01 to 2.3 mg/mL was ~5 %.
2.6. Material
All reference compounds used in the animal assays were either synthesized at Boehringer-
Ingelheim Pharma GmbH & Co. KG or purchased from commercial sources with at least
analytical grade or as commercial drugs for human treatment. Sodium 2,2-Dimethyl-2-
Silapentane-5-Sulfonat (DSS) was obtained from Cambridge Isotope Laboratories, Inc.
(Andover, Massachusetts, USA) and deuterium oxide (D2O) from euriso-top (Saint-Aubin
Cedex, France). All further chemical reagents were again at least from analytical grade and
purchased from commercial sources.
2.7. Classification procedure
NMR spectra were treated as (high-dimensional) real-valued vectors, which need to undergo
certain post-processing and feature extraction steps for the following classification. Given
annotated sets of sample vectors, the parameters of toxicity models were derived
automatically using SVMs from machine learning theory. We trained SVMs with a linear
kernel on distinct views of the training data by applying different configurations of post-
processing and feature extraction methods, respectively. Post-processing variations included
different bucketing procedures (bucket widths of 0.04 ppm, 0.02 ppm and 0.01 ppm) and
scaling either with or without Standard Normal Variate (SNV) correction (Barnes et al.,
1989). Feature extraction for data reduction was done by PLS transformation, projecting the
spectra onto a lower dimensional space. The final dimensionality varied from five to fifty (in
steps of five), overall resulting in 66 different configurations of spectra processing.
For the final classification an optimized selection of the resulting SVMs was aggregated by
pursuing a majority vote strategy, i.e. the overall decision regarding toxicity of a particular
8
NMR spectrum was given by the majority of classification results provided by different
SVMs. The SVMs for the resulting so-called Ensemble (Kittler et al., 1998) were selected by
ranking the single SVMs according to their individual performance. The number of
considered experts was gradually increased until the optimal overall classification
performance was reached.
2.8. Evaluation of predictivity by cross-validation
The data set used for training and parameter optimization was initially grouped with respect to
the particular substances’ targets and indications to avoid artifacts from efficacy, chemistry or
different other toxicities (cf. Discussion 4.4.). Structurally preserving this grouping, the
sample set was manually split into five disjoint sub-sets, focusing on (almost) equal ratios of
non-toxic and toxic samples for the actual model among all data sets. By means of a five-fold
cross-validation we ensured that every sample was used three times in the training, once in the
validation and once in the test data set. The final classification rates were averaged over the
results of the different validation or test data sets, respectively. Due to its robustness to
imbalanced data sets the Matthews Correlation Coefficient (MCC) (Baldi et al., 2000) was
chosen as major optimization criterion during parameter optimization. Additionally,
specificity, sensitivity and classification accuracy were calculated, representing the percentage
of correct classified toxic, non-toxic or overall samples, respectively.
MCC =TP ×TN − FP × FN
(TP + FN)(TP + FP)(TN + FP)(TN + FN)
FPTNTNySpecificit+
=
FNTPTPySensitivit+
=
FNFPTNTPTNTPAccuracy
++++
=
(TP: number of true toxic predictions, TN: number of true non-toxic predictions, FP: number
of false toxic predictions, FN: number of false non-toxic predictions).
9
3. Results
3.1. Classification of proximal tubule kidney toxicity
A model for proximal tubule kidney toxicity was built from a data set using 30 known non-
proximal tubule toxic compounds (637 spectra) and 18 proximal tubule toxic compounds (259
spectra) (Table 1). For the annotation, the following histological observations were classified
as toxic with respect to proximal tubule kidney: Apoptosis, necrosis, degeneration, or similar
observations of proximal tubule kidney cells. Compounds inducing only deposition of
material (e.g. lipofuszinosis) without inducing any further histological changes were not
judged to be toxic. The source of information for proximal tubule kidney toxicity was mostly
from previous studies with treatment periods of two weeks including histological endpoints.
Dose selection for compounds tested in house was based on the highest free or the lowest
toxic dose. When data was taken from external studies a factor of 3 to 10 was added in order
to avoid differences from rat strain or interlaboratory variance. This resulted in more than 18
compounds covering more than 11 different targets, which thereby present a broad chemical
background. Compounds inducing other toxicities, e.g. liver toxicity, phospholipidosis, other
kidney toxicities, or causing functional changes, such as diuresis, were again equally
distributed between both groups thereby aiming at proximal tubule kidney toxicity being the
main difference between both groups (for further information on compound characteristics see
Table 2).
For proximal tubule toxicity, predictivity was comparable for the validation and the test data
set, indicating robust classification models using relevant features from the spectral data
(Table 1). After optimization of post-processing and feature extraction methods, classification
by a single SVM resulted for the test data set in an accuracy of 71 %, a specificity of 81 %
and a sensitivity of 47 %. An MCC of 0.283 was achieved. Aggregation of the best 6 single
SVM classifications derived from modified post-processing and feature extraction methods
10
slightly improved the classification accuracy to 73 %, the sensitivity to 53 %, but did not
change the specificity (81 %), overall leading to an increased MCC of 0.334 (cf. Table 1).
Performing classification of compounds at a certain dose (instead of a single sample)
improved single SVM classification to an accuracy of 75 %, clearly enhanced sensitivity to 72
%, slightly reduced specificity to 77 %, overall resulting in a slightly increased MCC of
0.472. Aggregation of the 13 best SVMs in an Ensemble (from varied post-processing and
feature extraction procedures) clearly enhanced classification with a final accuracy of 85 %, a
specificity of 88 % and a sensitivity of 78 %. This resulted in a significantly increased MCC
of 0.660 (for individual data of each compound see Table 1). Differences in the number of
experts used within the Ensembles for classification of single samples and compound-dose
combinations were caused by the individual optimization procedure. The experts’
performance varied between classification of single samples and compound-dose
combinations as we expected, and thus led to different selections of experts.
3.2. Classification of phospholipidosis
A model for phospholipidosis was built from a data set using 20 non-phospholipidogenic
compounds (403 spectra) and 17 phospholipidogenic compounds (330 spectra) (Table 3).
Information for the annotation of phospholipidosis was derived from studies with histological
endpoints after a treatment period of about 2-13 weeks, using foam cell accumulation in at
least one organ as the classification criterion. As for proximal tubule kidney toxicity, dose
selection for compounds tested in house was based on the highest free or the lowest toxic
dose, and again for external studies a factor of 3 to 10 was added. Again a broad chemical
background was guaranteed by using more than 17 compounds from more than 12 different
targets in each group, and compounds with other effects, such as liver toxicity, kidney
toxicities, or diuresis, were equally distributed over both groups (cf. Table 2).
In contrast to the model for proximal tubule kidney toxicity, the predictivity for the validation
and the test data set for the phospholipidosis model differed from each other dramatically
11
(Table 3): The validation data set gave comparably good results as seen with the proximal
tubule kidney toxicity model, and showed similar improvements with the implementation of
compound- and Ensemble-based evaluation. Nevertheless, the test data predictivity was
strongly reduced for specificity as well as sensitivity, leading to a drop in accuracy and MCC:
MCC values were around zero, indicating that prediction was just driven by chance. We thus
concluded, that the phospholipidosis model was overfitted, which could only be observed
when using the test data set.
3.3. Phenylacetylglycine (PAG) as a biomarker for phospholipidosis
Phenylacetylglycine (PAG) was quantified in the urine samples, with the individual
concentrations covering a wide range of at least two log units in rat urine, ranging from <0.01
to 2.31 mg/mL. In order to determine whether phospholipidogenic compounds induce higher
PAG values a histogram was plotted comparing non-phospholipidogenic (22 compounds
referring to 446-458 samples) with phospholipidogenic compounds (17 compounds referring
to 338-345 samples), with again each group containing compounds with and without different
other toxicities or functional changes (Fig. 1).
It was clearly shown that the distribution of PAG values was independent of the
phospholipidogenic potential of a compound. This was not only observed using the PAG
concentrations in urine, but also after normalizing the PAG concentration to urine volume,
urine creatinine or urea concentrations. Thus, PAG failed as a stand-alone biomarker to
predict phospholipidosis.
4. Discussion
4.1. Classification of NMR spectra by Support Vector Machines
For both reliable and efficient analysis of urine-derived NMR spectra we focused generally on
the application of pattern recognition techniques, allowing us to evaluate more parameters
than it would be feasible by applying human expert knowledge only. More specifically, we
12
were aiming at robust statistical models that can automatically predict putative toxicities of
unknown spectra (treated as real-valued feature vectors). The parameters of these models
were derived automatically by exploiting machine learning techniques based on an annotated
data set of training samples. Since in most in vivo data sets the amount of training data is
small, we decided for the application of SVMs to model the differences between certain
toxicity classes. Basically, SVMs require only a small number of parameters to be estimated,
which allows for robust training even on small data sets (cf. e.g. Burges 1998). SVMs linearly
separate samples originating from different pattern classes (e.g. non-toxic and toxic) by a
discriminating hyperplane, which is defined by using sample vectors from the training data
set. It is the simplicity of this classification approach together with its modesty with respect to
the amount of annotated sample data required for automatically deriving robust classifiers that
makes SVMs popular in general (e.g. Joachims 1998; Rangwala & Karypis 2005; Dror et al.,
2005) and successful especially for the application described in this study.
4.2. Ensemble classification based on varying post-processing and feature extraction
For the analysis of NMR spectra we investigated the effectiveness of SVMs estimated on
training data, which were treated utilizing different configurations of post-processing and
feature extraction methods. Different bucketing methods integrating short spectral regions
into single intensity values reduce the effects of shifting peaks induced by varying different
experimental conditions (e.g. pH, ion concentration, temperature). Generally, bucketing is
applied as a standard procedure for classification purposes (Holmes et al., 1998a; Holmes et
al., 1998b; Beckonert et al., 2003; Azmi et al., 2005), but the widely used bucket width of
0.04 ppm does not seem to be optimal and was thus optimized.
Scaling real-valued features normalizes their numerical ranges and can improve the
subsequent classification procedures since normalized data can be compared directly. We
therefore used SNV correction as an additional option within post-processing, which scaled
spectra to unity standard deviation. The application of PLS transformation reduced the
13
dimensionality of the original spectral data while conserving the contained discriminating
information, which allowed for effective SVM modeling.
Every variant of SVMs (trained on samples that underwent one possible combination of the
above mentioned post-processing and feature extraction methods) covers different aspects of
the underlying data thus being an expert with a more or less focused view on the data. Due to
the strong variability of biological data it is hardly possible to find a single expert, which
exclusively covers the most favorable view and thus gives generally good predictivity results.
Therefore, we aggregated single SVMs to an Ensemble, i.e. a majority vote of multiple
experts’ “opinions”. Since sensitivity in this kind of data sets is the weakest predicted
parameter when compared with accuracy and specificity, it may be that the sensitivity results
from the Ensemble classification could be improved when compared to the results of the best
single SVM. Indeed, for the proximal tubule toxicity model, sensitivity was improved by
about 20-25%. Furthermore, using the MCC as the primary optimization criterion, we
succeeded to improve overall prediction. Taken together, we showed that the aggregation of
multiple experts’ “opinions” into the classifier Ensemble in comparison with single SVMs
improved the overall classification performance (cf. Tables 1 and 3).
4.3. Classification of substances at a certain dose
The aim in safety pharmacology is to identify risks of compounds at the level of a certain
dose, but usually not at the level of a single animal or spectrum. By having two pieces of
information together (spectra corresponding to the compound-dose combinations and the
prediction for every single spectrum), a classification with respect to these compound-dose
combinations is possible. After the selection of samples corresponding to a certain compound-
dose combination, the final prediction was achieved by majority voting with respect to the
single spectras’ classification results. Thereby the biological variation of responses to an
applied compound was reduced and the classification performance increased by averaging
over the classification results of samples from usually eight different rats (i.e. 16 samples).
14
The reason for the biological variation was on the one hand due to inter-individual variance,
and on the other hand intentionally included to the data set by using different gender and urine
collection time-points.
4.4. Reasons for the structure of reference compound mixtures
Automatic classification of NMR spectra is achieved based on statistical models, which are
estimated on a labeled set of training samples. These models can thereafter be used to classify
new samples according to different model-specific patterns that were identified as class-
discriminating on the training data set. Compound-induced spectral changes, which are not
characteristic for the modeled toxicity, but e.g. caused by efficacy, other toxicities or
excretion of the compound and its metabolite(s), will be used for class-discrimination in sub-
optimally selected data sets. Generalization from such a data set for prediction of new
compounds will most probably give poor predictivity. Therefore our data set was optimized
using a large set of different compounds with varying chemical background, mechanisms of
actions and additional toxicities. Additionally, compounds with similar known chemical
structures or effects were distributed among the so-called non-toxic and toxic class, when
feasible. Thereby, we reduced the effect of single compounds and increased the impact of the
selected toxicity as the main differentiation criterion between the two classes.
This also led to the advantage that we did not need to “clean” the spectra from those peaks,
which are related to urinary excretion of the compounds and their metabolites, or to changes
related to efficacy and other toxicities. Thereby, we could strongly simplify the automated
approach of spectral handling.
4.5. Kidney as a target organ for toxicities of compounds
Compound-induced effects on the kidney can be grouped in functional changes, such as
diuresis or antidiuresis, and in organ damage, such as damage localized in the glomerulum,
15
renal papillae, proximal or distal tubule. Proximal tubule toxicity and renal papillae necrosis
are the most often observed compound-induced toxicities seen in the kidney (Miller 2002).
Aiming at early identification of critical hazards, we initially started to predict proximal
tubule kidney toxicity after single compound administration by using clinical chemistry,
which is described in literature especially after multiple compound administrations (Ogura et
al., 1996; Whiting & Brown 1996). A single compound administration approach was
validated for in house use, investigating rat urine in a standard experimental design using
clinical chemistry (Pestel et al., 2006). This “renal and liver function assay” routinely
performed in our laboratory measures a battery of clinical chemistry parameters in serum as
well as urine, including urinary enzyme excretion of ß-NAG, ALT, LDH, ALP and GGT as
markers for kidney damage (Pestel et al., 2006; Ogura et al., 1996; Whiting & Brown 1996).
Comparing the clinical chemistry approach with the metabonomics approach, the clinical
chemistry assay needs to use significantly more rats: 20 animals per group for clinical
chemistry (cf. Pestel et al., 2006) as compared to 8 animals for metabonomics. Additionally,
its throughput is about half of that of the metabonomics experimental design. With clinical
chemistry, proximal tubule kidney toxicity can be predicted after single compound
administration with an accuracy of 74 % compared to histology (own unpublished data).
However accuracy for toxic compounds is only 36 %, whereas non-toxic compounds are
predicted by 96 %.
We thus aimed at improving the sensitivity in a single compound administration approach by
enhancing the number of parameters using the metabonomics experimental design. It was
clearly shown that the metabonomics approach is superior to the clinical chemistry approach,
not only for accuracy (85 % vs. 74 %), but especially for the prediction of toxic compounds
(sensitivity 78 % vs. 36 %). Thus, metabonomics using NMR-spectra from rat urine is a more
predictive, higher throughput and less animal using approach than clinical chemistry.
4.6. Phospholipidosis: Currently available models and their limitations
16
Phospholipidosis was chosen as a second model to investigate the feasibility of predicting
toxicities after single compound administration. Since histology endpoints cannot be used
after short treatment periods, diverse biomarkers were previously investigated (Baronas et al.,
2007; Hasegawa et al., 2007; Delaney et al., 2004). To our knowledge, actually no in vivo
assay has demonstrated the prediction of phospholipidosis after single compound
administration on a routine base. On the one hand phospholipidosis is associated with one
common observation, the induction of intracellular phospholipid accumulation as lysosomal
concentric lamellar bodies often due to inhibition of a lysosomal phospholipase, and should
therefore induce a standardized biochemical pattern (Reasor & Kacew 2001). On the other
hand, phospholipidosis leads to diverse observations in the animals. Not only species specific
but also organ specific induction of phospholipidosis is well described, and additionally
heterogeneous functional consequences reaching from minimal adaptive reactions in a single
organ to fibrosis or necrosis in multiple organs are reported (Reasor & Kacew 2001).
Thus, as an initial screening assay, diverse cellular in vitro screens for predicting
phospholipidosis are described, which usually allow ranking of compounds within a certain
target class (Niai et al., 2007). Nevertheless, interpretation of these assays can mostly only be
done, when additional information from studies with histological endpoints is available for at
least one compound from a certain target class.
We thus investigated, whether it is possible to predict phospholipidosis in vivo (independent
from any experience with the compound class, target or indication) after only single
compound administration in order to speed the compound selection process on the level of the
research process. With the present approach, we were not able to set up a predictive in vivo
model with single compound administration for phospholipidosis (Table 3). Since the
methodological approach using multivariate analysis of urine NMR spectra in general worked
well for the proximal tubule toxicity model, the reason of failure to predict phospholipidosis
may lay on the biological side. We can only speculate whether the lack of predictivity is due
17
to the complexity of the disease (implicating different organs) or due to the often delayed
onset of the disease.
These results demonstrate the relevance of an adequate evaluation strategy for classification
models. Very often, cross-validations using only training and validation but no test data sets
are used (Beckonert et al., 2003; Ebbels et al., 2003; Westerhuis et al., 2008), typically due to
the lack of access to a larger data set needed for including a test data set. We show that
although the phospholipidosis as well as the proximal tubule kidney toxicity models achieved
comparable predictivities on the validation data set, only the model for proximal tubule
kidney toxicity achieved acceptable predictivities on the test data set. The observed overfitting
of the phospholipidosis model was only detected by using a test data set. Thus, in agreement
with the observations from Westerhuis et al. (Westerhuis et al., 2008), we clearly recommend
to incorporate a test data set in the cross-validation strategy in order to be able to detect
overfitting.
4.7. Biomarkers
High expectations are associated with “metabonomics” to deliver biomarkers for further
profiling in clinics. A broad field of biomarkers (especially from NMR- and MS-based
metabonomics approaches) is published to be associated with various defined toxicities. In
general, biomarkers can be identified and quantified in NMR-spectra if a sufficiently high
concentration is present in the samples. PAG is published as a marker for phospholipidosis
even after single compound administration (Hasegawa et al., 2007; Delaney et al., 2004;
Nicholls et al., 2000), but the predictivity as a marker is critically discussed within the expert
field.
We investigated in a second approach whether prediction of phospholipidosis is feasible using
a stand-alone marker, PAG. The data used for this study was comparable to that used for the
multivariate approach: Two non-phospholipidogenic compounds were added, and few spectra
18
were excluded, of which data from clinical chemistry was not available (but necessary for
normalization of PAG values). It was shown that PAG concentrations varied strongly within
the data set, but variation was clearly not associated with phospholipidosis, whether
investigated as the urinary concentration or as a normalized value regarding urine volume,
creatinine or urea concentration (Fig. 1). Thus, a stand-alone biomarker approach with PAG
was unsuccessful in predicting phospholipidosis after single compound administration, as
beforehand observed with the multivariate classification approach.
4.8. Summary
NMR-based urine analysis in rats was shown to be a predictive tool for investigating proximal
tubule kidney toxicity after single compound administration in rats. In contrast,
phospholipidosis could not be predicted after single compound administration neither using
NMR-based urine analysis nor using PAG. The effectiveness of SVM Ensembles based on
variation of post-processing and feature extraction methods for classification of single spectra
as well as of certain compound-dose combinations could be shown. Taken together, we
established a predictive tool for investigating compounds in early safety studies with a
relatively high throughput, low animal numbers need, and compound use and no need for
prior knowledge in the compound class.
Acknowledgement
We gratefully thank Astrid Jaehnige, Stephanie Hoell and Iris Erni for their excellent
technical assistance. We strongly acknowledge not only the high quality data but also the
scientific support from LipoFIT, Regensburg, Germany.
References
Azmi, J., Griffin, J. L., Shore, R. F., Holmes, & E., Nicholson, J. K. (2005). Chemometric
analysis of biofluids following toxicant induced hepatotoxicity: A metabonomic approach to
19
distinguish the effects of 1-naphthylisothiocyanate from its products. Xenobiotica, 35, 839-
852.
Baldi, P., Brunak, S., Chauvin, Y., Andersen, C. A. F., & Nielsen, H. (2000). Assessing the
accuracy of prediction algorithms for classification: an overview. Bioinformatics, 16, 412-
424.
Barnes, R., Dhanoa, M., & Lister, S. J. (1989). Standard normal variate transformation and
de-trending of near-infrared diffusive reflectance spectra. Applied Spectroscopy, 43, 772-777.
Baronas, E. T., Lee, J. W., Alden, C., & Hsieh, F. Y. (2007). Biomarkers to monitor drug-
induced phospholipidosis. Toxicology and Applied Pharmacology, 218, 72-78.
Basivireddy, J., Jacob, M., Pulimood, A.B., & Balasubramanian, K.A. (2004). Indomethacin-
induced renal damage: role of oxygen free radicals. Biochemical Pharmacology, 67, 587-599.
Beckonert, O., Bollard, M. E., Ebbels, T. M. D., Keun, H. C., Antti, H., Holmes, E., Lindon,
J. C., & Nicholson, J. K. (2003). NMR-based metabonomic toxicity classification:
hierarchical cluster analysis and k-nearest-neighbour approaches. Analytica Chimica Acta,
490, 3-15.
Bomhard, E., Maruhn, D., Vogel, O., & Mager, H. (1990). Determination of urinary
glutathione S-transferase and lactate dehydrogenase for differentiation between proximal and
distal nephron damage. Archives of Toxicology, 64, 269-278.
Burges, C. J. C. (1998). A tutorial on support vector machines for pattern recognition. Data
Mining and Knowledge Discovery, 2, 121-167.
Delaney, J., Neville, W. A., Swain, A., Miles, A., Leonard, M. S., & Waterfield, C. J. (2004).
Phenylacetylglycine, a putative biomarker of phospholipidosis: its origins and relevance to
phospholipid accumulation using amiodarone treated rats as a model. Biomarkers, 9, 271-290.
Doubek, M., Mayer, J., Lauschova, I., Scheer, P., Krejcirova, L., Horky, D., & Doubek, J.
(2005). Comparison of the effect of amphotericin B desoxycholate and amphotericin B
colloidal dispersion on renal functions and renal morphology in rats. Nephrology (Carlton),
10, 57-62.
20
Dror, G., Sorek, R., & Shamir, R. (2005). Accurate identification of alternatively spliced
exons using support vector machine. Bioinformatics, 21, 897-901.
Ebbels, T., Keun, H., Beckonert, O., Antti, H., Bollard, M., Holmes, E., Lindon, J., &
Nicholson, J. (2003). Toxicity classification from metabonomic data using a density
superposition approach: ´Clouds`. Analytica Chimica Acta, 490, 109-122.
El Mouedden, M., Laurent, G., Mingeot-Leclercq, M.P., Taper, H.S., Cumps, J., & Tulkens,
P.M. (2000). Apoptosis in renal proximal tubules of rats treated with low doses of
aminoglycosides. Antimicrobial Agents and Chemotherapy, 44, 665-675.
Espina, J.R., Shockcor, J.P., Herron, W.J., Car, B.D., Contel, N.R., Ciaccio, P.J., Lindon, J.C.,
Holmes, E., & Nicholson, J.K. (2001). Detection of in vivo biomarkers of phospholipidosis
using NMR-based metabonomic approaches. Magnetic Resonance in Chemistry, 39, 559-565.
FDA (2001). ICH S7A Safety Pharmacology Studies for Human Pharmaceuticals. Federal
Register, 66, 36791-36792.
Fink, M., Henry, M., & Tange, J.D. (1987). Experimental folic acid nephropathy. Pathology,
19, 143-149.
Gould, S., & Scott, R.C. (2005). 2-Hydroxypropyl-beta-cyclodextrin (HP-beta-CD): a
toxicology review. Food and Chemical Toxicology, 43, 1451-1459.
Gregg, N.J., Courtauld, E.A., & Bach, P.H. (1990a). Enzyme histochemical changes in an
acutely induced renal papillary necrosis. Toxicologic Pathology, 18, 39-46.
Gregg, N.J., Courtauld, E.A., & Bach, P.H. (1990b). High resolution light microscopic
morphological and microvascular changes in an acutely induced renal papillary necrosis.
Toxicologic Pathology, 18, 47-55.
Halstead, B.W., Zwickl, C.M., Morgan, R.E., Monteith, D.K., Thomas, C.E., Bowers, R.K., &
Berridge, B.R. (2006). A clinical flow cytometric biomarker strategy: validation of peripheral
leukocyte phospholipidosis using Nile red. Journal of Applied Toxicology, 26, 169-177.
21
Hasegawa, M., Takenaka, S., Kuwamura, M., Yamate, J., & Tsuyama, S. (2007). Urinary
metabolic fingerprinting for amiodarone-induced phospholipidosis in rats using FT-ICR MS.
Experimental and Toxicologic Pathology, 59, 115-120.
Holmes, E., Nicholls, A. W., Lindon, J. C., Connor, S. C., Connelly, J. C., Haselden, J. N.,
Damment, S. J. P., Spraul, M., Neidig, P., & Nicholson, J. K. (2000). Chemometric models
for toxicity classification based on NMR spectra of biofluids. Chemical Research in
Toxicology, 13, 471-478.
Holmes, E., Nicholls, A. W., Lindon, J. C., Ramos, S., Spraul, M., Neidig, P., Connor, S. C.,
Connelly, J., Damment, S. J. P., Haselden, J., & Nicholson, J. K. (1998a). Development of a
model for classification of toxin-induced lesions using 1H NMR spectroscopy of urine
combined with pattern recognition. NMR in Biomedicine, 11, 235-244.
Holmes, E., Nicholson, J. K., Nicholls, A. W., Lindon, J. C., Connor, S. C., Polley, S., &
Connelly, J. (1998b). The identification of novel biomarkers of renal toxicity using automatic
data reduction techniques and PCA of proton NMR spectra of urine. Chemometrics and
Intelligent Laboratory Systems, 44, 245-255.
Jaffe, M. (1886). Über den Niederschlag welchen Pikrinsäure in normalen Harn erzeugt und
über eine neue reaction des kreatinins. Hoppe-Seyler's Zeitschrift fur Physiologische Chemie,
10, 391-400.
Joachims, T. (1998). Text categorization with support vector machines: learning with many
relevant features. In: C. Nèdellec, C. Rouveirol (Eds.), Proceedings of ECML-98, 10th
European Conference on Machine Learning (pp. 137-142). Heidelberg: Springer Verlag.
Kassabi, M., Braun, J.P., Burgat-Sacaze, V., Bénard, P., & Rico, A.G. (1981). Comparison of
sodium and stannous fluoride nephrotoxicity. Toxicology Letters, 7, 463-467.
Kavlock, R.J., Rehnberg, B.F., & Rogers, E.H. (1985) Amphotericin B- and folic acid-
induced nephropathies in developing rats. Toxicology and Applied Pharmacology, 81, 407-
415.
22
Kim, H.S., Cha, S.H., Abraham, D.G., Cooper, A.J., & Endou, H. (1997). Intranephron
distribution of cysteine S-conjugate beta-lyase activity and its implication for hexachloro-1,3-
butadiene-induced nephrotoxicity in rats. Archives of Toxicology, 71, 131-141.
Kittler, J., Hatef, M., Duin, R. P. W., & Matas, J. (1998). On combining classifiers. IEEE
Transactions on Pattern Analysis and Machine Intelligence, 20, 226-239.
Lindon, J. C., Holmes, E., & Nicholson, J. K. (2004). Toxicological applications of magnetic
resonance. Progress in Nuclear Magnetic Resonance Spectroscopy, 45, 109–143.
Lüllmann-Rauch, R., & Scheid, D. (1975). Intraalveolar foam cells associated with lipidosis-
like alterations in lung and liver of rats treated with tricyclic psychotropic drugs. Virchows
Archiv. B: Cell Pathology, 19, 255-268.
Magnusson, G., Olsson, T., & Nyberg, J.A. (1986). Toxicity of Pluronic F-68. Toxicology
Letters, 30, 203-207.
Miller, D.S. (2002). Xenobiotic export pumps, endothelin signaling, and tubular
nephrotoxicants - a case of molecular hijacking. Journal of Biochemical and Molecular
Toxicology, 16, 121-127.
Morales, A.I., Barata, J.D., Bruges, M., Arevalo, M.A., de Buitrago, J.M.G., Palma, P.,
Branco, P., & Perez-Barriocanal, F. (2003). Acute Renal Toxic Effect of Amiodarone in Rats
Pharmacology & Toxicology, 92, 39-42.
Mortuza, G.B., Neville, W.A., Delaney, J., Waterfield, C.J., & Camilleri, P. (2003).
Characterisation of a potential biomarker of phospholipidosis from amiodarone-treated rats.
Biochimica et Biophysica Acta, 1631, 136-146.
Musabayane, C.T., Cooper, R.G., Rao, P.V., & Balment, R.J. (2000). Effects of ethanol on the
changes in renal fluid and electrolyte handling and kidney morphology induced by long-term
chloroquine administration to rats. Alcohol, 22, 129-138.
National Toxicology Program (1988). NTP Toxicology and Carcinogenesis Studies of N-
Phenyl-2-naphthylamine (CAS No. 135-88-6) in F344/N Rats and B6C3F1 Mice (Feed
Studies). National Toxicology Program technical report series, 333, 1-168.
23
National Toxicology Program (1989). Toxicology and Carcinogenesis Studies of Furosemide
(CAS No. 54-31-9) in F344/N Rats and B6C3F1 Mice (Feed Studies). National Toxicology
Program technical report series, 356, 1-190.
National Toxicology Program (1989). Toxicology and Carcinogenesis Studies of
Hydrochlorothiazide (CAS No. 58-93-5) in F344/N Rats and B6C3F1 Mice (Feed Studies).
National Toxicology Program technical report series, 357, 1-194.
Nicholls, A.W: Nicholson, J.K., Haselden, J.N., & Waterfield, C.J. (2000). A metabonomics
approach to the investigation of drug-induced phospholipidosis: an NMR spectroscopy and
pattern recognition study. Biomarkers, 5, 410-423.
Nioi, P., Perry, B. K., Wang, E.-J., Gu, Y.-Z., & Snyder, R. D. (2007). In vitro detection of
drug-induced phospholipidosis using gene expression and fluorescent phospholipid–based
Methodologies. Toxicological Sciences, 99, 162–173.
Nonclercq, D., Wrona, S., Toubeau, G., Zanen, J., Heuson-Stiennon, J.A., Schaudies, R.P., &
Laurent, G. (1992). Tubular injury and regeneration in the rat kidney following acute
exposure to gentamicin: a time-course study. Renal Failure, 14, 507-521.
Ogura, T., Takaoka, M., Yamauchi, T., Oishi, T., Mimura, Y., Hashimoto, M., Asano, N.,
Yamamura, M., Otsuka, F., Makino, H., Ota, Z., & Takahashi, K. (1996). Changes in urinary
enzyme activity and histochemical findings in experimental tubular injury induced by gold
sodium thiomalate. Journal of medicine, 27, 41-55.
Pari, L., & Murugan, P. (2006). Tetrahydrocurcumin: effect on chloroquine-mediated
oxidative damage in rat kidney. Basic and Clinical Pharmacology and Toxicology, 99, 329-
334.
Pestel, S., Martin, H.-J., Maier, G.-M., & Guth, B. (2006). Effect of commonly used vehicles
on gastrointestinal, renal, and liver function in rats. Journal of Pharmacological and
Toxicological Methods, 54, 200–214.
24
Peters, M.M., Jones, T.W., Monks, T.J., & Lau, S.S. (1997). Cytotoxicity and cell-
proliferation induced by the nephrocarcinogen hydroquinone and its nephrotoxic metabolite
2,3,5-(tris-glutathion-S-yl)hydroquinone. Carcinogenesis, 18, 2393-2401.
Rangwala, H., & Karypis, G. (2005). Profile-based direct kernels for remote homology
detection and fold recognition. Bioinformatics, 21, 4239-4247.
Reasor, M. J., & Kacew, S. (2001) Drug-induced phospholipidosis: are there functional
consequences? Experimental Biology and Medicine, 226, 825-830.
Robertson, D. G., Reily, M. D., Sigler, R. E., Wells, D. F., Paterson, D. A., & Braden, T.K.
(2000). Metabonomics: evaluation of nuclear magnetic resonance (NMR) and pattern
recognition technology for rapid in vivo screening of liver and kidney toxicants.
Toxicological Sciences, 57, 326-337.
Schölkopf, B., & Smola, A. J. (2002). Learning with kernels. Cambridge, Massachusetts: MIT
Press.
Takagi, M., & Shiraki, S. (1982). Acute sodium fluoride toxicity in the rat kidney. The
Bulletin Tokyo Medical and Dental University, 29, 123-130.
Tanaka, T., Kojima, I., Ohse, T., Inagi, R., Miyata, T., Ingelfinger, J.R., Fujita, T., &
Nangaku, M. (2005). Hypoxia-inducible factor modulates tubular cell survival in cisplatin
nephrotoxicity. American Journal of Physiology. Renal Physiology, 289, F1123-F1133.
Westerhuis, J. A., Hoefsloot, H. C. J., Smit, S., Vis, D. J., Smilde, A. K., van Velzen, E. J. J.,
van Duijnhoven, J. P. M., & van Dorsten, F. A. (2008). Assessment of PLSDA cross
validation. Metabolomics, 4, 81-89.
Whiting, P.H., & Brown, P.A. (1996). The relationship between enzymuria and kidney
enzyme activities in experimental gentamicin nephrotoxicity. Renal failure, 18, 899-909.
Wold, H. (1966). Estimation of principal components and related models by iterative least
squares. In: P.R. Krishnaiaah (Eds.). Multivariate Analysis (pp. 391-420). New York:
Academic Press.
25
Conflict of interest statement
There are no conflicts of interest for the authors, i.e. Kai Lienemann, Thomas Plötz, and
Sabine Pestel.
26
Figure Legends
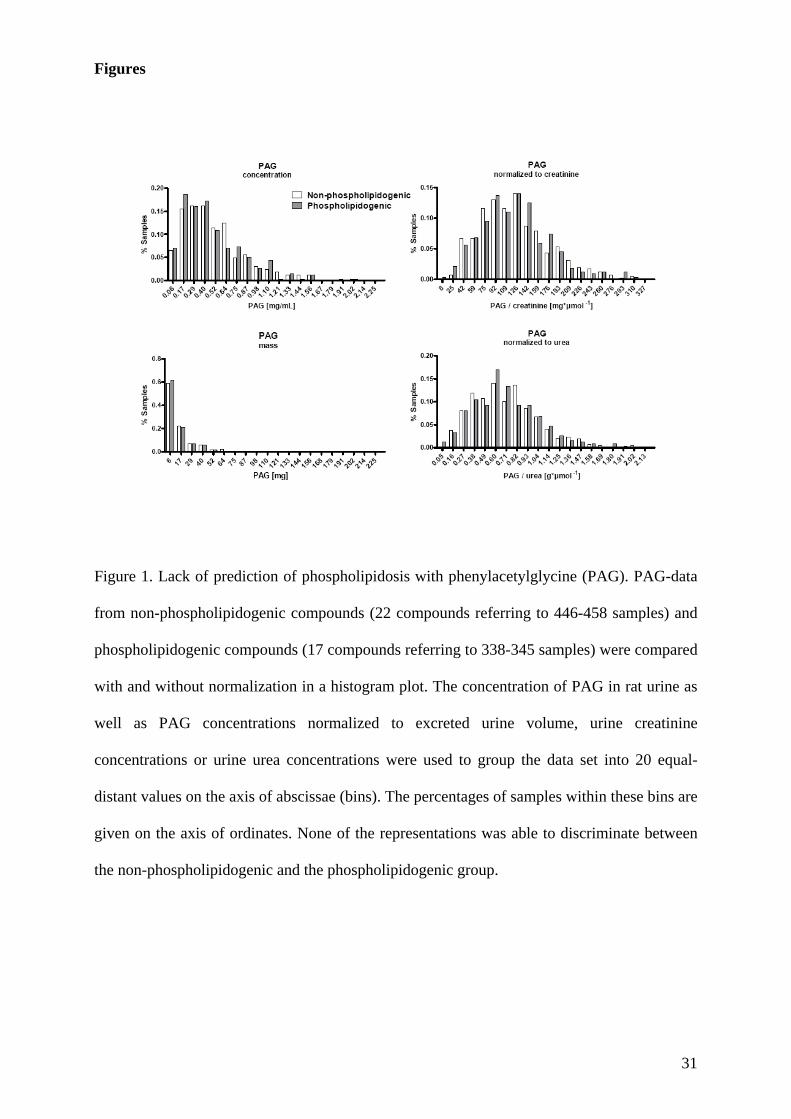
Figure 1. Lack of prediction of phospholipidosis with phenylacetylglycine (PAG). PAG-data
from non-phospholipidogenic compounds (22 compounds referring to 446-458 samples) and
phospholipidogenic compounds (17 compounds referring to 338-345 samples) were compared
with and without normalization in a histogram plot. The concentration of PAG in rat urine as
well as PAG concentrations normalized to excreted urine volume, urine creatinine
concentrations or urine urea concentrations were used to group the data set into 20 equal-
distant values on the axis of abscissae (bins). The percentages of samples within these bins are
given on the axis of ordinates. None of the representations was able to discriminate between
the non-phospholipidogenic and the phospholipidogenic group.
27
Tables
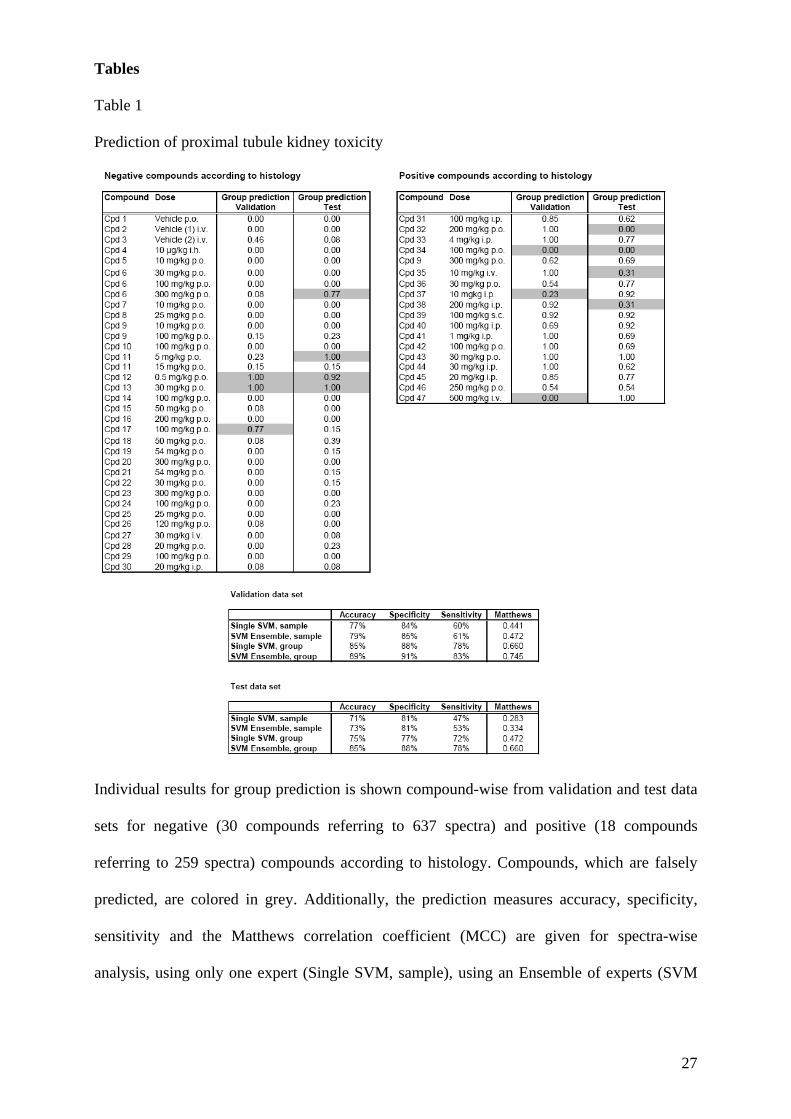
Table 1
Prediction of proximal tubule kidney toxicity
Individual results for group prediction is shown compound-wise from validation and test data
sets for negative (30 compounds referring to 637 spectra) and positive (18 compounds
referring to 259 spectra) compounds according to histology. Compounds, which are falsely
predicted, are colored in grey. Additionally, the prediction measures accuracy, specificity,
sensitivity and the Matthews correlation coefficient (MCC) are given for spectra-wise
analysis, using only one expert (Single SVM, sample), using an Ensemble of experts (SVM
28
Ensemble, sample) or using single SVMs (Single SVM, group) or an Ensemble but with a
compound- and dose-wise decision (SVM Ensemble, group).
29
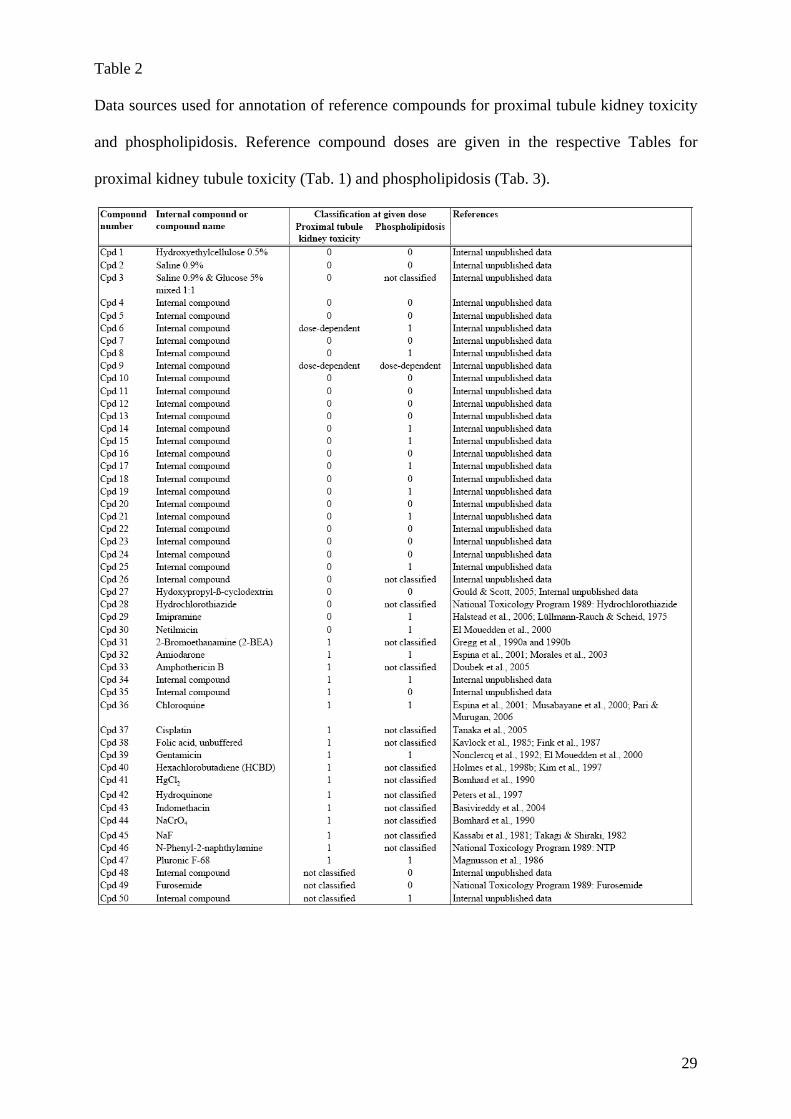
Table 2
Data sources used for annotation of reference compounds for proximal tubule kidney toxicity
and phospholipidosis. Reference compound doses are given in the respective Tables for
proximal kidney tubule toxicity (Tab. 1) and phospholipidosis (Tab. 3).
30
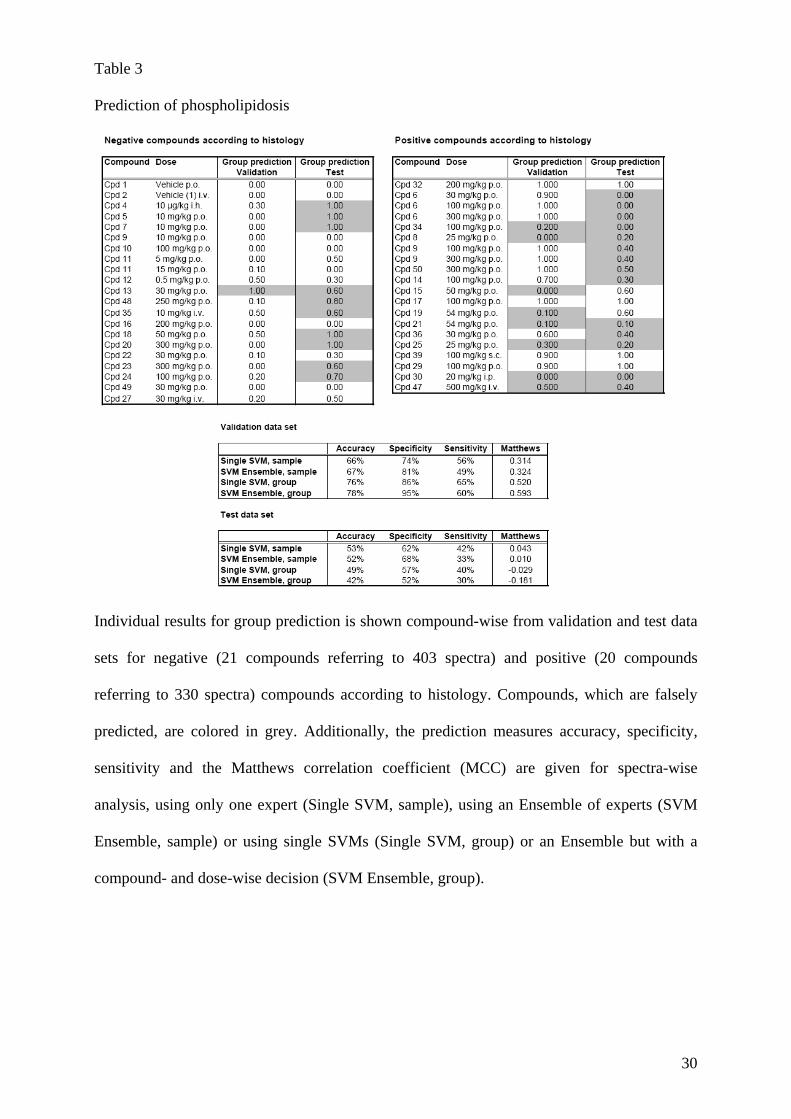
Table 3
Prediction of phospholipidosis
Individual results for group prediction is shown compound-wise from validation and test data
sets for negative (21 compounds referring to 403 spectra) and positive (20 compounds
referring to 330 spectra) compounds according to histology. Compounds, which are falsely
predicted, are colored in grey. Additionally, the prediction measures accuracy, specificity,
sensitivity and the Matthews correlation coefficient (MCC) are given for spectra-wise
analysis, using only one expert (Single SVM, sample), using an Ensemble of experts (SVM
Ensemble, sample) or using single SVMs (Single SVM, group) or an Ensemble but with a
compound- and dose-wise decision (SVM Ensemble, group).
31
Figures
Figure 1. Lack of prediction of phospholipidosis with phenylacetylglycine (PAG). PAG-data
from non-phospholipidogenic compounds (22 compounds referring to 446-458 samples) and
phospholipidogenic compounds (17 compounds referring to 338-345 samples) were compared
with and without normalization in a histogram plot. The concentration of PAG in rat urine as
well as PAG concentrations normalized to excreted urine volume, urine creatinine
concentrations or urine urea concentrations were used to group the data set into 20 equal-
distant values on the axis of abscissae (bins). The percentages of samples within these bins are
given on the axis of ordinates. None of the representations was able to discriminate between
the non-phospholipidogenic and the phospholipidogenic group.
Related Documents


![The acid-base regulation by renal proximal tubule · proximal tubule [2,11-16]. In the mammal NHE3 exists not only in the apical side of renal proximal tubule and thick ascending](https://static.cupdf.com/doc/110x72/60266b739b27dd64204c8508/the-acid-base-regulation-by-renal-proximal-tubule-proximal-tubule-211-16-in.jpg)


