Application of High-Throughput Sequencing Methods to Spider Phylogenomics and Speciation with a Focus on the Mygalomorph Genus Aptostichus by Nicole L. Garrison A dissertation submitted to the Graduate Faculty of Auburn University in partial fulfillment of the requirements for the Degree of Doctor of Philosophy Auburn, Alabama May 5, 2018 Keywords: phylogenomics, molecular systematics, mygalomorph spiders, transcriptome, species delimitation Copyright 2018 by Nicole L. Garrison Approved by Dr. Jason E. Bond, Chair, Professor and Department Chair of Biological Sciences Dr. Rita Graze, Professor of Biological Sciences Dr. Scott Santos, Professor of Biological Sciences Dr. Michael Wooten, Professor of Biological Sciences

Welcome message from author
This document is posted to help you gain knowledge. Please leave a comment to let me know what you think about it! Share it to your friends and learn new things together.
Transcript
Application of High-Throughput Sequencing Methods to Spider Phylogenomics and Speciation with a Focus on the Mygalomorph Genus Aptostichus
by
Nicole L. Garrison
A dissertation submitted to the Graduate Faculty of Auburn University
in partial fulfillment of the requirements for the Degree of
Doctor of Philosophy
Auburn, Alabama May 5, 2018
Keywords: phylogenomics, molecular systematics, mygalomorph spiders, transcriptome, species
delimitation
Copyright 2018 by Nicole L. Garrison
Approved by
Dr. Jason E. Bond, Chair, Professor and Department Chair of Biological Sciences Dr. Rita Graze, Professor of Biological Sciences
Dr. Scott Santos, Professor of Biological Sciences Dr. Michael Wooten, Professor of Biological Sciences
ii
Abstract
Spiders are massively abundant generalist arthropod predators that are found in nearly
every ecosystem on the planet and have persisted for over 380 million years. Spiders have long
served as evolutionary models for studying complex mating and web spinning behaviors, key
innovation and adaptive radiation hypotheses, and have been inspiration for important theories
like sexual selection by female choice. Unfortunately, past major attempts to reconstruct spider
phylogeny typically employing the “usual suspect” genes have been unable to produce a well-
supported phylogenetic framework for the entire order. To further resolve higher level spider
evolutionary relationships, I assembled a transcriptome-based data set comprising 70 ingroup
spider taxa and executed phylogenomic analyses of a core ortholog supermatrix (Chapter I). To
address questions at the species/population level, I employed a combination of two genomic
sequencing approaches – targeted enrichment (anchored hybrid enrichment) and restriction
enzyme based (genotyping-by-sequencing) – to evaluate relationships within the Aptostichus
atomarius species complex (Chapter II). Finally, to understand the genomic basis of species
diversity at the level of transcription, I compared transcriptomes of eight closely related species
including ingroup A. atomarius complex members and outgroup taxa. Within the transcribed
genes I detected gene families under selection and recovered sequences potentially associated
with dune endemic lineages (Chapter III). All three chapters are designed with a single
overarching goal: to move spider evolutionary biology and systematics forward by generating
and utilizing next-generation sequence data and resources.
iii
Table of Contents
Abstract ......................................................................................................................................... ii
List of Tables ............................................................................................................................... vi
List of Figures ............................................................................................................................. vii
Chapter I Spider Phylogenomics: Untangling the Spider Tree of Life ........................................ 1
Introduction ....................................................................................................................... 1
Materials and Methods ...................................................................................................... 5
Sampling, Extraction, Assembly ........................................................................... 5
Core Ortholog Approach and Data Processing ................................................... 6
Phylogenetics ...................................................................................................... 10
Results ............................................................................................................................. 13
Summary of Genomic Data ................................................................................. 13
Phylogenetic Analyses ........................................................................................ 14
Discussion ....................................................................................................................... 16
Data Characteristics and Development of Spider Core Orthologs .................... 17
A Modified View of Spider Evolution and Key Innovations ............................... 18
Spider Systematics .............................................................................................. 21
Conclusions ..................................................................................................................... 27
Data Accessibility ........................................................................................................... 28
References ....................................................................................................................... 29
iv
Chapter II Species Delimitation in a Californian Trapdoor Spider Species Complex .............. 49
Introduction ..................................................................................................................... 49
Materials and Methods .................................................................................................... 52
GBS Sequencing and Filtering ............................................................................ 53
Species/Population Discovery ............................................................................ 54
AHE Loci Capture and Processing ..................................................................... 55
Phylogenomic Analyses ...................................................................................... 56
Species Validation ............................................................................................... 57
Species Boundary Refinement ............................................................................. 58
Results ............................................................................................................................. 59
GBS Data Clustering Analyses ........................................................................... 60
Phylogenomic Relationships ............................................................................... 61
Species Delimitation and Refinement ................................................................. 62
Discussion ....................................................................................................................... 63
Cryptic Speciation ............................................................................................... 64
Sympatry and Species Diagnoses ........................................................................ 65
Sister Species of Metapopulations? .................................................................... 66
Conclusions ..................................................................................................................... 68
References ....................................................................................................................... 71
Chapter III Transcriptome Characterization and Signatures of Selection in the Aptostichus
atomarius Species Complex ........................................................................................... 85

v
Background ..................................................................................................................... 85
Materials and Methods .................................................................................................... 87
Assembly and Assessment of Completeness ........................................................ 88
Functional Annotation ........................................................................................ 90
Detection of Gene Families Under Selection ...................................................... 91
Results and Discussion ................................................................................................... 92
Conclusions ..................................................................................................................... 98
References ..................................................................................................................... 100
Appendix I ................................................................................................................................ 116
vi
List of Tables
Chapter I
Table 1: Major Spider Lineages .................................................................................................. 39
Table 2: Summary of Phylogenomic Analyses ........................................................................... 40
Table 3: BEAST statistics .......................................................................................................... 41
Chapter II
Table 1: Sampling Locality Data ............................................................................................... 75
Chapter III
Table 1: Sequence Metadata and Annotation Summary ........................................................... 106
Table 2: OrthoFinder Summary ................................................................................................ 106
Table 3: COATS Top 20 ........................................................................................................... 107
vii
List of Figures
Chapter I Figure 1: Summary, Preferred Tree of Spider Relationships ...................................................... 43
Figure 2: Summary Tree of Phylogenomic Analyses ................................................................ 44
Figure 3: ASTRAL Gene Tree ................................................................................................... 45
Figure 4: Chronogram ................................................................................................................ 46
Figure 5: Time Calibrated Phylogeny and BAMM Analysis .................................................... 47
Figure 6: ML Ancestral State Reconstruction ........................................................................... 48
Chapter II
Figure 1: Sampling Locality Map ............................................................................................... 78
Figure 2: STRUCTURE and LEA for D1 ................................................................................... 79
Figure 3: STRUCTURE and LEA for D2 ................................................................................... 79
Figure 4: STRUCTURE and LEA for D3 ................................................................................... 79
Figure 5: ML Reconstruction 644 Loci ...................................................................................... 80
Figure 6: ML Reconstruction 141 Loci ...................................................................................... 80
Figure 7: ASTRAL Species Tree 644 Loci ................................................................................. 81
Figure 8: ASTRAL Species Tree 141 Loci ................................................................................. 82
Figure 9: BPP Result Summary .................................................................................................. 83
Figure 10: PHRAPL Asymmetric Analyses Summary ............................................................... 83
Figure 11: PHRAPL Symmetric Analyses Summary ................................................................. 84
viii
Figure 12: Map of Adjusted Distributions .................................................................................. 84
Chapter III
Figure 1: Distribution Map and Sampling Localities ............................................................... 108
Figure 2: COATS Pipeline ........................................................................................................ 109
Figure 3: Isoform Counts .......................................................................................................... 110
Figure 4 BUSCO Results .......................................................................................................... 110
Figure 5: MCSC Taxonomic Distribution ................................................................................ 111
Figure 6: Heatmap of Pairwise Sequence Values ..................................................................... 112
Figure 7: OrthoVenn Output ..................................................................................................... 113
Figure 8: MSA Aptostichus ICK Peptides ................................................................................ 114
Figure 9: TMhmm Alignment of ICK ...................................................................................... 115
Figure 10: MSA Kunitz-type peptides ...................................................................................... 115
1
CHAPTER I Spider Phylogenomics: Untangling the Spider Tree of Life
Introduction:
Spiders (Order Araneae; Fig. 1) are a prototypical, hyperdiverse arthropod group
comprising >45,000 described species (World Spider Catalog, 2016) distributed among 3,958
genera and 114 families; by some estimates the group may include more than 120,000 species
(Agnarsson, Coddington & Kuntner, 2013). Spiders are abundant, generalist predators that play
dominant roles in almost every terrestrial ecosystem. The order represents an ancient group that
has continued to diversify taxonomically and ecologically since the Devonian (>380 mya). They
are relatively easy to collect and identify, and are one of few large arthropod orders to have a
complete online taxonomic catalog with synonymies and associated literature (World Spider
Catalog, 2016).
In addition to their remarkable ecology, diversity, and abundance, spiders are known for
producing extraordinary biomolecules like venoms and silks as well as their utility as models for
behavioral and evolutionary studies (reviewed in Agnarsson, Coddington & Kuntner, 2013).
Stable and complex venoms have evolved over millions of years to target predators and prey
alike. Stable and complex venoms have evolved over millions of years to target predators and
prey alike. Although few are dangerous to humans, spider venoms hold enormous promise as
economically important insecticides and therapeutics (Saez et al., 2010; King & Hardy, 2013).
Moreover, no other animal lineage can claim a more varied and elegant use of silk. A single
species may have as many as eight different silk glands, producing a variety of super-strong silks
deployed in almost every aspect of a spider’s life (Garb, 2013): safety lines, dispersal,
2
reproduction (sperm webs, eggsacs, pheromone trails), and prey capture (Blackledge, Kuntner &
Agnarsson, 2011). Silken prey capture webs, particularly the orb, have long been considered a
key characteristic contributing to the ecological and evolutionary success of this group (reviewed
in Bond & Opell, 1998). Moreover, spider silks are promising biomaterials, already benefiting
humans in myriad ways - understanding the phylogenetic basis of such super-materials will
facilitate efforts to reproduce their properties in biomimetic materials like artificial nerve
constructs, implant coatings, and drug delivery systems (Blackledge, Kuntner & Agnarsson,
2011; Schacht & Scheibel, 2014).
The consensus on major spider clades has changed relatively little in the last two decades
since the summary of Coddington & Levi (1991) and Coddington (2005). Under the classical
view, Araneae comprises two clades (see Table 1 and Fig. 1 for major taxa discussed throughout;
node numbers (Fig. 1) referenced parenthetically hereafter), Mesothelae (Node 2) and
Opisthothelae (Node 3). Mesotheles are sister to all other spiders, possessing a plesiomorphic
segmented abdomen and mid-ventral (as opposed to terminal) spinnerets. Opisthothelae contains
two clades: Mygalomorphae (Node 4) and Araneomorphae (Node 8). Mygalomorphae is less
diverse (~6 % of described Araneae diversity) and retains several plesiomorphic features (e.g.
two pairs of book lungs, few and biomechanically ‘weak’ silks (Dicko et al., 2008; Starrett et al.,
2012). Within Araneomorphae, Hypochilidae (Paleocribellatae; Node 9) is sister to
Neocribellatae, within which Austrochiloidea are sister to the major clades Haplogynae (Node
10) and Entelegynae (Node 11), each weakly to moderately supported by few morphological
features. Haplogynes have simple genitalia under muscular control whereas entelegynes have
hydraulically activated, complex genitalia, with externally sclerotized female epigyna.
Entelegynes comprise multiple, major, hyperdiverse groups, including the “RTA clade” (RTA =
3
retrolateral tibial apophysis, Node 13), its subclade Dionycha (e.g. jumping spiders; Ramirez,
2014, Node 14), and the Orbiculariae – the cribellate and ecribellate orb weavers and relatives
(see Hormiga & Griswold, 2014).
Beginning with early higher-level molecular phylogenetic studies, it gradually became
clear that major “stalwart” and presumably well-supported spider groups like the Neocribellatae,
Haplogynae, Palpimanoidea, Orbiculariae, Lycosoidea, and others (generally only known to
arachnologists) were questionable. Subsequent studies focusing on mygalomorph (Hedin &
Bond, 2006; Bond et al., 2012) and araneomorph (Blackledge et al., 2009; Dimitrov et al., 2012)
relationships continued to challenge the consensus view based largely on morphological data,
finding polyphyletic families and ambivalent support for major clades, which were sometimes
“rescued” by adding non-molecular data; molecular signal persistently contradicted past verities.
In Agnarsson, Coddington & Kuntner (2013), a meta-analysis of available molecular data failed
to recover several major groups such as Araneomorphae, Haplogynae, Orbiculariae, Lycosoidea,
and others (Table 1). Although these authors criticized the available molecular data as
insufficient, their results actually presaged current spider phylogenomic inferences Bond et al.,
2014. Incongruence between the traditional spider classification scheme and (non-phylogenomic)
molecular systematics likely has one primary cause: too few data. Non-molecular datasets to date
have been restricted to a relatively small set of morphological and/or behavioral characters
whereas molecular analyses addressing deep spider relationships have largely employed
relatively few, rapidly evolving loci (e.g., 28S and 18S rRNA genes, Histone 3, and a number of
mitochondrial DNA markers).
The first analyses of spider relationships using genome-scale data, scored for 40 taxa by
Bond et al. (2014) and for 14 taxa by Fernández, Hormiga & Giribet (2014), considerably refined
4
understanding of spider phylogeny, the former explicitly calling into question long held notions
regarding the tempo and mode of spider evolution. Using transcriptome-derived data, Bond et al.
(2014) recovered the monophyly of some major groups (araneomorphs and mygalomorphs) but
reshuffled several araneomorph lineages (haplogynes, paleocribellates, orbicularians, araneoids
(Node 12) and the RTA clade). Notably, Bond et al. (2014) and Fernández, Hormiga & Giribet
(2014) rejected Orbiculariae, which included both cribellate (Deinopoidea) and ecribellate orb
weavers (Araneoidea). Instead they suggested either that the orb web arose multiple times, or,
more parsimoniously, that it arose once and predated the major diversification of spiders. Despite
significant advances in understanding of spider phylogeny, only a small percentage of spider
families were sampled and monophyly of individual families could not be tested in previous
phylogenomic studies. Denser taxon sampling is needed to warrant changes in higher
classification and to more definitively address major questions about spider evolution.
Herein, we apply a spider-specific core ortholog approach with significantly increased
taxon and gene sampling to produce a more complete and taxon specific set of alignments for
phylogenetic reconstruction and assessment of spider evolutionary pattern and process. Existing
genome-derived protein predictions and transcriptome sequences from a representative group of
spiders and arachnid outgroups were used to create a custom core ortholog set specific to spiders.
Taxon sampling was performed to broadly sample Araneae with an emphasis on lineages whose
phylogenetic placement is uncertain and included previously sequenced transcriptomes, gene
models from completely sequenced genomes, and novel transcriptome sequences generated by
our research team. This resulted in a data set comprising 70 spider taxa plus five additional
arachnid taxa as outgroups. We test long-held notions that the orb web, in conjunction with
ecribellate adhesive threads, facilitated diversification among araneoids and present the most
5
completely sampled phylogenomic data set for spiders to date using an extensive dataset of
nearly 3,400 putative genes (~700K amino acids). Further, we test the hypothesis of a non-
monophyletic Orbiculariae, assess diversification rate shifts across the spider phylogeny, and
provide phylogenomic hypotheses for historically difficult to place spider families. Our results
clearly demonstrate that our understanding of spider phylogeny and evolution requires major
reconsideration and that several long-held and contemporary morphologically-derived
hypotheses are likely destined for falsification.
Materials and Methods:
Sampling, Extraction, Assembly
Spider sequence data representing all major lineages were collected from previously
published transcriptomic and genomic resources (N=53) and supplemented with newly
sequenced transcriptomes (N=22) to form the target taxon set for the current study. Existing
sequence data were acquired via the NCBI SRA database (http://www.ncbi.nlm.nih.gov/sra).
Raw transcriptome sequences were downloaded, converted to fastq file format, and assembled
using Trinity (Grabherr et al., 2011). Genomic data sets in the form of predicted proteins were
downloaded directly from the literature (Sanggaard et al., 2014) for downstream use in our
pipeline. Newly sequenced spiders were collected from a variety of sources, extracted using the
TRIzol total RNA extraction method, purified with the RNeasy mini kit (Qiagen) and sequenced
in-house at the Auburn University Core Genetics and Sequencing Laboratory using an Illumina
Hi-Seq 2500. This produced 100bp paired end reads for each newly sequenced spider
transcriptome, which were then assembled using Trinity. Proteins were predicted from each
transcriptome using the program TransDecoder (Haas et al., 2013).
6
Core Ortholog Approach and Data Processing
We employed a core ortholog approach for putative ortholog selection and implicitly
compared the effect of using a common arthropod core ortholog set and one compiled for
spiders; the arthropod core ortholog set was deployed as described in Bond et al. (2014). To
generate the spider core ortholog set, we used an all-versus-all BLASTP method (Altschul et al.,
1990) to compare the transcripts of the amblypygid Damon variegatus, and the spiders
Acanthoscurria geniculata, Dolomedes triton, Ero leonina, Hypochilus pococki, Leucauge
venusta, Liphistius malayanus, Megahexura fulva, Neoscona arabesca, Stegodyphus
mimosarum, and Uloborus sp. Acanthoscurria geniculata) and Stegodyphus mimosarum were
represented by predicted transcripts from completely sequenced genomes while the other taxa
were represented by our new Illumina transcriptomes. An e-value cut-off of 10-5 was used. Next,
based on the BLASTP results, Markov clustering was conducted using OrthoMCL 2.0 (Li,
Stoeckert & Roos, 2003) with an inflation parameter of 2.1.
The resulting putatively orthologous groups (OGs) were processed with a modified
version of the bioinformatics pipeline employed by Kocot et al. (2011). First, sequences shorter
than 100 amino acids in length were discarded. Next, each candidate OG was aligned with
MAFFT (Katoh, 2005) using the automatic alignment strategy with a maxiterate value of 1,000.
To screen OGs for evidence of paralogy, an “approximately maximum likelihood tree” was
inferred for each remaining alignment using FastTree 2 (Price, Dehal & Arkin, 2010). Briefly,
this program constructs an initial neighbor-joining tree and improves it using minimum evolution
with nearest neighbor interchange (NNI) subtree rearrangement. FastTree subsequently uses
minimum evolution with subtree pruning regrafting (SPR) and maximum likelihood using NNI
to further improve the tree. We used the “slow” and “gamma” options; “slow” specifies a more
7
exhaustive NNI search, while “gamma” reports the likelihood under a discrete gamma
approximation with 20 categories, after the final round of optimizing branch lengths.
PhyloTreePruner (Kocot, Citarella & Halanych, 2013) was then employed as a tree-based
approach to screen each candidate OG for evidence of paralogy. First, nodes with support values
below 0.95 were collapsed into polytomies. Next, the maximally inclusive subtree was selected
where all taxa were represented by no more than one sequence or, in cases where more than one
sequence was present for any taxon, all sequences from that taxon formed a monophyletic group
or were part of the same polytomy. Putative paralogs (sequences falling outside of this
maximally inclusive subtree) were then deleted from the input alignment. In cases where
multiple sequences from the same taxon formed a clade or were part of the same polytomy, all
sequences but the longest were deleted. Lastly, in order to eliminate orthology groups with poor
taxon sampling, all groups sampled for fewer than 7 of the 11 taxa and all groups not sampled
for Megahexura fulva (taxon with greatest number of identified OGs) were discarded. The
remaining alignments were used to build profile hidden Markov models (pHMMs) for HaMStR
with hmmbuild and hmmcalibrate from the HMMER package (Eddy, 2011).
For orthology inference, we employed HaMStR v13.2.3 (Ebersberger, Strauss & Von
Haeseler, 2009), which infers orthology based on predefined sets of orthologs. Translated
transcripts for all taxa were searched against the new set of 4,934 spider-specific pHMMs
(available for download from the Dryad Data Repository) and an arthropod core ortholog set
previously employed in Bond et al. (2014). In the spider core ortholog analysis, the genome-
derived Acanthoscurria geniculata OGs were used as the reference protein set for reciprocal best
hit scoring. Daphnia pulex was used as the reference species for putative ortholog detection in
the arthropod core ortholog analysis. Orthologs sharing a core identification number were pooled
8
together for all taxa and processed using a modified version of the pipeline used to generate the
custom spider ortholog set. In both analyses, sequences shorter than 75 amino acids were deleted
first. OGs sampled for fewer than 10 taxa were then discarded. Redundant identical sequences
were removed with the perl script uniqhaplo.pl (available at
http://raven.iab.alaska.edu/~ntakebay/) leaving only unique sequences for each taxon. Next, in
cases where one of the first or last 20 characters of an amino acid sequence was an X
(corresponding to a codon with an ambiguity, gap, or missing data), all characters between the X
and that end of the sequence were deleted and treated as missing data. Each OG was then aligned
with MAFFT (mafft --auto --localpair --maxiterate 1000; Katoh, 2005). Alignments were then
trimmed with ALISCORE (Misof & Misof, 2009) and ALICUT (Kück, 2009) to remove
ambiguously aligned regions. Next, a consensus sequence was inferred for each alignment using
the EMBOSS program infoalign (Rice, Longden & Bleasby, 2000). For each sequence in each
single-gene amino acid alignment, the percentage of positions of that sequence that differed from
the consensus of the alignment were calculated using infoalign’s “change” calculation. Any
sequence with a “change” value greater than 75 was deleted. Subsequently, a custom script was
used to delete any mistranslated sequence regions of 20 or fewer amino acids in length
surrounded by ten or more gaps on either side. This step was important, as sequence ends were
occasionally mistranslated or misaligned. Alignment columns with fewer than four non-gap
characters were subsequently deleted. At this point, alignments shorter than 75 amino acids in
length were discarded. Lastly, we deleted sequences that did not overlap with all other sequences
in the alignment by at least 20 amino acids, starting with the shortest sequence not meeting this
criterion. This step was necessary for downstream single-gene phylogenetic tree reconstruction.
As a final filtering step, OGs sampled for fewer than 10 taxa were discarded.
9
In some cases, a taxon was represented in an OG by two or more sequences (splice
variants, lineage-specific gene duplications [=inparalogs], overlooked paralogs, or exogenous
contamination). In order to select the best sequence for each taxon and exclude any overlooked
paralogs or exogenous contamination, we built trees in FastTree 2 (Price, Dehal & Arkin, 2010)
and used PhyloTreePruner to select the best sequence for each taxon as described above.
Remaining OGs were then concatenated using FASconCAT (Kück & Meusemann, 2010). The
OGs selected by our bioinformatic pipeline were further screened in seven different ways
(subsets listed in Table 2). OGs were first sorted based on amount of missing data; the half with
the lowest levels was pulled out as matrix 2 (1699 genes). From matrix 2, a smaller subset of
OGs optimized for gene occupancy was extracted, resulting in matrix 3 (850 genes). The full
supermatrix (matrix 1) was also optimized using the programs MARE (Meyer, Meusemann &
Misof, 2011) and BaCoCa (Base Composition Calculator; Kück & Struck, 2014). MARE
assesses the supermatrix by partition, providing a measure of tree-likeness for each gene and
optimizes the supermatrix for information content. The full supermatrix was optimized with an
alpha value of 5, to produce matrix 7 (1488 genes, 58 taxa). From the MARE-reduced matrix,
genes having no missing partitions for any of the remaining taxa (n=50) were extracted to form a
starting matrix for the BEAST analyses (details below). Matrix assessment was also conducted
using BaCoCa, which provides a number of descriptive supermatrix statistics for evaluating bias
in amino acid composition and patterns in missing data. This program was used to assess for
patterns of non-random clusters of sequences in the data, which could potentially mislead
phylogenetic analyses. Matrix 4 represents a 50 % reduction of the full supermatrix using
BaCoCa derived values for phylogenetically informative sites as a guide; essentially reducing
missing data from absent partitions and gaps. This matrix is similar, but not identical to matrix
10
2. Matrix 5 resulted from application of arthropod core OGs from Bond et al. (2014) to the
extended taxon set. Matrix 6 represents the full spider core OG matrix (matrix 1) with
Stegodyphus pruned from the tree. OGs for each matrix were concatenated using FASconCAT
(Kück & Meusemann, 2010).
Phylogenetics
Table 2 summarizes run parameters of the seven individual maximum likelihood analyses
conducted for each of the supermatrices. We selected the optimal tree for each supermatrix using
the computer program ExaML ver. 3.0.1 (Kozlov, Aberer & Stamatakis, 2015). Models of amino
acid substitution were selected using the AUTOF command in ExaML. Bootstrap data sets and
starting parsimony trees for each matrix were generated using RAxML (Stamatakis, 2014) and
each individually analyzed in ExaML. We generated 225-300 replicates for each matrix which
were then used to construct a majority-rule bootstrap consensus tree; a custom python script was
used to automate the process and write a bash script to execute the analyses on a high-
performance computing (HPC) cluster. The arthropod core OG bootstrap analysis was conducted
using RAxML. All analyses were conducted on the Auburn University CASIC HPC and Atrax
(Bond Lab, Auburn University).
A coalescent-based method as implemented in ASTRAL (Accurate Species TRee
ALgorithm; Mirarab et al., 2014) was used to infer a species tree from a series of unrooted gene
trees. The ASTRAL approach is thought to be more robust to incomplete lineage sorting, or deep
coalescence, than maximum likelihood analysis of concatenated matrices and works quickly on
genome-scale datasets (Mirarab et al., 2014). We first constructed individual gene trees for all
partitions contained within matrix 1. Gene trees were generated using ML based on 100 RAxML
random addition sequence replicates followed by 100 bootstrap replicates (Table 2). Subsequent
11
species tree estimation was inferred using ASTRAL v4.7.6, from all individual unrooted gene
trees (and bootstrap replicates), under the multi-species coalescent model.
A chronogram was inferred in a Bayesian framework under an uncorrelated lognormal
relaxed clock model (Drummond et al., 2006, Drummond, 2007) using Beast v1.8.1 (Drummond
et al., 2012). For this analysis we used 43 partitions of a matrix which included complete
partitions for all taxa derived from the MARE-optimized matrix 7. The model of protein
evolution for each partition was determined using the perl script ProteinModelSelection.pl in
RAxML. BEAST analyses were run separately for each partition using eight calibration points
based on fossil data. The most recent common ancestor (MRCA) of Mesothelae + all remaining
spiders was given a lognormal prior of (mean in real space) 349 Ma (SD=0.1) based on the
Mesothelae fossil Palaeothele montceauensis (Selden, 1996). The MRCA of extant
araneomorphs was given a lognormal prior of (mean in real space) 267 Ma (SD=0.2) based on
the fossil Triassaraneus andersonorum (Selden et al., 1999). The MRCA of extant
mygalomorphs was given a lognormal prior of (mean in real space) 278 Ma (SD=0.1) based on
the fossil Rosamygale grauvogeli (Selden & Gall, 1992). The MRCA of Haplogynae +
Hypochilidae was given a lognormal prior of (mean in real space) 278 Ma (SD=0.1) based on the
fossil Eoplectreurys gertschi (Selden & Penney, 2010). The MRCA of Deinopoidea (cribellate
orb-weavers) was given a lognormal prior of (mean in real space) 195 Ma (SD=0.3) based on the
fossil Mongolarachne jurassica (Selden, Shih & Ren, 2013). The MRCA of ecribellate orb-
weavers was given a lognormal prior of (mean in real space) 168 Ma (SD=0.4) based on the
fossil Mesozygiella dunlopi (Penney & Ortu, 2006). The MRCA of Nemesiidae, excluding
Damarchus, was given a lognormal prior of (mean in real space) 168 Ma (SD=0.4) based on the
nemesiid fossil Cretamygale chasei (Selden, 2002). Finally, the MRCA of Antrodiaetidae was
12
given a lognormal prior of (mean in real space) 168 Ma (SD=0.4) based on the fossil
Cretacattyma raveni (Eskov & Zonstein, 1990). Two or more independent Markov Chain Monte
Carlo (MCMC) searches were performed until a parameter effective sample size (ESS) >200 was
achieved. ESS values were examined in Tracer v1.5. Independent runs for each partition were
assembled with LogCombiner v1.7.5 and 10 % percent of generations were discarded as burn-in.
Tree files for each partition where then uniformly sampled to obtain 10,000 trees. A total of
430,000 trees (10,000 trees from each partition) were assembled with LogCombiner v1.7.5 and a
consensus tree was produced using TreeAnnotator v1.8.1. A chronogram containing all taxa was
generated using a penalized likelihood method in r8s v1.8 (Sanderson, 2002). The 95 % highest
posterior density dates obtained for the BEAST analysis were incorporated as constraints for
node ages of the eight fossil calibrated nodes. The analysis was performed using the TN
algorithm, cross validation of branch-length variation and rate variation modeled as a gamma
distribution with an alpha shape parameter.
To detect diversification rate shifts, we performed a Bayesian analysis of diversification
in BAMM (Bayesian Analysis of Macroevolutionary Mixtures; Rabosky et al., 2014). For this
analysis we used the chronogram obtained by the r8s analysis in order to maximize taxon
sampling. To account for non-random missing speciation events, we quantified the percentage of
taxa sampled per family (World Spider Catalog, 2015) and incorporated these into the analysis.
We also accounted for missing families sampled at various taxonomic levels. The MCMC chain
was run for 100,000,000 generations, with sampling every 10,000 generations. Convergence
diagnostics were examined using coda (Plummer et al., 2006) in R. Ten percent of the runs were
discarded as burn-in. The 95 % credible set of shift configurations was plotted in the R package
BAMMtools (Rabosky et al., 2014).
13
Character state reconstructions of web type following Blackledge et al. (2009) were
performed using a maximum likelihood approach. The ML approach was implemented using the
rayDISC command in the package corHMM (Beaulieu, O’Meara & Donoghue, 2013) in R
(Ihaka & Gentleman, 1996). This method allows for multistate characters, unresolved nodes, and
ambiguities (polymorphic taxa or missing data). Three models of character evolution were
evaluated under the ML method: equal rates (ER), symmetrical (SYM) and all rates different
(ARD). A likelihood-ratio test was performed to select among these varying models of character
evolution.
Results:
Summary of Genomic Data
Twenty-one novel spider transcriptomes were sequenced, with an average of 72,487
assembled contigs (contiguous sequences) ranging from 6,816 (Diguetia sp.) to 191,839
(Segestria sp.); specimen data and transcriptome statistics for each sample are summarized in
Supplemental Tables S1 and S2 respectively. Median contig length for the novel transcriptomes
was 612 bp. The complete taxon set, including spider and outgroup transcriptomes from the SRA
database, had an average contig number of 53,740 and a range of 5,158 (Paratropis sp.) to
202,311 (Amaurobius ferox) with a median contig length of 655. The newly constructed spider-
specific core ortholog group (OG) set contained 4,934 OGs, more than three times the number of
arthropod core orthologs used in a prior spider analysis Bond et al. (2014) and represents a
significant step forward in generating a pool of reasonably well-vetted orthologs for spider
phylogenomic analyses. The arthropod and spider core orthology sets had 749 groups in
common; 4,185 OGs in the spider core were novel. Of the spider-core groups, 4,249 (86 %) were
14
present in the sequenced genome of our HaMStR reference taxon of choice Acanthoscurria
geniculata (Sanggaard et al., 2014) and were retained for use in downstream ortholog detection.
The number of TransDecoder predicted proteins and ortholog detection success for each taxon is
summarized in Table S2. Annotations for the arthropod set can be found in Bond et al. (2014);
Supplemental Table S3 summarizes gene annotations for the spider core ortholog set generated
for this study. Our new HaMStR spider core ortholog set and Acanthoscurria geniculata BLAST
database file can be downloaded from the Dryad Data Repository at doi:10.5061/dryad.6p072.
Phylogenetic Analyses
Seven super matrices were generated for downstream non time-calibrated analyses (Fig.
2), one drawn from the arthropod core set and six using the spider core set. Data set sizes,
summarized in Table 2, ranged from a maximum of 3,398 OGs with a higher percentage of
missing cells (38.5%), 850 OGs with 19.6% missing, to 549 OGs (arthropod core set) with 33%
missing data. Two matrices were generated using automated filtering approaches implemented
by BaCoCa (Kuck & Struck, 2014) and MARE (Meyer, Meusemann & Misof, 2011). In BaCoCa
we sorted partitions using number of informative sites, capturing the top half (~1700 OGs) of the
matrix containing the most informative sites. RCFV values generated by BaCoCa were <0.05 for
all taxa in all partitions for each of the matrices, indicating homogeneity in base composition.
Additionally, there was no perceptible taxonomic bias observed in shared missing data (Figs. S1-
S6). The MARE optimized matrix comprised 58 taxa and 1,488 genes with 19.6% missing data.
For graphical representations of gene occupancy for each matrix, see Figures S7-S12. Blast2GO
(Conesa et al., 2005) gene ontology distributions of molecular function for OGs recovered from
both the spider and arthropod ortholog sets (Figs. S13 and S14) can be found in the supplemental
materials.
15
Our phylogenetic analyses (see Table 2 and Discussion), the results of which are
summarized in Figure 2, consistently recover many well-supported monophyletic groups:
Araneae, Mygalomorphae, Araneomorphae, Synspermiata (i.e., Haplogynae excluding
Filistatidae and Leptonetidae), Entelegynae, the RTA clade, Dionycha, and Lycosoidea. Within
Mygalomorphae, Atypoidina and Avicularioidea are monophyletic; Nemesiidae is polyphyletic.
Filistatidae (Kukulcania) emerges as the sister group to Hypochilus. Interestingly, Leptonetidae
emerges as the sister group to Entelegynae. Eresidae is sister to Araneoidea, similar to findings
of Miller et al. (2010). Deinopoidea is polyphyletic. Oecobiidae is sister to Uloboridae, which are
together sister to Deinopidae plus the RTA clade. Homalonychidae and by implication the entire
Zodarioidea (Miller et al., 2010), is sister to Dionycha plus Lycosoidea. Hahniidae, represented
by the cryphoecine Calymmaria, is sister to Dictynidae. Thomisidae belongs in Lycosoidea as
proposed by Homann (1971) and Polotow, Carmichael & Griswold (2015) (see also Ramirez,
2014). Coalescent-based species-tree analysis in ASTRAL employed unrooted gene trees based
on the 3,398 gene matrix as input and inferred a well-supported tree (most nodes >95 % bs; Fig.
3). With few exceptions the topology recovered using this approach was congruent with the
likelihood-based supermatrix analysis. Conflicting nodes, some corresponding to key
araneomorph lineages, which were moderately to weakly supported in concatenated analyses, are
summarized in Figure 2.
A chronogram based on 43 partitions with no missing data (matrix 7, see Table 2) is
shown in Figure 4. MRCA divergence time estimates are summarized in Table 3: Mesothelae -
Opisthothelae at 340 Ma (95 % CI[287-398]); Mygalomorphae - Araneomorphae at 308 Ma (95
% CI[258-365]); Synspermiata + Hypochilidae - Entelegynae at 276 Ma (95 % CI[223-330]);
RTA + Deinopoidea - Stegodyphus + Araneoidea at 214 Ma (95 % CI[154-280]); RTA -
16
Dionycha at 138.8 Ma (Fig. 4). Diversification rate shift analysis estimated three instances of
significant diversification shifts within spiders (95 % credibility). The highest rate shift is within
the RTA + Dionycha + Lycosoidea (Fig. 5) followed by Avicularioidea and within Araneoidea (f
= 0.23; 0.21; Fig. 5).
Maximum likelihood ancestral state reconstruction of web type (Fig. 6) shows that the
spider common ancestor likely foraged from a subterranean burrow, sometimes sealed by a
trapdoor. The ancestral condition for araneomorphs may have been a stereotypical aerial sheet.
Entelegynae ancestors probably spun orbs, which were subsequently lost at least three times.
RTA taxa largely abandoned webs to become hunting spiders. Precise location of these character
state shifts depends upon sufficient sampling; denser sampling reduces the number of
unobserved evolutionary events. While this analysis contains only 47 of 114 spider families, the
sequence and overall mapping to the spider backbone phylogeny is strongly supported.
Discussion:
Our phylogenomic analyses represent the largest assessment of spider phylogeny to date
using genomic data, both in terms of taxa and number of orthologs sampled. Our results are
largely congruent with earlier work (Bond et al., 2014): we recover all of the major backbone
lineages (Mygalomorphae, Araneomorphae, RTA, etc.), but reiterate that our understanding of
spider evolutionary pattern and process needs thorough reconsideration. This expanded study
reinforces the ancient origin of the orb web hypothesis (Bond et al., 2014) and shows that rates
of spider species diversification appear to be associated with web change or loss – or with
modification of the male palp rather than the origin of the orb web. It shows that the Haplogynae
are polyphyletic with Filistatidae as sister to Hypochilidae and Leptonetidae as sister to
17
Entelegynae. It also suggests a position for two enigmatic families – Hahniidae and
Homalonychidae – and provides an alternate view of RTA relationships and the contents of
Dionycha clade.
Data Characteristics and Development of Spider Core Orthologs
Transcriptome analyses are unquestionably data rich. Thousands of assembled sequences
emerge from even modest RNA-seq experiments, providing, among other things, a basis for
identifying phylogenetically informative orthologs. This bounty comes with a few caveats.
Isoforms, paralogous sequences, and assembly artifacts (chimeric contigs) can mislead inference
of single-copy orthologous genes. The data represent one snapshot – a specific organism, point in
time, and combination of tissues – that can lead to gaps in downstream supermatrices due to
stochastic sampling issues. Large amounts of missing data, due to missing loci and indels
introduced during alignment, can arise post-assembly in the ortholog detection and filtering
stages of phylogenomic analyses (Bond et al., 2014; Fernandez, Hormiga & Giribet, 2014).
Lemmon et al. (2009) and a number of other authors (Roure, Baurain & Philippe, 2013;
Dell’Ampio et al., 2014; Xia, 2014) have discussed the potential negative effects of such missing
data in large phylogenomic (transcriptome-based) datasets. Recent studies argue that the
phylogenetic signal from transcriptomes can conflict with alternative reduced representation
approaches like targeted sequence capture (Jarvis et al., 2014; Brandley et al., 2015; Prum et al.,
2015). From vast amounts of bird genome protein-coding data, Jarvis et al. (2014) concluded that
these loci were not only insufficient (low support values), but also misleading due to
convergence and high levels of incomplete lineage sorting during rapid radiations.
Simulation studies now predict that 10’s-100’s of loci will resolve most phylogenies,
albeit sensitive to factors such as population size or speciation tempos (Knowles & Kubatko,
18
2011; Leache & Rannala, 2011; Liu & Yu, 2011). To mitigate the impacts of paralogy,
incomplete lineage sorting, and missing data, we developed a priori a set of spider core
orthologs that comprise a database consisting of over 4,500 genes that are expected to be
recovered from most whole spider RNA extractions and are likely orthologous. We summarize
the annotations for each of the genes in the HaMStR pHMM file in Supplemental table S3.
Our approach enhances repeatability, downstream assessment, scalability (taxon
addition), and data quality. Studies that employ pure clustering approaches like OMA stand-
alone (Altenhoff et al., 2013) may produce more data (i.e., more “genes”) on the front end;
however, they present some problems in terms of ease of scalability. Although adding more
genes is one strategy, it is increasingly clear that taxon sampling and data quality are also very
important (Lemmon & Lemmon, 2013; Bond et al., 2014).
A Modified View of Spider Evolution and Key Innovations
Once considered the “crowning achievement of aerial spiders” (Gertsch, 1979), the orb
web and consequent adaptive radiation of araneoid spiders (ecribellate orb weavers and their
relatives) captured the imagination of spider researchers for over a century. The evolution of
adhesive threads and the vertical orientation of the orb web, positioned to intercept and retain
flying insects, has been long considered a “key innovation” that allowed spiders to inhabit a new
adaptive zone (Bond & Opell, 1998). It is important to note that several prior authors speculated
about orb web adaptive value, such as Levi (1980), Opell (1979), Opell (1982), and Coddington
(1986) although Bond & Opell (1998) quantified the pattern in a formal phylogenetic framework.
Over 25 % of all spider species are araneoids. Given orb weaver monophyly on quantitative
phylogenies (Griswold et al., 1998; Blackledge et al., 2009), rigorous empirical studies tended to
confirm the orb as a prime cause of spider diversification (Bond & Opell, 1998). Nevertheless, a
19
lack of correlation of the orb web and species richness has been apparent for some time.
Griswold et al. (1998) noted that over 50 % of Araneoidea no longer build recognizable orb webs
and suggested that “the orb web has been an evolutionary base camp rather than a summit.”
Bond et al. (2014) tested two alternative evolutionary scenarios for orb web evolution,
reflecting different analytical results; parsimony implied multiple independent origins, and
maximum likelihood implied one origin and subsequent multiple losses. The current study (Fig.
6) favors the latter: the orb evolves at the base of the araneoid + deinopoid + RTA clade, but is
lost at least three times independently. Large amounts of morphological and behavioral data
(albeit often correlated with features essential to the orb) still support the single origin hypothesis
(Coddington, 1986; Coddington, 1991; Scharff & Coddington, 1997; Griswold et al., 1998;
Agnarsson, Coddington & Kuntner, 2013). Our results suggest both that the orb web originated
earlier than previously supposed, and that heretofore-unsuspected clades of spiders descend from
orb weavers. In a sense, this ancient origin hypothesis reconciles the implications of genomic
data with the classical evidence for multiple, homologous, complex, co-adapted character
systems.
Recent discoveries of large, cribellate orb web-weaving taxa from the late Triassic agree
with our molecular dates. Diverse Mesozoic deinopoids (Selden, Ren & Shih, 2015) are
consistent with the “orb web node” at 213 Ma (Fig. 4, Table 3). Under this view, modern
uloborids and deinopids are distinct remnants of this diverse group. Selden, Ren & Shih (2015)
previously noted that if other extant taxa “emerged from the deinopoid stem or crown group it
would render the whole-group Deinopoidea paraphyletic”; we discuss this scenario in detail
below.
20
Contrary to the contemporary paradigm that the evolution of the orb web and adhesive
sticky threads elevated rates of diversification among the araneoid spiders, our BAMM analysis
(Fig. 5) indicates that the highest rates of diversification likely occurred among the RTA spiders
followed by mygalomorphs and then araneoids as a distant third, the latter driven--in part--by the
secondarily non-orb weaving theridiids and linyphiids. These results imply that other foraging
strategies (e.g. cursorial hunting and irregular sheets) were a more “successful” strategy than the
orb. Indeed, the point estimate for the RTA node during the early Cretaceous (138.8 Ma; Fig. 4
and Table 3) precedes the subsequent diversification of the RTA clade at 125-100 Ma.
This date coincides with the Cretaceous Terrestrial Revolution (KTR). Angiosperms
radiated extensively at 125-90 Ma (Crane & Friis, 1987; Wang, Zhang & Jarezembowski, 2013),
as did various plant-dependent insect lineages, including beetles (McKenna et al., 2009;
McKenna et al., 2015), lepidopterans (Wahlberg, Wheat & Pena, 2013), ants (Moreau et al.,
2006), and holometabolous insects in general (Misof et al., 2014), although some insect lineages
do not show a pulse (e.g., darkling beetles; Kergoat et al., 2014). Spiders, as important insect
predators, may also have diversified rapidly along with their prey (e.g., Penney, Wheater &
Selden, 2003; Penalver, 2006; Selden & Penney, 2010). The fossil and phylogenomic data
presented here show that most spider lineages predate the KTR (Selden & Penney, 2010; Bond et
al., 2014). Among these, the RTA clade especially, but also mygalomorphs and araneoids,
diversified in response to the KTR insect pulse. That aerial web spinners specialized on rapidly
radiating clades of flying insects is hardly surprising. Similarly, if forest litter habitats became
more complex and spurred insect diversification (Moreau et al., 2006), ground-dwelling spiders
may also have diversified at unusual rates. Perhaps the most dramatic change in insect
abundances occurred with the origin and early diversification of social insects that today
21
dominate animal biomass on the planet (Holldobler & Wilson, 1990) and beetles (McKenna et
al., 2015). Both groups date back to 150-125 my and diversified during the KTR (LaPolla,
Dlussky & Perrichot, 2013; Ward, 2014; Legendre et al., 2015). A major increase in these insect
groups may have favoured spiders that feed on cursorial prey and thus could help explain the
concurrent increase in diversification in the RTA clade, mygalomorphs, and non-orb weaving
araneoids such as cobweb weavers (Dziki et al., 2015).
Taken together, this new evidence on character evolution, divergence estimates, and rates
of diversification indicates that previous conclusions regarding the timing and rate of spider
evolution were imprecise. Our data support an ancient orb web hypothesis that is further
bolstered by a wealth of fossil data showing that a cribellate deinopoid stem group likely
diversified during the early Mesozoic. Molecular divergence clock estimates are consistent with
the placement of the orb web further down the tree as well as suggesting that some of the greatest
rates of species diversification coincided with the KTR. The latter suggests that spiders took
advantage of increased abundance of cursorial prey. These findings likely diminish the
hypothesis proposed by Bond & Opell (1998) that the vertically oriented orb web represented a
key innovation, particularly in light of the fact that over half of araneoid species do not build an
orb web (e.g. Theridiidae and Linyphiidae; noted by Griswold et al., 1998; Fernandez, Hormiga
& Giribet, 2014). We already knew that major orb web-weaving groups are very successful in
spite of abandoning the orb (Blackledge et al., 2009).
Spider Systematics
Although our results show that many classical ideas in spider systematics require revision
(e.g. mygalomorph families, Haplogynae, paleocribellates, higher araneoids, and RTA +
dionychan lineages), they also robustly support many classical taxonomic concepts. Since Raven
22
(1985), Mygalomorphae (Table 1, Node 4) has continuously represented a challenge to spider
systematics. As discussed by Hedin & Bond (2006) and Bond et al. (2012), nearly half the
families are probably non-monophyletic. While our sampling here and previously (Bond et al.,
2014) is far greater than any other published phylogenomic study (e.g., Fernandez, Hormiga &
Giribet, 2014 included just one theraphosid), taxon sampling remains insufficient to address
major issues aside from deeper level phylogenetic problems. However, the data (Fig. 2) support
Euctenizidae as a monophyletic family, but not Nemesiidae. As indicated in Bond et al. (2014),
the once controversial Atypoidina (Node 5) consistently has strong statistical support in all
analyses. Alternatively, the placement of paratropidids, ctenizids, and idiopids remains
questionable and warrants further sampling.
The traditional view of spider classification (Coddington, 2005) places Paleocribellatae
and Austrochiloidea (Table 1) as sister groups to all the remaining Araneomorphae taxa –
Haplogynae and Entelegynae; the latter terms are used primarily herein as clade names rather
than specific reference to genitalic condition. Our current tree (Fig. 2) is congruent with Bond et
al. (2014) in placing Paleocribellatae (Table 1, Hypochilus); Fig. 1, Node 9) as sister to
Haplogynae. Filistatidae (Kukulcania), which is placed as sister to the ecribellate haplogynes
(Synspermiata lineage as proposed in Michalik & Ramirez, 2014), pairs with Hypochilus as in
Bond et al. (2014). This arrangement suggests that characters formerly considered “primitive” to
araneomorphs, for example, mobile leg three cribellate silk carding, might instead be a
synapomorphy for the new hypochilid-filistatid clade. Remaining haplogyne relationships are
somewhat congruent with previously published analyses (Ramirez, 2000; Michalik & Ramirez,
2014). However, one of the more intriguing results is the placement of the morphologically
intermediate “haplogyne” (Table 1) Calileptoneta (Leptonetidae) as sister to Entelegynae,
23
suggesting that leptonetids may represent intermediate genitalic forms between haplogyne and
the relatively more complex entelegyne condition (Ledford & Griswold, 2010). As outlined by
Ledford & Griswold (2010), a number of previous analyses (Platnick et al., 1991; Ramirez,
2000; Griswold et al., 2005) discussed the “rampant” homoplasy required to place leptonetids
(sister to Telemidae) among haplogynes and suggest two possible scenarios – leptonetids are
proto-entelegynes, or they are the sister group to the remaining Haplogynae. Our phylogenomic
analyses support the former hypothesis favored by Ledford & Griswold (2010), and puts the
discovery of the cribellate Archoleptoneta into better phylogenetic context. Additionally, these
results provide further support for the concept of Synspermiata as proposed by Michalik &
Ramirez (2014) and represent a robust phylogenetic framework for understanding the evolution
of entelegyne genitalia.
Our reconstruction of araneoid relationships departs dramatically from the traditional
classification scheme and a number of recently published molecular systematic studies (e.g.,
Blackledge et al., 2009; Dimitrov et al., 2012). Theridiidae (cobweb spiders) is sister to the
remaining araneoids as opposed to occupying a more derived position within that clade.
Comparisons to Dimitrov et al. (2012) should be viewed with caution: that analysis contained a
large suite of taxa not included here, and many results of that analysis had only weak support.
Nevertheless, our phylogenomic data agree in supporting the close relationship between
Mysmenidae, Mimetidae, and Tetragnathidae. We also retain the more inclusive linyphioids as
close relatives of Araneidae + Nephilidae as in Dimitrov et al. (2012). Unlike that study, we
recover nesticids sister to linyphioids (Pimoidae plus Linyphiidae) rather than theridiids:
Theridioid (Theridiidae and Nesticidae) diphyly is a surprising result, which has already been
shown with standard markers by Agnarsson, Coddington & Kuntner (2013). Theridioids have
24
strikingly similar spinning organs and tarsus IV comb for throwing silk, but are otherwise
genitalically distinct. Clearly relationships among the derived araneoids require more intensive
sampling, especially of missing families (Theridiosomatidae, Malkaridae, Anapidae, etc.) to
adequately resolve their phylogeny.
The addition of nearly 30 terminals to the Bond et al. (2014) dataset corroborates the non-
monophyly of the classically defined Orbiculariae, although the orb and its behavioral,
morphological, and structural constituents may be homologous. Deinopoidea, with these data, is
polyphyletic (see also Dimitrov et al., 2012). Instead, a new clade, Uloboridae + Oecobiidae, is
sister to Deinopidae + the RTA clade. Bootstrap support was consistently low for the node
dividing these two groupings in all analyses except matrix 6 (Fig. 2), which omits the eresid
exemplar Stegodyphus and matrix 8, the ASTRAL analysis. The placement of the two eresoid
taxa (Table 1), Stegodyphus and Oecobius continues to present difficulties here as in previous
published phylogenomic studies (Miller et al., 2010). Fernandez, Hormiga & Giribet (2014)
found alternative placements for Oecobius whereas Bond et al. (2014) typically recovered
Stegodyphus as the sister group to all entelegynes (recovered here as the sister group to
araneoids) and Oecobius as a member of a clade comprising uloborid and deinopid exemplars,
but with notably lower support. Disparities between the two analyses may be attributed to
differences in taxon sampling. On the other hand, increased taxon sampling across the tree
diminished node support in some places. However, it is worth noting that support was very
strong in the ASTRAL species tree analysis, suggesting that while there may be some conflict
among individual data partitions there is an overwhelming amount of signal in the data for a
Deinopoidea + RTA relationship. This trend was noted by Bond et al. (2014) who found that
only 2.4 % of all bootstrap replicates recovered a monophyletic Orbiculariae. Based on these
25
data and the putative rapid diversification that occurred once the orb web was abandoned, it is
clear that resolving relationships at this point in spider evolutionary history remains a challenge.
Finally, Bond et al. (2014) and Agnarsson, Coddington & Kuntner (2013) recovered an
unexpected relationship between eresoid taxa and deinopoids that consistently rendered the
Deinopoidea paraphyletic or polyphyletic if Oecobius was included in the analysis. Our results,
here including an additional uloborid exemplar, still confirm Deinopoidea polyphyly. Perhaps
careful examination of Oecobius web morphology and spinning behavior may provide
independent corroboration of this molecular signal.
Although all of our analyses recover a monophyletic RTA clade, relationships among its
members reflect some departure from the traditional view of RTA phylogeny but are largely
consistent with a more recent morphology-based study. We recover a clade that comprises a mix
of agelenoids (Agelenidae, Desidae, and Amphinectidae) as a sister group to Dictynidae +
Hahniidae and Amaurobiidae. The taxonomic composition of Dictynidae, Hahniidae and
Amaurobiidae, as well as their phylogenetic placement, remains problematic and in a state of
flux (Coddington, 2005; Spagna, Crews & Gillespie, 2010; Miller et al., 2010). The typical
hahniine hahniids have been difficult to place due to their long branches (Spagna & Gillespie,
2008, Miller et al., 2010). Calymmaria, has been moved into “Cybaeidae s.l.” by Spagna Crews
& Gillespie (2010), suggesting that the relationships among hahniids, cybaeids, and dictynids
need further scrutiny.
Amaurobiids have also been hard to place, though this is in part because Amaurobiidae
are a moving target. The term “Amaurobiids” needs to be clarified, as most of nine subfamilies
discussed in Lehtinen (1967) are now placed elsewhere. We use Callobius, from the type
subfamily of the family. Our amaurobiid placement, basal to an agelenoid and dictynoid
26
grouping corroborates previous findings (Miller et al., 2010; Spagna, Crews & Gillespie, 2010).
Dictynids on the other hand were considered one of the unresolved sister groups to
amaurobioids, zodarioids, and dionychans (Spagna, Crews & Gillespie, 2010). Here the
placement of our dictynid exemplar Cicurina is more precise: sister group to the hahniid
Calymmaria (as in Miller et al., 2010).
We also recover Homalonychidae (representing Zodarioidea) as the sister group to
dionychans and lycosoids, once again, mirroring the results of Agnarsson, Coddington &
Kuntner (2013). Previously Zodarioidea was placed closer to the base of the RTA clade (Miller
et al., 2010). Dionychans here include salticids, anyphaenids, corinnids, and gnaphosids whereas
crab spiders (Thomisidae) nest with the lycosoids containing a paraphyletic Pisauridae.
Placement of Thomisidae within Lycosoidea goes back at least to Homann (1971) and was
formally established by Bayer & Schonhofer (2013) and the total evidence analysis of Polotow,
Carmichael & Griswold, 2015). Although Ramirez (2014) placed Thomisidae outside of
Lycosoidea, in one of his slightly suboptimal results thomisids were included in Lycosoidea. The
relationships we recover among dionychan and lycosoid taxa are largely congruent with those
inferred by Ramirez (2014) in a massive morphological study of Dionycha and RTA exemplars.
Given the general incongruence among previous morphological and molecular spider systematic
studies, it will be interesting to see how Ramirez (2014) phylogeny and familial-level
reevaluations compare as phylogenomic studies expand. Raven (1985) was a landmark study for
mygalomorphs; perhaps Ramirez (2014) may serve in the same capacity for one of the most
diverse branches on the spider tree of life.
27
Conclusions:
Following Coddington & Levi (1991), higher-level spider classification underwent a
series of challenges from quantitative studies of morphology, producing provocative but weakly-
supported hypotheses (Griswold et al., 1998; Griswold et al., 2005). Total evidence studies, for
example, Wood, Griswold & Gillespie (2012a; Wood et al. (2012b) for Palpimanoidea, Polotow,
Carmichael & Griswold (2015) for Lycosoidea, and Bond et al. (2012) for Mygalomorphae
appear to have settled some local arrangements, but much of the backbone of the spider tree of
life remains an open question only to be solved through increased taxon sampling.
Phylogenomics has already brought data-rich, convincing solutions to long standing
controversies, for example, phylogeny of the orb web (Bond et al., 2014; Fernandez, Hormiga &
Giribet, 2014). Phylogenomics portends a new and exciting period for spider evolutionary
biology. Recent advances in digital imaging, proteomics, silk biology and major fossil
discoveries mean that our understanding of spider evolution will likely accelerate by leaps and
bounds in the coming years. The tempo and mode of spider evolution is likely different than
previously thought. At this point it seems reasonably clear that the orb web evolved earlier
phylogenetically than previously thought, only to be subsequently lost at least three times
independently during the Cretaceous. While the orb web has certainly been successful, a likely
dramatic increase in the abundances of cursorial insects during the KTR, also impacted the
success of other foraging strategies, including webless hunting. Our results and that of others like
Ramirez (2014) show that spider systematics remains a work in progress with many questions
yet to be answered.

28
Data Availability:
Illumina transcriptome sequence data are available from the NCBI short read archive (SRA) as
BioProject PRJNA306047 (accession numbers SAMN04453329-SAMN04453350).
Phylogenomics data matrices were deposited on 5 February 2016 in the Dryad Digital
Repository at doi:10.5061/dryad.6p072. Supplemental Figures are available online with the
publication: https://doi.org/10.7717/peerj.1719/supp-1 - https://doi.org/10.7717/peerj.1719/supp-
19.
29
References: Agnarsson I, Coddington JA, Kuntner M. 2013. Systematics—progress in the study of spider
diversity and evolution. In: Penney D, ed. Spider research in the 21st century: trends and perspectives. Manchester: Siri Scientific Press, 58–111.
Altenhoff AM, Gil M, Gonnet GH, Dessimoz C. 2013. Inferring hierarchical orthologous groups from orthologous gene pairs. PLoS ONE 8(1):e53786 DOI 10.1371/journal.pone.0053786.
Altschul SF, Gish W, Miller W, Myers EW, Lipman DJ. 1990. Basic local alignment search tool. Journal of Molecular Biology 215:403–410 DOI 10.1016/S0022-2836(05)80360-2.
Bayer S, Schönhofer AL. 2013. Phylogenetic relationships of the spider family psechridae inferred from molecular data, with comments on the lycosoidea (arachnida: Araneae). Invertebrate Systematics 27(1):53–80 DOI 10.1071/IS12017.
Beaulieu JM, O’Meara BC, Donoghue MJ. 2013. Identifying hidden rate changes in the evolution of a binary morphological character: the evolution of plant habit in cam- panulid angiosperms. Systematic Biology 62(5):725–737 DOI 10.1093/sysbio/syt034.
Blackledge TA, Kuntner M, Agnarsson I. 2011. The form and function of spider orb webs: evolution from silk to ecosystems. In: Casas J, ed. Advances in insect physiology. Vol. 41. Burlington: Academic Press, 175–262.
Blackledge TA, Scharff N, Coddington JA, Szüts T, Wenzel JW, Hayashi CY, Agnarsson I. 2009. Reconstructing web evolution and spider diversification in the molecular era. Proceedings of the National Academy of Sciences of the United States of America 106(13):5229–5234 DOI 10.1073/pnas.0901377106.
Bond JE, Garrison NL, Hamilton CA, Godwin RL, Hedin M, Agnarsson I. 2014. Phylogenomics resolves a spider backbone phylogeny and rejects a prevailing paradigm for orb web evolution. Current Biology 24(15):1765–1771 DOI 10.1016/j.cub.2014.06.034.
Bond JE, Hendrixson BE, Hamilton CA, Hedin M. 2012. A reconsideration of the classification of the spider infraorder mygalomorphae (arachnida: Araneae) based on three nuclear genes and morphology. PLoS ONE 7(6):e38753 DOI 10.1371/journal.pone.0038753.
Bond JE, Opell BD. 1998. Testing adaptive radiation and key innovation hypotheses in spiders. Evolution 52(2):403–414 DOI 10.2307/2411077.
Brandley MC, Bragg JG, Singhal S, Chapple DG, Jennings CK, Lemmon AR, Lemmon EM, Thompson MB, Moritz C. 2015. Evaluating the performance of anchored hybrid enrichment at the tips of the tree of life: a phylogenetic analysis of Aus- tralian Eugongylus group scincid lizards. BMC Evolutionary Biology 15(62) DOI 10.1186/s12862-015-0318-0.
30
Coddington J. 1986. The monophyletic origin of the orb web. In: Shear W, ed. Spiders: webs, behavior, and evolution. Stanford, California: Stanford University Press, 319–363.
Coddington JA. 1991. Cladistics and spider classification: araneomorph phylogeny and the monophyly of orbweavers (Araneae: Araneomorphae; Orbiculariae). Acta Zoologica Fennica 190:75–87.
Coddington JA. 2005. Phylogeny and classification of spiders. In: Ubick P, Paquin P, Cushing P, Roth V, eds. Spiders of North America: an identification manual. American Arachnological Society, 18–24.
Coddington JA, Levi HW. 1991. Systematics and evolution of spiders (Araneae). Annual Review of Ecology and Systematics 22:565–592 DOI 10.1146/annurev.es.22.110191.003025.
Conesa A, Götz S, García-Gómez JM, Terol J, Talón M, Robles M. 2005. Blast2go: a universal tool for annotation, visualization and analysis in functional genomics research. Bioinformatics 21(18):3674–3676 DOI 10.1093/bioinformatics/bti610.
Crane P. 1987. The origin of angiosperms and their biological consequences. In: Friis E, Chaloner W, Crane P, eds. Vegetational consequences of the angiosperm diversification. Cambridge: Cambridge University Press, 105–144.
Dell’Ampio E, Meusemann K, Szucsich NU, Peters RS, Meyer B, Borner J, Petersen M, Aberer AJ, Stamatakis A, Walzl MG, Minh BQ, Von Haeseler A, Ebersberger I, Pass G, Misof B. 2014. Decisive data sets in phylogenomics: lessons from studies on the phylogenetic relationships of primarily wingless insects. Molecular Biology and Evolution 31(1):239–249 DOI 10.1093/molbev/mst196.
Dicko C, Porter D, Bond J, Kenney JM, Vollrath F. 2008. Structural disorder in silk proteins reveals the emergence of elastomericity. Biomacromolecules 9(1):216–221 DOI 10.1021/bm701069y.
Dimitrov D, Lopardo L, Giribet G, Arnedo MA, Alvarez-Padilla F, Hormiga G. 2012. Tangled in a sparse spider web: single origin of orb weavers and their spinning work unravelled by denser taxonomic sampling. Proceedings of the Royal Society B: Biological Sciences 279(1732):1341–1350 DOI 10.1098/rspb.2011.2011.
Drummond AJ, Ho S Y W, Phillips MJ, Rambaut A. 2006. Relaxed phylogenetics and dating with confidence. PLoS Biology 4(5):e88 DOI 10.1371/journal.pbio.0040088.
Drummond AJ, Rambaut A. 2007. BEAST: Bayesian evolutionary analysis by sampling trees. BMC Evolutionary Biology 7(1):214 DOI 10.1186/1471-2148-7-214.
Drummond AJ, Suchard MA, Xie D, Rambaut A. 2012. Bayesian phylogenetics with BEAUti and the BEAST 1.7. Molecular Biology and Evolution 29(8):1969–1973 DOI 10.1093/molbev/mss075.
31
Dziki A, Binford G, Coddington JA, Agnarsson I. 2015. Spintharus flavidus in the caribbean–a 30 million year biogeographical history and radiation of a ‘widespread species’. PeerJ PrePrints 3:e1639 DOI 10.7287/peerj.preprints.1332v1.
Ebersberger I, Strauss S, Von Haeseler A. 2009. HaMStR: profile hidden markov model based search for orthologs in ESTs. BMC Evolutionary Biology 9(1):157 DOI 10.1186/1471-2148-9-157.
Eddy SR. 2011. Accelerated profile HMM searches. PLoS Computational Biology 7(10):e1002195 DOI 10.1371/journal.pcbi.1002195.
Eskov KY, Zonstein S. 1990. First Mesozoic mygalomorph spiders from the Lower Cretaceous of Siberia and Mongolia, with notes on the system and evolution of the infraorder Mygalomorphae (Chelicerata: Araneae). Neues Jahrbuch für Geologie und Paläontologie, Abhandlungen 178:325–368.
Fernández R, Hormiga G, Giribet G. 2014. Phylogenomic analysis of spiders reveals nonmonophyly of orb weavers. Current Biology 24(15):1772–1777 DOI 10.1016/j.cub.2014.06.035.
Garb J. 2013. Spider silk: an ancient biomaterial for the 21st century. In: Penney D, ed. Spider research in the 21st century: trends and perspectives. Manchester, UK: Siri Scientific Press, 252–281.
Gertsch WJ. 1979. American spiders. Second edition. New York: Van Nostrand Reinhold Co.
Grabherr MG, Haas BJ, Yassour M, Levin JZ, Thompson DA, Amit I, Adiconis X, Fan L, Raychowdhury R, Zeng Q, Chen Z, Mauceli E, Hacohen N, Gnirke A, Rhind N, Di Palma F, Birren BW, Nusbaum C, Lindblad-Toh K, Friedman N, Regev A. 2011. Full-length transcriptome assembly from RNA-Seq data without a reference genome. Nature Biotechnology 29(7):644–652 DOI 10.1038/nbt.1883.
Griswold CE, Coddington JA, Hormiga G, Scharff N. 1998. Phylogeny of the orb-web building spiders (Araneae, Orbiculariae: Deinopoidea, Araneoidea). Zoological Journal of the Linnean Society 123(1):1–99 DOI 10.1111/j.1096-3642.1998.tb01290.x.
Griswold CE, Ramírez M, Coddington J, Platnick N. 2005. Atlas of phylogenetic data for entelegyne spiders (Araneae: araneomorphae: Entelegynae), with comments on their phylogeny. Procceedings of the California Academy of Sciences 56:1–324.
Haas BJ, Papanicolaou A, Yassour M, Grabherr M, Blood PD, Bowden J, Couger MB, Eccles D, Li B, Lieber M, MacManes MD, Ott M, Orvis J, Pochet N, Strozzi F, Weeks N, Westerman R, William T, Dewey CN, Henschel R, LeDuc RD, Friedman N, Regev A. 2013. De novo transcript sequence reconstruction from RNA-seq using the Trinity platform for reference generation and analysis. Nature Protocols 8(8):1494–1512 DOI 10.1038/nprot.2013.084.
32
Hedin M, Bond JE. 2006. Molecular phylogenetics of the spider infraorder Mygalo- morphae using nuclear rRNA genes (18s and 28s): conflict and agreement with the current system of classification. Molecular Phylogenetics and Evolution 41(2):454–471 DOI 10.1016/j.ympev.2006.05.017.
Homann H. 1971. Die Augen der Araneae. Zeitschrift für Morphologie der Tiere 69(3):201–272 DOI 10.1007/BF00277623.
Hormiga G, Griswold CE. 2014. Systematics, phylogeny, and evolution of orb-weaving spiders. Annual Review of Entomology 59(1):487–512 DOI 10.1146/annurev-ento-011613-162046.
Hölldobler B, Wilson EO. 1990. The ants. Cambridge: Belknap Press.
Ihaka R, Gentleman R. 1996. R: a language for data analysis and graphics. Journal of Computational and Graphical Statistics 5(3):299–314.
Jarvis ED, Mirarab S, Aberer AJ, Li B, Houde P, Li C, Ho SY, Faircloth BC, Nabholz B, Howard JT, Suh A, Weber CC, Da Fonseca RR, Li J, Zhang F, Li H, Zhou L, Narula N, Liu L, Ganapathy G, Boussau B, Bayzid MS, Zavidovych V, Subramanian S, Gabaldon T, Capella-Gutierrez S, Huerta-Cepas J, Rekepalli B, Munch K, Schierup M, Lindow B, Warren WC, Ray D, Green RE, Bruford MW, Zhan X, Dixon A, Li S, Li N, Huang Y, Derryberry EP, Bertelsen MF, Sheldon FH, Brumfield RT, Mello CV, Lovell PV, Wirthlin M, Schneider MPC, Prosdocimi F, Samaniego JA, Velazquez AMV, Alfaro-Nunez A, Campos PF, Petersen B, Sicheritz-Ponten T, Pas A, Bailey T, Scofield P, Bunce M, Lambert DM, Zhou Q, Perelman P, Driskell AC, Shapiro B, Xiong Z, Zeng Y, Liu S, Li Z, Liu B, Wu K, Xiao J, Yinqi X, Zheng Q, Zhang Y, Yang H, Wang J, Smeds L, Rheindt FE, Braun M, Fjeldsa J, Orlando L, Barker FK, Jonsson KA, Johnson W, Koepfli K-P, O’Brien S, Haussler D, Ryder OA, Rahbek C, Willerslev E, Graves GR, Glenn TC, McCormack J, Burt D, Ellegren H, Alstrom P, Edwards SV, Stamatakis A, Mindell DP, Cracraft J, Braun EL, Warnow T, Jun W, Gilbert MTP, Zhang G. 2014. Whole-genome analyses resolve early branches in the tree of life of modern birds. Science 346(6215):1320–1331 DOI 10.1126/science.1253451.
Katoh K. 2005. MAFFT version 5: improvement in accuracy of multiple sequence alignment. Nucleic Acids Research 33(2):511–518 DOI 10.1093/nar/gki198.
Kergoat GJ, Soldati L, Anne-Laure C, Jourdan H, Jabbour-Zahab R, Genson G, Bouchard P, Condamine FL. 2014. Higher level molecular phylogeny of darkling beetles (Coleoptera: Tenebrionidae): Darkling beetle phylogeny. Systematic Entomol- ogy 39(3):486–499 DOI 10.1111/syen.12065.
King GF, Hardy MC. 2013. Spider-venom peptides: structure, pharmacology, and potential for control of insect pests. Annual Review of Entomology 58(1):475–496 DOI 10.1146/annurev-ento-120811-153650.
Knowles LL, Kubatko LS. 2011. Estimating species trees: practical and theoretical aspects. John Wiley and Sons.
33
Kocot KM, Cannon JT, Todt C, Citarella MR, Kohn AB, Meyer A, Santos SR, Schander C, Moroz LL, Lieb B, Halanych KM. 2011. Phylogenomics reveals deep molluscan relationships. Nature 477(7365):452–456 DOI 10.1038/nature10382.
Kocot ML, Citarella M, Halanych K. 2013. PhyloTreePruner: a phylogenetic tree-based approach for selection of orthologous sequences for phylogenomics. Evolutionary Bioinformatics 9:429–435 DOI 10.4137/EBO.S12813.
Kozlov AM, Aberer AJ, Stamatakis A. 2015. ExaML version 3: a tool for phy- logenomic analyses on supercomputers. Bioinformatics 31(15):2577–2579 DOI 10.1093/bioinformatics/btv184.
Kück P. 2009. ALICUT: a Perlscript which cuts ALISCORE identified RSS. version, 2. Bonn, Germany: Department of Bioinformatics, Zoologisches Forschungsmuseum A. Koenig (ZFMK).
Kück P, Meusemann K. 2010. FASconCAT: convenient handling of data matrices. Molec- ular Phylogenetics and Evolution 56(3):1115–1118 DOI 10.1016/j.ympev.2010.04.024.
Kück P, Struck TH. 2014. BaCoCa—a heuristic software tool for the parallel assessment of sequence biases in hundreds of gene and taxon partitions. Molecular Phylogenetics and Evolution 70:94–98 DOI 10.1016/j.ympev.2013.09.011.
LaPolla JS, Dlussky GM, Perrichot V. 2013. Ants and the fossil record. Annual Review of Entomology 58(1):609–630 DOI 10.1146/annurev-ento-120710-100600.
Leache AD, Rannala B. 2011. The accuracy of species tree estimation under simulation: a comparison of methods. Systematic Biology 60(2):126–137 DOI 10.1093/sysbio/syq073.
Ledford JM, Griswold CE. 2010. A study of the subfamily Archoleptonetinae (Araneae, Leptonetidae) with a review of the morphology and relationships for the Leptoneti- dae. Zootaxa 2391:1–32.
Legendre F, Nel A, Svenson GJ, Robillard T, Pellens R, Grandcolas P. 2015. Phylogeny of dictyoptera: dating the origin of cockroaches, praying mantises and termites with molecular data and controlled fossil evidence. PLoS ONE 10(7):e0130127 DOI 10.1371/journal.pone.0130127.
Lehtinen PT. 1967. Classification of the cribellate spiders and some allied families, with notes on the evolution of the suborder Araneomorpha. In: Annales zoologici fennici. Societas Zoologica Botanica Fennica Vanamo, 199–468.
Lemmon AR, Brown JM, Stanger-Hall K, Lemmon EM. 2009. The effect of ambiguous data on phylogenetic estimates obtained by maximum likelihood and Bayesian inference. Systematic Biology 58(1):130–145 DOI 10.1093/sysbio/syp017.
34
Lemmon EM, Lemmon AR. 2013. High-throughput genomic data in systematics and phylogenetics. Annual Review of Ecology, Evolution, and Systematics 44(1):99–121 DOI 10.1146/annurev-ecolsys-110512-135822.
Levi HW. 1980. Orb-webs: primitive or specialized. In: Gruber J,ed. Proceedings of the 8th international congress of arachnology, 367–370.
Li L, Stoeckert CJ, Roos DS. 2003. OrthoMCL: identification of ortholog groups for eukaryotic genomes. Genome Research 13(9):2178–2189 DOI 10.1101/gr.1224503.
Liu L, Yu L. 2011. Estimating species trees from unrooted gene trees. Systematic Biology 60(5):661–667 DOI 10.1093/sysbio/syr027.
McKenna DD, Sequeira AS, Marvaldi AE, Farrell BD. 2009. Temporal lags and overlap in the diversification of weevils and flowering plants. Proceedings of the National Academy of Sciences of the United States of America 106(17):7083–7088 DOI 10.1073/pnas.0810618106.
Mckenna DD, Wild AL, Kanda K, Bellamy CL, Beutel RG, Caterino MS, Farnum CW, Hawks DC, Ivie MA, Jameson ML, Leschen RAB, Marvaldi AE, Mchugh JV, Newton AF, Robertson JA, Thayer MK, Whiting MF, Lawrence JF, lipiski A, Maddison DR, Farrell BD. 2015. The beetle tree of life reveals that coleopteran survived end-permian mass extinction to diversify during the cretaceous terrestrial revolution. Systematic Entomology 40(4):835–880 DOI 10.1111/syen.12132.
Meyer B, Meusemann K, Misof B. 2011. MARE: MAtrix REduction—a tool to select optimized data subsets from supermatrices for phylogenetic inference. Bonn (Germany): Zentrum fuur molekulare Biodiversitätsforschung (zmb) am ZFMK . Version 01.2-rc. Available at http:// mare.zfmk.de.
Michalik P, Ramírez MJ. 2014. Evolutionary morphology of the male reproductive system, spermatozoa and seminal fluid of spiders (Araneae, Arachnida) – Current knowledge and future directions. Arthropod Structure & Development 43(4):291–322 DOI 10.1016/j.asd.2014.05.005.
Miller JA, Carmichael A, Ramírez MJ, Spagna JC, Haddad CR, Řezáč M, Johan- nesen J, Král J, Wang X-P, Griswold CE. 2010. Phylogeny of entelegyne spi- ders: Affinities of the family Penestomidae (NEW RANK), generic phylogeny of Eresidae, and asymmetric rates of change in spinning organ evolution (Araneae, Araneoidea, Entelegynae). Molecular Phylogenetics and Evolution 55(3):786–804 DOI 10.1016/j.ympev.2010.02.021.
Mirarab S, Reaz R, Bayzid MS, Zimmermann T, Swenson MS, Warnow T. 2014. ASTRAL: genome-scale coalescent-based species tree estimation. Bioinformatics 30(17):i541–i548 DOI 10.1093/bioinformatics/btu462.
Misof B, Liu S, Meusemann K, Peters RS, Donath A, Mayer C, Frandsen PB, Ware J, Flouri T, Beutel RG, Niehuis O, Petersen M, Izquierdo-Carrasco F, Wappler T, Rust J, Aberer AJ,
35
Aspock U, Aspock H, Bartel D, Blanke A, Berger S, Bohm A, Buckley TR, Calcott B, Chen J, Friedrich F, Fukui M, Fujita M, Greve C, Grobe P, Gu S, Huang Y, Jermiin LS, Kawahara AY, Krogmann L, Kubiak M, Lanfear R, Letsch H, Li Y, Li Z, Li J, Lu H, Machida R, Mashimo Y, Kapli P, McKenna DD,
Meng G, Nakagaki Y, Navarrete-Heredia JL, Ott M, Ou Y, Pass G, Podsiadlowski L, Pohl H, Von Reumont BM, Schutte K, Sekiya K, Shimizu S, Slipinski A, Stamatakis A, Song W, Su X, Szucsich NU, Tan M, Tan X, Tang M, Tang J, Timelthaler G, Tomizuka S, Trautwein M, Tong X, Uchifune T, Walzl MG, Wiegmann BM, Wilbrandt J, Wipfler B, Wong TKF, Wu Q, Wu G, Xie Y, Yang S, Yang Q, Yeates DK, Yoshizawa K, Zhang Q, Zhang R, Zhang W, Zhang Y, Zhao J, Zhou C, Zhou L, Ziesmann T, Zou S, Li Y, Xu X, Zhang Y, Yang H, Wang J, Wang J, Kjer KM, Zhou X. 2014. Phylogenomics resolves the timing and pattern of insect evolution. Science 346(6210):763–767 DOI 10.1126/science.1257570.
Misof B, Misof K. 2009. A monte carlo approach successfully identifies randomness in multiple sequence alignments: a more objective means of data exclusion. Systematic Biology 58(1):21–34 DOI 10.1093/sysbio/syp006.
Moreau CS, Bell CD, Vila R, Archibald SB, Pierce NE. 2006. Phylogeny of the ants: diversification in the age of angiosperms. Science 312(5770):101–104 DOI 10.1126/science.1124891.
Opell B. 1979. Revision of the genera and tropical American species of the spider family Uloboridae. Revisión de los géneros de las especies americanas tropicales de arañas de la familia Uloboridae. Bulletin of the Museum of Comparative Zoology 148(10):443–549.
Opell BD. 1982. Post-hatching development and web production of Hyptiotes cavatus (Hentz) (Araneae, Uloboridae). Journal of Arachnology 10:185–191.
Peñalver E. 2006. Early cretaceous spider web with its prey. Science 312(5781):1761–1761 DOI 10.1126/science.1126628.
Penney D, Ortuño VM. 2006. Oldest true orb-weaving spider (Araneae: Araneidae). Biology Letters 2(3):447–450 DOI 10.1098/rsbl.2006.0506.
Penney D, Wheater CP, Selden PA. 2003. Resistance of spiders to Cretaceous-Tertiary extinction events. Evolution 57(11):2599–2607.
Platnick NI, Coddington JA, Forster RR, Griswold CE. 1991. Spinneret morphology and the phylogeny of haplogyne spiders (Araneae, Araneomorphae). American Museum noviates 3016:1–76.
Plummer M, Best N, Cowles K, Vines K. 2006. CODA: Convergence diagnosis and output analysis for MCMC. R News 6(1):7–11.
36
Polotow D, Carmichael A, Griswold CE. 2015. Total evidence analysis of the phylo- genetic relationships of Lycosoidea spiders (Araneae, Entelegynae). Invertebrate Systematics 29(2):124 DOI 10.1071/IS14041.
Price MN, Dehal PS, Arkin AP, et al. 2010. FastTree 2-approximately maximum- likelihood trees for large alignments. PLoS ONE 5(3):e9490 DOI 10.1371/journal.pone.0009490.
Prum RO, Berv JS, Dornburg A, Field DJ, Townsend JP, Lemmon EM, Lemmon AR. 2015. A comprehensive phylogeny of birds (Aves) using targeted next-generation DNA sequencing. Nature 526(7574):569–573 DOI 10.1038/nature15697.
Rabosky DL, Donnellan SC, Grundler M, Lovette IJ. 2014. Analysis and Visualization of Complex Macroevolutionary Dynamics: an example from Australian Scincid Lizards. Systematic Biology 63(4):610–627 DOI 10.1093/sysbio/syu025.
Ramírez MJ. 2000. Respiratory system morphology and the phylogeny of haplogyne spiders (Araneae, Araneomorphae). Journal of Arachnology 28(2):149–157 DOI 10.1636/0161-8202(2000)028[0149:RSMATP]2.0.CO;2.
Ramírez MJ. 2014. The morphology and phylogeny of dionychan spiders (Araneae: Araneomorphae). Bulletin of the American Museum of Natural History 390(1):1–374 DOI 10.1206/821.1.
Raven RJ. 1985. The Spider Infraorder Mygalomorphae (Araneae): Cladistics and systematics. Bulletin of the American Museum of Natural History 182(1):1–184.
Rice P, Longden I, Bleasby A, et al. 2000. EMBOSS: the European molecular biology open software suite. Trends in genetics 16(6):276–277 DOI 10.1016/S0168-9525(00)02024-2.
Roure B, Baurain D, Philippe H. 2013. Impact of missing data on phylogenies inferred from empirical phylogenomic data sets. Molecular Biology and Evolution 30(1):197–214 DOI 10.1093/molbev/mss208.
Saez NJ, Senff S, Jensen JE, Er SY, Herzig V, Rash LD, King GF. 2010. Spider-venom peptides as therapeutics. Toxins 2(12):2851–2871 DOI 10.3390/toxins2122851.
Sanderson MJ. 2002. Estimating absolute rates of molecular evolution and diver- gence times: a penalized likelihood approach. Molecular Biology and Evolution 19(1):101–109 DOI 10.1093/oxfordjournals.molbev.a003974.
Sanggaard KW, Bechsgaard JS, Fang X, Duan J, Dyrlund TF, Gupta V, Jiang X, Cheng L, Fan D, Feng Y, Han L, Huang Z, Wu Z, Liao L, Settepani V, Thøgersen IB, Vanthournout B, Wang T, Zhu Y, Funch P, Enghild JJ, Schauser L, Andersen SU, Villesen P, Schierup MH, Bilde T, Wang J. 2014. Spider genomes provide insight into composition and evolution of venom and silk. Nature Communications 5(3765) DOI 10.1038/ncomms4765.
37
Schacht K, Scheibel T. 2014. Processing of recombinant spider silk proteins into tailor- made materials for biomaterials applications. Current Opinion in Biotechnology 29:62–69 DOI 10.1016/j.copbio.2014.02.015.
Scharff N, Coddington JA. 1997. A phylogenetic analysis of the orb-weaving spider family Araneidae (Arachnida, Araneae). Zoological Journal of the Linnean Society 120(4):355–434 DOI 10.1111/j.1096-3642.1997.tb01281.x.
Selden PA. 1996. First fossil mesothele spider, from the Carboniferous of France. Revue suisse de Zoologie 2:585–596.
Selden PA. 2002. First British Mesozoic spider, from Cretaceous amber of the Isle of Wight, southern England. Palaeontology 45:973–983 DOI 10.1111/1475-4983.00271.
Selden PA, Anderson JM, Anderson HM, Fraser NC. 1999. Fossil araneomorph spiders from the Triassic of South Africa and Virginia. Journal of Arachnology 27:401–414.
Selden PA, Gall J-C. 1992. A Triassic mygalomorph spider from the northern Vosges, France. Palaeontology 35:211–235.
Selden PA, Penney D. 2010. Fossil spiders. Biological Reviews 85(1):171–206. Selden PA, Ren D, Shih C. 2015. Mesozoic cribellate spiders (araneae: Deinopoidea) from china. Journal of Systematic Palaeontology 14:1–26.
Selden PA, Shih C, Ren D. 2013. A giant spider from the Jurassic of China reveals greater diversity of the orbicularian stem group. Naturwissenschaften 100(12):1171–1181 DOI 10.1007/s00114-013-1121-7.
Spagna JC, Crews SC, Gillespie RG. 2010. Patterns of habitat affinity and Austral/Hol- arctic parallelism in dictynoid spiders (Araneae:Entelegynae). Invertebrate Systematics 24(3):238–257 DOI 10.1071/IS10001.
Spagna JC, Gillespie RG. 2008. More data, fewer shifts: Molecular insights into the evo- lution of the spinning apparatus in non-orb-weaving spiders. Molecular Phylogenetics and Evolution 46(1):347–368 DOI 10.1016/j.ympev.2007.08.008.
Stamatakis A. 2014. RAxML version 8: a tool for phylogenetic analysis and post-analysis of large phylogenies. Bioinformatics 30(9):1312–1313 DOI 10.1093/bioinformatics/btu033.
Starrett J, Garb JE, Kuelbs A, Azubuike UO, Hayashi CY. 2012. Early events in the evolution of spider silk genes. PLoS ONE 7(6):e38084 DOI 10.1371/journal.pone.0038084.
Wahlberg N, Wheat CW, Peña C. 2013. Timing and patterns in the taxonomic di- versification of Lepidoptera (Butterflies and Moths). PLoS ONE 8(11):e80875 DOI 10.1371/journal.pone.0080875.
Wang B, Zhang H, Jarzembowski EA. 2013. Early Cretaceous angiosperms and beetle evolution. Frontiers in Plant Science 4(360):1–6 DOI 10.3389/fpls.2013.00360.
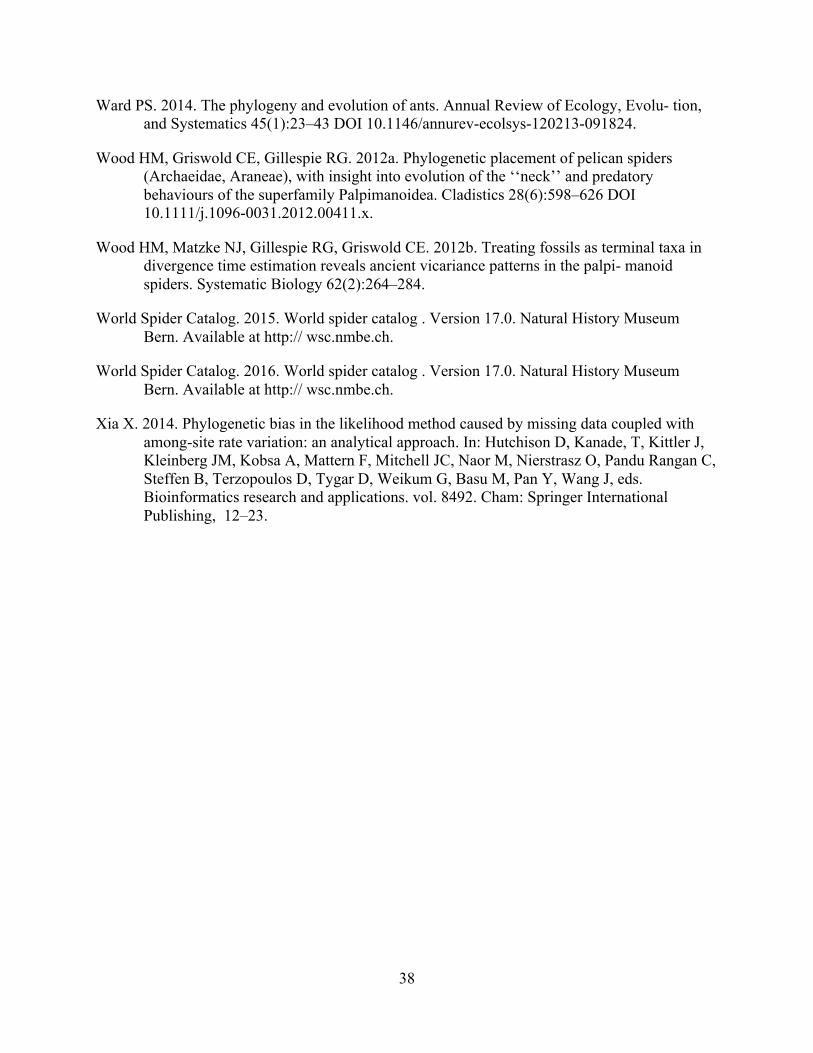
38
Ward PS. 2014. The phylogeny and evolution of ants. Annual Review of Ecology, Evolu- tion, and Systematics 45(1):23–43 DOI 10.1146/annurev-ecolsys-120213-091824.
Wood HM, Griswold CE, Gillespie RG. 2012a. Phylogenetic placement of pelican spiders (Archaeidae, Araneae), with insight into evolution of the ‘‘neck’’ and predatory behaviours of the superfamily Palpimanoidea. Cladistics 28(6):598–626 DOI 10.1111/j.1096-0031.2012.00411.x.
Wood HM, Matzke NJ, Gillespie RG, Griswold CE. 2012b. Treating fossils as terminal taxa in divergence time estimation reveals ancient vicariance patterns in the palpi- manoid spiders. Systematic Biology 62(2):264–284.
World Spider Catalog. 2015. World spider catalog . Version 17.0. Natural History Museum Bern. Available at http:// wsc.nmbe.ch.
World Spider Catalog. 2016. World spider catalog . Version 17.0. Natural History Museum Bern. Available at http:// wsc.nmbe.ch.
Xia X. 2014. Phylogenetic bias in the likelihood method caused by missing data coupled with among-site rate variation: an analytical approach. In: Hutchison D, Kanade, T, Kittler J, Kleinberg JM, Kobsa A, Mattern F, Mitchell JC, Naor M, Nierstrasz O, Pandu Rangan C, Steffen B, Terzopoulos D, Tygar D, Weikum G, Basu M, Pan Y, Wang J, eds. Bioinformatics research and applications. vol. 8492. Cham: Springer International Publishing, 12–23.
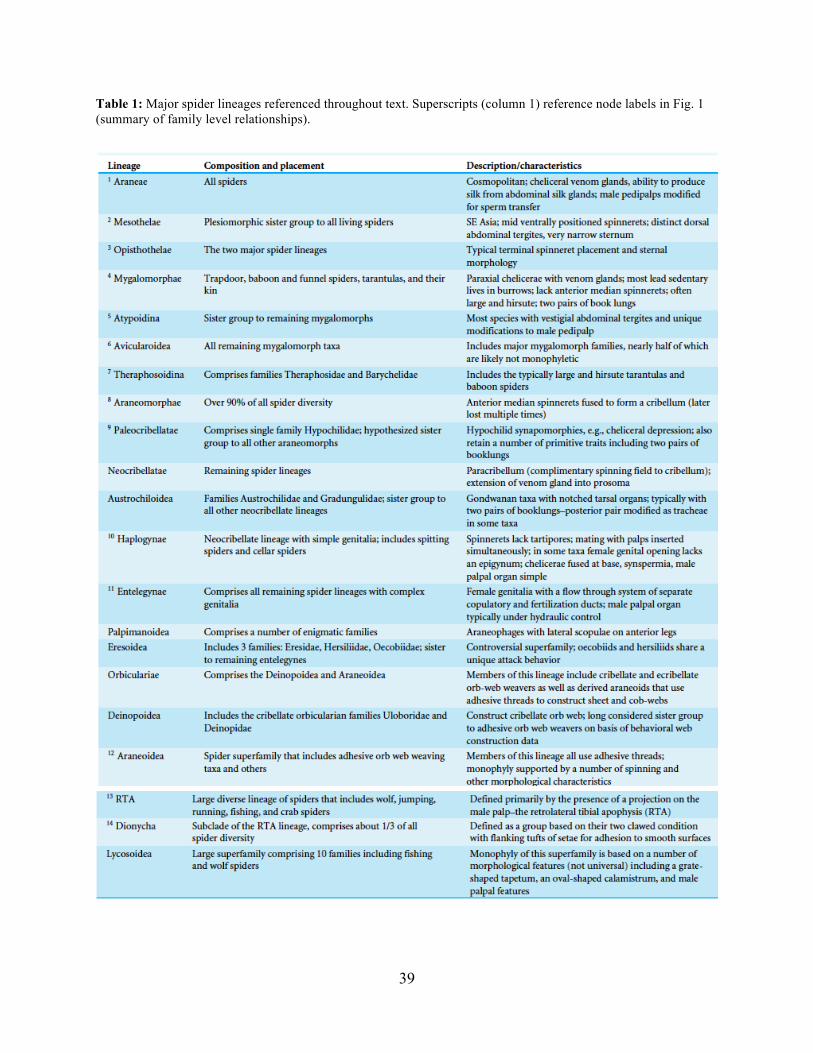
39
Table 1: Major spider lineages referenced throughout text. Superscripts (column 1) reference node labels in Fig. 1 (summary of family level relationships).
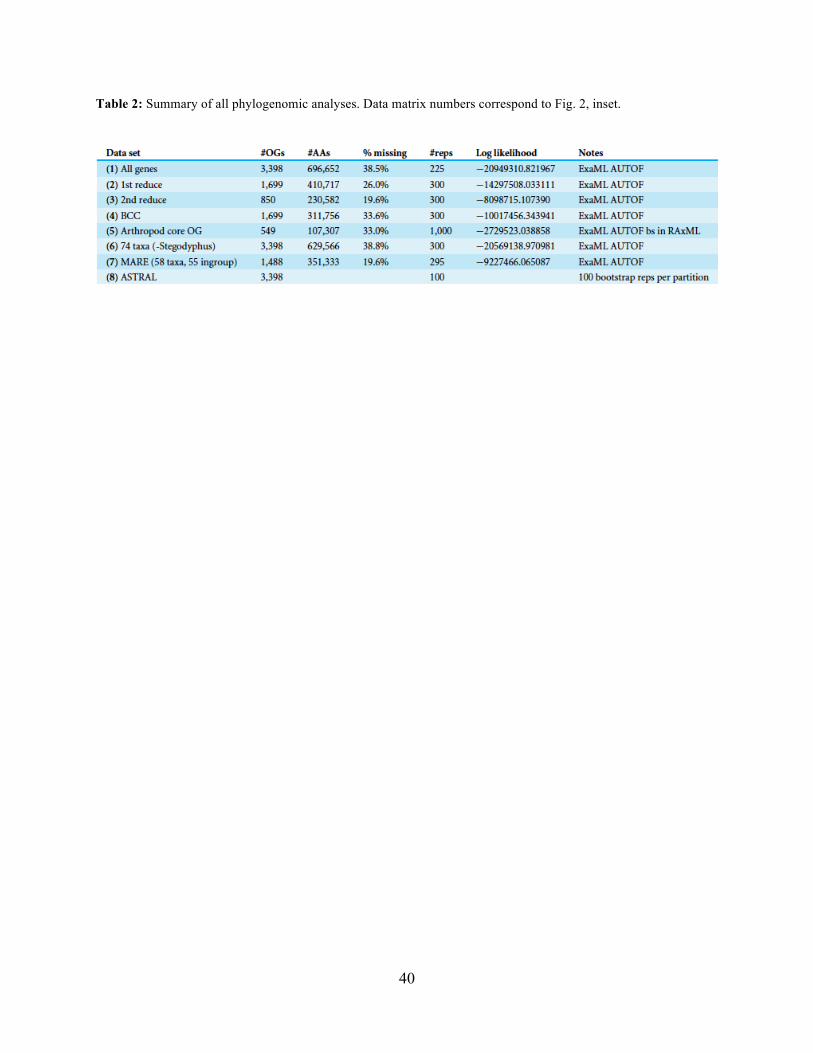
40
Table 2: Summary of all phylogenomic analyses. Data matrix numbers correspond to Fig. 2, inset.
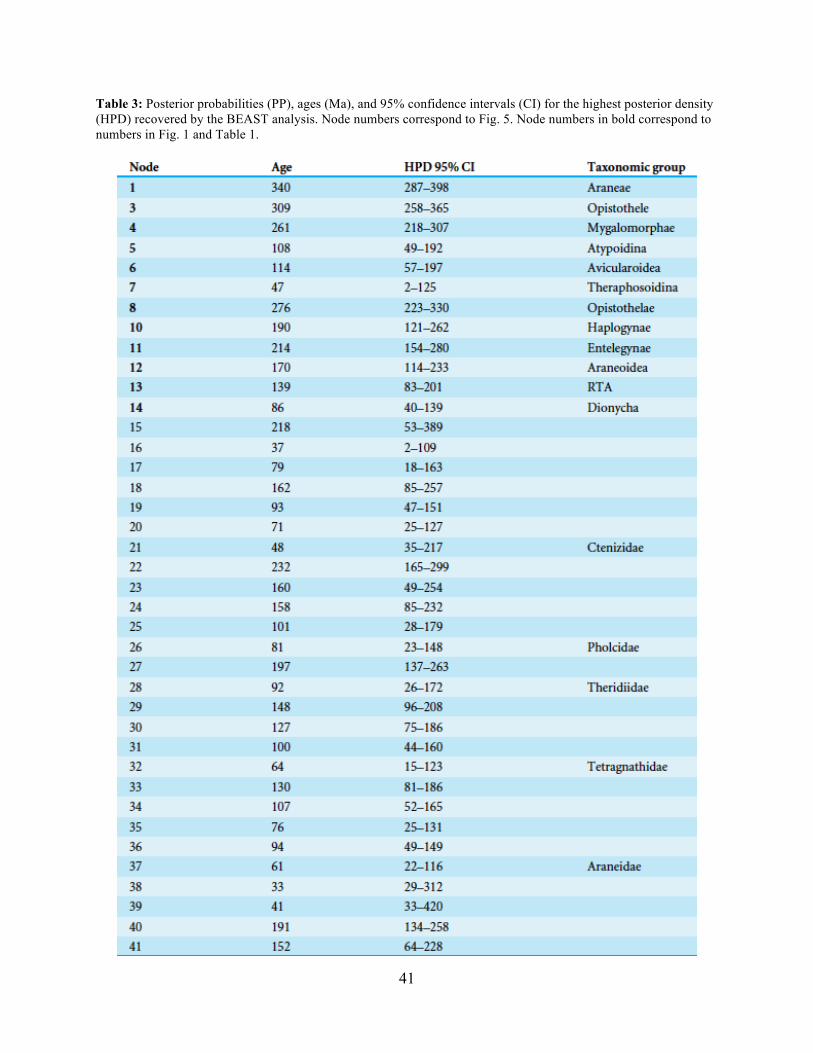
41
Table 3: Posterior probabilities (PP), ages (Ma), and 95% confidence intervals (CI) for the highest posterior density (HPD) recovered by the BEAST analysis. Node numbers correspond to Fig. 5. Node numbers in bold correspond to numbers in Fig. 1 and Table 1.
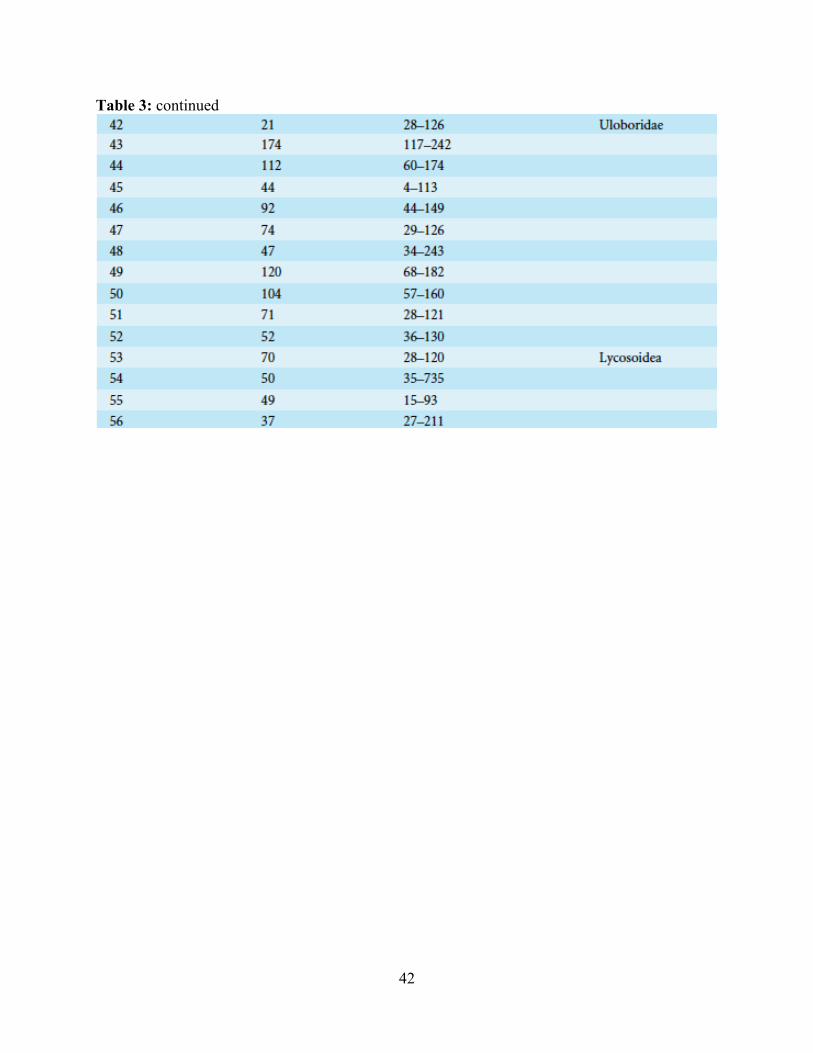
42
Table 3: continued
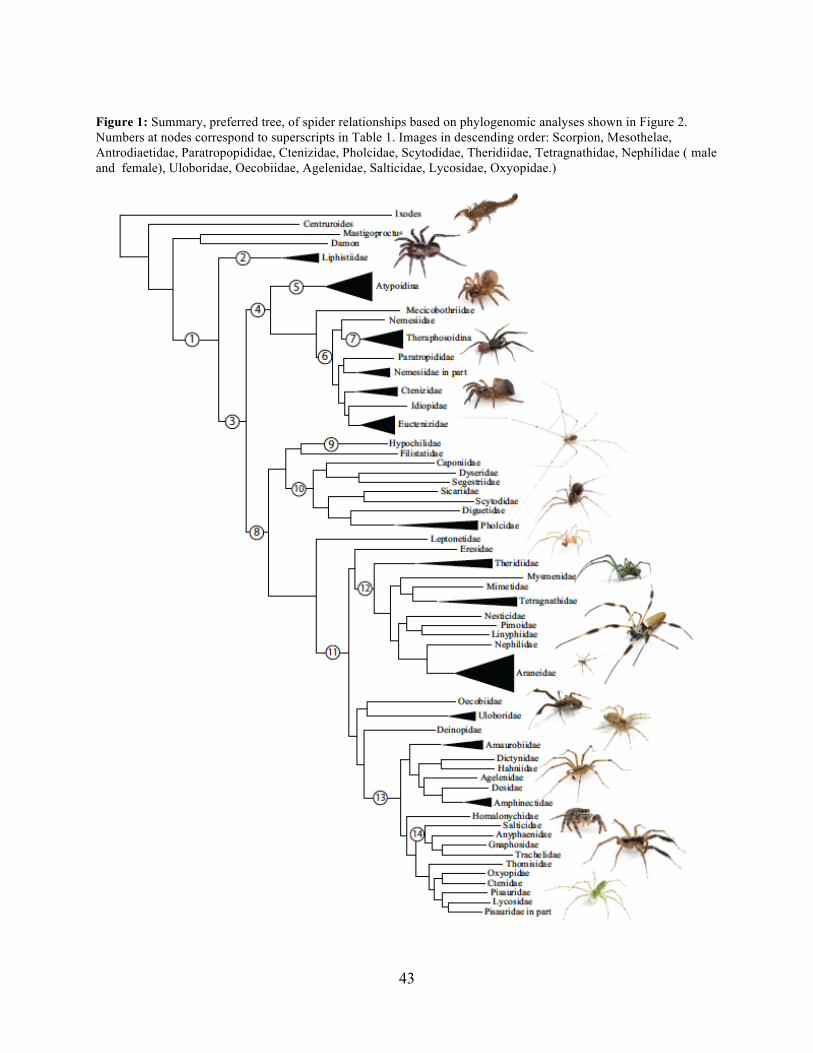
43
Figure 1: Summary, preferred tree, of spider relationships based on phylogenomic analyses shown in Figure 2. Numbers at nodes correspond to superscripts in Table 1. Images in descending order: Scorpion, Mesothelae, Antrodiaetidae, Paratropopididae, Ctenizidae, Pholcidae, Scytodidae, Theridiidae, Tetragnathidae, Nephilidae ( male and female), Uloboridae, Oecobiidae, Agelenidae, Salticidae, Lycosidae, Oxyopidae.)
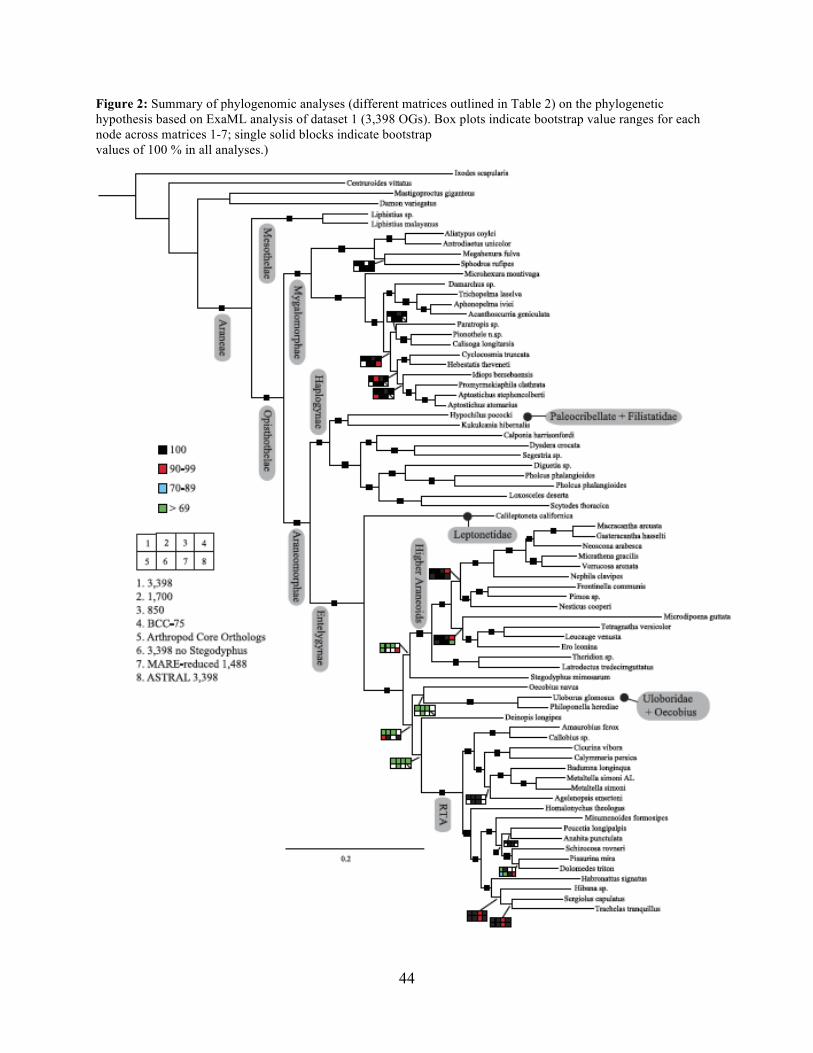
44
Figure 2: Summary of phylogenomic analyses (different matrices outlined in Table 2) on the phylogenetic hypothesis based on ExaML analysis of dataset 1 (3,398 OGs). Box plots indicate bootstrap value ranges for each node across matrices 1-7; single solid blocks indicate bootstrap values of 100 % in all analyses.)
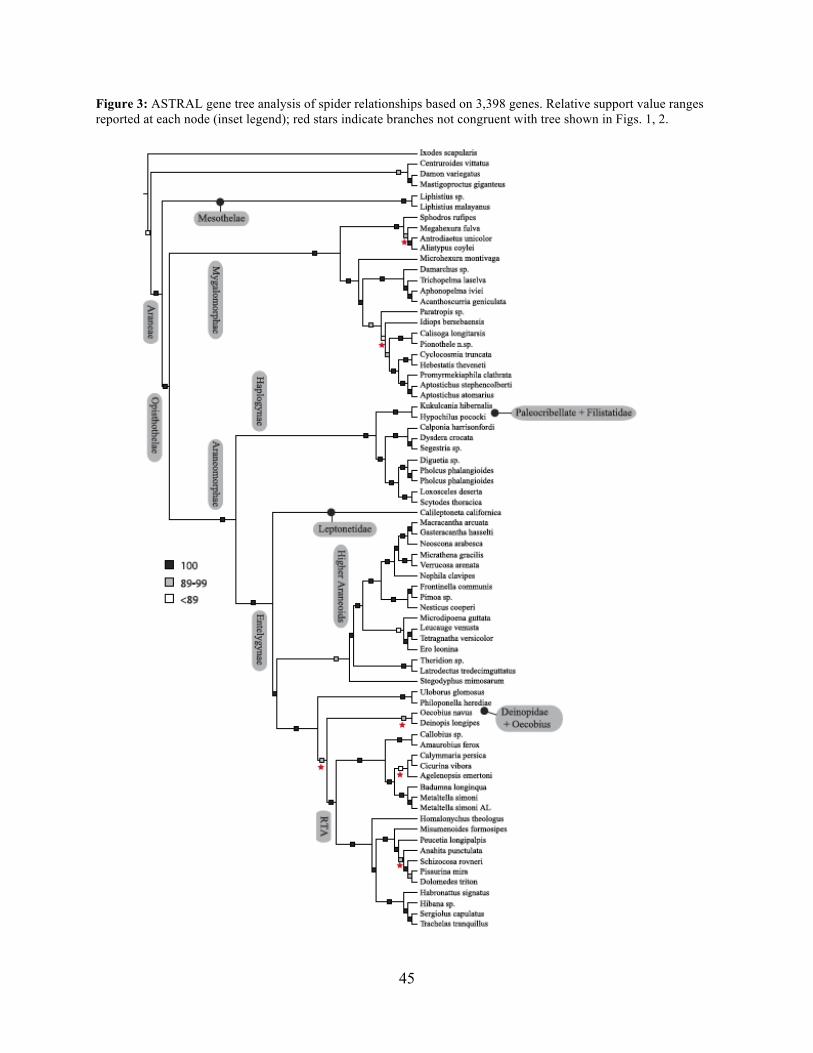
45
Figure 3: ASTRAL gene tree analysis of spider relationships based on 3,398 genes. Relative support value ranges reported at each node (inset legend); red stars indicate branches not congruent with tree shown in Figs. 1, 2.
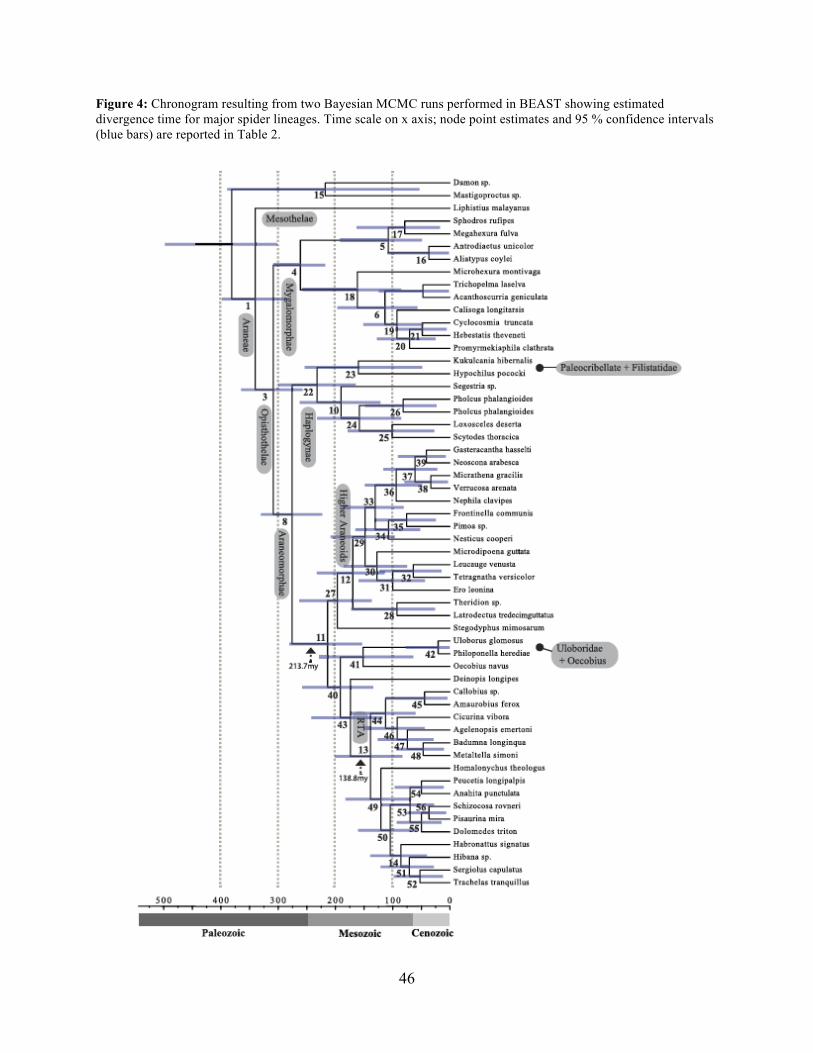
46
Figure 4: Chronogram resulting from two Bayesian MCMC runs performed in BEAST showing estimated divergence time for major spider lineages. Time scale on x axis; node point estimates and 95 % confidence intervals (blue bars) are reported in Table 2.
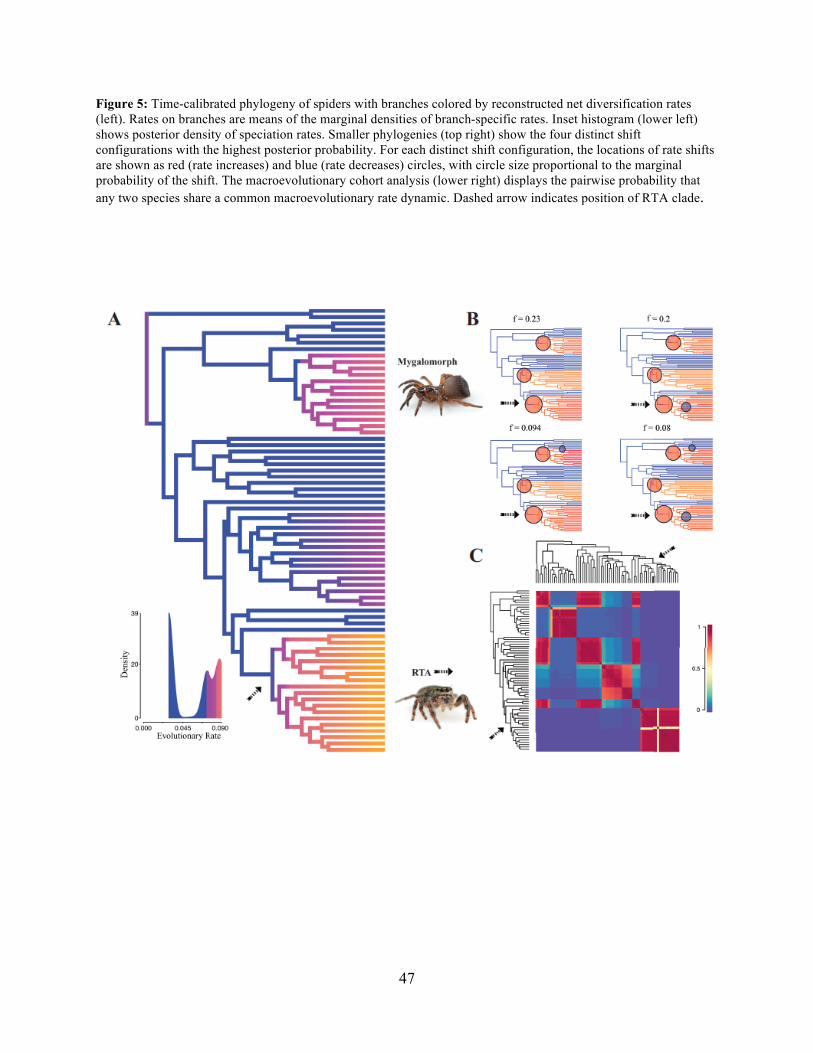
47
Figure 5: Time-calibrated phylogeny of spiders with branches colored by reconstructed net diversification rates (left). Rates on branches are means of the marginal densities of branch-specific rates. Inset histogram (lower left) shows posterior density of speciation rates. Smaller phylogenies (top right) show the four distinct shift configurations with the highest posterior probability. For each distinct shift configuration, the locations of rate shifts are shown as red (rate increases) and blue (rate decreases) circles, with circle size proportional to the marginal probability of the shift. The macroevolutionary cohort analysis (lower right) displays the pairwise probability that any two species share a common macroevolutionary rate dynamic. Dashed arrow indicates position of RTA clade.
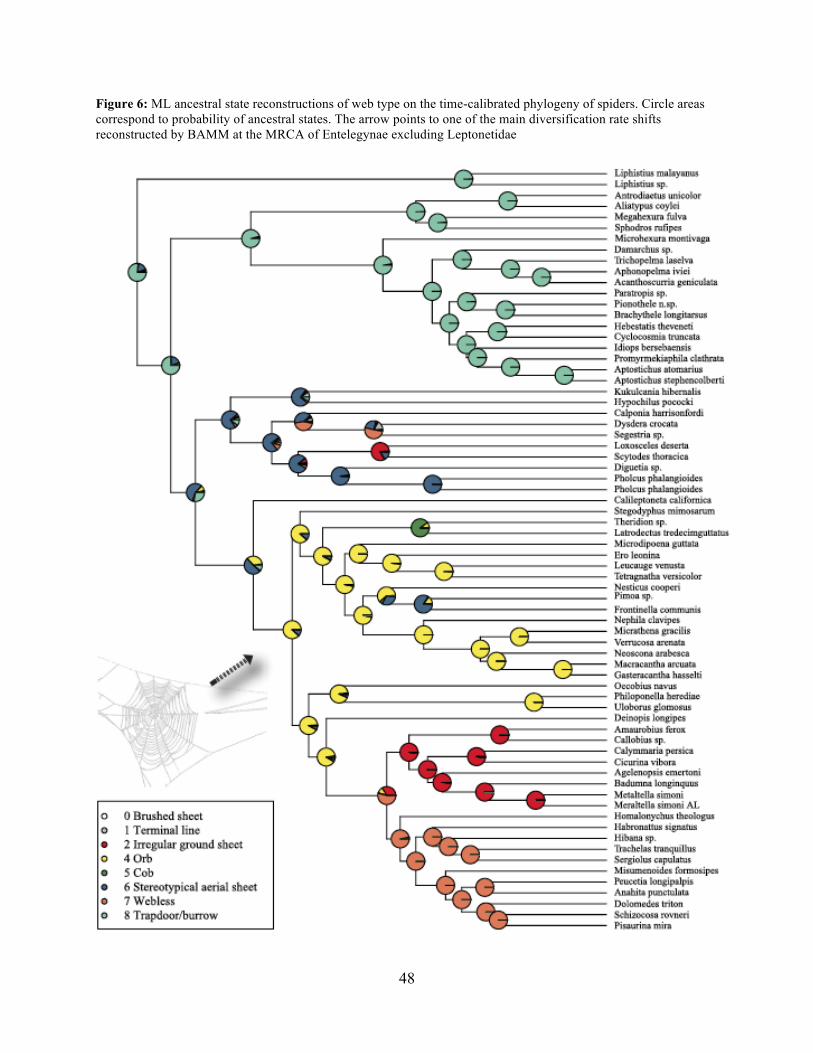
48
Figure 6: ML ancestral state reconstructions of web type on the time-calibrated phylogeny of spiders. Circle areas correspond to probability of ancestral states. The arrow points to one of the main diversification rate shifts reconstructed by BAMM at the MRCA of Entelegynae excluding Leptonetidae
49
Chapter II
Evaluating Species Boundaries in the Aptostichus atomarius species complex
Introduction:
The trapdoor spider genus Aptostichus currently comprises 41 species, distributed widely
throughout the California Floristic Province (CFP) with disjunct populations in Nevada, Arizona
and Mexico (Bond, 2012; Valdez & Roldan, 2016). Like other spiders in the suborder
Mygalomorphae Aptostichus are long-lived predators (15-30 years, 5 to reach maturity) that
construct and inhabit silk lined burrows. Aptostichus species form a cryptic trapdoor from layers
of silk and substrate, which covers the burrow entrance – providing protection as well as a
predatory advantage. This engineering feat allows Aptostichus to occupy a diversity of habitats.
These species occur on roadside slopes, ravines, and hillsides with variable substrate types in
ecosystems ranging from alpine forests to coastal dunes. When undisturbed, these sedentary
spiders leave their burrow at most twice; adult males venture out to find female burrows during
seasonal reproductive periods and juvenile spiders disperse from their mothers' burrow. When
present at a locality, they can form dense colonies (multiple conspecific burrows per square
foot), and are often syntopic with other Mygalomorph genera.
Within the genus, the Aptostichus atomarius species complex exemplifies the kind of
cryptic diversity found with increasing regularity in Mygalomorph spiders (e.g., Hendrixson &
Bond, 2005; Hamilton, Formanowicz & Bond, 2011; Starrett et al., 2018), other arthropod
systems (Bickford et al., 2007; Daniels et al., 2009; Nicholls et al., 2010), and other genera
subject to the CFP’s complex geologic history (Calsbeek et al.,2003; Myers et al., 2014). Current
members of the complex (A. atomarius, A. stanfordianus, A. stephencolberti, A. miwok, A.
50
angelinajolieae, and A. dantrippi) have been established through an integrative delimitation
method, which incorporated geographic and ecological aspects of the system with genetic
structure (Bond &Stockman, 2008; Bond, 2012). Despite any discernable divergence in
morphological characters traditionally used to define mygalomorph spider species (e.g. sexual
and secondary sexual characters), this group displays very high levels of pairwise mtDNA
genetic divergence (Bond & Stockman, 2008). Mitochondrial genetic structuring is
unambiguous, largely tracking geographic boundaries as would be expected of organisms with
low female vagility. Though compelling evidence for the independence of these lineages has
been established, support for phylogenetic relationships between atomarius complex species is
still weak at deeper nodes (Bond, 2012). Current delimitation within the group relies heavily on
mitochondrial gene tree topology (12S-16S region); though supplemented with limited sampling
of the nuclear rRNA Internal Transcribed Spacer unit (Bond & Stockman, 2008) and later
improved with broader sampling across the distribution (Bond, 2012) species diagnoses within
the complex primarily reflect patterns of mitochondrial inheritance and evolution. The extent to
which single gene trees, particularly those derived from mitochondrial DNA, reflect the broader
genomic history of this complex remains unclear.
Increasing efficiency and availability of genomic approaches has created a pathway for
researchers of non-model organisms to overcome limitations of mitochondrial only or single
gene tree analyses (Ellegren, 2014). For a fraction of the time and capital required to generate
individual gene trees via traditional sequencing methods, high-throughput driven, multi-locus
datasets can be obtained and used to estimate a species tree. Both higher-level systematic
analyses (Misof et al., 2014, Prum et al., 2015) and delimitation efforts at the species/population
level have benefited (Pease et al., 2016, Domingos et al., 2017). The two loci-generating
51
methods employed here, genotyping-by-sequencing (GBS; Elshire et al., 2011) and Anchored
Hybrid Enrichment (AHE; Lemmon, Emme & Lemmon, 2012), sample from different,
independent, genomic constituents. GBS applies a restriction enzyme based method to digest
genomic DNA and sample single nucleotide polymorphisms (SNPs) from across the genome.
These data are particularly useful for initial detection of genetic structure via unguided clustering
analysis and the generation of species hypotheses (discovery), which can be validated through
independent analyses. AHE leverages taxon specific probes to sequence highly conserved
regions of genomic sequence and variably divergent flanking regions. This method can generate
hundreds of deeply sequenced loci for large numbers of samples, useful when resolving
relationships at multiple phylogenetic scales (e.g. Brandley et al., 2015; Young et al., 2016). In
this study, AHE loci form the basis of phylogenomic reconstruction, validation via BPP
(Bayesian Phylogenetics and Phylogeography; Yang, 2015), and refinement of species
boundaries – specifically, model-based exploration of contemporary and historic gene flow
between species using PHRAPL (Phylogeographic Inference using Approximate Likelihoods;
Jackson et al., 2017).
Though providing an enormous amount of raw material for establishing the existence and
extent of genetic lineages, these data have their own limitations and considerations. Single gene
trees disagree, sometimes in remarkable ways, with the estimated species tree reflecting the
complex interaction of micro and macroevolutionary forces (Degnan & Rosenberg, 2009).
Consolidation of divergent gene histories under the multi-species coalescent can require
substantial computational power when many species and large numbers of loci are considered; as
a result, many heuristic approaches have been developed (Nakleh, 2013). Striking a balance
between analyses of additional loci, adequate population/species sampling, and independent lines
52
of evidence (e.g. geography, ecology, behavior) can be challenging, but it is crucial if a truly
integrative approach to species delimitation is to be achieved. In pursuit of this ideal, we take a
discovery/validation approach to molecular delimitation building upon integrative systematic
strategies employed elsewhere (Hedin, Carlson & Coyle, 2015; Wachter et al., 2015) which
combine independent methods for 1) generating species hypotheses (through clustering or
phylogenetic analysis) and 2) validating species hypotheses (using spedeSTEM, BPP or other
statistical evaluation of competing hypotheses). We employ genetic methods of clustering and
multi-locus phylogenetic analysis from a broader sample of the Aptostichus genome, evaluating
the concordance (or lack thereof) between nuclear loci and the previously resolved mitochondrial
gene tree and validate our species hypotheses using BPP. Lastly, we attempt to expand the
integrative approach to include the possibility of male-dispersal mediated gene flow using the
program PHRAPL, refining the extent and permeability of species boundaries within the A.
atomarius complex.
Materials and Methods:
Samples were selected such that each species in the atomarius complex had
representatives spanning its known distribution (Fig 1). Geographic considerations were
balanced with sample availability and minimum requirements (sample
number/population and DNA quality) for each type of genetic analysis performed. Given
the multi-step integrative approach applied, initial sampling was foundational to later
genomic analysis; the samples used in the GBS protocol guided the sampling scheme
used in the AHE analysis. When possible, the same samples, or individuals collected at
the same localities, were used for both the GBS and AHE sequencing protocols to allow
53
for comparison of the two approaches. Additionally, many of the same individuals used
in Bond and Stockman (2008) were included when preserved tissue was available.
Overlap between the two genomic data types detailed herein can be found in Table 1.
DNA was extracted from preserved leg tissue (90% Ethanol or RNAlater) using
the Qiagen DNeasy Kit, and assessed for sufficient yield and quality. High molecular
weight genomic DNA was sent either to the Institute for Genomic Diversity at Cornell
University (GBS protocol, n=47) or the Center for Anchored Phylogenomics at Florida
State University (AHE protocol, n=40 + 3 outgroup taxa) for library preparation and
sequencing. Details of the specific genomic sequencing methods are as follows.
GBS Sequencing and Filtering
GBS for non-model organisms such as Aptostichus requires an initial optimization of a
single sample to select an appropriate restriction enzyme set. In this case a single enzyme,
EcoT22I, was chosen as sample digestion with this 6-base cutter yielded a distribution of
fragment sizes suitable for Illumina sequencing (<500bp). Samples were plated in a 48-plex
design (47 individuals in duplicate on a 96 well plate) and digested. Unique barcode adapters
were ligated to each sample to allow for pooling during sequencing and downstream
demultiplexing. Illumina sequencing adapters were annealed to DNA fragments, and the pooled
samples were sequenced on a single flowcell lane of the Illumina HiSeq 2000 platform (50 bp,
SE reads). Since no suitable reference genome was available for mygalomorph spiders, raw
sequences were processed using the Universal Network Enabled Analysis Kit (UNEAK; Lu et
al., 2013), an analysis pipeline for non-model organisms implemented in TASSEL v3.0
(Bradbury, 2007). In lieu of a reference genome, the UNEAK pipeline first trims and aligns reads
to each other, collapsing them into sequence tags. Tags differing at only one site are then
54
identified and those forming complex networks with each other are filtered out as they likely
represent sequencing errors, paralogs, or repetitive sequences. Importantly, UNEAK employs an
error tolerance rate parameter of 0.3 during the network analysis phase to account for the
expected Illumina sequencing error rate, allowing only highly covered reciprocal tag pairs to
remain. This process results in a series of file types representing different filtering levels and
merge methods, specifically vcf and HapMap files that have either been merged by taxon and/or
by SNP site. The unfiltered SNP and taxon merged HapMap file from this output was subjected
to filtering prior to analysis; TASSEL (v5.2.27) was used to further minimize missing sites in the
data. Three filtered datasets, varying in proportion of missing sites (10, 20, and 30%) were
generated and converted into the STRUCTURE input file format in preparation for downstream
analyses.
Species/Population Discovery
GBS derived SNPs were used in two similar clustering analyses – a Bayesian admixture
analysis in STRUCTURE (Pritchard, 2000, Falush et al., 2003) and an analysis in the R package
LEA (Frichot & Francois, 2015) that uses a cross-entropy criterion to estimate the number of
ancestral populations given a genomic matrix. An admixture model with correlated allele
frequencies was selected in STRUCTURE. For each filtered dataset, twenty replicate runs were
generated (100,000 burn-in generations followed by 1,000,000 MCMC runs) for values of K
ranging from 2 to 8. The replicated runs for each dataset were then evaluated using the program
StructureHarvester (Earl, 2012) to determine the optimal value for K. Alignment and summary
of clusters across replicates for the optimal K value was determined by the program CLUMPP
(Jakobsson, 2007) and visualized using STRUCTURE PLOT (Ramasamay, 2014, v2.0).
STRUCTURE input files were converted to the appropriate file type in LEA using the
55
struct2geno function and the snmf function was used to generate 30 replicates of population
structure analyses for values of K ranging from 1 to 8. The number of clusters was chosen using
the minimal cross-entropy criterion output; the value of K displaying a plateau in this curve was
selected. Within the 30 replicates of the appropriate K value, the run with the lowest cross-
entropy estimate was retained for generation of a STRUCTURE-like ancestry coefficient plot.
AHE Loci Capture and Processing
Genomic DNA from 43 Aptostichus (40 ingroup, 3 outgroup) representing geographic
clades recovered in previous phylogenetic analyses, overlapping with GBS samples where
possible and with an increased focus on groups underrepresented in the GBS analyses was sent
to the Center for Anchored Phylogenomics at Florida State University to undergo anchored
hybrid enrichment (www.anchoredphylogeny.com). Library preparation, sequencing, and
bioinformatic processing of raw Illumina data follow methods outlined in Lemmon et al., (2012)
and Hamilton et al., (2016). Hamilton details the design of the Spider Probe Kit utilized as well
as the methods that led to sequence alignments analyzed in the current work. Briefly, sonication
of up to 500ng genomic DNA for each sample was followed by addition of sample indices, blunt
end repair, and size selection (300-800bp fragments). Indexed samples were pooled at equal
quantities before being enriched using the AHE Spider Probe Kit (v1). This kit was designed to
target 585 conserved regions of spider genomic and transcriptomic sequences. Following
enrichment, reactions were pooled again and sequenced on a single Illumina HiSeq 2500 lane
(150bp, PE reads) at the Florida State University Translational Science Laboratory. Prior to
sequence assembly, overlapping paired reads were merged following Rokyta et al. (2012). Read
pairs failing to merge were utilized but left unmerged during assembly. Divergent reference
assembly was used to map reads to the probe regions and extend the assembly into the flanking
56
regions (see Prum et al., 2015 and Hamilton et al., 2016 for details). Orthology was determined
among the homologous consensus sequences at each locus following Prum et al. (2015) and
Hamilton et al. (2016). Sequences in each orthologous cluster were aligned using MAFFT
v7.023b (Katoh & Standley, 2013), using the --genafpair and --maxiterate 1000 flags. Since the
spider AHE loci probe design was heavily influenced by conserved sequence regions present in
reference transcriptome sequences, AHE alignments were mapped back to reference Aptostichus
transcriptome contigs for annotation of protein coding components within the AHE sequences.
First, a BLAST search using a fasta file containing a single representative sequence from each
AHE locus as the query and five previously derived transcriptome assemblies for Aptostichus
species within the complex (A. atomarius, A. angelinajolieae, A. stanfordianus, A.
stephencolberti, and A. miwok) as the database was used to identify relevant contigs for mapping.
Each locus was then assigned a “transcriptome group” identification based on the reference
sequence to which it hit. At this taxonomic level, individual AHE loci represent fragments of
conserved genomic regions also represented in aligned transcriptomes. Flanking regions in this
case represent introns rather than variable protein coding regions.
Phylogenomic Analyses
The recovered AHE loci were analyzed in a phylogenetic framework. First, prior to any
additional trimming or filtering of alignments, all loci recovered (644) were concatenated and the
program IQ-TREE (Nguyen et al., 2014) was used to perform a maximum likelihood analysis of
the resulting supermatrix. The built-in model selection feature of IQ-TREE, ModelFinder
(Kaylaanamoorthy et al., 2017), was used to select the optimal model and partitioning scheme
for each locus in the supermatrix; confidence estimates were generated using the ultrafast
bootstrap (Hoang et al., 2017) and SH-aLRT (Guindon et al., 2010) methods (1000 replicates
57
each). Due to the redundant nature of the AHE loci, the full dataset was reduced via selection of
a single AHE locus per transcript group (n=428) and further filtered to remove loci for which
there were less than 5 representative samples from each putative species group (all currently
described species and A. stanfordianus North/South clades). The resulting dataset contained 141
loci and is the preferred focus of phylogenomic analysis, as it is small enough to be used for
downstream, computationally intensive species delimitation methods. A fully concatenated
analysis of this subset was performed with settings identical to the 644 locus analysis to assess
consistency of topology and support. IQ-TREE was then used to generate individual gene trees
for the 141 set of loci (-m TESTNEW, 1000 UFboot, 1000 SH-aLRT), which served as input for
the coalescent-based species tree analysis in ASTRAL II (Mirarab & Warnow 2015). Both
bootstrap and gene-resampling only assessments of nodal support available in ASTRAL were
performed using individual gene tree input from IQ-TREE. Additionally, to evaluate gene tree
bias in our 141 loci subset, an ASTRAL species tree was generated for all 644 loci using IQ-
TREE inputs as described previously.
Species Validation
Using the coalescent species delimitation approach available in the software package
Bayesian Phylogeography and Phylogenomics (BPP version 3, Rannala & Yang, 2015; Yang &
Rannala, 2014) species hypotheses as recovered in the discovery and phylogenomic methods
were further evaluated. Three different types of analyses were performed with alignments of the
141-gene subset utilized in phylogenomic reconstructions as input. First, a joint estimation of the
species tree and species delimitation (unguided analysis type ‘A11’; Yang, 2015) was executed
to independently evaluate tree topology and individual group assignments. Priors reflecting an
assumption of small ancestral population size (2,2000) and relatively deep divergence (1,10)
58
were chosen based on the biology of the group and previous BPP analyses of other mygalomorph
spiders (Hedin, Carlson & Coyle, 2013). The clean data option, which removes ambiguities and
gap positions in the alignments, was chosen for all analyses. Each BPP run included 1x10⁵
MCMC generations (burn-in of 5000) sampled every 5 generations and was performed in
triplicate. Following the A11 analysis, two additional species delimitation analyses with identical
parameters but with fixed guide trees (type ‘A10’; Yang, 2015) reflecting alternate topologies
recovered in phylogenomic analyses (concatenation vs. species tree topologies) were executed.
Species Boundary Refinement
To assess the presence, magnitude and direction of gene flow between putative species of
the atomarius complex with abutting ranges, the program PHRAPL was employed. PHRAPL is
written in R and allows for the generation and evaluation of demographic models (migration,
coalescent events, demographic events) under the assumptions of the multispecies coalescent.
This tool evaluates the probability of a set of empirically derived gene trees, calculating the
proportion of topologies simulated under a range of demographic parameters matching observed
topologies, ultimately ranking fit of all demographic models tested using the Akaike information
criterion (AIC) framework. To make this type of exploratory analysis possible, PHRAPL
implements several strategies including subsampling of tree tips and calculating tree degeneracy
weights to reduce the influence of intra-population-only discord. Models must be generated first,
given a specified number of free parameters (K), followed by creation of an appropriately
subsampled dataset. For this dataset, species comparisons were divided into geographic regions
of interest (e.g. North, Central, South) due to the computational challenges posed by testing
model sets containing more than 3 species/populations at a time (Jackson et al., 2017). Gene
trees generated by IQ-TREE for the 141 AHE loci subset were used as input along with a
59
population assignment file. Population assignments were based on the consensus of previous
analyses. Gene trees included only the focal species for each subset and two outgroup taxa, A.
hesperus and A. madera, which served as the root taxa and were subsequently trimmed by
PHRAPL. Since parameter space can quickly overwhelm computational power, initial analyses
were limited to 3 population models with only tree-like topologies (all populations coalesce), a
single free parameter for migration (all migration rates equal), and only symmetrical migration
(48 models). After evaluating the limited model space generated with these parameters, a more
complex set of models allowing asymmetric migration rates while limiting tree topology to the
three-taxon relationships derived from phylogenomic analyses was explored (256 models).
PHRAPL was executed on the Auburn University high performance computing resource,
Hopper, using R version 3.3.0. Each population subsampling size was set to 3, with 200
subsamples per gene; 10,000 trees were simulated for each model using default collapse start
(0.3, 0.58, 1.11, 2.12, 4.07, 7.81, 15) and migration start (0.1, 0.22, 0.46, 1, 2.15, 4.64) grid
search parameters. Two replicates of each analysis were performed to evaluate consistency of
results.
Results:
The GBS protocol yielded 190,873,287 reads for 47 individuals, which were assembled
into 29,967,018 sequence tags. From these tags, 33,934 SNPs were called and additional filtering
of these sites based on missingness resulted in three files containing 412 (D1, 10% missing
sites), 990 (D2, 20% missing sites), and 1628 (D3, 30% missing sites). The AHE protocol
resulted in a total of 644 multiple sequence alignments varying in length (100-2251 bp),
sequence similarity (68.6-99.3% pairwise identity), and taxon occupancy (41.86-100%). In total,
60
there were 48,7882 sites (18,160,824 nucleotides) in the fully concatenated AHE supermatrix.
Summary statistics for individual loci can be found in Supplementary Table 2. When mapped
back to transcripts of Aptostichus atomarius, the centralized probe region of these loci was found
to be associated with only 428 unique contigs; that is, AHE probes displayed a one to many
relationship with resulting AHE loci. Classifying these loci by which “transcript group” they
belong to (membership ranging in size from 1-8), allowing only one representative locus per
group, and setting a minimum criterion for species representation (at least 5
individuals/previously identified clade) the data was reduced to 141 loci. In the 124 cases where
more than one AHE alignment mapped to the same transcript, the longest alignment was chosen.
GBS Data Clustering Analyses
Most analyses detected an optimal K of five, with clusters corresponding largely to
mitochondrial clades. STRUCTURE analysis of the most conservatively filtered SNP dataset
(D1, 10% missing sites) recovered six distinct clusters within the sequenced samples (Fig 2a).
Several clades previously identified primarily on the basis of mitochondrial divergence were
found to be exclusive – A. stephencolberti, A. angelinajolieae, and individuals from the southern
half of the A. stanfordianus range formed a distinct cluster. Individuals from the southern part of
the A. atomarius range were distinct in the preferred output from those in the northern portion,
which clustered with the A. dantrippi specimen from that area (MY0730). In solutions where A.
atomarius and A. dantrippi were not collapsed as one (all LEA analyses see Figures 2b,3b,4b and
STRUCTURE for D2, Figure 3a) this A. dantrippi singleton showed very high levels of
admixture and more shared ancestry with A. stanfordianus South than A. atomarius. The second
A. dantrippi specimen consistently clustered with A. angelinajolieae; to account for the
possibility of experimental error or misidentification, this individual was intentionally re-

61
extracted for the AHE analyses. The northern dune species, A. miwok, and individuals from the
northern portion of the A. stanfordianus range were collapsed into one population in all analyses;
SNP markers alone were not sufficient to distinguish these two species.
Phylogenomic Relationships
Concatenated analyses of the AHE loci were congruent between the full set (644 loci,
Figure 5) and the filtered set (141 loci, Figure 6). Mitochondrial clades from Bond and Stockman
(2008) and Bond (2012) were recovered with high support, though the arrangement differed from
the 2008 mtDNA-based topology. A. miwok is nested within the northern clade of A.
stanfordianus and the southern A. stanfordianus are found sister to the southern dune species A.
stephencolberti as previously found, but A. angelinajolieae is placed sister to the A.
stanfordianus North + A. miwok clade and A. atomarius is sister to A. dantrippi. The ASTRAL II
species tree for all 644 loci had the same topology as concatenated analyses, with high support
(>90 local posterior probability) for most deep nodes in the tree, falling below that level only at
some inter-population level splits near the tips of the tree and for the A. stanfordianus South/A.
stephencolberti node (Fig 7). The species tree based on the 141 loci subset generated by
ASTRAL II resembled the concatenated tree apart from the placement of A. angelinajolieae,
found to be sister to a clade containing all other species (Fig 8).
The two primary topologies recovered – A. angelinajolieae + northern species and A.
angelinajolieae sister to all other complex members – were used in BPP species delimitation in
analyses requiring guide tree input. A single case of species mis-assignment was confirmed;
sample MY3809, originally considered A. dantrippi based on its sampling locality was
consistently placed within the A. angelinajolieae clade with high support as found in the GBS
62
clustering analyses. A second individual sampled from the same locality, MY3807, was placed
within the A. dantrippi clade indicating possible sympatry.
Species Delimitation and Refinement
The joint estimation of species tree topology and species delimitation analysis in BPP
consistently generated high support for most relationships recovered in phylogenomic and
clustering analyses (Fig 9). The unguided analysis recovered a species tree topology matching
that of the concatenated phylogenomic analyses; A. angelinajolieae was sister to the A. miwok/A.
stanfordianus (North) grouping but with variable support (0.87-0.99) as the top model. Five of
the currently delimited species were fully supported in the A11 analysis; the sixth member of the
atomarius complex, A. stanfordianus, was once again found to contain two distinct genetic
lineages with full support. When the guide tree was fixed to match the concatenated topology (A.
angelinajolieae sister to northern species) the A. atomarius/A. dantrippi split became the focus of
uncertainty with posterior support ranging from 0.46-1 across replicates for the two species
delimitation. Alternatively, fixing the guide tree to match the 141 loci based ASTRAL species
tree resulted in full support for (>0.96) all seven groups.
PHRAPL analysis of geographic subsets within this tree revealed some indication of
contemporary migration and historical contact between sister species, migration rate parameters
were high in the asymmetric models, fixed at ~2.15 in all top ranked models (Fig 10a-c). The
highest ranking model for the northern species group, as taken from the concatenated tree
topologies (A. angelinajolieae, A. miwok/A. stanfordianus North), included asymmetric
migration between the dune endemic A. miwok and its inland sister A. stanfordianus and
historical migration between A. angelinajolieae and the ancestor of the other two species (Fig
10a). Species in the central part of the atomarius complex range displayed only ancestral
63
migration from the A. stephencolberti/A. stanfordianus South sister grouping into A.
angelinajolieae (Fig 10b). In the southern ranges, contemporary migration from A. dantrippi into
A. atomarius and historical migration from the A. dantrippi/A. atomarius sister grouping into A.
angelinajolieae were both detected (Fig 10c). Alternatively, PHRAPL analyses which were not
constrained to match the species tree topology revealed a tendency for disruption of sister
species, lower migration rate estimates, and symmetrical contemporary migration between
geographically adjacent species groups (Fig 11a-c). In the northern comparison, the topology
matches that of the species tree, with A. angelinajolieae sister to an A. miwok/A. stanfordianus
grouping with low estimated migration between the northern dune species and its inland sister
(Fig 11A). In the central region comparison, A. angelinajolieae coalesces with A. stanfordianus
South and there is moderate migration between the dune endemic species and the inland species
(Fig 11B). A similar situation appears in the comparison of southern species, where A.
angelinajolieae coalesces first with A. atomarius to the exclusion of A. dantrippi, found to be the
strongly supported sister of A. atomarius in all other analyses, with moderate migration estimates
(11C).
Discussion:
We have applied two independent, genomic-scale datasets (GBS and AHE) to thoroughly
evaluate genetic boundaries between the six currently described members of the Aptostichus
atomarius species complex, validating all but Aptostichus stanfordianus and resolving
divergences within a coalescent species tree framework. Herein we apply a three stage,
integrative approach with phases of SNP-based discovery, independent genomic validation, and
refinement of sister species relationships. Previous delimitations in this group of morphologically
64
homogeneous trapdoor spiders have depended heavily upon a handful of divergent mitochondrial
sites and the assumption of geographic exclusivity within the complex. Our findings indicate that
although previously utilized mitochondrial markers do, in part, reflect species boundaries in the
A. atomarius complex, they fail to accurately recover relationships between species and obscure
the potential effects of male dispersal mediated gene flow between sister species.
Cryptic Speciation
Both GBS and AHE markers revealed striking divergence between northern and southern
populations of what is currently known as Aptostichus stanfordianus. Despite an apparently
contiguous geographic distribution throughout the central California Coast Ranges, the two
distinct genetic lineages sampled from this region are most closely associated with adjacent dune
species (A. miwok in the north, A. stephencolberti in the south) rather than each other. This
divergence was hinted at by previous works (Bond & Stockman, 2008; Bond, 2012), however,
ambiguity of clade placement resulted in a conservative delimitation that did not include splitting
A. stanfordianus. Given the apparent deep divergence within this species, with clades
representing independently evolving lineages and displaying properties of phylogenetic species
(i.e. secondary species criteria sensu DeQuieroz, 2007) such as reciprocal monophyly and
diagnosability, we propose that the southern A. stanfordianus individuals constitute a new
species. There appears to be some degree of north/south geographic partitioning in the region,
though the current sampling is insufficient to clearly delimit the physical boundary between
species ranges. Combining individuals sampled in this study with previous works, the range of A.
stanfordianus South appears to extend from the gap between the Santa Cruz Mountains and the
Gabilan Range eastward into the Diablo Range (Figure 11). Bordered to the west by the Salinas
Valley and to the east by the Central Valley, this distribution as currently understood appears to
65
wrap around the Eastern Diablo Range where A. stanfordianus North individuals are found
exclusively. A. stanfordianus North also predominates in the Santa Clara Valley, sweeping into
foothills north of the San Francisco Bay near Clear Lake. This Santa Clara Valley/Diablo Range
intersection is one of many regions within the complex range that would benefit from denser
sampling and investigation of potential reproductive barriers, as it seems likely that individuals
from A. stanfordianus and the cryptic A. stanfordianus South might coexist near the edges of
their respective ranges with no clear geographic barriers to close range dispersal and male
migration.
Sympatry and Species Diagnosis
In both the discovery and validation phases of analysis, we detected further evidence of
sympatry between A. angelinajolieae and A. dantrippi at a locality in the western portion of the
A. dantrippi range. In isolation, this finding would most parsimoniously indicate sample
mislabeling at some stage of sample collection, processing or analysis. However, coupled with
previous findings of mismatch between geographic assignments to species and mitochondrial
haplotypes, a pattern of sympatry between A. angelinajolieae and three adjacent southern species
(A. atomarius, A. dantrippi, A. stanfordianus South) is evident. Several localities have sampled
individuals that represent more than one lineage. This finding has a couple of implications; the A.
angelinajolieae range is much larger than previously known, the Salinas River valley may not
represent an impermeable barrier to Aptostichus dispersal, and the potential for mitochondrial
introgression between species cannot be entirely dismissed when interpreting sampled
haplotypes near range borders.
We hypothesize that the sampling gap south of A. angelinajolieae’s current range
conceals the true extent of the distribution, south from the Monterey area through the Santa
66
Lucia Range to San Luis Obispo and west to the edge of the Central Valley. This region remains
underrepresented in trapdoor phylogeography studies, either representing sampling bias due to
lack of road access or a real gap in mygalomorph distribution due to geologic events or other
forces. There is precedent for genetic connection between trapdoor spider populations spanning,
but not including, the Salinas Valley, however. This pattern has also been observed in the
trapdoor spider genera Aliatypus (Hedin & Carlson, 2011) and Antrodiaetus (Hedin, Starrett &
Hayashi, 2012). Because fixed mitochondrial differences and geographic locality are the primary
means of diagnosing species in this complex, individuals occurring in sympatry may always
represent a challenge to subsequent analysis unless lack of mitochondrial introgression is
established or another metric for identifying species is developed. In all analyses, the single
specimen representing this potential sympatry was unambiguously placed within the A.
angelinajolieae clade, providing limited evidence that in cases of sympatry mitochondrial and
nuclear genomic signatures of divergence are in accord.
Sister Species or Metapopulations?
Anchored enrichment loci also revealed strongly supported sister species relationships
between several pairs of complex members. Both dune species have inland sister species – A.
miwok pairing with A. stanfordianus North and A. stanfordianus South with A. stephencolberti.
The southernmost species, A. atomarius and A. dantrippi, also have a well-supported sister
relationship. Placement of A. angelinajolieae remains somewhat ambiguous, alternatively found
sister to the northern species and at the base of the species tree. The most well supported
phylogenetic analyses are in congruence with the coalescent tree topology recovered in the
unguided BPP analysis, lending credence to the northern association of A. angelinajolieae. In
each phase of the analysis there was some tendency for sister species collapse, particularly at the
67
A. stanfordianus North/A. miwok and A. atomarius/A. dantrippi splits. This pattern was subtle in
the discovery and validation stages and could be attributed to weaknesses of experimental design
(not enough sites, not enough individuals per population) or appeared only in secondary analyses
and given less weight when results were evaluated holistically.
Relative to the other analyses, PHRAPL results indicate that there is a moderate amount
of contemporary migration between these two sister species pairs that might play a role in
generating the patterns of divergence we observed. Gene flow between species need not
ultimately lead to the collapse of established independent lineages, or change the fact that these
lineages are currently diagnosable, but its occurrence here challenges our understanding of
mygalomorph dispersal and the atomarius complex distribution. For gene flow to occur between
these sister species pairs, males would have to be moving much farther (or range borders are
much closer) than expected over increasingly fragmented habitats to successfully find and mate
with females of adjacent species. Additionally, successful mating would depend on the absence
of species-specific mating cues – chemical, behavioral, or temporal – not likely given the role of
sex pheromones and intricate pre/post mating behaviors of trapdoor and other mygalomorph
spiders (Ferretti et al., 2013).
Considering the above, we regard the PHRAPL results with some suspicion, particularly
because incomplete lineage sorting between sister species seems to be a more valid explanation
of the data given our current understanding of the system. Divergences are likely quite deep
within the atomarius complex; one estimate of the split between two members (A. atomarius and
A. stephencolberti) in the context of transcriptome ortholog divergence was around 3-8 Mya
(Bond et al., 2014). For this group, “contemporary” migration may reflect gene flow nearer the
species coalescent point than present day. If migration were currently happening at the level
68
suggested by PHRAPL analyses, we would expect much more discordance across the tree and
higher levels of admixture in the discovery analyses with STRUCTURE. The inability of
PHRAPL to recover the three-taxon topology that is compatible with the species tree in the
unconstrained model exploration was unexpected, but may indeed indicate that migration is
providing signal in the data that is leading to incorrect phylogenetic reconstructions. More
complete model explorations that include all species without assumptions about the species tree
topology, though computationally taxing, may be necessary to understand the patterns of
migration in this group.
Conclusions:
There is no single perfect species delimitation method, many require significant input
from the researcher (e.g. population parameter estimates, species guide tree, species/population
assignments, estimated gene trees etc.) and like any statistical method they make simplifying
assumptions (Carstens et al., 2013). Similarly, the emergence of varied genome-wide sequencing
methods has resulted in data types with application at different phylogenetic scales having
different considerations at the sampling, processing, and analysis stages (Matz, 2017; da Fonesca
et al, 2015). AHE and other enrichment approaches offer versatility, repeatability, and a wealth
of information for phylogenetic reconstruction, particularly valuable for non-model organisms
with no genomic resources. With this flood of information comes a host of incompatible gene
histories that must be reconciled, sometimes at a significant computational cost, but may also
reveal hidden associations between species. GBS and SNP-based methods have advantages of a
well-established suite of analysis tools, though they are perhaps best employed at a shallow
phylogenetic scale ideally in system with some pre-existing genomic resources. Deeply divergent
69
lineages can reduce GBS SNP recovery rates, as we saw here, and low sample sizes may also
contribute to inconsistent results during analysis. In future iterations of integrative systematic
work in the A. atomarius complex, sister species boundaries might be better suited for a focused
GBS or RADseq-type analysis, where thorough assessment of shared ancestry might yield more
robust results.
Integrative taxonomy is a highly iterative process; here we have clarified our
understanding of relationships within the A. atomarius sister species complex and generated a
testable species tree hypothesis supported by a wide swath of nuclear genomic loci while also
revealing areas in need of further examination. The integration of multiple genomic datasets and
analyses with complementary statistical tendencies has generated a more refined view of species
boundaries; however true integration across disciplines, e.g. behavior, ecology, physiology,
might inform our models of trapdoor spider population dynamics while simultaneously providing
lines of evidence for species boundaries outside of genetic markers. The genomic resources
developed here and elsewhere may provide the raw material for directing studies in other
disciplines. Which chemosensory genes and pathways are present in trapdoor spiders? Are there
species-specific changes in odorant binding proteins or receptors that might lead to species
recognition? What are the differences between courtship behaviors (drumming, tapping,
vibrating etc.) between species within the atomarius complex? There are gaps in our genetic
sampling of the complex and in our knowledge of aspects of Aptostichus natural history. A large
portion of the A. angelinajolieae range may still be left unsampled, there are disjunct populations
of the widely distributed A. atomarius that have not been included in any genetic analyses to
date, and while our study shows that A. stanfordianus is a composite of two deeply divergent
independent lineages our understanding of where they overlap and how they might interact

70
remains incomplete. Rectifying these gaps should increase the resolution of species boundaries
and allow for increasingly more accurate interpretations of the A. atomarius complex genetic
landscape.
71
References:
Bickford, D., Lohman, D. J., Sodhi, N. S., Ng, P. K., Meier, R., Winker, K., Ingram K., & Das, I. (2007). Cryptic species as a window on diversity and conservation. Trends in Ecology & Evolution, 22(3), 148-155.
Bradbury, P. J., Z. Zhang, D. E. Kroon, T. M. Casstevens, Y. Ramdoss, and E. S. Buckler. 2007. Tassel: software for association mapping of complex traits in diverse samples. Bioinformatics, 23, 2633–2635.
Brandley, M. C., Bragg, J. G., Singhal, S., Chapple, D. G., Jennings, C. K., Lemmon, A. R., Lemmon, E.M., Thomposon M.B., & Moritz, C. (2015). Evaluating the performance of anchored hybrid enrichment at the tips of the tree of life: a phylogenetic analysis of Australian Eugongylus group scincid lizards. BMC Evolutionary Biology, 15(1), 62.
Bond, J. E. (2012). Phylogenetic treatment and taxonomic revision of the trapdoor spider genus Aptostichus Simon (Araneae, Mygalomorphae, Euctenizidae). ZooKeys, (252), 1.
Bond, J. E., Garrison, N. L., Hamilton, C. A., Godwin, R. L., Hedin, M., & Agnarsson, I. (2014). Phylogenomics resolves a spider backbone phylogeny and rejects a prevailing paradigm for orb web evolution. Current Biology, 24(15): 1765-1771.
Bond, J. E., & Stockman, A. K. (2008). An integrative method for delimiting cohesion species: finding the population-species interface in a group of Californian trapdoor spiders with extreme genetic divergence and geographic structuring. Systematic Biology, 57(4), 628-646.
Carstens, B. C., Pelletier, T. A., Reid, N. M., & Satler, J. D. (2013). How to fail at species delimitation. Molecular Ecology, 22(17), 4369-4383.
da Fonseca, R. R., Albrechtsen, A., Themudo, G. E., Ramos-Madrigal, J., Sibbesen, J. A., Maretty, L., & Pereira, R. J. (2016). Next-generation biology: sequencing and data analysis approaches for non-model organisms. Marine Genomics, 30, 3-13.
Daniels, S. R., Picker, M. D., Cowlin, R. M., & Hamer, M. L. (2009). Unravelling evolutionary lineages among South African velvet worms (Onychophora: Peripatopsis) provides evidence for widespread cryptic speciation. Biological Journal of the Linnean Society, 97(1), 200-216.
Degnan, J. H., & Rosenberg, N. A. (2009). Gene tree discordance, phylogenetic inference and the multispecies coalescent. Trends in Ecology & Evolution, 24(6), 332-340.
Domingos, F. M., Colli, G. R., Lemmon, A., Lemmon, E. M., & Beheregaray, L. B. (2017). In the shadows: Phylogenomics and coalescent species delimitation unveil cryptic diversity in a Cerrado endemic lizard (Squamata: Tropidurus). Molecular Phylogenetics and Evolution, 107, 455-465.
Earl, D. A. & vonHoldt, B.M. (2012). Structure harvester: a website and program for visualizing structure output and implementing the evanno method. Conservation
72
Genetics Resources, 4 (2), 359–361.
Ellegren, H. (2014). Genome sequencing and population genomics in non-model organisms. Trends in Ecology & Evolution, 29(1): 51-63.
Elshire R.J., Glaubitz J.C., Sun Q., Poland J.A., Kawamoto K., Buckler E.S., & Mitchell, S.E. (2011). A Robust, Simple Genotyping-by-Sequencing (GBS) Approach for High Diversity Species. PLoS ONE, 6(5): e19379. https://doi.org/10.1371/journal.pone.0019379
Falush, D., Stephens, M., and Pritchard, J.K. (2003). Inference of population structure using multilocus genotype data: linked loci and correlated allele frequencies. Genetics,164, 1567–1587.
Ferretti, N., Pompozzi, G., Copperi, S., González, A., & Pérez-Miles, F. (2013). Sexual behaviour of mygalomorph spiders: when simplicity becomes complex; an update of the last 21 years. Arachnology, 16(3), 85-93.
Frichot, E. & Francois, O. (2015). Lea: an r package for landscape and ecological association studies. Methods in Ecology and Evolution, 6, 925–929.
Guindon, S., Dufayard , F., Lefort, V., Anisimova, M., Hordijk, W., & Gascuel, O. (2010). New algorithms and methods to estimate maximum-likelihood phylogenies: assessing the performance of phyml 3.0. Systematic Biology, 59, 307–321.
Hamilton, C.A., Formanowicz, D.R., & Bond, J.E. (2011). Species delimitation and phylogeography of Aphonopelma hentzi (Araneae, Mygalomorphae, Theraphosidae): cryptic diversity in North American tarantulas. PloS one, 6(10), e26207.
Hamilton, C.A., Lemmon, A.R., Lemmon, E.M., & Bond, J.E. (2016). Expanding anchored hybrid enrichment to resolve both deep and shallow relationships within the spider tree of life. BMC Evolutionary Biology, 16(1), 212.
Hedin, M., & Carlson, D. (2011). A new trapdoor spider species from the southern Coast Ranges of California (Mygalomorphae, Antrodiaetidae, Aliatypus coylei, sp. nov,), including consideration of mitochondrial phylogeographic structuring. Zootaxa, 2963(1), 55-68.
Hedin, M., Carlson, D., & Coyle, F. (2015). Sky island diversification meets the multispecies coalescent–divergence in the spruce fir moss spider (Microhexura montivaga, Araneae, Mygalomorphae) on the highest peaks of southern Appalachia. Molecular Ecology, 24(13), 3467-3484.
Hedin, M., Starrett, J., & Hayashi, C. (2013). Crossing the uncrossable: novel trans‐valley biogeographic patterns revealed in the genetic history of low dispersal mygalomorph spiders (Antrodiaetidae, Antrodiaetus) from California. Molecular Ecology, 22(2), 508-526.
Hendrixson, Brent E., and Jason E. Bond. (2005). Testing species boundaries in the
73
Antrodiaetus unicolor complex (Araneae: Mygalomorphae: Antrodiaetidae):“paraphyly” and cryptic diversity. Molecular Phylogenetics and Evolution, 36(2), 405-416.
Hoang, D.T., Chernomor, O., von Haeseler, A., Minh, B.Q., & Le, S.V. (2017). Ufboot2: Improving the ultrafast bootstrap approximation. Molecular Biology and Evolution, 35(2), 518-522.
Jackson, N.D., Morales, A.E., Carstens, B.C., & O’Meara, B.C. (2017). PHRAPL: Phylogeographic inference using approximate likelihoods. Systematic Biology, 66(6), 1045-1053.
Jakobsson, M. & Rosenberg N.A. (2007). Clumpp: a cluster matching and permutation program for dealing with label switching and multimodality in analysis of population structure. Bioinformatics, 23, 1801–1806.
Kalyaanamoorthy, S., Minh, B.Q., Wong, T.K., von Haeseler, A., &. Jermiin, L.S. (2017). Modelfinder: fast model selection for accurate phylogenetic estimates. Nature Methods, 14, 587-589.
Katoh, K. & Standley, D.M. (2013). Mafft multiple sequence alignment software version 7: improvements in performance and usability. Molecular Biology and Evolution, 30, 772–780.
Lemmon, A.R., Emme, S.A., & Lemmon, E.M. (2012). Anchored hybrid enrichment for massively high-throughput phylogenomics. Systematic Biology, 61(5), 727-744.
Lu, F., Lipka, A.E., Glaubitz, J., Elshire, R., Cherney, J.H., Casler, M.D., Buckler, E.S., & Costich, D.E. (2013). Switchgrass genomic diversity, ploidy, and evolution: novel insights from a network-based snp discovery protocol. PLoS Genetics, 9(1), e1003215.
Matz, M.V. (2017). Fantastic Beasts and How To Sequence Them: Ecological Genomics for Obscure Model Organisms. Trends in Genetics. 34(2), 121-132.
Mirarab, S. & Warnow, T. (2015). Astral-ii: coalescent-based species tree estimation with many hundreds of taxa and thousands of genes. Bioinformatics 31, i44–i52.
Misof, B., Liu, S., Meusemann, K., Peters, R. S., Donath, A., Mayer, C., Niehuis, O., et al. (2014). Phylogenomics resolves the timing and pattern of insect evolution. Science, 346(6210), 763-767.
Nguyen, L.T., Schmidt, H.A., von Haeseler, A., & Minh, B.Q. (2014). Iq-tree: a fast and effective stochastic algorithm for estimating maximum-likelihood phylogenies. Molecular Biology and Evolution, 32, 268–274.
Nicholls, J.A., Preuss, S., Hayward, A., Melika, G., Csoka, G., Nieves-Aldrey, J.L., Askew R.R., Tavakoli, M., Schonrogge, K., & Stone, G.N. (2010). Concordant phylogeography and cryptic speciation in two Western Palaearctic oak gall parasitoid species complexes.
74
Molecular Ecology, 19(3), 592-609.
Pease, J.B., Haak, D.C., Hahn, M.W., & Moyle, L.C. (2016). Phylogenomics reveals three sources of adaptive variation during a rapid radiation. PLoS Biology, 14(2), e1002379.
Pritchard, J.K., Stephens, M., & Donnelly, P. (2000). Inference of population structure using multilocus genotype data. Genetics, 155, 945–959.
Prum, R.O., Berv, J.S., Dornburg, A., Field, D.J., Townsend, J.P., Lemmon, E.M., & Lemmon, A.R. (2015). A comprehensive phylogeny of birds (aves) using targeted next generation dna sequencing. Nature, 526, 569–573.
Ramasamy, R.K., Ramasamy, S., Bindroo, B.B., & Naik, V.K. (2014). Structure plot: a program for drawing elegant structure bar plots in user friendly interface. SpringerPlus, 3, 431.
Myers, E.A., Rodríguez-Robles, J.A., Denardo, D.F., Staub, R.E., Stropoli, A., Ruane, S., & Burbrink, F.T. (2013). Multilocus phylogeographic assessment of the California Mountain Kingsnake (Lampropeltis zonata) suggests alternative patterns of diversification for the California Floristic Province. Molecular Ecology, 22(21), 5418-5429.
Nakhleh, L. (2013). Computational approaches to species phylogeny inference and gene tree reconciliation. Trends in Ecology & Evolution, 28(12), 719-728.
Starrett, J., Hayashi, C.Y., Derkarabetian, S., & Hedin, M. (2018). Cryptic elevational zonation in trapdoor spiders (Araneae, Antrodiaetidae, Aliatypus janus complex) from the California southern Sierra Nevada. Molecular Phylogenetics and Evolution, 118, 403-413.
Yang, Z. (2015). The BPP program for species tree estimation and species delimitation. Current Zoology, 61(5), 854-865.
Young, A.D., Lemmon, A.R., Skevington, J.H., Mengual, X., Ståhls, G., Reemer, M., Jordaens, K., Kelso, S., Lemmon, E.M., Hauser, M., De Meyer M., Misof, B., & Wiegman B.M. (2016). Anchored enrichment dataset for true flies (order Diptera) reveals insights into the phylogeny of flower flies (family Syrphidae). BMC evolutionary biology, 16(1), 143.
Valdez-Mondragón, A., & Cortez-Roldán, M.R. (2016). On the trapdoor spiders of Mexico: description of the first new species of the spider genus Aptostichus from Mexico and the description of the female of Eucteniza zapatista (Araneae, Mygalomorphae, Euctenizidae). ZooKeys, (641), 81.
Wachter, G.A., Muster, C., Arthofer, W., Raspotnig, G., Föttinger, P., Komposch, C., Steiner, F.M., & Schlick-Steiner, B.C. (2015). Taking the discovery approach in integrative taxonomy: decrypting a complex of narrow-endemic Alpine harvestmen (Opiliones: Phalangiidae: Megabunus). Molecular Ecology, 24(4), 863-889.
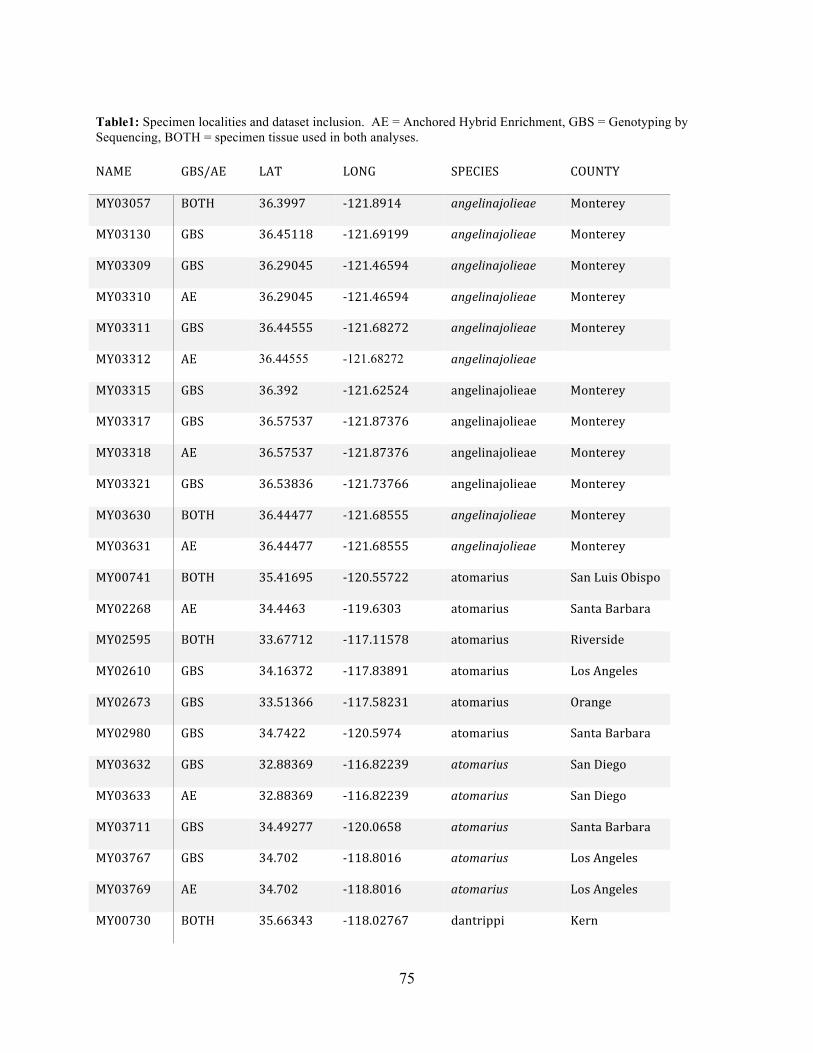
75
Table1: Specimen localities and dataset inclusion. AE = Anchored Hybrid Enrichment, GBS = Genotyping by Sequencing, BOTH = specimen tissue used in both analyses. NAME GBS/AE LAT LONG SPECIES COUNTY
MY03057 BOTH 36.3997 -‐121.8914 angelinajolieae Monterey
MY03130 GBS 36.45118 -‐121.69199 angelinajolieae Monterey
MY03309 GBS 36.29045 -‐121.46594 angelinajolieae Monterey
MY03310 AE 36.29045 -‐121.46594 angelinajolieae Monterey
MY03311 GBS 36.44555 -‐121.68272 angelinajolieae Monterey
MY03312 AE 36.44555 -121.68272 angelinajolieae
MY03315 GBS 36.392 -‐121.62524 angelinajolieae Monterey
MY03317 GBS 36.57537 -‐121.87376 angelinajolieae Monterey
MY03318 AE 36.57537 -‐121.87376 angelinajolieae Monterey
MY03321 GBS 36.53836 -‐121.73766 angelinajolieae Monterey
MY03630 BOTH 36.44477 -‐121.68555 angelinajolieae Monterey
MY03631 AE 36.44477 -‐121.68555 angelinajolieae Monterey
MY00741 BOTH 35.41695 -‐120.55722 atomarius San Luis Obispo
MY02268 AE 34.4463 -‐119.6303 atomarius Santa Barbara
MY02595 BOTH 33.67712 -‐117.11578 atomarius Riverside
MY02610 GBS 34.16372 -‐117.83891 atomarius Los Angeles
MY02673 GBS 33.51366 -‐117.58231 atomarius Orange
MY02980 GBS 34.7422 -‐120.5974 atomarius Santa Barbara
MY03632 GBS 32.88369 -‐116.82239 atomarius San Diego
MY03633 AE 32.88369 -‐116.82239 atomarius San Diego
MY03711 GBS 34.49277 -‐120.0658 atomarius Santa Barbara
MY03767 GBS 34.702 -‐118.8016 atomarius Los Angeles
MY03769 AE 34.702 -‐118.8016 atomarius Los Angeles
MY00730 BOTH 35.66343 -‐118.02767 dantrippi Kern
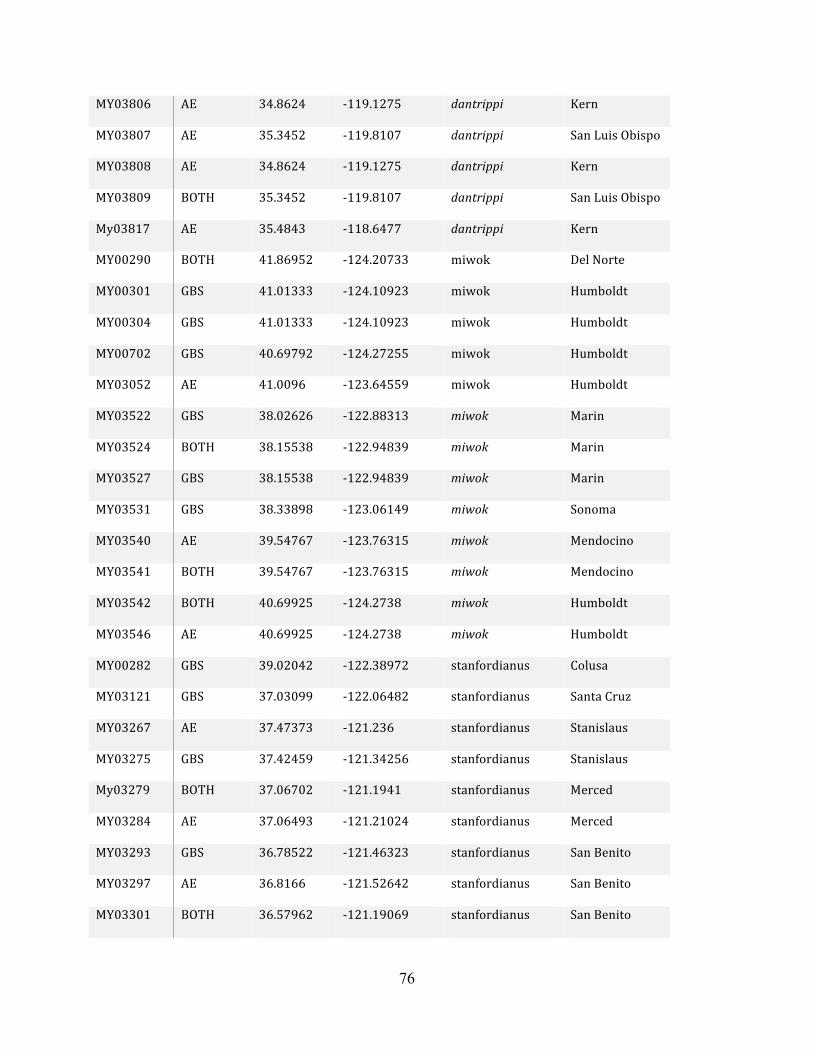
76
MY03806 AE 34.8624 -‐119.1275 dantrippi Kern
MY03807 AE 35.3452 -‐119.8107 dantrippi San Luis Obispo
MY03808 AE 34.8624 -‐119.1275 dantrippi Kern
MY03809 BOTH 35.3452 -‐119.8107 dantrippi San Luis Obispo
My03817 AE 35.4843 -‐118.6477 dantrippi Kern
MY00290 BOTH 41.86952 -‐124.20733 miwok Del Norte
MY00301 GBS 41.01333 -‐124.10923 miwok Humboldt
MY00304 GBS 41.01333 -‐124.10923 miwok Humboldt
MY00702 GBS 40.69792 -‐124.27255 miwok Humboldt
MY03052 AE 41.0096 -‐123.64559 miwok Humboldt
MY03522 GBS 38.02626 -‐122.88313 miwok Marin
MY03524 BOTH 38.15538 -‐122.94839 miwok Marin
MY03527 GBS 38.15538 -‐122.94839 miwok Marin
MY03531 GBS 38.33898 -‐123.06149 miwok Sonoma
MY03540 AE 39.54767 -‐123.76315 miwok Mendocino
MY03541 BOTH 39.54767 -‐123.76315 miwok Mendocino
MY03542 BOTH 40.69925 -‐124.2738 miwok Humboldt
MY03546 AE 40.69925 -‐124.2738 miwok Humboldt
MY00282 GBS 39.02042 -‐122.38972 stanfordianus Colusa
MY03121 GBS 37.03099 -‐122.06482 stanfordianus Santa Cruz
MY03267 AE 37.47373 -‐121.236 stanfordianus Stanislaus
MY03275 GBS 37.42459 -‐121.34256 stanfordianus Stanislaus
My03279 BOTH 37.06702 -‐121.1941 stanfordianus Merced
MY03284 AE 37.06493 -‐121.21024 stanfordianus Merced
MY03293 GBS 36.78522 -‐121.46323 stanfordianus San Benito
MY03297 AE 36.8166 -‐121.52642 stanfordianus San Benito
MY03301 BOTH 36.57962 -‐121.19069 stanfordianus San Benito
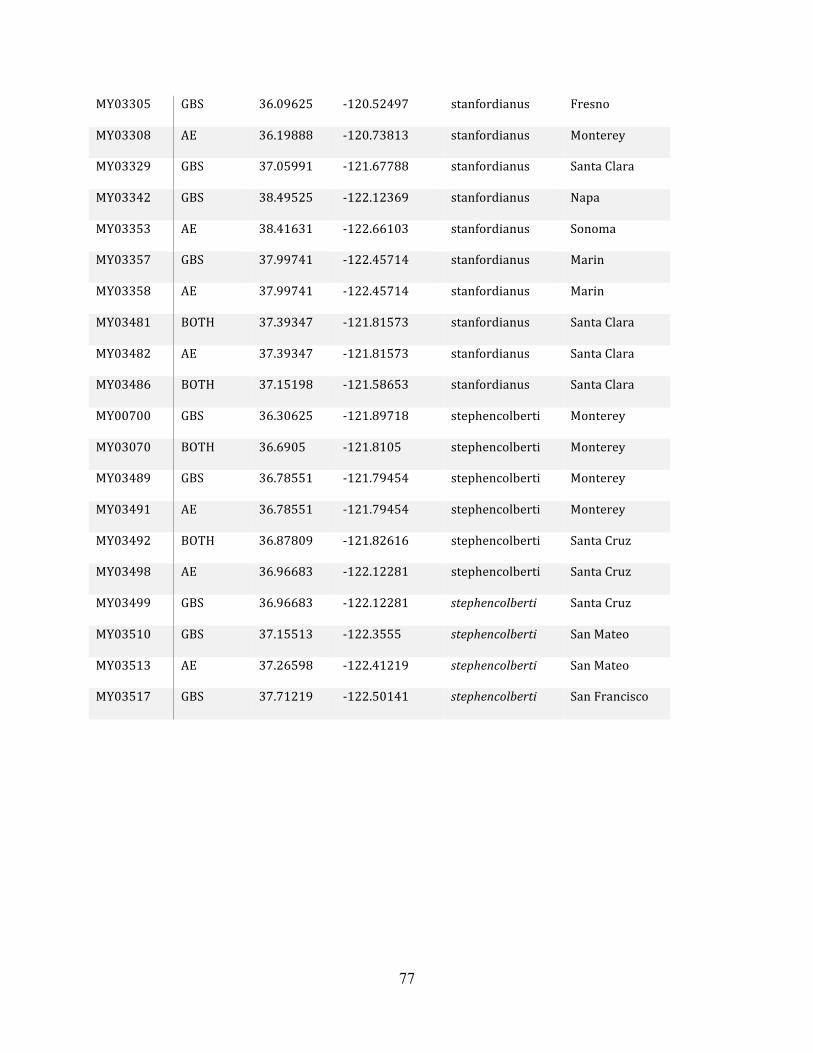
77
MY03305 GBS 36.09625 -‐120.52497 stanfordianus Fresno
MY03308 AE 36.19888 -‐120.73813 stanfordianus Monterey
MY03329 GBS 37.05991 -‐121.67788 stanfordianus Santa Clara
MY03342 GBS 38.49525 -‐122.12369 stanfordianus Napa
MY03353 AE 38.41631 -‐122.66103 stanfordianus Sonoma
MY03357 GBS 37.99741 -‐122.45714 stanfordianus Marin
MY03358 AE 37.99741 -‐122.45714 stanfordianus Marin
MY03481 BOTH 37.39347 -‐121.81573 stanfordianus Santa Clara
MY03482 AE 37.39347 -‐121.81573 stanfordianus Santa Clara
MY03486 BOTH 37.15198 -‐121.58653 stanfordianus Santa Clara
MY00700 GBS 36.30625 -‐121.89718 stephencolberti Monterey
MY03070 BOTH 36.6905 -‐121.8105 stephencolberti Monterey
MY03489 GBS 36.78551 -‐121.79454 stephencolberti Monterey
MY03491 AE 36.78551 -‐121.79454 stephencolberti Monterey
MY03492 BOTH 36.87809 -‐121.82616 stephencolberti Santa Cruz
MY03498 AE 36.96683 -‐122.12281 stephencolberti Santa Cruz
MY03499 GBS 36.96683 -‐122.12281 stephencolberti Santa Cruz
MY03510 GBS 37.15513 -‐122.3555 stephencolberti San Mateo
MY03513 AE 37.26598 -‐122.41219 stephencolberti San Mateo
MY03517 GBS 37.71219 -‐122.50141 stephencolberti San Francisco
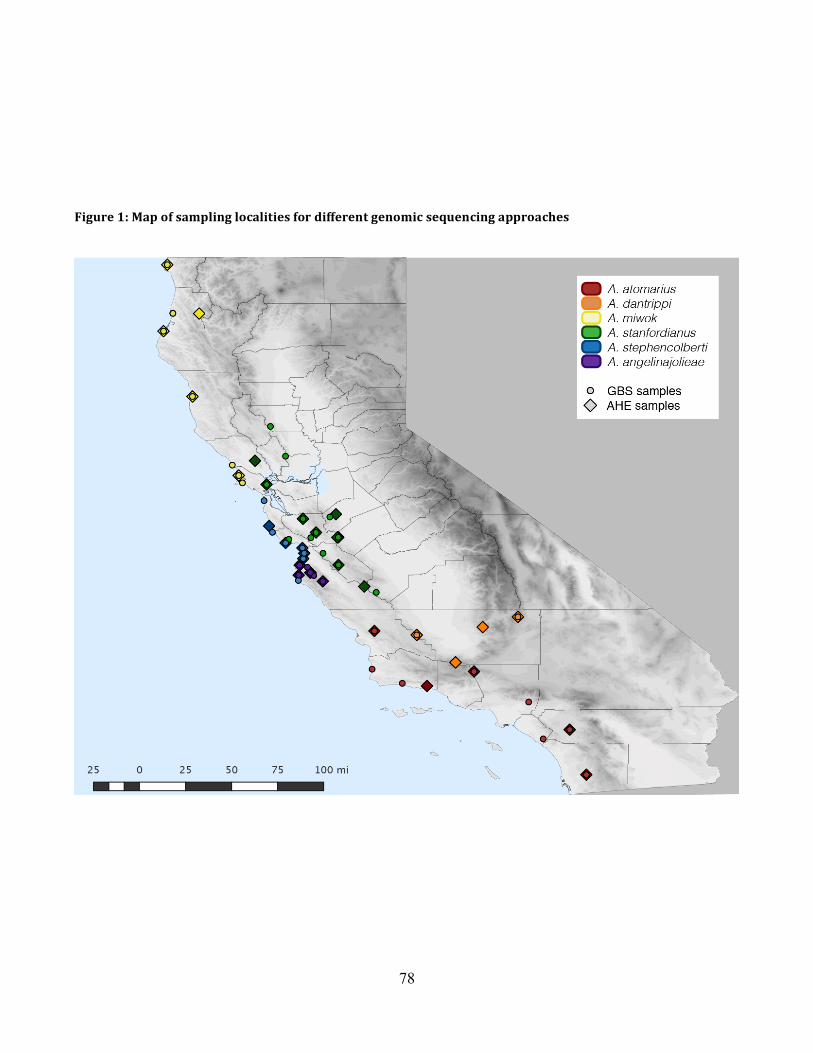
78
Figure 1: Map of sampling localities for different genomic sequencing approaches
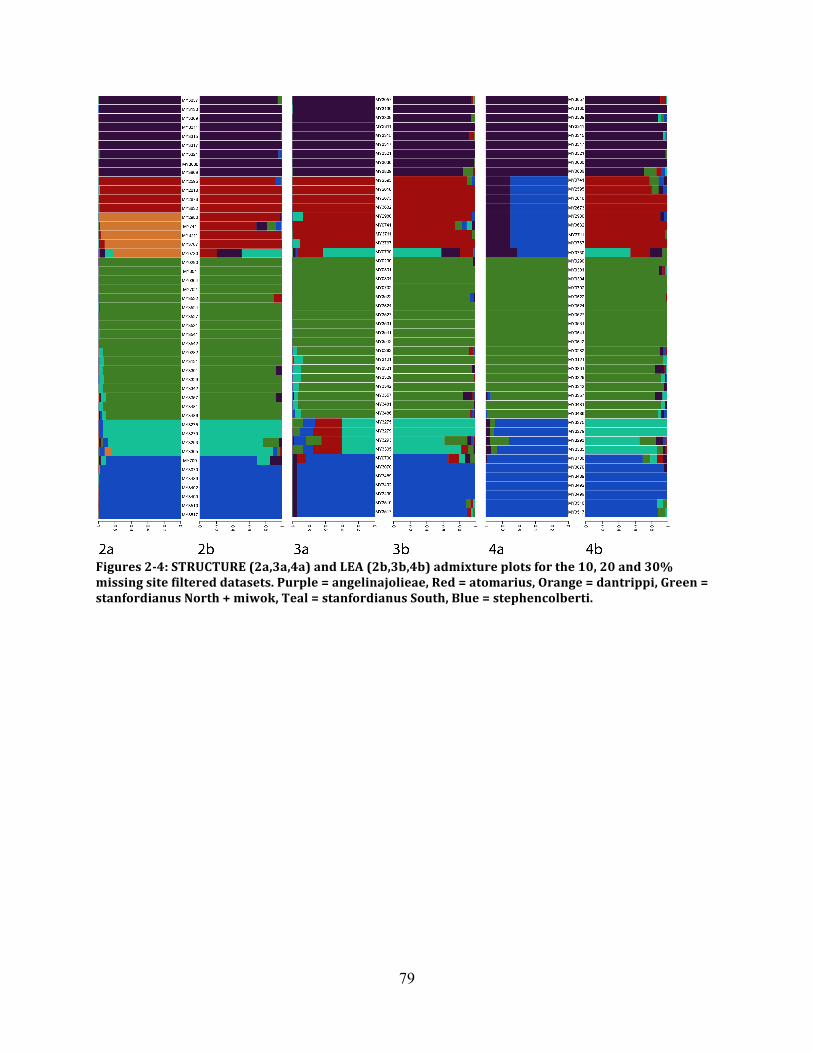
79
Figures 2-‐4: STRUCTURE (2a,3a,4a) and LEA (2b,3b,4b) admixture plots for the 10, 20 and 30% missing site filtered datasets. Purple = angelinajolieae, Red = atomarius, Orange = dantrippi, Green = stanfordianus North + miwok, Teal = stanfordianus South, Blue = stephencolberti.
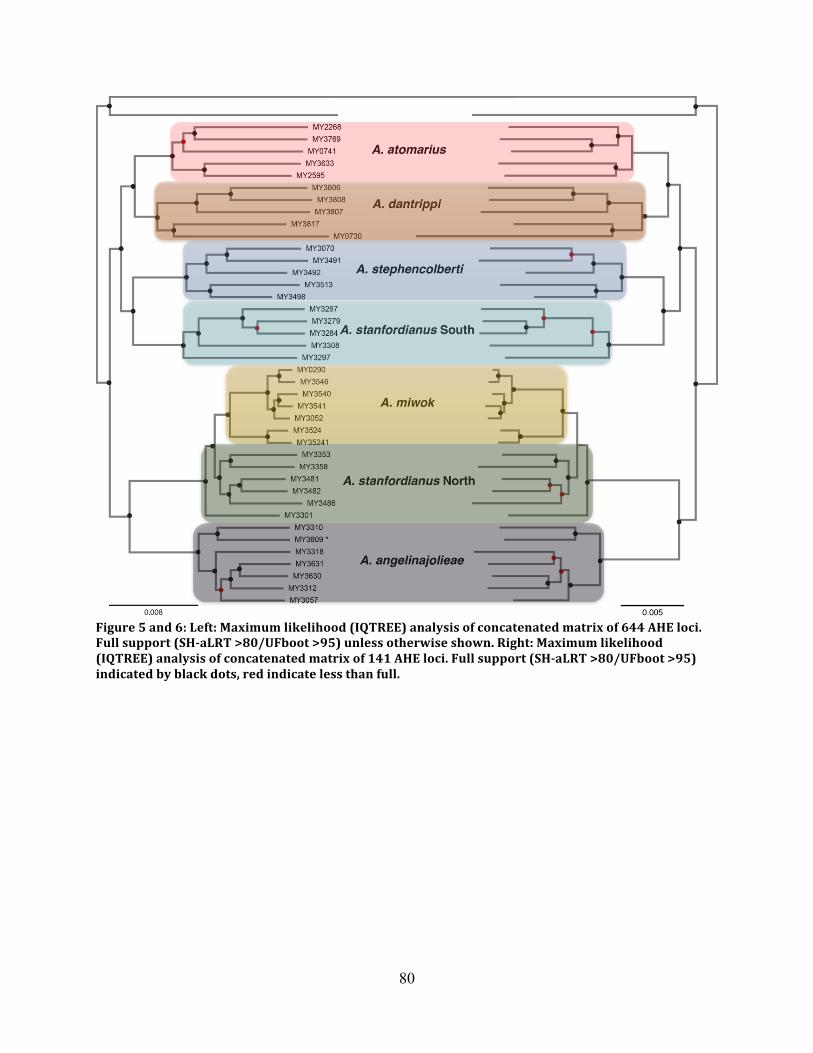
80
Figure 5 and 6: Left: Maximum likelihood (IQTREE) analysis of concatenated matrix of 644 AHE loci. Full support (SH-‐aLRT >80/UFboot >95) unless otherwise shown. Right: Maximum likelihood (IQTREE) analysis of concatenated matrix of 141 AHE loci. Full support (SH-‐aLRT >80/UFboot >95) indicated by black dots, red indicate less than full.
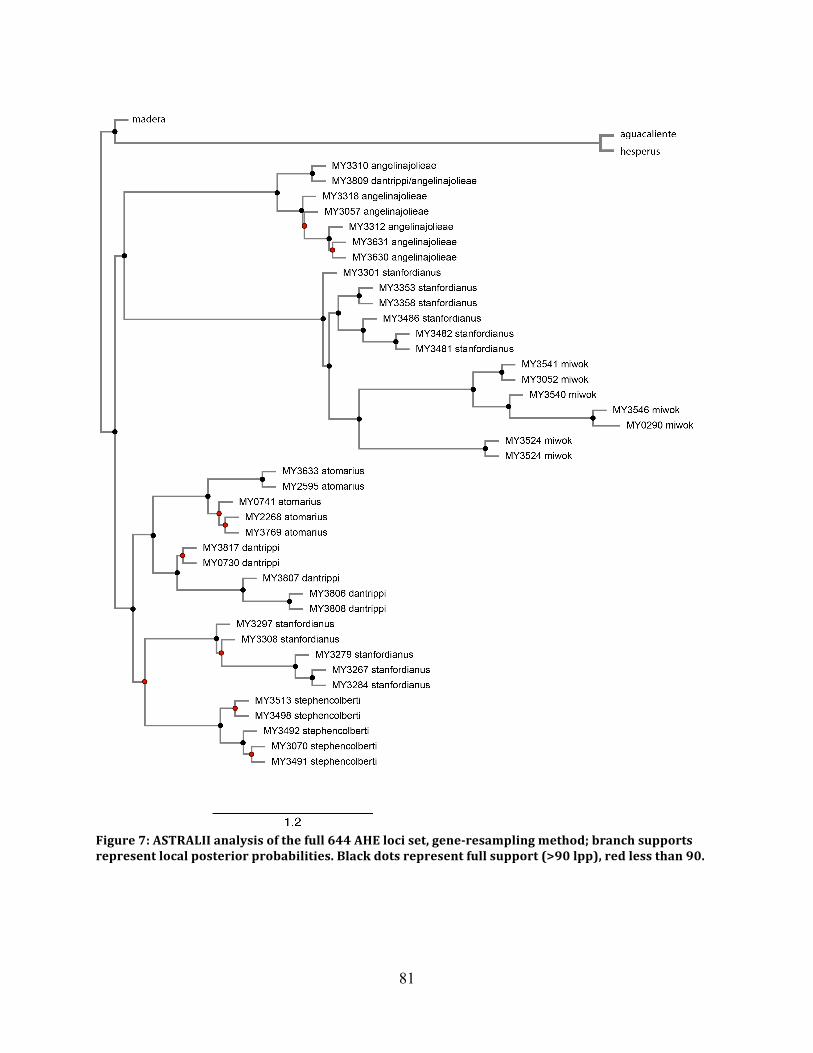
81
Figure 7: ASTRALII analysis of the full 644 AHE loci set, gene-‐resampling method; branch supports represent local posterior probabilities. Black dots represent full support (>90 lpp), red less than 90.
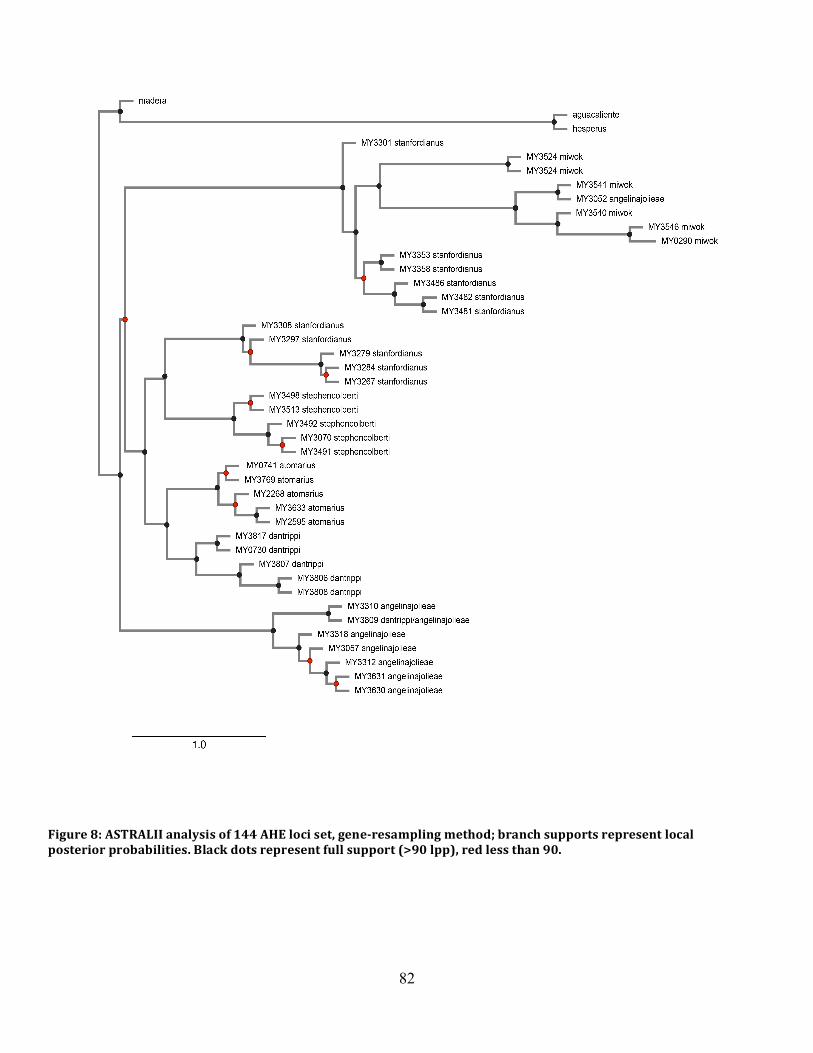
82
Figure 8: ASTRALII analysis of 144 AHE loci set, gene-‐resampling method; branch supports represent local posterior probabilities. Black dots represent full support (>90 lpp), red less than 90.
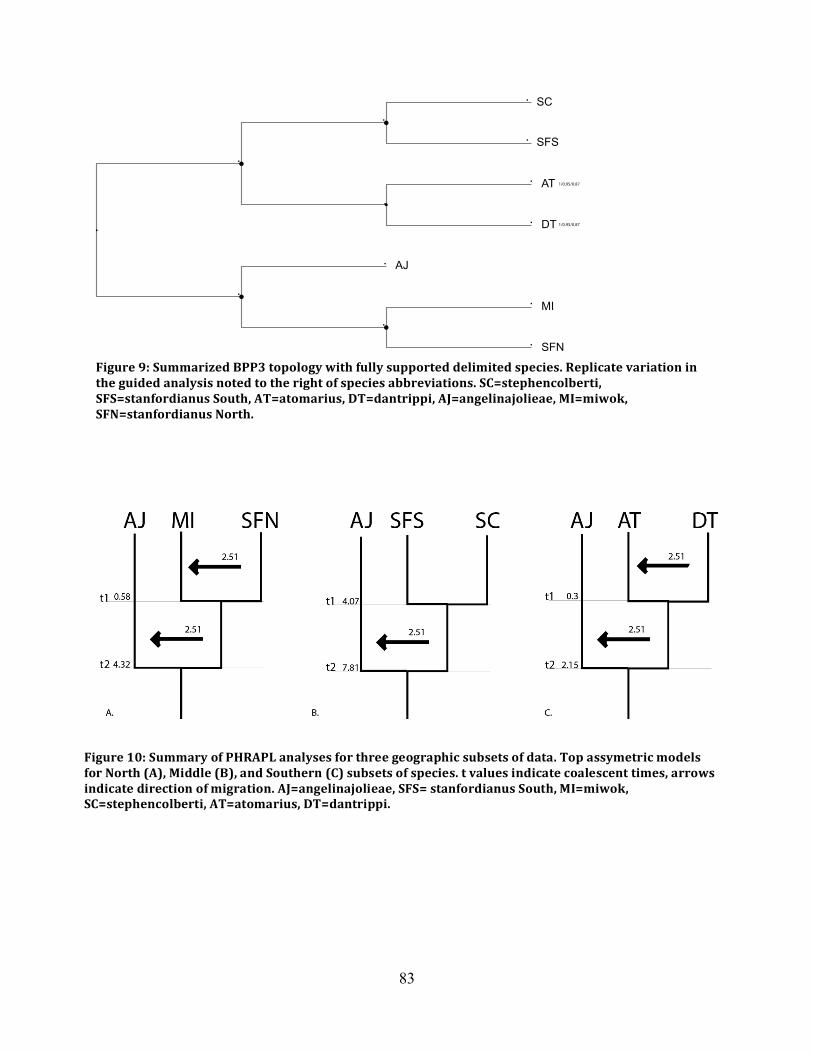
83
Figure 9: Summarized BPP3 topology with fully supported delimited species. Replicate variation in the guided analysis noted to the right of species abbreviations. SC=stephencolberti, SFS=stanfordianus South, AT=atomarius, DT=dantrippi, AJ=angelinajolieae, MI=miwok, SFN=stanfordianus North.
SFN
MI
AJ
DT
AT
SFS
SC
1/0.95/0.87
1/0.95/0.87
0.1
Figure 10: Summary of PHRAPL analyses for three geographic subsets of data. Top assymetric models for North (A), Middle (B), and Southern (C) subsets of species. t values indicate coalescent times, arrows indicate direction of migration. AJ=angelinajolieae, SFS= stanfordianus South, MI=miwok, SC=stephencolberti, AT=atomarius, DT=dantrippi.
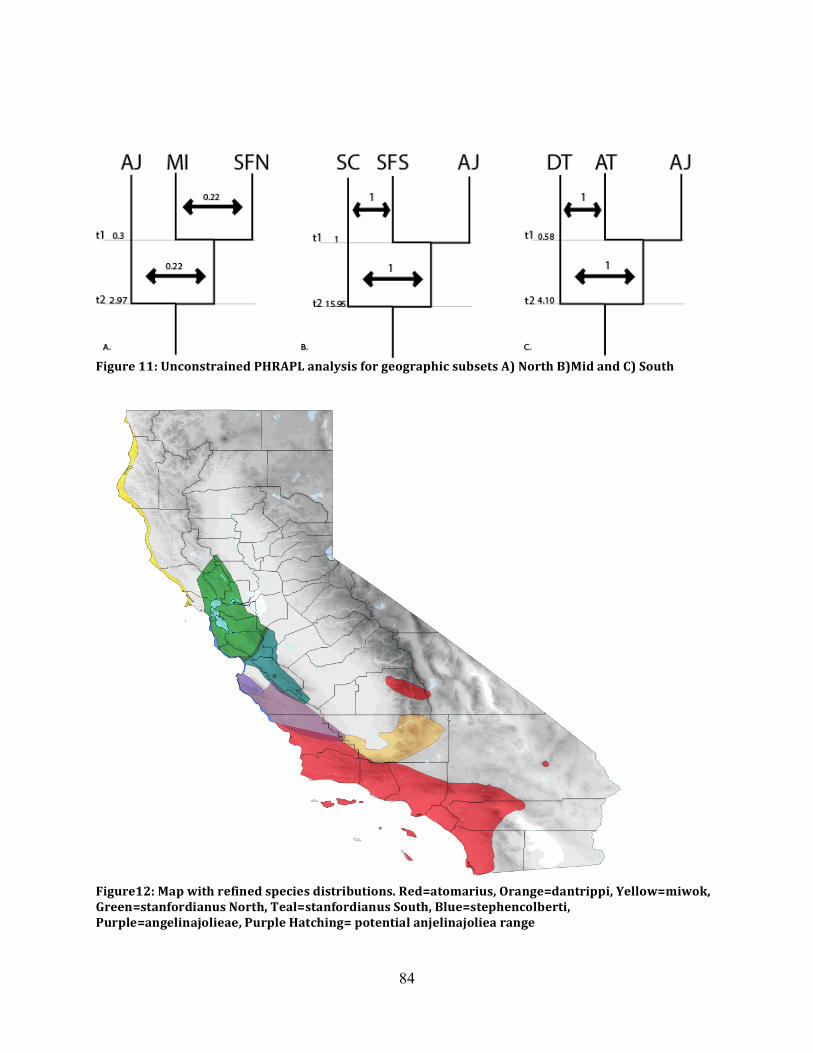
84
Figure 11: Unconstrained PHRAPL analysis for geographic subsets A) North B)Mid and C) South
Figure12: Map with refined species distributions. Red=atomarius, Orange=dantrippi, Yellow=miwok, Green=stanfordianus North, Teal=stanfordianus South, Blue=stephencolberti, Purple=angelinajolieae, Purple Hatching= potential anjelinajoliea range
85
Chapter III Transcriptome characterization of the atomarius species complex: detecting signals of
selection in dune endemic species
Background:
Trapdoor spiders belong to an ancient lineage of chelicerate arthropods, the spider
suborder Mygalomorphae, which includes charismatic fauna such as tarantulas and Australian
funnel-web spiders. These spiders are sedentary, fossorial predators, which build silk-lined
burrows; females are non-vagile and mature males emerge seasonally to search for females
(Bond et al., 2012). Mygalomorph spiders contain considerably less extant species diversity (348
genera, 3846 species) than their Araneomorph relatives (3,732 genera, 44,534 species) (WSC,
2018), and have historically received less attention in the scientific literature. They present
several challenges to researchers interested in performing rigorous experimental studies; they can
be difficult to collect in large numbers from across their ranges, they are remarkably long lived
and take years to reach sexual maturity (Main, 1978; Bond et al., 2001), and until recently very
few genetic markers and no genomic resources were available for the suborder (but see
Sanggaard et al., 2014; Hamilton et al., 2016). At the same time, they pose considerable appeal
in terms of investigating physiological adaptation to harsh environments (Mason et al., 2013),
longevity (Criscuolo et al., 2010), evolution and application of novel venom peptides (Diego-
Garcia et al., 2016), chemosensory systems (Perez-Miles et al., 2017), genome size evolution
(Gregory & Shorthouse, 2003), and historical biogeography to name a few.
With technological advances in sequencing, opportunities to begin generating genomic
resources for non-model arthropods have increased substantially, from only 3 genomes in 2002
to over 540 at varying levels of completeness (27 at the chromosome level, 63 at the contig level,
458 at the scaffold level; https://www.ncbi.nlm.nih.gov/genome/browse#!/eukaryotes/). Even
86
more accessible methods for non-model organisms such as phylogenomics, targeted genomic
sequencing approaches, and comparative transcriptome efforts have begun to provide
foundational datasets which may help resolve long standing evolutionary questions and open
new paths of inquiry for insects (Yeates et al., 2016), spiders (Garrison et al., 2016; Wheeler et
al., 2018), diplopods (Rodriguez et al., 2018), and other arthropod groups (Schwentner et al.,
2017). Within mygalomorphs, second-generation sequencing approaches have recently been
applied to the study of venoms (Undheim et al., 2013), chemosensory systems (Frías-López et
al., 2015), cryptic speciation (Leavitt et al., 2015), and higher-level systematics (Hedin et al.,
2018). At the family level, publicly available sequence data for mygalomorph spiders has
increased exponentially in the last five years due to large-scale phylogenomic analyses however;
utilization of high-throughput information to search for signatures of selection at the species
level is terra incognita in mygalomorph research. The ability to carry out such studies at the
species/population interface is hindered by a lack of appropriate foundational genomic datasets,
as is the case for many non-model or ‘obscure model organisms’ (Matz, 2017); only one
mygalomorph spider genome has been partially sequenced, for the tarantula Acanthoscurria
geniculata, but remains in the scaffolding stage (Sanggaard et al., 2014) and has likely been
diverging from trapdoor spiders for ~114MY (Garrison et al., 2016). The overarching goal of
this study is to build genomic resources and generate preliminary functional annotations for
transcriptomes of an ecologically diverse trapdoor spider sister species complex.
The Aptostichus atomarius complex is a closely related set of sister species pairs, a
sibling species complex, distributed throughout the Coastal Ranges in the California Floristic
Province. Of the seven members, two species are chaparral dwelling, two are coastal dune
endemics, and three inhabit the inland hills and valleys of central California west of the Central
87
Valley. The two dune species represent independent colonization of dune habitats, and though
they share phenotypic features of light pigmentation and reduced abdominal patterning (Bond &
Stockman, 2008), they are not sister taxa (Chapter 2). Aptostichus miwok occupies dune habitats
north of the San Francisco Bay and A. stephencolberti is distributed along beaches further to the
south (Figure 1). We have utilized RNAseq derived sequences to generate draft transcriptome
assemblies, annotations, and search for gene families under selection within the A. atomarius
complex; we specifically test for positive selection in detected orthologs along branches of the
species tree leading to dune endemic members. We also assess transcriptome level conservation
across the complex and between A. atomarius members and two outgroup Aptostichus species
representing varying levels of taxonomic distance from the species complex ingroup.
Materials and Methods:
Adult female spiders were collected from known localities with mitochondrial evidence
for clade assignment (Bond, 2012) for five of the six currently recognized species in the
atomarius complex (A. atomarius, angelinajolieae, A. stephencolberti, A. miwok, and A.
stanfordianus North); one individual from the putative cryptic species A. stanfordianus South
(see Chapter 2) was also obtained. Two outgroup taxa, A. barackobamai and A. simus, were also
sampled for this study. After burrow excavation, all spiders were placed in individual containers
with sterile tissue wipers molded into a burrow shape, transported back to the lab, and held for
two weeks under the same conditions (room temp, minimal light exposure, daily hydration, no
food). After a multi-week holding period, spiders were removed from their artificial burrows and
flash frozen in preparation for RNA extraction. The prosomal region of each spider was cut
diagonally in half and, with the distal portion of one leg, was ground in liquid nitrogen before
88
being transferred to a tube containing 1mL TRIzol. RNA was extracted following the TRIzol
protocol with an additional RNA purification step using the RNeasy kit (Qiagen). Samples were
checked for high quality via spectrometry and gel electrophoresis and sent to the Genomic
Services Center at HudsonAlpha (Huntsville, Alabama) for paired end sequencing on the
Illumina HiSeq platform (50bp, 25-50 million reads). Collection and processing of spiders in this
study happened in three pulses – sequencing details, raw sequence statistics, and locality
information for each specimen is summarized in Table 1.
Assembly and Assessment of Completeness
Raw sequence reads were processed with the program FastQC to evaluate sequence
quality and content. Guided by the FastQC results, residual Illumina adapters were removed with
Trimmomatic (Bolger, Lohse, & Usadel, 2014) during assembly. The program Trinity (v2.2.0;
Grabherr et al., 2011; Haas et al., 2013) was used to generate de novo assemblies for each of the
individuals, using default paired end parameters. To estimate assembly statistics and provide
expression level data for downstream interpretation of functional annotations, raw reads were
mapped back to their respective assemblies using the programs RSEM (Li & Dewey, 2011) and
TransRate (Smith-Unna et al., 2016). PCR duplicates were removed from raw reads using
samtools rmdup (Li et al., 2009) prior to final mapping to references to ensure more accurate
coverage estimation. TransRate uses the ultrafast alignment algorithm of SNAP (Scalable
Nucleotide Alignment Program; Zaharia et al., 2011) to map reads back to transcriptomes and
the alignment-free mapping software salmon (Patro et al., 2017) to assign multi-mapping reads
and generate coverage values. TransRate generates a filtered subset of contigs based on read
coverage evidence as well as descriptive statistics about each assembly. After assembly, 12S-
89
tRNA Val-16s mitochondrial fragments were extracted and used to match samples to previously
sequenced haplotypes and confirm species identities.
BUSCOv3 (Benchmarking Universal Single-Copy Orthologs; Waterhouse et al., 2017;
Siman et al., 2015) was used to determine completeness of the assembly relative to a curated,
highly conserved set of single-copy orthologs housed in the OrthoDB online database. The
BUSCO pipeline first translates and detects open reading frames (ORFs) within a set
transcriptome contigs (using TransDecoder; http://transdecoder.github.io), then uses hidden
markov models (HMMER; Finn, Clements, & Eddy, 2011) to search the curated ortholog set for
matches, accepting those sequences which are recovered as reciprocal best hits to the reference
species of choice. For this study BUSCO was used to determine the proportion and quality
(complete, fragmented, duplicated) of 2,675 core arthropod (fly reference species) and 1066 core
spider (Parasteatoda reference) orthologs present in each transcriptome. BUSCO analyses were
executed on the CyVerse Discovery Platform (www.cyverse.org) for all species.
The transcriptomes were further evaluated for taxonomic identity of sequence clusters
using MCSC decontamination (Lafonde-Lapalme et al., 2017). MCSC uses hierarchical
clustering approach and incorporates taxonomic information from BLAST (Altschul et al., 1990)
hits to the UniRef90 cluster database to determine which sequences likely represent the focal
organism and which may represent contaminating organisms. Contamination can arise from
sources within and on the surface of the extracted tissues or potentially during sample/library
preparation and sequencing via sample bleeding (Mitra et al., 2015). Though the expectation is
minimal contamination given the tissue types chosen, MCSC was used to exclude transcripts
with no homology to known spider or arthropod transcripts in the final set of contigs. MCSC was
employed at the phylum level; Arthropoda best hits were preferentially retained. Taxonomic
90
distributions based on BLAST hits for each of the species were parsed from the MCSC results
and ‘good’ transcripts represented in both the MCSC and TransRate filtered files were used for
downstream ortholog inference.
Functional Annotation
Annotations were added to the full set of transcripts for each species using the Trinotate
pipeline. First, untranslated transcriptome sequences and predicted open reading frames for each
species were subjected BLAST+ (Camacho et al., 2008) searches of the UniProt peptide database
(blastx and blastp respectively). Additional blastp and blastx searches were conducted using
proteins predicted from the reference tarantula transcriptome (Sanggaard et al., 2014
Supplementary Data 4) as a database. Next, HMMER was used to search for protein family
domains using the PfamA database (Punta et al., 2012), signalP (Petersen et al., 2011) was used
to search for signal peptide cleavage sites, tmHMM (Krogh et al., 2001) was used to identify
transmembrane regions, and RNAmmer (Lagesen et al., 2007) was used to detect any ribosomal
RNA present in the samples. Trinotate output includes eggnog (Powell et al., 2012) and KEGG
(Kanehisa et al., 2012) associated terms for all annotated contigs when able. All results were
loaded into a boilerplate sqlite database before being exported into a tab-delimited report that
could be parsed in downstream analyses.
OrthoFinder (Emms & Kelly, 2015) and the online ortholog visualization tool OrthoVenn
(Wang et al., 2015) were used to identify and compare sets of orthologs across the Aptostichus
samples and within the atomarius ingroup. OrthoFinder offers improved accuracy and recovery
relative to several other ortholog detection programs by overcoming sequence length biases in
ortholog detection (Emms & Kelly, 2015). The full complement of coding sequences predicted
from each transcriptome and the filtered set (TransRate/MCSC overlap) was processed with
91
OrthoFinder to determine orthogroup overlap and identify species-specific orthogroups.
OrthoVenn is an online orthology server which combines OrthoMCL, BLAST homology
searches of the swissprot reference database, and inparalog detection with orthAgogue (Ekseth,
Kuiper, & Mironov, 2013) to generate interactive visualizations of whole genome/transcriptome
comparisons. In OrthoVenn, the filtered and translated transcripts were analyzed for the full A.
atomarius complex ingroup.
Detection of Gene Families Under Selection
The FUSTr pipeline (Families Under Seletction in Transcriptomes; Cole & Brewer,
2017) was used to explore patterns of selection 1) within the atomarius complex and 2) within
dune endemic species. For detection of genes under selection, the full set of transcripts was
utilized for each species under the expectation that rare or lowly expressed transcripts may
contribute to a pattern of gene family expression in a biologically meaningful way. This
approach provides the maximum amount of transcriptome wide information while still allowing
for incorporation of confidence estimates from TransRate, MCSC, and RSEM in post-analysis
interpretation of findings if necessary. FUSTr first translates sequences and predicts open
reading frames (TransDecoder), infers homology using blastp and the transitive clustering
algorithm of SiLix (Miele, Penel, & Duret, 2011), generates multiple sequence alignments of
clusters using mafft (Katoh & Standley, 2013), and builds phylogenetic trees for each family
using FastTree (Price, Dehal, & Arkin, 2009) prior to detection of selection. In families
containing at least 15 members, site-specific tests for positive selection (amino acid level) are
performed using codeml v4.9 (Yang, 2007) and log likelihood values are compared to those of
models excluding positive selection. The result of FUSTr analysis is a list of gene families
detected, and a file highlighting those containing at least one site where the ratio of non-
92
synonymous to synonymous changes (dN/dS ratios, ω) exceeded 1, indicating strong positive
selection.
Tests for positive selection along branches leading to dune endemic species A. miwok and
A. stephencolberti were implemented using the COATS pipeline (unpublished, Brewer in prep),
which is designed to examine selection within the context of a species tree. The species tree
generated in Chapter 2 with the most corroboration across analyses (Figure 1 legend) was given
to the pipeline for the multi-species analysis pathway depicted in Figure 2. Briefly,
TransDecoder predicted ORFs are subjected to an all versus all blastp search, reciprocal best hit
loci are used to generate fasta files with orthologous sets of loci, orthologous sets are searched
using a reference taxon (in our case the dune species A. stephencolberti), orthologs are aligned
using mafft, pal2nal.pl (Mikita, Torrence, & Bork, 2006) is used to assign codon positions to
sequences using the translated ORF and corresponding nucleotide sequences, poorly aligned sites
in alignments are masked using Aliscore/Alicut (Kuck, 2009), alignments with too few taxa are
removed, and multi-species PAML (Yang, 2007) analyses are performed on the remaining
alignments. A selection of representative sequences from alignments of orthogroups under
selection (top results of FUSTr and COATS) were submitted to the I-TASSER server
(http://zhanglab.ccmb.med.umich.edu/I-TASSER) for automated comparison of tertiary structure
to known structural models housed in the PDB (Protein Data Bank).
Results and Discussion:
Raw read counts ranged from ~27 to 61 million paired reads, averaging ~29 million for
the 25M read sequencing design (A. atomarius, A. angelinajolieae, A. miwok, A. stanfordianus
North, and A. stephencolberti) and ~49 million for the 50M design (A. stanfordianus South, A.
barackobamai, A. simus). Mean base quality scores as assessed by FastQC were >30 for all raw
93
reads, however post sequencing adapter contamination was detected and removed using
Trimmomatic during assembly. Pre- and post-assembly statistics for each transcriptome can be
found in Table 1; total number of assembled contiguous sequences ranged from 30,871- 61,516
with a mean length of 636 and average GC content of 40%. A. stephencolberti had the fewest
contigs (30,871), while A. stanfordianus North had the most (61,516). On average, there were
~35,700 unique genes with isoform group size ranging from 2-38. Isoform distribution was less
expansive for earlier sequencing events (25M PE samples), group size decreased drastically for
all assemblies beyond the 3-isoform category (Figure 3). RSEM mapping rates prior to de-
duplication ranged from 71.7-86.6%, with larger more isoform rich transcriptomes averaging
72% and less diverse assemblies averaging 84%. Assessment of completeness via TransRate
resulted in ‘good’ sequence files containing ~17,260 contigs on average. Mapping rates
determined by SNAP and salmon were lower than those generated via RSEM with an average
mapping rate of 66% and ‘good’ mapping rates averaging 58%. Mitochondrial matching of
samples to previously sequenced localities was successful in all but two cases: A. atomarius and
A. stanfordianus South may represent a previously unrecognized clade of Aptostichus occurring
south of the A. angelinajolieae range (see Figure 1, angelinajolieae-like). This clade was found
to be sister to A. angelinajolieae in the recent revision of the genus (Bond 2012), but was not
explicitly analyzed in the species tree analyses of Chapter 2. Original species names have been
retained for the purposes of this study, pending further examination of speciation within the
complex.
Completeness as assessed by BUSCO showed that Aptostichus transcriptomes were
~64% ‘complete’ when compared to the Parasteatoda reference sequences. The smallest
transcriptome, A. stephencolberti was the least complete (52%) while A. stanfordianus South
94
was the most (72%). The proportion of single-copy, duplicated, fragmented and missing genes
can be seen in Figure 4 for all species. Of the genes missing, 77 were missing from all of the
Aptostichus transcriptomes. Missing sequences were found to represent 5 functional annotation
clusters by the online functional annotation tool DAVID (Huang et al., 2009a; Huang et al.,
2009b). Two KEGG pathways were identified, having multiple components missing – the
Fanconi anemia and glycerophospholipid metabolism pathways. A table of the associated
pathways and IDs in each cluster can be found in the supplemental materials (Supplemental Doc
1).
Decontamination with MCSC revealed high taxonomic affinity with Arthropoda for
sequences that had matches to the uniref90 database (Figure 5); however, most transcripts had no
similarity to sequences in the database. Despite this, MCSC recovered ~27,247 sequences on
average which passed the taxonomy/clustering filter. The full complement of transcripts was
processed with OrthoFinder and high confidence sequences representing overlap between MCSC
and TransRate were processed with OrthoVenn, generating a rich resource of orthologous
clusters for species level comparisons. For the atomarius complex ingroup, OrthoFinder assigned
96,946 genes (88.1% of total) to 18,273 orthogroups. Fifty percent of all genes were in
orthogroups with 6 or more genes (G50 was 6) and were contained in the largest 6,577
orthogroups (O50 was 6,577). There were 5,770 orthogroups with all species present and 2,127
of these consisted entirely of single-copy genes. When the outgroup taxa were compared as well,
OrthoFinder assigned 13,4045 genes (89.1% of total) to 19,773 orthogroups. Fifty percent of all
genes were in orthogroups with 8 or more genes (G50 was 8) and were contained in the largest
6,230 orthogroups (O50 was 6230). There were 4,799 orthogroups with all species present and
1,338 of these consisted entirely of single-copy genes. Table 2 shows total numbers of orthologs
95
(diagonal), species-specific orthogroups (diagonal, parentheses), total orthogroup overlap
between species (lower left triangle) and one-to-one ortholog overlap between species (upper
right triangle). Uncorrected pairwise distances were calculated for alignments of single copy
orthogroups recovered in the OrthoFinder analysis including outgroups (n=1,338) using the
EMBOSS utility distmat (Rice, Longden, & Bleasby 2000) and visualized using R (Figure 6).
Figure 7 illustrates the A. atomarius ingroup overlap of clusters as determined by OrthoVenn. In
total, the high confidence filtering of transcripts yielded 1,296 orthogroup clusters with
representative sequences from all species; more species-specific clusters were detected with this
method (tips of venn diagram) and there were only 717 single copy gene clusters.
FUSTr detected 46 gene families under some degree of positive selection (Supp. Table 1)
within the atomarius complex ingroup, with the number of sites under selection ranging from 1
(n=26) to 18 (n=1). Four of the five top clusters under selection were composed of venom
related peptides. The cluster of orthologs with the most sites under selection shared significant
homology with the ICK (inhibitor cysteine knot) protein family, a group of hyperstable small
peptides which have been detected in most spider venom proteomes (King and Hardy, 2013).
The specific peptides detected in Aptostichus most closely resemble the Aptotoxins (a.k.a.
Cyrtautoxins; Herzig et al., 2010), isolated from the mygalomorph spider Apomastus schlingeri
Bond and Opell 2002 with BLAST identities ranging from 42-59% (Figure 8). When the
Aptostichus ICK peptide structure was compared to the PDB database, it was found to most
resemble U4-hexatoxin-Hi1a with a very high TM-align score of 0.962 (Figure 9). Not only do
these venoms act as strong paralytic insecticides, they are remarkably resistant to proteases and
environmental degradation (extreme pH, organic solvents, temperature extremes) making them
candidates for orally active therapeutics (Saez et al., 2010). The cluster with the second highest
96
number of sites under selection belonged to the Kunitz family of venom peptides (Figure 10),
which are serine protease inhibitors (ArachnoServer; Herzig et al., 2010). Other venom peptides
detected in the top 20 families under selection included Techylectin-like homologs (agglutinate
in human erythrocytes and Gram+/- bacteria), and Prokinektin-2-like proteins (CsTx-20,
neurotoxic enhancer). The cluster with the third highest number of sites under selection was an
alpha-tocopherol (vitamin E) transferase family, with 8 sites under strong positive selection.
Only two families were found to be under selection in the dune endemic spiders retinol
dehydrogenase and Cytochrome P450. Both of these families were also detected in the complete
ingroup analysis as well, so this is not likely a dune specific result.
The COATS pipeline revealed 16 orthologous clusters under strong positive selection
that met the 0.05 FDR (false discovery rate) threshold cutoff. Six of these groups matched the
input species tree topology. Among the six groups with the appropriate species tree topology
(Table 3) were Cytochrome P450 2c15 (as in the FUSTr analysis), Niemann Pick C1-like, and
Kainate 2 isoform-like (ionotropic glutamate receptor) as identified by NCBI-BLAST. Both
Niemann Pick and Kainate/glutamate receptor sequences were detected in a recent distal leg-
tissue specific transcriptome analysis of the mygalomorph spider Macrothele calpeiana, and may
play a role in chemosensory function (Frias-Lopez et al., 2015). Aptostichus sequences display
strong similarity (64-85% pairwise identity) at the nucleotide level to four of the six
chemoreception candidate genes identified from leg tissue in that study (2 Niemann Pick C2 and
2 glutamate receptor genes).
Additionally, the COATS pipeline detected selection in a few proteins belonging to
families with some venom associations – sulfotransferase, A disintegrin and metalloproteinase
with thrombospondin motif 5 (ADAMTs5), and even cytochrome p450. Sulfotransferase,
97
thrombin inhibitor/metalloproteinase, and the cytochrome p450 family categories were found to
be highly differentially expressed in the salivary gland secretions of the aptly named Australian
paralysis tick (Ixodes holocyclus; Rodriguez-Valle et al., 2018). Sulfotransferases are also
prominently expressed in the venom transcriptome of the Australian scorpion Urodacus
yaschenkoi (Luna-Ramirez et al., 2015), and ADAMTs5 is phylogenetically closely related and
structurally similar to snake venom metalloproteinases (Takeda 2015). Venom peptide evolution
in spiders is thought to progress in short bursts, perhaps in response to colonization of novel
habitats, followed by long periods of stasis under strong purifying selection. When compared to
the venoms of evolutionarily ‘young’ lineages such as cone snails and snakes, spider venoms
display remarkable conservation over large taxonomic distances (Sunagar & Moran, 2015).
For Aptostichus, this work provides a foundation for future studies of the connection
between speciation, genome-wide divergence, and adaptation to coastal dune habitats. The
changes in phenotype seen in dune lineages likely represent the shallowest level of response to
dune colonization; for reasons yet to be determined, there appears to be positive selection at the
amino acid level for genes related to venom production, metabolism, and sensory systems. To a
colonizing organism, dune habitat would present many abiotic and biotic elements that differ
from inland habitats and might, over evolutionary timescales, result in signals of selective
pressure. Drought, disturbance, and the unique chemical composition of dune soils have led to
the development of specific community structures in sand dune ecosystems particularly across
the dune-inland gradient (McLachlan, 1991). Implications of Aptostichus dune colonization
might include 1) higher levels of oxidative stress (from temperature extremes, increased salinity,
and a decrease in soil moisture) requiring or resulting in altered metabolic responses 2) a diet that
is divergent in species composition from inland habitats and a concurrent decrease in venom
98
efficacy 3) altered macro and micronutrient availability 4) changes in the microbiome or
composition of burrow associated soil bacteria/fungi 5) engineering challenges associated with
constructing and maintaining a burrow in shifting sand or 6) an altered signaling landscape due
to substrate and vegetation changes resulting in behavioral modifications to male search
strategies. Some, or many, of these elements may have led to the observed patterns in dune
Aptostichus transcripts, however, the complexity of both the habitat and transcriptional patterns
will require much more fine-scale analysis to make strong connections between ecology and
species-specific adaptations.
Conclusions:
There is great potential in this system for further comparative studies, both between dune
species and their inland sisters and between independent dune lineages. Biological and technical
replicates will be needed to further facilitate understanding the quantitative differences among
species within the atomarius complex. Additionally, tissue specific and transcriptomes sampled
from males may be very revealing in this group – increasing resolution and specificity of datasets
will make inferring function easier and examining males, with their reduced life span, altered
phenotype, and epigean life stage, would provide a more complete picture of dune adaptation. To
extract the maximal amount of insight from resources like those generated in this study,
complementary natural history studies must be carried out as well. What are they eating? When
do they move across the landscape and why? How are they communicating, what kinds of
interactions are they having with each other? Are there species -specific parasitoid pressures that
might impact population dynamics and chemical communication? More detailed knowledge of
the constraints imposed upon these spiders and the associated life history strategies they employ
99
will help guide future work and provide better context for the results of the current study. Guided
by this study, areas of interest might include specific differences in composition and nutritional
content of diet, abiotic dune parameters, and secretion of volatile compounds which might be
associated with inter or intra species signaling.
The transcriptome assemblies presented here represent a novel genomic resource for
researchers interested in spider and chelicerate evolution or species level variation in
transcription. We have developed a preliminary transcript level reference of shared orthologs for
a closely related set of mygalomorph spiders, detected genes under putative positive selection in
independent colonizers of dune habitats, and recovered gene families containing novel peptides
across the atomarius species complex. While they may not represent ideal laboratory subjects
and have not received much scientific attention, mygalomorphs harbor a vast amount of
evolutionary insight regarding early animal evolution, physiology, and synthesis of potent
chemical cocktails. This oversight is now well within our ability to correct, with additional
resources being added and curated daily in online databases and software development
proceeding at a rapid pace. Developing foundational datasets for even the most obscure
organisms is now possible, and may lead to significant advances in our understanding of this
group’s fascinating and ancient evolutionary history.
100
References:
Altschul S.F., Gish W., Miller W., Myers E.W., Lipman D.J. (1990). Basic local alignment search tool. Journal of Molecular Biology, 215, 403-10.
Bolger, A.M., Lohse, M., & Usadel, B. (2014). Trimmomatic: A flexible trimmer for Illumina Sequence Data. Bioinformatics, btu170.
Bond, J.E. (2012). Phylogenetic treatment and taxonomic revision of the trapdoor spider genus Aptostichus Simon (Araneae, Mygalomorphae, Euctenizidae). ZooKeys, (252), 1.
Bond, J.E., Hedin, M.C., Ramirez, M.G., & Opell, B.D. (2001). Deep molecular divergence in
the absence of morphological and ecological change in the Californian coastal dune endemic trapdoor spider Aptostichus simus. Molecular Ecology, 10(4), 899-910.
Bond, J.E., Hendrixson, B.E., Hamilton, C.A., & Hedin, M. (2012). A reconsideration of the classification of the spider infraorder Mygalomorphae (Arachnida: Araneae) based on three nuclear genes and morphology. PLoS One, 7(6), e38753.
Bond, J.E., & Stockman, A.K. (2008). An integrative method for delimiting cohesion species:
finding the population-species interface in a group of Californian trapdoor spiders with extreme genetic divergence and geographic structuring. Systematic Biology, 57(4), 628-646.
Camacho C., Coulouris G., Avagyan V., Ma N., Papadopoulos J., Bealer K., & Madden T.L.
(2008). BLAST+: architecture and applications. BMC Bioinformatics, 10:421. Cole, T. J., & Brewer, M. S. (2018). FUSTr: a tool to find gene Families Under Selection in
Transcriptomes. PeerJ, 6, e4234. Criscuolo, F., Font-Sala, C., Bouillaud, F., Poulin, N., & Trabalon, M. (2010). Increased ROS
production: a component of the longevity equation in the male mygalomorph, Brachypelma albopilosa. PloS One, 5(10), e13104.
Diego-García, E., Cologna, C.T., Cassoli, J.S., & Corzo, G. (2016). Spider Transcriptomes from
Venom Glands: Molecular Diversity of Ion Channel Toxins and Antimicrobial Peptide Transcripts. Spider Venoms, 223-249.
Ekseth, O.K., Kuiper, M., & Mironov, V. (2013). orthAgogue: an agile tool for the rapid
prediction of orthology relations. Bioinformatics, 30(5), 734-736. Emms, D.M., & Kelly, S. (2015). OrthoFinder: solving fundamental biases in whole genome
comparisons dramatically improves orthogroup inference accuracy. Genome Biology, 16(1), 157.
101
Finn, R.D., Clements, J., & Eddy, S.R. (2011). HMMER web server: interactive sequence similarity searching. Nucleic Acids Research,Web Server Issue 39:W29-W37.
Frías-López, C., Almeida, F.C., Guirao-Rico, S., Vizueta, J., Sánchez-Gracia, A., Arnedo, M.A., & Rozas, J. (2015). Comparative analysis of tissue-specific transcriptomes in the funnel-web spider Macrothele calpeiana (Araneae, Hexathelidae). PeerJ, 3, e1064.
Garrison, N.L., Rodriguez, J., Agnarsson, I., Coddington, J.A., Griswold, C.E., Hamilton, C.A.,
Hedin, M., Kocot, K.M., Ledford, J.M., & Bond, J.E. (2016). Spider phylogenomics: untangling the Spider Tree of Life. PeerJ, 4, e1719.
Grabherr M.G., Haas B.J., Yassour M., Levin J.Z., Thompson D.A., Amit I., Adiconis X., Fan
L., Raychowdhury R., Zeng Q., Chen Z., Mauceli E., Hacohen N., Gnirke A., Rhind N., di Palma F., Birren B.W., Nusbaum C., Lindblad-Toh K., Friedman N., & Regev A. (2011). Full-length transcriptome assembly from RNA-Seq data without a reference genome. Nature Biotechnology, 29(7):644-652
Gregory, T.R., & Shorthouse, D.P. (2003). Genome sizes of spiders. Journal of Heredity, 94(4),
285-290. Haas, B.J., Papanicolaou, A., Yassour, M., Grabherr, M., Blood, P.D., Bowden, J., Couger,
B.M., Eccles, D., Li, B., Lieber, M., MacManes, M.D., Ott, M., Orvis, J., Pochet, N., Strozzi, F., Weeks, N., Westerman, R., William, T., Dewey, C.N., Henschel, R., LeDuc, R.D., Friedman, N., & Regev, A. (2013). De novo transcript sequence reconstruction from RNA-seq using the Trinity platform for reference generation and analysis. Nature Protocols, 8(8), 1494.
Hamilton, C.A., Lemmon, A.R., Lemmon, E.M., & Bond, J.E. (2016). Expanding anchored
hybrid enrichment to resolve both deep and shallow relationships within the spider tree of life. BMC Evolutionary Biology, 16(1), 212.
Hedin, M., Derkarabetian, S., Ramírez, M.J., Vink, C., & Bond, J.E. (2018). Phylogenomic
reclassification of the world’s most venomous spiders (Mygalomorphae, Atracinae), with implications for venom evolution. Scientific Reports, 8(1), 1636.
Herzig, V., Wood, D.L., Newell, F., Chaumeil, P.A., Kaas, Q., Binford, G.J., Nicholson, G.M,
Gorse, D., & King, G.F. (2010). ArachnoServer 2.0, an updated online resource for spider toxin sequences and structures. Nucleic Acids Research, 39, D653-D657.
Huang D.W., Sherman B.T., & Lempicki R.A. (2009). Systematic and integrative analysis of large gene lists using DAVID Bioinformatics Resources. Nature Protocols, 4(1):44-57.
Huang D.W., Sherman B.T., & Lempicki R.A. (2009). Bioinformatics enrichment tools: paths toward the comprehensive functional analysis of large gene lists. Nucleic Acids Research, 37(1), 1-13.
102
Kanehisa, M., Goto, S., Sato, Y., Furumichi, M., and Tanabe, M. (2012). KEGG for integration and interpretation of large-scale molecular datasets. Nucleic Acids Research, 40, D109-D114.
Katoh, K., & Standley, D.M. (2013). MAFFT multiple sequence alignment software version 7: improvements in performance and usability. Molecular Biology and Evolution, 30(4), 772-780.
King, G.F., & Hardy, M.C. (2013). Spider-venom peptides: structure, pharmacology, and potential for control of insect pests. Annual Review of Entomology, 58, 475-496.
Krogh A., Larsson B., von Heijne G., Sonnhammer E.L. (2001). Predicting transmembrane protein topology with a hidden Markov model: application to complete genomes. Journal of Molecular Biology, 305(3), 567-80.
Kück, P. (2009). ALICUT: a Perlscript which cuts ALISCORE identified RSS. Department of Bioinformatics, Zoologisches Forschungsmuseum A. Koenig (ZFMK), Bonn, Germany, version, 2.
Lafond-Lapalme, J., Duceppe, M.O., Wang, S., Moffett, P., & Mimee, B. (2017). A new method
for decontamination of de novo transcriptomes using a hierarchical clustering algorithm. Bioinformatics, 33(9), 1293-1300.
Lagesen, K., Hallin, P.F., Rodland, E., Staerfeldt, H.H., Rognes, T., & Ussery, D.W. (2007). RNammer: consistent annotation of rRNA genes in genomic sequences. Nucleic Acids Research, 35(9), 3100-3108.
Leavitt, D.H., Starrett, J., Westphal, M.F., & Hedin, M. (2015). Multilocus sequence data reveal dozens of putative cryptic species in a radiation of endemic Californian mygalomorph spiders (Araneae, Mygalomorphae, Nemesiidae). Molecular Phylogenetics and Evolution, 91, 56-67.
Li, B., & Dewey, C.N. (2011). RSEM: accurate transcript quantification from RNA-Seq data with or without a reference genome. BMC Bioinformatics, 12(1), 323.
Li, H., Handsaker, B., Wysoker, A., Fennell, T., Ruan, J., Homer, N., Marth G., Abecasis, G.,& Durbin, R. (2009). The sequence alignment/map format and SAMtools. Bioinformatics, 25(16), 2078-2079.
Luna-Ramírez, K., Quintero-Hernández, V., Juárez-González, V.R., & Possani, L.D. (2015).
Whole transcriptome of the venom gland from Urodacus yaschenkoi scorpion. PloS One, 10(5), e0127883.
Main, B.Y. (1978). Biology of the arid-adapted Australian trapdoor spider Anidiops villosus
(rainbow). Bulletin of the British Arachnological Society, 4, 161-175.
103
Mason, L.D., Tomlinson, S., Withers, P.C., & Main, B.Y. (2013). Thermal and hygric physiology of Australian burrowing mygalomorph spiders (Aganippe spp.). Journal of Comparative Physiology B, 183(1), 71-82.
Matz, M.V. (2017). Fantastic beasts and how to sequence them: ecological genomics for obscure
model organisms. Nature, 36(37), 38. McLachlan, A. (1991). Ecology of coastal dune fauna. Journal of Arid Environments, 21, 229-
243. Miele, V., Penel, S., & Duret, L. (2011). Ultra-fast sequence clustering from similarity networks
with SiLiX. BMC Bioinformatics, 12(1), 116. Mitra, A., Skrzypczak, M., Ginalski, K., & Rowicka, M. (2015). Strategies for achieving high
sequencing accuracy for low diversity samples and avoiding sample bleeding using illumina platform. PloS One, 10(4), e0120520.
Patro R., Duggal G., Love M.I., Irizarry R.A., Kingsford C. (2017). Salmon: fast and bias-aware quantification of transcript expression using dual-phase inference. Nature Methods, 14(4):417-419. doi:10.1038/nmeth.4197.
Pérez-Miles, F., Guadanucci, J. P.L., Jurgilas, J.P., Becco, R., & Perafán, C. (2017). Morphology and evolution of scopula, pseudoscopula and claw tufts in Mygalomorphae (Araneae). Zoomorphology, 136(4), 435-459.
Petersen T.N., Brunak S., von Heijne, G., & Nielsen, H. (2011). SignalP 4.0: discriminating signal peptides from transmembrane regions. Nature Methods, 8, 785-786.
Powell, S., Szklarczyk, D., Trachana, K., Roth, A., Kuhn. M., Muller, J., Arnold, R., Rattei, T., Letunic, I., Doerks, T., Jensen, L.J., von Mering, C., & Bork, P. (2012). eggNOG v3.0: orthologous groups covering 1133 organisms at 41 different taxonomic ranges. Nucleic Acids Research, 40(Database Issue), D284-9.
Price, M.N., Dehal, P.S., & Arkin, A.P. (2009). FastTree: computing large minimum evolution trees with profiles instead of a distance matrix. Molecular biology and evolution, 26(7), 1641-1650.
Punta, P.C. Coggill, R.Y. Eberhardt, J. Mistry, J. Tate, C. Boursnell, N. Pang, K. Forslund, Ceric, J. Clements, A. Heger, L. Holm, E.L.L. Sonnhammer, S.R. Eddy, A. Bateman, R.D. Finn. (2012). The Pfam protein families database. Nucleic Acids Research, 40(Database Issue), D290-D301
Rodriguez, J., Jones, T.H., Sierwald, P., Marek, P.E., Shear, W.A., Brewer, M.S., Kocot, K.M. & Bond, J.E. (2018). Step-wise evolution of complex chemical defenses in millipedes: a phylogenomic approach. Scientific Reports, 8(1), 3209.
104
Saez, N.J., Senff, S., Jensen, J.E., Er, S.Y., Herzig, V., Rash, L.D., & King, G.F. (2010). Spider-venom peptides as therapeutics. Toxins, 2(12), 2851-2871.
Sanggaard, K.W., Bechsgaard, J.S., Fang, X., Duan, J., Dyrlund, T.F., Gupta, V., ... & Han, L.
(2014). Spider genomes provide insight into composition and evolution of venom and silk. Nature communications, 5, 3765.
Schlinger, E.I. (1987). The biology of Acroceridae (Diptera): True endoparasitoids of spiders.
Pp. 319-326, In Ecophysiology of Spiders. (W. Nentwig, ed.). Springer-Verlag, Berlin. Schwentner, M., Combosch, D.J., Nelson, J.P., & Giribet, G. (2017). A phylogenomic solution to
the origin of insects by resolving crustacean-hexapod relationships. Current Biology, 27(12), 1818-1824.
Simão, F.A., Waterhouse, R.M., Ioannidis, P., Kriventseva, E.V., & Zdobnov, E.M. (2015).
BUSCO: assessing genome assembly and annotation completeness with single-copy orthologs. Bioinformatics, 31(19), 3210-3212.
Smith-Unna R.D., Boursnell C.,Patro R., Hibberd J.M., Kelly S. (2016). TransRate: reference
free quality assessment of de-novo transcriptome assemblies. Genome Research doi: http://dx.doi.org/10.1101/gr.196469.115
Sunagar, K., & Moran, Y. (2015). The rise and fall of an evolutionary innovation: contrasting
strategies of venom evolution in ancient and young animals. PLoS Genetics, 11(10), e1005596.
Suyama, M., Torrents, D., & Bork, P. (2006). PAL2NAL: robust conversion of protein sequence
alignments into the corresponding codon alignments. Nucleic Acids Research, 34, W609-W612.
Takeda, S. (2016). ADAM and ADAMTS family proteins and snake venom metalloproteinases:
A structural overview. Toxins, 8(5), 155. Rice, P., Longden, I., & Bleasby, A. (2000). EMBOSS: the European molecular biology open
software suite. Rodriguez-Valle, M., Moolhuijzen, P., Barrero, R.A., Ong, C.T., Busch, G., Karbanowicz, T.,
Booth, M., Clark, R., Koehback, J., Ijaz, H., Broady, K., Agnew, K., Knowles, A.G., Bellgard, M.I., & Tabor, A.E. (2018). Transcriptome and toxin family analysis of the paralysis tick, Ixodes holocyclus. International Journal for Parasitology, 48(1), 71-82.
Undheim, E.A., Sunagar, K., Herzig, V., Kely, L., Low, D.H., Jackson, T.N., Jones, A.,
Kurniawan, N., King, G.F., Ali, S.A., Antunes, A., Ruder, T., & Fry B.G. (2013). A proteomics and transcriptomics investigation of the venom from the barychelid spider Trittame loki (brush-foot trapdoor). Toxins, 5(12), 2488-2503.
105
Wang, Y., Coleman-Derr, D., Chen, G., & Gu, Y. Q. (2015). OrthoVenn: a web server for genome wide comparison and annotation of orthologous clusters across multiple species. Nucleic Acids Research, 43(W1), W78-W84.
Waterhouse, R.M., Seppey, M., Simão, F.A., Manni, M., Ioannidis, P., Klioutchnikov, G.,
Kriventseva, E.V., & Zdobnov, E.M. (2017). BUSCO applications from quality assessments to gene prediction and phylogenomics. Molecular biology and evolution, 35(3), 543-548.
Wheeler, W.C., Coddington, J.A., Crowley, L.M., Dimitrov, D., Goloboff, P.A., Griswold, C.E.,
et al. (2017). The spider tree of life: phylogeny of Araneae based on target gene analyses from an extensive taxon sampling. Cladistics, 33(6), 574-616.
World Spider Catalog (2018). World Spider Catalog. Natural History Museum Bern, online at
http://wsc.nmbe.ch, version 19.0, accessed on 1 March 2018. doi: 10.24436/2 Yang, Z. (2007). PAML 4: phylogenetic analysis by maximum likelihood. Molecular Biology
and Evolution, 24(8), 1586-1591. Yeates, D.K., Meusemann, K., Trautwein, M., Wiegmann, B., & Zwick, A. (2016). Power,
resolution and bias: recent advances in insect phylogeny driven by the genomic revolution. Current Opinion in Insect Science, 13, 16-23.
Zaharia M., Bolosky W.J., Curtis K., Fox A., Patterson D., Shenker S., Stoica I., Karp R.M., &
Sittler, T. (2011). Faster and More Accurate Sequence Alignment with SNAP. arXiv:1111.5572v1
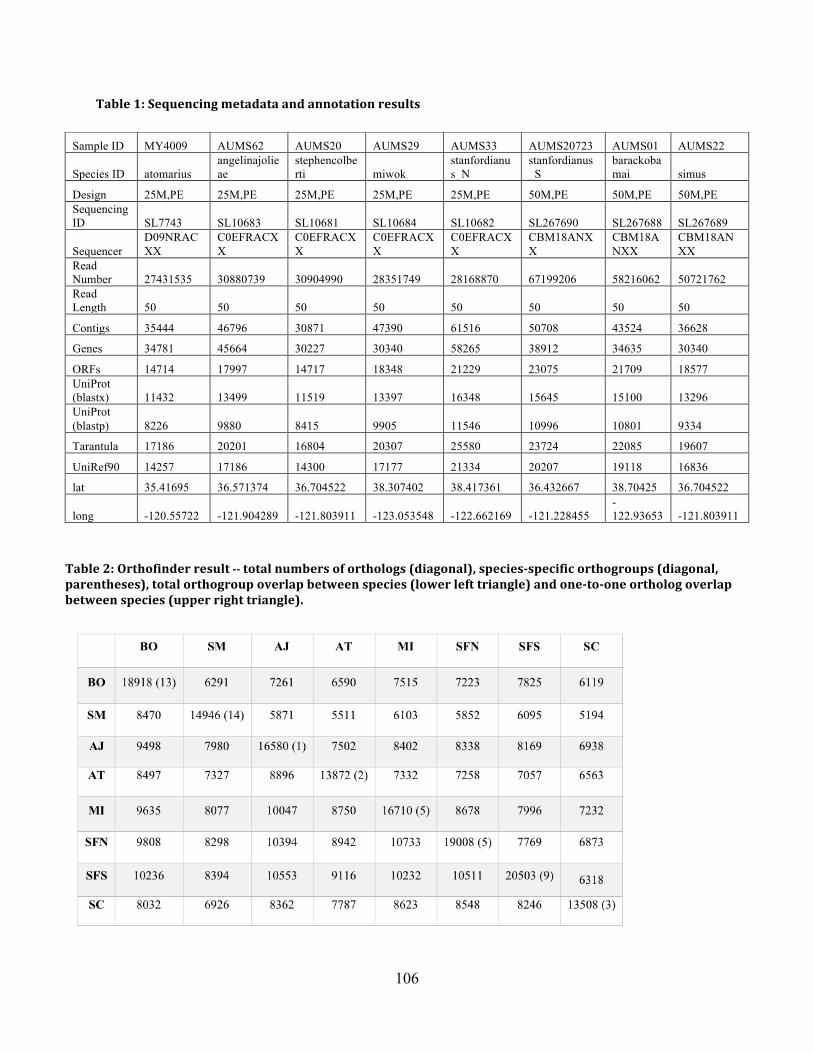
106
Table 1: Sequencing metadata and annotation results
Sample ID MY4009 AUMS62 AUMS20 AUMS29 AUMS33 AUMS20723 AUMS01 AUMS22
Species ID atomarius angelinajolieae
stephencolberti miwok
stanfordianus_N
stanfordianus_S
barackobamai simus
Design 25M,PE 25M,PE 25M,PE 25M,PE 25M,PE 50M,PE 50M,PE 50M,PE Sequencing ID SL7743 SL10683 SL10681 SL10684 SL10682 SL267690 SL267688 SL267689
Sequencer D09NRACXX
C0EFRACXX
C0EFRACXX
C0EFRACXX
C0EFRACXX
CBM18ANXX
CBM18ANXX
CBM18ANXX
Read Number 27431535 30880739 30904990 28351749 28168870 67199206 58216062 50721762 Read Length 50 50 50 50 50 50 50 50
Contigs 35444 46796 30871 47390 61516 50708 43524 36628
Genes 34781 45664 30227 30340 58265 38912 34635 30340
ORFs 14714 17997 14717 18348 21229 23075 21709 18577 UniProt (blastx) 11432 13499 11519 13397 16348 15645 15100 13296 UniProt (blastp) 8226 9880 8415 9905 11546 10996 10801 9334
Tarantula 17186 20201 16804 20307 25580 23724 22085 19607
UniRef90 14257 17186 14300 17177 21334 20207 19118 16836
lat 35.41695 36.571374 36.704522 38.307402 38.417361 36.432667 38.70425 36.704522
long -120.55722 -121.904289 -121.803911 -123.053548 -122.662169 -121.228455 -122.93653 -121.803911
Table 2: Orthofinder result -‐-‐ total numbers of orthologs (diagonal), species-‐specific orthogroups (diagonal, parentheses), total orthogroup overlap between species (lower left triangle) and one-‐to-‐one ortholog overlap between species (upper right triangle).
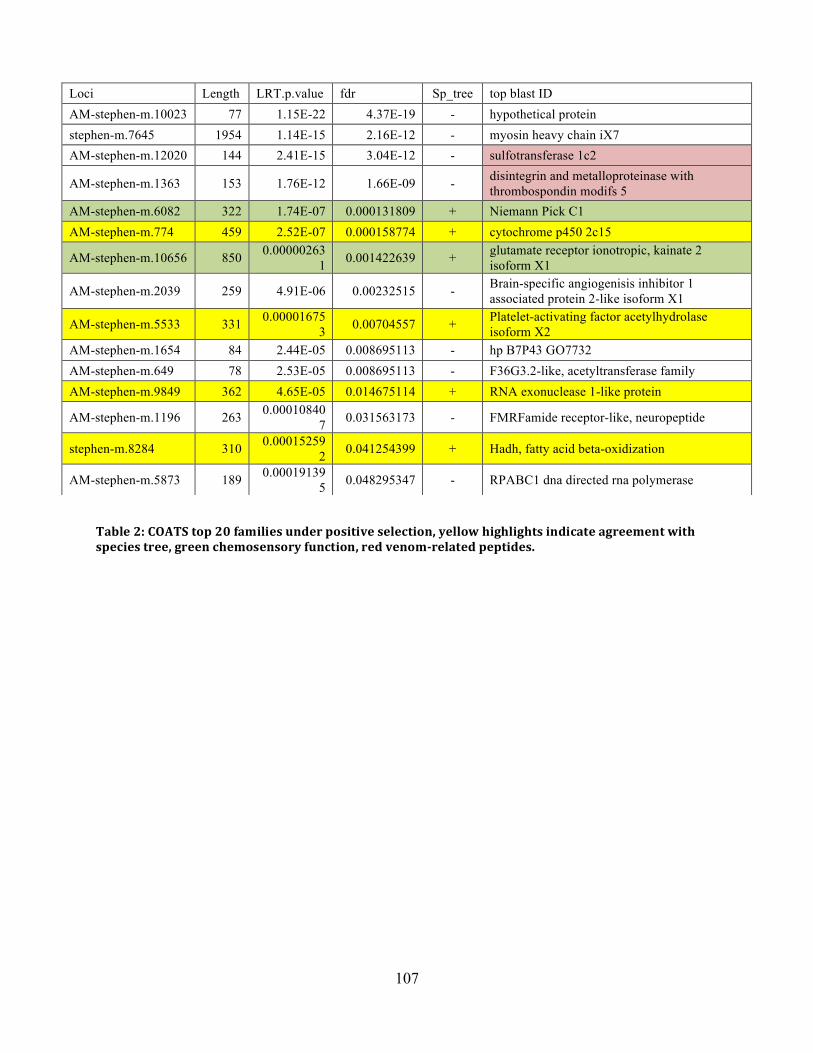
107
Loci Length LRT.p.value fdr Sp_tree top blast ID AM-stephen-m.10023 77 1.15E-22 4.37E-19 - hypothetical protein stephen-m.7645 1954 1.14E-15 2.16E-12 - myosin heavy chain iX7 AM-stephen-m.12020 144 2.41E-15 3.04E-12 - sulfotransferase 1c2
AM-stephen-m.1363 153 1.76E-12 1.66E-09 - disintegrin and metalloproteinase with thrombospondin modifs 5
AM-stephen-m.6082 322 1.74E-07 0.000131809 + Niemann Pick C1 AM-stephen-m.774 459 2.52E-07 0.000158774 + cytochrome p450 2c15
AM-stephen-m.10656 850 0.000002631 0.001422639 + glutamate receptor ionotropic, kainate 2
isoform X1
AM-stephen-m.2039 259 4.91E-06 0.00232515 - Brain-specific angiogenisis inhibitor 1 associated protein 2-like isoform X1
AM-stephen-m.5533 331 0.000016753 0.00704557 + Platelet-activating factor acetylhydrolase
isoform X2 AM-stephen-m.1654 84 2.44E-05 0.008695113 - hp B7P43 GO7732 AM-stephen-m.649 78 2.53E-05 0.008695113 - F36G3.2-like, acetyltransferase family AM-stephen-m.9849 362 4.65E-05 0.014675114 + RNA exonuclease 1-like protein
AM-stephen-m.1196 263 0.000108407 0.031563173 - FMRFamide receptor-like, neuropeptide
stephen-m.8284 310 0.000152592 0.041254399 + Hadh, fatty acid beta-oxidization
AM-stephen-m.5873 189 0.000191395 0.048295347 - RPABC1 dna directed rna polymerase
Table 2: COATS top 20 families under positive selection, yellow highlights indicate agreement with species tree, green chemosensory function, red venom-‐related peptides.
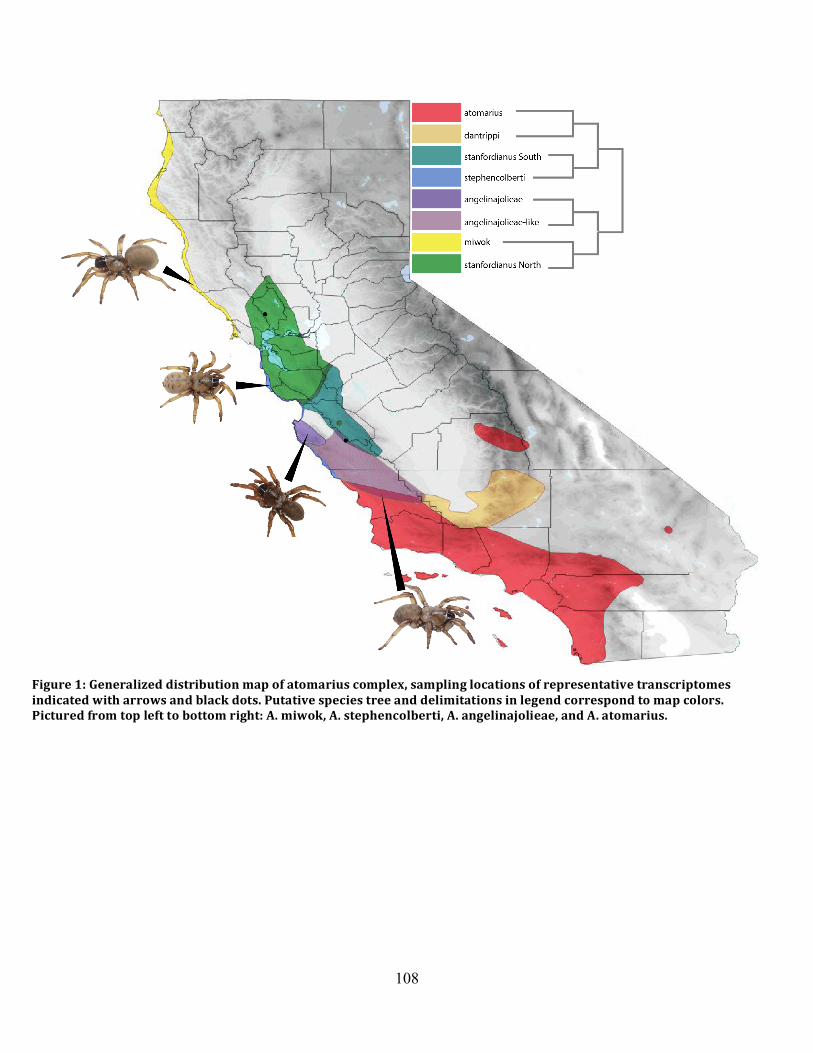
108
Figure 1: Generalized distribution map of atomarius complex, sampling locations of representative transcriptomes indicated with arrows and black dots. Putative species tree and delimitations in legend correspond to map colors. Pictured from top left to bottom right: A. miwok, A. stephencolberti, A. angelinajolieae, and A. atomarius.
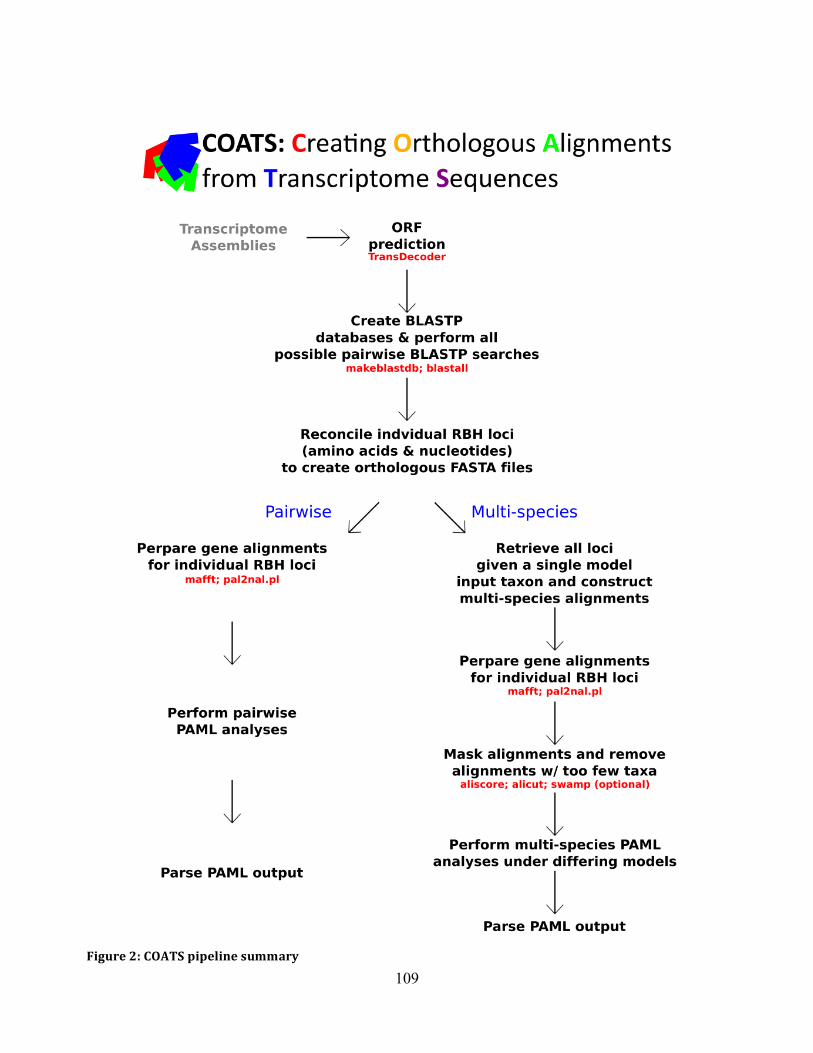
109
Figure 2: COATS pipeline summary
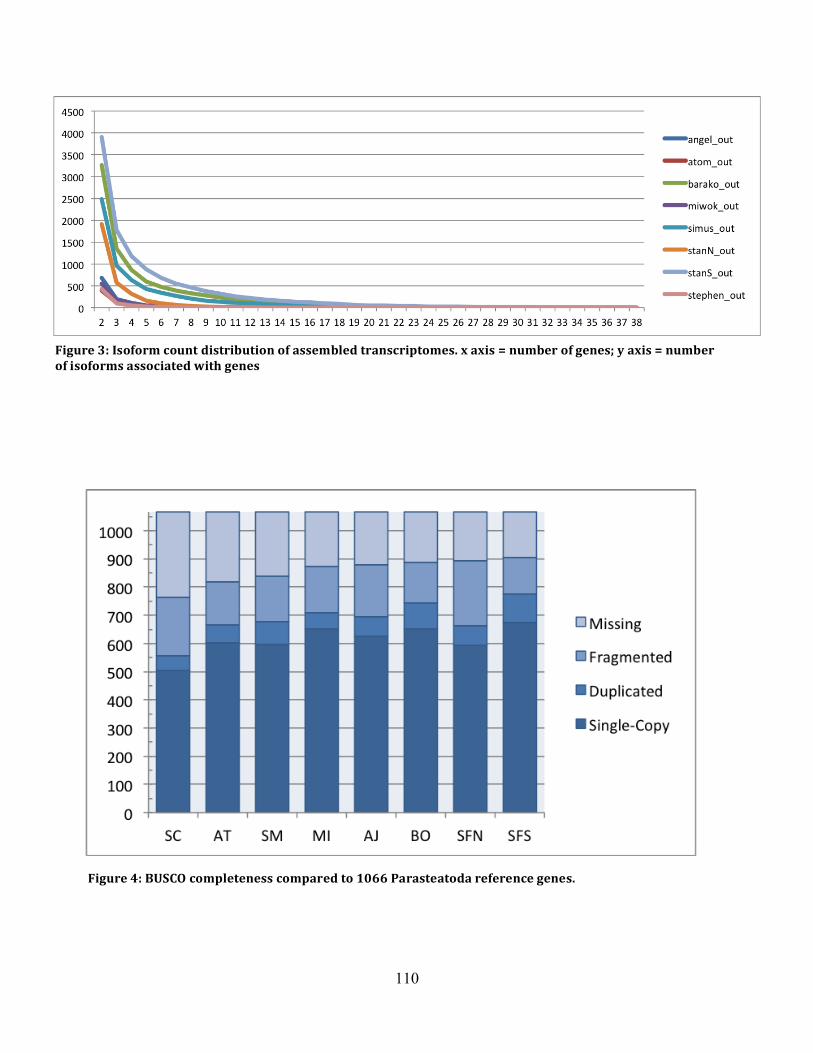
110
Figure 3: Isoform count distribution of assembled transcriptomes. x axis = number of genes; y axis = number of isoforms associated with genes
Figure 4: BUSCO completeness compared to 1066 Parasteatoda reference genes.
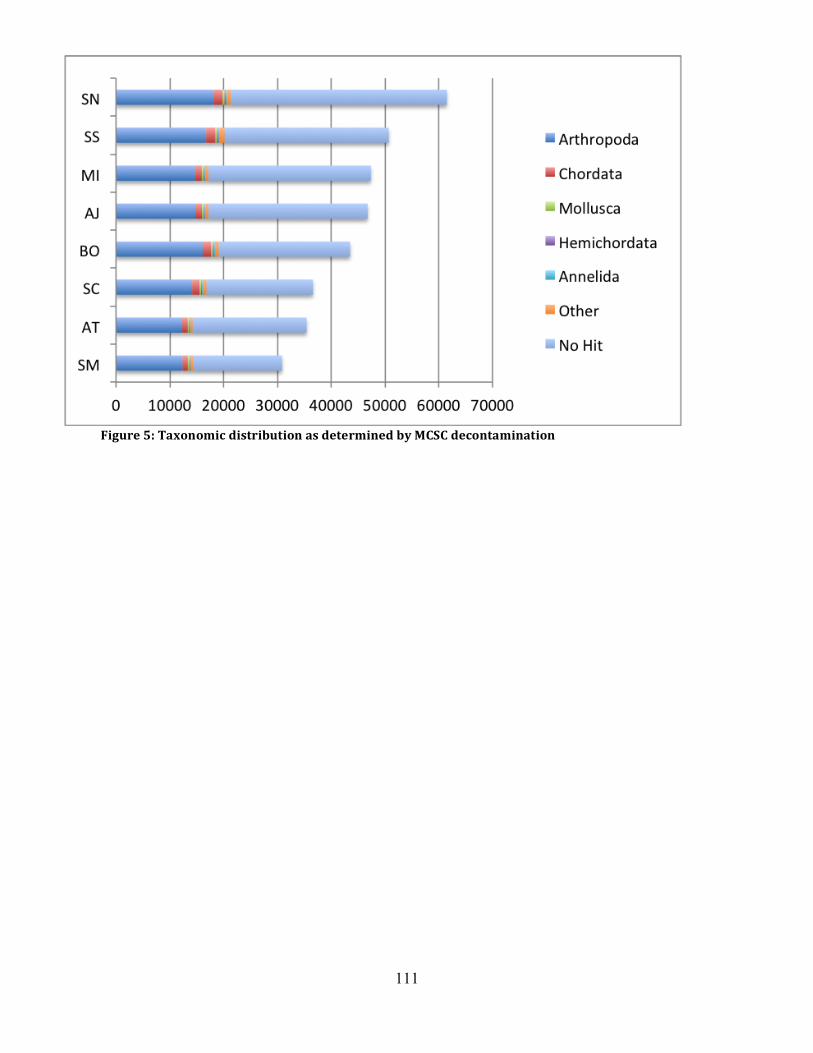
111
Figure 5: Taxonomic distribution as determined by MCSC decontamination
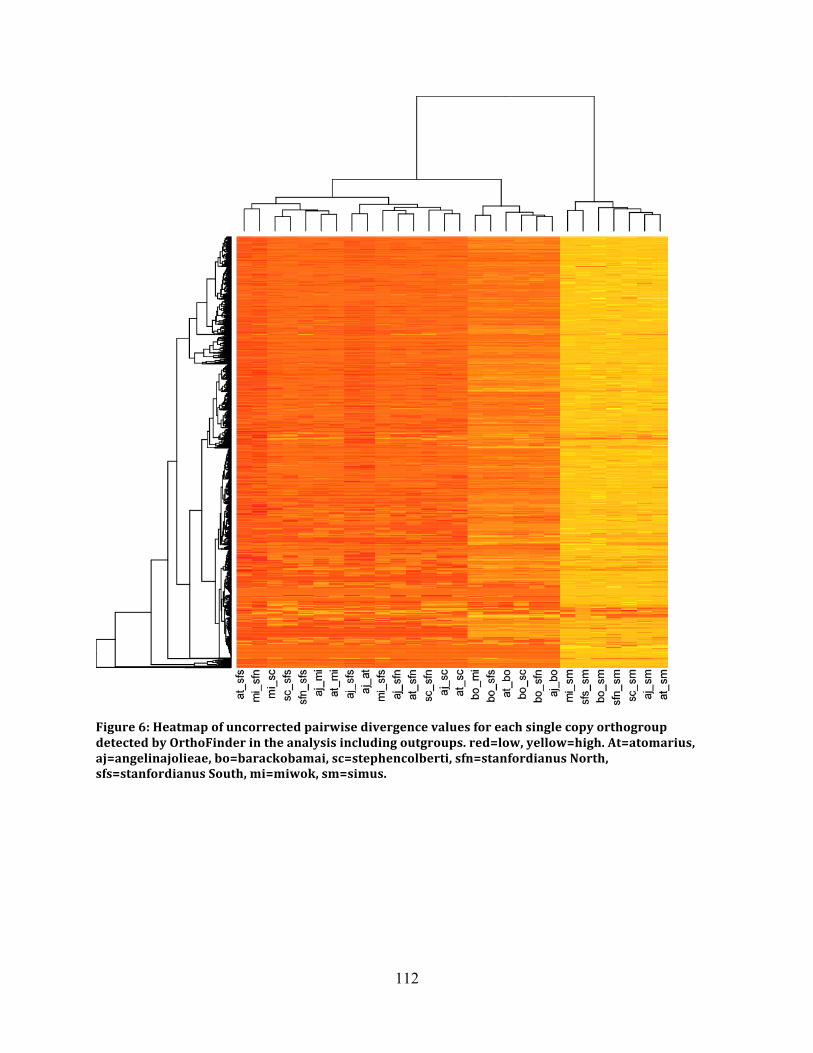
112
Figure 6: Heatmap of uncorrected pairwise divergence values for each single copy orthogroup detected by OrthoFinder in the analysis including outgroups. red=low, yellow=high. At=atomarius, aj=angelinajolieae, bo=barackobamai, sc=stephencolberti, sfn=stanfordianus North, sfs=stanfordianus South, mi=miwok, sm=simus.
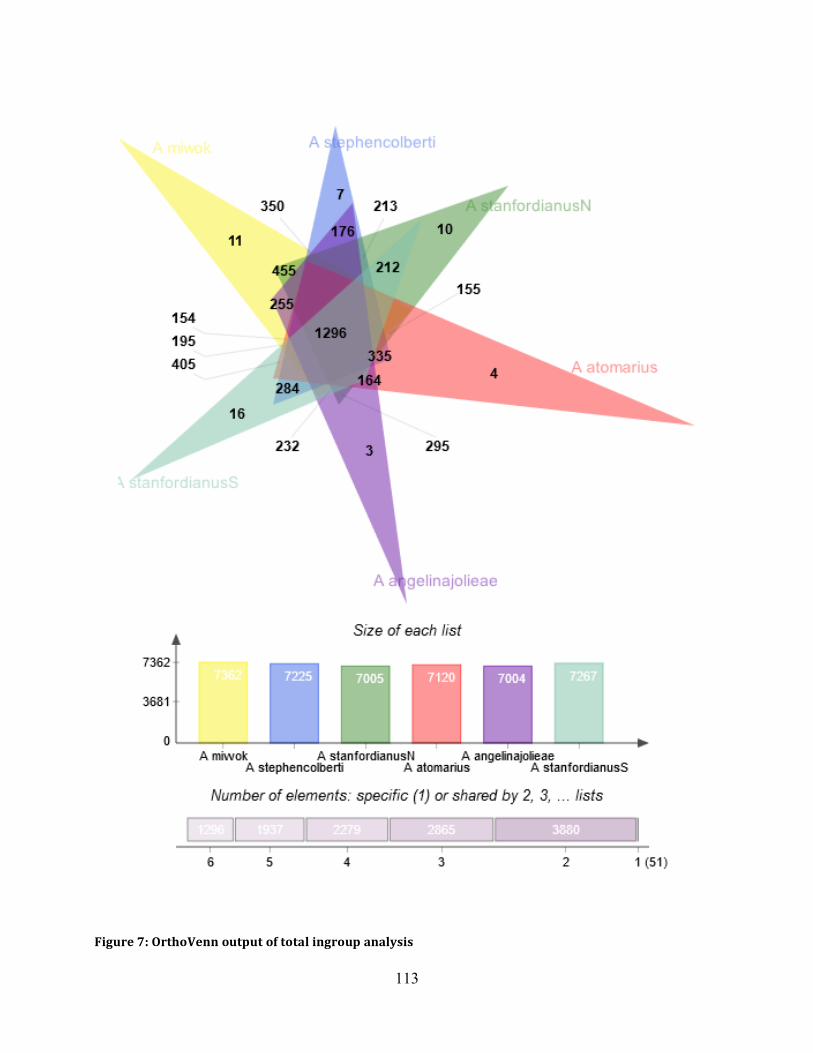
113
Figure 7: OrthoVenn output of total ingroup analysis
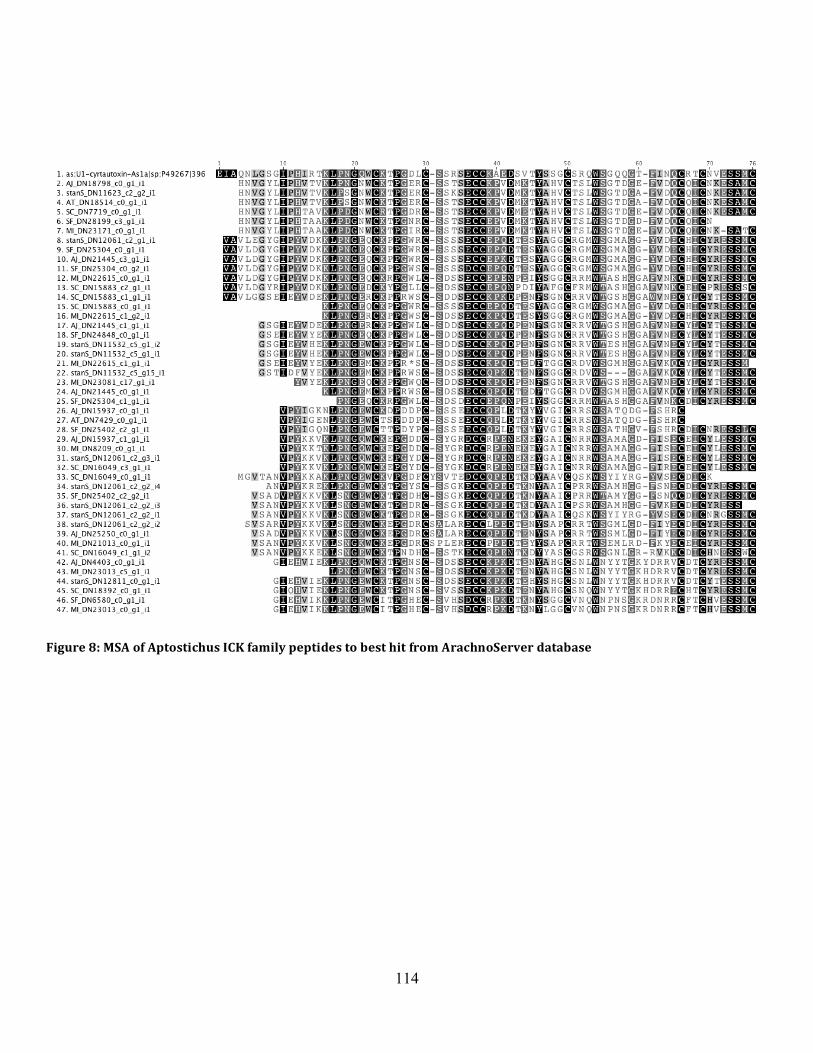
114
Figure 8: MSA of Aptostichus ICK family peptides to best hit from ArachnoServer database
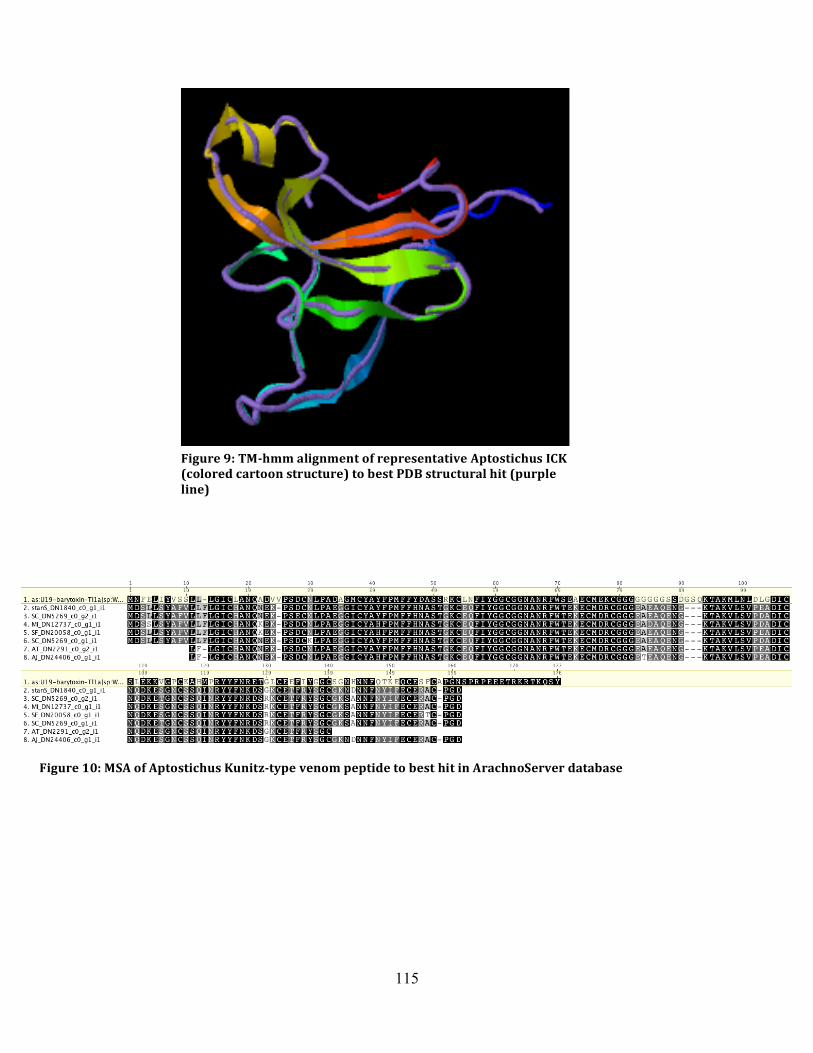
115
Figure 9: TM-‐hmm alignment of representative Aptostichus ICK (colored cartoon structure) to best PDB structural hit (purple line)
Figure 10: MSA of Aptostichus Kunitz-‐type venom peptide to best hit in ArachnoServer database
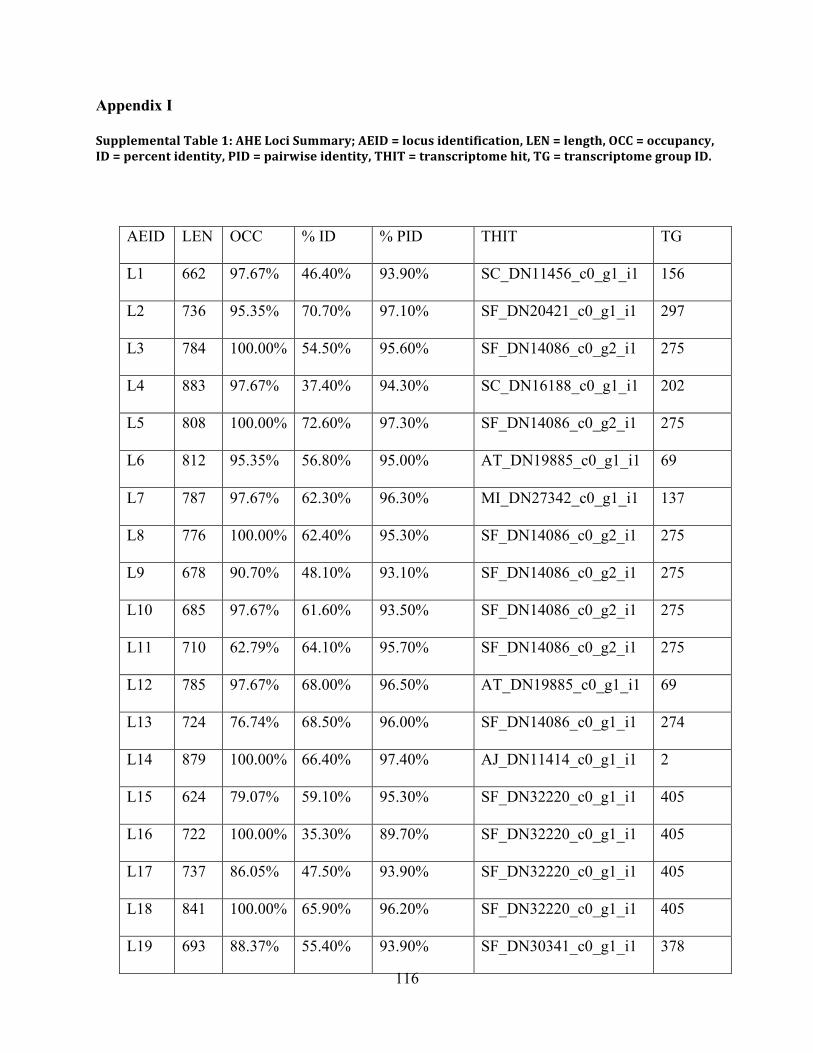
116
Appendix I Supplemental Table 1: AHE Loci Summary; AEID = locus identification, LEN = length, OCC = occupancy, ID = percent identity, PID = pairwise identity, THIT = transcriptome hit, TG = transcriptome group ID.
AEID LEN OCC % ID % PID THIT TG
L1 662 97.67% 46.40% 93.90% SC_DN11456_c0_g1_i1 156
L2 736 95.35% 70.70% 97.10% SF_DN20421_c0_g1_i1 297
L3 784 100.00% 54.50% 95.60% SF_DN14086_c0_g2_i1 275
L4 883 97.67% 37.40% 94.30% SC_DN16188_c0_g1_i1 202
L5 808 100.00% 72.60% 97.30% SF_DN14086_c0_g2_i1 275
L6 812 95.35% 56.80% 95.00% AT_DN19885_c0_g1_i1 69
L7 787 97.67% 62.30% 96.30% MI_DN27342_c0_g1_i1 137
L8 776 100.00% 62.40% 95.30% SF_DN14086_c0_g2_i1 275
L9 678 90.70% 48.10% 93.10% SF_DN14086_c0_g2_i1 275
L10 685 97.67% 61.60% 93.50% SF_DN14086_c0_g2_i1 275
L11 710 62.79% 64.10% 95.70% SF_DN14086_c0_g2_i1 275
L12 785 97.67% 68.00% 96.50% AT_DN19885_c0_g1_i1 69
L13 724 76.74% 68.50% 96.00% SF_DN14086_c0_g1_i1 274
L14 879 100.00% 66.40% 97.40% AJ_DN11414_c0_g1_i1 2
L15 624 79.07% 59.10% 95.30% SF_DN32220_c0_g1_i1 405
L16 722 100.00% 35.30% 89.70% SF_DN32220_c0_g1_i1 405
L17 737 86.05% 47.50% 93.90% SF_DN32220_c0_g1_i1 405
L18 841 100.00% 65.90% 96.20% SF_DN32220_c0_g1_i1 405
L19 693 88.37% 55.40% 93.90% SF_DN30341_c0_g1_i1 378
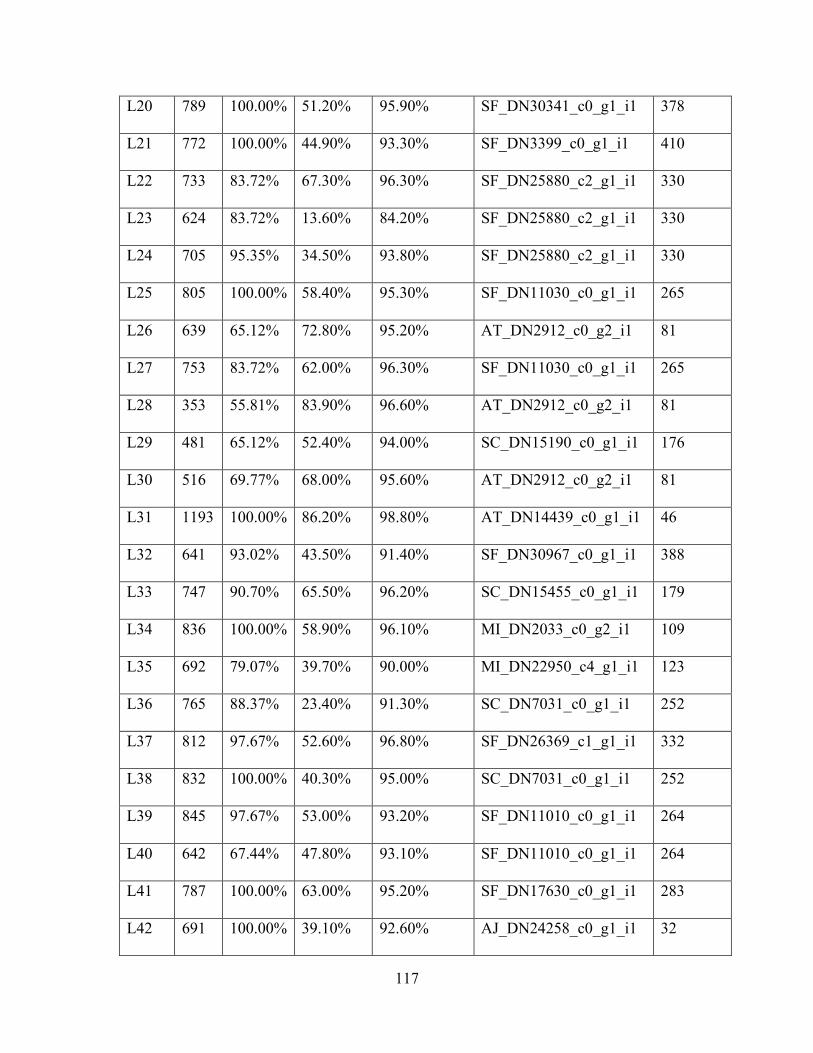
117
L20 789 100.00% 51.20% 95.90% SF_DN30341_c0_g1_i1 378
L21 772 100.00% 44.90% 93.30% SF_DN3399_c0_g1_i1 410
L22 733 83.72% 67.30% 96.30% SF_DN25880_c2_g1_i1 330
L23 624 83.72% 13.60% 84.20% SF_DN25880_c2_g1_i1 330
L24 705 95.35% 34.50% 93.80% SF_DN25880_c2_g1_i1 330
L25 805 100.00% 58.40% 95.30% SF_DN11030_c0_g1_i1 265
L26 639 65.12% 72.80% 95.20% AT_DN2912_c0_g2_i1 81
L27 753 83.72% 62.00% 96.30% SF_DN11030_c0_g1_i1 265
L28 353 55.81% 83.90% 96.60% AT_DN2912_c0_g2_i1 81
L29 481 65.12% 52.40% 94.00% SC_DN15190_c0_g1_i1 176
L30 516 69.77% 68.00% 95.60% AT_DN2912_c0_g2_i1 81
L31 1193 100.00% 86.20% 98.80% AT_DN14439_c0_g1_i1 46
L32 641 93.02% 43.50% 91.40% SF_DN30967_c0_g1_i1 388
L33 747 90.70% 65.50% 96.20% SC_DN15455_c0_g1_i1 179
L34 836 100.00% 58.90% 96.10% MI_DN2033_c0_g2_i1 109
L35 692 79.07% 39.70% 90.00% MI_DN22950_c4_g1_i1 123
L36 765 88.37% 23.40% 91.30% SC_DN7031_c0_g1_i1 252
L37 812 97.67% 52.60% 96.80% SF_DN26369_c1_g1_i1 332
L38 832 100.00% 40.30% 95.00% SC_DN7031_c0_g1_i1 252
L39 845 97.67% 53.00% 93.20% SF_DN11010_c0_g1_i1 264
L40 642 67.44% 47.80% 93.10% SF_DN11010_c0_g1_i1 264
L41 787 100.00% 63.00% 95.20% SF_DN17630_c0_g1_i1 283
L42 691 100.00% 39.10% 92.60% AJ_DN24258_c0_g1_i1 32
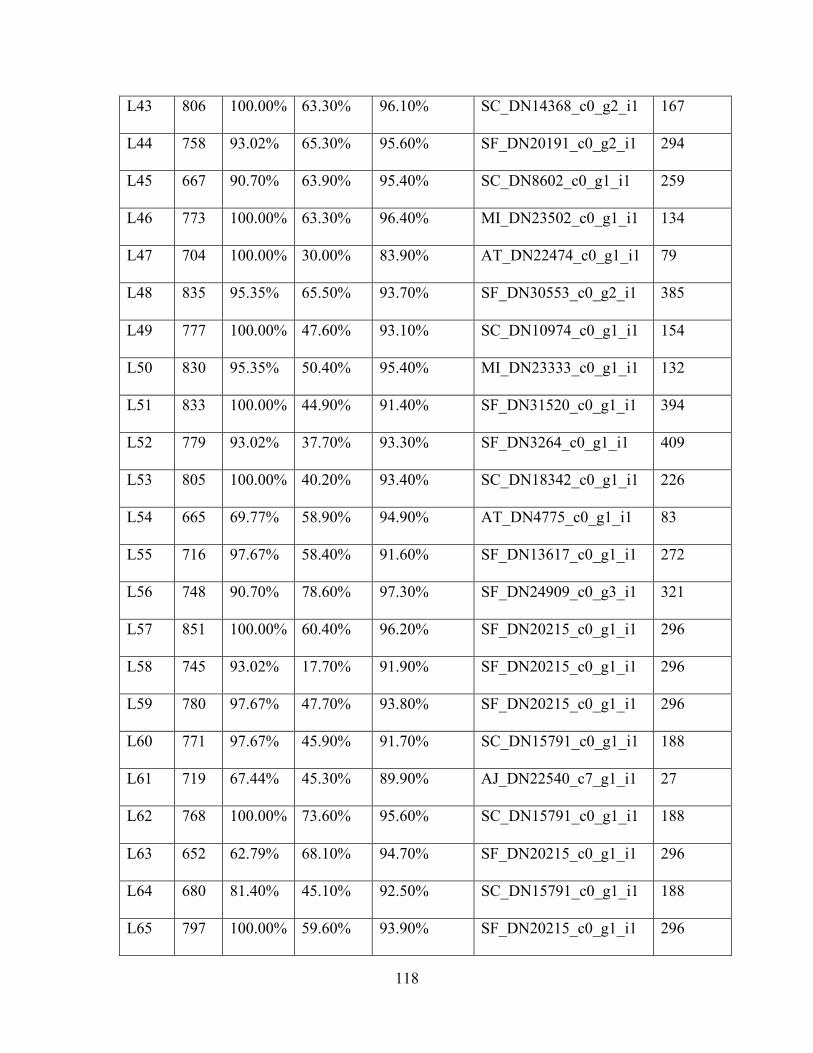
118
L43 806 100.00% 63.30% 96.10% SC_DN14368_c0_g2_i1 167
L44 758 93.02% 65.30% 95.60% SF_DN20191_c0_g2_i1 294
L45 667 90.70% 63.90% 95.40% SC_DN8602_c0_g1_i1 259
L46 773 100.00% 63.30% 96.40% MI_DN23502_c0_g1_i1 134
L47 704 100.00% 30.00% 83.90% AT_DN22474_c0_g1_i1 79
L48 835 95.35% 65.50% 93.70% SF_DN30553_c0_g2_i1 385
L49 777 100.00% 47.60% 93.10% SC_DN10974_c0_g1_i1 154
L50 830 95.35% 50.40% 95.40% MI_DN23333_c0_g1_i1 132
L51 833 100.00% 44.90% 91.40% SF_DN31520_c0_g1_i1 394
L52 779 93.02% 37.70% 93.30% SF_DN3264_c0_g1_i1 409
L53 805 100.00% 40.20% 93.40% SC_DN18342_c0_g1_i1 226
L54 665 69.77% 58.90% 94.90% AT_DN4775_c0_g1_i1 83
L55 716 97.67% 58.40% 91.60% SF_DN13617_c0_g1_i1 272
L56 748 90.70% 78.60% 97.30% SF_DN24909_c0_g3_i1 321
L57 851 100.00% 60.40% 96.20% SF_DN20215_c0_g1_i1 296
L58 745 93.02% 17.70% 91.90% SF_DN20215_c0_g1_i1 296
L59 780 97.67% 47.70% 93.80% SF_DN20215_c0_g1_i1 296
L60 771 97.67% 45.90% 91.70% SC_DN15791_c0_g1_i1 188
L61 719 67.44% 45.30% 89.90% AJ_DN22540_c7_g1_i1 27
L62 768 100.00% 73.60% 95.60% SC_DN15791_c0_g1_i1 188
L63 652 62.79% 68.10% 94.70% SF_DN20215_c0_g1_i1 296
L64 680 81.40% 45.10% 92.50% SC_DN15791_c0_g1_i1 188
L65 797 100.00% 59.60% 93.90% SF_DN20215_c0_g1_i1 296
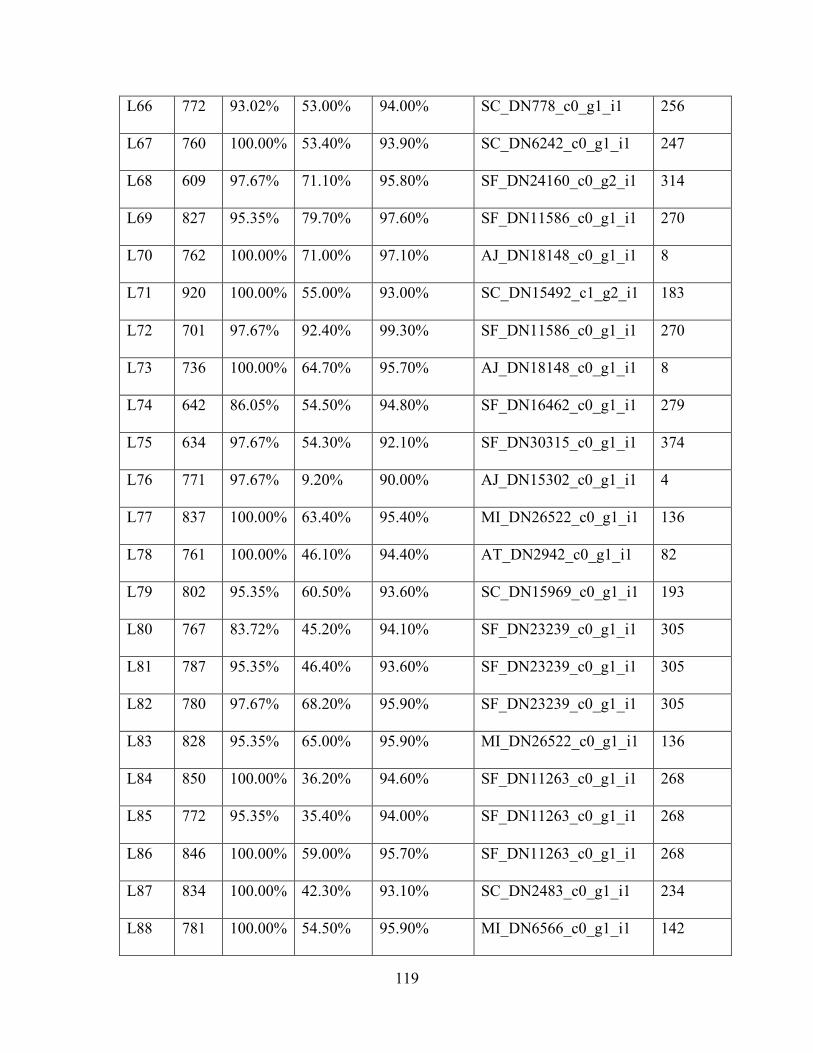
119
L66 772 93.02% 53.00% 94.00% SC_DN778_c0_g1_i1 256
L67 760 100.00% 53.40% 93.90% SC_DN6242_c0_g1_i1 247
L68 609 97.67% 71.10% 95.80% SF_DN24160_c0_g2_i1 314
L69 827 95.35% 79.70% 97.60% SF_DN11586_c0_g1_i1 270
L70 762 100.00% 71.00% 97.10% AJ_DN18148_c0_g1_i1 8
L71 920 100.00% 55.00% 93.00% SC_DN15492_c1_g2_i1 183
L72 701 97.67% 92.40% 99.30% SF_DN11586_c0_g1_i1 270
L73 736 100.00% 64.70% 95.70% AJ_DN18148_c0_g1_i1 8
L74 642 86.05% 54.50% 94.80% SF_DN16462_c0_g1_i1 279
L75 634 97.67% 54.30% 92.10% SF_DN30315_c0_g1_i1 374
L76 771 97.67% 9.20% 90.00% AJ_DN15302_c0_g1_i1 4
L77 837 100.00% 63.40% 95.40% MI_DN26522_c0_g1_i1 136
L78 761 100.00% 46.10% 94.40% AT_DN2942_c0_g1_i1 82
L79 802 95.35% 60.50% 93.60% SC_DN15969_c0_g1_i1 193
L80 767 83.72% 45.20% 94.10% SF_DN23239_c0_g1_i1 305
L81 787 95.35% 46.40% 93.60% SF_DN23239_c0_g1_i1 305
L82 780 97.67% 68.20% 95.90% SF_DN23239_c0_g1_i1 305
L83 828 95.35% 65.00% 95.90% MI_DN26522_c0_g1_i1 136
L84 850 100.00% 36.20% 94.60% SF_DN11263_c0_g1_i1 268
L85 772 95.35% 35.40% 94.00% SF_DN11263_c0_g1_i1 268
L86 846 100.00% 59.00% 95.70% SF_DN11263_c0_g1_i1 268
L87 834 100.00% 42.30% 93.10% SC_DN2483_c0_g1_i1 234
L88 781 100.00% 54.50% 95.90% MI_DN6566_c0_g1_i1 142
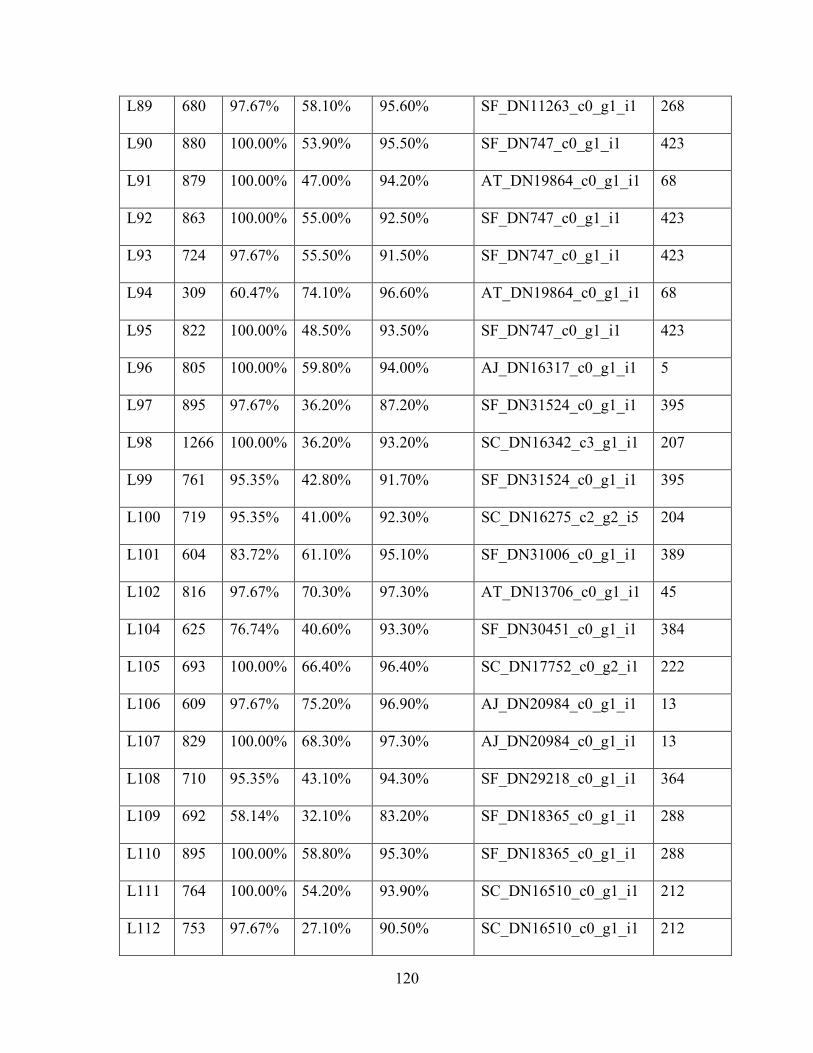
120
L89 680 97.67% 58.10% 95.60% SF_DN11263_c0_g1_i1 268
L90 880 100.00% 53.90% 95.50% SF_DN747_c0_g1_i1 423
L91 879 100.00% 47.00% 94.20% AT_DN19864_c0_g1_i1 68
L92 863 100.00% 55.00% 92.50% SF_DN747_c0_g1_i1 423
L93 724 97.67% 55.50% 91.50% SF_DN747_c0_g1_i1 423
L94 309 60.47% 74.10% 96.60% AT_DN19864_c0_g1_i1 68
L95 822 100.00% 48.50% 93.50% SF_DN747_c0_g1_i1 423
L96 805 100.00% 59.80% 94.00% AJ_DN16317_c0_g1_i1 5
L97 895 97.67% 36.20% 87.20% SF_DN31524_c0_g1_i1 395
L98 1266 100.00% 36.20% 93.20% SC_DN16342_c3_g1_i1 207
L99 761 95.35% 42.80% 91.70% SF_DN31524_c0_g1_i1 395
L100 719 95.35% 41.00% 92.30% SC_DN16275_c2_g2_i5 204
L101 604 83.72% 61.10% 95.10% SF_DN31006_c0_g1_i1 389
L102 816 97.67% 70.30% 97.30% AT_DN13706_c0_g1_i1 45
L104 625 76.74% 40.60% 93.30% SF_DN30451_c0_g1_i1 384
L105 693 100.00% 66.40% 96.40% SC_DN17752_c0_g2_i1 222
L106 609 97.67% 75.20% 96.90% AJ_DN20984_c0_g1_i1 13
L107 829 100.00% 68.30% 97.30% AJ_DN20984_c0_g1_i1 13
L108 710 95.35% 43.10% 94.30% SF_DN29218_c0_g1_i1 364
L109 692 58.14% 32.10% 83.20% SF_DN18365_c0_g1_i1 288
L110 895 100.00% 58.80% 95.30% SF_DN18365_c0_g1_i1 288
L111 764 100.00% 54.20% 93.90% SC_DN16510_c0_g1_i1 212
L112 753 97.67% 27.10% 90.50% SC_DN16510_c0_g1_i1 212
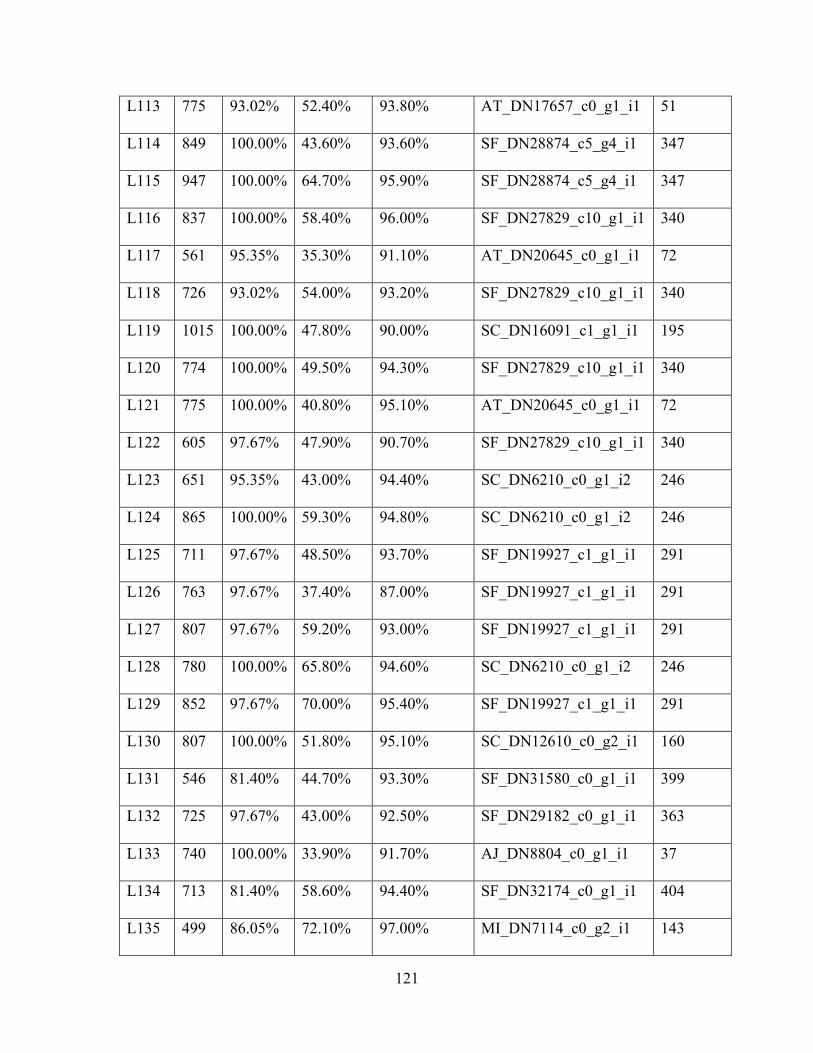
121
L113 775 93.02% 52.40% 93.80% AT_DN17657_c0_g1_i1 51
L114 849 100.00% 43.60% 93.60% SF_DN28874_c5_g4_i1 347
L115 947 100.00% 64.70% 95.90% SF_DN28874_c5_g4_i1 347
L116 837 100.00% 58.40% 96.00% SF_DN27829_c10_g1_i1 340
L117 561 95.35% 35.30% 91.10% AT_DN20645_c0_g1_i1 72
L118 726 93.02% 54.00% 93.20% SF_DN27829_c10_g1_i1 340
L119 1015 100.00% 47.80% 90.00% SC_DN16091_c1_g1_i1 195
L120 774 100.00% 49.50% 94.30% SF_DN27829_c10_g1_i1 340
L121 775 100.00% 40.80% 95.10% AT_DN20645_c0_g1_i1 72
L122 605 97.67% 47.90% 90.70% SF_DN27829_c10_g1_i1 340
L123 651 95.35% 43.00% 94.40% SC_DN6210_c0_g1_i2 246
L124 865 100.00% 59.30% 94.80% SC_DN6210_c0_g1_i2 246
L125 711 97.67% 48.50% 93.70% SF_DN19927_c1_g1_i1 291
L126 763 97.67% 37.40% 87.00% SF_DN19927_c1_g1_i1 291
L127 807 97.67% 59.20% 93.00% SF_DN19927_c1_g1_i1 291
L128 780 100.00% 65.80% 94.60% SC_DN6210_c0_g1_i2 246
L129 852 97.67% 70.00% 95.40% SF_DN19927_c1_g1_i1 291
L130 807 100.00% 51.80% 95.10% SC_DN12610_c0_g2_i1 160
L131 546 81.40% 44.70% 93.30% SF_DN31580_c0_g1_i1 399
L132 725 97.67% 43.00% 92.50% SF_DN29182_c0_g1_i1 363
L133 740 100.00% 33.90% 91.70% AJ_DN8804_c0_g1_i1 37
L134 713 81.40% 58.60% 94.40% SF_DN32174_c0_g1_i1 404
L135 499 86.05% 72.10% 97.00% MI_DN7114_c0_g2_i1 143
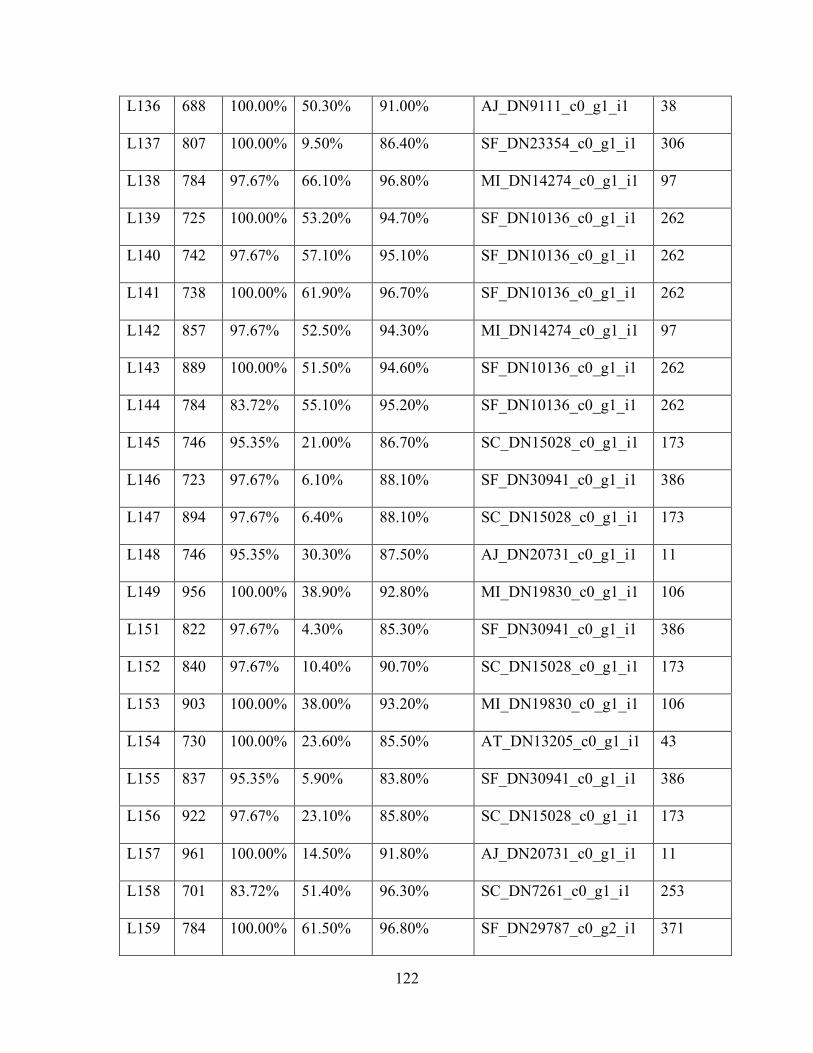
122
L136 688 100.00% 50.30% 91.00% AJ_DN9111_c0_g1_i1 38
L137 807 100.00% 9.50% 86.40% SF_DN23354_c0_g1_i1 306
L138 784 97.67% 66.10% 96.80% MI_DN14274_c0_g1_i1 97
L139 725 100.00% 53.20% 94.70% SF_DN10136_c0_g1_i1 262
L140 742 97.67% 57.10% 95.10% SF_DN10136_c0_g1_i1 262
L141 738 100.00% 61.90% 96.70% SF_DN10136_c0_g1_i1 262
L142 857 97.67% 52.50% 94.30% MI_DN14274_c0_g1_i1 97
L143 889 100.00% 51.50% 94.60% SF_DN10136_c0_g1_i1 262
L144 784 83.72% 55.10% 95.20% SF_DN10136_c0_g1_i1 262
L145 746 95.35% 21.00% 86.70% SC_DN15028_c0_g1_i1 173
L146 723 97.67% 6.10% 88.10% SF_DN30941_c0_g1_i1 386
L147 894 97.67% 6.40% 88.10% SC_DN15028_c0_g1_i1 173
L148 746 95.35% 30.30% 87.50% AJ_DN20731_c0_g1_i1 11
L149 956 100.00% 38.90% 92.80% MI_DN19830_c0_g1_i1 106
L151 822 97.67% 4.30% 85.30% SF_DN30941_c0_g1_i1 386
L152 840 97.67% 10.40% 90.70% SC_DN15028_c0_g1_i1 173
L153 903 100.00% 38.00% 93.20% MI_DN19830_c0_g1_i1 106
L154 730 100.00% 23.60% 85.50% AT_DN13205_c0_g1_i1 43
L155 837 95.35% 5.90% 83.80% SF_DN30941_c0_g1_i1 386
L156 922 97.67% 23.10% 85.80% SC_DN15028_c0_g1_i1 173
L157 961 100.00% 14.50% 91.80% AJ_DN20731_c0_g1_i1 11
L158 701 83.72% 51.40% 96.30% SC_DN7261_c0_g1_i1 253
L159 784 100.00% 61.50% 96.80% SF_DN29787_c0_g2_i1 371
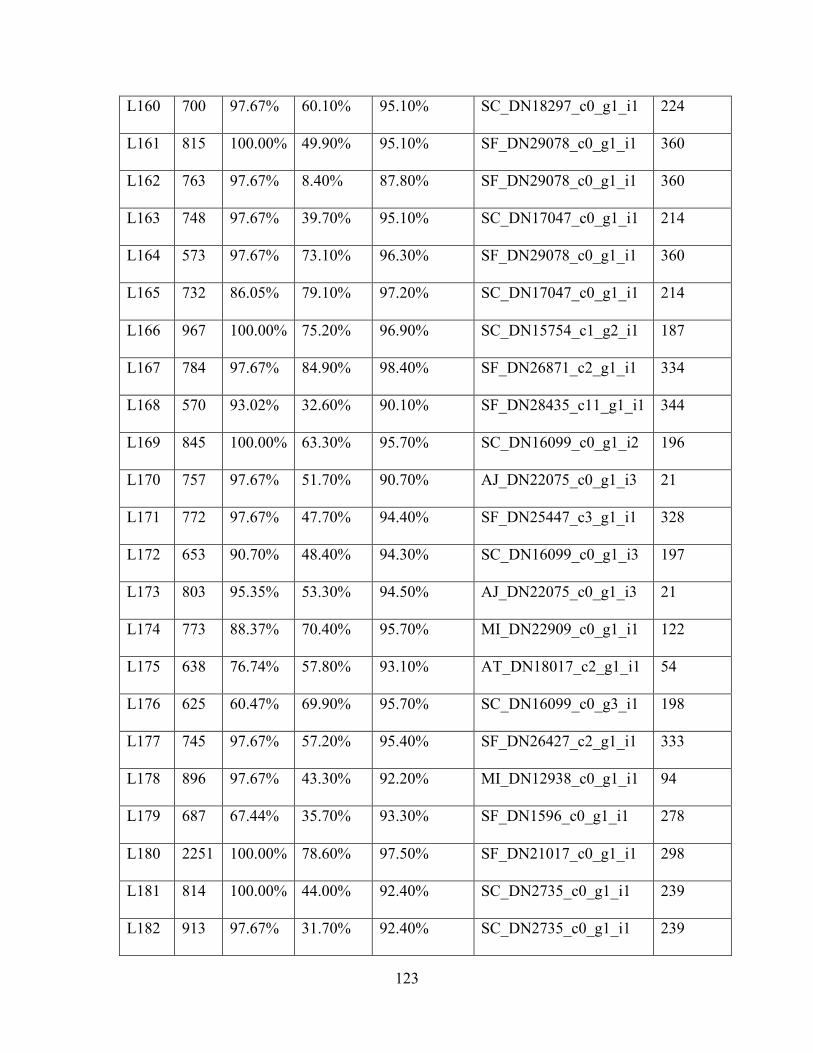
123
L160 700 97.67% 60.10% 95.10% SC_DN18297_c0_g1_i1 224
L161 815 100.00% 49.90% 95.10% SF_DN29078_c0_g1_i1 360
L162 763 97.67% 8.40% 87.80% SF_DN29078_c0_g1_i1 360
L163 748 97.67% 39.70% 95.10% SC_DN17047_c0_g1_i1 214
L164 573 97.67% 73.10% 96.30% SF_DN29078_c0_g1_i1 360
L165 732 86.05% 79.10% 97.20% SC_DN17047_c0_g1_i1 214
L166 967 100.00% 75.20% 96.90% SC_DN15754_c1_g2_i1 187
L167 784 97.67% 84.90% 98.40% SF_DN26871_c2_g1_i1 334
L168 570 93.02% 32.60% 90.10% SF_DN28435_c11_g1_i1 344
L169 845 100.00% 63.30% 95.70% SC_DN16099_c0_g1_i2 196
L170 757 97.67% 51.70% 90.70% AJ_DN22075_c0_g1_i3 21
L171 772 97.67% 47.70% 94.40% SF_DN25447_c3_g1_i1 328
L172 653 90.70% 48.40% 94.30% SC_DN16099_c0_g1_i3 197
L173 803 95.35% 53.30% 94.50% AJ_DN22075_c0_g1_i3 21
L174 773 88.37% 70.40% 95.70% MI_DN22909_c0_g1_i1 122
L175 638 76.74% 57.80% 93.10% AT_DN18017_c2_g1_i1 54
L176 625 60.47% 69.90% 95.70% SC_DN16099_c0_g3_i1 198
L177 745 97.67% 57.20% 95.40% SF_DN26427_c2_g1_i1 333
L178 896 97.67% 43.30% 92.20% MI_DN12938_c0_g1_i1 94
L179 687 67.44% 35.70% 93.30% SF_DN1596_c0_g1_i1 278
L180 2251 100.00% 78.60% 97.50% SF_DN21017_c0_g1_i1 298
L181 814 100.00% 44.00% 92.40% SC_DN2735_c0_g1_i1 239
L182 913 97.67% 31.70% 92.40% SC_DN2735_c0_g1_i1 239
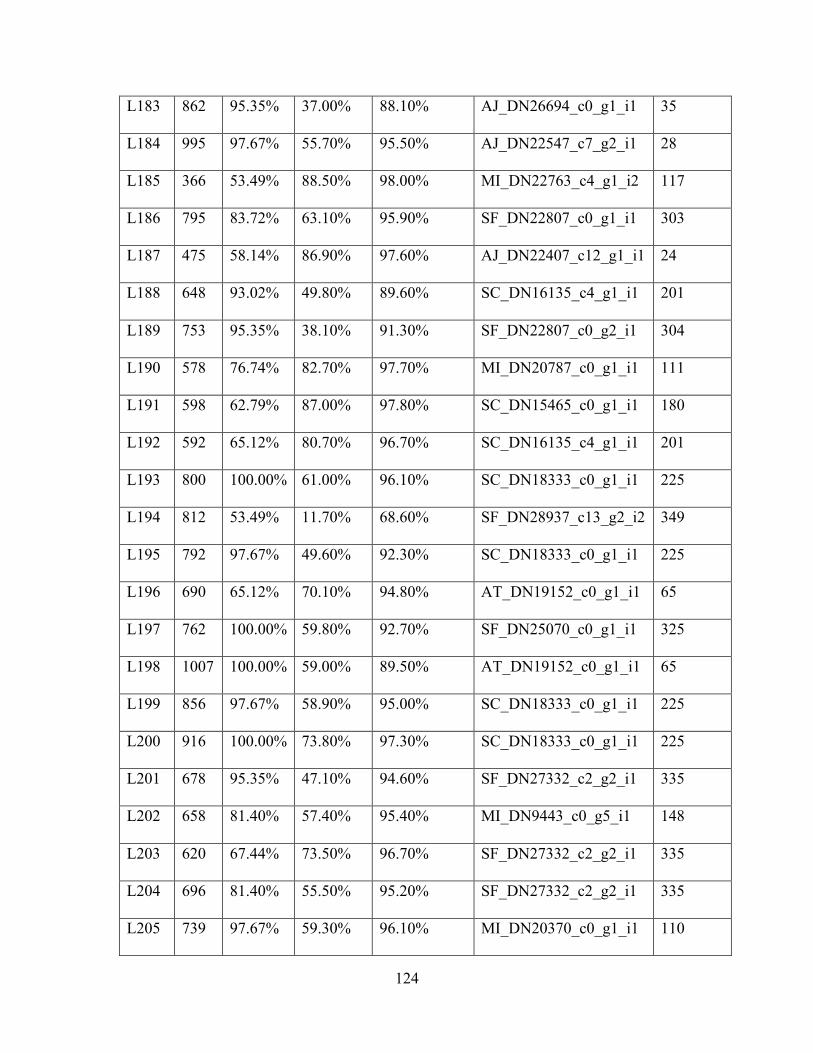
124
L183 862 95.35% 37.00% 88.10% AJ_DN26694_c0_g1_i1 35
L184 995 97.67% 55.70% 95.50% AJ_DN22547_c7_g2_i1 28
L185 366 53.49% 88.50% 98.00% MI_DN22763_c4_g1_i2 117
L186 795 83.72% 63.10% 95.90% SF_DN22807_c0_g1_i1 303
L187 475 58.14% 86.90% 97.60% AJ_DN22407_c12_g1_i1 24
L188 648 93.02% 49.80% 89.60% SC_DN16135_c4_g1_i1 201
L189 753 95.35% 38.10% 91.30% SF_DN22807_c0_g2_i1 304
L190 578 76.74% 82.70% 97.70% MI_DN20787_c0_g1_i1 111
L191 598 62.79% 87.00% 97.80% SC_DN15465_c0_g1_i1 180
L192 592 65.12% 80.70% 96.70% SC_DN16135_c4_g1_i1 201
L193 800 100.00% 61.00% 96.10% SC_DN18333_c0_g1_i1 225
L194 812 53.49% 11.70% 68.60% SF_DN28937_c13_g2_i2 349
L195 792 97.67% 49.60% 92.30% SC_DN18333_c0_g1_i1 225
L196 690 65.12% 70.10% 94.80% AT_DN19152_c0_g1_i1 65
L197 762 100.00% 59.80% 92.70% SF_DN25070_c0_g1_i1 325
L198 1007 100.00% 59.00% 89.50% AT_DN19152_c0_g1_i1 65
L199 856 97.67% 58.90% 95.00% SC_DN18333_c0_g1_i1 225
L200 916 100.00% 73.80% 97.30% SC_DN18333_c0_g1_i1 225
L201 678 95.35% 47.10% 94.60% SF_DN27332_c2_g2_i1 335
L202 658 81.40% 57.40% 95.40% MI_DN9443_c0_g5_i1 148
L203 620 67.44% 73.50% 96.70% SF_DN27332_c2_g2_i1 335
L204 696 81.40% 55.50% 95.20% SF_DN27332_c2_g2_i1 335
L205 739 97.67% 59.30% 96.10% MI_DN20370_c0_g1_i1 110
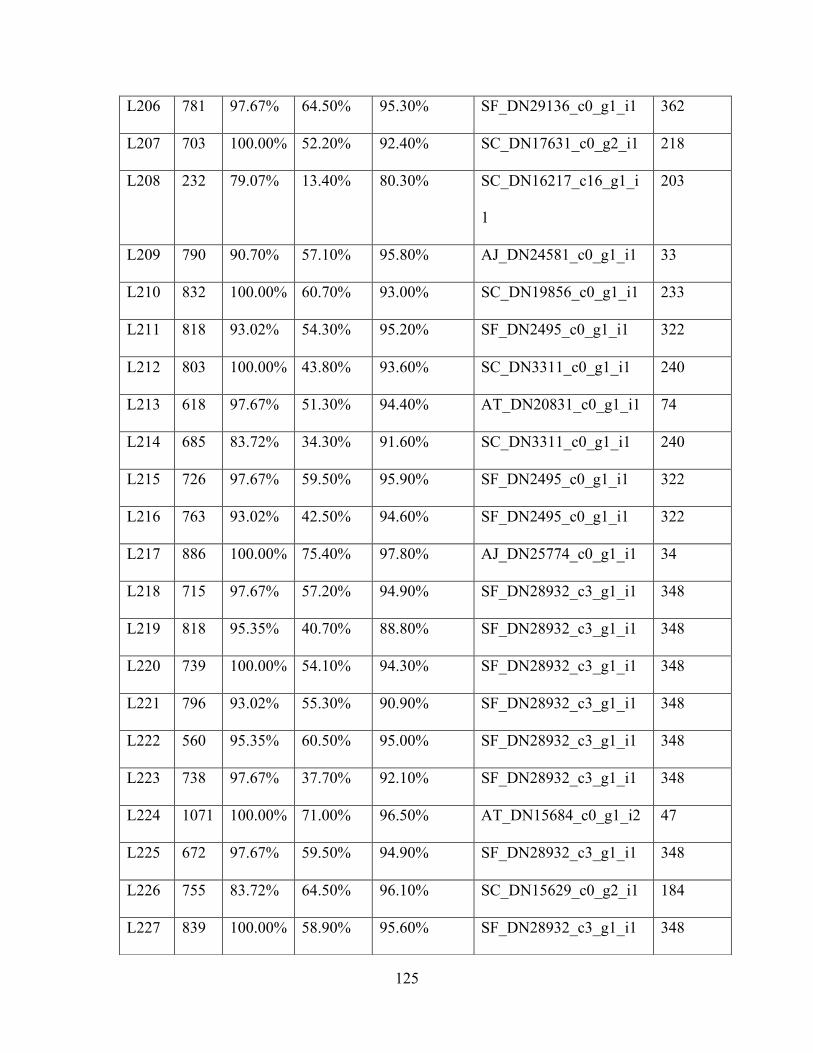
125
L206 781 97.67% 64.50% 95.30% SF_DN29136_c0_g1_i1 362
L207 703 100.00% 52.20% 92.40% SC_DN17631_c0_g2_i1 218
L208 232 79.07% 13.40% 80.30% SC_DN16217_c16_g1_i
1
203
L209 790 90.70% 57.10% 95.80% AJ_DN24581_c0_g1_i1 33
L210 832 100.00% 60.70% 93.00% SC_DN19856_c0_g1_i1 233
L211 818 93.02% 54.30% 95.20% SF_DN2495_c0_g1_i1 322
L212 803 100.00% 43.80% 93.60% SC_DN3311_c0_g1_i1 240
L213 618 97.67% 51.30% 94.40% AT_DN20831_c0_g1_i1 74
L214 685 83.72% 34.30% 91.60% SC_DN3311_c0_g1_i1 240
L215 726 97.67% 59.50% 95.90% SF_DN2495_c0_g1_i1 322
L216 763 93.02% 42.50% 94.60% SF_DN2495_c0_g1_i1 322
L217 886 100.00% 75.40% 97.80% AJ_DN25774_c0_g1_i1 34
L218 715 97.67% 57.20% 94.90% SF_DN28932_c3_g1_i1 348
L219 818 95.35% 40.70% 88.80% SF_DN28932_c3_g1_i1 348
L220 739 100.00% 54.10% 94.30% SF_DN28932_c3_g1_i1 348
L221 796 93.02% 55.30% 90.90% SF_DN28932_c3_g1_i1 348
L222 560 95.35% 60.50% 95.00% SF_DN28932_c3_g1_i1 348
L223 738 97.67% 37.70% 92.10% SF_DN28932_c3_g1_i1 348
L224 1071 100.00% 71.00% 96.50% AT_DN15684_c0_g1_i2 47
L225 672 97.67% 59.50% 94.90% SF_DN28932_c3_g1_i1 348
L226 755 83.72% 64.50% 96.10% SC_DN15629_c0_g2_i1 184
L227 839 100.00% 58.90% 95.60% SF_DN28932_c3_g1_i1 348
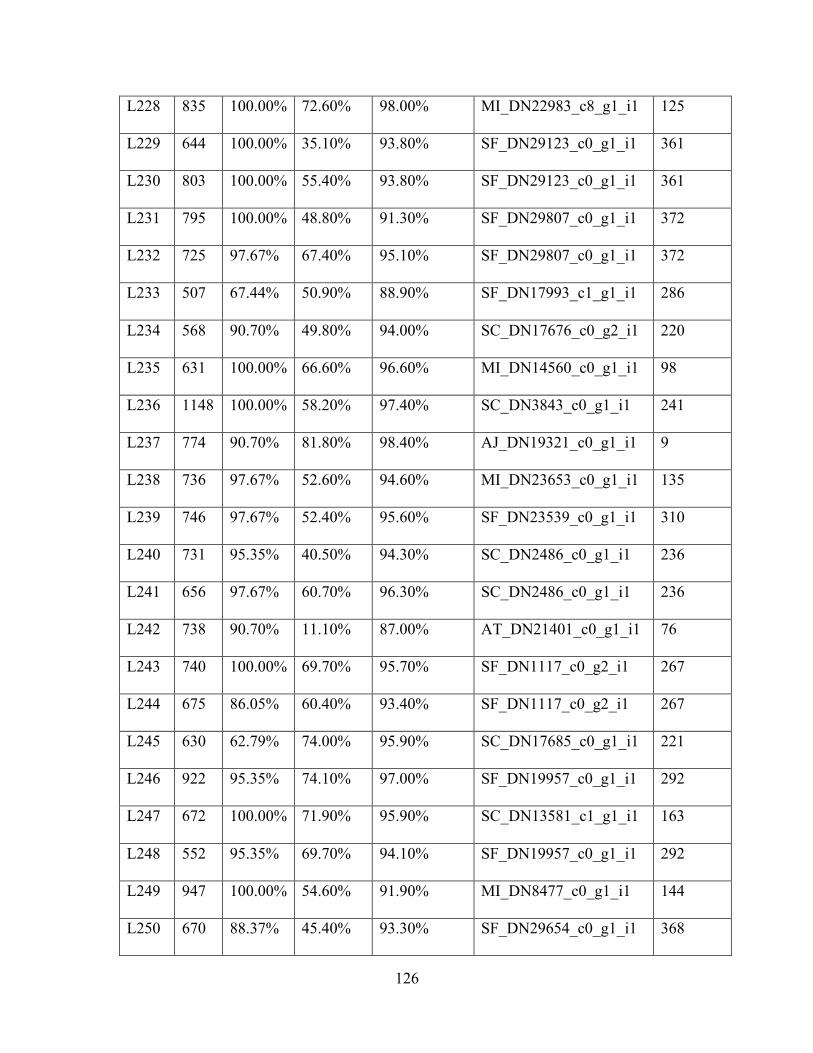
126
L228 835 100.00% 72.60% 98.00% MI_DN22983_c8_g1_i1 125
L229 644 100.00% 35.10% 93.80% SF_DN29123_c0_g1_i1 361
L230 803 100.00% 55.40% 93.80% SF_DN29123_c0_g1_i1 361
L231 795 100.00% 48.80% 91.30% SF_DN29807_c0_g1_i1 372
L232 725 97.67% 67.40% 95.10% SF_DN29807_c0_g1_i1 372
L233 507 67.44% 50.90% 88.90% SF_DN17993_c1_g1_i1 286
L234 568 90.70% 49.80% 94.00% SC_DN17676_c0_g2_i1 220
L235 631 100.00% 66.60% 96.60% MI_DN14560_c0_g1_i1 98
L236 1148 100.00% 58.20% 97.40% SC_DN3843_c0_g1_i1 241
L237 774 90.70% 81.80% 98.40% AJ_DN19321_c0_g1_i1 9
L238 736 97.67% 52.60% 94.60% MI_DN23653_c0_g1_i1 135
L239 746 97.67% 52.40% 95.60% SF_DN23539_c0_g1_i1 310
L240 731 95.35% 40.50% 94.30% SC_DN2486_c0_g1_i1 236
L241 656 97.67% 60.70% 96.30% SC_DN2486_c0_g1_i1 236
L242 738 90.70% 11.10% 87.00% AT_DN21401_c0_g1_i1 76
L243 740 100.00% 69.70% 95.70% SF_DN1117_c0_g2_i1 267
L244 675 86.05% 60.40% 93.40% SF_DN1117_c0_g2_i1 267
L245 630 62.79% 74.00% 95.90% SC_DN17685_c0_g1_i1 221
L246 922 95.35% 74.10% 97.00% SF_DN19957_c0_g1_i1 292
L247 672 100.00% 71.90% 95.90% SC_DN13581_c1_g1_i1 163
L248 552 95.35% 69.70% 94.10% SF_DN19957_c0_g1_i1 292
L249 947 100.00% 54.60% 91.90% MI_DN8477_c0_g1_i1 144
L250 670 88.37% 45.40% 93.30% SF_DN29654_c0_g1_i1 368
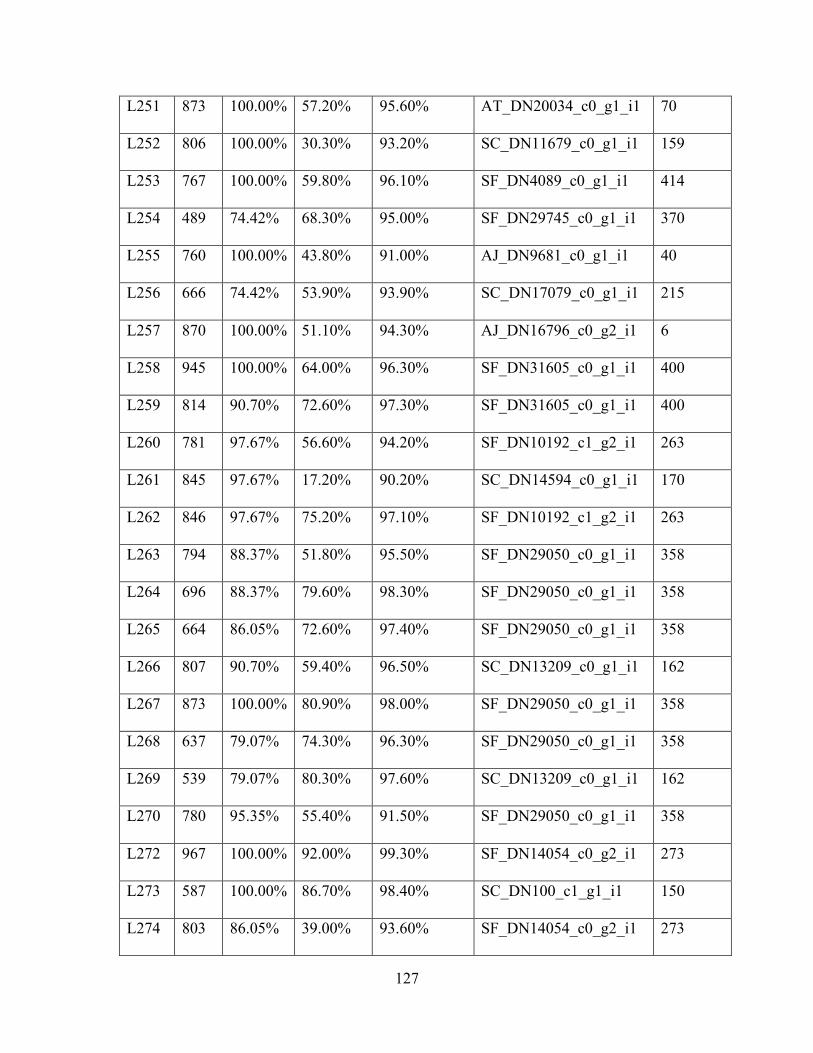
127
L251 873 100.00% 57.20% 95.60% AT_DN20034_c0_g1_i1 70
L252 806 100.00% 30.30% 93.20% SC_DN11679_c0_g1_i1 159
L253 767 100.00% 59.80% 96.10% SF_DN4089_c0_g1_i1 414
L254 489 74.42% 68.30% 95.00% SF_DN29745_c0_g1_i1 370
L255 760 100.00% 43.80% 91.00% AJ_DN9681_c0_g1_i1 40
L256 666 74.42% 53.90% 93.90% SC_DN17079_c0_g1_i1 215
L257 870 100.00% 51.10% 94.30% AJ_DN16796_c0_g2_i1 6
L258 945 100.00% 64.00% 96.30% SF_DN31605_c0_g1_i1 400
L259 814 90.70% 72.60% 97.30% SF_DN31605_c0_g1_i1 400
L260 781 97.67% 56.60% 94.20% SF_DN10192_c1_g2_i1 263
L261 845 97.67% 17.20% 90.20% SC_DN14594_c0_g1_i1 170
L262 846 97.67% 75.20% 97.10% SF_DN10192_c1_g2_i1 263
L263 794 88.37% 51.80% 95.50% SF_DN29050_c0_g1_i1 358
L264 696 88.37% 79.60% 98.30% SF_DN29050_c0_g1_i1 358
L265 664 86.05% 72.60% 97.40% SF_DN29050_c0_g1_i1 358
L266 807 90.70% 59.40% 96.50% SC_DN13209_c0_g1_i1 162
L267 873 100.00% 80.90% 98.00% SF_DN29050_c0_g1_i1 358
L268 637 79.07% 74.30% 96.30% SF_DN29050_c0_g1_i1 358
L269 539 79.07% 80.30% 97.60% SC_DN13209_c0_g1_i1 162
L270 780 95.35% 55.40% 91.50% SF_DN29050_c0_g1_i1 358
L272 967 100.00% 92.00% 99.30% SF_DN14054_c0_g2_i1 273
L273 587 100.00% 86.70% 98.40% SC_DN100_c1_g1_i1 150
L274 803 86.05% 39.00% 93.60% SF_DN14054_c0_g2_i1 273
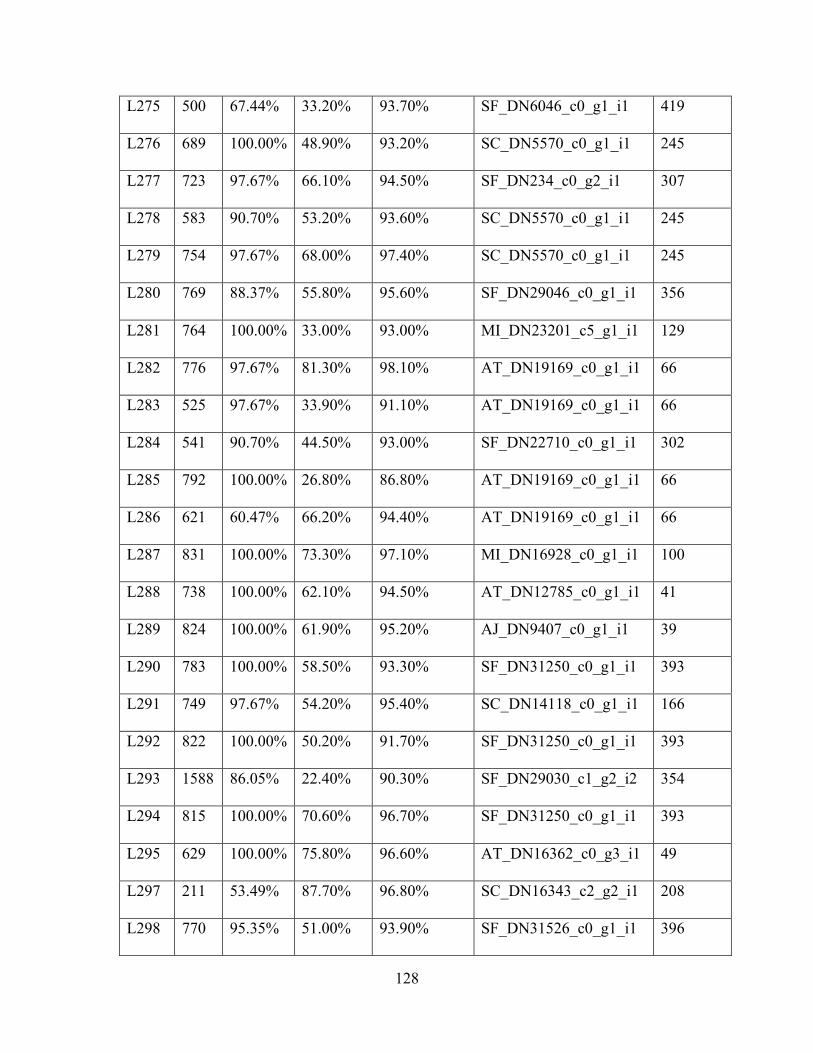
128
L275 500 67.44% 33.20% 93.70% SF_DN6046_c0_g1_i1 419
L276 689 100.00% 48.90% 93.20% SC_DN5570_c0_g1_i1 245
L277 723 97.67% 66.10% 94.50% SF_DN234_c0_g2_i1 307
L278 583 90.70% 53.20% 93.60% SC_DN5570_c0_g1_i1 245
L279 754 97.67% 68.00% 97.40% SC_DN5570_c0_g1_i1 245
L280 769 88.37% 55.80% 95.60% SF_DN29046_c0_g1_i1 356
L281 764 100.00% 33.00% 93.00% MI_DN23201_c5_g1_i1 129
L282 776 97.67% 81.30% 98.10% AT_DN19169_c0_g1_i1 66
L283 525 97.67% 33.90% 91.10% AT_DN19169_c0_g1_i1 66
L284 541 90.70% 44.50% 93.00% SF_DN22710_c0_g1_i1 302
L285 792 100.00% 26.80% 86.80% AT_DN19169_c0_g1_i1 66
L286 621 60.47% 66.20% 94.40% AT_DN19169_c0_g1_i1 66
L287 831 100.00% 73.30% 97.10% MI_DN16928_c0_g1_i1 100
L288 738 100.00% 62.10% 94.50% AT_DN12785_c0_g1_i1 41
L289 824 100.00% 61.90% 95.20% AJ_DN9407_c0_g1_i1 39
L290 783 100.00% 58.50% 93.30% SF_DN31250_c0_g1_i1 393
L291 749 97.67% 54.20% 95.40% SC_DN14118_c0_g1_i1 166
L292 822 100.00% 50.20% 91.70% SF_DN31250_c0_g1_i1 393
L293 1588 86.05% 22.40% 90.30% SF_DN29030_c1_g2_i2 354
L294 815 100.00% 70.60% 96.70% SF_DN31250_c0_g1_i1 393
L295 629 100.00% 75.80% 96.60% AT_DN16362_c0_g3_i1 49
L297 211 53.49% 87.70% 96.80% SC_DN16343_c2_g2_i1 208
L298 770 95.35% 51.00% 93.90% SF_DN31526_c0_g1_i1 396
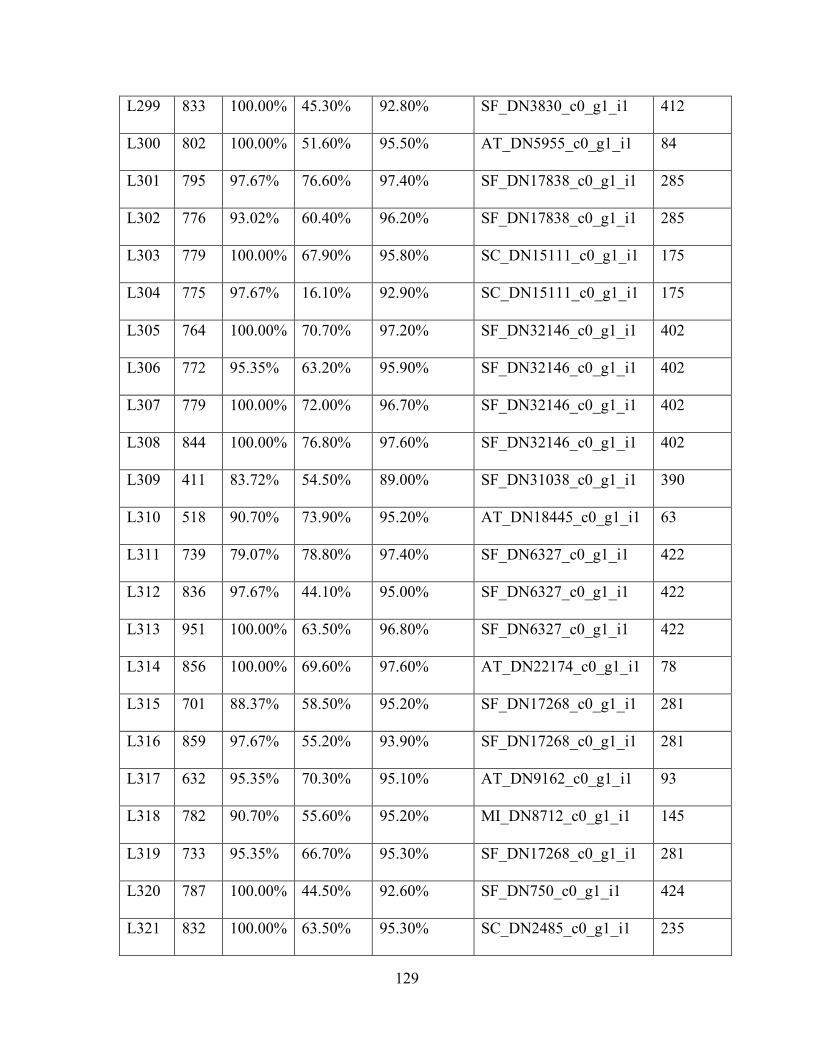
129
L299 833 100.00% 45.30% 92.80% SF_DN3830_c0_g1_i1 412
L300 802 100.00% 51.60% 95.50% AT_DN5955_c0_g1_i1 84
L301 795 97.67% 76.60% 97.40% SF_DN17838_c0_g1_i1 285
L302 776 93.02% 60.40% 96.20% SF_DN17838_c0_g1_i1 285
L303 779 100.00% 67.90% 95.80% SC_DN15111_c0_g1_i1 175
L304 775 97.67% 16.10% 92.90% SC_DN15111_c0_g1_i1 175
L305 764 100.00% 70.70% 97.20% SF_DN32146_c0_g1_i1 402
L306 772 95.35% 63.20% 95.90% SF_DN32146_c0_g1_i1 402
L307 779 100.00% 72.00% 96.70% SF_DN32146_c0_g1_i1 402
L308 844 100.00% 76.80% 97.60% SF_DN32146_c0_g1_i1 402
L309 411 83.72% 54.50% 89.00% SF_DN31038_c0_g1_i1 390
L310 518 90.70% 73.90% 95.20% AT_DN18445_c0_g1_i1 63
L311 739 79.07% 78.80% 97.40% SF_DN6327_c0_g1_i1 422
L312 836 97.67% 44.10% 95.00% SF_DN6327_c0_g1_i1 422
L313 951 100.00% 63.50% 96.80% SF_DN6327_c0_g1_i1 422
L314 856 100.00% 69.60% 97.60% AT_DN22174_c0_g1_i1 78
L315 701 88.37% 58.50% 95.20% SF_DN17268_c0_g1_i1 281
L316 859 97.67% 55.20% 93.90% SF_DN17268_c0_g1_i1 281
L317 632 95.35% 70.30% 95.10% AT_DN9162_c0_g1_i1 93
L318 782 90.70% 55.60% 95.20% MI_DN8712_c0_g1_i1 145
L319 733 95.35% 66.70% 95.30% SF_DN17268_c0_g1_i1 281
L320 787 100.00% 44.50% 92.60% SF_DN750_c0_g1_i1 424
L321 832 100.00% 63.50% 95.30% SC_DN2485_c0_g1_i1 235
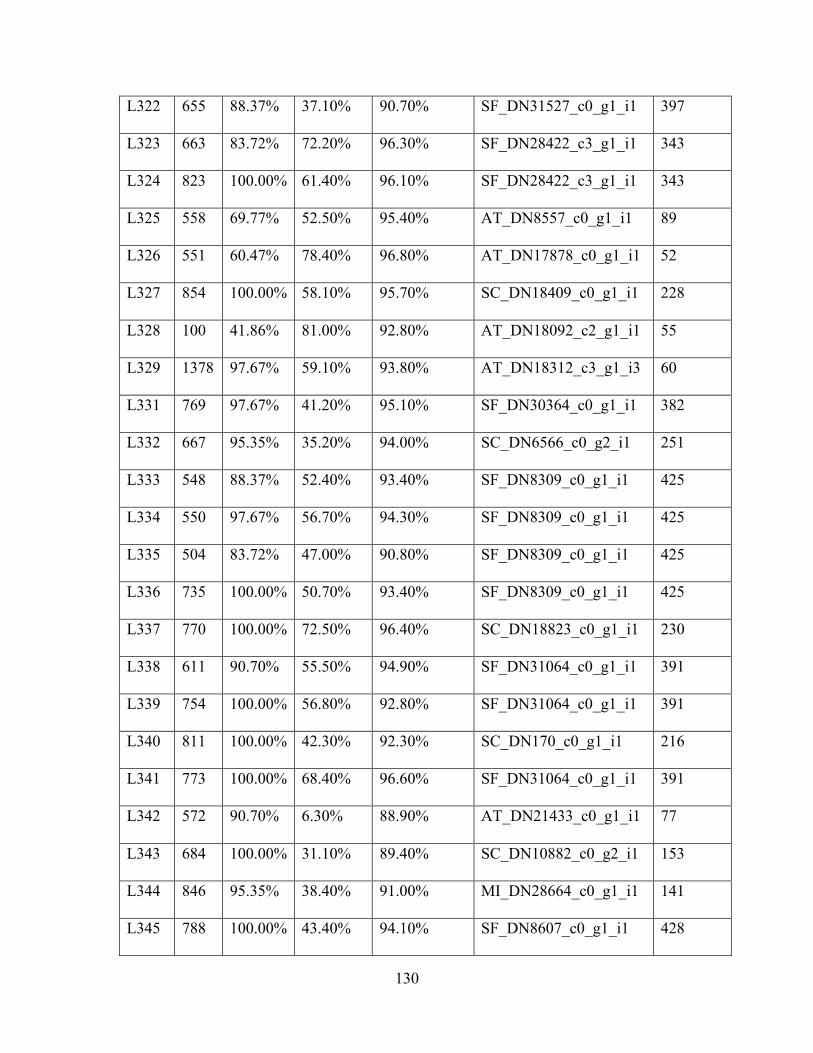
130
L322 655 88.37% 37.10% 90.70% SF_DN31527_c0_g1_i1 397
L323 663 83.72% 72.20% 96.30% SF_DN28422_c3_g1_i1 343
L324 823 100.00% 61.40% 96.10% SF_DN28422_c3_g1_i1 343
L325 558 69.77% 52.50% 95.40% AT_DN8557_c0_g1_i1 89
L326 551 60.47% 78.40% 96.80% AT_DN17878_c0_g1_i1 52
L327 854 100.00% 58.10% 95.70% SC_DN18409_c0_g1_i1 228
L328 100 41.86% 81.00% 92.80% AT_DN18092_c2_g1_i1 55
L329 1378 97.67% 59.10% 93.80% AT_DN18312_c3_g1_i3 60
L331 769 97.67% 41.20% 95.10% SF_DN30364_c0_g1_i1 382
L332 667 95.35% 35.20% 94.00% SC_DN6566_c0_g2_i1 251
L333 548 88.37% 52.40% 93.40% SF_DN8309_c0_g1_i1 425
L334 550 97.67% 56.70% 94.30% SF_DN8309_c0_g1_i1 425
L335 504 83.72% 47.00% 90.80% SF_DN8309_c0_g1_i1 425
L336 735 100.00% 50.70% 93.40% SF_DN8309_c0_g1_i1 425
L337 770 100.00% 72.50% 96.40% SC_DN18823_c0_g1_i1 230
L338 611 90.70% 55.50% 94.90% SF_DN31064_c0_g1_i1 391
L339 754 100.00% 56.80% 92.80% SF_DN31064_c0_g1_i1 391
L340 811 100.00% 42.30% 92.30% SC_DN170_c0_g1_i1 216
L341 773 100.00% 68.40% 96.60% SF_DN31064_c0_g1_i1 391
L342 572 90.70% 6.30% 88.90% AT_DN21433_c0_g1_i1 77
L343 684 100.00% 31.10% 89.40% SC_DN10882_c0_g2_i1 153
L344 846 95.35% 38.40% 91.00% MI_DN28664_c0_g1_i1 141
L345 788 100.00% 43.40% 94.10% SF_DN8607_c0_g1_i1 428
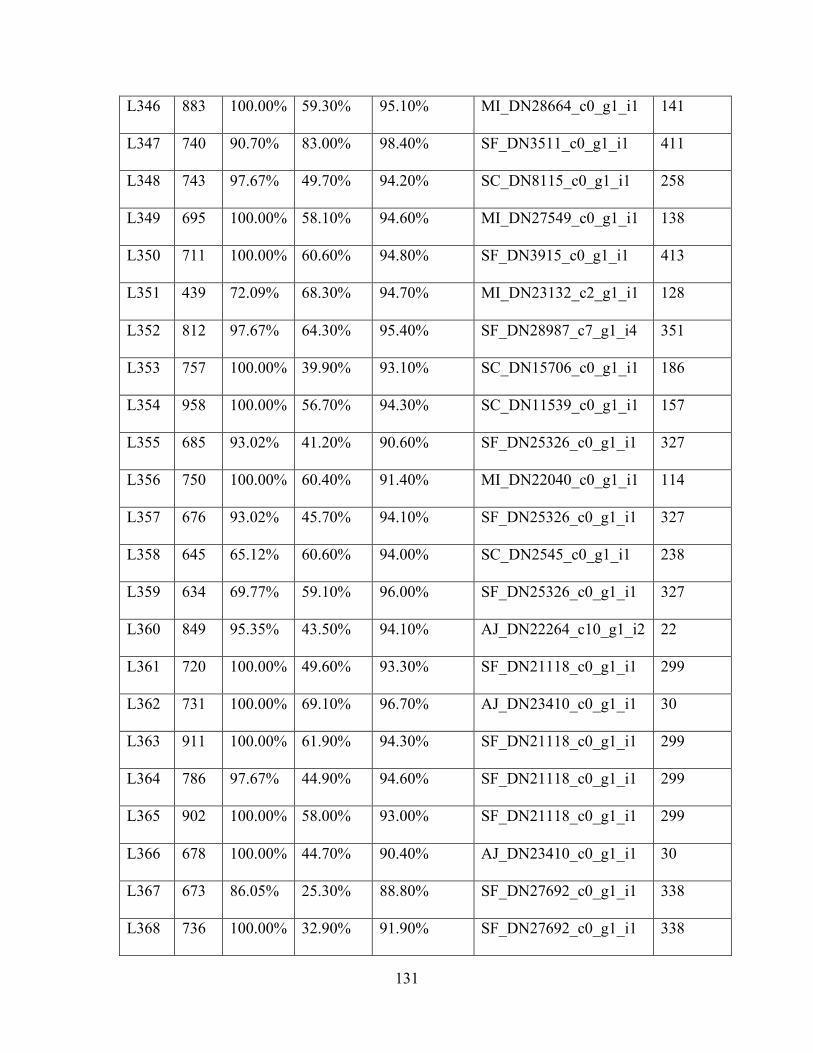
131
L346 883 100.00% 59.30% 95.10% MI_DN28664_c0_g1_i1 141
L347 740 90.70% 83.00% 98.40% SF_DN3511_c0_g1_i1 411
L348 743 97.67% 49.70% 94.20% SC_DN8115_c0_g1_i1 258
L349 695 100.00% 58.10% 94.60% MI_DN27549_c0_g1_i1 138
L350 711 100.00% 60.60% 94.80% SF_DN3915_c0_g1_i1 413
L351 439 72.09% 68.30% 94.70% MI_DN23132_c2_g1_i1 128
L352 812 97.67% 64.30% 95.40% SF_DN28987_c7_g1_i4 351
L353 757 100.00% 39.90% 93.10% SC_DN15706_c0_g1_i1 186
L354 958 100.00% 56.70% 94.30% SC_DN11539_c0_g1_i1 157
L355 685 93.02% 41.20% 90.60% SF_DN25326_c0_g1_i1 327
L356 750 100.00% 60.40% 91.40% MI_DN22040_c0_g1_i1 114
L357 676 93.02% 45.70% 94.10% SF_DN25326_c0_g1_i1 327
L358 645 65.12% 60.60% 94.00% SC_DN2545_c0_g1_i1 238
L359 634 69.77% 59.10% 96.00% SF_DN25326_c0_g1_i1 327
L360 849 95.35% 43.50% 94.10% AJ_DN22264_c10_g1_i2 22
L361 720 100.00% 49.60% 93.30% SF_DN21118_c0_g1_i1 299
L362 731 100.00% 69.10% 96.70% AJ_DN23410_c0_g1_i1 30
L363 911 100.00% 61.90% 94.30% SF_DN21118_c0_g1_i1 299
L364 786 97.67% 44.90% 94.60% SF_DN21118_c0_g1_i1 299
L365 902 100.00% 58.00% 93.00% SF_DN21118_c0_g1_i1 299
L366 678 100.00% 44.70% 90.40% AJ_DN23410_c0_g1_i1 30
L367 673 86.05% 25.30% 88.80% SF_DN27692_c0_g1_i1 338
L368 736 100.00% 32.90% 91.90% SF_DN27692_c0_g1_i1 338
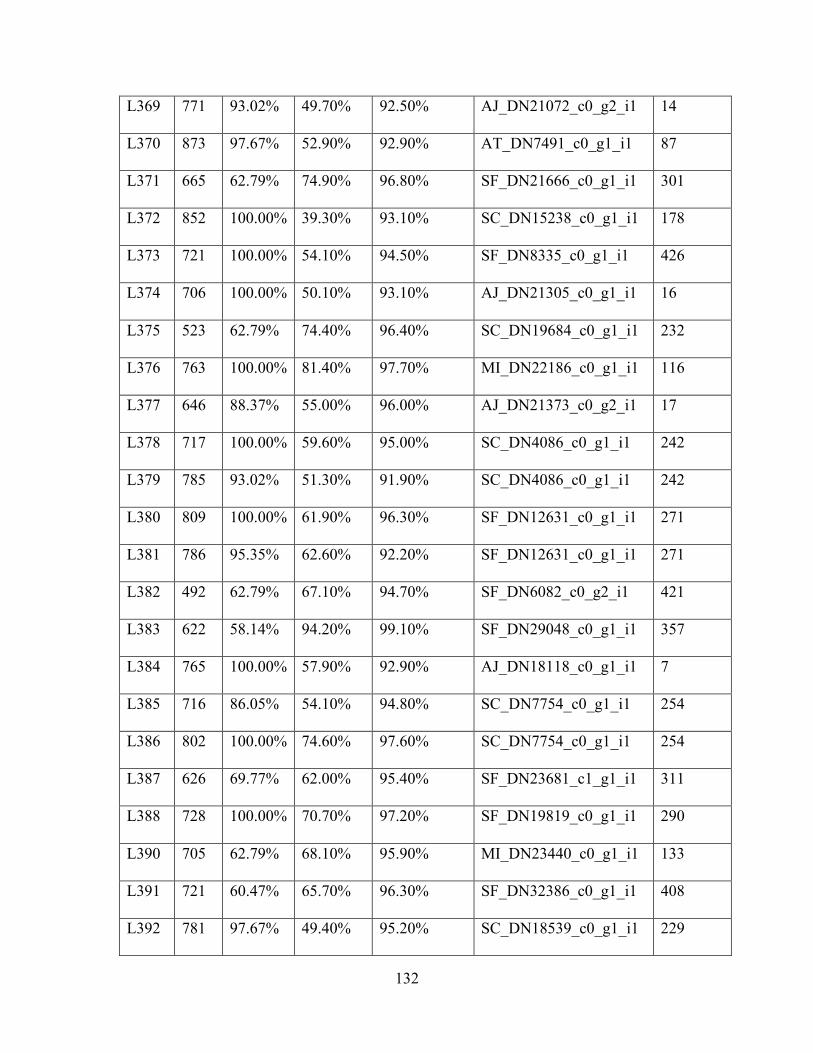
132
L369 771 93.02% 49.70% 92.50% AJ_DN21072_c0_g2_i1 14
L370 873 97.67% 52.90% 92.90% AT_DN7491_c0_g1_i1 87
L371 665 62.79% 74.90% 96.80% SF_DN21666_c0_g1_i1 301
L372 852 100.00% 39.30% 93.10% SC_DN15238_c0_g1_i1 178
L373 721 100.00% 54.10% 94.50% SF_DN8335_c0_g1_i1 426
L374 706 100.00% 50.10% 93.10% AJ_DN21305_c0_g1_i1 16
L375 523 62.79% 74.40% 96.40% SC_DN19684_c0_g1_i1 232
L376 763 100.00% 81.40% 97.70% MI_DN22186_c0_g1_i1 116
L377 646 88.37% 55.00% 96.00% AJ_DN21373_c0_g2_i1 17
L378 717 100.00% 59.60% 95.00% SC_DN4086_c0_g1_i1 242
L379 785 93.02% 51.30% 91.90% SC_DN4086_c0_g1_i1 242
L380 809 100.00% 61.90% 96.30% SF_DN12631_c0_g1_i1 271
L381 786 95.35% 62.60% 92.20% SF_DN12631_c0_g1_i1 271
L382 492 62.79% 67.10% 94.70% SF_DN6082_c0_g2_i1 421
L383 622 58.14% 94.20% 99.10% SF_DN29048_c0_g1_i1 357
L384 765 100.00% 57.90% 92.90% AJ_DN18118_c0_g1_i1 7
L385 716 86.05% 54.10% 94.80% SC_DN7754_c0_g1_i1 254
L386 802 100.00% 74.60% 97.60% SC_DN7754_c0_g1_i1 254
L387 626 69.77% 62.00% 95.40% SF_DN23681_c1_g1_i1 311
L388 728 100.00% 70.70% 97.20% SF_DN19819_c0_g1_i1 290
L390 705 62.79% 68.10% 95.90% MI_DN23440_c0_g1_i1 133
L391 721 60.47% 65.70% 96.30% SF_DN32386_c0_g1_i1 408
L392 781 97.67% 49.40% 95.20% SC_DN18539_c0_g1_i1 229
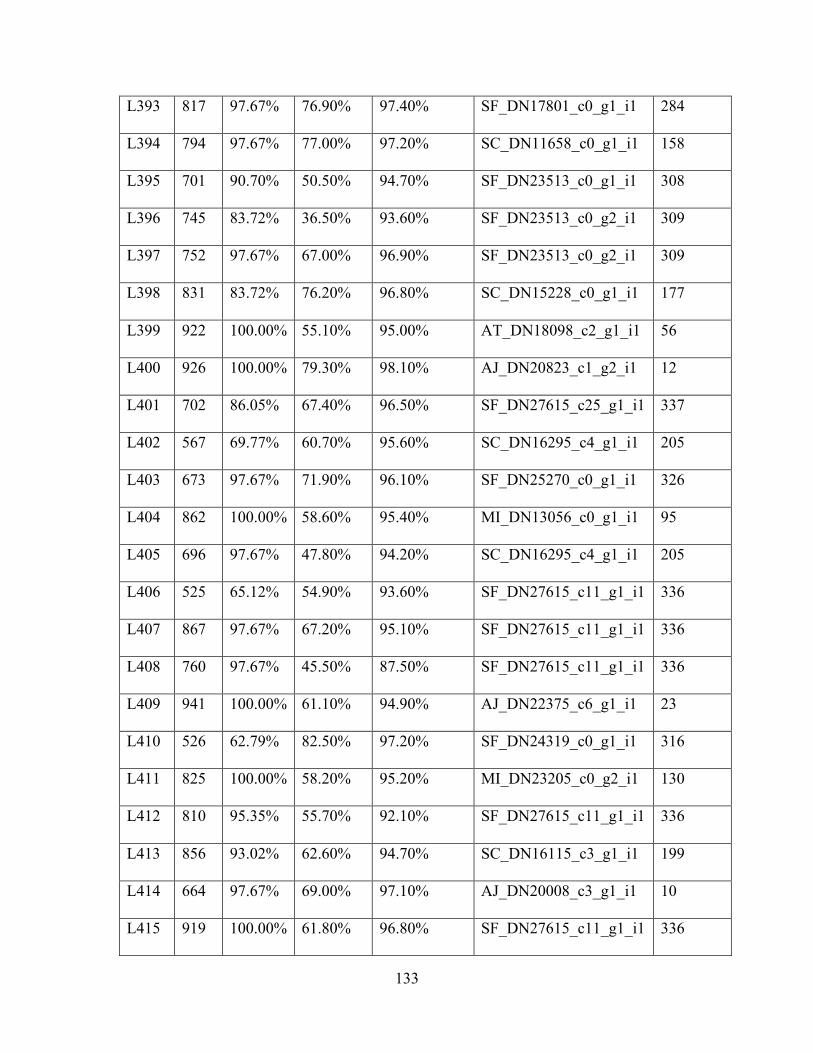
133
L393 817 97.67% 76.90% 97.40% SF_DN17801_c0_g1_i1 284
L394 794 97.67% 77.00% 97.20% SC_DN11658_c0_g1_i1 158
L395 701 90.70% 50.50% 94.70% SF_DN23513_c0_g1_i1 308
L396 745 83.72% 36.50% 93.60% SF_DN23513_c0_g2_i1 309
L397 752 97.67% 67.00% 96.90% SF_DN23513_c0_g2_i1 309
L398 831 83.72% 76.20% 96.80% SC_DN15228_c0_g1_i1 177
L399 922 100.00% 55.10% 95.00% AT_DN18098_c2_g1_i1 56
L400 926 100.00% 79.30% 98.10% AJ_DN20823_c1_g2_i1 12
L401 702 86.05% 67.40% 96.50% SF_DN27615_c25_g1_i1 337
L402 567 69.77% 60.70% 95.60% SC_DN16295_c4_g1_i1 205
L403 673 97.67% 71.90% 96.10% SF_DN25270_c0_g1_i1 326
L404 862 100.00% 58.60% 95.40% MI_DN13056_c0_g1_i1 95
L405 696 97.67% 47.80% 94.20% SC_DN16295_c4_g1_i1 205
L406 525 65.12% 54.90% 93.60% SF_DN27615_c11_g1_i1 336
L407 867 97.67% 67.20% 95.10% SF_DN27615_c11_g1_i1 336
L408 760 97.67% 45.50% 87.50% SF_DN27615_c11_g1_i1 336
L409 941 100.00% 61.10% 94.90% AJ_DN22375_c6_g1_i1 23
L410 526 62.79% 82.50% 97.20% SF_DN24319_c0_g1_i1 316
L411 825 100.00% 58.20% 95.20% MI_DN23205_c0_g2_i1 130
L412 810 95.35% 55.70% 92.10% SF_DN27615_c11_g1_i1 336
L413 856 93.02% 62.60% 94.70% SC_DN16115_c3_g1_i1 199
L414 664 97.67% 69.00% 97.10% AJ_DN20008_c3_g1_i1 10
L415 919 100.00% 61.80% 96.80% SF_DN27615_c11_g1_i1 336
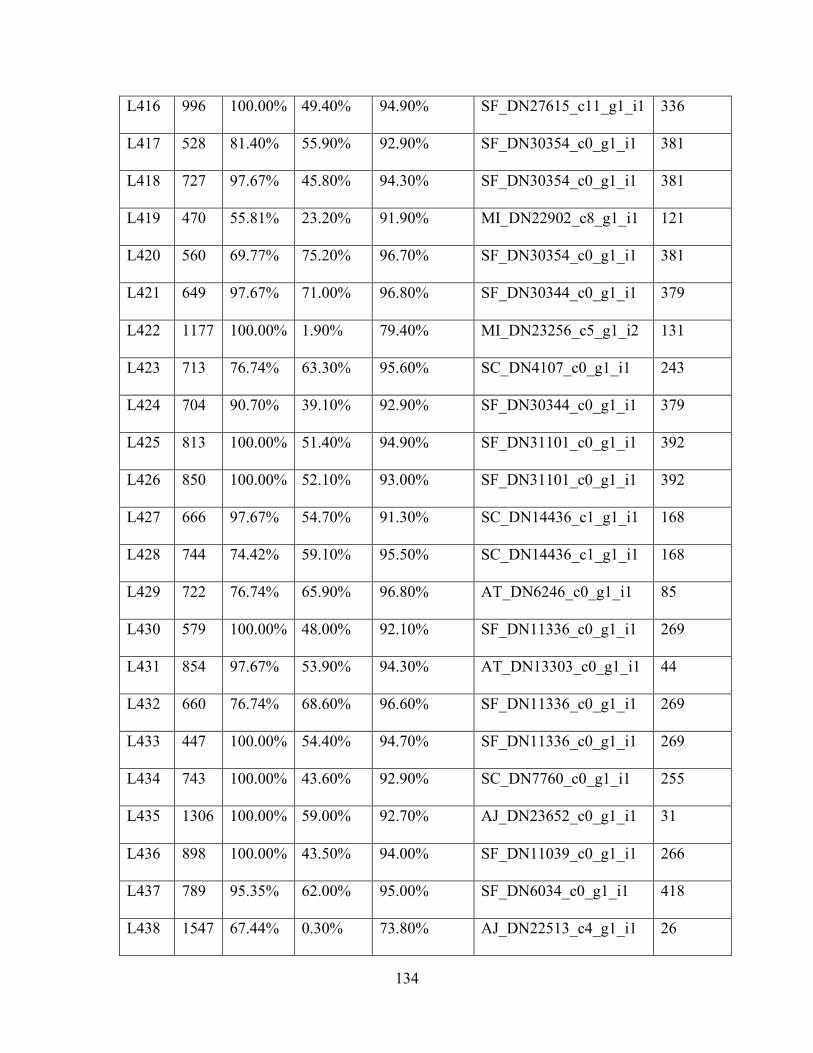
134
L416 996 100.00% 49.40% 94.90% SF_DN27615_c11_g1_i1 336
L417 528 81.40% 55.90% 92.90% SF_DN30354_c0_g1_i1 381
L418 727 97.67% 45.80% 94.30% SF_DN30354_c0_g1_i1 381
L419 470 55.81% 23.20% 91.90% MI_DN22902_c8_g1_i1 121
L420 560 69.77% 75.20% 96.70% SF_DN30354_c0_g1_i1 381
L421 649 97.67% 71.00% 96.80% SF_DN30344_c0_g1_i1 379
L422 1177 100.00% 1.90% 79.40% MI_DN23256_c5_g1_i2 131
L423 713 76.74% 63.30% 95.60% SC_DN4107_c0_g1_i1 243
L424 704 90.70% 39.10% 92.90% SF_DN30344_c0_g1_i1 379
L425 813 100.00% 51.40% 94.90% SF_DN31101_c0_g1_i1 392
L426 850 100.00% 52.10% 93.00% SF_DN31101_c0_g1_i1 392
L427 666 97.67% 54.70% 91.30% SC_DN14436_c1_g1_i1 168
L428 744 74.42% 59.10% 95.50% SC_DN14436_c1_g1_i1 168
L429 722 76.74% 65.90% 96.80% AT_DN6246_c0_g1_i1 85
L430 579 100.00% 48.00% 92.10% SF_DN11336_c0_g1_i1 269
L431 854 97.67% 53.90% 94.30% AT_DN13303_c0_g1_i1 44
L432 660 76.74% 68.60% 96.60% SF_DN11336_c0_g1_i1 269
L433 447 100.00% 54.40% 94.70% SF_DN11336_c0_g1_i1 269
L434 743 100.00% 43.60% 92.90% SC_DN7760_c0_g1_i1 255
L435 1306 100.00% 59.00% 92.70% AJ_DN23652_c0_g1_i1 31
L436 898 100.00% 43.50% 94.00% SF_DN11039_c0_g1_i1 266
L437 789 95.35% 62.00% 95.00% SF_DN6034_c0_g1_i1 418
L438 1547 67.44% 0.30% 73.80% AJ_DN22513_c4_g1_i1 26
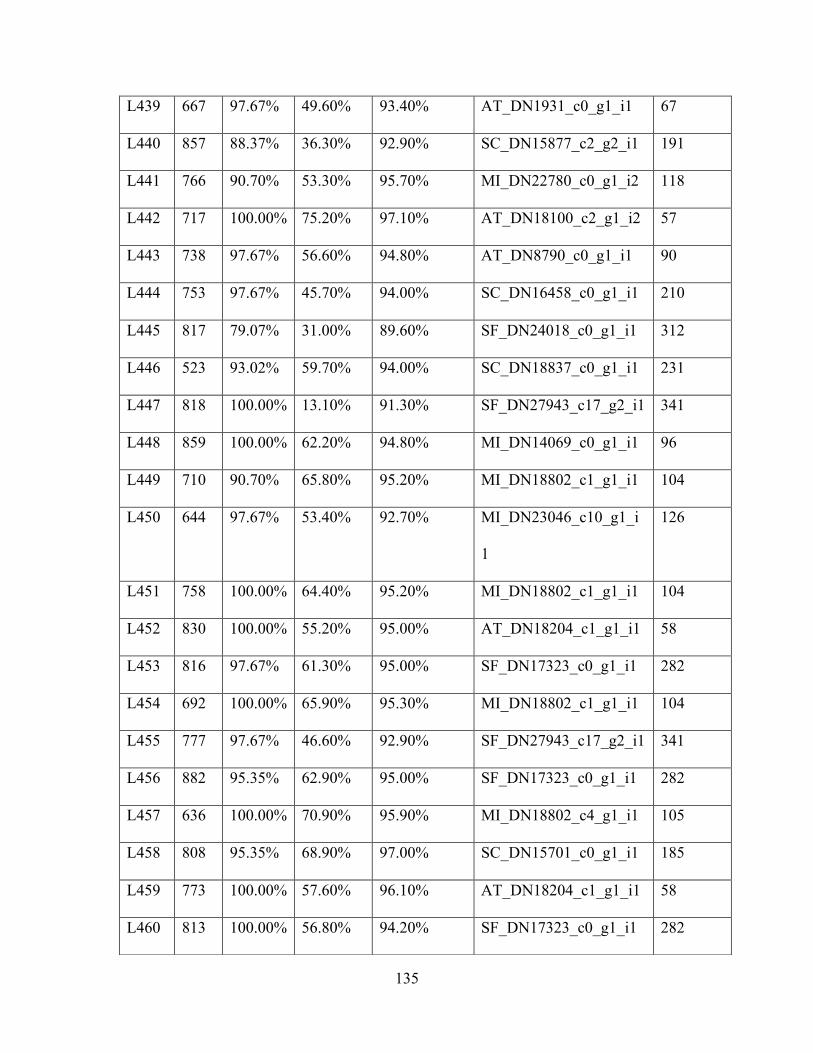
135
L439 667 97.67% 49.60% 93.40% AT_DN1931_c0_g1_i1 67
L440 857 88.37% 36.30% 92.90% SC_DN15877_c2_g2_i1 191
L441 766 90.70% 53.30% 95.70% MI_DN22780_c0_g1_i2 118
L442 717 100.00% 75.20% 97.10% AT_DN18100_c2_g1_i2 57
L443 738 97.67% 56.60% 94.80% AT_DN8790_c0_g1_i1 90
L444 753 97.67% 45.70% 94.00% SC_DN16458_c0_g1_i1 210
L445 817 79.07% 31.00% 89.60% SF_DN24018_c0_g1_i1 312
L446 523 93.02% 59.70% 94.00% SC_DN18837_c0_g1_i1 231
L447 818 100.00% 13.10% 91.30% SF_DN27943_c17_g2_i1 341
L448 859 100.00% 62.20% 94.80% MI_DN14069_c0_g1_i1 96
L449 710 90.70% 65.80% 95.20% MI_DN18802_c1_g1_i1 104
L450 644 97.67% 53.40% 92.70% MI_DN23046_c10_g1_i
1
126
L451 758 100.00% 64.40% 95.20% MI_DN18802_c1_g1_i1 104
L452 830 100.00% 55.20% 95.00% AT_DN18204_c1_g1_i1 58
L453 816 97.67% 61.30% 95.00% SF_DN17323_c0_g1_i1 282
L454 692 100.00% 65.90% 95.30% MI_DN18802_c1_g1_i1 104
L455 777 97.67% 46.60% 92.90% SF_DN27943_c17_g2_i1 341
L456 882 95.35% 62.90% 95.00% SF_DN17323_c0_g1_i1 282
L457 636 100.00% 70.90% 95.90% MI_DN18802_c4_g1_i1 105
L458 808 95.35% 68.90% 97.00% SC_DN15701_c0_g1_i1 185
L459 773 100.00% 57.60% 96.10% AT_DN18204_c1_g1_i1 58
L460 813 100.00% 56.80% 94.20% SF_DN17323_c0_g1_i1 282
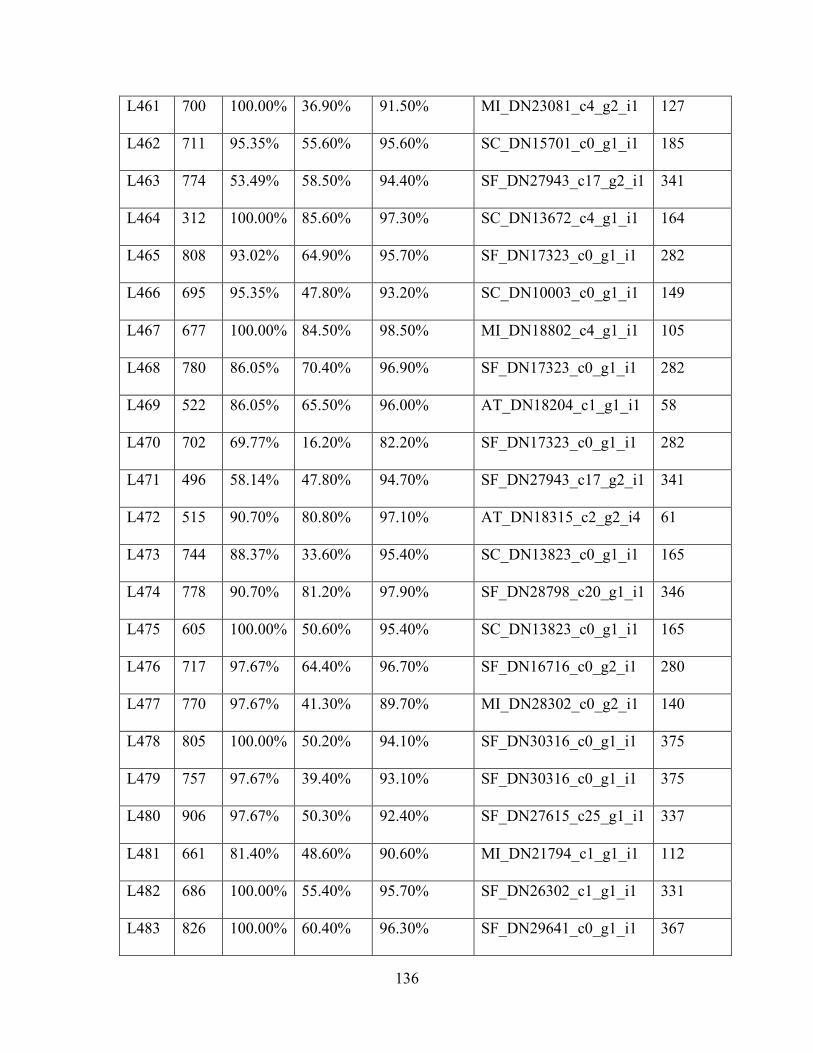
136
L461 700 100.00% 36.90% 91.50% MI_DN23081_c4_g2_i1 127
L462 711 95.35% 55.60% 95.60% SC_DN15701_c0_g1_i1 185
L463 774 53.49% 58.50% 94.40% SF_DN27943_c17_g2_i1 341
L464 312 100.00% 85.60% 97.30% SC_DN13672_c4_g1_i1 164
L465 808 93.02% 64.90% 95.70% SF_DN17323_c0_g1_i1 282
L466 695 95.35% 47.80% 93.20% SC_DN10003_c0_g1_i1 149
L467 677 100.00% 84.50% 98.50% MI_DN18802_c4_g1_i1 105
L468 780 86.05% 70.40% 96.90% SF_DN17323_c0_g1_i1 282
L469 522 86.05% 65.50% 96.00% AT_DN18204_c1_g1_i1 58
L470 702 69.77% 16.20% 82.20% SF_DN17323_c0_g1_i1 282
L471 496 58.14% 47.80% 94.70% SF_DN27943_c17_g2_i1 341
L472 515 90.70% 80.80% 97.10% AT_DN18315_c2_g2_i4 61
L473 744 88.37% 33.60% 95.40% SC_DN13823_c0_g1_i1 165
L474 778 90.70% 81.20% 97.90% SF_DN28798_c20_g1_i1 346
L475 605 100.00% 50.60% 95.40% SC_DN13823_c0_g1_i1 165
L476 717 97.67% 64.40% 96.70% SF_DN16716_c0_g2_i1 280
L477 770 97.67% 41.30% 89.70% MI_DN28302_c0_g2_i1 140
L478 805 100.00% 50.20% 94.10% SF_DN30316_c0_g1_i1 375
L479 757 97.67% 39.40% 93.10% SF_DN30316_c0_g1_i1 375
L480 906 97.67% 50.30% 92.40% SF_DN27615_c25_g1_i1 337
L481 661 81.40% 48.60% 90.60% MI_DN21794_c1_g1_i1 112
L482 686 100.00% 55.40% 95.70% SF_DN26302_c1_g1_i1 331
L483 826 100.00% 60.40% 96.30% SF_DN29641_c0_g1_i1 367
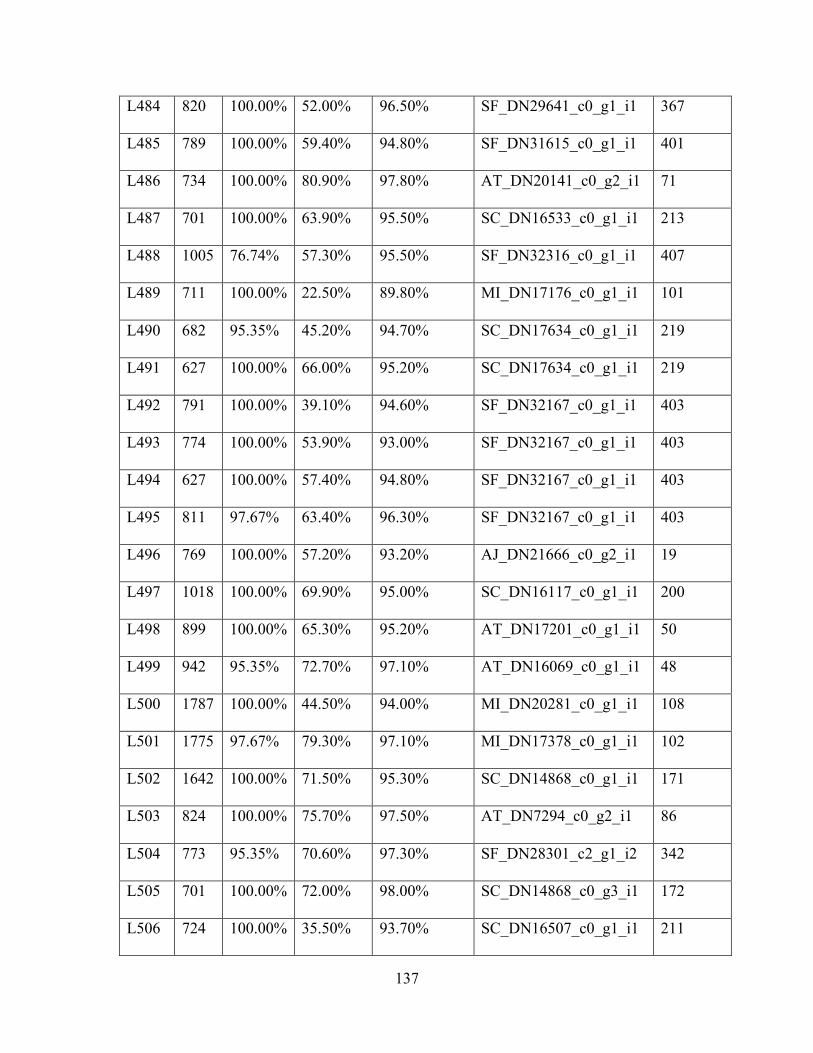
137
L484 820 100.00% 52.00% 96.50% SF_DN29641_c0_g1_i1 367
L485 789 100.00% 59.40% 94.80% SF_DN31615_c0_g1_i1 401
L486 734 100.00% 80.90% 97.80% AT_DN20141_c0_g2_i1 71
L487 701 100.00% 63.90% 95.50% SC_DN16533_c0_g1_i1 213
L488 1005 76.74% 57.30% 95.50% SF_DN32316_c0_g1_i1 407
L489 711 100.00% 22.50% 89.80% MI_DN17176_c0_g1_i1 101
L490 682 95.35% 45.20% 94.70% SC_DN17634_c0_g1_i1 219
L491 627 100.00% 66.00% 95.20% SC_DN17634_c0_g1_i1 219
L492 791 100.00% 39.10% 94.60% SF_DN32167_c0_g1_i1 403
L493 774 100.00% 53.90% 93.00% SF_DN32167_c0_g1_i1 403
L494 627 100.00% 57.40% 94.80% SF_DN32167_c0_g1_i1 403
L495 811 97.67% 63.40% 96.30% SF_DN32167_c0_g1_i1 403
L496 769 100.00% 57.20% 93.20% AJ_DN21666_c0_g2_i1 19
L497 1018 100.00% 69.90% 95.00% SC_DN16117_c0_g1_i1 200
L498 899 100.00% 65.30% 95.20% AT_DN17201_c0_g1_i1 50
L499 942 95.35% 72.70% 97.10% AT_DN16069_c0_g1_i1 48
L500 1787 100.00% 44.50% 94.00% MI_DN20281_c0_g1_i1 108
L501 1775 97.67% 79.30% 97.10% MI_DN17378_c0_g1_i1 102
L502 1642 100.00% 71.50% 95.30% SC_DN14868_c0_g1_i1 171
L503 824 100.00% 75.70% 97.50% AT_DN7294_c0_g2_i1 86
L504 773 95.35% 70.60% 97.30% SF_DN28301_c2_g1_i2 342
L505 701 100.00% 72.00% 98.00% SC_DN14868_c0_g3_i1 172
L506 724 100.00% 35.50% 93.70% SC_DN16507_c0_g1_i1 211
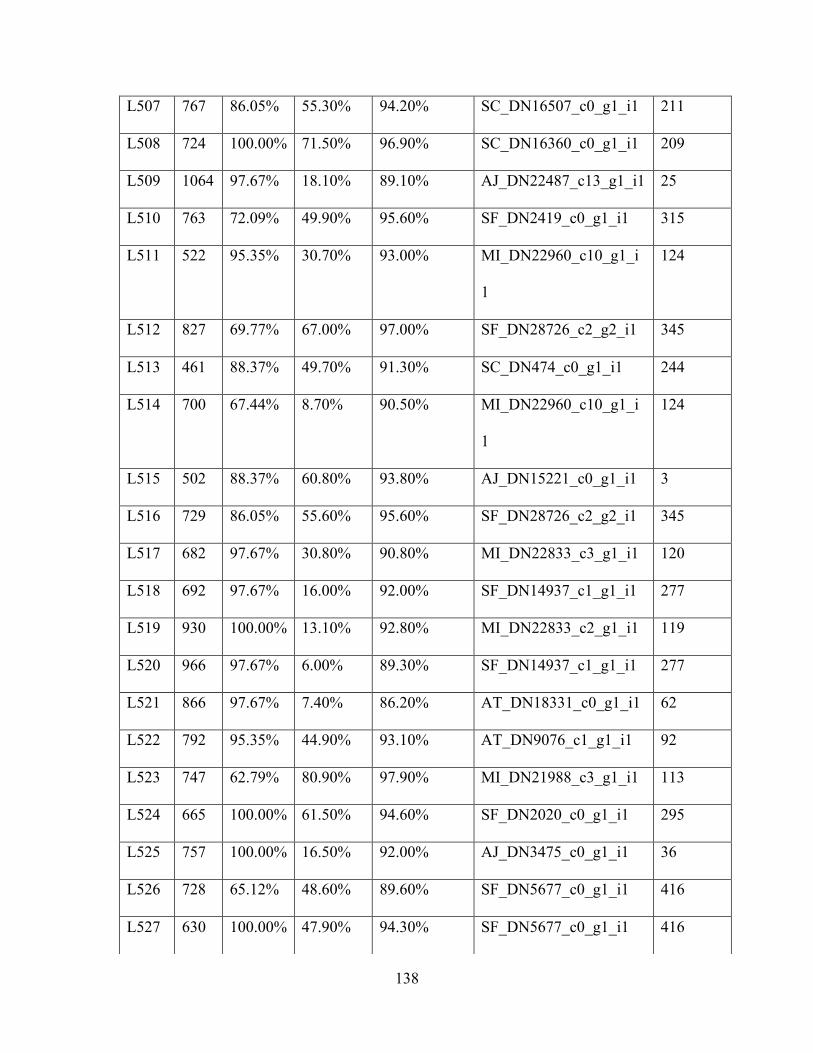
138
L507 767 86.05% 55.30% 94.20% SC_DN16507_c0_g1_i1 211
L508 724 100.00% 71.50% 96.90% SC_DN16360_c0_g1_i1 209
L509 1064 97.67% 18.10% 89.10% AJ_DN22487_c13_g1_i1 25
L510 763 72.09% 49.90% 95.60% SF_DN2419_c0_g1_i1 315
L511 522 95.35% 30.70% 93.00% MI_DN22960_c10_g1_i
1
124
L512 827 69.77% 67.00% 97.00% SF_DN28726_c2_g2_i1 345
L513 461 88.37% 49.70% 91.30% SC_DN474_c0_g1_i1 244
L514 700 67.44% 8.70% 90.50% MI_DN22960_c10_g1_i
1
124
L515 502 88.37% 60.80% 93.80% AJ_DN15221_c0_g1_i1 3
L516 729 86.05% 55.60% 95.60% SF_DN28726_c2_g2_i1 345
L517 682 97.67% 30.80% 90.80% MI_DN22833_c3_g1_i1 120
L518 692 97.67% 16.00% 92.00% SF_DN14937_c1_g1_i1 277
L519 930 100.00% 13.10% 92.80% MI_DN22833_c2_g1_i1 119
L520 966 97.67% 6.00% 89.30% SF_DN14937_c1_g1_i1 277
L521 866 97.67% 7.40% 86.20% AT_DN18331_c0_g1_i1 62
L522 792 95.35% 44.90% 93.10% AT_DN9076_c1_g1_i1 92
L523 747 62.79% 80.90% 97.90% MI_DN21988_c3_g1_i1 113
L524 665 100.00% 61.50% 94.60% SF_DN2020_c0_g1_i1 295
L525 757 100.00% 16.50% 92.00% AJ_DN3475_c0_g1_i1 36
L526 728 65.12% 48.60% 89.60% SF_DN5677_c0_g1_i1 416
L527 630 100.00% 47.90% 94.30% SF_DN5677_c0_g1_i1 416
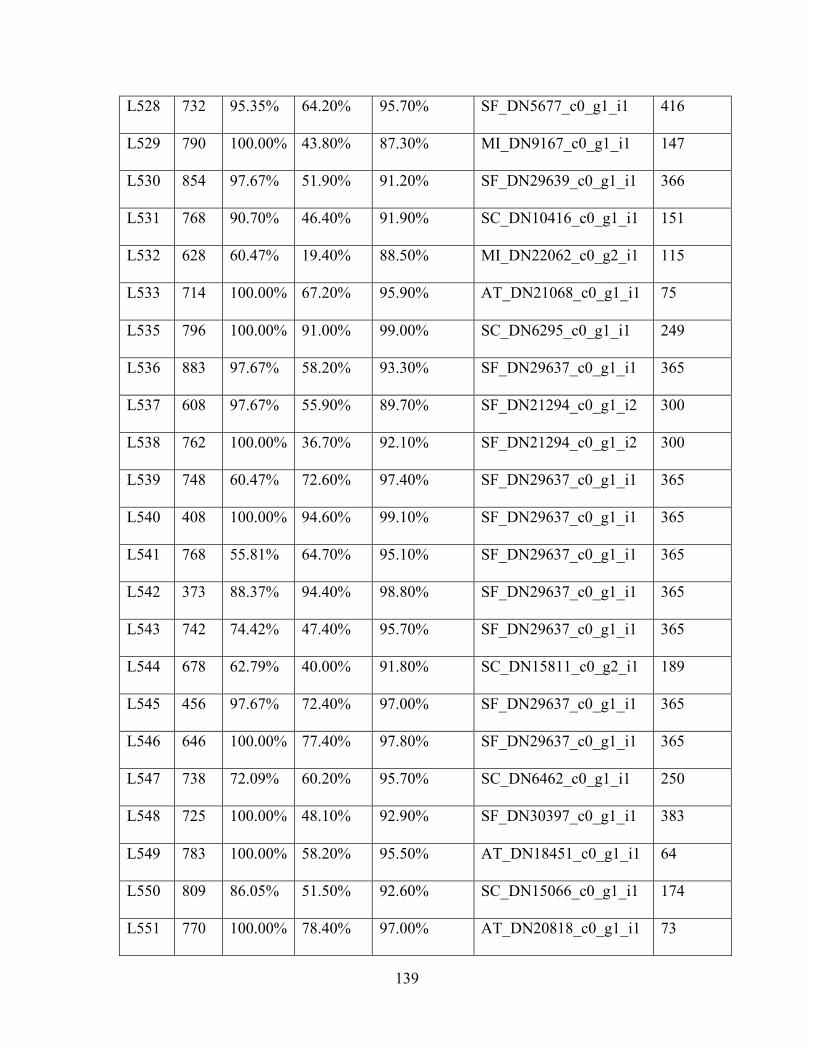
139
L528 732 95.35% 64.20% 95.70% SF_DN5677_c0_g1_i1 416
L529 790 100.00% 43.80% 87.30% MI_DN9167_c0_g1_i1 147
L530 854 97.67% 51.90% 91.20% SF_DN29639_c0_g1_i1 366
L531 768 90.70% 46.40% 91.90% SC_DN10416_c0_g1_i1 151
L532 628 60.47% 19.40% 88.50% MI_DN22062_c0_g2_i1 115
L533 714 100.00% 67.20% 95.90% AT_DN21068_c0_g1_i1 75
L535 796 100.00% 91.00% 99.00% SC_DN6295_c0_g1_i1 249
L536 883 97.67% 58.20% 93.30% SF_DN29637_c0_g1_i1 365
L537 608 97.67% 55.90% 89.70% SF_DN21294_c0_g1_i2 300
L538 762 100.00% 36.70% 92.10% SF_DN21294_c0_g1_i2 300
L539 748 60.47% 72.60% 97.40% SF_DN29637_c0_g1_i1 365
L540 408 100.00% 94.60% 99.10% SF_DN29637_c0_g1_i1 365
L541 768 55.81% 64.70% 95.10% SF_DN29637_c0_g1_i1 365
L542 373 88.37% 94.40% 98.80% SF_DN29637_c0_g1_i1 365
L543 742 74.42% 47.40% 95.70% SF_DN29637_c0_g1_i1 365
L544 678 62.79% 40.00% 91.80% SC_DN15811_c0_g2_i1 189
L545 456 97.67% 72.40% 97.00% SF_DN29637_c0_g1_i1 365
L546 646 100.00% 77.40% 97.80% SF_DN29637_c0_g1_i1 365
L547 738 72.09% 60.20% 95.70% SC_DN6462_c0_g1_i1 250
L548 725 100.00% 48.10% 92.90% SF_DN30397_c0_g1_i1 383
L549 783 100.00% 58.20% 95.50% AT_DN18451_c0_g1_i1 64
L550 809 86.05% 51.50% 92.60% SC_DN15066_c0_g1_i1 174
L551 770 100.00% 78.40% 97.00% AT_DN20818_c0_g1_i1 73
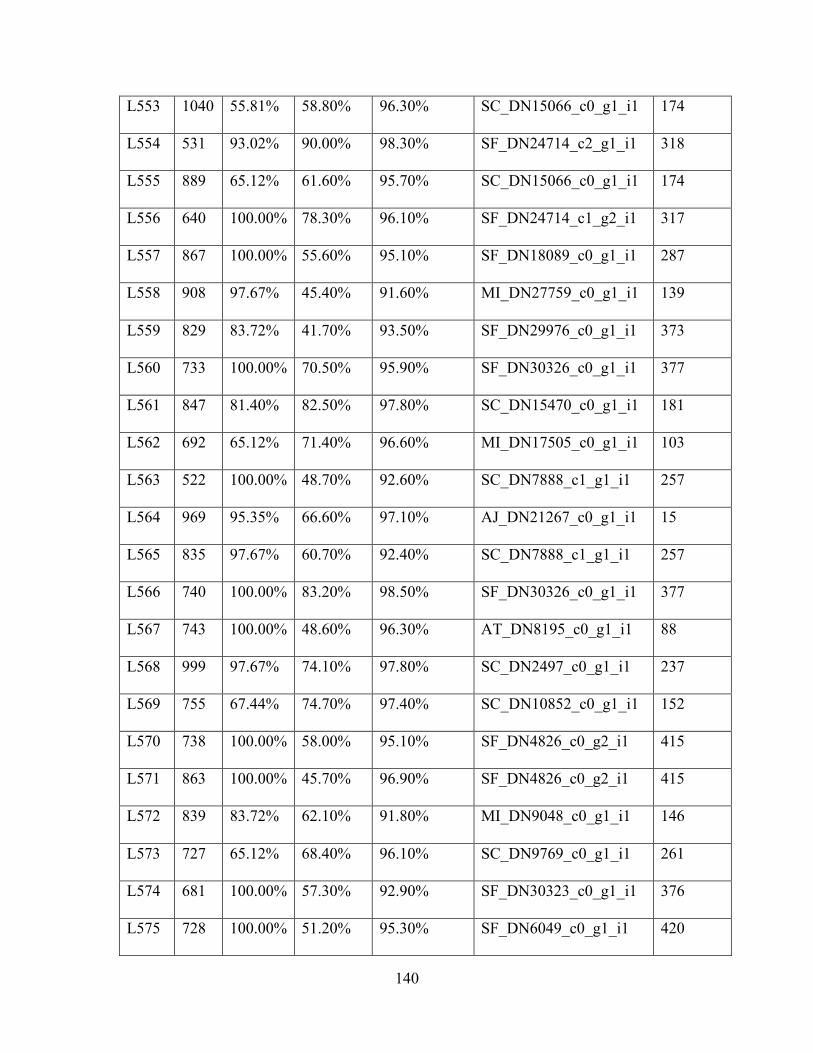
140
L553 1040 55.81% 58.80% 96.30% SC_DN15066_c0_g1_i1 174
L554 531 93.02% 90.00% 98.30% SF_DN24714_c2_g1_i1 318
L555 889 65.12% 61.60% 95.70% SC_DN15066_c0_g1_i1 174
L556 640 100.00% 78.30% 96.10% SF_DN24714_c1_g2_i1 317
L557 867 100.00% 55.60% 95.10% SF_DN18089_c0_g1_i1 287
L558 908 97.67% 45.40% 91.60% MI_DN27759_c0_g1_i1 139
L559 829 83.72% 41.70% 93.50% SF_DN29976_c0_g1_i1 373
L560 733 100.00% 70.50% 95.90% SF_DN30326_c0_g1_i1 377
L561 847 81.40% 82.50% 97.80% SC_DN15470_c0_g1_i1 181
L562 692 65.12% 71.40% 96.60% MI_DN17505_c0_g1_i1 103
L563 522 100.00% 48.70% 92.60% SC_DN7888_c1_g1_i1 257
L564 969 95.35% 66.60% 97.10% AJ_DN21267_c0_g1_i1 15
L565 835 97.67% 60.70% 92.40% SC_DN7888_c1_g1_i1 257
L566 740 100.00% 83.20% 98.50% SF_DN30326_c0_g1_i1 377
L567 743 100.00% 48.60% 96.30% AT_DN8195_c0_g1_i1 88
L568 999 97.67% 74.10% 97.80% SC_DN2497_c0_g1_i1 237
L569 755 67.44% 74.70% 97.40% SC_DN10852_c0_g1_i1 152
L570 738 100.00% 58.00% 95.10% SF_DN4826_c0_g2_i1 415
L571 863 100.00% 45.70% 96.90% SF_DN4826_c0_g2_i1 415
L572 839 83.72% 62.10% 91.80% MI_DN9048_c0_g1_i1 146
L573 727 65.12% 68.40% 96.10% SC_DN9769_c0_g1_i1 261
L574 681 100.00% 57.30% 92.90% SF_DN30323_c0_g1_i1 376
L575 728 100.00% 51.20% 95.30% SF_DN6049_c0_g1_i1 420
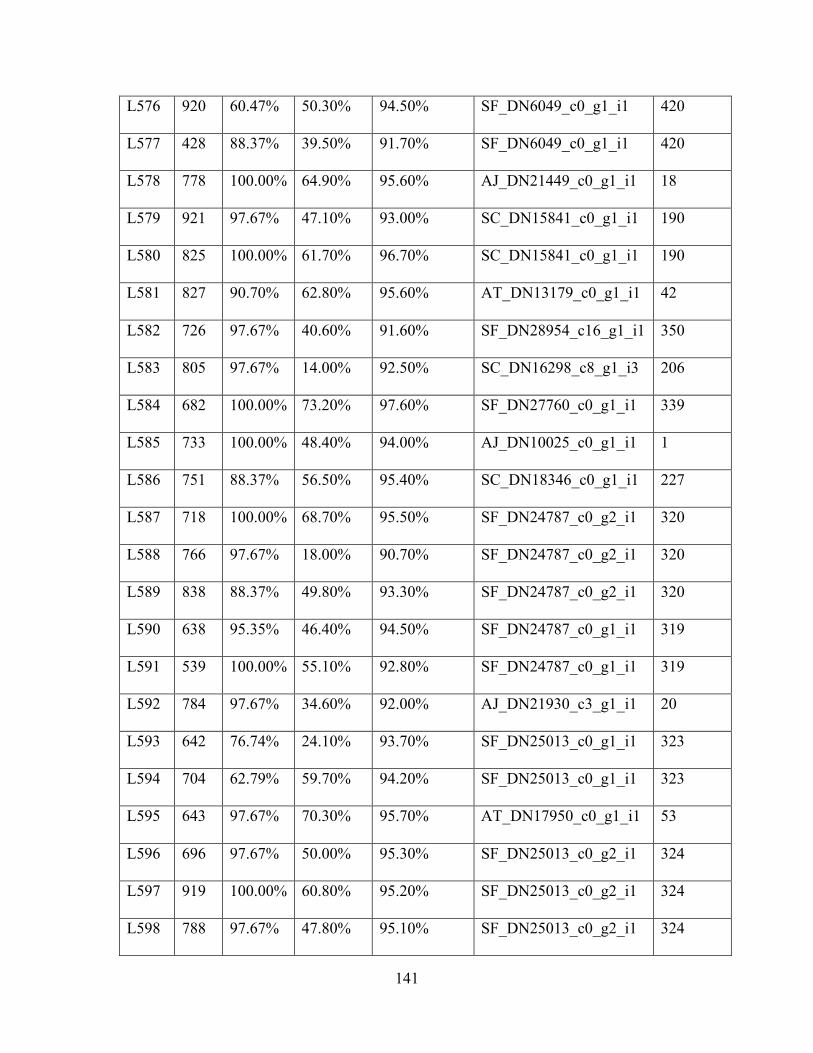
141
L576 920 60.47% 50.30% 94.50% SF_DN6049_c0_g1_i1 420
L577 428 88.37% 39.50% 91.70% SF_DN6049_c0_g1_i1 420
L578 778 100.00% 64.90% 95.60% AJ_DN21449_c0_g1_i1 18
L579 921 97.67% 47.10% 93.00% SC_DN15841_c0_g1_i1 190
L580 825 100.00% 61.70% 96.70% SC_DN15841_c0_g1_i1 190
L581 827 90.70% 62.80% 95.60% AT_DN13179_c0_g1_i1 42
L582 726 97.67% 40.60% 91.60% SF_DN28954_c16_g1_i1 350
L583 805 97.67% 14.00% 92.50% SC_DN16298_c8_g1_i3 206
L584 682 100.00% 73.20% 97.60% SF_DN27760_c0_g1_i1 339
L585 733 100.00% 48.40% 94.00% AJ_DN10025_c0_g1_i1 1
L586 751 88.37% 56.50% 95.40% SC_DN18346_c0_g1_i1 227
L587 718 100.00% 68.70% 95.50% SF_DN24787_c0_g2_i1 320
L588 766 97.67% 18.00% 90.70% SF_DN24787_c0_g2_i1 320
L589 838 88.37% 49.80% 93.30% SF_DN24787_c0_g2_i1 320
L590 638 95.35% 46.40% 94.50% SF_DN24787_c0_g1_i1 319
L591 539 100.00% 55.10% 92.80% SF_DN24787_c0_g1_i1 319
L592 784 97.67% 34.60% 92.00% AJ_DN21930_c3_g1_i1 20
L593 642 76.74% 24.10% 93.70% SF_DN25013_c0_g1_i1 323
L594 704 62.79% 59.70% 94.20% SF_DN25013_c0_g1_i1 323
L595 643 97.67% 70.30% 95.70% AT_DN17950_c0_g1_i1 53
L596 696 97.67% 50.00% 95.30% SF_DN25013_c0_g2_i1 324
L597 919 100.00% 60.80% 95.20% SF_DN25013_c0_g2_i1 324
L598 788 97.67% 47.80% 95.10% SF_DN25013_c0_g2_i1 324
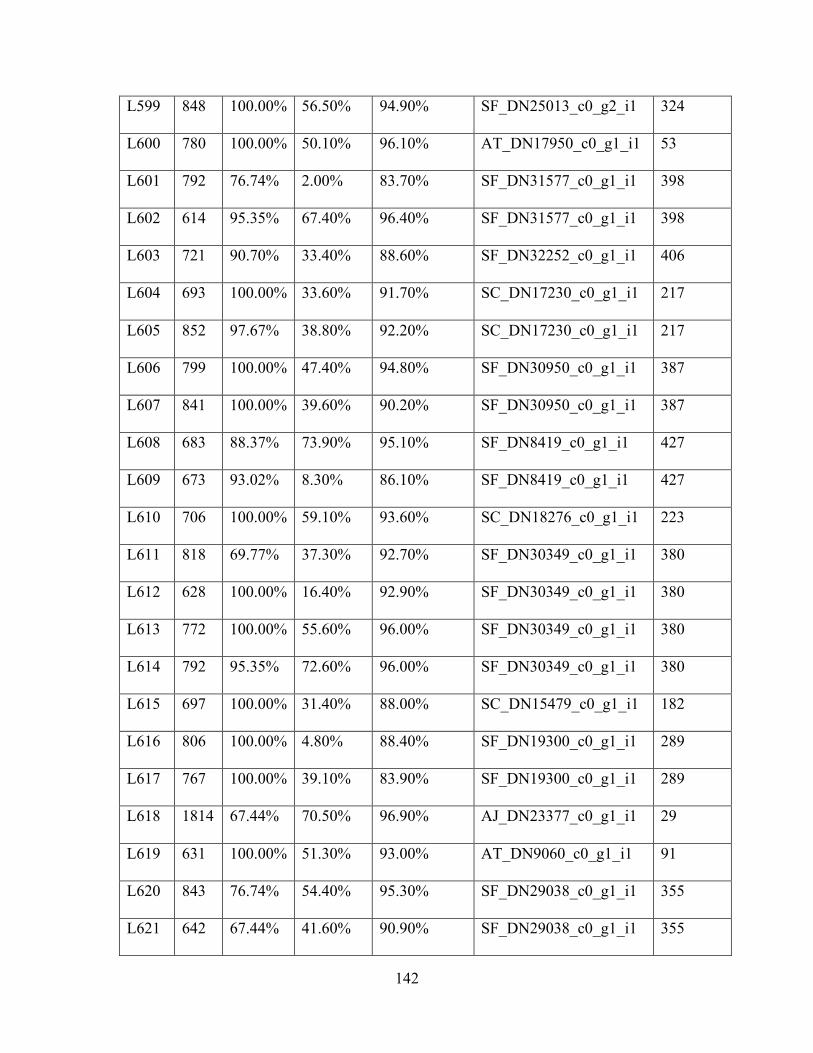
142
L599 848 100.00% 56.50% 94.90% SF_DN25013_c0_g2_i1 324
L600 780 100.00% 50.10% 96.10% AT_DN17950_c0_g1_i1 53
L601 792 76.74% 2.00% 83.70% SF_DN31577_c0_g1_i1 398
L602 614 95.35% 67.40% 96.40% SF_DN31577_c0_g1_i1 398
L603 721 90.70% 33.40% 88.60% SF_DN32252_c0_g1_i1 406
L604 693 100.00% 33.60% 91.70% SC_DN17230_c0_g1_i1 217
L605 852 97.67% 38.80% 92.20% SC_DN17230_c0_g1_i1 217
L606 799 100.00% 47.40% 94.80% SF_DN30950_c0_g1_i1 387
L607 841 100.00% 39.60% 90.20% SF_DN30950_c0_g1_i1 387
L608 683 88.37% 73.90% 95.10% SF_DN8419_c0_g1_i1 427
L609 673 93.02% 8.30% 86.10% SF_DN8419_c0_g1_i1 427
L610 706 100.00% 59.10% 93.60% SC_DN18276_c0_g1_i1 223
L611 818 69.77% 37.30% 92.70% SF_DN30349_c0_g1_i1 380
L612 628 100.00% 16.40% 92.90% SF_DN30349_c0_g1_i1 380
L613 772 100.00% 55.60% 96.00% SF_DN30349_c0_g1_i1 380
L614 792 95.35% 72.60% 96.00% SF_DN30349_c0_g1_i1 380
L615 697 100.00% 31.40% 88.00% SC_DN15479_c0_g1_i1 182
L616 806 100.00% 4.80% 88.40% SF_DN19300_c0_g1_i1 289
L617 767 100.00% 39.10% 83.90% SF_DN19300_c0_g1_i1 289
L618 1814 67.44% 70.50% 96.90% AJ_DN23377_c0_g1_i1 29
L619 631 100.00% 51.30% 93.00% AT_DN9060_c0_g1_i1 91
L620 843 76.74% 54.40% 95.30% SF_DN29038_c0_g1_i1 355
L621 642 67.44% 41.60% 90.90% SF_DN29038_c0_g1_i1 355
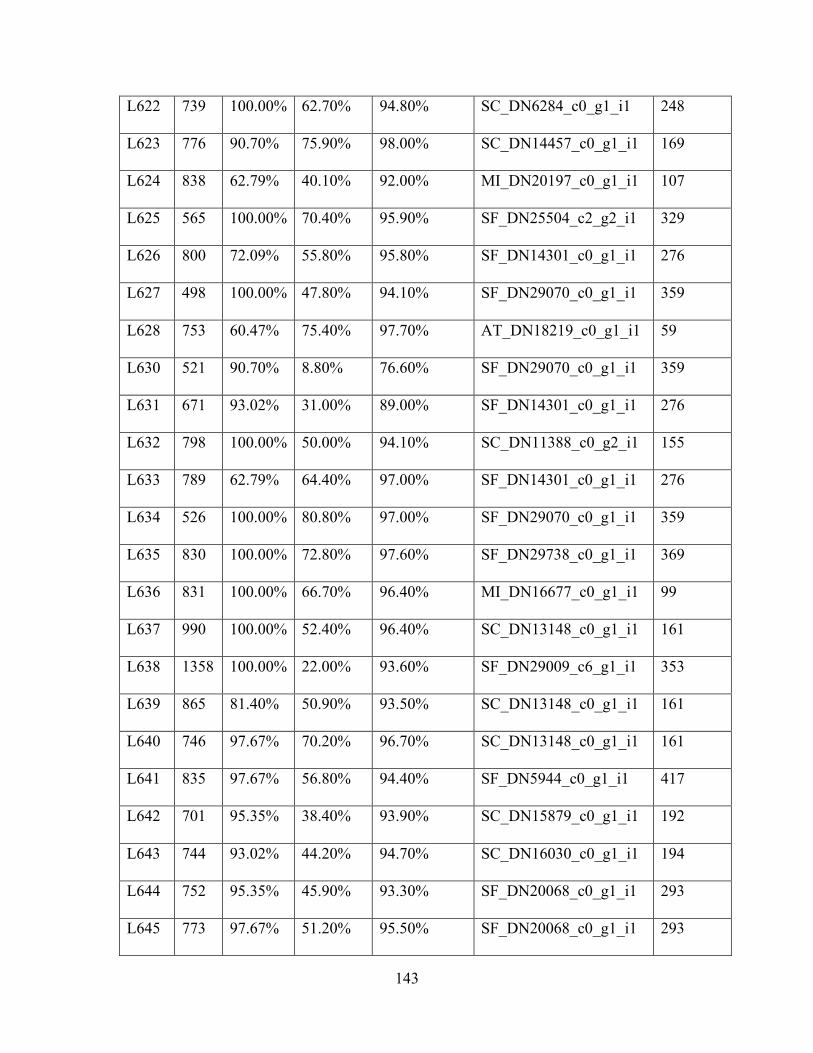
143
L622 739 100.00% 62.70% 94.80% SC_DN6284_c0_g1_i1 248
L623 776 90.70% 75.90% 98.00% SC_DN14457_c0_g1_i1 169
L624 838 62.79% 40.10% 92.00% MI_DN20197_c0_g1_i1 107
L625 565 100.00% 70.40% 95.90% SF_DN25504_c2_g2_i1 329
L626 800 72.09% 55.80% 95.80% SF_DN14301_c0_g1_i1 276
L627 498 100.00% 47.80% 94.10% SF_DN29070_c0_g1_i1 359
L628 753 60.47% 75.40% 97.70% AT_DN18219_c0_g1_i1 59
L630 521 90.70% 8.80% 76.60% SF_DN29070_c0_g1_i1 359
L631 671 93.02% 31.00% 89.00% SF_DN14301_c0_g1_i1 276
L632 798 100.00% 50.00% 94.10% SC_DN11388_c0_g2_i1 155
L633 789 62.79% 64.40% 97.00% SF_DN14301_c0_g1_i1 276
L634 526 100.00% 80.80% 97.00% SF_DN29070_c0_g1_i1 359
L635 830 100.00% 72.80% 97.60% SF_DN29738_c0_g1_i1 369
L636 831 100.00% 66.70% 96.40% MI_DN16677_c0_g1_i1 99
L637 990 100.00% 52.40% 96.40% SC_DN13148_c0_g1_i1 161
L638 1358 100.00% 22.00% 93.60% SF_DN29009_c6_g1_i1 353
L639 865 81.40% 50.90% 93.50% SC_DN13148_c0_g1_i1 161
L640 746 97.67% 70.20% 96.70% SC_DN13148_c0_g1_i1 161
L641 835 97.67% 56.80% 94.40% SF_DN5944_c0_g1_i1 417
L642 701 95.35% 38.40% 93.90% SC_DN15879_c0_g1_i1 192
L643 744 93.02% 44.20% 94.70% SC_DN16030_c0_g1_i1 194
L644 752 95.35% 45.90% 93.30% SF_DN20068_c0_g1_i1 293
L645 773 97.67% 51.20% 95.50% SF_DN20068_c0_g1_i1 293
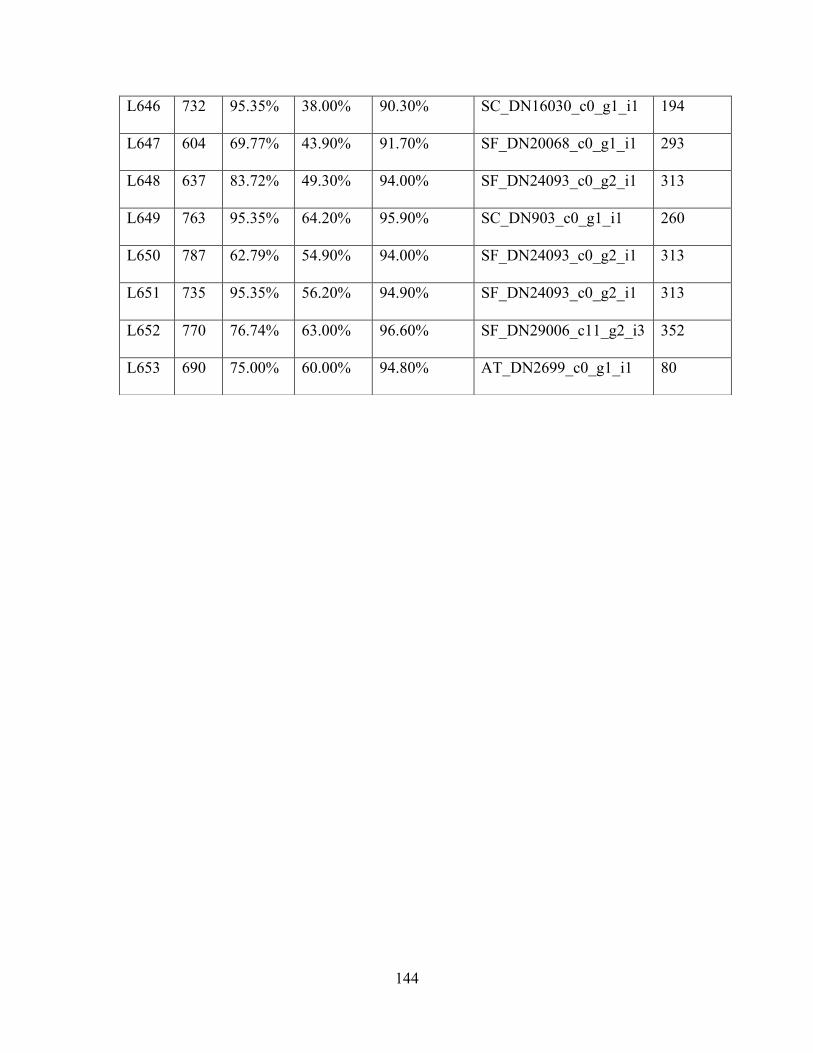
144
L646 732 95.35% 38.00% 90.30% SC_DN16030_c0_g1_i1 194
L647 604 69.77% 43.90% 91.70% SF_DN20068_c0_g1_i1 293
L648 637 83.72% 49.30% 94.00% SF_DN24093_c0_g2_i1 313
L649 763 95.35% 64.20% 95.90% SC_DN903_c0_g1_i1 260
L650 787 62.79% 54.90% 94.00% SF_DN24093_c0_g2_i1 313
L651 735 95.35% 56.20% 94.90% SF_DN24093_c0_g2_i1 313
L652 770 76.74% 63.00% 96.60% SF_DN29006_c11_g2_i3 352
L653 690 75.00% 60.00% 94.80% AT_DN2699_c0_g1_i1 80
Related Documents