National Leprosy Eradication Programme NLEP ANNUAL REPORT 2015 - 2016 Central Leprosy Division Directorate General of Health Services Ministry of Health and Family Welfare Government of India Nirman Bhawan, New Delhi – 110011.

Welcome message from author
This document is posted to help you gain knowledge. Please leave a comment to let me know what you think about it! Share it to your friends and learn new things together.
Transcript
National Leprosy Eradication Programme
NLEP ANNUAL REPORT
2015 - 2016
Central Leprosy Division Directorate General of Health Services Ministry of Health and Family Welfare
Government of India Nirman Bhawan, New Delhi – 110011.
NLEP – Annual Report for the year 2015-16
I. EPIDEMIOLOGICAL STATUS
Status in the Country
The year 2015-16 started with 0.88 lakh leprosy cases on record as on 1st
April 2015, with
PR 0.69/10,000. Till then 34 States/ UTs had attained the level of leprosy elimination. 551 districts
(82.36%) out of total 669 districts also achieved elimination by March 2016.
A total of 209 high endemic districts were identified for special actions during 2010-11.
After thorough analysis 1792 blocks &150 urban areas were identified for special activity. During
the year 2015-16 also, Special activities with house to house survey was the main strategy along
with IEC and capacity building of the workers and volunteers. These activities were carried out in
the high endemic blocks of low endemic districts along with the blocks of high endemic districts.
During 2015-16, there were 36 States/UTs and 669 districts.
Based on the reports received from all the States and UTs for the year of 2015 -16 (Annexure –I), current leprosy situation in the country is as below:
1. A total of 127334 new cases were detected during the year 2015-16, which gives Annual
New Case Detection Rate (ANCDR) of 9.71 per 100,000 population, as against 125785
cases in 2014-15. This shows decrease in ANCDR by 0.02% from 2014-15 (9.73).
2. A total of 86028 lakh cases are on record as on 1st April 2016, giving a Prevalence Rate
(PR) of 0.66 per 10,000 population, as against 88833 cases in 1st
April 2015. This shows
decrease in PR by 0.03% from 2014-15 (0.69).
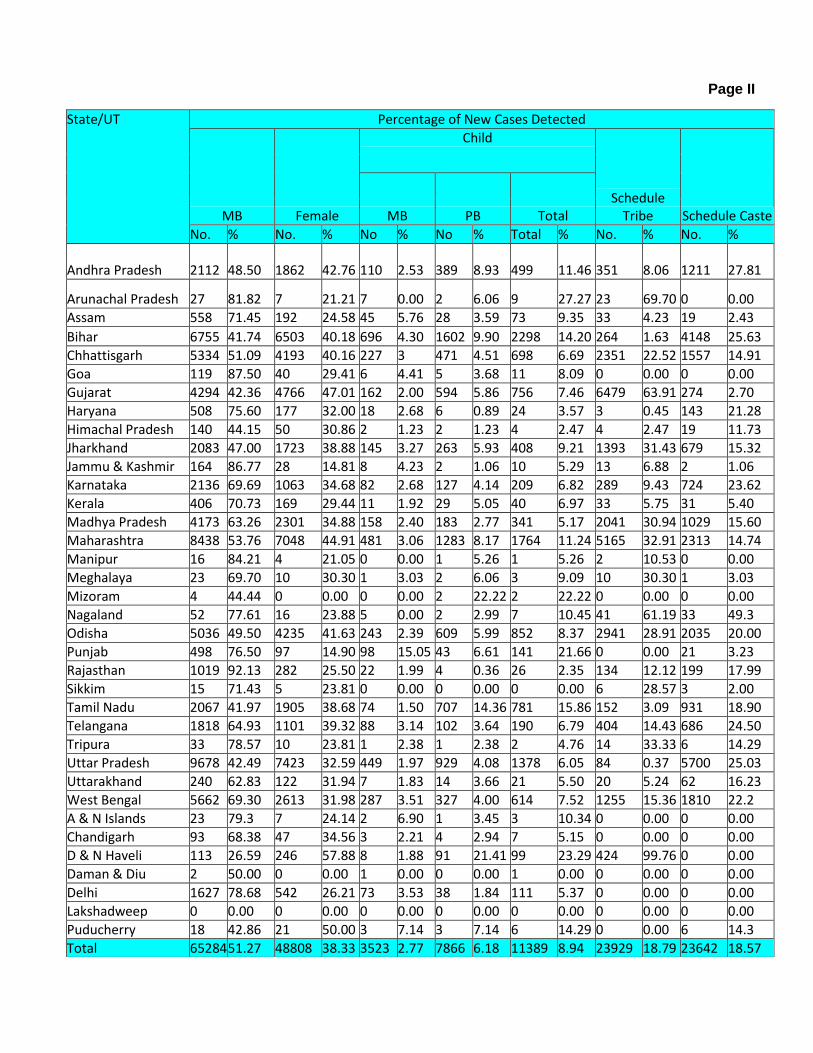
3. Detailed information on new leprosy cases detected during 2015-16 indicates the
proportion of MB (51.27%), Female (38.33%), Child (8.94%), Grade II Deformity (4.60%),
ST cases (18.79%) and SC cases (18.57%).
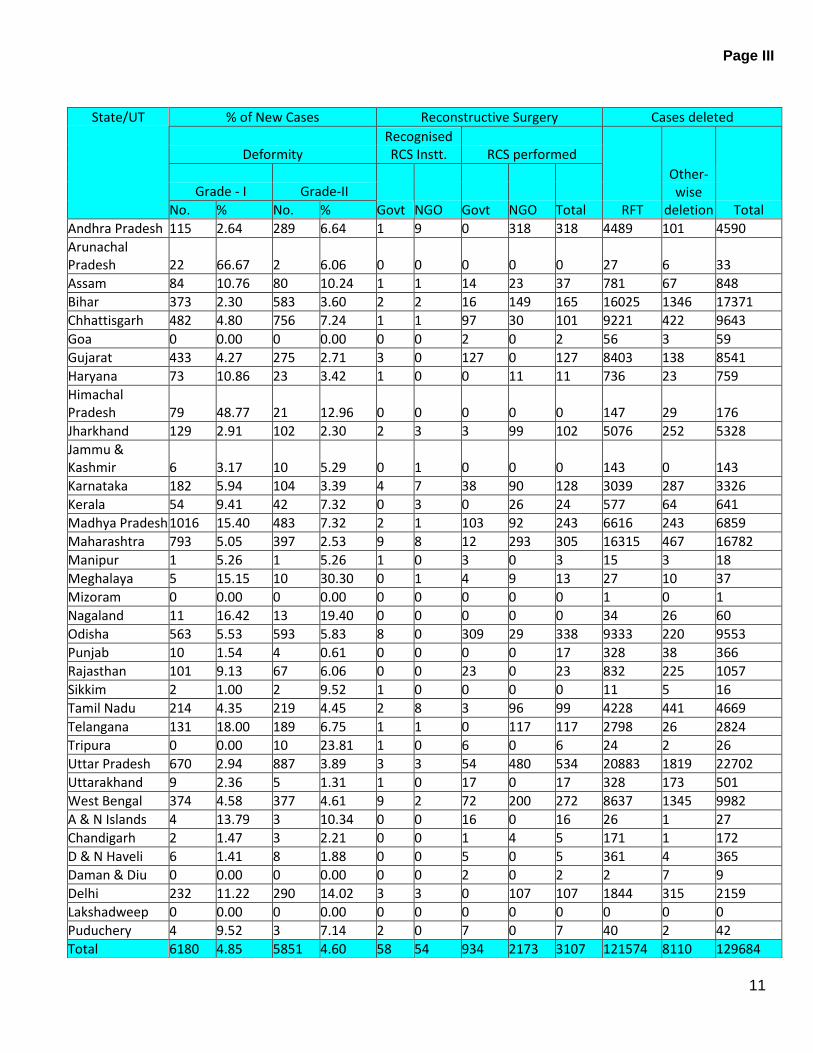
4. A total of 5851 Gr. II disability detected amongst the New Leprosy Cases during 2015-16,
indicating the Gr. II Disability Rate of 4.46 / million population (Annexure-II).
1
5. A total of 11389 child cases were recorded, indicating the Child Case rate of 0.89/100,000
population (Annexure-III). This shows an increase in child case rate from the year 2014-15
(0.88) by 0.01%
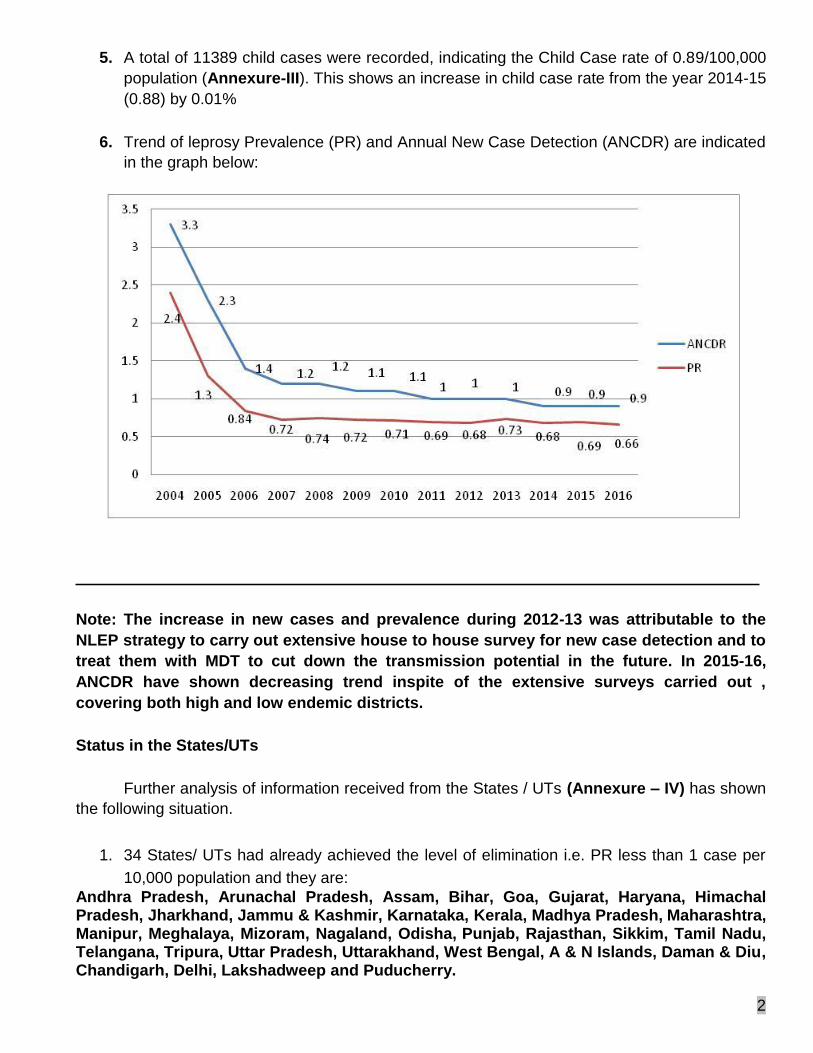
6. Trend of leprosy Prevalence (PR) and Annual New Case Detection (ANCDR) are indicated
in the graph below:
Note: The increase in new cases and prevalence during 2012-13 was attributable to the
NLEP strategy to carry out extensive house to house survey for new case detection and to
treat them with MDT to cut down the transmission potential in the future. In 2015-16,
ANCDR have shown decreasing trend inspite of the extensive surveys carried out ,
covering both high and low endemic districts.
Status in the States/UTs
Further analysis of information received from the States / UTs (Annexure – IV) has shown
the following situation.
1. 34 States/ UTs had already achieved the level of elimination i.e. PR less than 1 case per
10,000 population and they are:
Andhra Pradesh, Arunachal Pradesh, Assam, Bihar, Goa, Gujarat, Haryana, Himachal Pradesh, Jharkhand, Jammu & Kashmir, Karnataka, Kerala, Madhya Pradesh, Maharashtra, Manipur, Meghalaya, Mizoram, Nagaland, Odisha, Punjab, Rajasthan, Sikkim, Tamil Nadu, Telangana, Tripura, Uttar Pradesh, Uttarakhand, West Bengal, A & N Islands, Daman & Diu, Chandigarh, Delhi, Lakshadweep and Puducherry.
2
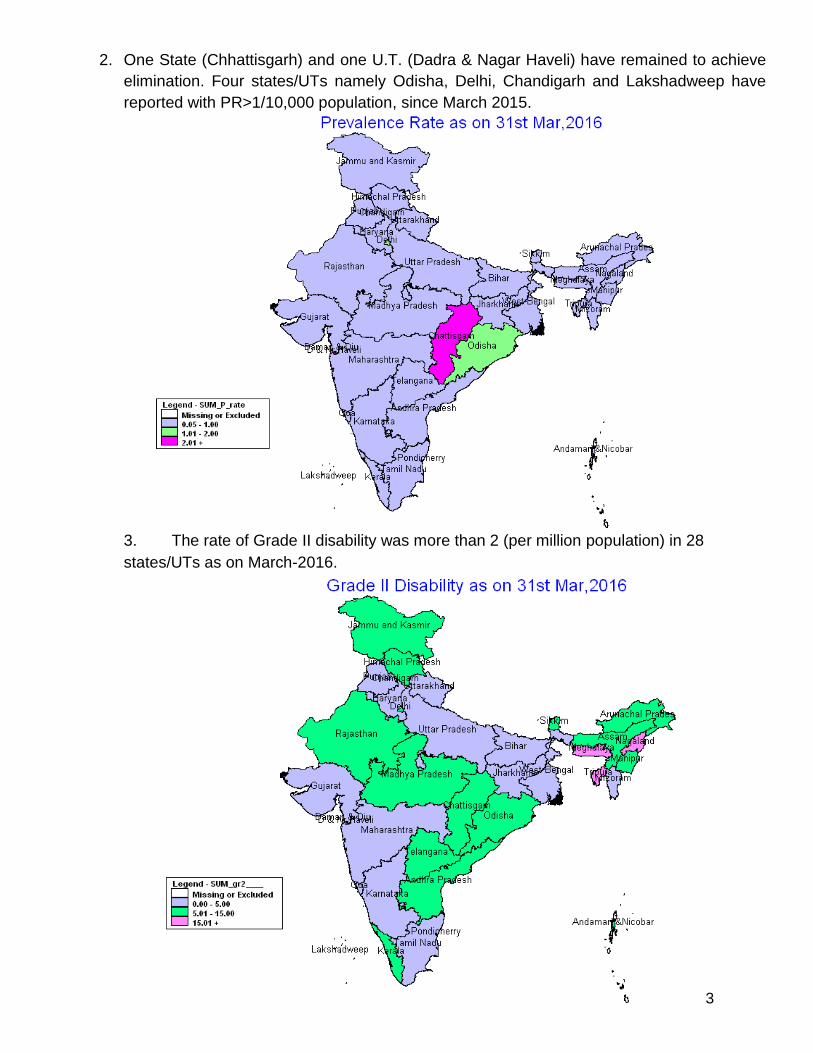
2. One State (Chhattisgarh) and one U.T. (Dadra & Nagar Haveli) have remained to achieve
elimination. Four states/UTs namely Odisha, Delhi, Chandigarh and Lakshadweep have
reported with PR>1/10,000 population, since March 2015.
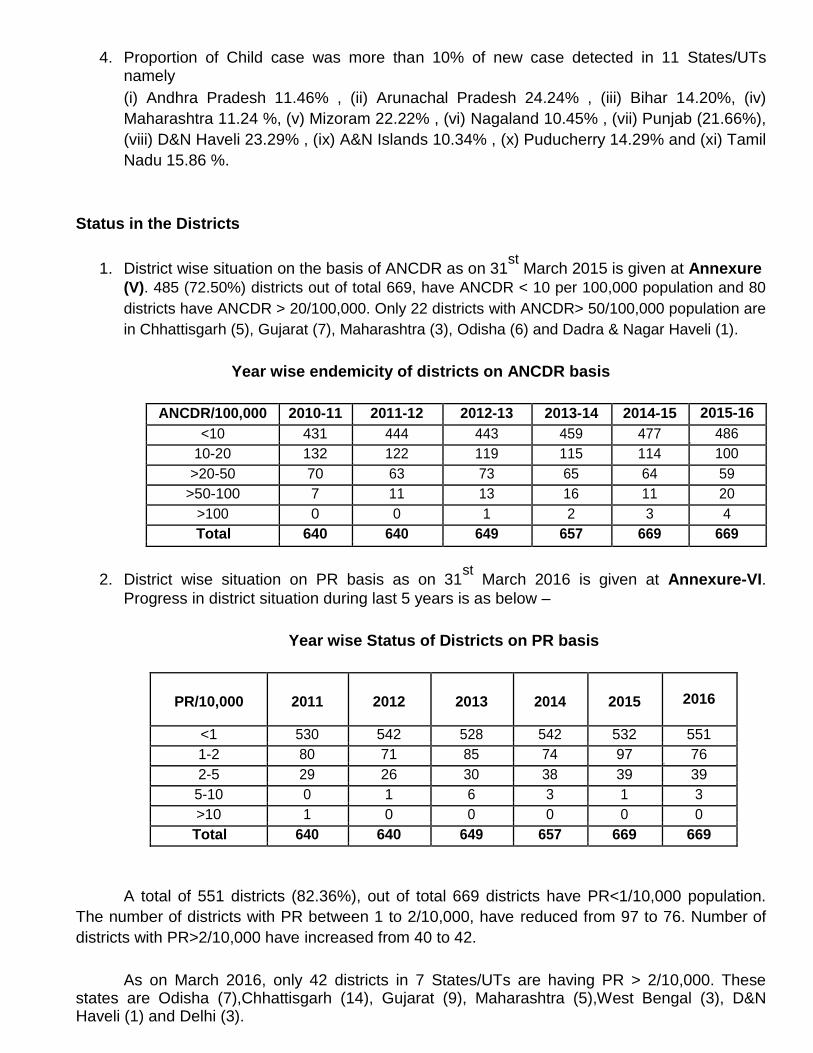
3. The rate of Grade II disability was more than 2 (per million population) in 28
states/UTs as on March-2016.
3
4. Proportion of Child case was more than 10% of new case detected in 11 States/UTs namely (i) Andhra Pradesh 11.46% , (ii) Arunachal Pradesh 24.24% , (iii) Bihar 14.20%, (iv)
Maharashtra 11.24 %, (v) Mizoram 22.22% , (vi) Nagaland 10.45% , (vii) Punjab (21.66%),
(viii) D&N Haveli 23.29% , (ix) A&N Islands 10.34% , (x) Puducherry 14.29% and (xi) Tamil
Nadu 15.86 %.
Status in the Districts
1. District wise situation on the basis of ANCDR as on 31st
March 2015 is given at Annexure (V). 485 (72.50%) districts out of total 669, have ANCDR < 10 per 100,000 population and 80
districts have ANCDR > 20/100,000. Only 22 districts with ANCDR> 50/100,000 population are
in Chhattisgarh (5), Gujarat (7), Maharashtra (3), Odisha (6) and Dadra & Nagar Haveli (1).
Year wise endemicity of districts on ANCDR basis
ANCDR/100,000 2010-11 2011-12 2012-13 2013-14 2014-15 2015-16
<10 431 444 443 459 477 486 10
10-20 132 122 119 115 114 100
>20-50 70 63 73 65 64 59
>50-100 7 11 13 16 11 20
>100 0 0 1 2 3 4
Total 640 640 649 657 669 669
2. District wise situation on PR basis as on 31st
March 2016 is given at Annexure-VI.
Progress in district situation during last 5 years is as below –
Year wise Status of Districts on PR basis
PR/10,000 2011 2012 2013 2014 2015
2016
<1 530 542 528 542 532 551
1-2 80 71 85 74 97 76 33
2-5 29 26 30 38 39 39
5-10 0 1 6 3 1 3
>10 1 0 0 0 0 0
Total 640 640 649 657 669 669
A total of 551 districts (82.36%), out of total 669 districts have PR<1/10,000 population.
The number of districts with PR between 1 to 2/10,000, have reduced from 97 to 76. Number of
districts with PR>2/10,000 have increased from 40 to 42.
As on March 2016, only 42 districts in 7 States/UTs are having PR > 2/10,000. These states are Odisha (7),Chhattisgarh (14), Gujarat (9), Maharashtra (5),West Bengal (3), D&N Haveli (1) and Delhi (3).
4
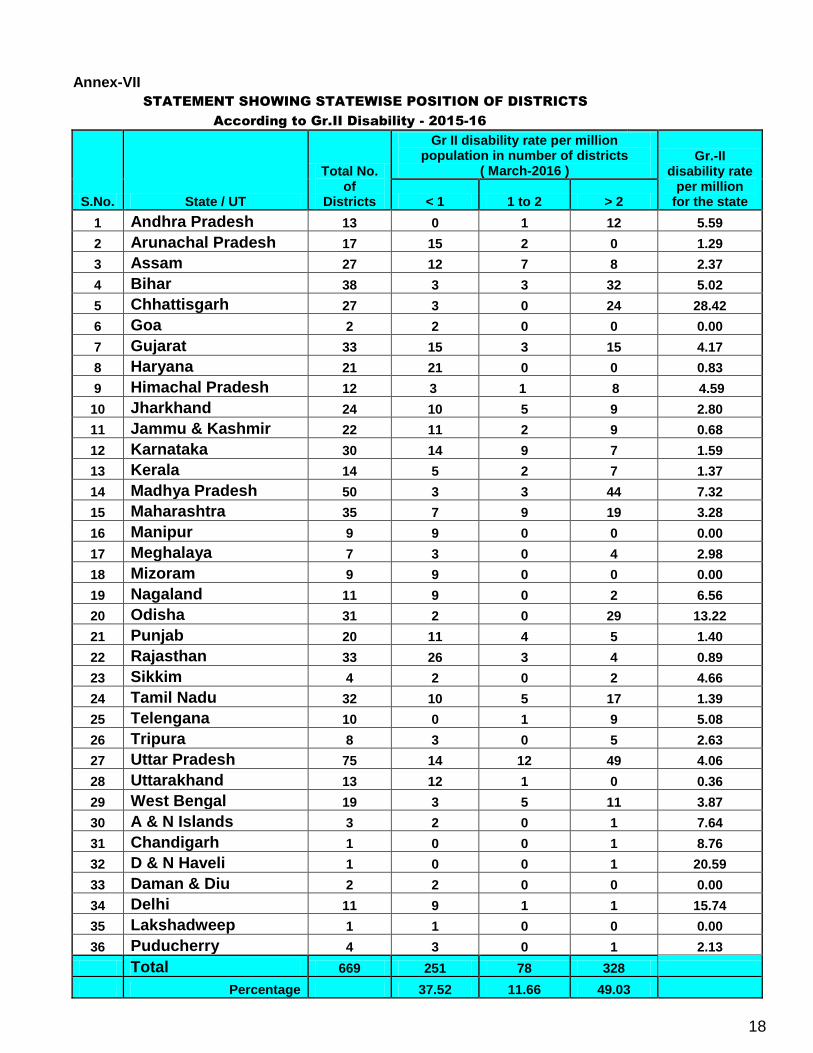
3. Position of districts as per grade II disability status has been given at (Annexure – VII ) Gr.
II disability rate >2/million population has been reported in 328 districts(49.03%).
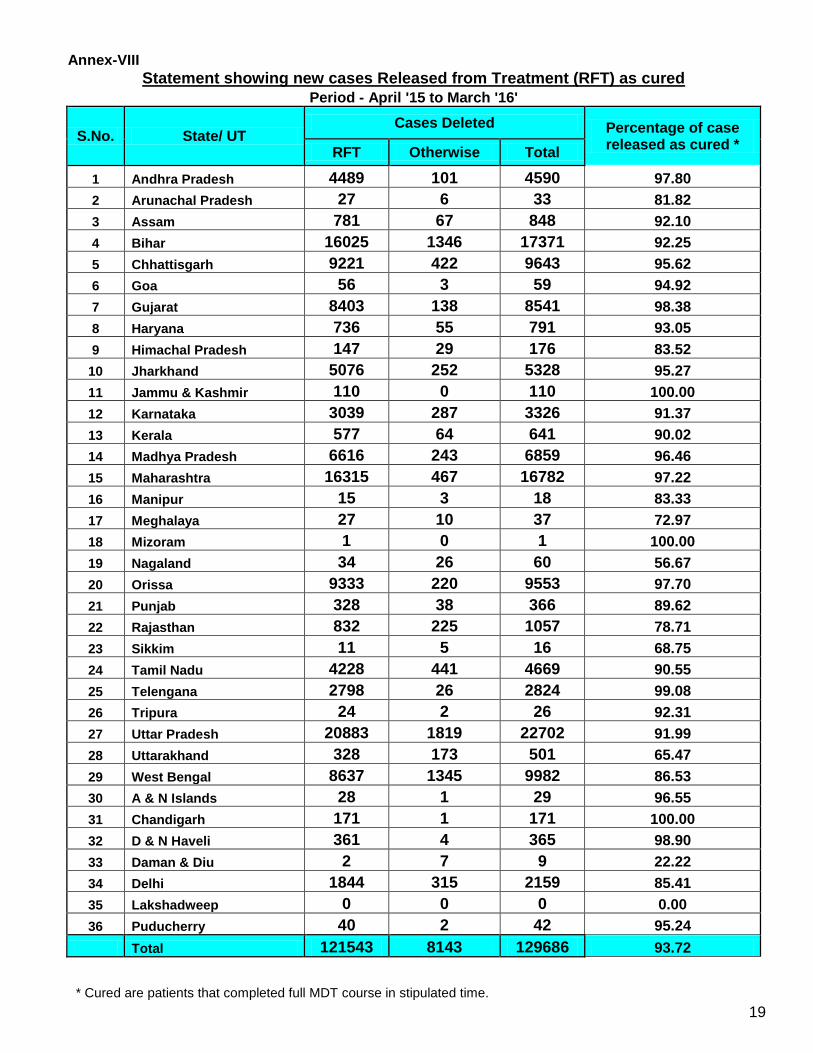
4. Out of the total 1.29 lakh New Cases deleted from record, a total of 1.21 lakh (93.72%)
completed their treatment within the specified period and were released from treatment
(RFT) as cured during 2015-16(Annexure – VIII).Poor performing states are Nagaland
(56.67%) and Uttrakhand (65.47%).
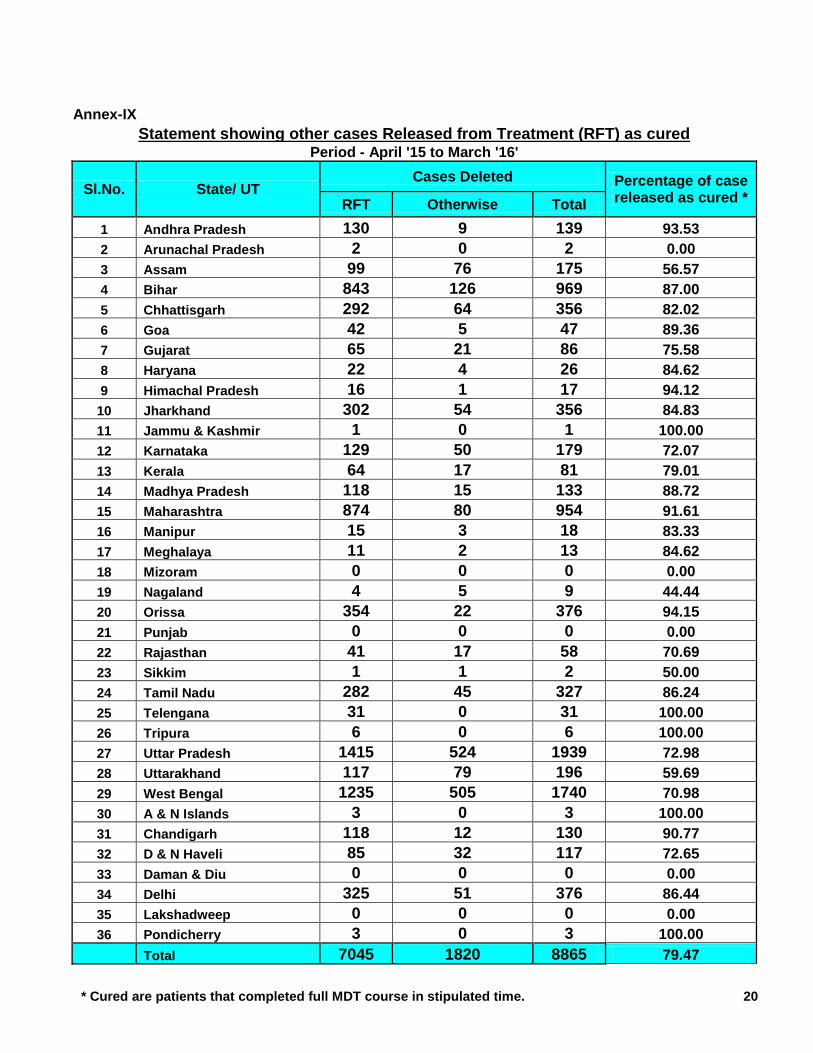
5. Out of the total 8865 ―Others Cases‖ deleted from record during 2015-16, a total of 7045
(79.47%) completed their treatment on time and were released from treatment (RFT) as
cured. (Annexure – IX ).
6. Total number of cases released as cured during 2015-16, comes to 1,28,588 (92.81%) as
against total deletion of 1,38,550. This brings the total number of persons affected by
Leprosy, cured of the disease, with MDT in the country, from the beginning till date to
130.59 lakh (13.05 million)
Other Programme aspects
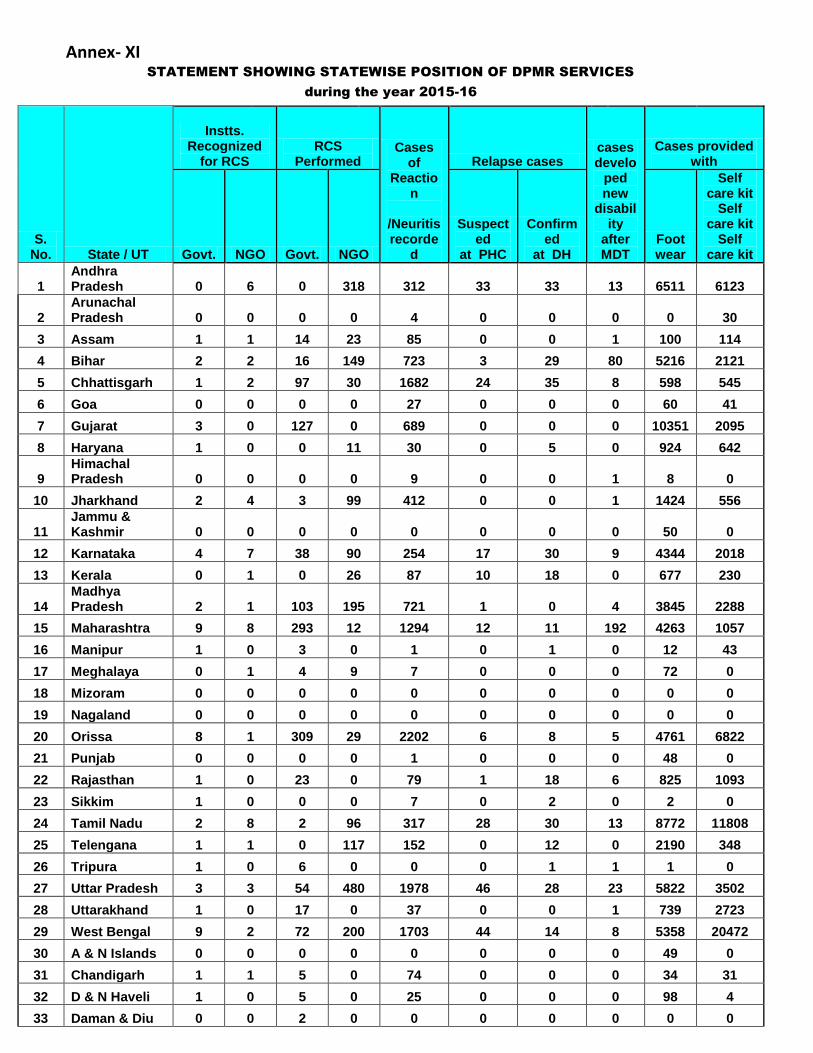
A. DPMR Services
Information pertaining to the Disability Prevention and Medical Rehabilitation (DPMR)
as received from the States/UTs is given at (Annexure – XI).
1. Total 115 (Govt.- 61 and NGO- 54) Institutions have been recognized for conducting Reconstructive Surgery to correct the disability in Leprosy Affected Persons.
2. During the year 2015-16 a total of 3107 RCS (Govt. – 934 and NGO – 2173) were
conducted.
3. A total of 276 Relapse cases were confirmed and treated at District Hospitals.
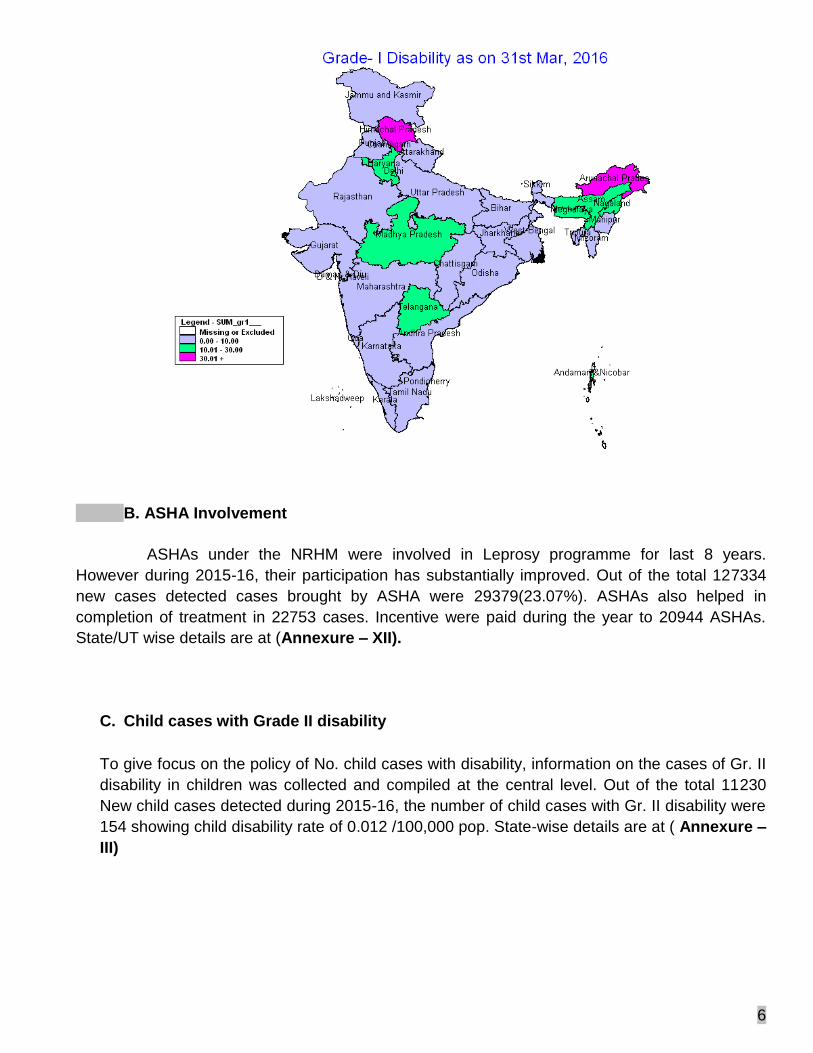
4. MCR footwear were provided to 52227 Leprosy Affected Persons with Grade I disability.
Map of states showing Grade I disability rate is as below:
5
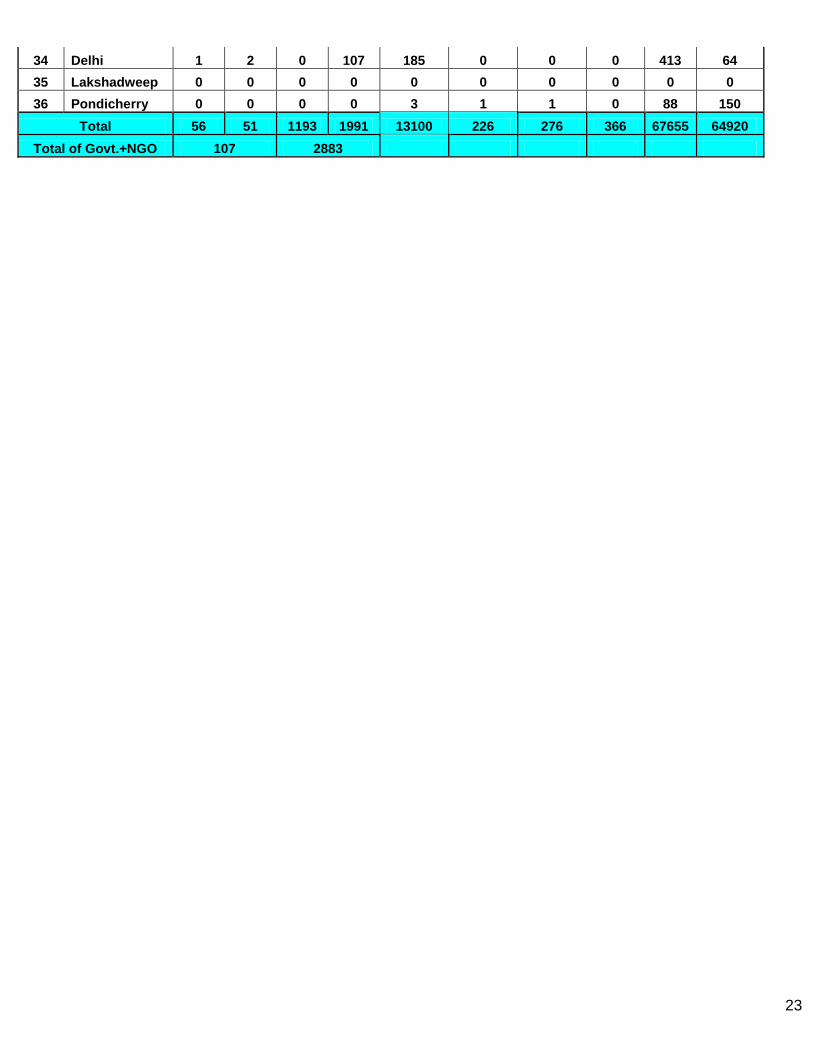
B. ASHA Involvement
ASHAs under the NRHM were involved in Leprosy programme for last 8 years.
However during 2015-16, their participation has substantially improved. Out of the total 127334
new cases detected cases brought by ASHA were 29379(23.07%). ASHAs also helped in
completion of treatment in 22753 cases. Incentive were paid during the year to 20944 ASHAs.
State/UT wise details are at (Annexure – XII).
C. Child cases with Grade II disability
To give focus on the policy of No. child cases with disability, information on the cases of Gr. II
disability in children was collected and compiled at the central level. Out of the total 11230
New child cases detected during 2015-16, the number of child cases with Gr. II disability were
154 showing child disability rate of 0.012 /100,000 pop. State-wise details are at ( Annexure –
III)
6
D. Training
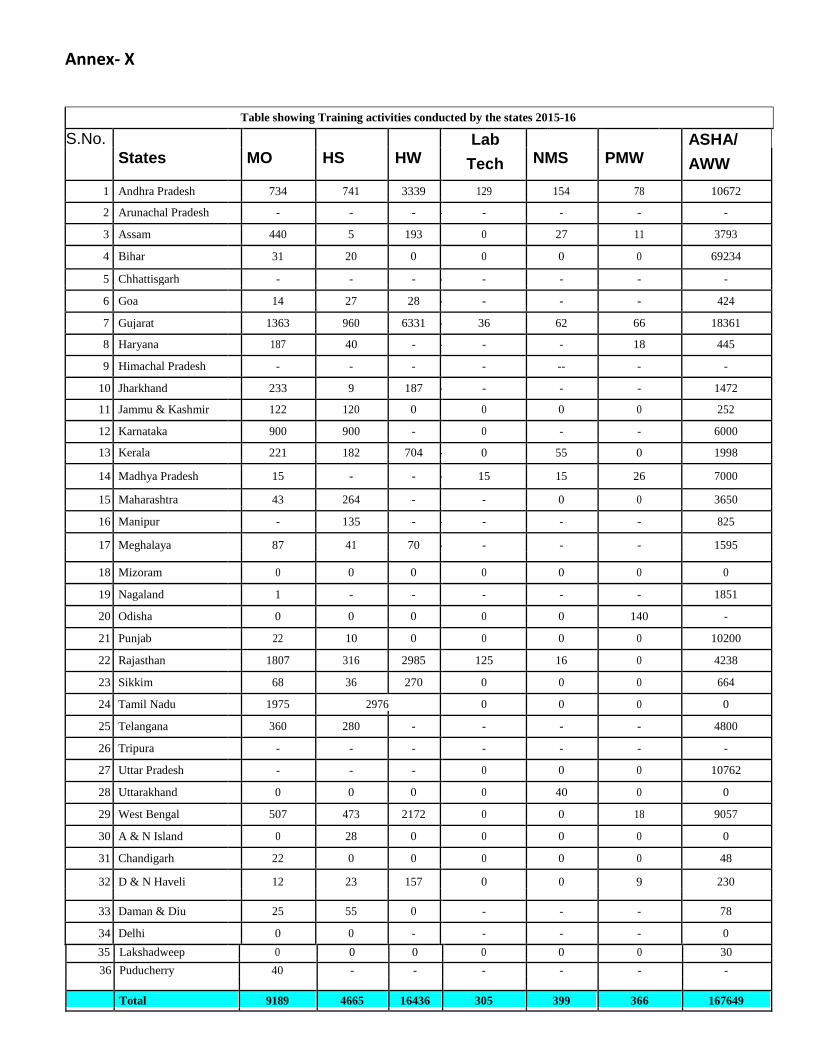
(i) There are number of training on Leprosy held across India for enhancing
efficiency of manpower. As per the report submitted by states on training
activities conducted during 2015-16. Number trained are Medical officer –9189,
Health supervisor 4665, Health Workers 16436, Lab Technician- 305, NMS 399,
Para Medical Workers 366 and ASHA/ AWWs-167649. Details are at Annexure
– X.
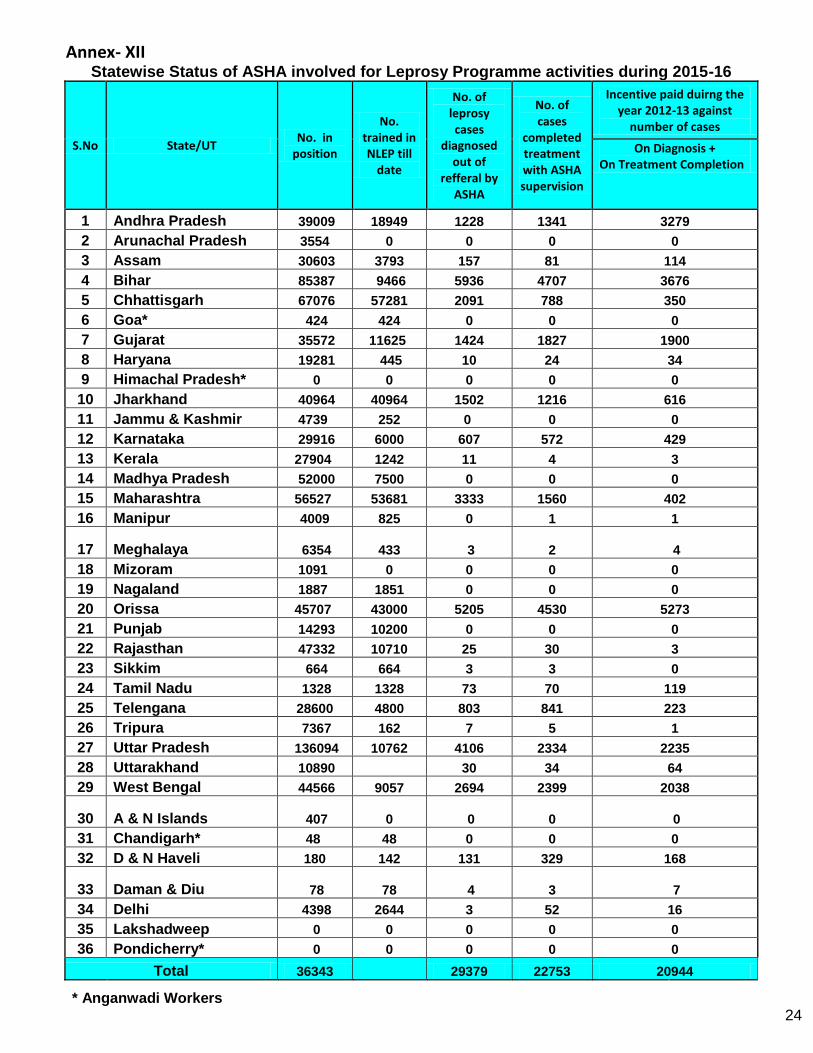
(ii) Training was also conducted by the Central Govt. Leprosy institutes in the year
2014-15. Central Leprosy Training & Research Institute, Chengalpattu ,Tamilnadu
conducted 16 courses for 150 participates. Regional Leprosy Training & Research
institute ,Gouripur, West Bengal has conducted 1 courses for 9 participants,
Regional Leprosy Training & Research institute, Raipur,
Chhattisgarh has conducted 46 course for 646 participants M.O DLC,
physiotherapist and AYUSH MOs details are in (Annexure – XIII).
E. IEC /BCC
The various mode of communication for conducting IEC activities to spread
awareness about leprosy at mass level has been undertaken at center &state
level in the year 2015-16.
(i) State level
As per the report submitted by the states on IEC activities undertaken in their
concerned states in the year 2014-2015 comprising Newspapers advertisement,
posters, Handbills, stickers, Pamphlets, leaflets, press conference/ Briefing/ Press
Release, TV spot , Radio jingles, cinema slides , Talk on TV/Radio , Rath, Rallies
Mela, Haat, NukadNatak/Road show, Magic show .Puppet show , flock
Dance/Songs, Banners/Hoardings, Wall Painting, Exhibition’s , and inter personal
communication (Meeting, conferences, talks, door to door survey , quiz) are
conducted at states lhave actively undertaken IEC activities to spread mass level
Gujarat, Rajasthan, Jharkhand & west Bengal has performed well as they have
undertake all four medium of communication (Print, Electronic, Traditional & other
media). IEC activities was carried out in a campaign mode during the Block Leprosy
Central Campaign (BLCC) and Anti Leprosy Fortnight starting from 30th
January
2015 and ending on 28th
February and 13th
February 2015 respectively. 7
(ii) Central level
The IEC activities undertaken in the 2014-15 at central level are print advertisements on newspaper in Hindi, English and Regional languages which were
released through DAVP on 2nd
October 2014 & 30th
January 2015. Leprosy
awareness drive was conducted by Indian Railway Catering and Tourism
Corporation (IRCTC) through DAVP where message were displayed on flask, menu
card , napkins cups etc. for disseminating awareness message to community.
--x—
8
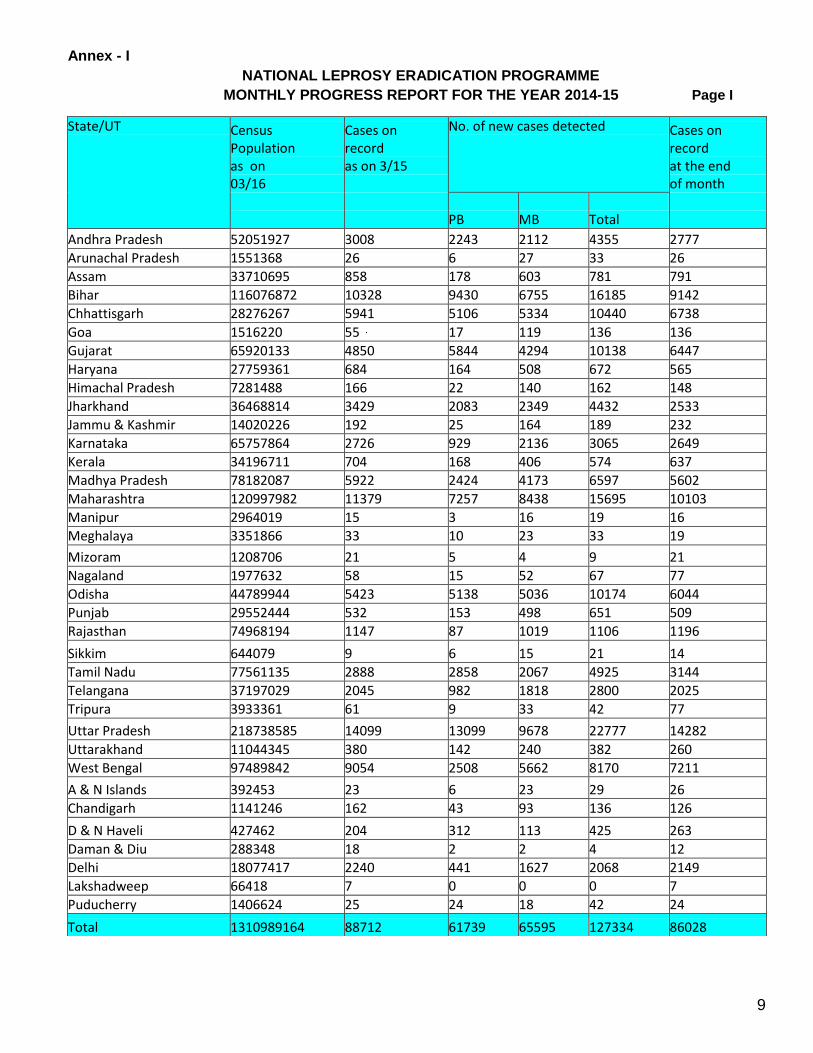
Annex - I NATIONAL LEPROSY ERADICATION PROGRAMME
MONTHLY PROGRESS REPORT FOR THE YEAR 2014-15 Page I
9
State/UT Census Population as on 03/16
Cases on record as on 3/15
No. of new cases detected Cases on record at the end of month PB
MB
Total
Andhra Pradesh 52051927 3008 2243 2112 4355 2777
Arunachal Pradesh 1551368 26 6 27 33 26
Assam 33710695 858 178 603 781 791
Bihar 116076872 10328 9430 6755 16185 9142
Chhattisgarh 28276267 5941 5106 5334 10440 6738
Goa 1516220 55 17 119 136 136
Gujarat 65920133 4850 5844 4294 10138 6447
Haryana 27759361 684 164 508 672 565
Himachal Pradesh 7281488 166 22 140 162 148
Jharkhand 36468814 3429 2083 2349 4432 2533
Jammu & Kashmir 14020226 192 25 164 189 232
Karnataka 65757864 2726 929 2136 3065 2649
Kerala 34196711 704 168 406 574 637
Madhya Pradesh 78182087 5922 2424 4173 6597 5602
Maharashtra 120997982 11379 7257 8438 15695 10103
Manipur 2964019 15 3 16 19 16
Meghalaya 3351866 33 10 23 33 19
Mizoram 1208706 21 5 4 9 21
Nagaland 1977632 58 15 52 67 77
Odisha 44789944 5423 5138 5036 10174 6044
Punjab 29552444 532 153 498 651 509
Rajasthan 74968194 1147 87 1019 1106 1196
Sikkim 644079 9 6 15 21 14
Tamil Nadu 77561135 2888 2858 2067 4925 3144
Telangana 37197029 2045 982 1818 2800 2025
Tripura 3933361 61 9 33 42 77
Uttar Pradesh 218738585 14099 13099 9678 22777 14282
Uttarakhand 11044345 380 142 240 382 260
West Bengal 97489842 9054 2508 5662 8170 7211
A & N Islands 392453 23 6 23 29 26
Chandigarh 1141246 162 43 93 136 126
D & N Haveli 427462 204 312 113 425 263
Daman & Diu 288348 18 2 2 4 12
Delhi 18077417 2240 441 1627 2068 2149
Lakshadweep 66418 7 0 0 0 7
Puducherry 1406624 25 24 18 42 24
Total 1310989164 88712 61739 65595 127334 86028
Page II
State/UT Percentage of New Cases Detected
MB Female
Child
Schedule Tribe Schedule Caste MB PB Total
No. % No. % No % No % Total % No. % No. %
Andhra Pradesh 2112 48.50 1862 42.76 110 2.53 389 8.93 499 11.46 351 8.06 1211 27.81
Arunachal Pradesh 27 81.82 7 21.21 7 0.00 2 6.06 9 27.27 23 69.70 0 0.00
Assam 558 71.45 192 24.58 45 5.76 28 3.59 73 9.35 33 4.23 19 2.43
Bihar 6755 41.74 6503 40.18 696 4.30 1602 9.90 2298 14.20 264 1.63 4148 25.63
Chhattisgarh 5334 51.09 4193 40.16 227 3 471 4.51 698 6.69 2351 22.52 1557 14.91
Goa 119 87.50 40 29.41 6 4.41 5 3.68 11 8.09 0 0.00 0 0.00
Gujarat 4294 42.36 4766 47.01 162 2.00 594 5.86 756 7.46 6479 63.91 274 2.70
Haryana 508 75.60 177 32.00 18 2.68 6 0.89 24 3.57 3 0.45 143 21.28
Himachal Pradesh 140 44.15 50 30.86 2 1.23 2 1.23 4 2.47 4 2.47 19 11.73
Jharkhand 2083 47.00 1723 38.88 145 3.27 263 5.93 408 9.21 1393 31.43 679 15.32
Jammu & Kashmir 164 86.77 28 14.81 8 4.23 2 1.06 10 5.29 13 6.88 2 1.06
Karnataka 2136 69.69 1063 34.68 82 2.68 127 4.14 209 6.82 289 9.43 724 23.62
Kerala 406 70.73 169 29.44 11 1.92 29 5.05 40 6.97 33 5.75 31 5.40
Madhya Pradesh 4173 63.26 2301 34.88 158 2.40 183 2.77 341 5.17 2041 30.94 1029 15.60
Maharashtra 8438 53.76 7048 44.91 481 3.06 1283 8.17 1764 11.24 5165 32.91 2313 14.74
Manipur 16 84.21 4 21.05 0 0.00 1 5.26 1 5.26 2 10.53 0 0.00
Meghalaya 23 69.70 10 30.30 1 3.03 2 6.06 3 9.09 10 30.30 1 3.03
Mizoram 4 44.44 0 0.00 0 0.00 2 22.22 2 22.22 0 0.00 0 0.00
Nagaland 52 77.61 16 23.88 5 0.00 2 2.99 7 10.45 41 61.19 33 49.3
Odisha 5036 49.50 4235 41.63 243 2.39 609 5.99 852 8.37 2941 28.91 2035 20.00
Punjab 498 76.50 97 14.90 98 15.05 43 6.61 141 21.66 0 0.00 21 3.23
Rajasthan 1019 92.13 282 25.50 22 1.99 4 0.36 26 2.35 134 12.12 199 17.99
Sikkim 15 71.43 5 23.81 0 0.00 0 0.00 0 0.00 6 28.57 3 2.00
Tamil Nadu 2067 41.97 1905 38.68 74 1.50 707 14.36 781 15.86 152 3.09 931 18.90
Telangana 1818 64.93 1101 39.32 88 3.14 102 3.64 190 6.79 404 14.43 686 24.50
Tripura 33 78.57 10 23.81 1 2.38 1 2.38 2 4.76 14 33.33 6 14.29
Uttar Pradesh 9678 42.49 7423 32.59 449 1.97 929 4.08 1378 6.05 84 0.37 5700 25.03
Uttarakhand 240 62.83 122 31.94 7 1.83 14 3.66 21 5.50 20 5.24 62 16.23
West Bengal 5662 69.30 2613 31.98 287 3.51 327 4.00 614 7.52 1255 15.36 1810 22.2
A & N Islands 23 79.3 7 24.14 2 6.90 1 3.45 3 10.34 0 0.00 0 0.00
Chandigarh 93 68.38 47 34.56 3 2.21 4 2.94 7 5.15 0 0.00 0 0.00
D & N Haveli 113 26.59 246 57.88 8 1.88 91 21.41 99 23.29 424 99.76 0 0.00
Daman & Diu 2 50.00 0 0.00 1 0.00 0 0.00 1 0.00 0 0.00 0 0.00
Delhi 1627 78.68 542 26.21 73 3.53 38 1.84 111 5.37 0 0.00 0 0.00
Lakshadweep 0 0.00 0 0.00 0 0.00 0 0.00 0 0.00 0 0.00 0 0.00
Puducherry 18 42.86 21 50.00 3 7.14 3 7.14 6 14.29 0 0.00 6 14.3
Total 65284 51.27 48808 38.33 3523 2.77 7866 6.18 11389 8.94 23929 18.79 23642 18.57
Page III
11
State/UT % of New Cases Reconstructive Surgery Cases deleted
Deformity Recognised RCS Instt. RCS performed
RFT
Other-wise
deletion Total
Grade - I Grade-II
Govt NGO Govt NGO Total No. % No. %
Andhra Pradesh 115 2.64 289 6.64 1 9 0 318 318 4489 101 4590
Arunachal Pradesh 22 66.67 2 6.06 0 0 0 0 0 27 6 33
Assam 84 10.76 80 10.24 1 1 14 23 37 781 67 848
Bihar 373 2.30 583 3.60 2 2 16 149 165 16025 1346 17371
Chhattisgarh 482 4.80 756 7.24 1 1 97 30 101 9221 422 9643
Goa 0 0.00 0 0.00 0 0 2 0 2 56 3 59
Gujarat 433 4.27 275 2.71 3 0 127 0 127 8403 138 8541
Haryana 73 10.86 23 3.42 1 0 0 11 11 736 23 759
Himachal Pradesh 79 48.77 21 12.96 0 0 0 0 0 147 29 176
Jharkhand 129 2.91 102 2.30 2 3 3 99 102 5076 252 5328
Jammu & Kashmir 6 3.17 10 5.29 0 1 0 0 0 143 0 143
Karnataka 182 5.94 104 3.39 4 7 38 90 128 3039 287 3326
Kerala 54 9.41 42 7.32 0 3 0 26 24 577 64 641
Madhya Pradesh 1016 15.40 483 7.32 2 1 103 92 243 6616 243 6859
Maharashtra 793 5.05 397 2.53 9 8 12 293 305 16315 467 16782
Manipur 1 5.26 1 5.26 1 0 3 0 3 15 3 18
Meghalaya 5 15.15 10 30.30 0 1 4 9 13 27 10 37
Mizoram 0 0.00 0 0.00 0 0 0 0 0 1 0 1
Nagaland 11 16.42 13 19.40 0 0 0 0 0 34 26 60
Odisha 563 5.53 593 5.83 8 0 309 29 338 9333 220 9553
Punjab 10 1.54 4 0.61 0 0 0 0 17 328 38 366
Rajasthan 101 9.13 67 6.06 0 0 23 0 23 832 225 1057
Sikkim 2 1.00 2 9.52 1 0 0 0 0 11 5 16
Tamil Nadu 214 4.35 219 4.45 2 8 3 96 99 4228 441 4669
Telangana 131 18.00 189 6.75 1 1 0 117 117 2798 26 2824
Tripura 0 0.00 10 23.81 1 0 6 0 6 24 2 26
Uttar Pradesh 670 2.94 887 3.89 3 3 54 480 534 20883 1819 22702
Uttarakhand 9 2.36 5 1.31 1 0 17 0 17 328 173 501
West Bengal 374 4.58 377 4.61 9 2 72 200 272 8637 1345 9982
A & N Islands 4 13.79 3 10.34 0 0 16 0 16 26 1 27
Chandigarh 2 1.47 3 2.21 0 0 1 4 5 171 1 172
D & N Haveli 6 1.41 8 1.88 0 0 5 0 5 361 4 365
Daman & Diu 0 0.00 0 0.00 0 0 2 0 2 2 7 9
Delhi 232 11.22 290 14.02 3 3 0 107 107 1844 315 2159
Lakshadweep 0 0.00 0 0.00 0 0 0 0 0 0 0 0
Puduchery 4 9.52 3 7.14 2 0 7 0 7 40 2 42
Total 6180 4.85 5851 4.60 58 54 934 2173 3107 121574 8110 129684
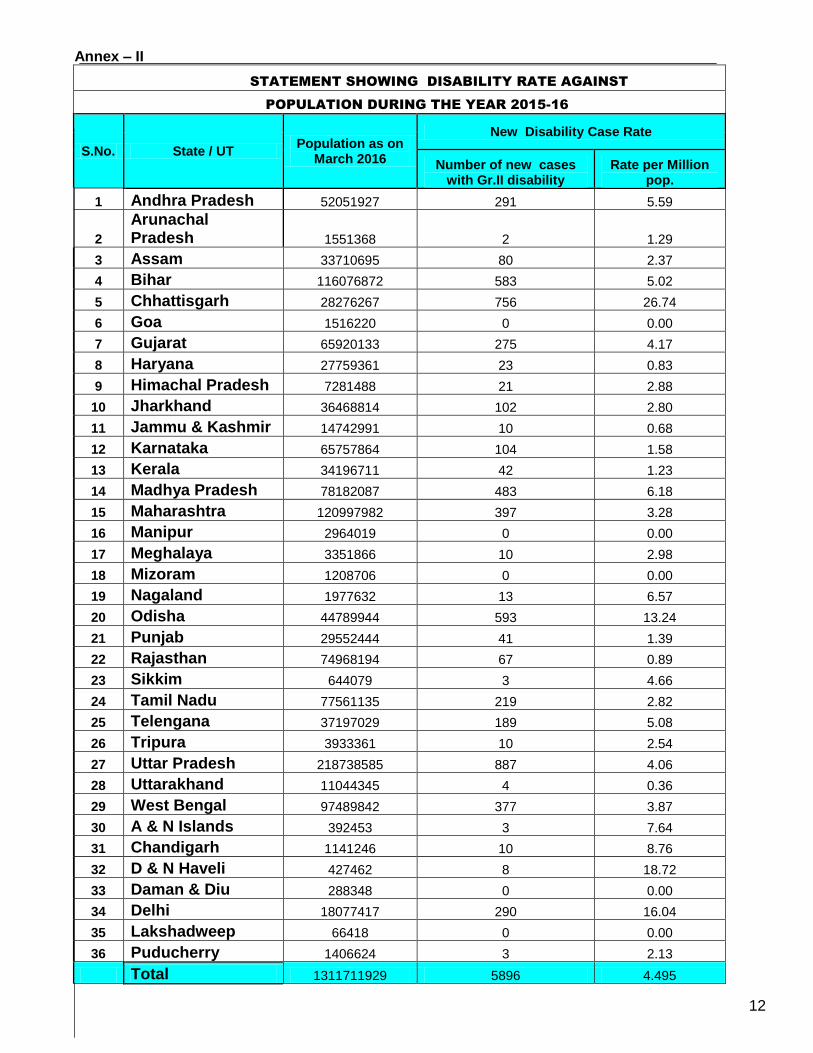
Annex – II
STATEMENT SHOWING DISABILITY RATE AGAINST
POPULATION DURING THE YEAR 2015-16
S.No. State / UT Population as on
March 2016
New Disability Case Rate
Number of new cases with Gr.II disability
Rate per Million pop.
1 Andhra Pradesh 52051927 291 5.59
2
Arunachal Pradesh 1551368 2 1.29
3 Assam 33710695 80 2.37
4 Bihar 116076872 583 5.02
5 Chhattisgarh 28276267 756 26.74
6 Goa 1516220 0 0.00
7 Gujarat 65920133 275 4.17
8 Haryana 27759361 23 0.83
9 Himachal Pradesh 7281488 21 2.88
10 Jharkhand 36468814 102 2.80
11 Jammu & Kashmir 14742991 10 0.68
12 Karnataka 65757864 104 1.58
13 Kerala 34196711 42 1.23
14 Madhya Pradesh 78182087 483 6.18
15 Maharashtra 120997982 397 3.28
16 Manipur 2964019 0 0.00
17 Meghalaya 3351866 10 2.98
18 Mizoram 1208706 0 0.00
19 Nagaland 1977632 13 6.57
20 Odisha 44789944 593 13.24
21 Punjab 29552444 41 1.39
22 Rajasthan 74968194 67 0.89
23 Sikkim 644079 3 4.66
24 Tamil Nadu 77561135 219 2.82
25 Telengana 37197029 189 5.08
26 Tripura 3933361 10 2.54
27 Uttar Pradesh 218738585 887 4.06
28 Uttarakhand 11044345 4 0.36
29 West Bengal 97489842 377 3.87
30 A & N Islands 392453 3 7.64
31 Chandigarh 1141246 10 8.76
32 D & N Haveli 427462 8 18.72
33 Daman & Diu 288348 0 0.00
34 Delhi 18077417 290 16.04
35 Lakshadweep 66418 0 0.00
36 Puducherry 1406624 3 2.13
Total 1311711929 5896 4.495
12
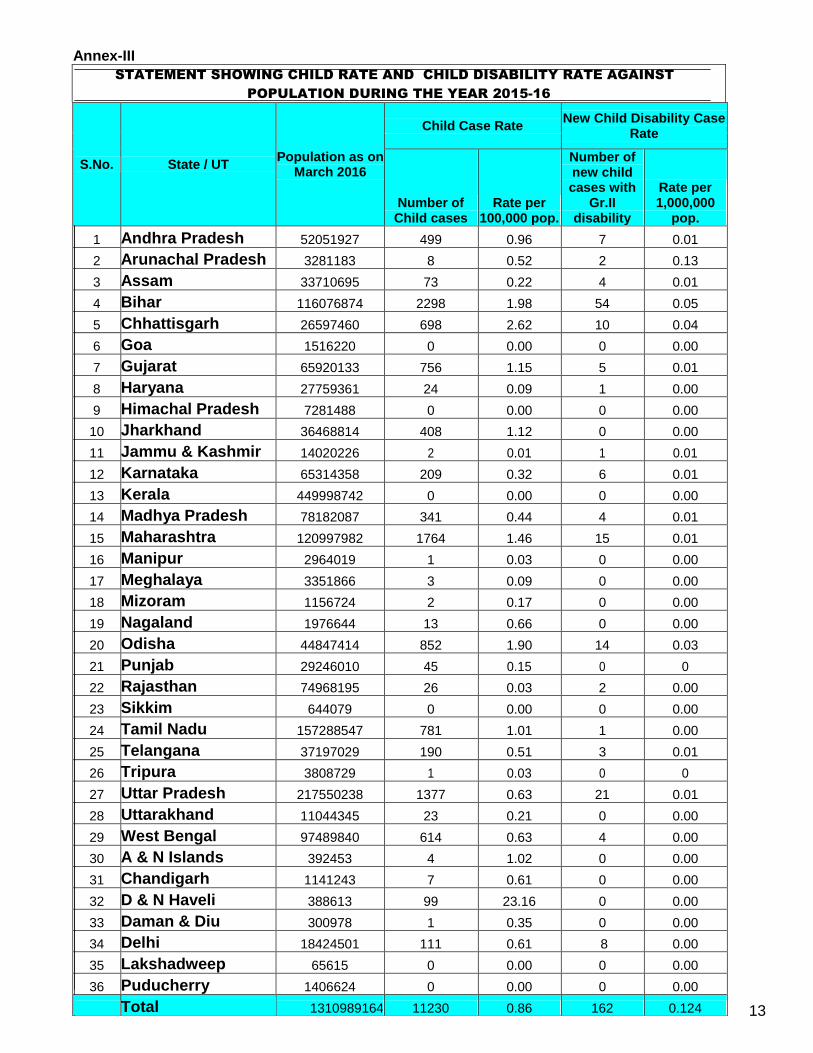
Annex-III
STATEMENT SHOWING CHILD RATE AND CHILD DISABILITY RATE AGAINST
POPULATION DURING THE YEAR 2015-16
A nex – II Annex – II
13
S.No. State / UT Population as on
March 2016
Child Case Rate New Child Disability Case
Rate
Number of Child cases
Rate per 100,000 pop.
Number of new child cases with
Gr.II disability
Rate per 1,000,000
pop.
1 Andhra Pradesh 52051927 499 0.96 7 0.01
2 Arunachal Pradesh 3281183 8 0.52 2 0.13
3 Assam 33710695 73 0.22 4 0.01
4 Bihar 116076874 2298 1.98 54 0.05
5 Chhattisgarh 26597460 698 2.62 10 0.04
6 Goa 1516220 0 0.00 0 0.00
7 Gujarat 65920133 756 1.15 5 0.01
8 Haryana 27759361 24 0.09 1 0.00
9 Himachal Pradesh 7281488 0 0.00 0 0.00
10 Jharkhand 36468814 408 1.12 0 0.00
11 Jammu & Kashmir 14020226 2 0.01 1 0.01
12 Karnataka 65314358 209 0.32 6 0.01
13 Kerala 449998742 0 0.00 0 0.00
14 Madhya Pradesh 78182087 341 0.44 4 0.01
15 Maharashtra 120997982 1764 1.46 15 0.01
16 Manipur 2964019 1 0.03 0 0.00
17 Meghalaya 3351866 3 0.09 0 0.00
18 Mizoram 1156724 2 0.17 0 0.00
19 Nagaland 1976644 13 0.66 0 0.00
20 Odisha 44847414 852 1.90 14 0.03
21 Punjab 29246010 45 0.15 0 0
22 Rajasthan 74968195 26 0.03 2 0.00
23 Sikkim 644079 0 0.00 0 0.00
24 Tamil Nadu 157288547 781 1.01 1 0.00
25 Telangana 37197029 190 0.51 3 0.01
26 Tripura 3808729 1 0.03 0 0
27 Uttar Pradesh 217550238 1377 0.63 21 0.01
28 Uttarakhand 11044345 23 0.21 0 0.00
29 West Bengal 97489840 614 0.63 4 0.00
30 A & N Islands 392453 4 1.02 0 0.00
31 Chandigarh 1141243 7 0.61 0 0.00
32 D & N Haveli 388613 99 23.16 0 0.00
33 Daman & Diu 300978 1 0.35 0 0.00
34 Delhi 18424501 111 0.61 8 0.00
35 Lakshadweep 65615 0 0.00 0 0.00
36 Puducherry 1406624 0 0.00 0 0.00
Total 1310989164 11230 0.86 162 0.124
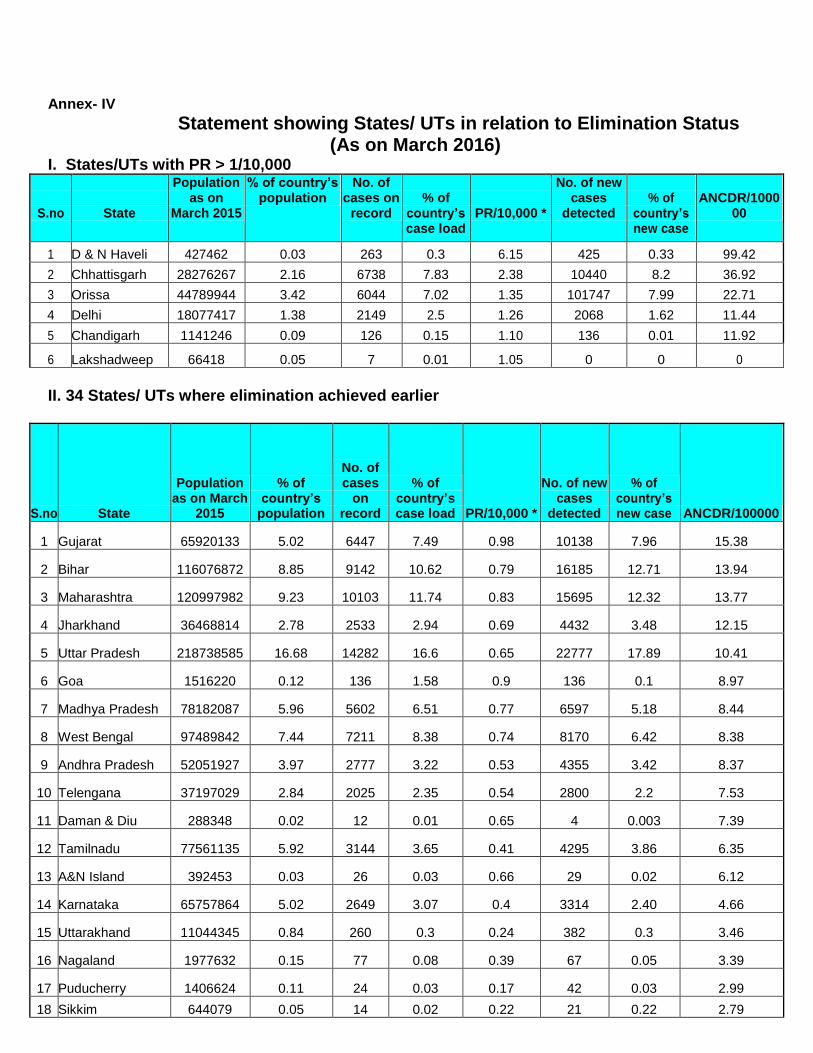
Annex- IV
Statement showing States/ UTs in relation to Elimination Status (As on March 2016)
I. States/UTs with PR > 1/10,000
S.no
State
Population as on
March 2015
% of country’s population
No. of cases on
record
% of
country’s case load
PR/10,000 *
No. of new cases
detected
% of
country’s new case
ANCDR/1000
00
1 D & N Haveli 427462 0.03 263 0.3 6.15 425 0.33 99.42
2 Chhattisgarh 28276267 2.16 6738 7.83 2.38 10440 8.2 36.92
3 Orissa 44789944 3.42 6044 7.02 1.35 101747 7.99 22.71
4 Delhi 18077417 1.38 2149 2.5 1.26 2068 1.62 11.44
5 Chandigarh 1141246 0.09 126 0.15 1.10 136 0.01 11.92
6 Lakshadweep 66418 0.05 7 0.01 1.05 0 0 0
II. 34 States/ UTs where elimination achieved earlier
S.no State
Population as on March
2015
% of country’s
population
No. of cases
on record
% of country’s case load PR/10,000 *
No. of new cases
detected
% of country’s new case ANCDR/100000
1 Gujarat 65920133 5.02 6447 7.49 0.98 10138 7.96 15.38
2 Bihar 116076872 8.85 9142 10.62 0.79 16185 12.71 13.94
3 Maharashtra 120997982 9.23 10103 11.74 0.83 15695 12.32 13.77
4 Jharkhand 36468814 2.78 2533 2.94 0.69 4432 3.48 12.15
5 Uttar Pradesh 218738585 16.68 14282 16.6 0.65 22777 17.89 10.41
6 Goa 1516220 0.12 136 1.58 0.9 136 0.1 8.97
7 Madhya Pradesh 78182087 5.96 5602 6.51 0.77 6597 5.18 8.44
8 West Bengal 97489842 7.44 7211 8.38 0.74 8170 6.42 8.38
9 Andhra Pradesh 52051927 3.97 2777 3.22 0.53 4355 3.42 8.37
10 Telengana 37197029 2.84 2025 2.35 0.54 2800 2.2 7.53
11 Daman & Diu 288348 0.02 12 0.01 0.65 4 0.003 7.39
12 Tamilnadu 77561135 5.92 3144 3.65 0.41 4295 3.86 6.35
13 A&N Island 392453 0.03 26 0.03 0.66 29 0.02 6.12
14 Karnataka 65757864 5.02 2649 3.07 0.4 3314 2.40 4.66
15 Uttarakhand 11044345 0.84 260 0.3 0.24 382 0.3 3.46
16 Nagaland 1977632 0.15 77 0.08 0.39 67 0.05 3.39
17 Puducherry 1406624 0.11 24 0.03 0.17 42 0.03 2.99
18 Sikkim 644079 0.05 14 0.02 0.22 21 0.22 2.79
19 Haryana 27759361 2.12 565 0.66 0.20 672 0.53 2.42
20 Assam 33710695 2.57 791 0.92 0.23 781 0.61 2.32
21 Himachal Pradesh 7281488 0.56 148 0.17 0.2 176 0.13 2.22
22 Punjab 29552444 2.25 509 0.59 0.17 651 0.51 2.20
23 Arunachal Pradesh 1551368 0.11 26 0.03 0.17 33 0.02 2.13
24 Kerala 34196711 2.59 637 0.74 0.19 574 0.45 1.68
25 Jammu and Kashmir 14020226 1.06 232 0.26 0.17 189 0.14 1.35
26 Tripura 3933361 0.3 77 0.09 0.20 42 0.03 1.07
27 Meghalaya 3351866 0.25 19 0.02 0.10 33 0.02 0.98
28 Manipur 2964019 0.22 16 0.02 0.05 19 0.01 0.64
29 Mizoram 1208706 0.09 21 0.02 0.17 9 0.07 0.17
30 Rajasthan 74968194 5.67 1196 1.39 0.16 1106 0.86 0.16
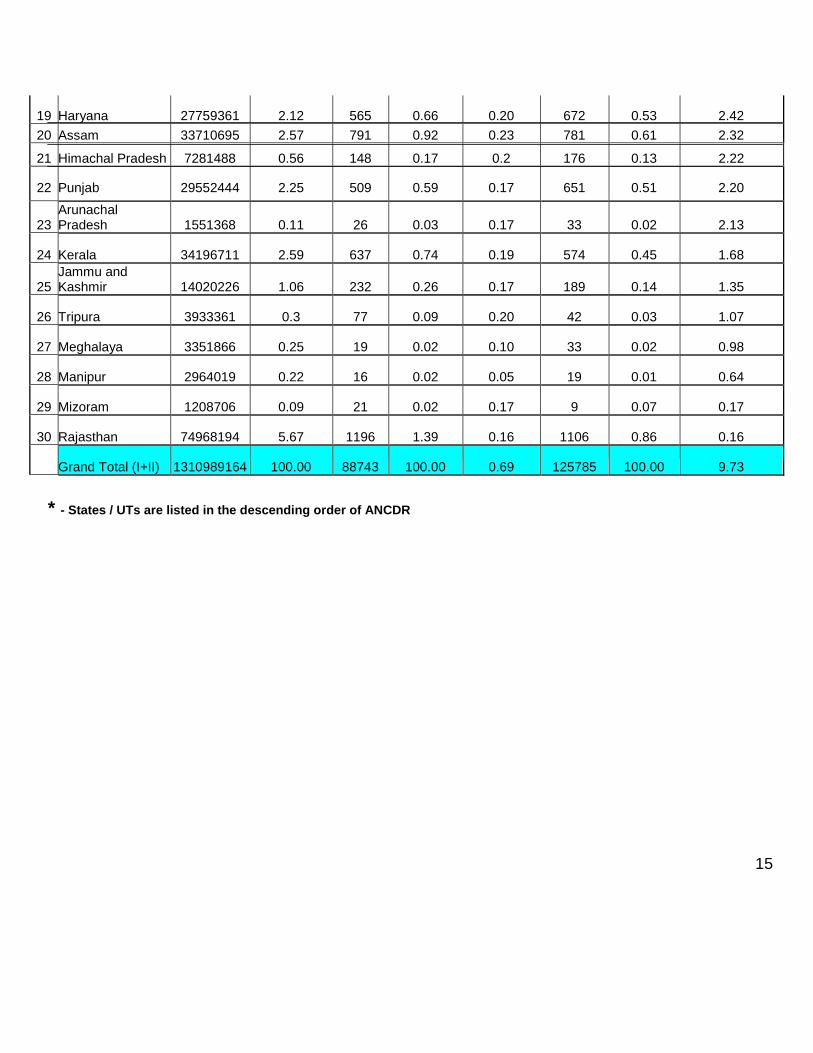
Grand Total (I+II) 1310989164 100.00 88743 100.00 0.69 125785 100.00 9.73
* - States / UTs are listed in the descending order of ANCDR
15
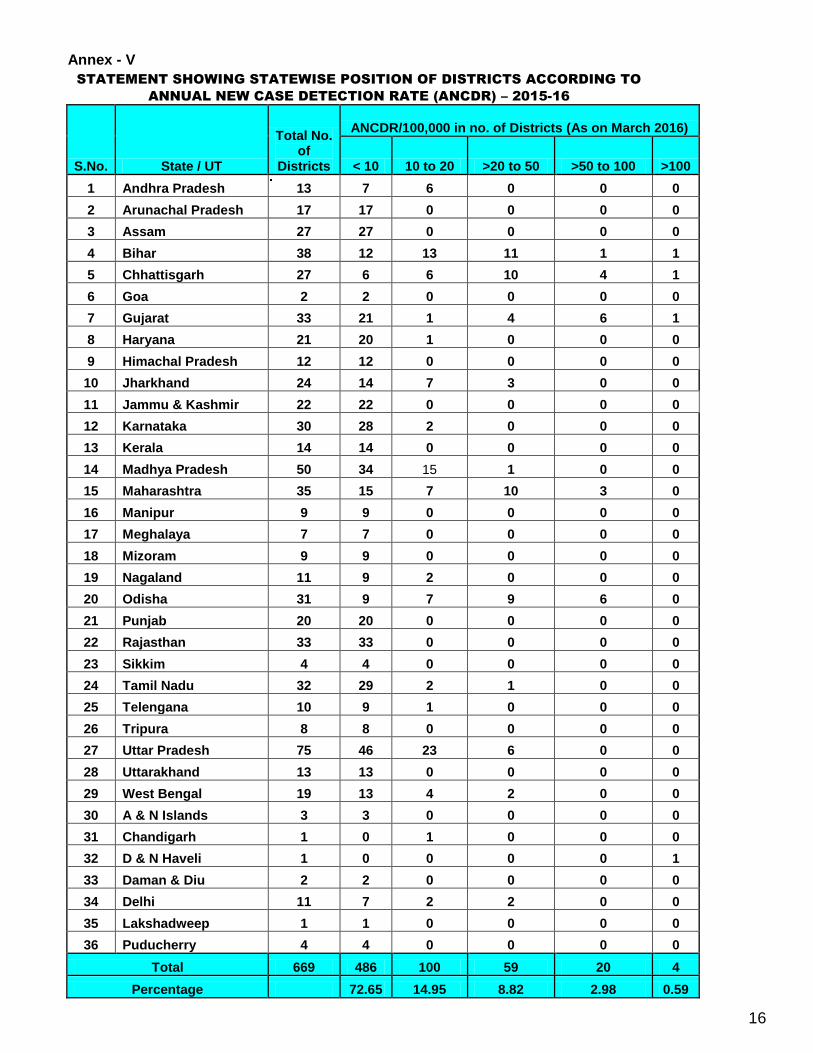
Annex - V STATEMENT SHOWING STATEWISE POSITION OF DISTRICTS ACCORDING TO
ANNUAL NEW CASE DETECTION RATE (ANCDR) – 2015-16
S.No. State / UT
Total No. of
Districts
ANCDR/100,000 in no. of Districts (As on March 2016)
< 10 10 to 20 >20 to 50 >50 to 100 >100
1 Andhra Pradesh 13 7 6 0 0 0
2 Arunachal Pradesh 17 17 0 0 0 0
3 Assam 27 27 0 0 0 0
4 Bihar 38 12 13 11 1 1
5 Chhattisgarh 27 6 6 10 4 1
6 Goa 2 2 0 0 0 0
7 Gujarat 33 21 1 4 6 1
8 Haryana 21 20 1 0 0 0
9 Himachal Pradesh 12 12 0 0 0 0
10 Jharkhand 24 14 7 3 0 0
11 Jammu & Kashmir 22 22 0 0 0 0
12 Karnataka 30 28 2 0 0 0
13 Kerala 14 14 0 0 0 0
14 Madhya Pradesh 50 34 15 1 0 0
15 Maharashtra 35 15 7 10 3 0
16 Manipur 9 9 0 0 0 0
17 Meghalaya 7 7 0 0 0 0
18 Mizoram 9 9 0 0 0 0
19 Nagaland 11 9 2 0 0 0
20 Odisha 31 9 7 9 6 0
21 Punjab 20 20 0 0 0 0
22 Rajasthan 33 33 0 0 0 0
23 Sikkim 4 4 0 0 0 0
24 Tamil Nadu 32 29 2 1 0 0
25 Telengana 10 9 1 0 0 0
26 Tripura 8 8 0 0 0 0
27 Uttar Pradesh 75 46 23 6 0 0
28 Uttarakhand 13 13 0 0 0 0
29 West Bengal 19 13 4 2 0 0
30 A & N Islands 3 3 0 0 0 0
31 Chandigarh 1 0 1 0 0 0
32 D & N Haveli 1 0 0 0 0 1
33 Daman & Diu 2 2 0 0 0 0
34 Delhi 11 7 2 2 0 0
35 Lakshadweep 1 1 0 0 0 0
36 Puducherry 4 4 0 0 0 0
Total 669 486 100 59 20 4
Percentage 72.65 14.95 8.82 2.98 0.59
16
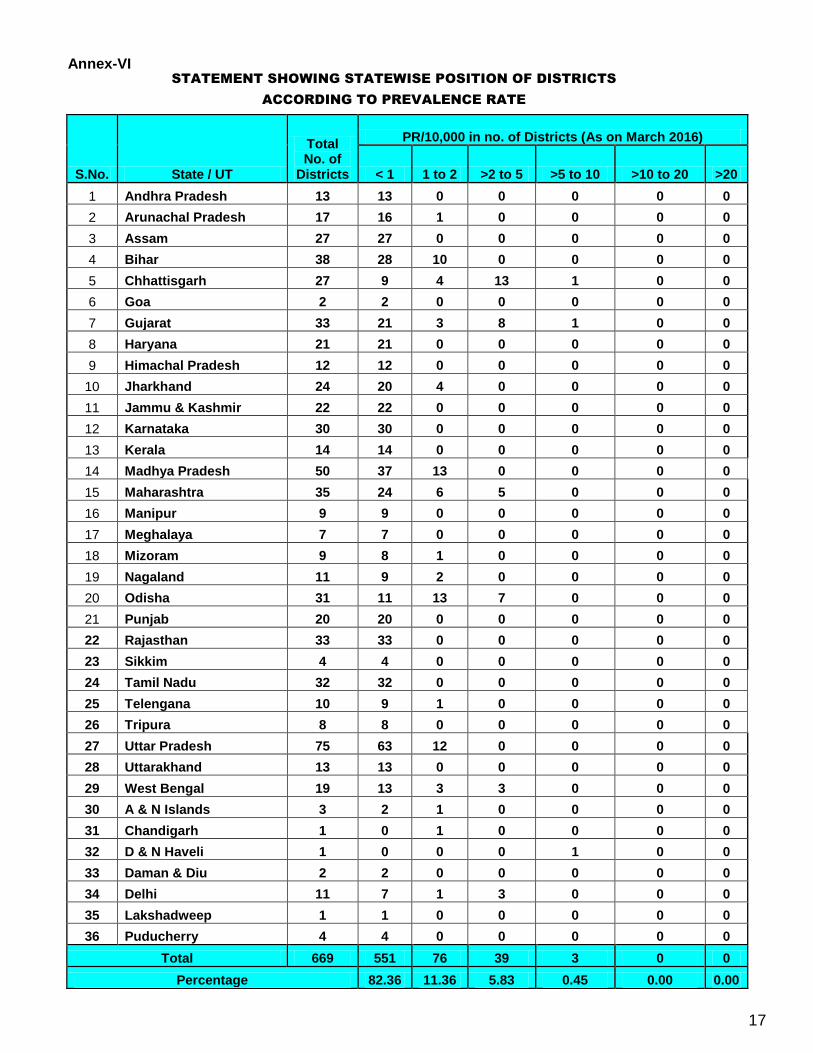
Annex-VI STATEMENT SHOWING STATEWISE POSITION OF DISTRICTS
ACCORDING TO PREVALENCE RATE
S.No. State / UT
Total No. of
Districts
PR/10,000 in no. of Districts (As on March 2016)
< 1 1 to 2 >2 to 5 >5 to 10 >10 to 20 >20
1 Andhra Pradesh 13 13 0 0 0 0 0
2 Arunachal Pradesh 17 16 1 0 0 0 0
3 Assam 27 27 0 0 0 0 0
4 Bihar 38 28 10 0 0 0 0
5 Chhattisgarh 27 9 4 13 1 0 0
6 Goa 2 2 0 0 0 0 0
7 Gujarat 33 21 3 8 1 0 0
8 Haryana 21 21 0 0 0 0 0
9 Himachal Pradesh 12 12 0 0 0 0 0
10 Jharkhand 24 20 4 0 0 0 0
11 Jammu & Kashmir 22 22 0 0 0 0 0
12 Karnataka 30 30 0 0 0 0 0
13 Kerala 14 14 0 0 0 0 0
14 Madhya Pradesh 50 37 13 0 0 0 0
15 Maharashtra 35 24 6 5 0 0 0
16 Manipur 9 9 0 0 0 0 0
17 Meghalaya 7 7 0 0 0 0 0
18 Mizoram 9 8 1 0 0 0 0
19 Nagaland 11 9 2 0 0 0 0
20 Odisha 31 11 13 7 0 0 0
21 Punjab 20 20 0 0 0 0 0
22 Rajasthan 33 33 0 0 0 0 0
23 Sikkim 4 4 0 0 0 0 0
24 Tamil Nadu 32 32 0 0 0 0 0
25 Telengana 10 9 1 0 0 0 0
26 Tripura 8 8 0 0 0 0 0
27 Uttar Pradesh 75 63 12 0 0 0 0
28 Uttarakhand 13 13 0 0 0 0 0
29 West Bengal 19 13 3 3 0 0 0
30 A & N Islands 3 2 1 0 0 0 0
31 Chandigarh 1 0 1 0 0 0 0
32 D & N Haveli 1 0 0 0 1 0 0
33 Daman & Diu 2 2 0 0 0 0 0
34 Delhi 11 7 1 3 0 0 0
35 Lakshadweep 1 1 0 0 0 0 0
36 Puducherry 4 4 0 0 0 0 0
Total 669 551 76 39 3 0 0
Percentage 82.36 11.36 5.83 0.45 0.00 0.00
17
Annex-VII
STATEMENT SHOWING STATEWISE POSITION OF DISTRICTS
According to Gr.II Disability - 2015-16
S.No. State / UT
Total No. of
Districts
Gr II disability rate per million population in number of districts
( March-2016 ) Gr.-II
disability rate per million
for the state < 1 1 to 2 > 2
1 Andhra Pradesh 13 0 1 12 5.59
2 Arunachal Pradesh 17 15 2 0 1.29
3 Assam 27 12 7 8 2.37
4 Bihar 38 3 3 32 5.02
5 Chhattisgarh 27 3 0 24 28.42
6 Goa 2 2 0 0 0.00
7 Gujarat 33 15 3 15 4.17
8 Haryana 21 21 0 0 0.83
9 Himachal Pradesh 12 3 1 8 4.59
10 Jharkhand 24 10 5 9 2.80
11 Jammu & Kashmir 22 11 2 9 0.68
12 Karnataka 30 14 9 7 1.59
13 Kerala 14 5 2 7 1.37
14 Madhya Pradesh 50 3 3 44 7.32
15 Maharashtra 35 7 9 19 3.28
16 Manipur 9 9 0 0 0.00
17 Meghalaya 7 3 0 4 2.98
18 Mizoram 9 9 0 0 0.00
19 Nagaland 11 9 0 2 6.56
20 Odisha 31 2 0 29 13.22
21 Punjab 20 11 4 5 1.40
22 Rajasthan 33 26 3 4 0.89
23 Sikkim 4 2 0 2 4.66
24 Tamil Nadu 32 10 5 17 1.39
25 Telengana 10 0 1 9 5.08
26 Tripura 8 3 0 5 2.63
27 Uttar Pradesh 75 14 12 49 4.06
28 Uttarakhand 13 12 1 0 0.36
29 West Bengal 19 3 5 11 3.87
30 A & N Islands 3 2 0 1 7.64
31 Chandigarh 1 0 0 1 8.76
32 D & N Haveli 1 0 0 1 20.59
33 Daman & Diu 2 2 0 0 0.00
34 Delhi 11 9 1 1 15.74
35 Lakshadweep 1 1 0 0 0.00
36 Puducherry 4 3 0 1 2.13
Total 669 251 78 328
Percentage 37.52 11.66 49.03
18
Annex-VIII
Statement showing new cases Released from Treatment (RFT) as cured
Period - April '15 to March '16'
S.No. State/ UT Cases Deleted Percentage of case
released as cured * RFT Otherwise Total
1 Andhra Pradesh 4489 101 4590 97.80
2 Arunachal Pradesh 27 6 33 81.82
3 Assam 781 67 848 92.10
4 Bihar 16025 1346 17371 92.25
5 Chhattisgarh 9221 422 9643 95.62
6 Goa 56 3 59 94.92
7 Gujarat 8403 138 8541 98.38
8 Haryana 736 55 791 93.05
9 Himachal Pradesh 147 29 176 83.52
10 Jharkhand 5076 252 5328 95.27
11 Jammu & Kashmir 110 0 110 100.00
12 Karnataka 3039 287 3326 91.37
13 Kerala 577 64 641 90.02
14 Madhya Pradesh 6616 243 6859 96.46
15 Maharashtra 16315 467 16782 97.22
16 Manipur 15 3 18 83.33
17 Meghalaya 27 10 37 72.97
18 Mizoram 1 0 1 100.00
19 Nagaland 34 26 60 56.67
20 Orissa 9333 220 9553 97.70
21 Punjab 328 38 366 89.62
22 Rajasthan 832 225 1057 78.71
23 Sikkim 11 5 16 68.75
24 Tamil Nadu 4228 441 4669 90.55
25 Telengana 2798 26 2824 99.08
26 Tripura 24 2 26 92.31
27 Uttar Pradesh 20883 1819 22702 91.99
28 Uttarakhand 328 173 501 65.47
29 West Bengal 8637 1345 9982 86.53
30 A & N Islands 28 1 29 96.55
31 Chandigarh 171 1 171 100.00
32 D & N Haveli 361 4 365 98.90
33 Daman & Diu 2 7 9 22.22
34 Delhi 1844 315 2159 85.41
35 Lakshadweep 0 0 0 0.00
36 Puducherry 40 2 42 95.24
Total 121543 8143 129686 93.72
* Cured are patients that completed full MDT course in stipulated time. 19
Annex-IX
Statement showing other cases Released from Treatment (RFT) as cured Period - April '15 to March '16'
Sl.No. State/ UT Cases Deleted Percentage of case
released as cured * RFT Otherwise Total
1 Andhra Pradesh 130 9 139 93.53
2 Arunachal Pradesh 2 0 2 0.00
3 Assam 99 76 175 56.57
4 Bihar 843 126 969 87.00
5 Chhattisgarh 292 64 356 82.02
6 Goa 42 5 47 89.36
7 Gujarat 65 21 86 75.58
8 Haryana 22 4 26 84.62
9 Himachal Pradesh 16 1 17 94.12
10 Jharkhand 302 54 356 84.83
11 Jammu & Kashmir 1 0 1 100.00
12 Karnataka 129 50 179 72.07
13 Kerala 64 17 81 79.01
14 Madhya Pradesh 118 15 133 88.72
15 Maharashtra 874 80 954 91.61
16 Manipur 15 3 18 83.33
17 Meghalaya 11 2 13 84.62
18 Mizoram 0 0 0 0.00
19 Nagaland 4 5 9 44.44
20 Orissa 354 22 376 94.15
21 Punjab 0 0 0 0.00
22 Rajasthan 41 17 58 70.69
23 Sikkim 1 1 2 50.00
24 Tamil Nadu 282 45 327 86.24
25 Telengana 31 0 31 100.00
26 Tripura 6 0 6 100.00
27 Uttar Pradesh 1415 524 1939 72.98
28 Uttarakhand 117 79 196 59.69
29 West Bengal 1235 505 1740 70.98
30 A & N Islands 3 0 3 100.00
31 Chandigarh 118 12 130 90.77
32 D & N Haveli 85 32 117 72.65
33 Daman & Diu 0 0 0 0.00
34 Delhi 325 51 376 86.44
35 Lakshadweep 0 0 0 0.00
36 Pondicherry 3 0 3 100.00
Total 7045 1820 8865 79.47
* Cured are patients that completed full MDT course in stipulated time. 20
Annex- X
Table showing Training activities conducted by the states 2015-16
S.No.
States
MO HS HW
Lab NMS PMW
ASHA/ Tech AWW
1 Andhra Pradesh 734 741 3339 129 154 78 10672
2 Arunachal Pradesh - - - - - - - -
3 Assam 440 5 193 0 27 11 3793
4 Bihar 31 20 0 0 0 0 69234
5 Chhattisgarh - - - - - - - -
6 Goa 14 27 28 - - - - 424
7 Gujarat 1363 960 6331 - 36 62 66 18361
8 Haryana 187 40 - - - - 18 445
9 Himachal Pradesh - - - - -- - -
10 Jharkhand 233 9 187 - - - - 1472
11 Jammu & Kashmir 122 120 0 0 0 0 252
12 Karnataka 900 900 - 0 - - 6000
13 Kerala 221 182 704 - 0 55 0 1998
14 Madhya Pradesh 15 - - - 15 15 26 7000
15 Maharashtra 43 264 - - 0 0 3650
16 Manipur - 135 - - - - - 825
17 Meghalaya 87 41 70 - - - - 1595
18 Mizoram 0 0 0 0 0 0 0
19 Nagaland 1 - - - - - 1851
20 Odisha 0 0 0 0 0 140 -
21 Punjab 22 10 0 0 0 0 10200
22 Rajasthan 1807 316 2985 125 16 0 4238
23 Sikkim 68 36 270 0 0 0 664
24 Tamil Nadu 1975 2976 0 0 0 0
25 Telangana 360 280 - - - - 4800
26 Tripura - - - - - - -
27 Uttar Pradesh - - - 0 0 0 10762
28 Uttarakhand 0 0 0 0 40 0 0
29 West Bengal 507 473 2172 0 0 18 9057
30 A & N Island 0 28 0 0 0 0 0
31 Chandigarh 22 0 0 0 0 0 48
32 D & N Haveli 12 23 157 0 0 9 230
33 Daman & Diu 25 55 0 - - - 78
34 Delhi 0 0 - - - - 0
35 Lakshadweep 0 0 0 0 0 0 30
36 Puducherry 40 - - - - - -
Total 9189 4665 16436 305 399 366 167649
Annex- XI STATEMENT SHOWING STATEWISE POSITION OF DPMR SERVICES
during the year 2015-16
S. No. State / UT
Instts. Recognized
for RCS RCS
Performed Cases
of Reactio
n
/Neuritis recorde
d
Relapse cases cases develo
ped new
disability
after MDT
Cases provided with
Govt. NGO Govt. NGO
Suspected
at PHC
Confirmed
at DH Footwear
Self care kit
Self care kit
Self care kit
1 Andhra Pradesh 0 6 0 318 312 33 33 13 6511 6123
2 Arunachal Pradesh 0 0 0 0 4 0 0 0 0 30
3 Assam 1 1 14 23 85 0 0 1 100 114
4 Bihar 2 2 16 149 723 3 29 80 5216 2121
5 Chhattisgarh 1 2 97 30 1682 24 35 8 598 545
6 Goa 0 0 0 0 27 0 0 0 60 41
7 Gujarat 3 0 127 0 689 0 0 0 10351 2095
8 Haryana 1 0 0 11 30 0 5 0 924 642
9 Himachal Pradesh 0 0 0 0 9 0 0 1 8 0
10 Jharkhand 2 4 3 99 412 0 0 1 1424 556
11 Jammu & Kashmir 0 0 0 0 0 0 0 0 50 0
12 Karnataka 4 7 38 90 254 17 30 9 4344 2018
13 Kerala 0 1 0 26 87 10 18 0 677 230
14 Madhya Pradesh 2 1 103 195 721 1 0 4 3845 2288
15 Maharashtra 9 8 293 12 1294 12 11 192 4263 1057
16 Manipur 1 0 3 0 1 0 1 0 12 43
17 Meghalaya 0 1 4 9 7 0 0 0 72 0
18 Mizoram 0 0 0 0 0 0 0 0 0 0
19 Nagaland 0 0 0 0 0 0 0 0 0 0
20 Orissa 8 1 309 29 2202 6 8 5 4761 6822
21 Punjab 0 0 0 0 1 0 0 0 48 0
22 Rajasthan 1 0 23 0 79 1 18 6 825 1093
23 Sikkim 1 0 0 0 7 0 2 0 2 0
24 Tamil Nadu 2 8 2 96 317 28 30 13 8772 11808
25 Telengana 1 1 0 117 152 0 12 0 2190 348
26 Tripura 1 0 6 0 0 0 1 1 1 0
27 Uttar Pradesh 3 3 54 480 1978 46 28 23 5822 3502
28 Uttarakhand 1 0 17 0 37 0 0 1 739 2723
29 West Bengal 9 2 72 200 1703 44 14 8 5358 20472
30 A & N Islands 0 0 0 0 0 0 0 0 49 0
31 Chandigarh 1 1 5 0 74 0 0 0 34 31
32 D & N Haveli 1 0 5 0 25 0 0 0 98 4
33 Daman & Diu 0 0 2 0 0 0 0 0 0 0
34 Delhi 1 2 0 107 185 0 0 0 413 64
35 Lakshadweep 0 0 0 0 0 0 0 0 0 0
36 Pondicherry 0 0 0 0 3 1 1 0 88 150
Total 56 51 1193 1991 13100 226 276 366 67655 64920
Total of Govt.+NGO 107 2883
23
Annex- XII
24
Statewise Status of ASHA involved for Leprosy Programme activities during 2015-16
S.No State/UT No. in
position
No. trained in NLEP till
date
No. of leprosy cases
diagnosed out of
refferal by ASHA
No. of cases
completed treatment with ASHA supervision
Incentive paid duirng the year 2012-13 against
number of cases
On Diagnosis + On Treatment Completion
1 Andhra Pradesh 39009 18949 1228 1341 3279
2 Arunachal Pradesh 3554 0 0 0 0
3 Assam 30603 3793 157 81 114
4 Bihar 85387 9466 5936 4707 3676
5 Chhattisgarh 67076 57281 2091 788 350
6 Goa* 424 424 0 0 0
7 Gujarat 35572 11625 1424 1827 1900
8 Haryana 19281 445 10 24 34
9 Himachal Pradesh* 0 0 0 0 0
10 Jharkhand 40964 40964 1502 1216 616
11 Jammu & Kashmir 4739 252 0 0 0
12 Karnataka 29916 6000 607 572 429
13 Kerala 27904 1242 11 4 3
14 Madhya Pradesh 52000 7500 0 0 0
15 Maharashtra 56527 53681 3333 1560 402
16 Manipur 4009 825 0 1 1
17 Meghalaya 6354 433 3 2
4
18 Mizoram 1091 0 0 0 0
19 Nagaland 1887 1851 0 0 0
20 Orissa 45707 43000 5205 4530 5273
21 Punjab 14293 10200 0 0 0
22 Rajasthan 47332 10710 25 30 3
23 Sikkim 664 664 3 3 0
24 Tamil Nadu 1328 1328 73 70 119
25 Telengana 28600 4800 803 841 223
26 Tripura 7367 162 7 5 1
27 Uttar Pradesh 136094 10762 4106 2334 2235
28 Uttarakhand 10890 30 34 64
29 West Bengal 44566 9057 2694 2399 2038
30 A & N Islands 407 0 0 0
0
31 Chandigarh* 48 48 0 0 0
32 D & N Haveli 180 142 131 329 168
33 Daman & Diu 78 78 4 3
7
34 Delhi 4398 2644 3 52 16
35 Lakshadweep 0 0 0 0 0
36 Pondicherry* 0 0 0 0 0
Total 36343
29379 22753 20944
* Anganwadi Workers
Annex - XIII National Leprosy Eradication programme
Progress Report 2014-15
Leprosy Training & Research Institutes
Regional Leprosy Training & Research Institute, Raipur, Chhattisgarh
Central Leprosy Training & Research Institute, Chengalpattu, Tamil Nadu
S.No
Name of Training Course
Duration of the Course
Participants per Batch
No. of Batches conducted
1 NLEP Training for State / District Leprosy Officer
5 days 14 01
2 NLEP Training for District Leprosy Consultant
3 days 6 01
3 Tertiary Care Management of Leprosy 15 days 4 02
4 NLEP Training for PG Community Medicine
5 days 7 02
5 NLEP Training for Non-Medical Health Supervisor’s
2 months
6 In plant Training in Bio-Technology 10 days 1 01
7 Skin Smear Technician Training 2 /5 days --
8 NLEP Training for Health Supervisors 5 days 4 01
9 NLEP Training for Field Investigators 5 days 24 01
10 Internship for CRRI Training 4 / 5 days 67 / 45 15 / 39
11 NLEP Training for Medical Officer 3 days --
13 Physiotherapy Technician Course 9 months --
14 Observational Visit for Medical Student 1 day 158 07
15 Observational Visit for Nursing Students 1 day 40 02
16 Observational Visit for Bio Technology 1 day 02 02
Sr No
Name of the training Duration of training
Number of Batch trained
Number of Participants trained
1 AYUSH Medical Officers of Chattisgarh State
1 Day 7 batches 224
2 National level SLO/ DLO/BMO/MO Training
5 days 8 batches 146
3 Training imparted to Medical College Students
1 day 5batches 130
4 Training imparted to BPT Intern students
1 week 5 batches 14
5 Training of Laboratory Technicians in Skin Smear
5 days 1 batches 5
6 Multi Purpose Workers/ Para Medical Workers
5 days 2 batches 13
7 Training imparted to Nursing Students
1 day 4 batches 114
TOTAL 32 Batch 646 Participants
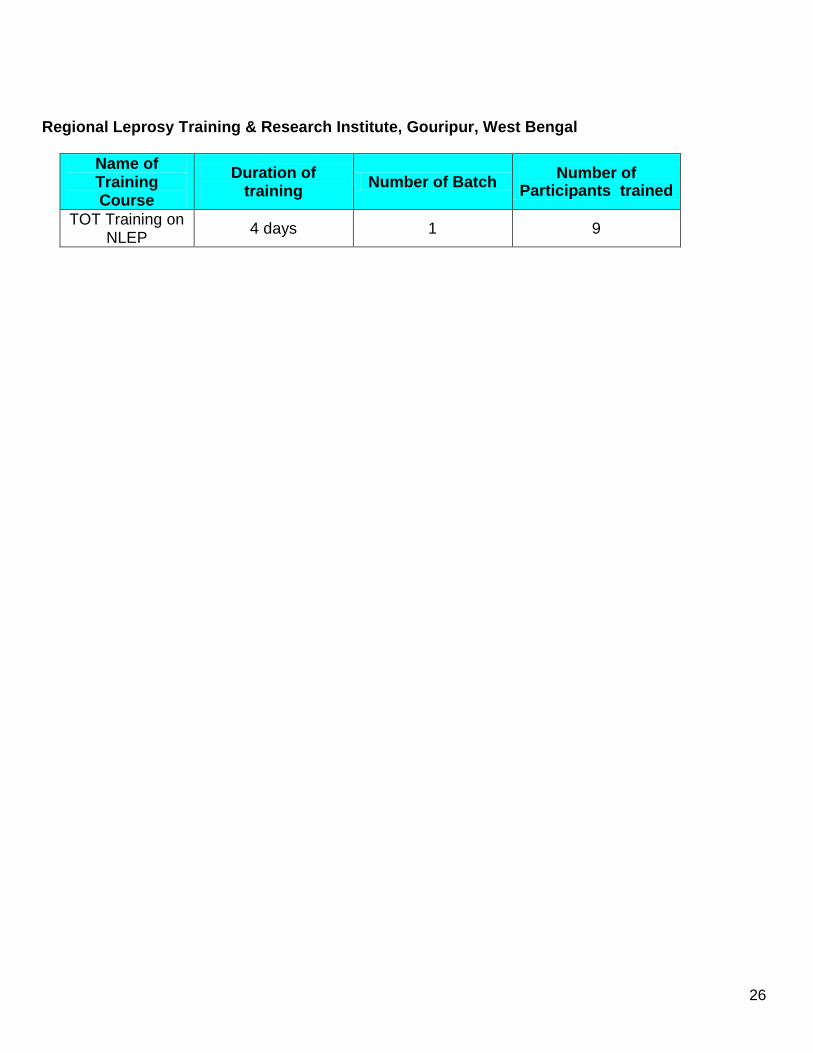
Regional Leprosy Training & Research Institute, Gouripur, West Bengal
Name of Training Course
Duration of training
Number of Batch Number of
Participants trained
TOT Training on NLEP
4 days 1 9
26

Related Documents