Draft for Public Comment New Jersey Stormwater Best Management Practices Manual March 2020 Chapter 5: Stormwater Management Quantity and Quality Standards and Computations Page 1 5. STORMWATER MANAGEMENT QUANTITY AND QUALITY STANDARDS AND COMPUTATIONS This chapter discusses the fundamentals of computing stormwater runoff rates and volumes from rainfall using various mathematical methods. To do so effectively, the chapter also describes the fundamentals of the rainfall-runoff process that these methods attempt to simulate. Guidance is also provided in the use of the Natural Resources Conservation Service (NRCS) method, the Rational Method and the Modified Rational Method that are specifically required by the NJDEP Stormwater Management rules at N.J.A.C. 7:8 et seq. Fundamentals of Stormwater Runoff In general, stormwater runoff can be described as a by-product of the interaction of rainfall with the land. This interaction is one of several processes that the earth’s water may go through as it continually cycles between the land and the atmosphere. This cyclical process is scientifically known as the hydrologic cycle. Stormwater runoff is only one of many forms water may take. Figure 5-1 below depicts the primary forms that water can take during the hydrologic cycle and the various processes that produce these forms. In addition to runoff, these processes include precipitation, evaporation from surfaces or the atmosphere, evapotranspiration by plants and infiltration into the soil and or groundwater. As such, water that precipitates as rainfall can wind up, or at least spend time, on ground or plant surfaces, in the atmosphere, within the various soil layers or in waterways and water bodies. Figure 5-1: The Hydrologic Cycle Source: Fundamentals of Urban Runoff Management.

Welcome message from author
This document is posted to help you gain knowledge. Please leave a comment to let me know what you think about it! Share it to your friends and learn new things together.
Transcript

Draft for Public Comment
New Jersey Stormwater Best Management Practices Manual March 2020 Chapter 5: Stormwater Management Quantity and Quality Standards and Computations Page 1
5. STORMWATER MANAGEMENT QUANTITY ANDQUALITY STANDARDS AND COMPUTATIONSThis chapter discusses the fundamentals of computing stormwater runoff rates and volumes from rainfall using various mathematical methods. To do so effectively, the chapter also describes the fundamentals of the rainfall-runoff process that these methods attempt to simulate. Guidance is also provided in the use of the Natural Resources Conservation Service (NRCS) method, the Rational Method and the Modified Rational Method that are specifically required by the NJDEP Stormwater Management rules at N.J.A.C. 7:8 et seq.
Fundamentals of Stormwater Runoff
In general, stormwater runoff can be described as a by-product of the interaction of rainfall with the land. This interaction is one of several processes that the earth’s water may go through as it continually cycles between the land and the atmosphere. This cyclical process is scientifically known as the hydrologic cycle. Stormwater runoff is only one of many forms water may take. Figure 5-1 below depicts the primary forms that water can take during the hydrologic cycle and the various processes that produce these forms. In addition to runoff, these processes include precipitation, evaporation from surfaces or the atmosphere, evapotranspiration by plants and infiltration into the soil and or groundwater. As such, water that precipitates as rainfall can wind up, or at least spend time, on ground or plant surfaces, in the atmosphere, within the various soil layers or in waterways and water bodies.
Figure 5-1: The Hydrologic Cycle
Source: Fundamentals of Urban Runoff Management.

Draft for Public Comment
New Jersey Stormwater Best Management Practices Manual March 2020 Chapter 5: Stormwater Management Quantity and Quality Standards and Computations Page 2
The physical processes that convert rainfall to runoff are both complex and highly variable. As such, these processes cannot be replicated mathematically with exact certainty. However, by making simplifying assumptions and using empirical data, there are several mathematical models and equations that can simulate these processes and predict resultant runoff volumes and rates with acceptable accuracy. Before any of the computation methods can be discussed, it is necessary to include a brief glossary of the terms that will be used throughout this chapter.
Time of concentration – As defined in N.J.A.C. 7:8-2.4(g)4, time of concentration is the time it takes for runoff to travel from the hydraulically most distant point of the drainage area to the point of interest within a watershed.
Hydrograph – In the context of a stormwater runoff analysis, the graph depicting the flow rate of runoff versus the time passed at a specific point of analysis is a hydrograph. A hydrograph can provide much information about stormwater runoff, including the time of concentration, the time at which peak flow occurs, the peak flow rate and the volume of runoff generated.
In general, all runoff computation methods are mathematical expressions attempting to replicate the hydrologic cycle. However, most transform its cyclical character to a linear one, treating a rainfall event as an individual input and producing runoff as a singular output. Many hydrological models have been developed to compute the flow rate or volume of the runoff from an individual event. However, the Stormwater Management rules at N.J.A.C. 7:8-5.7 allow only the following three modeling methodologies to be used:
1. The USDA Natural Resources Conservation Service (NRCS) methodology, including the NRCSRunoff Equation and Dimensionless Unit Hydrograph as described in Chapters 7, 9, 10, 15 and 16,Part 630 Hydrology, National Engineering Handbook, may be used for the computation of runoffvolume, peak flow rate of runoff and hydrograph of runoff resulting from specific precipitationdepths. This methodology is additionally described in Technical Release 55--Urban Hydrology forSmall Watersheds (TR-55), dated June 1986. Information regarding the methodology is availablefrom the Natural Resources Conservation Service website at:
https://www.nrcs.usda.gov/Internet/FSE_DOCUMENTS/stelprdb1044171.pdf or
at United States Department of Agriculture Natural Resources Conservation Service, 220 Davison Avenue, Somerset, New Jersey 08873.
2. The Rational Method may be used for the computation of peak flow rate under specific rainfallintensity.
3. The Modified Rational Method may be used for hydrograph computations, which can be furtherutilized for the computation of runoff volume for a specific rainfall intensity and the requiredstorage volume of a detention BMP. The rational and modified rational methods are described in"Appendix A-9 Modified Rational Method" in the Standards for Soil Erosion and Sediment Controlin New Jersey, July 1999, as amended and supplemented. This document is available from theState Soil Conservation Committee or any of the Soil Conservation Districts listed at N.J.A.C. 2:90-1.3(a)4. The document is also available online at:
http://www.nj.gov/agriculture/divisions/anr/pdf/2014NJSoilErosionControlStandardsComplete.pdf.

Draft for Public Comment
New Jersey Stormwater Best Management Practices Manual March 2020 Chapter 5: Stormwater Management Quantity and Quality Standards and Computations Page 3
Predicting Storm Events
Even though precipitation events are, by nature, random in their duration and rainfall depths, historical data shows that large storm events occur less frequently than small storm events. No one can predict exactly when a certain size storm event will occur. However, through a frequency analysis of rainfall depths and intensities from past precipitation events, one can determine the likelihood of a storm occurrence using probability analysis.
The rainfall depth and intensity of past precipitation events are sorted into a probability distribution that gives the likelihood of the occurrence of different sized events.
For example, a storm event producing a rainfall depth of 3.5 inches or greater has about a 50% chanceof happening in a given year whereas a storm event with a rainfall depth of 8.5 inches or greater thathas only a 1% chance of occurring in the same given year.
The probability of the occurrence of a certain size of storm event can be alternatively expressed as a recurrence interval, which is the inverse of the probability.
For example, the recurrence interval of a rainfall event that has a 50% chance of occurrence in a givenyear is expressed as the 2-year (= 100 ÷ 50) recurrence interval, which is also known as the 2-yearstorm.
For a storm event with a 1% chance of occurrence, it has a 100-year (= 100 ÷ 1) recurrence intervaland is referred to as the 100-year storm.
Referring to a precipitation event as the “X-year storm” does not mean that this storm can only happen once every X years. Nor does it mean that a larger storm event cannot also occur that year. The table below lists the probability of a particular occurrence and its corresponding chance of occurring, expressed as a percentage, in any given year.
Recurrence Intervals and Probabilities of Occurrences Recurrence Interval,
in years Probability of Occurrence
in any Given Year Percent Chance of Occurrence
in any Given Year
100 1 in 100 1
50 1 in 50 2
25 1 in 25 4
10 1 in 10 10
5 1 in 5 20
2 1 in 2 50
Draft for Public Comment
New Jersey Stormwater Best Management Practices Manual March 2020 Chapter 5: Stormwater Management Quantity and Quality Standards and Computations Page 4
Another aspect of the frequency analysis is the duration of rainfall events. The frequency analysis may use the rainfall depths observed in events having various durations of precipitation, such as 1 hour, 6 hours, 24 hours or even 3 days.
There are many organizations that collect and publish hydrological data, such as National Oceanic and Atmospheric Administration’s (NOAA) National Weather Service (NWS). NOAA’s NWS publishes and updates hydrological data and frequency analysis of rainfall depth and intensity constantly, under normal operating conditions. The National Engineering Handbook (NEH) produced by the NRCS uses NWS data due to its availability and lengths of record. Therefore, in this chapter, NWS data is referenced in the calculations involving the rainfall depths and intensities for the 2-, 10- and 100-year storm events. A more detailed discussion of using NWS data is found beginning on Page 12.
Regulatory Requirements of the Stormwater Management Rules
The Stormwater Management rules set forth stormwater runoff quantity, stormwater runoff quality and groundwater recharge standards for stormwater runoff generated by major developments as defined in N.J.A.C. 7:8-1.2. These projects must demonstrate compliance with those standards, as follows.
Stormwater Runoff Quantity Control Design and Performance Standards
In order to control stormwater runoff quantity impacts, the design engineer shall use the assumptions and factors for stormwater runoff calculations at N.J.A.C. 7:8-5.7(a). Unless the project meets N.J.A.C. 4.6(a)3.ix, 5.2(d) or 5.6(b)4, the design engineer must demonstrate the compliance of the quantity standards in one of the three options in N.J.A.C. 7:8-5.6(b)1 to 3:
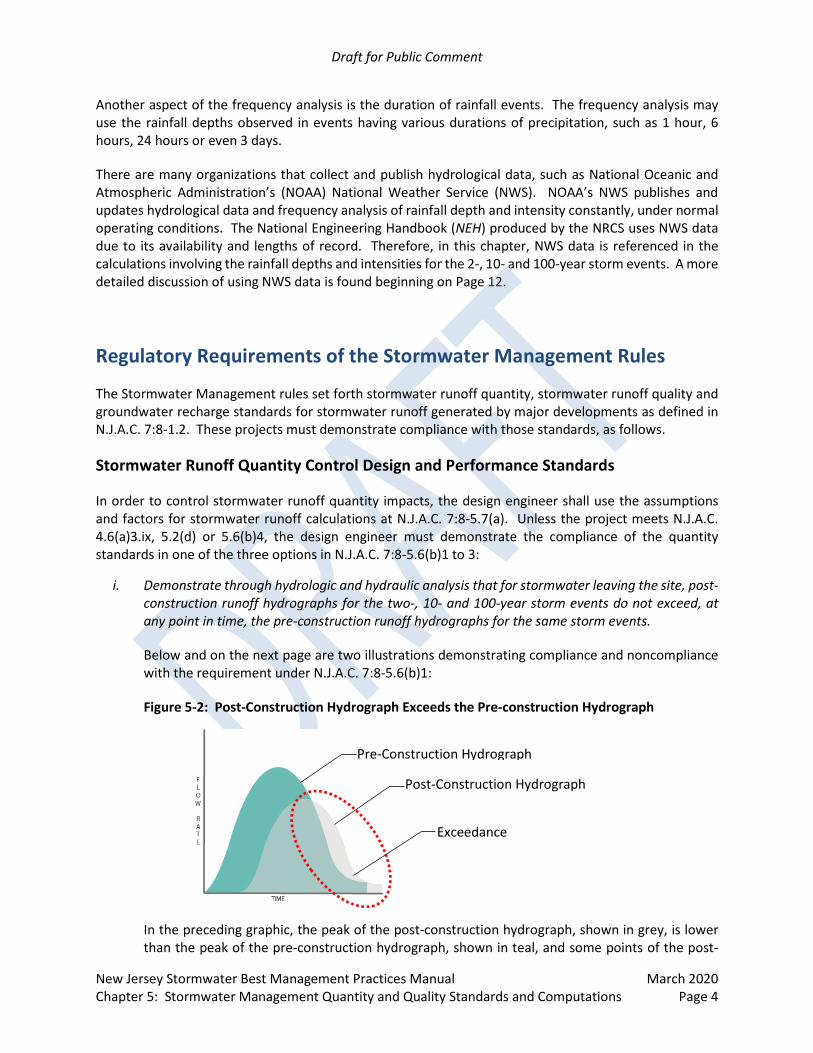
i. Demonstrate through hydrologic and hydraulic analysis that for stormwater leaving the site, post-construction runoff hydrographs for the two-, 10- and 100-year storm events do not exceed, atany point in time, the pre-construction runoff hydrographs for the same storm events.
Below and on the next page are two illustrations demonstrating compliance and noncompliancewith the requirement under N.J.A.C. 7:8-5.6(b)1:
Figure 5-2: Post-Construction Hydrograph Exceeds the Pre-construction Hydrograph
In the preceding graphic, the peak of the post-construction hydrograph, shown in grey, is lower than the peak of the pre-construction hydrograph, shown in teal, and some points of the post-
Exceedance
Pre-Construction Hydrograph
Post-Construction Hydrograph

Draft for Public Comment
New Jersey Stormwater Best Management Practices Manual March 2020 Chapter 5: Stormwater Management Quantity and Quality Standards and Computations Page 5
construction hydrograph lie outside the pre-construction hydrograph, shown within the dashed oval area; therefore, the post-construction hydrograph does not meet the requirements set forth at N.J.A.C. 7:8-5.6(b)1.
Figure 5-3: Post-Construction Hydrograph does not Exceed the Pre-construction Hydrograph at any Point
In the above graphic, the post-construction hydrograph meets the aforementioned requirement since every point of the post-construction hydrograph is under the pre-construction hydrograph.
It is important to note that the area under the hydrograph represents the volume of the stormwater runoff. In order to comply with this option for meeting the stormwater runoff quantity standards, the post-construction runoff volume must be equal to or lower than the pre-construction runoff volume. Otherwise, the post-construction hydrograph will exceed the pre-construction hydrograph at some point.
ii. Demonstrate through hydrologic and hydraulic analysis that there is no increase, as compared tothe pre-construction condition, in the peak runoff rates of stormwater leaving the site for the two-,10- and 100-year storm events and that the increased volume or change in timing of stormwaterrunoff will not increase flood damage at or downstream of the site. This analysis shall include theanalysis of impacts of existing land uses and projected land uses assuming full development underexisting zoning and land use ordinances in the drainage area.
This demonstration requires the following calculations and demonstrations be provided, at a minimum:
□ Calculation of pre- and post-construction conditions for the 2-, 10- and 100-year storms,where post-construction peak flow rates leaving the site must not be higher than the pre-construction peak flow rates leaving the site.
□ A hydrologic and hydraulic analysis of the receiving waterbody, which demonstrates that theincreased volume of stormwater runoff and/or change in timing from pre- to post-construction conditions for the 2-, 10- and 100-year storms does not result in increased flooddamage at or downstream of the project.
□ A full set of hydrologic and hydraulic calculations with pre-construction conditions and post-construction conditions with the project calculations based on the existing land uses.
Pre-Construction Hydrograph
Post-Construction Hydrograph

Draft for Public Comment
New Jersey Stormwater Best Management Practices Manual March 2020 Chapter 5: Stormwater Management Quantity and Quality Standards and Computations Page 6
□ A full set of hydrologic and hydraulic calculations with pre-construction conditions and post-construction conditions with the project calculations based on the assumption of fulldevelopment in the drainage area allowed by existing zoning and land use ordinances.
iii. Design stormwater management measures so that the post-construction peak runoff rates for thetwo-, 10- and 100-year storm events are 50, 75 and 80 percent, respectively, of the pre-construction peak runoff rates. The percentages apply only to the post-construction stormwaterrunoff that is attributable to the portion of the site on which the proposed development or projectis to be constructed.
Under the third option, the design engineer may use stormwater management measures, eithernonstructural and/or structural, to control the post-construction peak flow rates to be 50, 75 and80 percent of the pre-construction peak flow rates for the 2-, 10- and 100-year storms,respectively.
The methodologies allowed under N.J.A.C. 7:8-5.7 are discussed in the section which begins on Page 9.
Applicability of Stormwater Runoff Quantity Control Standards
For municipal review under the requirements of the Municipal Separate Storm Sewer System (MS4)permits, the threshold under which a project is considered to meet the definition of majordevelopment is dependent upon each municipality’s adopted stormwater managementordinances(s). According to N.J.A.C. 7:8-4.2(a), major development reviewed under MunicipalStormwater Control Ordinances is limited to projects that ultimately disturb one or more acres ofland. However, municipal ordinances can be more stringent than the requirements of the Stormwater Management rules, but cannot be less restrictive. The Residential Site Improvement Standards (RSIS),under N.J.A.C. 5:21 et seq., allow municipalities to require stormwater runoff controls fordevelopment falling below the major development threshold to address groundwater recharge andstormwater runoff quantity control, but not for stormwater runoff water quality control.
In accordance with N.J.A.C. 7:8-5.6(b)4, in tidal flood hazard areas, stormwater runoff water quantityanalysis in accordance with N.J.A.C. 7:8-5.6(b)1, 2 and 3 is required unless the design engineerdemonstrates through hydrologic and hydraulic analysis that the increased volume, change in timing,or increased rate of the stormwater runoff, or any combination of the three will not result in additionalflood damage below the point of discharge of the major development. This provision, however, doesnot provide a blanket exemption from having to provide stormwater quantity control requirementsfor the sites located in the tidal flood hazard area. It, instead, requires a demonstration that thereare no increases in flood damages below the point of discharge by the increased volume ofstormwater runoff before the quantity control requirement stated in N.J.A.C. 7:8-5.6(b)1, 2 and 3 canbe waived.
□ For example, when a site located in a tidal flood hazard area discharges stormwater runoff directly into a bay, there is no increase of the water level or flood damage below the point of discharge.Therefore, the project is not required to meet the stormwater quantity control requirement.
□ However, if a site located in a tidal flood hazard area will discharge the runoff so that it flows overor past a neighboring property before reaching the tidal water, the stormwater runoff from the

Draft for Public Comment
New Jersey Stormwater Best Management Practices Manual March 2020 Chapter 5: Stormwater Management Quantity and Quality Standards and Computations Page 7
site could increase flood damages to the neighboring property. This project will be required to meet the quantity control requirement.
□ Similarly, if the stormwater runoff from a site will discharge to a storm sewer or other conveyance,meaning it will flow past or through other properties before reaching the tidal water, thestormwater discharge could increase flood damages below the point of discharge. Under suchcircumstances, the stormwater runoff quantity control requirement must be satisfied.
The demonstration analysis is not required when the stormwater is discharged directly into any ocean, bay, inlet or the reach of any watercourse between its confluence with an ocean, bay or inlet and downstream of the first water control structure.
Stormwater runoff from agricultural development meeting the definition of major development mustmeet the performance standards established in these rules. Development on agricultural land means: any activity that requires a State permit, any activity reviewed by the County Agricultural Boards (CAB) and/or the State Agricultural Development Committee (SADC) and any activity that requires municipalreview that is not exempted by the Right to Farm Act, N.J.S.A. 4:1C-1 et seq. This does not conflictwith the Right to Farm Act, which recognizes the State's continuing authority to regulate agriculturaldevelopment at N.J.S.A. 4:1C-9.
“Disturbance” means the placement or reconstruction of impervious surface or motor vehicle surface, or exposure and/or movement of soil or bedrock or clearing, cutting, or removing of vegetation.Milling and repaving is not considered disturbance for the purposes of this definition. Milling and/orrepaving of an existing impervious surface that will not expose or move soil or bedrock beneath theexisting surface do/does not count as disturbance or redevelopment and do/does not trigger theStormwater Management rules, provided there are no changes to the existing stormwater drainagesystem. The reconstruction of these areas, however, does constitute disturbance.
N.J.A.C. 7:8-5.6(c) requires that the stormwater runoff quantity standards shall be applied at the site’sboundary to each abutting lot, roadway, watercourse or receiving storm sewer system. Stormwaterquantity control requirements are applicable to each discharge point leaving the boundary of thedevelopment site separately unless the stormwater runoff generated by different areas within thesite converge into one discharge point before leaving the development site.
Conditions Regarding the Use of Exfiltration in Stormwater Runoff Routing Computations
Exfiltration can be used in the design of a small-scale green infrastructure BMP that infiltrates stormwater runoff into the subsoil subject to the requirements of N.J.A.C. 7:8-5.4. Exfiltration, meaning discharge of runoff into the subsoil, may be included in stormwater runoff routing computations under certain conditions, as outlined below.
1. All soil testing must be fully compliant with Chapter 12: Soil Testing Criteria of this manual.
2. Pre-treatment, in the form of a forebay or any of the other BMPs found in the BMP Manual, mustbe incorporated into the BMP design.

Draft for Public Comment
New Jersey Stormwater Best Management Practices Manual March 2020 Chapter 5: Stormwater Management Quantity and Quality Standards and Computations Page 8
3. Exfiltration cannot be used in any BMP designed with an underdrain system, regardless ofwhether the underdrained system is used as an emergency or as an alternative drainage method.Note that underdrains used for emergency or alternative drainage are not consistent within thedesigns in this Manual. These would need to be approved as an alternative stormwatermanagement measure pursuant to N.J.A.C. 7:8-5.2(g).
4. Exfiltration of the entire volume of stormwater runoff generated by any storm other than theWater Quality Design Storm is prohibited except when:
a. the system is designed to infiltrate the difference in volumes produced by the pre- and post-development condition for the 2-year design storm with exfiltration included in the routingcalculations for the purpose of meeting the groundwater recharge requirements set forth inN.J.A.C. 7:8-5.4,
b. existing site conditions are such that no runoff leaves the site for the pre-constructioncondition scenario, thereby constraining the design to infiltrate 100% of the volume producedby the post-construction condition for the same design storm or
c. the volume of stormwater runoff to be fully infiltrated is required by law or rule implementedthe Pinelands Commission, Highlands Council, or any other stormwater review agency withjurisdiction over the project.
5. The analysis of groundwater hydrology and the hydraulic impact due to the exfiltration, requiredpursuant to N.J.A.C. 7:8-5.2(h), must be conducted in conjunction with the design usingexfiltration. The design soil permeability rate, also known as the design vertical hydraulicconductivity, of the most hydraulically restrictive soil horizon below an infiltration type BMP maybe used as the exfiltration rate in the routing calculations only when the soil is tested strictly inaccordance with Chapter 12. This analysis must be performed using the method outlined inChapter 13: Groundwater Table Hydraulic Impact Assessments for Infiltration BMPs.
6. The runoff volume discarded as exfiltration and the design vertical hydraulic conductivity of themost hydraulically restrictive soil horizon below an infiltration BMP must be used to calculate theduration of infiltration period in the groundwater mounding analysis. An adverse impact may becaused by exfiltration if the resulting groundwater mounding reaches the bottom of the BMP orif the temporary localized increase in the water table encroaches upon a building or anotherstructure, including any septic systems. If an adverse impact is concluded from the groundwatermounding analysis, the rate of exfiltration must be reduced to avoid the adverse impact. Thereduced exfiltration rate must also be used to re-run the routing calculation(s) to check the peakflow rate(s) produced for the respective design storm(s) through the proposed outlet structure ofthe infiltration BMP used to meet the Stormwater Runoff Quantity Standards. When an adverseimpact is the result, further modifications to the size of the infiltration area of the BMP orreductions in the exfiltration rate must be performed until the adverse impacts are eliminated. Ifadverse impacts cannot be avoided, the infiltration BMP cannot be used.
For additional information on performing the groundwater mounding analysis, see Chapter 13: Groundwater Table Hydraulic Impact Assessments for Infiltration BMPs of this manual.
Example 5-8, which begins on Page 56, illustrates the methodology to be used.

Draft for Public Comment
New Jersey Stormwater Best Management Practices Manual March 2020 Chapter 5: Stormwater Management Quantity and Quality Standards and Computations Page 9
Stormwater Runoff Computation Methods
As stated above, for the purposes of managing potential flooding, stormwater runoff quantity and quality, plus groundwater recharge, issues, it is essential to calculate the volume and peak flow of the stormwater runoff produced by a storm event. N.J.A.C 7:8-5.7 states the following methods are the only methods acceptable for use in the computation of stormwater runoff:
1. The U.S. Department of Agriculture NRCS methodology and
2. The Rational Method for peak flow along with the Modified Rational Method for hydrographcomputations.
The selection of an appropriate method depends upon the limitation(s) of the method under consideration:
The Rational Method can be used to produce estimates of peak runoff rates, but it cannot providetotal stormwater runoff volumes nor produce hydrographs.
The Modified Rational Method can be used for the calculation of runoff volume.
The NRCS method can provide total stormwater runoff volume, the peak flow rate and producehydrographs. Under the NRCS method, different synthetic rainfall distributions and unithydrographs can be applied to produce the stormwater runoff hydrograph in accordance withgeographical differences that may affect the rainfall pattern in each storm event and the runoffpattern in a region, depending on whether the topographic slope is steep or flat. Furtherdiscussion of rainfall distributions and unit hydrographs are found beginning on Page 17.
Limitations on the size of the drainage area must also be taken into consideration:
The Rational Method can be used in drainage areas measuring 20 acres or less. When a drainagearea is larger than 20 acres, the drainage area needs to be divided into smaller sub-drainage areas.The Rational Method is then applied to each sub-drainage area. Peak flow rates in each sub-drainage area are combined in consideration of the time of concentration for each drainage area.
The NRCS method can be used in a drainage area larger than 20 acres, but the area is still subjectto the N.J.A.C. 7:8-5.7(a)4 requirement that the relative stormwater runoff rates and/or volumesof pervious and impervious surfaces be separately considered to accurately compute the ratesand volume of stormwater runoff from the drainage area.
A table is provided on Page 81 summarizing the applicability of the methods discussed in this chapter and how the methods are to be used.

Draft for Public Comment
New Jersey Stormwater Best Management Practices Manual March 2020 Chapter 5: Stormwater Management Quantity and Quality Standards and Computations Page 10
NRCS Methodology
The NRCS methodology is perhaps the most widely used method for computing stormwater runoff rates, volumes and hydrographs. It uses both a hypothetical design storm and an empirical nonlinear runoff equation to compute runoff volumes and as well as a dimensionless unit hydrograph to convert the volumes into runoff hydrographs. The methodology is particularly useful for comparing pre- and post-development peak rates, volumes and hydrographs. The key component of the NRCS runoff equation is the NRCS Curve Number (CN), which is based on soil permeability, surface cover, hydrologic condition and antecedent moisture. Watershed or drainage area time of concentration is the key component of the dimensionless “unit hydrograph,” which is defined as a discharge hydrograph resulting from one inch of direct runoff distributed uniformly over the watershed resulting from a rainfall of a specified duration.
Several runoff computation methods rely on the overall NRCS methodology. The most commonly used are the June 1986 Technical Release 55 – Urban Hydrology for Small Watersheds (TR-55), the April 2002 WinTR- 55 – Small Watershed Hydrology computer program and Technical Release 20 – Computer Program for Project Formulation: Hydrology (TR-20) published by the NRCS. The computer programs HEC-1 Flood Hydrograph Package and HEC-HMS Hydrologic Modeling System published by the U.S. Army Corps of Engineers’ Hydrologic Engineering Center also contain components of the NRCS methodology. A complete description of the NRCS methodology can be found in the NRCS National Engineering Handbook, Part 630 -Hydrology (NEH), available at:
https://www.nrcs.usda.gov/wps/portal/nrcs/detailfull/national/water/?cid=stelprdb1043063.
Information Required for the NRCS Methodology
The index on the following page lists of all the information required in order to use the NRCS methodology of computing stormwater runoff. Examples are provided and begin on Page 33.

Draft for Public Comment
New Jersey Stormwater Best Management Practices Manual March 2020 Chapter 5: Stormwater Management Quantity and Quality Standards and Computations Page 11
Information Required to use the NRCS Methodology Page No.
Hydrologic Soil Group of the drainage area soil 11
Sub-drainage areas 12
Land cover 12
Rainfall depth for the stormwater runoff quantity control design storms 12
Rainfall distributions for the stormwater runoff quantity control design storms 17
Rainfall depth for the stormwater runoff water quality design storm 23
Rainfall distribution for the stormwater runoff water quality design storm 23
Time of travel and time of concentration 26
Maximum sheet flow roughness coefficient 26
Maximum sheet flow length 27
Shallow concentrated flow 27
Open channel flow 27
Tc routes 27
Runoff Hydrographs 28
Directly Connected Impervious Cover 31
Unconnected Impervious Cover 31
1. Hydrologic Soil Group of the drainage area soil: Under the NRCS classification, soils are classified intohydrologic soil groups (HSGs) to indicate the minimum rate of infiltration obtained for bare soil afterprolonged wetting. The HSGs, which have the designations A, B, C and D, are arranged from highestto lowest in order of soil permeability, or infiltration rate, which is the rate at which water enters thesoil at the soil surface. Infiltration is controlled by the surface condition. HSG also indicates thetransmission rate—the rate which the water moves within the soil.
The U.S. Department of Agriculture’s (USDA) Soil Surveys by county or the soil survey data fromUSDA’s Soil Survey website can be used in the preliminary or conceptual design. Currently, theinformation regarding the location of the HSGs present at a location, and the specific soil properties,is available online at:
https://websoilsurvey.sc.egov.usda.gov/App/HomePage.htm.
However, during the design process, if soil boring samples and/or field tests of permeability show that the soil of the site has a different HSG soil than the information obtained from the USDA soil survey, the calculation of stormwater runoff and groundwater recharge must be adjusted to the HSG

Draft for Public Comment
New Jersey Stormwater Best Management Practices Manual March 2020 Chapter 5: Stormwater Management Quantity and Quality Standards and Computations Page 12
designation obtained from field soil testing. Soil Permeability Testing requirements and procedures can be found in Chapter 12 of this manual.
2. Sub-drainage areas: Each sub-drainage area having different flow patterns and drainage points bywhich stormwater runoff leaves the sub-drainage area, must be individually identified, and thehydrological analysis of each sub-drainage area must be individually performed. When a site consistsof impervious areas and pervious areas, the impervious areas and pervious areas must be separatedinto sub-different drainage areas in accordance with N.J.A.C. 7:8-5.7. Some hydrologic modelingsoftware packages may allow the user to calculate the runoff separately from impervious surfaces and pervious surfaces that exist in one drainage area. However, the design engineer may only use thismodeling option if the impervious area time of concentration is the same as the pervious area timeof concentration.
3. Land cover: The types of vegetation present, the density of the vegetation, the types of developmentand the percentage of impervious cover are all characteristics that factor into the CN value. For thepre-development condition, the presumed state is wooded land use in good hydrologic conditionunless it is proven otherwise as set forth in the N.J.A.C. 7:8-5.6. Take note that the cover types forstreets and roads, urban districts and residential districts by average lot size in the TR-55 manual areintended for modeling large watershed on an area-wide scale. They are not intended for use inmodeling runoff from individual development sites. For runoff from individual sites involving adirectly connected or unconnected impervious surface, it may be necessary to compute runoff fromthe impervious surface separately from any pervious surfaces.
For a site that has more than one land cover existing on the site during the five years immediatelyprior to the time of application, the land cover with the lowest runoff potential must be used forthe computations, as specified at N.J.A.C. 7:8-5.7(a)2. For example, if a site had an existing asphaltpaved parking lot removed in 2012 and vegetation was established after the removal of the pavement,the application for stormwater management approval in 2015 cannot claim the removed asphaltparking lot as an impervious surface on the site since the surface with the lowest runoff potential isthe vegetation that was established prior to the time of the application.
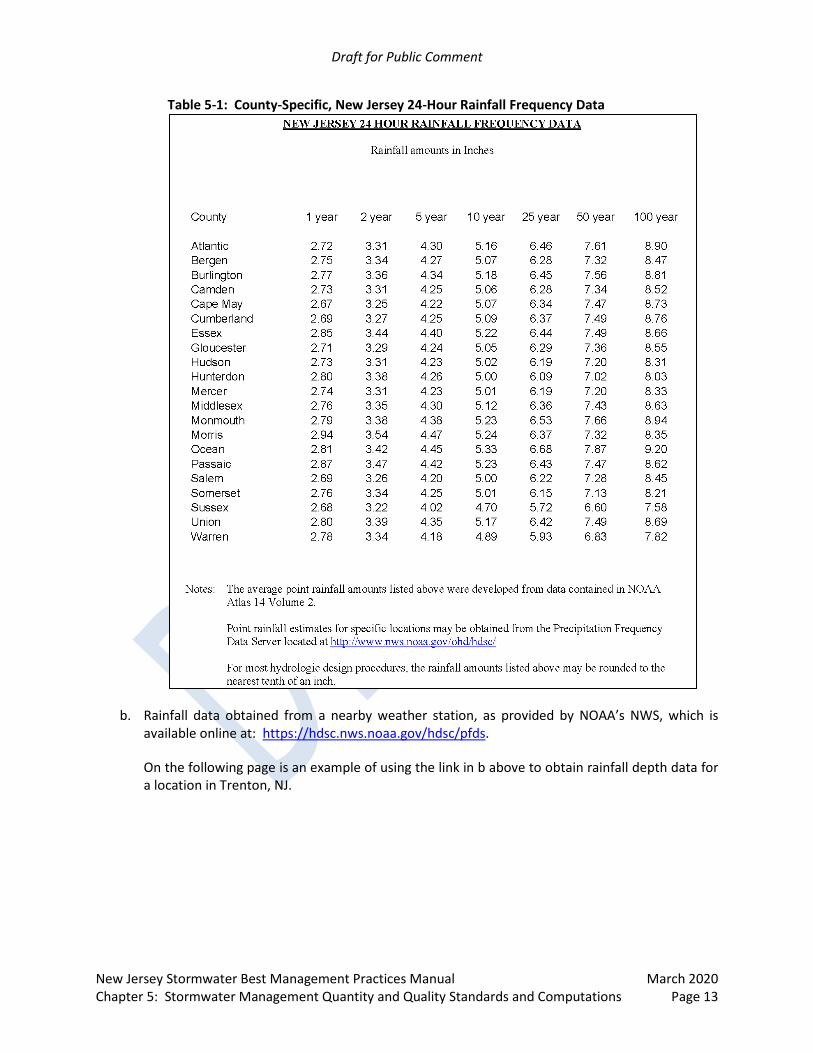
4. Rainfall depth for the stormwater runoff quantity control design storms: Rainfall depth is anessential parameter in the calculation of stormwater runoff volumes and peak flows when using theNRCS methodology. Two sources of data are available. Both sources must be obtained and compared,and whichever values are greater must be used, as follows:
a. Rainfall depth for a specific location from the New Jersey 24-hour Rainfall Frequency Data for aspecific county, as provided in either Table 5-1 found on the following page or by following thislink:
https://www.nrcs.usda.gov/Internet/FSE_DOCUMENTS/nrcs141p2_018235.pdf.
Draft for Public Comment
New Jersey Stormwater Best Management Practices Manual March 2020 Chapter 5: Stormwater Management Quantity and Quality Standards and Computations Page 13
Table 5-1: County-Specific, New Jersey 24-Hour Rainfall Frequency Data
b. Rainfall data obtained from a nearby weather station, as provided by NOAA’s NWS, which isavailable online at: https://hdsc.nws.noaa.gov/hdsc/pfds.
On the following page is an example of using the link in b above to obtain rainfall depth data fora location in Trenton, NJ.

Draft for Public Comment
New Jersey Stormwater Best Management Practices Manual March 2020 Chapter 5: Stormwater Management Quantity and Quality Standards and Computations Page 14
How to Obtain Rainfall Depth Data from NOAA’s NWS:
Step 1: Choose New Jersey from the drop-down list shown in the image below.
Figure 5-4: NOAA’s NWS Precipitation Frequency Data Server Website
Step 2: In the Data description section of the next window that opens, from the Select Data Type dropdown menu, choose “Precipitation depth” rather than “Precipitation intensity,” the latter of which is used more often for the Rational Method and is discussed beginning on Page 46. Then, for the Time series type, select “Partial duration” from that dropdown menu.
Figure 5-5: Selecting the Precipitation Depth Data Type

Draft for Public Comment
New Jersey Stormwater Best Management Practices Manual March 2020 Chapter 5: Stormwater Management Quantity and Quality Standards and Computations Page 15
Step 3: In the Select location section, input the location information by one of four methods:
latitude/longitude,
station name,
address or
left click on the location on the interactive map.
For this example, Trenton Station 2 was selected from the dropdown menu under 1.b):
Figure 5-6: Manual Location Selection on the NOAA NWS PFDS Website

Draft for Public Comment
New Jersey Stormwater Best Management Practices Manual March 2020 Chapter 5: Stormwater Management Quantity and Quality Standards and Computations Page 16
Step 4: Scroll down the page to the Point Precipitation Frequency (PF) Estimates section. Left click on the PF tabular option, if it does not appear on top of the other tabs, which will be highlighted in dark blue, as shown in the following image:
Figure 5-7: Point Precipitation Frequency (PF) Estimates – Tabular Option
The data needed is found in the row labeled “24-hr.” The values in the columns labeled “2,” “10” and “100” correspond to the rainfall depths generated by the 2-, 10- and 100-year design storms, respectively, for this weather station location, as outlined in red below.
Figure 5-8: Locating the 2-, 10- and 100- year Design Storm Rainfall Data

Draft for Public Comment
New Jersey Stormwater Best Management Practices Manual March 2020 Chapter 5: Stormwater Management Quantity and Quality Standards and Computations Page 17
5. Rainfall distribution for the stormwater runoff quantity control design storms: In addition to therainfall depth, knowing how rain falls, during a storm event is important in calculating the peak flowrate of the stormwater runoff generated. Keep in mind that generally, a precipitation event typicallybegins with a lighter intensity of rain falling, followed by a period during which rain falls at a higherintensity before gently tapering off. To achieve the goal of mimicking natural events, NRCS developedrainfall distributions from historical records from the different regions of the country. These rainfalldistributions are based upon the assumption that the rain distribution is bell-shaped, meaning it hasless rainfall in the beginning and at the end of the rain event. NRCS rainfall distributions are groupedinto four types according to the applicable regions or geographic situations. Types I and IA representthe Pacific maritime climate with wet winters and dry summers. Type II represents the Gulf of Mexico and Atlantic coastal areas where tropical storms bring large 24-hour rainfall amounts. Type IIIrepresents the rest of the country, which includes New Jersey. NRCS rainfall distributions havedurations of 24-, 18-, 12- or 6-hours:
On September 10, 2012, NCRS issued a note, NEW JERSEY BULLETIN NO. NJ210-12-1, stating that:
BULLETIN NO. NJ210-12-1 also states:
‘WinTR-55 users: “Storm distribution and unit hydrograph are separate inputs in the software. Distribution NOAA_C and NOAA_D apply to Region C and Region D, respectively. ‘
As stated above, designing BMPs to meet the stormwater runoff quantity control standards, NOAA_C and NOAA_D rainfall distributions must be used in accordance to Region C and Region D, respectively.
The location of Regions C and D are shown in Figure 5-9. NOAA_C and NOAA_D rainfall distributions, in graphic and tabular forms derived from NOAA data, are shown in Figures 5-10 and 5-11 and Tables 5-2 and 5-3. Rainfall Distributions NOAA_C and NOAA_D are also available online at:
https://www.nrcs.usda.gov/wps/portal/nrcs/main/nj/technical/engineering/.

Draft for Public Comment
New Jersey Stormwater Best Management Practices Manual March 2020 Chapter 5: Stormwater Management Quantity and Quality Standards and Computations Page 18
Figure 5-9: NJ Locations of Regions C and D

Draft for Public Comment
New Jersey Stormwater Best Management Practices Manual March 2020 Chapter 5: Stormwater Management Quantity and Quality Standards and Computations Page 19
Figure 5-10: Rainfall Depths Produced by Regions C and D Rainfall Distributions

Draft for Public Comment
New Jersey Stormwater Best Management Practices Manual March 2020 Chapter 5: Stormwater Management Quantity and Quality Standards and Computations Page 20
Figure 5-11: Rainfall Intensity for C and D Rainfall Distributions

Draft for Public Comment
New Jersey Stormwater Best Management Practices Manual March 2020 Chapter 5: Stormwater Management Quantity and Quality Standards and Computations Page 21
Table 5-2: NRCS NOAA_C and NOAA_D Rainfall Distribution by Rainfall Depth
Time(hours)
NOAA_C (Fractional
Depth)
NOAA_C (Fractional
Depth)Time
(hours)
NOAA_C (Fractional
Depth)
NOAA_C (Fractional
Depth)Time
(hours)
NOAA_C (Fractional
Depth)
NOAA_C (Fractional
Depth)Time
(hours)
NOAA_C (Fractional
Depth)
NOAA_C (Fractional
Depth)0.1 0.00128 0.0011 6.1 0.0809 0.08717 12.1 0.59331 0.58346 18.1 0.92236 0.916380.2 0.00231 0.0022 6.2 0.08259 0.08901 12.2 0.63382 0.61972 18.2 0.92396 0.918120.3 0.00335 0.00332 6.3 0.08432 0.0909 12.3 0.663 0.64585 18.3 0.92555 0.919850.4 0.00441 0.00445 6.4 0.08609 0.09283 12.4 0.68428 0.6649 18.4 0.92713 0.921570.5 0.00547 0.00559 6.5 0.0879 0.0948 12.5 0.7045 0.683 18.5 0.9287 0.923270.6 0.00654 0.00674 6.6 0.08975 0.09682 12.6 0.71755 0.69644 18.6 0.93026 0.924970.7 0.00763 0.0079 6.7 0.09164 0.09888 12.7 0.72978 0.70887 18.7 0.93181 0.926650.8 0.00872 0.00907 6.8 0.09356 0.10099 12.8 0.74093 0.72028 18.8 0.93335 0.928330.9 0.00982 0.01025 6.9 0.09553 0.10314 12.9 0.75101 0.73067 18.9 0.93488 0.92999
1 0.01093 0.01145 7 0.09754 0.10534 13 0.76001 0.74005 19 0.9364 0.931641.1 0.01206 0.01265 7.1 0.09959 0.10758 13.1 0.76794 0.7484 19.1 0.93791 0.933281.2 0.01319 0.01387 7.2 0.10168 0.10987 13.2 0.77529 0.75618 19.2 0.93941 0.934911.3 0.01433 0.0151 7.3 0.1038 0.1122 13.3 0.78207 0.76338 19.3 0.9409 0.936531.4 0.01548 0.01634 7.4 0.10597 0.11458 13.4 0.78827 0.77 19.4 0.94238 0.938131.5 0.01665 0.01759 7.5 0.10818 0.117 13.5 0.7939 0.77604 19.5 0.94385 0.939731.6 0.01782 0.01885 7.6 0.11042 0.11946 13.6 0.79896 0.7815 19.6 0.94531 0.941311.7 0.019 0.02012 7.7 0.11271 0.12197 13.7 0.80386 0.7868 19.7 0.94676 0.942891.8 0.02019 0.0214 7.8 0.11503 0.12453 13.8 0.80861 0.79195 19.8 0.94821 0.944451.9 0.0214 0.0227 7.9 0.1174 0.12712 13.9 0.81322 0.79693 19.9 0.94964 0.946
2 0.02261 0.024 8 0.11981 0.12977 14 0.81767 0.80176 20 0.95106 0.947542.1 0.02383 0.02532 8.1 0.12225 0.13246 14.1 0.82197 0.80643 20.1 0.95247 0.949072.2 0.02506 0.02665 8.2 0.12474 0.13519 14.2 0.82613 0.81094 20.2 0.95387 0.950592.3 0.02631 0.02799 8.3 0.12726 0.13796 14.3 0.83013 0.8153 20.3 0.95526 0.952092.4 0.02756 0.02934 8.4 0.12982 0.14079 14.4 0.83398 0.81949 20.4 0.95664 0.953592.5 0.02882 0.0307 8.5 0.13243 0.14365 14.5 0.83769 0.82353 20.5 0.95801 0.955072.6 0.03009 0.03207 8.6 0.13507 0.14656 14.6 0.84124 0.82741 20.6 0.95938 0.956552.7 0.03137 0.03346 8.7 0.13776 0.14952 14.7 0.84464 0.83113 20.7 0.96073 0.958012.8 0.03267 0.03485 8.8 0.14048 0.15252 14.8 0.8479 0.8347 20.8 0.96207 0.959462.9 0.03397 0.03626 8.9 0.14324 0.15556 14.9 0.851 0.8381 20.9 0.9634 0.9609
3 0.03528 0.03767 9 0.14605 0.15865 15 0.85395 0.84135 21 0.96472 0.962333.1 0.0366 0.0391 9.1 0.149 0.1619 15.1 0.85676 0.84444 21.1 0.96603 0.963743.2 0.03793 0.04054 9.2 0.1521 0.1653 15.2 0.85952 0.84748 21.2 0.96733 0.965153.3 0.03927 0.04199 9.3 0.15536 0.16887 15.3 0.86224 0.85048 21.3 0.96863 0.966543.4 0.04062 0.04345 9.4 0.15876 0.17259 15.4 0.86493 0.85344 21.4 0.96991 0.967933.5 0.04199 0.04493 9.5 0.16231 0.17647 15.5 0.86757 0.85635 21.5 0.97118 0.96933.6 0.04336 0.04641 9.6 0.16602 0.18051 15.6 0.87018 0.85921 21.6 0.97244 0.970663.7 0.04474 0.04791 9.7 0.16987 0.1847 15.7 0.87274 0.86204 21.7 0.97369 0.972013.8 0.04613 0.04941 9.8 0.17387 0.18906 15.8 0.87526 0.86481 21.8 0.97494 0.973353.9 0.04753 0.05093 9.9 0.17803 0.19357 15.9 0.87775 0.86754 21.9 0.97617 0.97468
4 0.04894 0.05246 10 0.18233 0.19824 16 0.88019 0.87023 22 0.97739 0.9764.1 0.05036 0.054 10.1 0.18678 0.20307 16.1 0.8826 0.87288 22.1 0.9786 0.97734.2 0.05179 0.05555 10.2 0.19139 0.20805 16.2 0.88497 0.87547 22.2 0.97981 0.97864.3 0.05324 0.05711 10.3 0.19614 0.2132 16.3 0.88729 0.87803 22.3 0.981 0.979884.4 0.05469 0.05869 10.4 0.20104 0.2185 16.4 0.88958 0.88054 22.4 0.98218 0.981154.5 0.05615 0.06027 10.5 0.2061 0.22396 16.5 0.89182 0.883 22.5 0.98335 0.982414.6 0.05762 0.06187 10.6 0.21173 0.23 16.6 0.89403 0.88542 22.6 0.98452 0.983664.7 0.0591 0.06347 10.7 0.21793 0.23662 16.7 0.8962 0.8878 22.7 0.98567 0.98494.8 0.06059 0.06509 10.8 0.22471 0.24382 16.8 0.89832 0.89013 22.8 0.98681 0.986134.9 0.06209 0.06672 10.9 0.23206 0.2516 16.9 0.90041 0.89242 22.9 0.98794 0.98735
5 0.0636 0.06836 11 0.23999 0.25995 17 0.90246 0.89466 23 0.98907 0.988555.1 0.06512 0.07001 11.1 0.24899 0.26933 17.1 0.90447 0.89686 23.1 0.99018 0.989755.2 0.06665 0.07167 11.2 0.25907 0.27972 17.2 0.90644 0.89901 23.2 0.99128 0.990935.3 0.06819 0.07335 11.3 0.27022 0.29113 17.3 0.90836 0.90112 23.3 0.99237 0.99215.4 0.06974 0.07503 11.4 0.28245 0.30356 17.4 0.91025 0.90318 23.4 0.99346 0.993265.5 0.0713 0.07673 11.5 0.2955 0.317 17.5 0.9121 0.9052 23.5 0.99453 0.994415.6 0.07287 0.07843 11.6 0.31572 0.3351 17.6 0.91391 0.90717 23.6 0.99559 0.995555.7 0.07445 0.08015 11.7 0.337 0.35415 17.7 0.91568 0.9091 23.7 0.99665 0.996685.8 0.07604 0.08188 11.8 0.36618 0.38028 17.8 0.91741 0.91099 23.8 0.99769 0.997795.9 0.07764 0.08362 11.9 0.40669 0.41654 17.9 0.9191 0.91283 23.9 0.99872 0.9989
6 0.07925 0.08537 12 0.4766 0.47909 18 0.92075 0.91463 24 1 1

Draft for Public Comment
New Jersey Stormwater Best Management Practices Manual March 2020 Chapter 5: Stormwater Management Quantity and Quality Standards and Computations Page 22
Table 5-3: NRCS NOAA_C and NOAA_D Rainfall Distribution by Intensity (fractional) Time
(hours)NOAA_D
(In/hr)NOAA_C
(In/hr)Time
(hours)NOAA_D
(In/hr)NOAA_C
(In/hr)Time
(hours)NOAA_D
(In/hr)NOAA_C
(In/hr)Time
(hours)NOAA_D
(In/hr)NOAA_C
(In/hr)0.1 0.0128 0.011 6.1 0.0165 0.018 12.1 1.1671 1.0437 18.1 0.0161 0.01750.2 0.0103 0.011 6.2 0.0169 0.0184 12.2 0.4051 0.3626 18.2 0.016 0.01740.3 0.0104 0.0112 6.3 0.0173 0.0189 12.3 0.2918 0.2613 18.3 0.0159 0.01730.4 0.0106 0.0113 6.4 0.0177 0.0193 12.4 0.2128 0.1905 18.4 0.0158 0.01720.5 0.0106 0.0114 6.5 0.0181 0.0197 12.5 0.2022 0.181 18.5 0.0157 0.0170.6 0.0107 0.0115 6.6 0.0185 0.0202 12.6 0.1305 0.1344 18.6 0.0156 0.0170.7 0.0109 0.0116 6.7 0.0189 0.0206 12.7 0.1223 0.1243 18.7 0.0155 0.01680.8 0.0109 0.0117 6.8 0.0192 0.0211 12.8 0.1115 0.1141 18.8 0.0154 0.01680.9 0.011 0.0118 6.9 0.0197 0.0215 12.9 0.1008 0.1039 18.9 0.0153 0.0166
1 0.0111 0.012 7 0.0201 0.022 13 0.09 0.0938 19 0.0152 0.01651.1 0.0113 0.012 7.1 0.0205 0.0224 13.1 0.0793 0.0835 19.1 0.0151 0.01641.2 0.0113 0.0122 7.2 0.0209 0.0229 13.2 0.0735 0.0778 19.2 0.015 0.01631.3 0.0114 0.0123 7.3 0.0212 0.0233 13.3 0.0678 0.072 19.3 0.0149 0.01621.4 0.0115 0.0124 7.4 0.0217 0.0238 13.4 0.062 0.0662 19.4 0.0148 0.0161.5 0.0117 0.0125 7.5 0.0221 0.0242 13.5 0.0563 0.0604 19.5 0.0147 0.0161.6 0.0117 0.0126 7.6 0.0224 0.0246 13.6 0.0506 0.0546 19.6 0.0146 0.01581.7 0.0118 0.0127 7.7 0.0229 0.0251 13.7 0.049 0.053 19.7 0.0145 0.01581.8 0.0119 0.0128 7.8 0.0232 0.0256 13.8 0.0475 0.0515 19.8 0.0145 0.01561.9 0.0121 0.013 7.9 0.0237 0.0259 13.9 0.0461 0.0498 19.9 0.0143 0.0155
2 0.0121 0.013 8 0.0241 0.0265 14 0.0445 0.0483 20 0.0142 0.01542.1 0.0122 0.0132 8.1 0.0244 0.0269 14.1 0.043 0.0467 20.1 0.0141 0.01532.2 0.0123 0.0133 8.2 0.0249 0.0273 14.2 0.0416 0.0451 20.2 0.014 0.01522.3 0.0125 0.0134 8.3 0.0252 0.0277 14.3 0.04 0.0436 20.3 0.0139 0.0152.4 0.0125 0.0135 8.4 0.0256 0.0283 14.4 0.0385 0.0419 20.4 0.0138 0.0152.5 0.0126 0.0136 8.5 0.0261 0.0286 14.5 0.0371 0.0404 20.5 0.0137 0.01482.6 0.0127 0.0137 8.6 0.0264 0.0291 14.6 0.0355 0.0388 20.6 0.0137 0.01482.7 0.0128 0.0139 8.7 0.0269 0.0296 14.7 0.034 0.0372 20.7 0.0135 0.01462.8 0.013 0.0139 8.8 0.0272 0.03 14.8 0.0326 0.0357 20.8 0.0134 0.01452.9 0.013 0.0141 8.9 0.0276 0.0304 14.9 0.031 0.034 20.9 0.0133 0.0144
3 0.0131 0.0141 9 0.0281 0.0309 15 0.0295 0.0325 21 0.0132 0.01433.1 0.0132 0.0143 9.1 0.0295 0.0325 15.1 0.0281 0.0309 21.1 0.0131 0.01413.2 0.0133 0.0144 9.2 0.031 0.034 15.2 0.0276 0.0304 21.2 0.013 0.01413.3 0.0134 0.0145 9.3 0.0326 0.0357 15.3 0.0272 0.03 21.3 0.013 0.01393.4 0.0135 0.0146 9.4 0.034 0.0372 15.4 0.0269 0.0296 21.4 0.0128 0.01393.5 0.0137 0.0148 9.5 0.0355 0.0388 15.5 0.0264 0.0291 21.5 0.0127 0.01373.6 0.0137 0.0148 9.6 0.0371 0.0404 15.6 0.0261 0.0286 21.6 0.0126 0.01363.7 0.0138 0.015 9.7 0.0385 0.0419 15.7 0.0256 0.0283 21.7 0.0125 0.01353.8 0.0139 0.015 9.8 0.04 0.0436 15.8 0.0252 0.0277 21.8 0.0125 0.01343.9 0.014 0.0152 9.9 0.0416 0.0451 15.9 0.0249 0.0273 21.9 0.0123 0.0133
4 0.0141 0.0153 10 0.043 0.0467 16 0.0244 0.0269 22 0.0122 0.01324.1 0.0142 0.0154 10.1 0.0445 0.0483 16.1 0.0241 0.0265 22.1 0.0121 0.0134.2 0.0143 0.0155 10.2 0.0461 0.0498 16.2 0.0237 0.0259 22.2 0.0121 0.0134.3 0.0145 0.0156 10.3 0.0475 0.0515 16.3 0.0232 0.0256 22.3 0.0119 0.01284.4 0.0145 0.0158 10.4 0.049 0.053 16.4 0.0229 0.0251 22.4 0.0118 0.01274.5 0.0146 0.0158 10.5 0.0506 0.0546 16.5 0.0224 0.0246 22.5 0.0117 0.01264.6 0.0147 0.016 10.6 0.0563 0.0604 16.6 0.0221 0.0242 22.6 0.0117 0.01254.7 0.0148 0.016 10.7 0.062 0.0662 16.7 0.0217 0.0238 22.7 0.0115 0.01244.8 0.0149 0.0162 10.8 0.0678 0.072 16.8 0.0212 0.0233 22.8 0.0114 0.01234.9 0.015 0.0163 10.9 0.0735 0.0778 16.9 0.0209 0.0229 22.9 0.0113 0.0122
5 0.0151 0.0164 11 0.0793 0.0835 17 0.0205 0.0224 23 0.0113 0.0125.1 0.0152 0.0165 11.1 0.09 0.0938 17.1 0.0201 0.022 23.1 0.0111 0.0125.2 0.0153 0.0166 11.2 0.1008 0.1039 17.2 0.0197 0.0215 23.2 0.011 0.01185.3 0.0154 0.0168 11.3 0.1115 0.1141 17.3 0.0192 0.0211 23.3 0.0109 0.01175.4 0.0155 0.0168 11.4 0.1223 0.1243 17.4 0.0189 0.0206 23.4 0.0109 0.01165.5 0.0156 0.017 11.5 0.1305 0.1344 17.5 0.0185 0.0202 23.5 0.0107 0.01155.6 0.0157 0.017 11.6 0.2022 0.181 17.6 0.0181 0.0197 23.6 0.0106 0.01145.7 0.0158 0.0172 11.7 0.2128 0.1905 17.7 0.0177 0.0193 23.7 0.0106 0.01135.8 0.0159 0.0173 11.8 0.2918 0.2613 17.8 0.0173 0.0189 23.8 0.0104 0.01115.9 0.016 0.0174 11.9 0.4051 0.3626 17.9 0.0169 0.0184 23.9 0.0103 0.0111
6 0.0161 0.0175 12 0.6991 0.6255 18 0.0165 0.018 24 0.0128 0.011

Draft for Public Comment
New Jersey Stormwater Best Management Practices Manual March 2020 Chapter 5: Stormwater Management Quantity and Quality Standards and Computations Page 23
6. Rainfall Depth for the Stormwater Runoff Water Quality Design Storm: For stormwater runoffquality control, N.J.A.C. 7:8-5.5 requires using 1.25 inches of rain falling nonuniformly in a 2-hourstorm event, which is also known as the Water Quality Design Storm (WQDS).
7. Rainfall Distribution for the NJDEP Water Quality Design Storm: The NRCS rainfall distribution doesnot provide a distribution for the NJDEP Water Quality Design Storm, which can be used to analyzeand design stormwater runoff water quality BMPs based on the Rational, Modified Rational or NRCSmethods. Selection of the appropriate method will depend on the type of BMP selected and itsrequired design data. During its duration, precipitation falls in a nonlinear pattern as depicted inN.J.A.C. 7:8-5.5(a) and in Table 5-4 on the following page. This rainfall pattern or distribution is basedon Trenton, New Jersey rainfall data collected between 1913 and 1975 and contains intermediaterainfall intensities that have the same probability or recurrence interval as the storm’s total rainfalland duration. As such, for times of concentration up to two hours, the stormwater runoff waterquality design storm can be used to compute runoff volumes, peak rates and hydrographs of equalprobability. This ensures that all stormwater runoff water quality BMPs, whether they are based ontotal runoff volume or peak runoff rate, will provide the same level of stormwater pollution control.

Draft for Public Comment
New Jersey Stormwater Best Management Practices Manual March 2020 Chapter 5: Stormwater Management Quantity and Quality Standards and Computations Page 24
Table 5-4: NJDEP 1.25-Inch/2-Hour Stormwater Runoff Water Quality Design Storm Rainfall Distributions

Draft for Public Comment
New Jersey Stormwater Best Management Practices Manual March 2020 Chapter 5: Stormwater Management Quantity and Quality Standards and Computations Page 25
The accumulative distribution curve for rainfall depth, shown below in Figure 5-12, is a graphical representation of 1.25 inches of rainfall falling in the 2-hour Stormwater Runoff Water Quality Design Storm.
Figure 5-12: Stormwater Runoff Water Quality Design Storm Rainfall Accumulative Distribution Curve
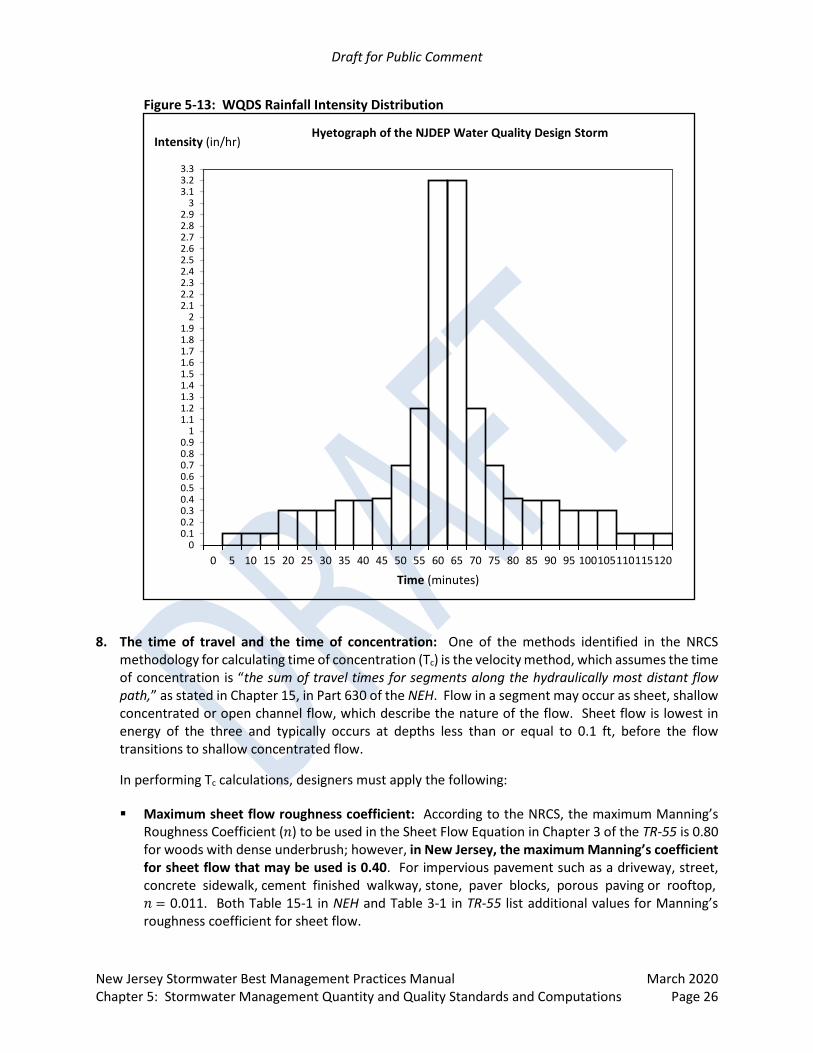
Figure 5-13, shown on the following page, is the intensity of the rainfall distribution derived from Table 5-4.
0
0.1
0.2
0.3
0.4
0.5
0.6
0.7
0.8
0.9
1
1.1
1.2
0 5 10 15 20 25 30 35 40 45 50 55 60 65 70 75 80 85 90 95 100105110115120
Rain
fall
Dept
h (in
ches
)
Time (minutes)
1.25
Draft for Public Comment
New Jersey Stormwater Best Management Practices Manual March 2020 Chapter 5: Stormwater Management Quantity and Quality Standards and Computations Page 26
Figure 5-13: WQDS Rainfall Intensity Distribution
8. The time of travel and the time of concentration: One of the methods identified in the NRCSmethodology for calculating time of concentration (Tc) is the velocity method, which assumes the time of concentration is “the sum of travel times for segments along the hydraulically most distant flowpath,” as stated in Chapter 15, in Part 630 of the NEH. Flow in a segment may occur as sheet, shallowconcentrated or open channel flow, which describe the nature of the flow. Sheet flow is lowest inenergy of the three and typically occurs at depths less than or equal to 0.1 ft, before the flowtransitions to shallow concentrated flow.
In performing Tc calculations, designers must apply the following:
Maximum sheet flow roughness coefficient: According to the NRCS, the maximum Manning’sRoughness Coefficient (𝑛𝑛) to be used in the Sheet Flow Equation in Chapter 3 of the TR-55 is 0.80for woods with dense underbrush; however, in New Jersey, the maximum Manning’s coefficientfor sheet flow that may be used is 0.40. For impervious pavement such as a driveway, street,concrete sidewalk, cement finished walkway, stone, paver blocks, porous paving or rooftop,𝑛𝑛 = 0.011. Both Table 15-1 in NEH and Table 3-1 in TR-55 list additional values for Manning’sroughness coefficient for sheet flow.
00.10.20.30.40.50.60.70.80.9
11.11.21.31.41.51.61.71.81.9
22.12.22.32.42.52.62.72.82.9
33.13.23.3
0 5 10 15 20 25 30 35 40 45 50 55 60 65 70 75 80 85 90 95 100105110115120
Intensity (in/hr)
Time (minutes)
Hyetograph of the NJDEP Water Quality Design Storm

Draft for Public Comment
New Jersey Stormwater Best Management Practices Manual March 2020 Chapter 5: Stormwater Management Quantity and Quality Standards and Computations Page 27
Maximum sheet flow length:
□ For the pre-construction condition, assume sheet flow occurs for 100 ft, unless there issomething physically in contact with the flow of stormwater runoff, such as a swale, curb orinlet, to prevent sheet flow from occurring, i.e., by increasing the depth of flow in excess of0.1 ft, regardless of whether the surface is impervious or pervious.
□ For the post-construction condition, the maximum distance for which flow occurs as sheetflow is 100 ft. The distance over which sheet flow occurs, L, must be calculated using theMcCuen-Spiess limitation as follows:
L = 100 √𝑆𝑆
𝑛𝑛
where 𝑆𝑆 is the slope, in ft/ft, and 𝑛𝑛 is the Manning’s roughness coefficient for sheet flow. If the sheet flow length calculated by the McCuen-Spiess limitation criteria exceeds 100 ft, the sheet flow length must be limited to 100 ft. For an undisturbed area, the sheet flow length will remain same as in the pre-construction condition.
Calculating the travel time for a segment in which sheet flow occurs: According to the NEH, asimplified form of Manning’s kinematic solution is used to compute travel time for sheet flow, asfollows:
Tt = 0.007(𝑛𝑛𝑛𝑛)0.8
(𝑃𝑃2)0.5𝑠𝑠0.4
Calculating the travel time for a segment in which shallow concentrated flow occurs: Shallowconcentrated flow occurs after sheet flow and the depths range from 0.1 to 0.5 ft. For this typeof flow, the average velocity of the flow in the segment must be calculated and then input intothe equation for travel time:
Tt = 𝑆𝑆ℎ𝑎𝑎𝑎𝑎𝑎𝑎𝑎𝑎𝑎𝑎 𝐶𝐶𝑎𝑎𝑛𝑛𝐶𝐶𝐶𝐶𝑛𝑛𝐶𝐶𝐶𝐶𝑎𝑎𝐶𝐶𝐶𝐶𝐶𝐶 𝐹𝐹𝑎𝑎𝑎𝑎𝑎𝑎 𝑛𝑛𝐶𝐶𝑛𝑛𝐿𝐿𝐶𝐶ℎ
𝑉𝑉 𝑥𝑥 3600
where Tt is the travel time (hr) and 𝑉𝑉 is the average flow velocity (ft/s). There is a graphicalsources for 𝑉𝑉 presented in Example 5-1, which begins on Page 34 and includes including guidance on the selection of the appropriate graphical source for the average velocity occurring as shallow concentrated flow.
Calculating the travel time for a segment in which open channel flow occurs: Open channel flowis assumed to occur after shallow concentrated flow and where “either surveyed cross-sectionalinformation has been obtained, where channels are visible on aerial photographs or whereblueline (indicated streams) occur on U.S. Geological Survey (USGS) quadrangle sheets,” per theChapter 15, Part 630 of the NEH, which also includes the equation to be used, along withinformation regarding its application and limitations.
Tc routes: Consideration must be given to the hydraulic conditions that exist along a selected Tc
route, particularly in pre-developed drainage areas. Tc routes should not cross through significantflow constrictions and ponding areas without considering the peak flow and time attenuationeffects of such areas. As noted in the NJDEP Stormwater Management Rules, such areas can occur at hedgerows, undersized culverts, fill areas, sinkholes and isolated ponding areas. In general, a

Draft for Public Comment
New Jersey Stormwater Best Management Practices Manual March 2020 Chapter 5: Stormwater Management Quantity and Quality Standards and Computations Page 28
separate subarea tributary to such areas should be created and its runoff routed through the area before combining with downstream runoff.
For the post-construction condition, except where the review agency determines that the use ofa specifically calculated time of concentration is necessary, instead of using the velocity methodto calculate the time of concentration, it is also acceptable to use 6 minutes for the total time ofconcentration of a drainage area when using the NRCS method to calculate flow rates.
9. Runoff Hydrographs: The NRCS method uses a Unit Hydrograph for runoff incorporated with theNRCS rainfall distributions (NOAA_C and NOAA_D for New Jersey) to develop a Dimensionless UnitHydrograph. Runoff is transformed into a hydrograph by using unit hydrograph theory and routingprocedures that depend on runoff travel time through segments of the watershed. In developmentof the runoff hydrograph, the runoff discharge is nonlinear in relation to the time of the rain event inaccordance with NRCS observations from many natural unit hydrographs developed from watershedsvarying widely in size and geographical locations. A dimensionless unit hydrograph was developedwhich has a peak rate factor of 484, which means that 48.4% of the total runoff volume is dischargedbefore the peak time and 51.6% of the total runoff volume is discharged after the peak time. Thedimensionless unit hydrograph having a 484 peak rate factor is normally called the “SCS StandardDimensionless Unit Hydrograph (DUH).”
Therefore, it developed an alternative DUH for the DelMarVa region (which corresponds to theDelaware, Maryland and Virginia peninsula), where coastal, flat areas that have an average watershed slope less than 5 percent, with low topographic relief and significant surface storage in swales anddepressions are found. NRCS call it the “DelMarVa DUH,” which as a peak rate factor of 284. Underthe DelMarVa DUH, not only the amount of runoff volume discharged before the peak time is smaller- 24.8% of the total volume - but also the length of time under the runoff curve is prolonged.Therefore, by using the DelMarVa DUH, the peak flow rate of runoff will be smaller and the entirerunoff routing time will be longer. The graph on the following page illustrates the differences between the 484 DUH and the DelMarVa DUH.

Draft for Public Comment
New Jersey Stormwater Best Management Practices Manual March 2020 Chapter 5: Stormwater Management Quantity and Quality Standards and Computations Page 29
Figure 5-14: NRCS Standard DUH (484 DUH) versus the DelMarVa DUH
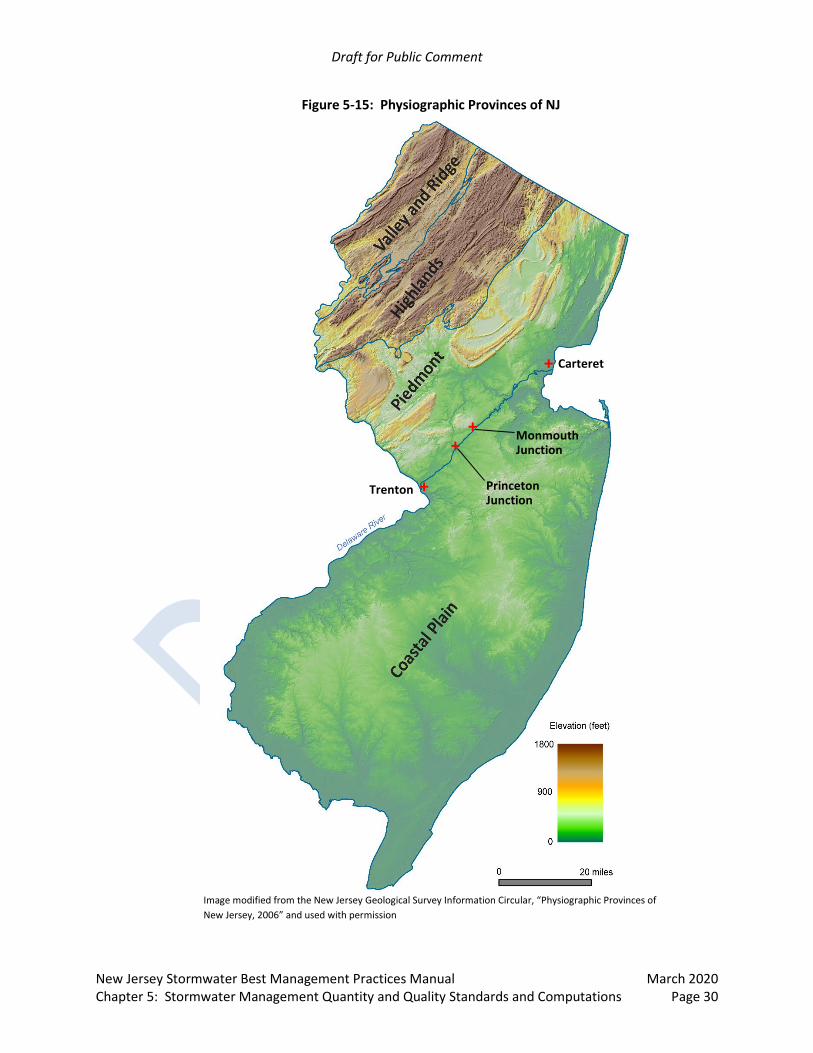
The DelMarVa DUH mmust be used in modeling watersheds in the Coastal Plain Region of New Jersey “that are characterized by flat topography (average watershed slope less than 5 percent), low relief and significant surface storage in swales and depressions.” The physiographic provinces of New Jersey are depicted in Figure 5-15, which may be found on the next page. For developed sites or heavily urbanized areas in the Coastal Plain of New Jersey, care should be taken to determine whether the use of the DelMarVa Unit Hydrograph is consistent with the conditions above. Also note that the same type of DUH must be used in the pre- and post-development hydrograph.
Take note that the DelMarVa DUH cannot be used in sizing Manufactured Treatment Devices, even if the site is located in the geographical area where the NRCS recommends application of DelMarVa DUH.
SCS
DelMarVa
Draft for Public Comment
New Jersey Stormwater Best Management Practices Manual March 2020 Chapter 5: Stormwater Management Quantity and Quality Standards and Computations Page 30
Figure 5-15: Physiographic Provinces of NJ
Image modified from the New Jersey Geological Survey Information Circular, “Physiographic Provinces of New Jersey, 2006” and used with permission
+ Trenton
+
+ +
Carteret
Monmouth Junction
Princeton Junction

Draft for Public Comment
New Jersey Stormwater Best Management Practices Manual March 2020 Chapter 5: Stormwater Management Quantity and Quality Standards and Computations Page 31
10. Directly Connected Impervious Cover: Impervious surfaces are considered directly connected if theimpervious surface meets one of the conditions listed below:
a. Runoff from the impervious surface flows directly into the drainage system, water bodies andriparian zones or wetlands.
b. Runoff is shallow concentrated flow that runs over a pervious area and then into the drainagesystem, water bodies and riparian zones or wetlands.
Figure 5-16: Directly Connected Impervious Surfaces
Shown above are examples of directly connected impervious surfaces, which include, but are not limited to, runoff from an impervious surface
collected by a storm drain, which then connects to a conduit or channel to a downstreamBMP, stormwater collection system or stream or
flowing over a pervious surface by shallow concentrated flow or channelized flow and theninto a channel to a down-gradient stream or other flowing water body.
The Stormwater Management rules at N.J.A.C. 7:8-5.7 requires that the design engineer shall consider the relative stormwater runoff rates and/or volumes of pervious and impervious surfaces separately to accurately compute the rates and volume of stormwater runoff from the site in computing stormwater runoff from all design storms. Therefore, when the site has directly connected impervious surface, the runoff volume and peak flow rate from impervious surface and pervious surface shall be modelled individually.
If the runoff from an impervious surface and from a pervious surface will converge into one point of analysis, such as stormwater BMP or stormwater conveyance system, the runoff volumes from impervious surface and pervious surface, each calculated separately, can be added together to obtain the total runoff volume. For peak flow modeling, since the time of the peak flow for runoff from impervious surface may not be at the same time as that from the pervious surface within a sub-drainage area, the two peak flow rates must not be simply added together. Instead, a composite hydrograph must be created by adding the separate runoff hydrographs from the impervious surface and the pervious surface, from which the overall peak flow rate can be determined.
11. Unconnected Impervious Cover: As described in detail in Chapter 2: Low Impact DevelopmentTechniques, an important nonstructural BMP is new impervious cover that is not directly connectedto a site’s drainage system. Instead, runoff from these impervious areas must undergo sheet flowonto adjacent pervious areas, where a portion of the impervious area runoff is given an opportunityto infiltrate into the soil. Under certain conditions described on the following page, this can help
Concentrated Flow Directed to Down-gradient Stream
Connected to Down-gradient BMP
Connected to Stormwater Collection System

Draft for Public Comment
New Jersey Stormwater Best Management Practices Manual March 2020 Chapter 5: Stormwater Management Quantity and Quality Standards and Computations Page 32
provide both groundwater recharge and stormwater quality treatment for small rainfall events as well as reduce the overall runoff volume that must be treated and/or controlled in a down-gradient BMP.
Figure 5-17: Unconnected Impervious Surfaces
An impervious area can be considered to be an unconnected impervious surface only when meeting all of the following conditions:
a. Upon entering the down-gradient pervious area, all runoff must remain as sheet flow.
b. Flow from the impervious surface must enter the down-gradient pervious area as sheet flowor, in the case of roofs, from one or more downspouts, each equipped with a splash pad, levelspreader or dispersion trench that reduces flow velocity and induces sheet flow in the down-gradient pervious area.
c. All discharges onto the down-gradient pervious surfaces must be stable and non-erosive.
d. The shape, slope and vegetated cover in the down-gradient pervious area must be sufficientto maintain sheet flow throughout its length.
e. The maximum slope of the down-gradient pervious area is 8 percent.
In accordance with N.J.A.C. 7:8-5.7(a)4, calculation of runoff from unconnected impervious cover, urban impervious area modifications as described in the NRCS Technical Release-55, Urban Hydrology for Small Watersheds or other methods may be employed. Computation of the resultant runoff from unconnected impervious areas can be performed using two different methods: the unconnected impervious area method by NRCS TR-55 or the Two-Step Method. Both methods require the following conditions to be met:
a. Only the portions of the impervious surface and the down-gradient pervious surface on which sheet flow occurs can be considered as an unconnected surface in the calculation. The areabeyond the maximum sheet flow path length cannot be considered in the calculation.
b. The maximum sheet flow path length across the unconnected impervious surface is 100 ft.
c. The minimum sheet flow length across the down-gradient pervious surface is 25 ft in order tomaintain the required sheet flow state of the runoff.
d. The NRCS TR-55 unconnected impervious area method can be used only when the totalimpervious surface is less than 30 percent of the receiving down-gradient pervious surface.
Example 5-2 uses the TR-55 unconnected impervious area method. See Page 37.
Sheet Flow Directed to Down-gradient Stream
Sheet Flow Directed to Down-gradient Grass Swale
Impervious Surface

Draft for Public Comment
New Jersey Stormwater Best Management Practices Manual March 2020 Chapter 5: Stormwater Management Quantity and Quality Standards and Computations Page 33
NRCS Methodology Examples
The following examples illustrate how to use the NRCS Methodology to calculate the time of concentration and the stormwater runoff volume generated by an unconnected impervious surface using the CN Method and the NJDEP Two-Step Method for calculating the stormwater runoff volume generated by an unconnected impervious surface flowing onto a pervious surface. The method used in Example 5-4 must not be used and is provided to illustrate why composite hydrographs are not permitted. Example 5-5 compares the pre- and post-condition hydrographs produced by a project in which impervious coveris reduced.
Example No. Scenario Description
Page No.
5-1 Calculate of Time of Concentration 34
5-2 Use the NRCS CN Method for an Unconnected Impervious Surface to Calculate the Runoff Volume for a Site
37
5-3 Use the NJDEP Two-Step Method for an Unconnected Impervious Surface to Calculate the Runoff Volume for a Site
39
5-4 Demonstration of Why a Composite CN Generates an Incorrect Runoff Volume 40
5-5 A Comparison of Pre- and Post-condition Hydrographs for Compliance Under N.J.A.C. 7:8-5.6(b)2 When Impervious Cover is Reduced
42
Additional examples, 5-6 and 5-7, illustrating the Rational and Modified Rational Methodology, are found on Pages 51 and 52, respectively.
Finally, Example 5-8A and B, which begin on Page 56, illustrates designing a site with two points of discharge and then comparing the results to a similar site with a single converged discharge. This example includes both exfiltration in the routing calculations as a means of discharge and the use of the Hantush Spreadsheet to demonstrate the redesign process when groundwater mounding negatively impacts a BMP. Details on using the Hantush Spreadsheet, along with additional examples and a discussion of the acceptable range for input parameters, is found in Chapter 13: Groundwater Table Hydraulic Impact Assessments for Infiltration BMPs.

Draft for Public Comment
New Jersey Stormwater Best Management Practices Manual March 2020 Chapter 5: Stormwater Management Quantity and Quality Standards and Computations Page 34
Example 5-1: Calculate Time of Concentration
For the post-construction condition, stormwater runoff flows through a wooded drainage area along a flow path, measuring 1,000 ft in length, consisting of sheet flow over an area with a 0.5% slope and shallow concentrated flow over an area of 1% slope. Calculate the time of concentration for the post-construction condition.
Step 1: In this example, there are only 2 different segments of flow. Travel time under sheet flow is calculated as follows:
Tt = 0.007(𝑛𝑛𝑛𝑛)0.8
(P2)0.5 s0.4 where:
Tt = travel time, hr 𝑛𝑛 = Manning’s roughness coefficient for sheet flow L = sheet flow length, ft P2 = 2-year, 24-hour rainfall, in 𝑠𝑠 = slope of land surface, ft/ft
The sheet flow length is calculated by using the formula from the McCuen-Spiess limitation criterion:
L = 100 √𝑆𝑆
𝑛𝑛
The values for the Manning’s roughness coefficient can also be found in Table 3-1 in TR-55, which is shown to the right. Values for Manning’s roughness coefficient must be selected in accordance with the land surface condition. The maximum value that can be used for woods, in New Jersey, is 0.40.

Draft for Public Comment
New Jersey Stormwater Best Management Practices Manual March 2020 Chapter 5: Stormwater Management Quantity and Quality Standards and Computations Page 35
The 2-year 24-hour rainfall depth, outlined in red in the table to the right, is obtained from the NOAA Precipitation Frequency Server website, as shown on Page 16, in “Step 4” of the example that begins on Page 14.
Using the McCuen-Spiess limitation, the length over which sheet flow occurs is calculated to be:
L = 100 √0.005
0.4 = 17.68 ft
The travel time is then calculated entering the appropriate values into the equation:
Tt = 0.007[(0.40)(17.68)]0.8
(3.33)0.5(0.005)0.4
= 0.153 hr = 9.18 min
Step 2: Travel time under shallow concentrated flow is calculated as follows:
Tt = 𝑆𝑆ℎ𝑎𝑎𝑎𝑎𝑎𝑎𝑎𝑎𝑎𝑎 𝐶𝐶𝑎𝑎𝑛𝑛𝐶𝐶𝐶𝐶𝑛𝑛𝐶𝐶𝐶𝐶𝑎𝑎𝐶𝐶𝐶𝐶𝐶𝐶 𝐹𝐹𝑎𝑎𝑎𝑎𝑎𝑎 𝑛𝑛𝐶𝐶𝑛𝑛𝐿𝐿𝐶𝐶ℎ
𝑉𝑉 𝑥𝑥 3600
where Tt is the travel time (hr) and 𝑉𝑉 is the flow velocity (ft/s).
The total flow path length is 1,000 ft. Since the sheet flow segment length is 17.68 ft, the length of the shallow concentrated flow segment must be 982.32 ft. The value for the flow velocity can be determined from the graphical source from NEH. The velocities plotted in each are average values and are a function of watercourse slope and the cover condition of the channel.
The graphical source, reprinted on the following page, is Figure 15-4 in Chapter 15 of Part 630 in the NEH. This source was derived by solving Manning’s equation for a wide variety of land covers.

Draft for Public Comment
New Jersey Stormwater Best Management Practices Manual March 2020 Chapter 5: Stormwater Management Quantity and Quality Standards and Computations Page 36
For this example, a horizontal line is projected across from the y-axis at the tic mark denoting the 1% slope to the curved representing forested areas. The corresponding velocity is 0.25 ft/s. This value is then entered into the equation for the travel time, as follows:
Tt = 982.32
0.25 𝑥𝑥 3600= 1.09 hr = 65.5 min
Step 3: Since no channel flow is specified in the example, the time of concentration for the post-construction condition is the sum of the travel times under sheet flow and shallow concentrated flow, as follows:
Tc = 9.18 + 65.5 = 74.7 min, using Figure 15-4

Draft for Public Comment
New Jersey Stormwater Best Management Practices Manual March 2020 Chapter 5: Stormwater Management Quantity and Quality Standards and Computations Page 37
Example 5-2: Use the NRCS CN Method for an Unconnected Impervious Surface to calculate the runoff volume for a site
A portion of a major development consists of a 200 ft wide, 25 ft long impervious surface and a 200 ft wide, 75 ft long grass lawn adjacent to the impervious surface. The stormwater runoff generated by the impervious surface will flow through the lawn area before it drains into the grass swale. The soils present are identified as HSG ‘A.’ The design storm event of concern is the 2-year storm, in which 3.5 inches of rain falls during a period of 24 hours. The slope of the impervious surface and the grass lawn area are each at 1%. From Table 2-2a, in the TR-55 manual, a lawn area in HSG ‘A’ soil has a Curve Number of 39, under good condition.
Step 1: Calculate the Percentage of Total Impervious Surface
To use the appropriate TR-55 figure, one must first know the percentage of the total impervious area to the total area. The percentage of the impervious surface to the total area is
= (200 ft 𝑥𝑥 25 ft)/((200 ft 𝑥𝑥 25 ft) + (200 ft 𝑥𝑥 75 ft)) = 0.25 = 25%
Since this percentage is less than the 30% maximum allowed (see the text at the bottom of Page 32), the NRCS composite CN with unconnected impervious area method is applicable.
Step 2: Ratio of Unconnected Impervious Surface to Total Impervious Surface
Secondly, one must determine the ratio of unconnected impervious surface to total impervious surface. In this case, all of the impervious surface present is the unconnected impervious surface under consideration; therefore, the ratio of unconnected impervious surface to total impervious surface is 1.
Step 3: Determine the Composite CN Representing Both the Unconnected Impervious and the Down-gradient Pervious Areas from the Pervious Area CN using TR-55, Figure 2-4
Starting with the right side of Figure 2-4, reprinted on the following page, find the intersection of the total impervious area with the line representing the ratio of unconnected impervious to total impervious. Draw a horizontal line across to intersect with the appropriate line representing the CN value of the site’s pervious area. In this example, the lawn has a CN = 39, so the line for CN = 40 is used. A vertical line is next drawn down to connect with the x-axis to establish the composite CN value for the site, which is 47. Take care reading the x-axis as the values increase from right to left.
Sheet Flow = 25 ft impervious + 75 ft pervious
GrassSwale

Draft for Public Comment
New Jersey Stormwater Best Management Practices Manual March 2020 Chapter 5: Stormwater Management Quantity and Quality Standards and Computations Page 38
Therefore, a Curve Number = 47 can be used to represent the entire area measuring 200 ft wide and 100 ft long.
Source: Figure 2-4, Urban Hydrology for Small Watersheds, Second Edition, June 1986
Step 4: Use the Composite CN from Step 3 in the Runoff Depth Calculation
The runoff will be calculated by the equation in Chapter 2 of TR-55 as
𝑄𝑄 = (𝑃𝑃−0.2𝑆𝑆)2
(𝑃𝑃+0.8𝑆𝑆)where:
Q = runoff, in P = rainfall, in
S = 1000𝐶𝐶𝐶𝐶
−10 =100047
−10 = 11.3, using the CN value determined in “Step 3”
Therefore,
𝑄𝑄 = (3.5−0.2 𝑥𝑥 11.3)2
(3.5+0.8 𝑥𝑥 11.3)
= (1.24)2
(12.5) = 0.123 in
Step 5: Calculate the Total Runoff Volume Generated by the Entire Area
The total runoff volume generated by the impervious surface and the lawn area is
= 0.123 𝑖𝑖𝑛𝑛 𝑥𝑥 1 𝑓𝑓𝐶𝐶12 𝑖𝑖𝑛𝑛
x 200 𝑓𝑓𝑓𝑓 𝑥𝑥 (25 𝑓𝑓𝑓𝑓 + 75 𝑓𝑓𝑓𝑓) = 205 cf
25 47

Draft for Public Comment
New Jersey Stormwater Best Management Practices Manual March 2020 Chapter 5: Stormwater Management Quantity and Quality Standards and Computations Page 39
Example 5-3: Use the NJDEP Two-Step Method for an Unconnected Impervious Surface to Calculate the Runoff Volume for a Site
As can be surmised from the name, this method requires a two-step technique using the initial abstraction provided by NRCS runoff equation. First the volume of runoff generated by just the impervious area is calculated and then this volume is considered as if it were additional rain falling on the pervious area.
Step 1: Calculate Runoff Volume from Impervious Area
Use the NRCS runoff equation in a manner similar to the technique described in the previous example for impervious surfaces. For Curve Number 98:
𝑄𝑄 = (𝑃𝑃−0.2𝑆𝑆)2
(𝑃𝑃+0.8𝑆𝑆)where: P = rainfall, in = 3.5 in
S = 1000𝐶𝐶𝐶𝐶
−10 = 100098
−10 = 0.20
Therefore,
𝑄𝑄 = (3.5−0.2 𝑥𝑥 0.20)2
(3.5+0.8 𝑥𝑥 0.20) = 3.27 in
The runoff volume generated by the impervious surface is calculated as above:
= 3.27 𝑖𝑖𝑛𝑛 𝑥𝑥 1 𝑓𝑓𝐶𝐶12 𝑖𝑖𝑛𝑛
x 200 𝑓𝑓𝑓𝑓 𝑥𝑥 25 𝑓𝑓𝑓𝑓 = 1,362.5 cf
Step 2: Convert the Runoff from the Impervious Surface to a Hypothetical Rainfall on the Pervious Area
Assume the entire runoff volume from “Step 1,” i.e., 1,362.5 cf, is evenly distributed as rain falling on the adjacent pervious surface. The converted rainfall depth is calculated as follows:
=(1,362.5 𝐶𝐶𝑓𝑓 𝑥𝑥 12 𝑖𝑖𝑖𝑖
1 𝑓𝑓𝑓𝑓 )
(200 𝑓𝑓𝐶𝐶 𝑥𝑥 75 𝑓𝑓𝐶𝐶) = 1.09 in
Sheet Flow = 25 ft impervious + 75 ft pervious
GrassSwale

Draft for Public Comment
New Jersey Stormwater Best Management Practices Manual March 2020 Chapter 5: Stormwater Management Quantity and Quality Standards and Computations Page 40
Note that only the sheet flow area (the area within the maximum 100 ft of flow path on the pervious surface) can be used to receive runoff from the impervious surface. The total effective rainfall on the pervious surface is equal to the direct rainfall plus the unconnected impervious area runoff that was converted above to a hypothetical rainfall depth. This means 1.09 in is added to the design rainfall depth (3.5 in), resulting in a total rainfall depth of 4.59 in. The runoff generated by the grass lawn is then calculated using the runoff equation with this new value substituted for P, as follows:
S = 1000𝐶𝐶𝐶𝐶
−10 = 100039
−10 = 15.64
Q = (4.59−0.2 𝑥𝑥 15.64)2
(4.59+0.8 𝑥𝑥 15.64) = 0.125 in
The total effective runoff volume generated is calculated as follows:
= 0.125 𝑖𝑖𝑛𝑛 𝑥𝑥 1 𝑓𝑓𝐶𝐶12 𝑖𝑖𝑛𝑛
x 200 𝑓𝑓𝑓𝑓 𝑥𝑥 75 𝑓𝑓𝑓𝑓 = 156 cf Example 5-4: Demonstration of Why a Composite CN Generates an Incorrect Runoff Volume
This example demonstrates the incorrect calculation of runoff volume by weighted CNs when the impervious surface is directly connected to the stormwater conveyance system. A portion of a major development consists of a 200 ft wide, 25 ft long impervious surface and a 200 ft wide, 75 ft long grass lawn area that are separated by a grass swale. In other words, the runoff from the impervious surface will flow directly into the grass swale. The soil is identified as belong to HSG ‘A.’ The storm event of concern is the 2-year storm, in which 3.5 in of rain falls over a period of 24 hours. The slopes of the impervious surface and the grass lawn are each 1%. From Table 2-2a in TR-55, the grass lawn area specified has a Curve Number of 39.
GrassSwale
75 ft Pervious Area Sheet Flow 25 ft Impervious
Area Sheet Flow

Draft for Public Comment
New Jersey Stormwater Best Management Practices Manual March 2020 Chapter 5: Stormwater Management Quantity and Quality Standards and Computations Page 41
A value of 98 is used as the CN value for impervious surfaces. If a weighted composite CN were applied in this situation, the weighted composite CN would be calculated as follows:
𝐶𝐶𝐶𝐶 = 98 𝑥𝑥 (200 𝑓𝑓𝐶𝐶 𝑥𝑥 25 𝑓𝑓𝐶𝐶) + 39 𝑥𝑥 (200 𝑓𝑓𝐶𝐶 𝑥𝑥 75 𝑓𝑓𝐶𝐶)
(200 𝑓𝑓𝐶𝐶 𝑥𝑥 25 𝑓𝑓𝐶𝐶) + (200 𝑓𝑓𝐶𝐶 𝑥𝑥 75 𝑓𝑓𝐶𝐶) = 53.75
S = 1000𝐶𝐶𝐶𝐶
−10 = 100053.75
−10 = 8.60
𝑄𝑄 = (3.5−0.2 𝑥𝑥 8.60)2
(3.5+0.8 𝑥𝑥 8.60) = 0.305 in
The total runoff volume would then be calculated as follows:
= 0.305 𝑖𝑖𝑛𝑛 𝑥𝑥 1 𝑓𝑓𝐶𝐶12 𝑖𝑖𝑛𝑛
𝑥𝑥 200 𝑓𝑓𝑓𝑓 𝑥𝑥 100 𝑓𝑓𝑓𝑓 = 508 cf. To demonstrate why this is incorrect, the total runoff volume for each area is calculated separately and then added.
For the impervious area,
S = 0.204 and
Q = 3.27 in, as calculated previously in “Step 1” of Example 5-3.
The runoff volume generated by the impervious area was previously calculated to be 1,362.5 cf (see Page 39).
For the pervious surface,
S = 1000𝐶𝐶𝐶𝐶
−10 = 100039
−10 = 15.64
𝑄𝑄 = (3.5−0.2 𝑥𝑥 15.64)2
(3.5+0.8 𝑥𝑥 15.64) = 0.009 in
which results in a runoff volume generated by the pervious area as follows:
= 0.009 𝑖𝑖𝑛𝑛 𝑥𝑥 1 𝑓𝑓𝐶𝐶12 𝑖𝑖𝑛𝑛
x 200 𝑓𝑓𝑓𝑓 𝑥𝑥 75 𝑓𝑓𝑓𝑓 = 10.8 cf
Adding these separately calculated volumes together yields the total runoff volume entering the grass swale equal to 1,373.3 cf. The previous, i.e. composite, calculation is only 37% of this volume.
The results show that the use of a weighted, or composite, CN in which pervious and impervious CN values are averaged will underestimate the runoff volume. Therefore, the use of weighted or composite CN values must not be used.

Draft for Public Comment
New Jersey Stormwater Best Management Practices Manual March 2020 Chapter 5: Stormwater Management Quantity and Quality Standards and Computations Page 42
Example 5-5: A Comparison of Pre- and Post-condition Hydrographs for Compliance Under N.J.A.C. 7:8-5.4(a)3.i When Impervious Cover is Reduced
N.J.A.C. 7:8-5.4(a)3.i requires the design engineer choosing this option to demonstrate compliance with the quantity control requirements “through hydrologic and hydraulic analysis that for stormwater leaving the site, post-construction runoff hydrographs for the two-, 10- and 100-year storm events do not exceed, at any point in time, the pre-construction runoff hydrographs for the same storm events.” This example provides a scenario showing noncompliance with the requirements when the proposed development reduces impervious surface.
An approximately 2 acre paved parking lot is to be redeveloped as an office complex consisting of a 0.5 acre new building, a 1.25 acre parking lot and 0.25 acre landscaped area. The existing lot is 300 ft x 300 ft with a slope of 1% from the north edge of the lot to the south edge of the lot. The runoff under existing conditions is as overland flow from the north side to the south side. The runoff generated by the proposed building is to be collected by a roof drainage system and directed via a downspout to the proposed parking lot where it will spread out as overland flow. The parking lot runoff is to remain as overland flow, but it will re-graded to be 5% slope for better drainage. The landscaped area is located on the north, east and west sides of the proposed development. The landscaped area will not receive runoff from the impervious surfaces. The precipitation depth in this example uses the county average rainfall depth for Mercer County.
The pre-construction drainage pattern consists of sheet flow for the first 100 ft, followed by shallow concentrated flow for 200 ft. For pavement, the value for Manning’s roughness coefficient is 0.011, as shown in Table 3-1, in TR-55, and reprinted on Page 34. Rainfall depths for the 2-, 10- and 100-year storms are 3.31, 5.01 and 8.33 in, respectively.
The post-construction drainage pattern remains the same as the existing condition, i.e., flowing from the north to the south. The slope, however, is increased from 1% to 5%. The sheet flow length calculated by McCuen-Spiess limiting criteria exceeds 100 ft. Therefore, the sheet flow length must be limited to the maximum of 100 ft and therefore, the shallow concentrated flow length is 200 ft. However, the time of concentration is shorter due to the increased slope.
Building
Landscaped Area
Existing Condition Proposed Condition
Paved Area
N
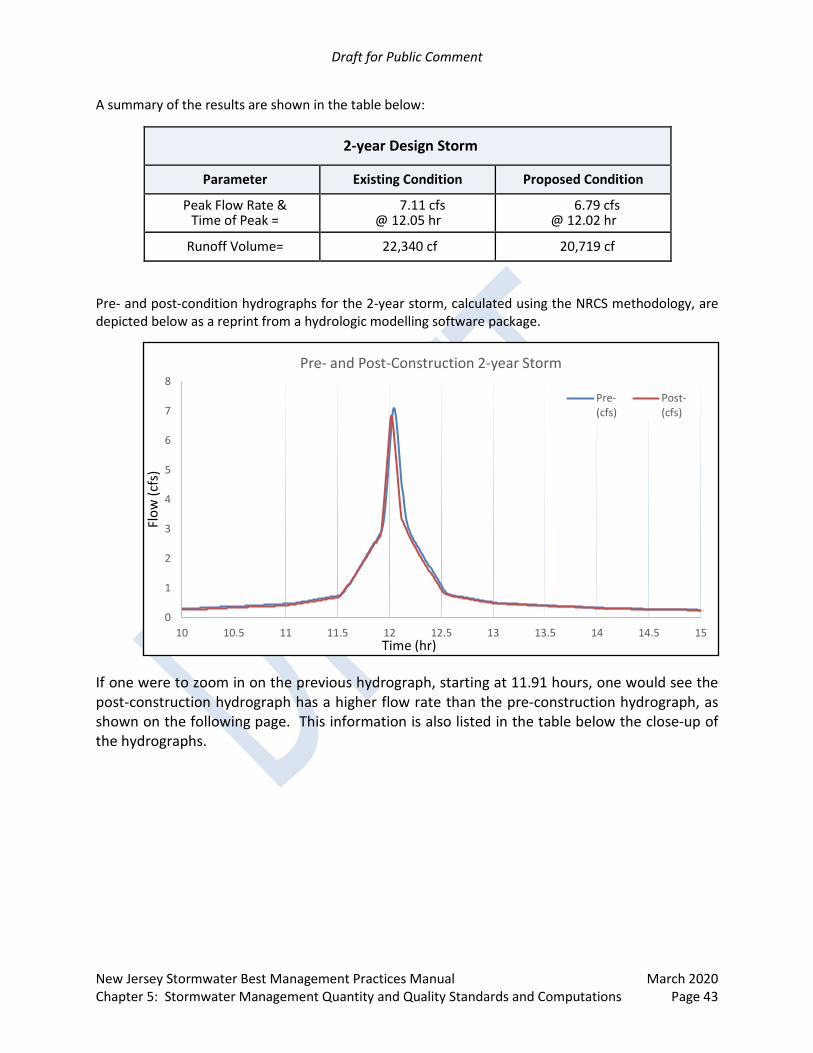
Draft for Public Comment
New Jersey Stormwater Best Management Practices Manual March 2020 Chapter 5: Stormwater Management Quantity and Quality Standards and Computations Page 43
A summary of the results are shown in the table below:
2-year Design Storm
Parameter Existing Condition Proposed Condition
Peak Flow Rate & Time of Peak =
7.11 cfs @ 12.05 hr
6.79 cfs @ 12.02 hr
Runoff Volume= 22,340 cf 20,719 cf
Pre- and post-condition hydrographs for the 2-year storm, calculated using the NRCS methodology, are depicted below as a reprint from a hydrologic modelling software package.
If one were to zoom in on the previous hydrograph, starting at 11.91 hours, one would see the post-construction hydrograph has a higher flow rate than the pre-construction hydrograph, as shown on the following page. This information is also listed in the table below the close-up of the hydrographs.
0
1
2
3
4
5
6
7
8
10 10.5 11 11.5 12 12.5 13 13.5 14 14.5 15
Pre- and Post-Construction 2-year Storm
Pre-(cfs)
Post-(cfs)
Time (hr)
Flow
(cfs
)

Draft for Public Comment
New Jersey Stormwater Best Management Practices Manual March 2020 Chapter 5: Stormwater Management Quantity and Quality Standards and Computations Page 44
Time (hr)
Pre-construction (cfs)
Post-construction (cfs)
Difference in Flow Rate, Pre – Post, (cfs)
11.91 2.86 2.79 0.07
11.92 2.93 2.98 -0.05
11.93 3.04 3.31 -0.27
11.94 3.22 3.70 -0.48
11.95 3.49 4.12 -0.63
11.96 3.84 4.55 -0.71
11.97 4.23 4.98 -0.75
11.98 4.66 5.41 -0.75
11.99 5.12 5.85 -0.73
12.00 5.58 6.29 -0.71
12.01 6.06 6.70 -0.64
12.02 6.51 6.79 -0.28
12.03 6.88 6.69 0.19
Although the reduction of impervious surface reduces the total volume of runoff and peak flow rate produced by the proposed construction, the design is not in compliance with N.J.A.C. 7:8-5.6(b)2 which requires that the post-construction runoff hydrographs do not exceed, at any point in time, the pre-construction runoff hydrographs for the same storm events, if the design engineer chooses to
2.5
3
3.5
4
4.5
5
5.5
6
6.5
7
11.91 11.93 11.95 11.97 11.99 12.01 12.03
Pre- and Post-Construction 2-year StormPre-(cfs)
Post-(cfs)
Time (hr)
Flow
(cfs
)

Draft for Public Comment
New Jersey Stormwater Best Management Practices Manual March 2020 Chapter 5: Stormwater Management Quantity and Quality Standards and Computations Page 45
demonstrate the quantity control using this option. Since the hydrographs for the 2-year storm have already shown noncompliance, this example does not continue to calculate hydrographs for the 10- and 100-year storms.
If the design engineer chooses to demonstrate compliance with the quantity control requirements under N.J.A.C. 7:8-5.4(a)3.iii, e.g., that the post-construction peak runoff rates for the 2-, 10- and 100-year storm events are 50, 75 and 80 percent, respectively, of the pre-construction peak runoff rates, the calculation of the 2-year storm will be as follows:
Design Storm: 2-year
Existing Allowable Post-Construction (50% Reduction)
Proposed
Peak Flow Rate = 7.11 cfs 3.56 cfs 6.79 cfs
The 2-year post-construction peak flow rate, 6.79 cfs, exceeds the allowable flow rate, 3.56 cfs. Therefore, the project is still not in compliance with the stormwater runoff quantity control requirement under the option found in N.J.A.C. 7:8-5.4(a)3.iii. A stormwater runoff quantity control or green infrastructure BMP will be required to reduce the post-construction peak flow to 50%, or lower, of the pre-construction peak flow rate.
This example dispels the common misconception that the reduction of impervious surface will automatically meet the quantity control requirements. Municipal review engineers must require that the design report include hydrologic modelling and hydrographs even when the design engineer claims there is reduction of impervious surface by the proposed development.

Draft for Public Comment
New Jersey Stormwater Best Management Practices Manual March 2020 Chapter 5: Stormwater Management Quantity and Quality Standards and Computations Page 46
Rational Method
The Rational method is a tool for estimating peak runoff flowrate from small drainage area not greater than 20 acres. The equation for the rational method is expressed below:
Qp = CiA
where: Qp = peak flow rate (cfs) C = runoff coefficient (Dimensionless), which describes the level of imperviousness of the drainage
area and reflect the ability of a soil to infiltrate precipitation before excess precipitation becomes stormwater runoff and sometimes the slope of the drainage area
i = uniform rate of rainfall intensity for a rainfall duration longer or equal to the time of concentration Tc (in/hr)
A = drainage area (ac) Note that the rational equation may not appear to be dimensionally correct in that although i is specified in inches per hour, 1 in/hr equals 1.008 cfs per acre, and in using this equation, the two are taken to be numerically equal, meaning no conversion factor is required. Runoff Coefficients
Pervious drainage areas typically have low values for their respective runoff coefficients, and impervious areas have runoff coefficients much closer to a value of 1. Unlike Curve Numbers published by NRCS, runoff coefficients can be obtained from many field studies or authoritative agencies. One source of a comprehensive table for runoff coefficients is the runoff coefficient table in Design and Construction of Sanitary and Storm Sewers, Manuals and Reports on Engineering Practice No. 37, American Society of Civil Engineers (ASCE), 1969. Other authorities such as transportation departments or environmental departments of other states may also publish their reference tables of runoff coefficients. However, some of these publications do not consider the HSG and/or land cover, which are two important factors affecting the amount of infiltration and retention of precipitation before excessive precipitation becomes runoff. Therefore, it is recommended that designers use the runoff coefficients listed on the following page in Table 5-5.

Draft for Public Comment
New Jersey Stormwater Best Management Practices Manual March 2020 Chapter 5: Stormwater Management Quantity and Quality Standards and Computations Page 47
Table 5-5: Runoff Coefficients for Rational Method
Drainage Area Size and Land Cover Limitations
As previously mentioned on Page 9, there are some basic assumptions when applying the Rational Method. The maximum size limit for a drainage area is 20 ac. The drainage area must also have homogeneous land cover and topography. Furthermore, the rainfall distribution on a drainage area is assumed to be uniform over the entire drainage area.
Sites with Pervious and Directly Connected Impervious Cover
Due to the linear character of the Rational Method equation, a representative Rational Runoff Coefficient (C) can be computed for the entire site by standard area weighting techniques.

Draft for Public Comment
New Jersey Stormwater Best Management Practices Manual March 2020 Chapter 5: Stormwater Management Quantity and Quality Standards and Computations Page 48
Sites with Unconnected Impervious Cover
Due to the basic nature of the Rational Method equation, there is currently no technique for addressing the effects of unconnected impervious cover. As such, neither the Rational nor Modified Rational Methods can be recommended at this time for use at sites with unconnected impervious areas. Calculations should be completed using the NRCS method, as previously discussed.
Time of Concentration
Although time of concentration is not an input factor in the equation, as mentioned above, the rainfall intensity in the equation is related to the choice of the time of concentration. Therefore, the time of concentration must be calculated using Manning’s equation for sheet flow, based on the limitations for the maximum length of sheet flow established on Page 27. The equation for shallow concentrated flow in TR-55 can be used for the travel time of shallow concentrated flow. However, unlike the NRCS method, the minimum value for time of concentration in the Rational Method is 5 minutes due to the lowest duration of precipitation that is available for rainfall intensity data is also 5 minutes.
Rainfall Intensity for Stormwater Runoff Quantity Calculation
The rainfall intensity used in the equation is the uniform rate of rainfall intensity for durations equal to the time of concentration. In the Rational Method, the intensity of a specific duration for a particular recurrence year of storm can also be obtained from NOAA’s Precipitation Frequency (PF) Estimates. On the NOAA Precipitation Frequency Data Server, the Data Type to be selected is precipitation intensity and the Time Series Type is partial duration, as shown in in the image below.
After selecting the location, the Precipitation Frequency Estimates provide a table of the intensity of precipitation in respect to the average recurrence interval of the storm and the duration. The duration referenced in the table is equal to the time of concentration. For example, if the time of concentration is 15 minutes, the intensities for the 2-, 10- and 100 year design storms located in the PF tabular table correspond to the values found in the row for a duration of 15-min, which are outlined in red in the table on the following page and read 3.28, 4.38 and 5.72 in/hr, respectively.
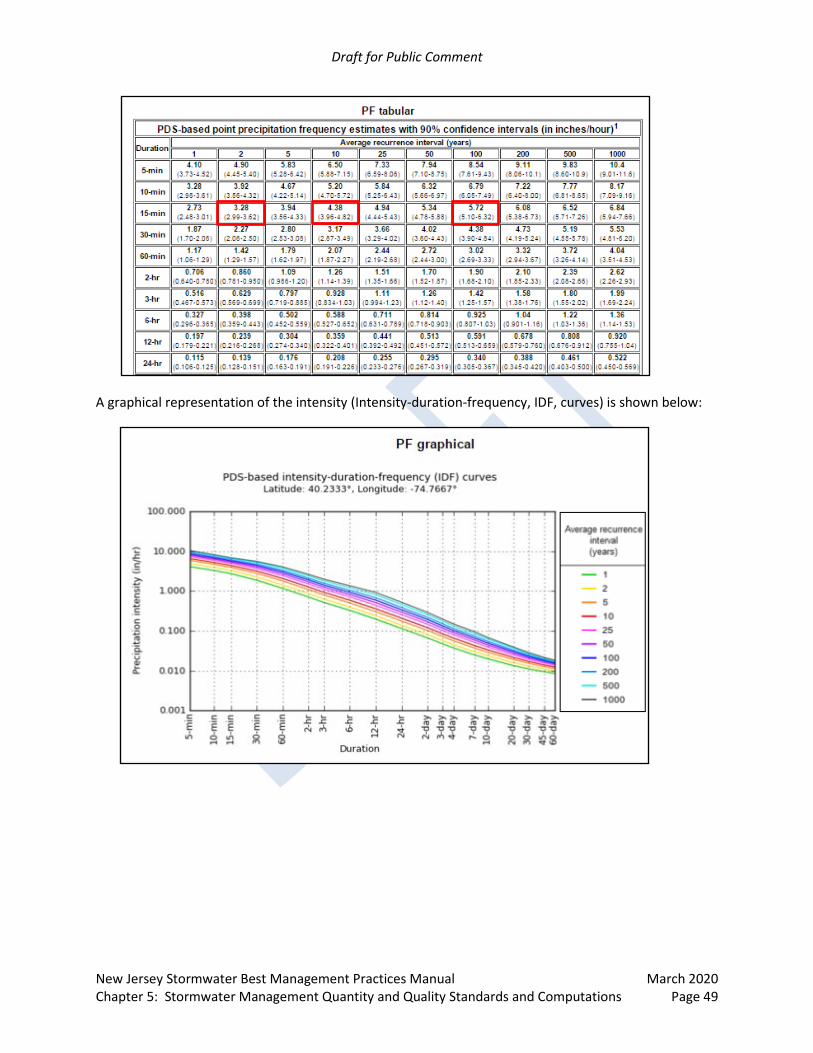
Draft for Public Comment
New Jersey Stormwater Best Management Practices Manual March 2020 Chapter 5: Stormwater Management Quantity and Quality Standards and Computations Page 49
A graphical representation of the intensity (Intensity-duration-frequency, IDF, curves) is shown below:

Draft for Public Comment
New Jersey Stormwater Best Management Practices Manual March 2020 Chapter 5: Stormwater Management Quantity and Quality Standards and Computations Page 50
Water Quality Design Storm
The Rational Method calculates only the peak flow rate of a specific storm event. Therefore, it is not appropriate to use the Rational method for sizing BMPs that require knowing the volume of stormwater runoff generated in order to determine the size of the BMP. The Rational method is often used in sizing Manufactured Treatment Devices by a determination of the peak flow rate of inflow.
The Stormwater Management rules define the NJDEP Water Quality Design Storm as 1.25 inches of rainfall in a 2-hour period. However, as explained on Page 23, the rainfall distribution for this storm event is not evenly distributed over the entire duration; therefore, using an average intensity of 1.25 in over 2 hr, or 0.625 in/hr cannot be used as the value for i, rainfall intensity, in the Rational Method equation. Instead, refer to Table 5-4, found on Page 24, or Figure 5-18, located below, for the correct rainfall intensity value corresponding to the calculated time of concentration.
Figure 5-18: NJDEP 1.25-Inch/2-Hour Stormwater Quality Design Storm Rainfall Intensity- Duration Curve
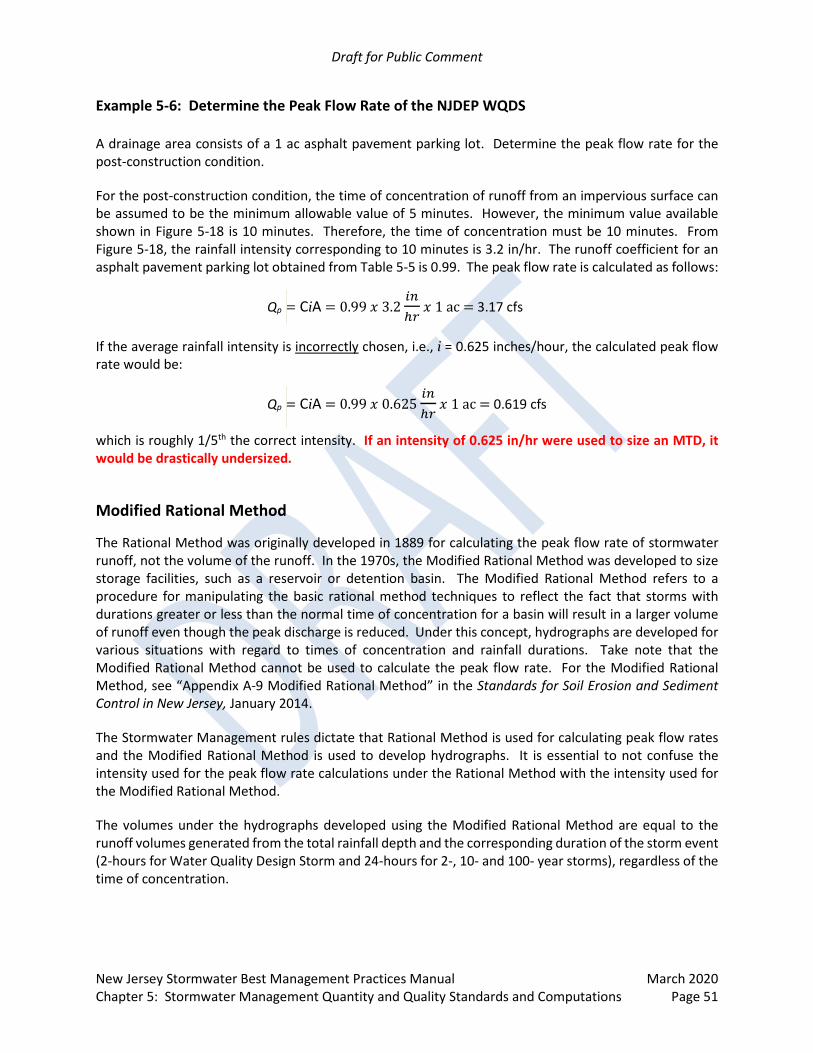
Draft for Public Comment
New Jersey Stormwater Best Management Practices Manual March 2020 Chapter 5: Stormwater Management Quantity and Quality Standards and Computations Page 51
Example 5-6: Determine the Peak Flow Rate of the NJDEP WQDS
A drainage area consists of a 1 ac asphalt pavement parking lot. Determine the peak flow rate for the post-construction condition.
For the post-construction condition, the time of concentration of runoff from an impervious surface can be assumed to be the minimum allowable value of 5 minutes. However, the minimum value available shown in Figure 5-18 is 10 minutes. Therefore, the time of concentration must be 10 minutes. From Figure 5-18, the rainfall intensity corresponding to 10 minutes is 3.2 in/hr. The runoff coefficient for an asphalt pavement parking lot obtained from Table 5-5 is 0.99. The peak flow rate is calculated as follows:
Qp = CiA = 0.99 𝑥𝑥 3.2 𝑖𝑖𝑛𝑛ℎ𝐶𝐶
𝑥𝑥 1 ac = 3.17 cfs
If the average rainfall intensity is incorrectly chosen, i.e., i = 0.625 inches/hour, the calculated peak flow rate would be:
Qp = CiA = 0.99 𝑥𝑥 0.625 𝑖𝑖𝑛𝑛ℎ𝐶𝐶
𝑥𝑥 1 ac = 0.619 cfs
which is roughly 1/5th the correct intensity. If an intensity of 0.625 in/hr were used to size an MTD, it would be drastically undersized.
Modified Rational Method
The Rational Method was originally developed in 1889 for calculating the peak flow rate of stormwater runoff, not the volume of the runoff. In the 1970s, the Modified Rational Method was developed to size storage facilities, such as a reservoir or detention basin. The Modified Rational Method refers to a procedure for manipulating the basic rational method techniques to reflect the fact that storms with durations greater or less than the normal time of concentration for a basin will result in a larger volume of runoff even though the peak discharge is reduced. Under this concept, hydrographs are developed for various situations with regard to times of concentration and rainfall durations. Take note that the Modified Rational Method cannot be used to calculate the peak flow rate. For the Modified Rational Method, see “Appendix A-9 Modified Rational Method” in the Standards for Soil Erosion and Sediment Control in New Jersey, January 2014.
The Stormwater Management rules dictate that Rational Method is used for calculating peak flow rates and the Modified Rational Method is used to develop hydrographs. It is essential to not confuse the intensity used for the peak flow rate calculations under the Rational Method with the intensity used for the Modified Rational Method.
The volumes under the hydrographs developed using the Modified Rational Method are equal to the runoff volumes generated from the total rainfall depth and the corresponding duration of the storm event (2-hours for Water Quality Design Storm and 24-hours for 2-, 10- and 100- year storms), regardless of the time of concentration.

Draft for Public Comment
New Jersey Stormwater Best Management Practices Manual March 2020 Chapter 5: Stormwater Management Quantity and Quality Standards and Computations Page 52
Example 5-7: Sizing a Detention Basin Using the Modified Rational Method
The Modified Rational Method is to be used to size a stormwater management basin for the 100-year storm. The existing condition peak flow rate is 7.024 cfs. The drainage area is 20 acres.
Step 1: Determine the allowable discharge peak flow for 100-year storm.
In accordance with the Stormwater Management rules requirement for stormwater runoff quantity control, the allowable discharge rate for the 100-year storm is 80% of the pre-construction peak flow rate. The pre-construction peak flow rate is 7.024 cfs. The allowable 100-year peak flow rate is therefore 5.62 cfs.
Step 2: Find the storm duration that will produce the maximum difference between the inflow volume and the outflow volume, assuming the maximum allowable peak outflow rate is the rate of discharge from the proposed detention basin.
Different stormwater durations and their rainfall intensities are used to calculate the inflow volumes. In Table 5-6, shown below, the design storm has a 100-year recurrence interval. Since the rainfall intensity decreases as the duration of rainfall increases, compare the rainfall intensity for the 5-min storm with that of the 12-hr storm.
Table 5-6: NOAA Precipitation Frequency Data
The inflow volume in excess of the outflow volume discharging at the allowable outflow rate must be detained in the detention basin to maintain a constant, yet allowable, rate of peak flow out of the detention basin. Construction of a table like the one shown on the following page can facilitate the calculation.

Draft for Public Comment
New Jersey Stormwater Best Management Practices Manual March 2020 Chapter 5: Stormwater Management Quantity and Quality Standards and Computations Page 53
Table 5-7: Modified Rational Method Basin Design Table
Column: A B C D E F G
Row No.
Storm Duration
(min)
Storm Intensity
(in/hr)
Inflow Rate (cfs)
Runoff Volume
(cf)
Outflow Rate (cfs)
Outflow Volume
(cf)
Storage Volume
(cf)
1 5 8.56
The storm duration (Column A) can be set at any interval of time, such as 20 minutes, 1 hour,etc. Smaller intervals of time provide more accurate estimates. For this example, the valuesof storm duration are initially chosen to match the storm durations in the NOAA websiteprecipitation frequency data as shown in Table 5-6.
Values for storm intensity (Column B) may be obtained from intensity-duration-frequencycurve in accordance with the stormwater recurrence frequency and the storm duration. Forthe current example, the stormwater recurrence frequency is 100-year storm. The stormduration is the values in column A. From Table 5-6, for example, the storm intensity is 8.56in/hr for a 5-min duration, 100-year storm. In Row 1, enter “5” in Column A and enter 8.56 inColumn B in Table 5-7. Note that these particular values will not be used in the remainder ofthe example.
The inflow rate (Column C) is the multiplication of storm intensity (Column B), the size of thecontributing inflow drainage area, and the C value, which is assumed to be 0.99 for animpervious surface. As discussed on Page 46, no conversion factor is required to adjust theunits of the rational method equation.
The runoff volume (Column D) is the multiplication of inflow rate (Column C) with the stormduration (Column A), along with the appropriate conversion of units from minutes to seconds.
The outflow rate (Column E) is the allowable outflow rate from “Step 1.”
The outflow volume (Column F) is the multiplication of the outflow rate (Column E) with thestorm duration (Column A). Also include the unit conversion from minutes to seconds in thisstep.
The storage volume (Column G) is the subtraction of outflow volume (Column F) from therunoff volume (Column D).

Draft for Public Comment
New Jersey Stormwater Best Management Practices Manual March 2020 Chapter 5: Stormwater Management Quantity and Quality Standards and Computations Page 54
Table 5-7 now looks like this, once the values are calculated as discussed above:
Table 5-7: Modified Rational Method Basin Design Table (revised)
Column: A B C D E F G
Row No.
Storm Duration
(min)
Storm Intensity
(in/hr)
Inflow Rate (cfs)
Runoff Volume
(cf)
Outflow Rate (cfs)
Outflow Volume
(cf)
Storage Volume
(cf)
1 10 6.80 134.6 80760 5.62 3372 77388
2 15 5.73 113.5 102150 5.62 5058 97092
3 30 4.39 86.9 156420 5.62 10116 146304
4 60 3.02 59.8 215280 5.62 20232 195048
5 120 1.90 37.6 270720 5.62 40464 230255
6 180 1.42 28.1 303480 5.62 60696 242784
7 360 0.925 18.3 395280 5.62 121392 273888
8 720 0.592 11.7 505440 5.62 242784 262656
The storage volume shown in Column G increases to 273,888 cf then decrease to 262,656 cf between the durations of 360 and 720 minutes. This means that the maximum storage volume occurs somewhere between these durations. Further analysis is needed as there is a time difference of 360 minutes between the two durations.
Next, an increment of 60 minutes between durations 360 and 720 minutes is used to zero in on the maximum storage volume. The storm intensity is still obtained from the precipitation-duration-frequency (“PDS”) data on the NOAA website. However, the tabular data does not provide data at 60-minute intervals between the targeted durations. This means the graphical curve will need to beconsulted. NOAA’s intensity-duration-frequency (“IDF”) curves are shown on the following page. Toobtain the value for a particular precipitation intensity, there is a three-step process.
First, locate the curve for the desired recurrence interval from the color-coded key on the right inthe figure reproduced at the top of Page 55.
Second, locate the storm duration on the x-axis and project a line up to the recurrence intervalcurve.
Finally, project a horizontal over to the y-axis to find the precipitation intensity.
Take note that the scale for each axis is logarithmic. For example, for a duration of 540 minutes (9 hours), the 100-year curve yields an intensity of 0.757 in/hr, shown on the following page with red arrows.

Draft for Public Comment
New Jersey Stormwater Best Management Practices Manual March 2020 Chapter 5: Stormwater Management Quantity and Quality Standards and Computations Page 55
Rows are then added to Table 5-7 and the method described above is used to complete the additional rows, resulting in a table that now looks, in part, like that depicted below:
Table 5-7: Modified Rational Method Basin Design Table - Expanded
A B C D E F G
Row No.
Storm Duration
(min)
Storm Intensity
(in/hr)
Inflow Rate (cfs)
Runoff Volume
(cf)
Outflow Rate (cfs)
Outflow Volume
(cf)
Storage Volume
(cf)
7 360 0.925 18.32 395712 5.62 121392 274320
8 420 0.869 17.21 433692 5.62 141624 292068
9 480 0.813 16.10 463680 5.62 161856 301824
10 540 0.757 14.99 485676 5.62 182088 303588
11 600 0.701 13.88 499680 5.62 202320 297360
12 660 0.645 12.77 505692 5.62 222552 283140
13 720 0.592 11.72 506304 5.62 242784 263520
As can be seen as bolded text in the table above, the storage volume increases to reach a maximum of 303,543 cf for a storm duration of 540 min. The expanded table is therefore a more accurate estimate of the maximum storage volume for the allowable discharge rate of 5.62 cfs for the 100-year

Draft for Public Comment
New Jersey Stormwater Best Management Practices Manual March 2020 Chapter 5: Stormwater Management Quantity and Quality Standards and Computations Page 56
storm. Of course, further refinements can be made using smaller time increments between durations of 480 and 540 minutes, if so desired.
The detention basin will need further configuration based on the storage volume of 303,543 cf, including sizing of orifices and maximum water depth to be consistent with the allowable peak outflow of 5.62 cfs. The method described above should also be performed for the 2- and 10-year storms to demonstrate the volumes and outflow rates meet the required 50% and 75% reduction rates. Further design and performance standards and other details for extended detention basins are addressed in Chapter 9.4 of this manual.
Example 5-8: A Re-development Project with Two Drainage Areas, Each Discharging to Separate Points, Compared to the Same Development having One Combined Discharge Point
In this example, a proposed development in Ocean County consists of two drainage areas, each discharging to a separate point, is compared to a scenario in which the stormwater runoff produced by the two drainage areas converges to a single discharge point before leaving the development site. This example combines a groundwater mounding analysis and stormwater routing calculations, which includes exfiltration as an allowable discharge, and also illustrates how the stormwater runoff quantity control design standards may and may not be applied.
Example 5-8A: Two Discharge Points
Drainage area A is 1.0 acre. Under existing conditions, stormwater runoff from drainage area A is discharged to a riparian zone toward a small creek. The existing cover in drainage area A is a pasture on HSG ‘B’ soil. The proposed development for drainage area A consists of a 0.25 acre gravel parking lot, with the remainder to be undisturbed. A small-scale infiltration basin (52 ft long by 52 ft wide) is proposed to provide water-quality treatment for the stormwater runoff generated by the proposed gravel parking lot, as well as provide stormwater runoff quantity control through infiltration of the runoff produced by the 2-, 10- and 100-year design storms. The small-scale infiltration basin has an emergency spillway discharging to the same riparian zone toward to the creek.
Drainage area B is 0.75 acres. Under existing conditions, stormwater runoff from drainage area B is discharged to a street that has a roadside catch basin connected to a municipal stormwater sewer system. Drainage area B consists of HSG ‘C’ soil. The concrete foundation of an abandoned warehouse covers 0.5 acres of drainage area B. Although there was an asphalt parking area adjacent to the warehouse, the parking area was removed and vegetation, grass and woods, have re-established on the site. The proposed development includes demolishing the warehouse to construct a 0.16 ac building and pedestrian walkway. Under proposed conditions, the rest of the drainage area B is to be vegetated as follows: 0.5 ac of turf grass and landscaping and 0.09 ac of woods. No green infrastructure is proposed in drainage area B.
The tested soil permeability rate for the most restrictive soil layer within the proposed small-scale infiltration basin is 3 in/hr. The Seasonal High Water Table (SHWT) is 8 feet below the existing ground elevation. The stormwater management report for the proposed development claims that the proposed stormwater management measures will meet the stormwater runoff quantity requirements in N.J.A.C. 7:8-5.6. Determine the validity of this claim.
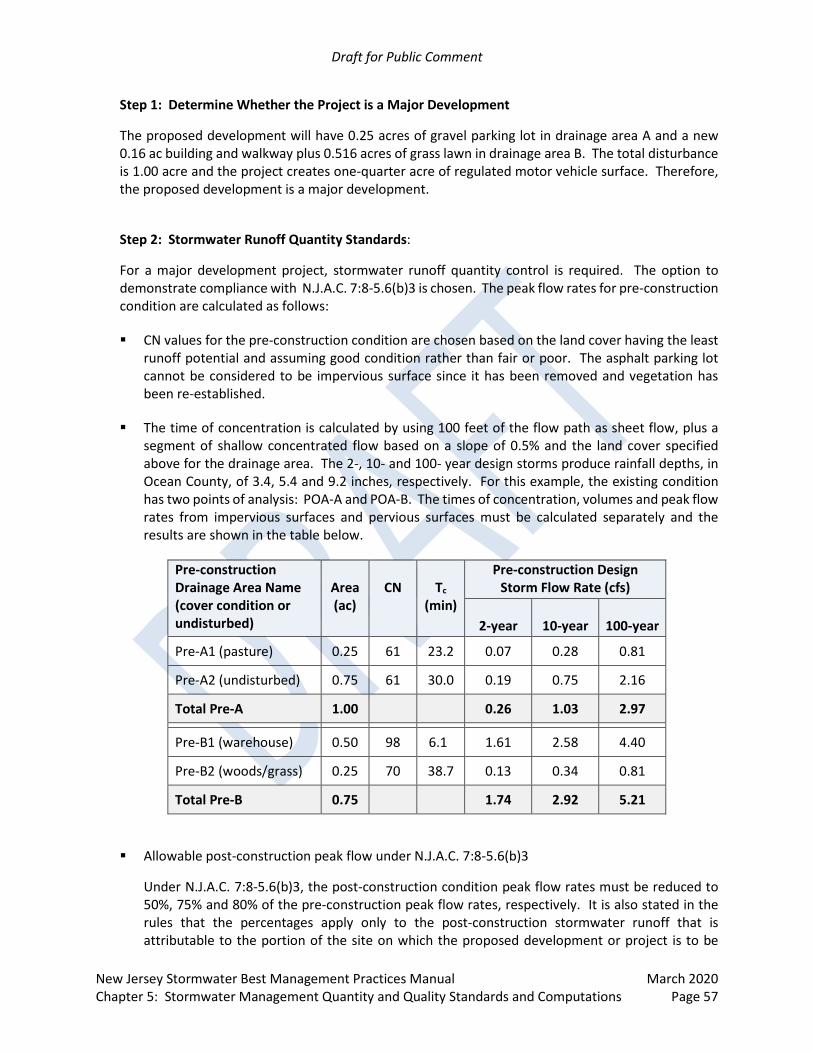
Draft for Public Comment
New Jersey Stormwater Best Management Practices Manual March 2020 Chapter 5: Stormwater Management Quantity and Quality Standards and Computations Page 57
Step 1: Determine Whether the Project is a Major Development
The proposed development will have 0.25 acres of gravel parking lot in drainage area A and a new 0.16 ac building and walkway plus 0.516 acres of grass lawn in drainage area B. The total disturbance is 1.00 acre and the project creates one-quarter acre of regulated motor vehicle surface. Therefore, the proposed development is a major development.
Step 2: Stormwater Runoff Quantity Standards:
For a major development project, stormwater runoff quantity control is required. The option to demonstrate compliance with N.J.A.C. 7:8-5.6(b)3 is chosen. The peak flow rates for pre-construction condition are calculated as follows:
CN values for the pre-construction condition are chosen based on the land cover having the leastrunoff potential and assuming good condition rather than fair or poor. The asphalt parking lotcannot be considered to be impervious surface since it has been removed and vegetation hasbeen re-established.
The time of concentration is calculated by using 100 feet of the flow path as sheet flow, plus asegment of shallow concentrated flow based on a slope of 0.5% and the land cover specifiedabove for the drainage area. The 2-, 10- and 100- year design storms produce rainfall depths, inOcean County, of 3.4, 5.4 and 9.2 inches, respectively. For this example, the existing conditionhas two points of analysis: POA-A and POA-B. The times of concentration, volumes and peak flowrates from impervious surfaces and pervious surfaces must be calculated separately and theresults are shown in the table below.
Pre-construction Drainage Area Name (cover condition or undisturbed)
Area (ac)
CN Tc (min)
Pre-construction Design Storm Flow Rate (cfs)
2-year 10-year 100-year
Pre-A1 (pasture) 0.25 61 23.2 0.07 0.28 0.81
Pre-A2 (undisturbed) 0.75 61 30.0 0.19 0.75 2.16
Total Pre-A 1.00 0.26 1.03 2.97
Pre-B1 (warehouse) 0.50 98 6.1 1.61 2.58 4.40
Pre-B2 (woods/grass) 0.25 70 38.7 0.13 0.34 0.81
Total Pre-B 0.75 1.74 2.92 5.21
Allowable post-construction peak flow under N.J.A.C. 7:8-5.6(b)3
Under N.J.A.C. 7:8-5.6(b)3, the post-construction condition peak flow rates must be reduced to50%, 75% and 80% of the pre-construction peak flow rates, respectively. It is also stated in therules that the percentages apply only to the post-construction stormwater runoff that isattributable to the portion of the site on which the proposed development or project is to be

Draft for Public Comment
New Jersey Stormwater Best Management Practices Manual March 2020 Chapter 5: Stormwater Management Quantity and Quality Standards and Computations Page 58
constructed. Therefore, the reduction percentages are not required for the undisturbed drainage area, Pre-A2. The allowable peak flow rates are listed below.
Pre-construction Drainage Area Name (cover condition)
Area (ac)
Allowable Design Storm Peak Flow Rates (cfs)
2-year 10-year 100-year
Pre-A1 (pasture) 0.25 0.04 0.21 0.65
Pre-A2 (undisturbed) 0.75 0.19 0.75 2.16
Total Pre-A 1.00 0.23 0.96 2.81
Pre-B1 (warehouse and parking area) 0.50 0.81 1.94 3.52
Pre-B2 (woods) 0.25 0.07 0.26 0.65
Total Pre-B 0.75 0.88 2.20 4.17
The post-construction peak flow rates for each of the proposed drainage areas (prior to theincorporation of stormwater management measures) are shown below:
Post-construction Drainage Area Name (undisturbed/cover condition)
Area (ac)
CN Tc (min)
Post-construction Design Storm Flow Rate (cfs)
2-year 10-year 100-year
Post-A1 (parking/ gravel) 0.25 96 6 0.78 1.27 2.19 Post-A2 (undisturbed/ pasture) 0.75 61 30 0.19 0.75 2.16
Total Post-A 1.00 0.97 2.02 4.35
Post-B1 (building or walkway) 0.16 98 6 0.52 0.83 1.41 Post-B2 (open space/ grass > 75% and woods) 0.59 74 18.7 0.53 1.28 2.86
Total Post-B 0.75 1.05 2.11 4.27
□ The uncontrolled post-construction peak flow rates generated by drainage area Post-A exceed the allowable design storm peak flow rates of stormwater runoff generated by drainage areaPre-A. Therefore, green infrastructure BMPs listed in Table 5-1 or 5-2, as required by N.J.A.C.7:8-5.3(c), must be used to meet the stormwater runoff quantity control requirements. Asstated on Page 56, a small-scale infiltration basin is proposed to provide the stormwaterrunoff quantity control.
□ Similarly, for drainage area B, the uncontrolled post-construction peak flow rates ofstormwater runoff generated by drainage area Post-B exceed the allowable design storm peak flow rates of stormwater runoff generated by drainage area Pre-B. Therefore, green
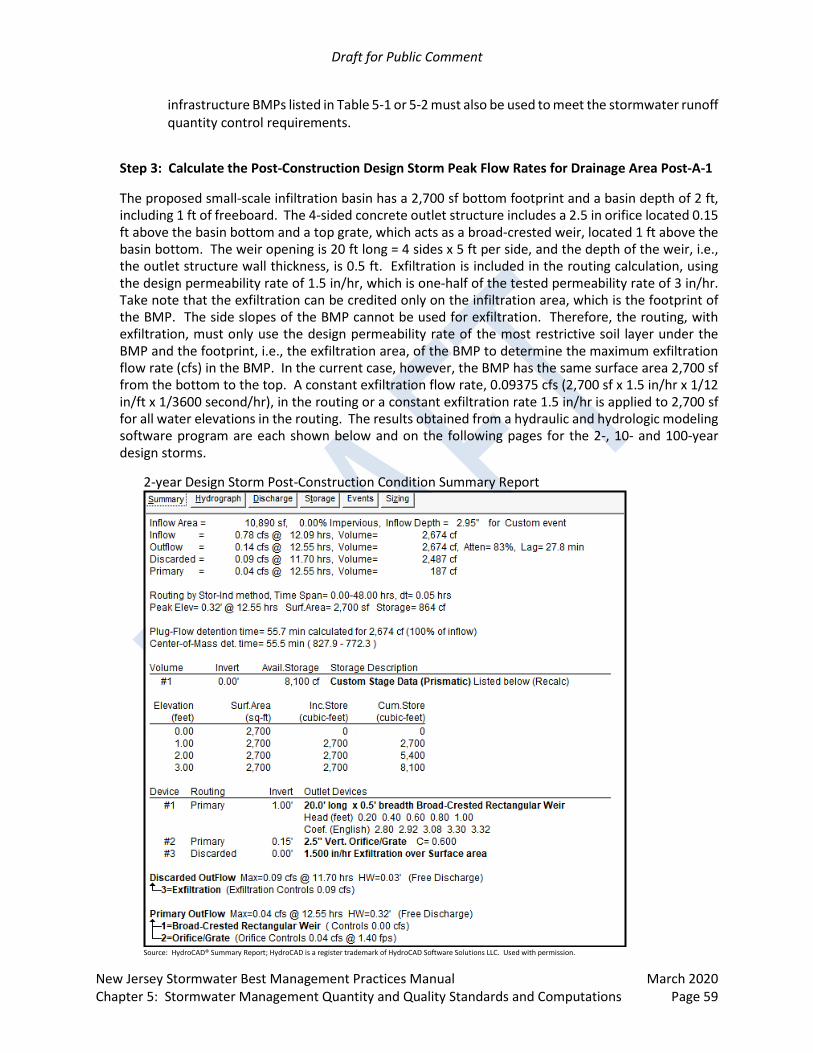
Draft for Public Comment
New Jersey Stormwater Best Management Practices Manual March 2020 Chapter 5: Stormwater Management Quantity and Quality Standards and Computations Page 59
infrastructure BMPs listed in Table 5-1 or 5-2 must also be used to meet the stormwater runoff quantity control requirements.
Step 3: Calculate the Post-Construction Design Storm Peak Flow Rates for Drainage Area Post-A-1
The proposed small-scale infiltration basin has a 2,700 sf bottom footprint and a basin depth of 2 ft, including 1 ft of freeboard. The 4-sided concrete outlet structure includes a 2.5 in orifice located 0.15 ft above the basin bottom and a top grate, which acts as a broad-crested weir, located 1 ft above the basin bottom. The weir opening is 20 ft long = 4 sides x 5 ft per side, and the depth of the weir, i.e., the outlet structure wall thickness, is 0.5 ft. Exfiltration is included in the routing calculation, using the design permeability rate of 1.5 in/hr, which is one-half of the tested permeability rate of 3 in/hr. Take note that the exfiltration can be credited only on the infiltration area, which is the footprint of the BMP. The side slopes of the BMP cannot be used for exfiltration. Therefore, the routing, with exfiltration, must only use the design permeability rate of the most restrictive soil layer under the BMP and the footprint, i.e., the exfiltration area, of the BMP to determine the maximum exfiltration flow rate (cfs) in the BMP. In the current case, however, the BMP has the same surface area 2,700 sf from the bottom to the top. A constant exfiltration flow rate, 0.09375 cfs (2,700 sf x 1.5 in/hr x 1/12 in/ft x 1/3600 second/hr), in the routing or a constant exfiltration rate 1.5 in/hr is applied to 2,700 sf for all water elevations in the routing. The results obtained from a hydraulic and hydrologic modeling software program are each shown below and on the following pages for the 2-, 10- and 100-year design storms.
2-year Design Storm Post-Construction Condition Summary Report
Source: HydroCAD® Summary Report; HydroCAD is a register trademark of HydroCAD Software Solutions LLC. Used with permission.

Draft for Public Comment
New Jersey Stormwater Best Management Practices Manual March 2020 Chapter 5: Stormwater Management Quantity and Quality Standards and Computations Page 60
10-year Design Storm Post-Construction Condition Summary Report
Source: HydroCAD® Summary Report; HydroCAD is a register trademark of HydroCAD Software Solutions LLC. Used with permission.
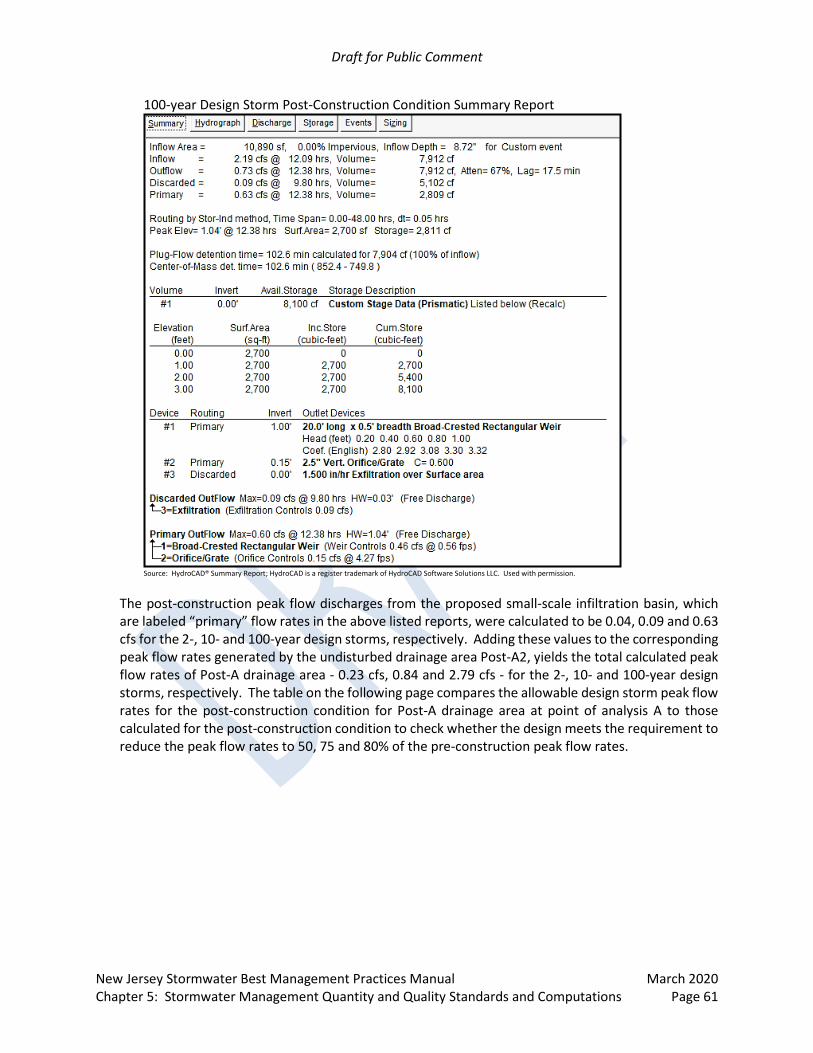
Draft for Public Comment
New Jersey Stormwater Best Management Practices Manual March 2020 Chapter 5: Stormwater Management Quantity and Quality Standards and Computations Page 61
100-year Design Storm Post-Construction Condition Summary Report
Source: HydroCAD® Summary Report; HydroCAD is a register trademark of HydroCAD Software Solutions LLC. Used with permission.
The post-construction peak flow discharges from the proposed small-scale infiltration basin, which are labeled “primary” flow rates in the above listed reports, were calculated to be 0.04, 0.09 and 0.63 cfs for the 2-, 10- and 100-year design storms, respectively. Adding these values to the corresponding peak flow rates generated by the undisturbed drainage area Post-A2, yields the total calculated peak flow rates of Post-A drainage area - 0.23 cfs, 0.84 and 2.79 cfs - for the 2-, 10- and 100-year design storms, respectively. The table on the following page compares the allowable design storm peak flow rates for the post-construction condition for Post-A drainage area at point of analysis A to those calculated for the post-construction condition to check whether the design meets the requirement to reduce the peak flow rates to 50, 75 and 80% of the pre-construction peak flow rates.

Draft for Public Comment
New Jersey Stormwater Best Management Practices Manual March 2020 Chapter 5: Stormwater Management Quantity and Quality Standards and Computations Page 62
The post-construction peak flow rates for each of the proposed drainage areas are shown below (after the incorporation of stormwater management measures).
Post-construction Drainage Area Designation
Allowable Design Storm Peak Flow Rate (cfs)
Design Storm Peak Flow Rates with a Small-Scale
Infiltration Basin (cfs)
2-year 10-year 100-year 2-year 10-year 100-yearPost-A1 (parking lot/ gravel) 0.04 0.21 0.65 0.04 0.09 0.63 Post-A2 (undisturbed area/ pasture) 0.19 0.75 2.16 0.19 0.75 2.16
Post-A 0.23 0.96 2.81 0.23 0.84 2.79
Step 4: Perform the Required Groundwater Mounding Analysis
The design of the small-scale infiltration basin must include a groundwater mounding analysis to verify the drain time within 72 hours and whether there is an adverse hydraulic impact to the groundwater level due to the infiltration practice, in accordance with N.J.A.C. 7:8-5.2(h).
The NJDEP Hantush Spreadsheet is used for the groundwater mounding analysis for which guidance is included in Chapter 13 of this manual. For this example, the small-scale infiltration basin measures 52 ft by 52 ft. The recharge rate, R, is the design permeability rate, which is one half the tested permeability rate, and equals 0.5 x 3.0 in/hr = 1.5 in/hr. The parameters for specific yield, Sy, and the horizontal hydraulic conductivity, Kh, is will be set at the default values specified in Chapter 13. The horizontal hydraulic conductivity rate is 5 times the recharge rate since the site, located in Ocean County, is in the Coastal plain. The x and y values are equal to half of the respective basin dimensions.
For the calculation of the duration of the infiltration period - when exfiltration is used in the basin routing calculation - the time calculated must be determined from the volume of runoff exfiltrated, or discarded, typically found in the modeling software results. As shown in the preceding summary reports, the exfiltration volumes or discarded volumes during the 2-, 10- and 100-year design storms are 2,487, 3,595 and 5,102 cf, respectively. Since the 100-year design storm produced the largest exfiltration volume, this design storm is most likely to yield the greatest mounding height. The exfiltration volume during the 100-year storm is used to calculate the duration of the infiltration period.
From Page 4 of Chapter 13, the duration of infiltration period, t, is calculated as follows for the 100-year design storm:
Duration of infiltration period, t (ℎ𝑟𝑟) = 𝐷𝐷𝑖𝑖𝑠𝑠𝐶𝐶𝑎𝑎𝐶𝐶𝐶𝐶𝐶𝐶𝐶𝐶 𝑉𝑉𝑎𝑎𝑎𝑎𝑉𝑉𝑉𝑉𝐶𝐶 𝑣𝑣𝑖𝑖𝑎𝑎 𝐸𝐸𝑥𝑥𝑓𝑓𝑖𝑖𝑎𝑎𝐶𝐶𝐶𝐶𝑎𝑎𝐶𝐶𝑖𝑖𝑎𝑎𝑛𝑛 (𝐶𝐶𝑓𝑓) 𝑥𝑥 12 𝑖𝑖𝑛𝑛/𝑓𝑓𝐶𝐶𝐼𝐼𝑛𝑛𝑓𝑓𝑖𝑖𝑎𝑎𝐶𝐶𝐶𝐶𝑎𝑎𝐶𝐶𝑖𝑖𝑎𝑎𝑛𝑛 𝑎𝑎𝐶𝐶𝐶𝐶𝑎𝑎 (𝑠𝑠𝑓𝑓) 𝑥𝑥 𝐸𝐸𝑥𝑥𝑓𝑓𝑖𝑖𝑎𝑎𝐶𝐶𝐶𝐶𝑎𝑎𝐶𝐶𝑖𝑖𝑎𝑎𝑛𝑛 𝐶𝐶𝑎𝑎𝐶𝐶𝐶𝐶 (𝑖𝑖𝑛𝑛/ℎ𝐶𝐶)
= 5,102 𝐶𝐶𝑓𝑓 𝑥𝑥 12 𝑖𝑖𝑛𝑛/𝑓𝑓𝐶𝐶2,700 𝑠𝑠𝑓𝑓 𝑥𝑥 1.5 𝑖𝑖𝑛𝑛/ℎ𝐶𝐶
= 15.12 hr

Draft for Public Comment
New Jersey Stormwater Best Management Practices Manual March 2020 Chapter 5: Stormwater Management Quantity and Quality Standards and Computations Page 63
The initial thickness of the saturated zone, hi(0), is set at the default value. Clicking on the blue button labeled “Re-Calculate Now” produced the results depicted below.
The results show that the maximum height of the groundwater mounding, Δh(max), is 6.16 ft. Since the groundwater table is 8 ft below the existing ground elevation, the elevated groundwater table will be 1.84 ft below the existing ground level at the center of the small-scale infiltration basin at the moment all of the stormwater runoff has infiltrated into the sand layer. However, the proposed small-scale basin provides 2 ft of temporary storage for stormwater, as depicted above by the light blue rectangle. The basin also includes a sand layer that is 0.5 ft deep, shown in tan. Therefore, the lowest point of the proposed basin is 2.5 ft below the existing ground elevation. Since the elevated groundwater table will be only 1.84 ft below the existing ground elevation, the elevated groundwater level will have an adverse impact on the drainage of the basin.
Since there is an adverse impact on the drainage of the basin, the rate of exfiltration will also be impacted, meaning the ability of the basin to drain will be reduced. A smaller recharge rate must be used to run the Hantush Spreadsheet again in order to further evaluate the mounding height. A trial and error approach must be undertaken because the extent to which the soil permeability rate will be reduced is unknown. The approach is outlined on the following page.
SHWT
Ex. Grade, El. 8.0 ft
Centerline of the proposed small-scale
infiltration basin
Bottom of the 0.5 ft thick sand layer, El. 5.5 ft
x = 26 ft

Draft for Public Comment
New Jersey Stormwater Best Management Practices Manual March 2020 Chapter 5: Stormwater Management Quantity and Quality Standards and Computations Page 64
Steps to Follow When an Adverse Impact is Encountered:
a. Further reduce the value for the recharge rate, R.
b. Use the reduced recharge rate from “Step a” as the exfiltration rate in the BMP routingcalculation.
i. Keep in mind that reducing the exfiltration rate will result in a greater volume to bedischarged via the outlet structure and a lower volume of stormwater runoff will bediscarded via exfiltration.
ii. If the increased flow rate through the outlet structure exceeds the allowable design stormpeak flow rate, the infiltration BMP will require a larger detention volume and the outletstructure may also need to be adjusted to meet the allowable design storm peak flow rate.
iii. Although the BMP can be enlarged by increasing the depth, doing so will reduce thedistance between the bottom of the BMP and the groundwater table, meaning the newdesign will be more likely to be negatively impacted by the elevated groundwater tableduring infiltration.
iv. Therefore, enlarging the footprint of the BMP will generally produce more favorable resultsthan increasing the depth.
c. After adjusting the footprint size and the outlet structure to meet the allowable design stormpeak flow rates for all storms with the reduced exfiltration rate, use the exfiltration (discarded)volume from the routing calculation as the infiltration volume to calculate a new value for theduration of infiltration period. Note that the new duration of the infiltration period must beless than or equal to 72 hours.
d. Run the Hantush Spreadsheet with the new values from “Step c.”
i. The recharge rate will be equal to the reduced exfiltration rate.ii. However, the horizontal conductivity must remain unchanged.
iii. If the BMP, using the reduced exfiltration rate, needs more than 72 hours to infiltrate theexfiltration volume, the BMP is considered unsuitable.
e. Use the mounding height from the results in “Step d” to assess the impact of the groundwatermounding on the BMP.
i. If the new height of the groundwater mounding is below the bottom of the BMP, theinfiltration practice will not be impacted by the groundwater mounding, and the trial anderror process is concluded at this point.
ii. However, if the new height of the groundwater mounding is still above the bottom of theBMP, a new iteration using a further reduced exfiltration rate will be needed.
iii. Note that an exfiltration rate less than 0.5 in/hr may be used as long as the duration ofinfiltration period does not exceed 72 hours.

Draft for Public Comment
New Jersey Stormwater Best Management Practices Manual March 2020 Chapter 5: Stormwater Management Quantity and Quality Standards and Computations Page 65
Based on the methodology discussed above, the trial and error approach for the current exampleis as follows:
a. Reduce the recharge rate from 1.5 in/hr to 1 in/hr.
b. The exfiltration rate used in the new basin routing calculation equals the recharge rate from“Step a.” The results are shown in the image below:
Revised 100-year Design Storm Post-Construction Condition Summary Report Exfiltration = 1.0 in/hr
i. The 100-year storm routing calculation shows the exfiltration (discarded) volume isreduced from 5,102 cf at an exfiltration rate of 1.5 in/hr to 4,185 cf at 1 in/hr.
ii. The peak flow rate (primary) from the proposed small-scale infiltration basin (Post-A1) isincreased from 0.63 cfs to 0.9 cfs and must be added to the 2.42 cfs from Post-A2(undisturbed area/ pasture). The new value for the combined peak flow rate is 3.32 cfs,which exceeds the allowable design storm peak flow rate for the Post-A drainage area.
iii. To alleviate the increased peak flow rate, a larger detention volume is needed. Thefootprint of the proposed BMP is therefore enlarged from 2,700 to 3,200 sf to providemore detention volume. New routing calculations are performed and the results areshown on the next three pages for the 2-. 10- and 100-year design storms:
Source: HydroCAD® Summary Report; HydroCAD is a register trademark of HydroCAD Software Solutions LLC. Used with permission

Draft for Public Comment
New Jersey Stormwater Best Management Practices Manual March 2020 Chapter 5: Stormwater Management Quantity and Quality Standards and Computations Page 66
Revised 2-year Design Storm Post-Construction Condition Summary Report Exfiltration = 1.0 in/hr and Basin Footprint Enlarged to 3,200 sf
Source: HydroCAD® Summary Report; HydroCAD is a register trademark of HydroCAD Software Solutions LLC. Used with permission
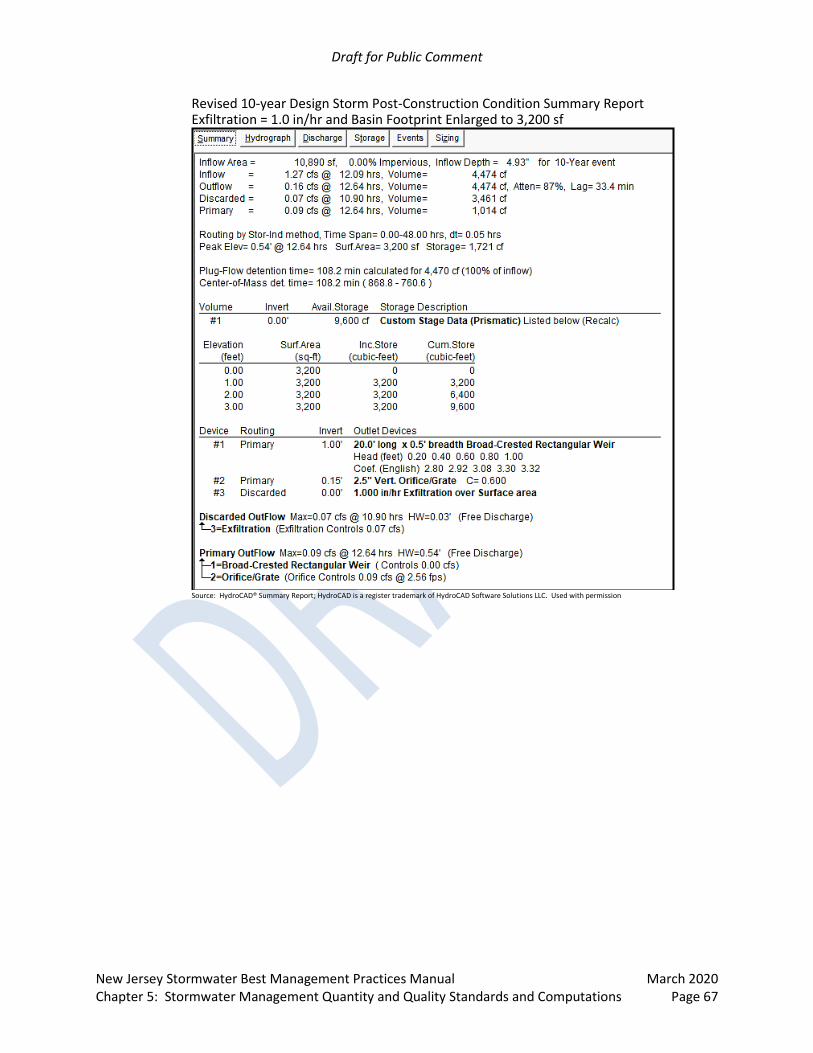
Draft for Public Comment
New Jersey Stormwater Best Management Practices Manual March 2020 Chapter 5: Stormwater Management Quantity and Quality Standards and Computations Page 67
Revised 10-year Design Storm Post-Construction Condition Summary Report Exfiltration = 1.0 in/hr and Basin Footprint Enlarged to 3,200 sf
Source: HydroCAD® Summary Report; HydroCAD is a register trademark of HydroCAD Software Solutions LLC. Used with permission

Draft for Public Comment
New Jersey Stormwater Best Management Practices Manual March 2020 Chapter 5: Stormwater Management Quantity and Quality Standards and Computations Page 68
Revised 100-year Design Storm Post-Construction Condition Summary Report Exfiltration = 1.0 in/hr and Basin Footprint Enlarged to 3,200 sf
Source: HydroCAD® Summary Report; HydroCAD is a register trademark of HydroCAD Software Solutions LLC. Used with permission
iv. The peak flow rate for the 100-year storm is 0.40 cfs. Adding this rate, which is for Post-A1, to 2.16 cfs (Post-A2) equals 2.56 cfs, which is less than the allowable design stormpeak flow rate of 3.07 cfs for the Post-A drainage area. A summary of design storm peakflow rates for two-, 10- and 100-year design storms are shown below:
Post-construction Peak Flow Rates of Drainage Area Post-A, with the Incorporation of a Green Infrastructure BMP (1 in/hr exfiltration rate)
Post-construction Drainage Area Designation
Allowable Design Storm Peak Flow Rate (cfs)
Design Storm Peak Flow Rates with a Small-Scale
Infiltration Basin (cfs)
2-year 10-year 100-year 2-year 10-year 100-yearPost-A1 (parking lot/ gravel) 0.04 0.21 0.65 0.04 0.09 0.40 Post-A2 (undisturbed area/ pasture) 0.19 0.75 2.16 0.19 0.75 2.16
Post-A 0.23 0.96 2.81 0.23 0.84 2.56

Draft for Public Comment
New Jersey Stormwater Best Management Practices Manual March 2020 Chapter 5: Stormwater Management Quantity and Quality Standards and Computations Page 69
c. From the revised summary for the 100-year design storm for a 3,200 sf footprint, theexfiltration (discarded) volume is 4,790 cf. The duration of infiltration for 1 in/hr exfiltrationrate is calculated to be 17.96 hours, as shown below. The 72 hour maximum has not beenexceeded, meaning the procedure may be continued.
infiltration period, t (ℎ𝑟𝑟) = 𝐷𝐷𝑖𝑖𝑠𝑠𝐶𝐶𝑎𝑎𝐶𝐶𝐶𝐶𝐶𝐶𝐶𝐶 𝑉𝑉𝑎𝑎𝑎𝑎𝑉𝑉𝑉𝑉𝐶𝐶 𝑣𝑣𝑖𝑖𝑎𝑎 𝐸𝐸𝑥𝑥𝑓𝑓𝑖𝑖𝑎𝑎𝐶𝐶𝐶𝐶𝑎𝑎𝐶𝐶𝑖𝑖𝑎𝑎𝑛𝑛 (𝐶𝐶𝑓𝑓) 𝑥𝑥 12 𝑖𝑖𝑛𝑛/𝑓𝑓𝐶𝐶𝐼𝐼𝑛𝑛𝑓𝑓𝑖𝑖𝑎𝑎𝐶𝐶𝐶𝐶𝑎𝑎𝐶𝐶𝑖𝑖𝑎𝑎𝑛𝑛 𝑎𝑎𝐶𝐶𝐶𝐶𝑎𝑎 (𝑠𝑠𝑓𝑓) 𝑥𝑥 𝐸𝐸𝑥𝑥𝑓𝑓𝑖𝑖𝑎𝑎𝐶𝐶𝐶𝐶𝑎𝑎𝐶𝐶𝑖𝑖𝑎𝑎𝑛𝑛 𝐶𝐶𝑎𝑎𝐶𝐶𝐶𝐶 (𝑖𝑖𝑛𝑛/ℎ𝐶𝐶)
= 4,790 𝐶𝐶𝑓𝑓 𝑥𝑥 12 𝑖𝑖𝑛𝑛/𝑓𝑓𝐶𝐶3,200 𝑠𝑠𝑓𝑓 𝑥𝑥 1.0 𝑖𝑖𝑛𝑛/ℎ𝐶𝐶
= 17.96 hr
d. The Hantush Spreadsheet must be run again. Since the footprint increased from 2,700 to3,200 sf, the basin dimensions changed from 52 ft by 52 ft to 56.57 ft by 56.57 ft. The x andy values for the spreadsheet inputs are each 28.285 ft. The result is shown below:
i. The recharge rate is the exfiltration rate, 1 in/hr.ii. The horizontal conductivity remain as 7.5 in/hr (five times the original design soil
permeability rate, 1.5 in/hr).
Duration of
SHWT
Bottom of the 0.5 ft thick sand layer, El. 5.5 ft
Ex. Grade, El. 8.0 ft
Centerline of the proposed small-scale
infiltration basin

Draft for Public Comment
New Jersey Stormwater Best Management Practices Manual March 2020 Chapter 5: Stormwater Management Quantity and Quality Standards and Computations Page 70
e. From the results in “Step d,” the mounding height is 4.99 feet. The groundwater table is 8feet below the ground level. The elevated groundwater table will be 3.01 feet below theground level. The basin sand bottom is 2.5 feet below the ground level, which is above theelevated groundwater table. The elevated groundwater table will not have an adverse impact on the infiltration of the proposed infiltration basin. The trial and error process can thereforeend.
Step 5: Since the option to meet the Stormwater Runoff Quantity Standards of N.J.A.C. 7:8-5.6(b)3 was selected in “Step 2,” Determine Whether the Post-B Drainage Area Meets the Same Standard
From Page 58, the 2-, 10- and 100-year design storm design peak flow rates from Post-B drainage area are 1.05, 2.11 and 4.27 cfs, respectively. The corresponding allowable design storm peak flow rates for 2-, 10- and 100-year design storms are 0.88, 2.20 and 4.17 cfs. Therefore, Post-B drainage area does not meet the Stormwater Runoff Quantity Requirements of N.J.A.C. 7:8-5.6(b)3.
Step 6: Determine Whether the Post-B Drainage Area Meets the Stormwater Runoff Quantity Standards of N.J.A.C. 7:8-5.6(b)1
As demonstrated above, the Post-B drainage area does not meet the Stormwater Runoff Quantity Control Requirements of N.J.A.C. 7:8-5.6(b)3. A comparison of the pre- and post-construction design storm peak flow rates is made to determine whether Post-B drainage area meets the Stormwater Runoff Quantity Control Requirements of N.J.A.C. 7:8-5.6(b)1.
Drainage Area Name
Pre-construction Design Storm Flow Rate (cfs)
Post-construction Design Storm Flow Rate (cfs)
2-year 10-year 100- 2-year 10-year 100-yearPost-B1 (building or walkway) 1.61 2.58 4.40 0.52 0.83 1.41 Post-B2 (open space/ grass > 75% and woods) 0.13 0.34 0.81 0.53 1.28 2.86
Total Post-B 1.74 2.92 5.21 1.05 2.11 4.27
The comparisons between the pre- and post-construction design storm peak flow rates show that the peak flow rates of the post-construction condition are less than the peak flow rates of the pre-construction. However, N.J.A.C. 7:8-5.6(b)1 does not require a comparison of the pre- and post-construction condition peak flow rates. This standard requires the demonstration that the post-construction runoff hydrographs for the 2-, 10- and 100-year design storm events do not exceed, at any point in time, the pre-construction runoff hydrographs for the same storm events. Therefore, from the definition of a hydrograph on Page 2, this standard means that the flow rates of the post-construction hydrograph at every point in time must be less than the flow rates of the pre-construction hydrograph for the same instance of time. A comparison of the 100-year design storm hydrographs for the pre-construction and post-construction conditions for the Post-B drainage area is shown on the next page.
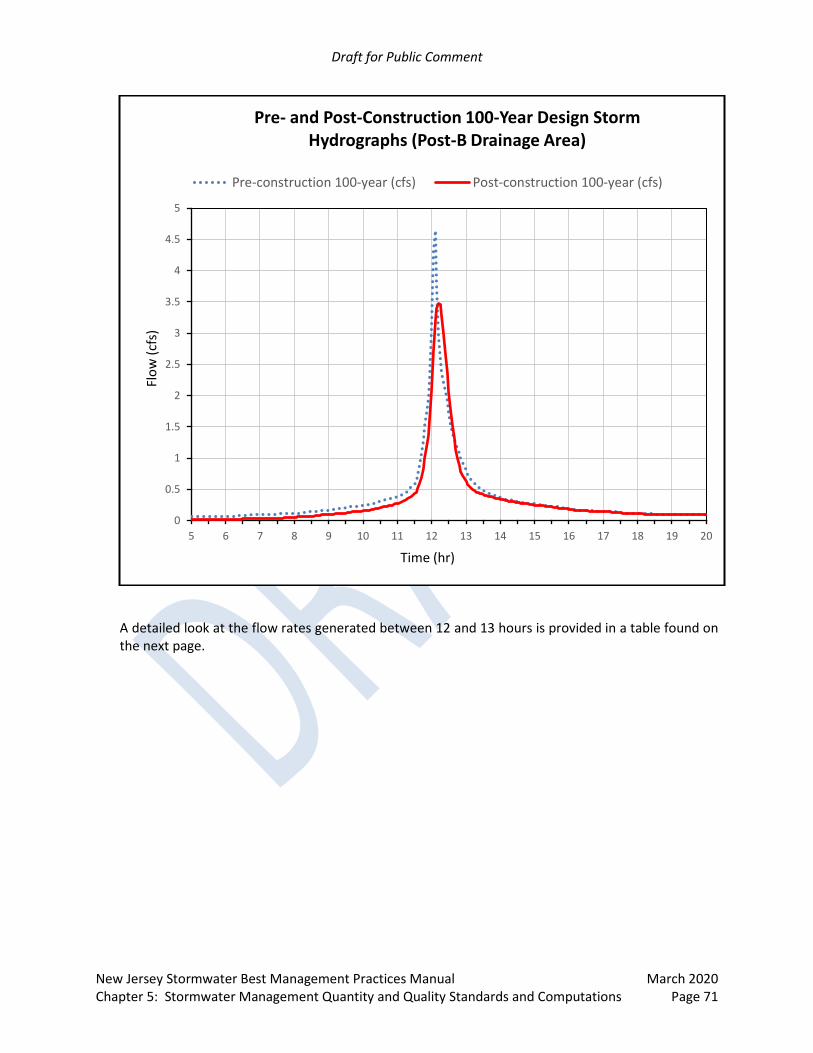
Draft for Public Comment
New Jersey Stormwater Best Management Practices Manual March 2020 Chapter 5: Stormwater Management Quantity and Quality Standards and Computations Page 71
A detailed look at the flow rates generated between 12 and 13 hours is provided in a table found on the next page.
0
0.5
1
1.5
2
2.5
3
3.5
4
4.5
5
5 6 7 8 9 10 11 12 13 14 15 16 17 18 19 20
Pre- and Post-Construction 100-Year Design Storm Hydrographs (Post-B Drainage Area)
Pre-construction 100-year (cfs)… Post-construction 100-year (cfs)…
Flow
(cfs
)
Time (hr)

Draft for Public Comment
New Jersey Stormwater Best Management Practices Manual March 2020 Chapter 5: Stormwater Management Quantity and Quality Standards and Computations Page 72
In the table below, yellow shaded cells denote a time increment at which the Post-Construction Peak Flow Rate exceeds the Pre-Construction Peak Flow Rate.
Time (hours)
Pre-construction
flow (cfs)
Post-construction
flow (cfs)
Difference (Pre – Post)
(cfs)
Time (hours)
Pre-construction
flow (cfs)
Post-construction
flow (cfs)
Difference (Pre – Post)
(cfs)
12 3.07 2.06 1.01 12.55 1.54 1.78 -0.24
12.05 4.33 2.72 1.61 12.6 1.39 1.53 -0.14
12.1 4.65 3.21 1.44 12.65 1.30 1.32 -0.02
12.15 3.78 3.39 0.39 12.7 1.23 1.14 0.09
12.2 2.95 3.47 -0.52 12.75 1.15 0.99 0.16
12.25 2.56 3.46 -0.9 12.8 1.08 0.88 0.2
12.3 2.37 3.29 -0.92 12.85 1 0.79 0.21
12.35 2.22 2.99 -0.77 12.9 0.93 0.72 0.21
12.4 2.07 2.66 -0.59 12.95 0.86 0.67 0.19
12.45 1.91 2.35 -0.44 13 0.8 0.62 0.18
12.5 1.73 2.06 -0.33 ----- ----- ----- ------
The hydrographs on the preceding page, as well as the information in the table depicted above, show that the post-construction 100-year design storm flow rate exceeds the pre-construction 100-year design storm flow rate from 12.2 to 12.65 hours. Therefore, drainage area Post-B has failed to demonstrate compliance with N.J.A.C. 7:8-5.6(b)1.
Step 7: Since Post-B Drainage Area Failed to Meet the Stormwater Runoff Quantity Control Standards of N.J.A.C. 7:8-5.6(b), on its own, Determine Whether the Site as a Whole Meets the Stormwater Runoff Quantity Control Standards of N.J.A.C. 7:8-5.6(b)
The question here is whether stormwater runoff from drainage areas Post-A and Post-B can be combined together to meet the Stormwater Runoff Quantity Control requirements either under N.J.A.C. 7:8-5.6(b)3 or N.J.A.C. 7:8-5.6(b)1. The table below illustrates combining post-construction flow rates from drainage areas A and B for each of the regulatory design storms.
Post-construction Drainage Area Designation
Allowable Design Storm Peak Flow Rate (cfs) under
N.J.A.C. 7:8-5.6(b)3
Design Storm Peak Flow Rate with a Small-Scale Infiltration Basin in drainage area Post-A
2-year 10-year 100-year 2-year 10-year 100-year
Post-A 0.23 0.96 2.81 0.23 0.84 2.56
Post-B 0.88 2.20 4.17 1.02 2.07 4.22
Post A and B Combined 1.11 3.16 6.98 1.25 2.91 6.78

Draft for Public Comment
New Jersey Stormwater Best Management Practices Manual March 2020 Chapter 5: Stormwater Management Quantity and Quality Standards and Computations Page 73
The combined post-construction 10- and 100-year storm peak flow rates for the whole site are 2.91 and 6.78 cfs, respectively, which are less than the allowable 10- and 100-year design storm peak flow rates, 3.16 cfs and 6.98 cfs, respectively. However, the combined post-construction 2-year peak flow rate 1.25 cfs is greater than the allowable 2-year design storm peak flow rate of 1.11 cfs.
If the hydrographs of the 2-year storm for the pre- and post-construction conditions are compared, it seems that the stormwater runoff quantity control requirements, when analyzing the site as a whole, for the 2-year design storm have been met under N.J.A.C. 7:8-5.6(b)1 since the post-construction hydrograph for the entire site does not exceed, at any point in time, the pre-construction hydrograph.
At this point, it would be incorrect to state that areas Post-A and Post-B – combined - meet the Stormwater Runoff Quantity Control Standards of N.J.A.C. 7:8-5.6(b)1 for the 2-year design storm and those of N.J.A.C. 7:8-5.6(b)3 for the 10- and 100-year design storms. N.J.A.C. 7:8-5.2(l) requires
If there is more than one drainage area, the groundwater recharge, stormwater runoff quality, and stormwater runoff quantity standards at N.J.A.C. 7:8-5.4, 5.5, and 5.6 shall be met in each drainage area, unless the runoff from the drainage areas converge onsite and no adverse environmental impact would occur as a result of compliance with any one or more of the individual standards being determined utilizing a weighted average of the results achieved for that individual standard across the affected drainage areas.
Specifically, N.J.A.C. 7:8-5.6(b)1 and N.J.A.C. 7:8-5.6(c) both require the standards be applied to the stormwater leaving the site or at the boundary to each abutting lot, roadway, watercourse or receiving storm sewer system. Recall that the runoff from drainage area Post-B discharges at a point on one side of the property and drains to a municipal storm sewer system, while the runoff from
0
0.2
0.4
0.6
0.8
1
1.2
1.4
1.6
1.8
5 7 9 11 13 15 17 19 21 23
Pre- and Post-Construction 2-Year Design Storm Hydrographs (Drainage Areas A and B Combined)
Pre-Construction Flow (cfs) Post-Construction Flow (cfs)

Draft for Public Comment
New Jersey Stormwater Best Management Practices Manual March 2020 Chapter 5: Stormwater Management Quantity and Quality Standards and Computations Page 74
drainage area Post-A is discharged on the other side of the property and drains to the riparian zone of a creek. The flows do not converge into one point of discharge before leaving the site boundaries. Therefore, the hydrographs for drainage area Post-A cannot be combined with the hydrographs of drainage area Post-B, and in other words, the above combined hydrograph or combined flow rates cannot be used to demonstrate the compliance with the requirements under N.J.A.C. 7:8-5.6(b)1.
Furthermore, the requirements under N.J.A.C. 7:8-5.6(b)1, 2 and 3 are three separate options that cannot be mixed. In each option, all three design storms are stated, which means one cannot choose to use one of the options from N.J.A.C. 7:8-5.6(b) for a single design storm and pick another option for a different design storm and so forth when in the same drainage area.
Therefore, in this example, the stormwater management design for drainage area Post-B alone will need to demonstrate compliance with either N.J.A.C. 7:8-5.6(b)1, 2 or 3. Moreover, the required demonstration of N.J.A.C. 7:8-5.6(b)2 is an analysis of the whole watershed, which will be a more difficult task than the demonstration of the requirement specified in N.J.A.C. 7:8-5.6(b)1 or 3.
In conclusion, the Post-B drainage area, as shown above, has failed to meet the requirements under N.J.A.C. 7:8-5.6(b)3. In the next step, green infrastructure will be evaluated to provide the required stormwater runoff quantity controls for the Post-B drainage area and to bring this portion of the site into compliance with the design and performance standards.
Step 8: Design Small-Scale Bioretention Basins to Address Roof Runoff from Drainage Area Post-B
Two small-scale bioretention basins are proposed to provide stormwater runoff quantity controls for the Post-B1 drainage area. Each of the basins has a footprint measuring 425 sf in area. A 4 in orifice elevated 1 ft above the basin bottom is used as the outlet structure for each of the proposed small scale-bioretention basins during the 2-, 10- and 100-year design storms. Soil permeability tests were conducted at the most restrictive soil layer within the proposed small-scale bioretention basins. The tested soil permeability rate is 1 in/hr. The design permeability rate, equal to one-half of the tested permeability rate, is 0.5 in/hr and is used as the exfiltration rate in the 2-, 10- and 100- year design storm routings. The summary report from the modeling software is shown on the next page for the 100-year design storm.

Draft for Public Comment
New Jersey Stormwater Best Management Practices Manual March 2020 Chapter 5: Stormwater Management Quantity and Quality Standards and Computations Page 75
100-year Design Storm Summary Report
Source: HydroCAD® Summary Report; HydroCAD is a register trademark of HydroCAD Software Solutions LLC. Used with permission In addition, the upper portions of the design storm summary reports are shown below for the 10- and 2-year storms. 10-year Design Storm Summary Report
Source: HydroCAD® Summary Report; HydroCAD is a register trademark of HydroCAD Software Solutions LLC. Used with permission
2-year Design Storm Summary Report
Source: HydroCAD® Summary Report; HydroCAD is a register trademark of HydroCAD Software Solutions LLC. Used with permission

Draft for Public Comment
New Jersey Stormwater Best Management Practices Manual March 2020 Chapter 5: Stormwater Management Quantity and Quality Standards and Computations Page 76
The peak flow rates resulting from the proposed design are as follows:
Post-construction Drainage Area Designation
Allowable Design Storm Peak Flow Rate (cfs)
Design Storm Peak Flow Rates with a Small-Scale
Bioretention Basin (cfs)
2-year 10-year 100-year 2-year 10-year 100-yearPost-B1 (building/walkway) after small-scale bioretention basins 0.81 1.94 3.52 0.32 0.5 0.74 Post-B2 (open space, grass > 75% and woods) 0.07 0.26 0.65 0.53 1.28 2.86
Post-B 0.88 2.20 4.17 0.85 1.78 3.60
Note that the peak flow rates from each small-scale bioretention basin are 0.16, 0.25 and 0.37 cfs for the 2-, 10- and 100-year design storms. Since there are two small-scale bioretention basins in the Post-B1 drainage area, the total post-construction design peak flow rates are twice the peak flow rates from each small-scale bioretention basin. The total peak flow rates for drainage area Post-B are 0.85, 1.78 and 3.60 cfs for the 2-, 10- and 100-year design storms, for which each of the design storm values are less than the allowable design storm peak flow rates, i.e., 0.88, 2.20 and 4.17 cfs, respectively. By constructing the two small-scale bioretention basins (rain gardens), the stormwater runoff peak flow rates from drainage area Post-B meet the design standard under N.J.A.C. 7:8-5.6(b)3.
Step 9: Groundwater Mounding Analysis
NJDEP’s Hantush Spreadsheet is used for the groundwater mounding analysis. Assume each small-scale bioretention basins is 25 ft by 17 ft. The recharge rate, R, is the design permeability rate, 0.5 in/hr. The parameters for specific yield, Sy, and the horizontal hydraulic conductivity, Kh, are set at the default values specified in Chapter 13. The horizontal hydraulic conductivity rate is 5 times the recharge rate since the site, located in Ocean County, is in the coastal plain. The x and y values are equal to half of the respective basin dimensions.
The duration of infiltration period of each basin during the 100-year storm is calculated by using the exfiltration (discarded) volume, 820 cf, the footprint of the basin, 425 sf, and the exfiltration rate, 0.5 in/hr. The result is 46.30 hr.
The results, depicted on the following page, show that the maximum height of the groundwater mounding, Δh(max), is 2.10 ft. Since the groundwater table is 8 ft below the existing ground elevation, the elevated groundwater table will be 5.9 ft below the existing ground level. The proposed small-scale bioretention basin has a 100-year storm outlet structure at 1ft. The basin also has 1 ft of freeboard and a soil bed 1.5 ft in depth. Therefore, the lowest point of the proposed basin is 3.5 ft below the existing ground elevation. Since the elevated groundwater table will be 5.9 feet below the existing ground elevation, the elevated groundwater level will not have adverse impact on the drainage of the basin.

Draft for Public Comment
New Jersey Stormwater Best Management Practices Manual March 2020 Chapter 5: Stormwater Management Quantity and Quality Standards and Computations Page 77
The groundwater mounding curve shows that within 40 ft from the center of the proposed small-scale bioretention (27.5 ft from the edge of the basin), the groundwater level will be elevated by approximately 0.32 ft, or roughly 7.68 ft below the existing ground elevation. If there is a basement within 40 ft of one of the small-scale bioretention basins and the slab of the basement is 8 ft below the existing ground elevation, the basement may sometimes experience inundation by the temporary increase in groundwater level during the 100-year storm. Therefore, the small-scale bioretention basins may need to be located away from the building to consider the possibility that the lowest point of the basement may sometimes be below the elevated groundwater table.
SHWT

Draft for Public Comment
New Jersey Stormwater Best Management Practices Manual March 2020 Chapter 5: Stormwater Management Quantity and Quality Standards and Computations Page 78
Example 5-8B:
The proposed development is the same as that of Example 5-8A, but a swale is proposed to run through drainage area B and directs the runoff from drainage area B to the discharge point of drainage area A. Determine whether the proposed development meets the stormwater runoff quantity standards under N.J.A.C. 7:8-5.6(b).
Step 1: Design the Grass Swale
Grass swales are one of the green infrastructure BMPs listed in Table 5-1 of N.J.A.C. 7:8-5.2, but as stated in this table, they cannot be used to meet the groundwater recharge or stormwater runoff quantity requirements of N.J.A.C. 7:8-5.4 and 5.6. However, grass swales can be designed to provide conveyance of stormwater runoff from one drainage area to another drainage area. A grass swale also can be designed to convey flows at a lower flow velocity, which results in a slower time of concentration, than that of a stormwater drainage pipe, which typically has a smooth surface.
Assuming the grass swale has a bottom width of 4 ft, a depth of 0.5 ft, a slope of 0.5%, a length of 600 ft and a Manning’s roughness coefficient 0.022, the grass swale will be able to convey the peak flow of stormwater runoff produced by the 100-year design storm with a runoff depth of 0.32 ft and a maximum flow velocity of 1.92 fps, which is under the maximum allowable velocity of 2.5 fps, for sandy clay loam soil texture as suggested in the Standards for Soil Erosion and Sediment Control in New Jersey.
Grass Swale Summary Report for the 100-year Design Storm
Source: HydroCAD® Summary Report; HydroCAD is a register trademark of HydroCAD Software Solutions LLC. Used with permission

Draft for Public Comment
New Jersey Stormwater Best Management Practices Manual March 2020 Chapter 5: Stormwater Management Quantity and Quality Standards and Computations Page 79
Grass Swale Summary Report for the 10-year Design Storm
Source: HydroCAD® Summary Report; HydroCAD is a register trademark of HydroCAD Software Solutions LLC. Used with permission
Grass Swale Summary Report for the 2-year Design Storm
Source: HydroCAD® Summary Report; HydroCAD is a register trademark of HydroCAD Software Solutions LLC. Used with permission

Draft for Public Comment
New Jersey Stormwater Best Management Practices Manual March 2020 Chapter 5: Stormwater Management Quantity and Quality Standards and Computations Page 80
To summarize the reports listed above, the stormwater runoff peak flow rates for the 2-, 10- and 100-year design storms, generated by the Post-B drainage area and conveyed by the grass swale to the discharge point of convergence in Post-A drainage area are listed in the table below.
Post-construction Drainage Area Designation
Design Storm Peak Flow Rates with a Grass Swale (cfs)
2-year 10-year 100-year
Post-B 0.74 1.61 3.43
Step 2: Address Groundwater Recharge
Regarding groundwater recharge, drainage area Post-B has less impervious surface (0.16 acres) than that of drainage area Pre-B, namely 0.5 acres, in the pre-development condition. However, the project proposes to change the land cover from woods to grass lawn, which will reduce the amount of stormwater runoff providing groundwater recharge. Therefore, an evaluation of the groundwater recharge deficit is needed. See Chapter 6 of this manual for guidance on performing a groundwater recharge analysis.
Step 3: Address Stormwater Runoff Quantity Control
Although not mentioned in the initial description, the stormwater runoff generated by the proposed building and walkway will flow as overland flow across the proposed lawn area. The lawn area is graded to direct this runoff to the same grass swale and discharge point for the Post-A drainage area. The stormwater runoff generated by both the roof and the non-vehicular walkway do not require water quality treatment. Drainage area Post-A1 will still require a small-scale infiltration basin to provide the required stormwater runoff quantity and quality controls, in addition to the groundwater recharge requirement for the stormwater runoff generated by the proposed gravel parking lot. Drainage area Post-A2 will not be disturbed and is therefore not subject to the stormwater runoff quality and quantity requirements, nor those for groundwater recharge.
In this example, the initial description states that the stormwater runoff from Drainage Areas A and B converge into one discharge point (i.e., the point of analysis A) before leaving the site. Therefore, the peak flow rates for 2-, 10- and 100-year design storms of the two drainage areas can be added to calculate the peak flow rates at the discharge location.
Post-construction Drainage Area Designation
Allowable Design Storm Peak Flow Rate (cfs) per the N.J.A.C. 7:8-5.6(b)3 Standard
Design Storm Peak Flow Rate (cfs)
2-year 10-year 100-year 2-year 10-year 100-year
Post-A 0.23 0.96 2.81 0.23 0.84 2.56
Post-B 0.88 2.20 4.17 0.74 1.61 3.43 Post A and B Combined 1.11 3.16 6.98 0.97 2.45 5.93
As the results show in the table above, each of the combined post-construction peak flow rates for the 2-, 10- and 100-year design storms are less than the respective allowable design storm peak flow rates. Therefore, the site as a whole meets the stormwater runoff quantity standards of N.J.A.C. 7:8-5.6(b)3.
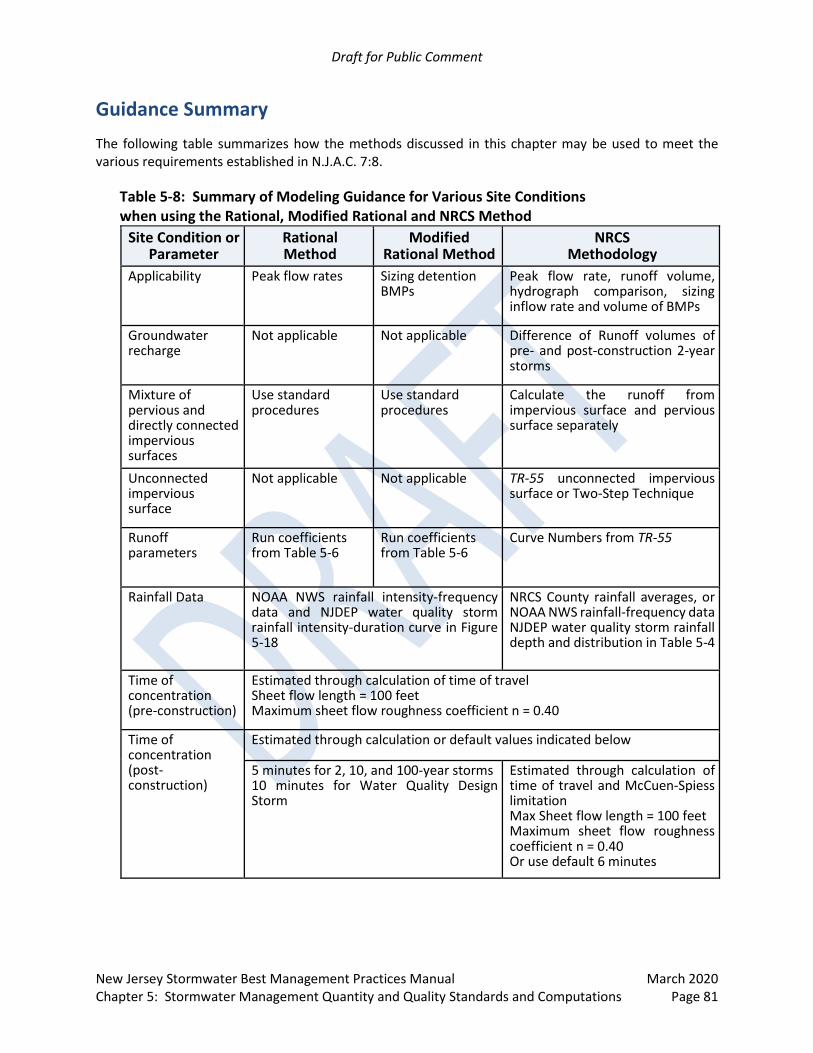
Draft for Public Comment
New Jersey Stormwater Best Management Practices Manual March 2020 Chapter 5: Stormwater Management Quantity and Quality Standards and Computations Page 81
Guidance Summary The following table summarizes how the methods discussed in this chapter may be used to meet the various requirements established in N.J.A.C. 7:8.
Table 5-8: Summary of Modeling Guidance for Various Site Conditions when using the Rational, Modified Rational and NRCS Method
Site Condition or Parameter
Rational Method
Modified Rational Method
NRCS Methodology
Applicability Peak flow rates Sizing detention BMPs
Peak flow rate, runoff volume, hydrograph comparison, sizing inflow rate and volume of BMPs
Groundwater recharge
Not applicable Not applicable Difference of Runoff volumes of pre- and post-construction 2-year storms
Mixture of pervious and directly connected impervious surfaces
Use standard procedures
Use standard procedures
Calculate the runoff from impervious surface and pervious surface separately
Unconnected impervious surface
Not applicable Not applicable TR-55 unconnected impervious surface or Two-Step Technique
Runoff parameters
Run coefficients from Table 5-6
Run coefficients from Table 5-6
Curve Numbers from TR-55
Rainfall Data NOAA NWS rainfall intensity-frequency data and NJDEP water quality storm rainfall intensity-duration curve in Figure 5-18
NRCS County rainfall averages, or NOAA NWS rainfall-frequency data NJDEP water quality storm rainfall depth and distribution in Table 5-4
Time of concentration (pre-construction)
Estimated through calculation of time of travel Sheet flow length = 100 feet Maximum sheet flow roughness coefficient n = 0.40
Time of concentration (post-construction)
Estimated through calculation or default values indicated below
5 minutes for 2, 10, and 100-year storms 10 minutes for Water Quality Design Storm
Estimated through calculation of time of travel and McCuen-Spiess limitation Max Sheet flow length = 100 feet Maximum sheet flow roughness coefficient n = 0.40 Or use default 6 minutes

Draft for Public Comment
New Jersey Stormwater Best Management Practices Manual March 2020 Chapter 5: Stormwater Management Quantity and Quality Standards and Computations Page 82
References
Center for Watershed Protection. March 2003. Impacts of Impervious Cover on Aquatic Systems – Watershed Protection Research Monograph No. 1. Ellicott City, MD.
Claytor, R. and T. Schueler. December. 1996. Design of Stormwater Filtering Systems. The Center for Watershed Protection. Ellicott City, MD.
Desbonnet, A., P. Pogue, V. Lee, and N Wolff. 1994. Vegetated Buffers in the Coastal Zone – A Summary Review and Bibliography, Coastal Resources Center Technical Report No. 2064. University of Rhode Island Graduate School of Oceanography. Narragansett, RI.
Horner, R.R., J.J. Skupien, E.H. Livingston and H.E. Shaver. August 1994. Fundamentals of Urban Runoff Management: Technical and Institutional Issues. In cooperation with U.S. Environmental Protection Agency. Terrene Institute, Washington, D.C.
Langan, T. National Stormwater BMP Database, NSW Statistical Summary 6-18-03 Tables.
Lucas, W.C. October 2002. DURMM: Delaware Urban Runoff Management Model Users Manual. Delaware Department of Natural Resources and Environmental Conservation.
Massachusetts Department of Environmental Protection. 1997. Stormwater Management Volume Two: Stormwater Technical Handbook.
McCuen, Richard H. Development and Evaluation of TR-55 Composite Curve Number for Unconnected Imperviousness.
New Jersey Department of Agriculture. January 2014. Standards for Soil Erosion and Sediment Control in New Jersey. State Soil Conservation Committee. Trenton, NJ.
New Jersey Department of Environmental Protection and Department of Agriculture. December 1994. Stormwater and Nonpoint Source Pollution Control Best Management Practices.
New Jersey Department of Environmental Protection, Land Use Management Program. September 1995. Technical Manual for Stream Encroachment Permits.
New Jersey Department of Environmental Protection, Land Use Management Program. 1988. Technical Manual for Land Use Regulation Program, Bureau of Inland and Coastal Regulations, NJDEP Flood Hazard Area Permits, New Jersey Department of Environmental Protection. Trenton, NJ.
Northeast National Technical Center. June 1986. Hydrology Technical Note No. N4 – Time of Concentration. USDA Natural Resources Conservation Service.
Northeast National Technical Center. 1986. Memorandum: Sheet Flow in the Northeast. USDA Natural Resources Conservation Service.
Pitt, R., J. Lantrip and R. Harrison. December 1999. Infiltration through Disturbed Urban Soils and Compost-Amended Soil Effects on Runoff Quality and Quantity. U.S. Environmental Protection Agency.

Draft for Public Comment
New Jersey Stormwater Best Management Practices Manual March 2020 Chapter 5: Stormwater Management Quantity and Quality Standards and Computations Page 83
Schueler, T.R. July 1987. Controlling Urban Runoff: A Practical Manual for Planning and Designing Urban BMPs. Metropolitan Washington Council of Governments. Washington, D.C.
Schueler, T.R. and R.A. Claytor. 2000. Maryland Stormwater Design Manual. Maryland Department of the
Environment. Baltimore, MD. Strecker, E.W., M.M. Quigley, B. Urbonas. Results of Analyses of the Expended EPA/ASCS National BMP
Database. U.S. Army Corps of Engineers Hydrologic Engineering Center. HEC-1 Flood Hydrograph Package Users
Manual. U.S. Army Corps of Engineers Hydrologic Engineering Center. HEC-HMS Hydrologic Modeling System Users
Manual. USDA Natural Resources Conservation Service. National Engineering Handbook, Part 630, Hydrology. USDA Natural Resources Conservation Service. Technical Release 20 – Project Formulation – Hydrology. USDA Natural Resources Conservation Service. June 1986. Technical Release 55 – Urban Hydrology for
Small Watersheds. USDA Natural Resources Conservation Service. April 2002. Win-TR55 – User Manual. USDA Natural Resources Conservation Service, September 10, 2012, Engineering Field Handbook
Supplement, Chapter 2, Estimating Runoff and Peak Discharges, NEW JERSEY BULLETIN NO. NJ210-12-1.
USDA Natural Resources Conservation Service, September 27, 2012, WinTR-55 frequently asked
precipitation questions. USDA Natural Resources Conservation Service, December 17, 2001, References on time of concentration
with respect to sheet flow, USDA, NRCS, National Water and Climate Center, Beltsville, MD. USDA Natural Resources Conservation Service, January 2009, Small Watershed Hydrology WinTR–55 User
Guide, Washington D.C. Viessman, W. Jr., J.W. Knapp, G.L. Lewis and T.E. Harbaugh. 1977 Introduction to Hydrology – Second
Edition. Harper & Row. New York. Walesh, S.G. 1989. Urban Surface Water Management. John Wiley & Sons, Inc. New York. Wanielista, M.P. and Y.A. Yousef. 1993. Stormwater Management. John Wiley & Sons, Inc. New York. Whipple, W., N.S. Grigg, T. Grizzard, C.W. Randall, R.P. Shubinski and L.S. Tucker. 1983. Stormwater
Management in Urbanizing Areas. Prentice-Hall, Inc. Englewood Cliffs, New Jersey. Winer, R. June 2000. National Pollutant Removal Performance Database for Stormwater Treatment
Practices, 2nd Edition, Center for Watershed Protection. Wong, S.L. and R.H. McCuen. Design of Vegetated Buffer Strips for Runoff and Sediment Control.
Related Documents