www.njpms.in 1 Portfolio Management Services For private circulation only. This presentation contains 51 slides and must be viewed in its entirety. A RULE-BASED ACTIVE PORTFOLIO MANAGER JANUARY 2022

Welcome message from author
This document is posted to help you gain knowledge. Please leave a comment to let me know what you think about it! Share it to your friends and learn new things together.
Transcript

www.njpms.in1Portfolio Management ServicesFor private circulation only. This presentation contains 51 slides and must be viewed in its entirety.
A RULE-BASEDACTIVE PORTFOLIOMANAGER
JANUARY 2022
www.njpms.in2Portfolio Management Services
For private circulation only. This presentation contains 51 slides and must be viewed in its entirety.
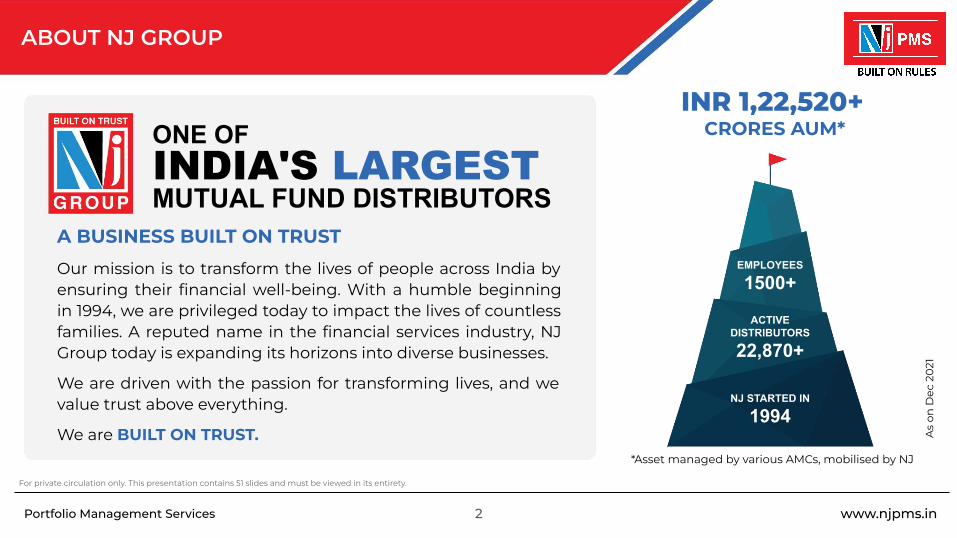
ABOUT NJ GROUP
ONE OFINDIA'S LARGESTMUTUAL FUND DISTRIBUTORS
A BUSINESS BUILT ON TRUST
Our mission is to transform the lives of people across India by ensuring their financial well-being. With a humble beginning in 1994, we are privileged today to impact the lives of countless families. A reputed name in the financial services industry, NJ Group today is expanding its horizons into diverse businesses.
We are driven with the passion for transforming lives, and we value trust above everything.
We are BUILT ON TRUST.
INR 1,22,520+ CRORES AUM*
EMPLOYEES
1500+
ACTIVE DISTRIBUTORS
22,870+
NJ STARTED IN
1994
*Asset managed by various AMCs, mobilised by NJ
As
on D
ec 2
021

www.njpms.in3Portfolio Management Services
For private circulation only. This presentation contains 51 slides and must be viewed in its entirety.
NJ’s HORIZON
EMPLOYEES
1500+
FINANCIAL PRODUCTS DISTRIBUTION PLATFORM
MUTUAL FUNDS
EQUITY & ETF
BONDS & FD
NPS
LOAN AGAINST MF
INSURANCE BROKING
NBFC OFFSHORE
ASSET MANAGEMENT
EDUCATION WELLNESS
INTERIOR REAL ESTATE CHARITABLE TRUST

www.njpms.in4Portfolio Management Services
For private circulation only. This presentation contains 51 slides and must be viewed in its entirety.
NJ PMS
NJ Group's PMS business commenced in the year 2010. The total Assets Under Management (AUM) currently are INR 3,400+ Crores (As on Dec 31, 2021) with approximately 3,000+ investors.
NJ PMS offers to investors an array of products across Equities, Mutual Funds, ETF's, and more through investment approaches under Dynamic Asset Allocation Portfolios (DAAP) and Equity based portfolios.
NJ PMS follows the 'Rule-Based Active Investing' strategy from the root of its Portfolio Management proposition

www.njpms.in5Portfolio Management Services
For private circulation only. This presentation contains 51 slides and must be viewed in its entirety.
INTRODUCTION TO RULE-BASEDACTIVE INVESTING
RULE-BASED ACTIVE MANAGEMENT
PASSIVE INVESTING
TRADITIONALACTIVE MANAGEMENT
DISCIPLINED
MARKETRETURN
ACTIVERETURN
DISCRETIONARY MANAGEMENT
Bringing to you the best of both worlds
DISCIPLINED
ACTIVERETURN
www.njpms.in6Portfolio Management Services
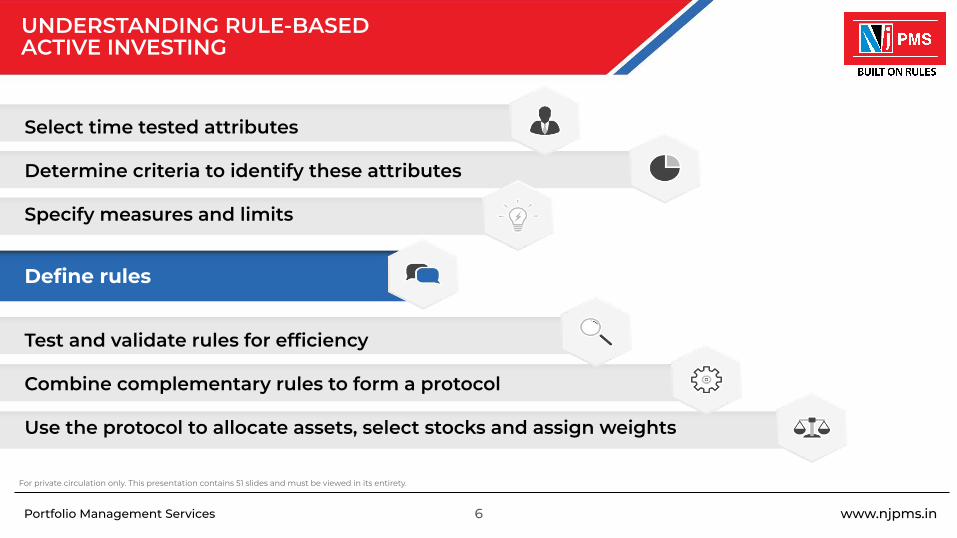
UNDERSTANDING RULE-BASEDACTIVE INVESTING
Select time tested attributes
Determine criteria to identify these attributes
Specify measures and limits
Test and validate rules for efficiency
Combine complementary rules to form a protocol
Use the protocol to allocate assets, select stocks and assign weights
Define rules
For private circulation only. This presentation contains 51 slides and must be viewed in its entirety.
www.njpms.in7Portfolio Management Services
For private circulation only. This presentation contains 51 slides and must be viewed in its entirety.
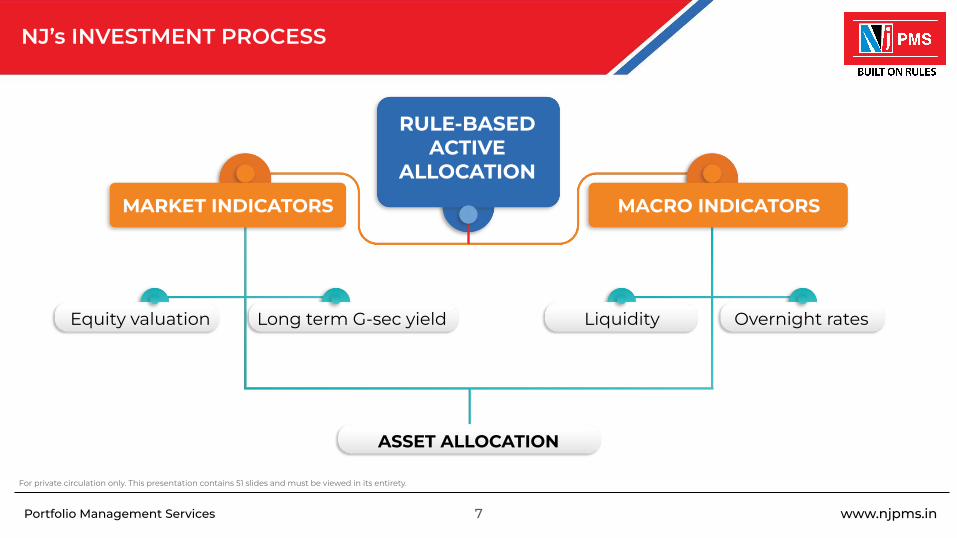
NJ’s INVESTMENT PROCESS
RULE-BASEDACTIVE
ALLOCATION
MARKET INDICATORS MACRO INDICATORS
Equity valuation Long term G-sec yield Liquidity Overnight rates
ASSET ALLOCATION

www.njpms.in8Portfolio Management Services
For private circulation only. This presentation contains 51 slides and must be viewed in its entirety.
NJ'S INVESTMENT PROCESS - STOCK SELECTION
RULE-BASED ACTIVE
SELECTION
MARKET FACTORS FUNDAMENTAL FACTORS
Momentum Volatility Value Quality
PORTFOLIO

www.njpms.in9Portfolio Management Services
For private circulation only. This presentation contains 51 slides and must be viewed in its entirety.
BENEFITS OF RULE-BASED ACTIVE INVESTING
Selection of securities is on a predefined set of rules, eliminating
human bias
The investment process is
pre-tested for performance and
volatility in various scenarios
The Portfolio stays "True to
Label" at all times

www.njpms.in10Portfolio Management Services For private circulation only. This presentation contains 51 slides and must be viewed in its entirety.
NJ PORTFOLIO MANAGEMENT SERVICESPRODUCT OFFERING

www.njpms.in11Portfolio Management Services
For private circulation only. This presentation contains 51 slides and must be viewed in its entirety.
CONVENTIONAL PMS MECHANISM
1
3
5
4
2Chasingreturns
Product Oriented approach
Equity ordebt orientation
Expensiveproposition
Discretionarymanagement
www.njpms.in12Portfolio Management Services
For private circulation only. This presentation contains 51 slides and must be viewed in its entirety.
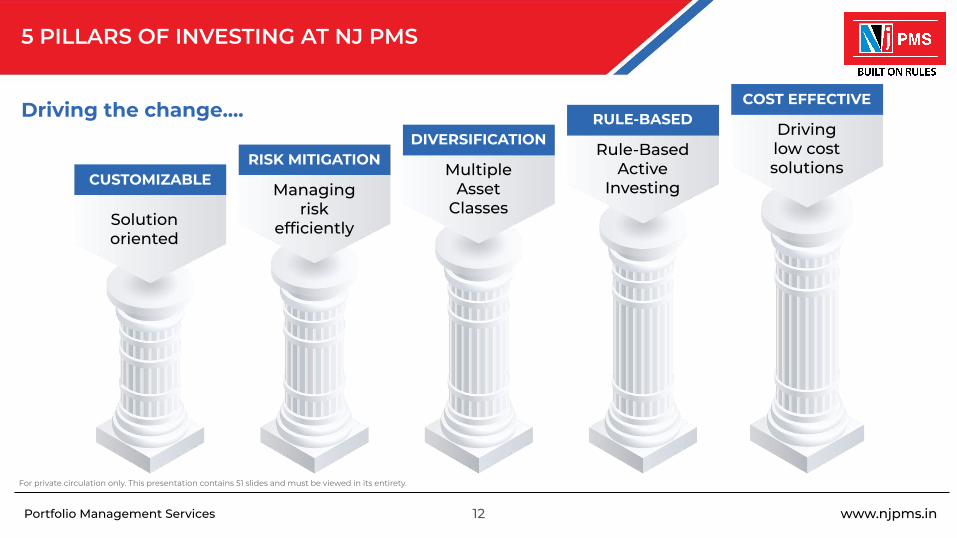
5 PILLARS OF INVESTING AT NJ PMS
Driving the change....
CUSTOMIZABLERISK MITIGATION
DIVERSIFICATIONRULE-BASED
COST EFFECTIVE
Solution oriented
Managingrisk
efficiently
MultipleAsset
Classes
Rule-Based Active
Investing
Drivinglow costsolutions
www.njpms.in13Portfolio Management Services
For private circulation only. This presentation contains 51 slides and must be viewed in its entirety.
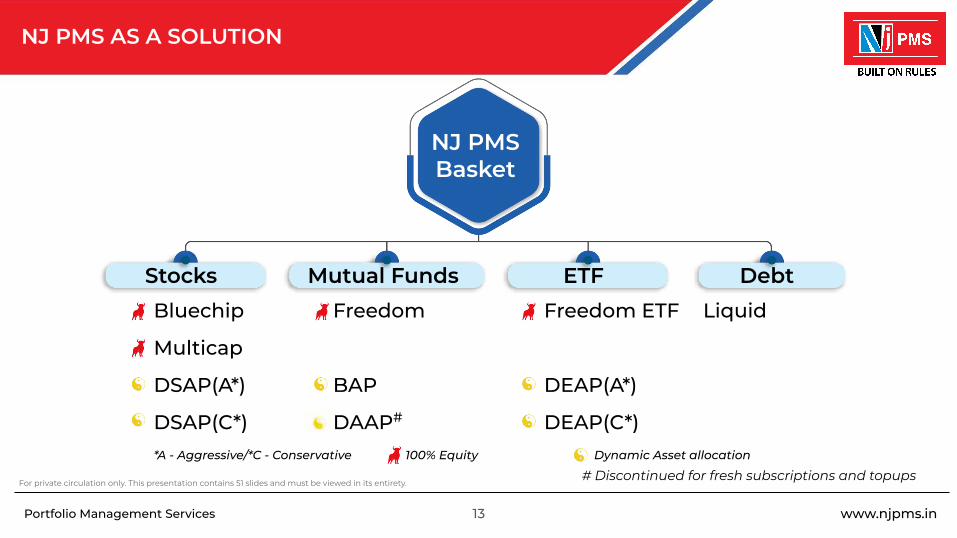
NJ PMS AS A SOLUTION
NJ PMS Basket
Stocks Mutual Funds ETF Debt
Bluechip
Multicap
DSAP(A*)
DSAP(C*)
Freedom
BAP
DAAP#
Freedom ETF
DEAP(A*)
DEAP(C*)
Liquid
Dynamic Asset allocation100% Equity*A - Aggressive/*C - Conservative
# Discontinued for fresh subscriptions and topups

www.njpms.in14Portfolio Management Services For private circulation only. This presentation contains 51 slides and must be viewed in its entirety.
BLUECHIP PORTFOLIO

www.njpms.in15Portfolio Management Services
BLUECHIP PORTFOLIOOBJECTIVE AND INVESTMENT APPROACH
For private circulation only. This presentation contains 51 slides and must be viewed in its entirety.
Investment Objective: To generate capital appreciation over a long term by investing in equities and equity related instruments.
The proposed investment approach is as summarised below :
● Rule-based stock selection
● Focus on companies with superior quality and momentum factors
● Portfolio would be reviewed for re-balancing on a half yearly basis
www.njpms.in16Portfolio Management Services
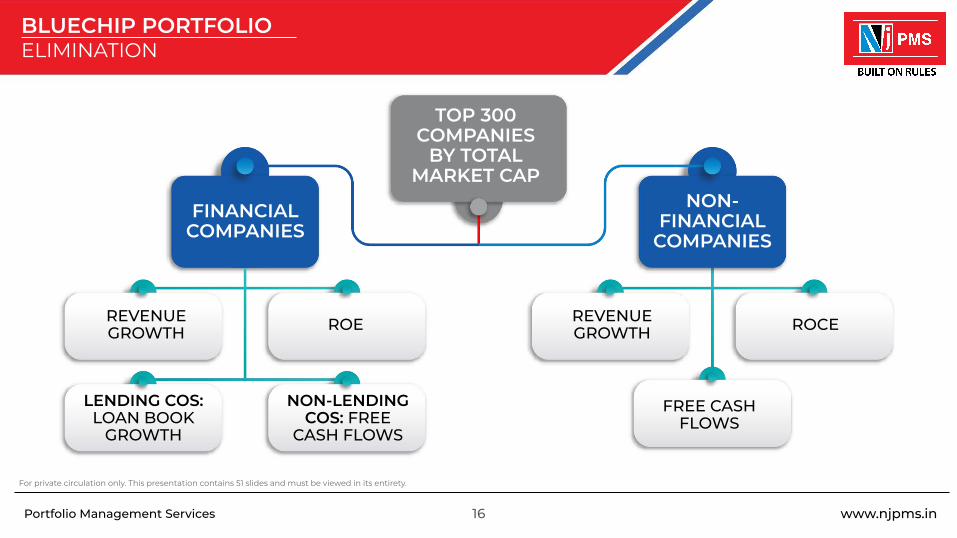
TOP 300 COMPANIES
BY TOTAL MARKET CAP
FINANCIALCOMPANIES
NON-FINANCIAL
COMPANIES
REVENUEGROWTH ROE REVENUE
GROWTH ROCE
LENDING COS: LOAN BOOK
GROWTH
NON-LENDING COS: FREE
CASH FLOWS
FREE CASH FLOWS
BLUECHIP PORTFOLIOELIMINATION
For private circulation only. This presentation contains 51 slides and must be viewed in its entirety.
www.njpms.in17Portfolio Management Services
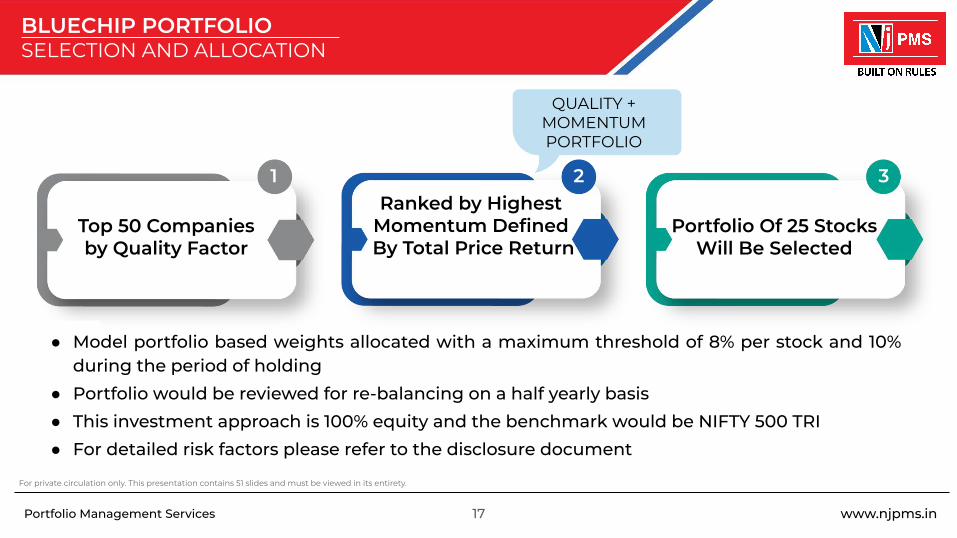
BLUECHIP PORTFOLIOSELECTION AND ALLOCATION
For private circulation only. This presentation contains 51 slides and must be viewed in its entirety.
QUALITY + MOMENTUM PORTFOLIO
Top 50 Companiesby Quality Factor
Ranked by Highest Momentum Defined By Total Price Return
Portfolio Of 25 Stocks Will Be Selected
● Model portfolio based weights allocated with a maximum threshold of 8% per stock and 10% during the period of holding
● Portfolio would be reviewed for re-balancing on a half yearly basis
● This investment approach is 100% equity and the benchmark would be NIFTY 500 TRI
● For detailed risk factors please refer to the disclosure document
1 2 3
www.njpms.in18Portfolio Management Services
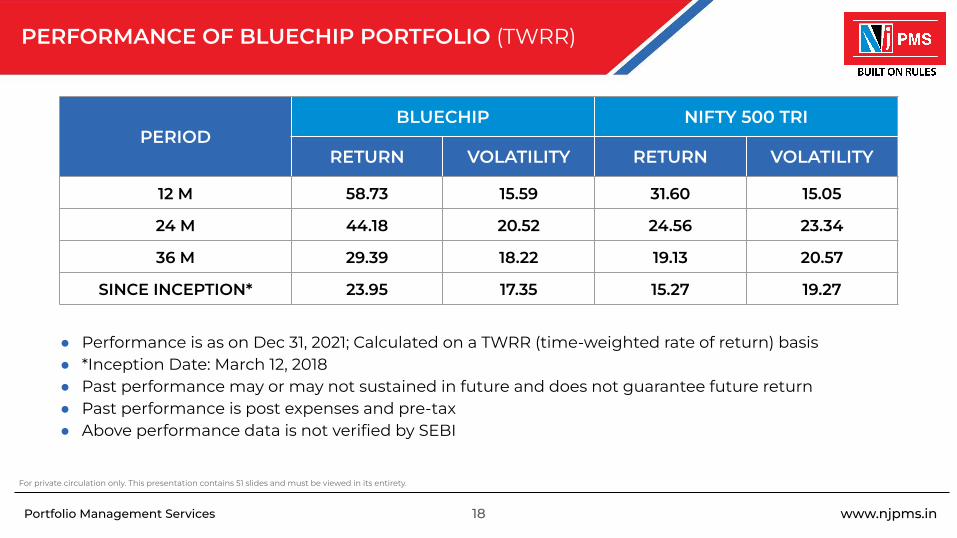
PERFORMANCE OF BLUECHIP PORTFOLIO (TWRR)
For private circulation only. This presentation contains 51 slides and must be viewed in its entirety.
● Performance is as on Dec 31, 2021; Calculated on a TWRR (time-weighted rate of return) basis ● *Inception Date: March 12, 2018● Past performance may or may not sustained in future and does not guarantee future return● Past performance is post expenses and pre-tax● Above performance data is not verified by SEBI
PERIODBLUECHIP NIFTY 500 TRI
RETURN VOLATILITY RETURN VOLATILITY
12 M 58.73 15.59 31.60 15.05
24 M 44.18 20.52 24.56 23.34
36 M 29.39 18.22 19.13 20.57
SINCE INCEPTION* 23.95 17.35 15.27 19.27
www.njpms.in19Portfolio Management Services For private circulation only. This presentation contains 51 slides and must be viewed in its entirety.
MULTICAP PORTFOLIO

www.njpms.in20Portfolio Management Services
MULTICAP PORTFOLIOOBJECTIVE AND INVESTMENT APPROACH
For private circulation only. This presentation contains 51 slides and must be viewed in its entirety.
Investment Objective: To deliver capital appreciation over a long term from a diversified portfolio that predominantly invests in equities and equity related instruments across various market capitalization.
The proposed investment approach is as summarised below :
● Rule-based stock selection
● Focus on companies with superior momentum and volatility factors
● Flexible allocation to invest across market capitalisation
● Portfolio would be reviewed for re-balancing on a quarterly basis

www.njpms.in21Portfolio Management Services
UNDERSTANDING RULE-BASED ACTIVE INVESTING
For private circulation only. This presentation contains 51 slides and must be viewed in its entirety.
● Model portfolio based weights allocated with a maximum threshold of 8% per stock and 10% during the period of holding● Portfolio would be reviewed for re-balancing on a quarterly basis● This investment approach is 100% in equities and the benchmark is NIFTY 500 TRI● For detailed risk factors please refer to the disclosure document
3 years + Listed track
record
Eliminates 25% of most volatile
stocks
Churn reducing
techniques
MOMENTUM + LOW VOLATILITY PORTFOLIO
TOP 300 COMPANIES BY TOTAL MARKET CAP
LOW VOLATILITY DEFINED BY STANDARD DEVIATION
HIGHEST MOMENTUM DEFINED BY TOTAL PRICE RETURN
PORTFOLIO OF 25-35 STOCKS WILL BE SELECTED

www.njpms.in22Portfolio Management Services
PERFORMANCE OF MULTICAP PORTFOLIO (TWRR)
For private circulation only. This presentation contains 51 slides and must be viewed in its entirety.
● Performance is as on Dec 31, 2021; Calculated on a TWRR (time-weighted rate of return) basis ● * Inception Date: April 02, 2016● Past performance may or may not sustained in future and does not guarantee future return● Past performance is post expenses and pre-tax● Above performance data is not verified by SEBI
PERIODMULTICAP NIFTY 500 TRI
RETURN VOLATILITY RETURN VOLATILITY
12 M 63.35 17.94 31.60 15.05
24 M 38.80 24.60 24.56 23.34
36 M 25.46 21.55 19.13 20.57
60M 14.59 20.03 17.89 17.54
SINCE INCEPTION * 15.10 19.43 17.20 17.07

www.njpms.in23Portfolio Management Services For private circulation only. This presentation contains 51 slides and must be viewed in its entirety.
FREEDOM ETF PORTFOLIO

www.njpms.in24Portfolio Management Services
FREEDOM ETF PORTFOLIOOBJECTIVE AND INVESTMENT APPROACH
For private circulation only. This presentation contains 51 slides and must be viewed in its entirety.
● Investment Objective: To generate capital appreciation over a long term through investments in equity oriented - Exchange Traded Funds (ETFs) and Index Funds tracking Indian or Foreign indices
● The proposed investment approach is as summarised below :○ Focused on investing in equity oriented ETFs tracking Indian / Foreign indices○ Currently the portfolio invests in ETFs that are tracking:
■ NIFTY 50 - 25%■ NIFTY NEXT 50 - 25%■ NIFTY MIDCAP 150 - 25%■ NASDAQ 100 - 25%
○ Portfolio re-balancing annually unless there is a large change in allocation due to index performance
○ Benchmark would be NIFTY 500 TRI

www.njpms.in25Portfolio Management Services
DIVERSIFICATION IS THE ONLY FREE LUNCH
For private circulation only. This presentation contains 51 slides and must be viewed in its entirety.
● All the Index values are INR denominated● All portfolios are re-balanced yearly● Back-tested period is from January 1, 1986 to July 31, 2020 (approx. 35 yrs)
STATISTICS SENSEX SENSEX & NASDAQCAGR 13% 16%
Standard deviation 25% 20%Downside deviation 15% 12%
Sharpe ratio 0.25 0.44Sortino ratio 0.41 0.72
Worst drawdown -61% -60%Worst month return -31% -18%Best month return 42% 27%Profitable months 58% 62%

www.njpms.in26Portfolio Management Services
PERFORMANCE OF FREEDOM ETF PORTFOLIO (TWRR)
For private circulation only. This presentation contains 51 slides and must be viewed in its entirety.
● Performance is as on Dec 31, 2021; Calculated on a TWRR (time-weighted rate of return) basis ● *Inception Date: March 09, 2018● Past performance may or may not sustained in future and does not guarantee future return● Past performance is post expenses and pre-tax● Above performance data is not verified by SEBI
PERIODFREEDOM ETF NIFTY 500 TRI
RETURN VOLATILITY RETURN VOLATILITY
12 M 32.31 11.83 31.60 15.05
24 M 23.78 18.78 24.56 23.34
36 M 16.29 17.24 19.13 20.57
SINCE INCEPTION* 12.80 16.64 15.69 19.25
www.njpms.in27Portfolio Management Services For private circulation only. This presentation contains 51 slides and must be viewed in its entirety.
DYNAMIC ASSET ALLOCATION PORTFOLIOS

www.njpms.in28Portfolio Management Services
POSITIONING
For private circulation only. This presentation contains 51 slides and must be viewed in its entirety.
RISK
RETURN
DEBT PORTFOLIO
DYNAMIC ASSET ALLOCATION PORTFOLIO
EQUITY PORTFOLIO ● Asset allocation is tactically managed based on our
Ruled-Based Active Asset Allocation protocol
● This protocol works on factors such as :
○ Interest Rate Cycles (Short Term & Long Term Rates)
○ Earnings growth rates (Equity Risk Premium)
○ Market Valuations (Relative Valuation)
● This protocol works on delivering superior risk adjusted returns
www.njpms.in29Portfolio Management Services
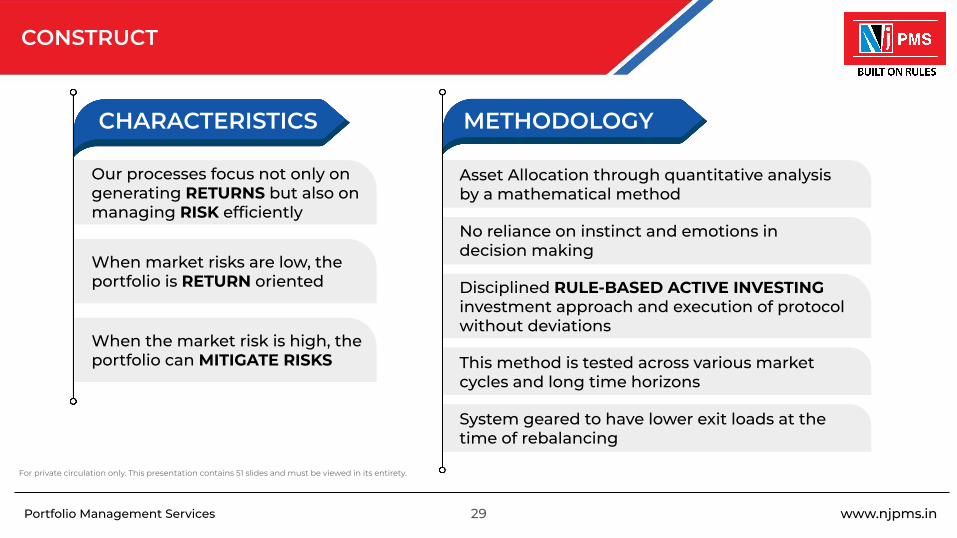
CONSTRUCT
For private circulation only. This presentation contains 51 slides and must be viewed in its entirety.
Our processes focus not only on generating RETURNS but also on managing RISK efficiently
When market risks are low, the portfolio is RETURN oriented
When the market risk is high, the portfolio can MITIGATE RISKS
Asset Allocation through quantitative analysis by a mathematical method
No reliance on instinct and emotions in decision making
Disciplined RULE-BASED ACTIVE INVESTING investment approach and execution of protocol without deviations
This method is tested across various market cycles and long time horizons
System geared to have lower exit loads at the time of rebalancing
METHODOLOGYCHARACTERISTICS
www.njpms.in30Portfolio Management Services
SIMULATED PERFORMANCE OF DAA MODEL
For private circulation only. This presentation contains 51 slides and must be viewed in its entirety.
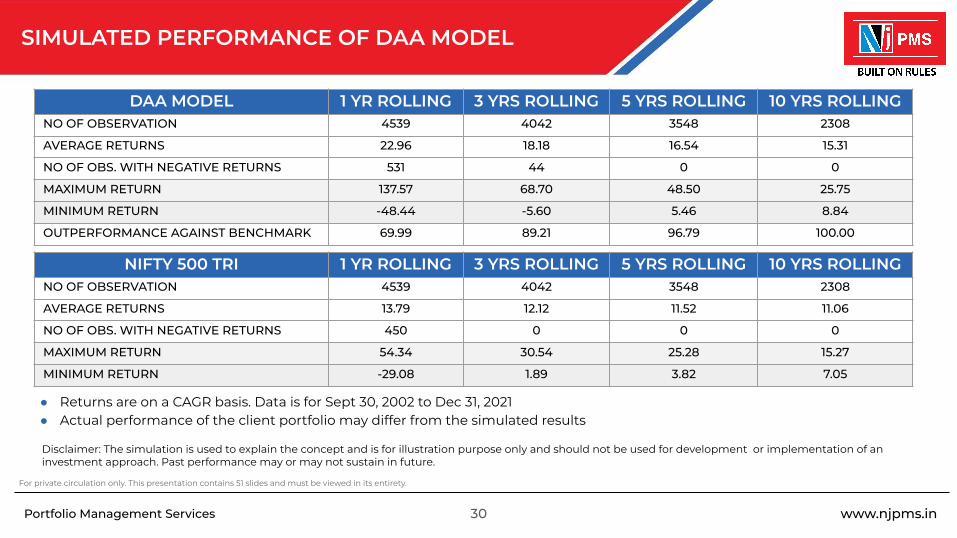
DAA MODEL 1 YR ROLLING 3 YRS ROLLING 5 YRS ROLLING 10 YRS ROLLINGNO OF OBSERVATION 4539 4042 3548 2308
AVERAGE RETURNS 22.96 18.18 16.54 15.31
NO OF OBS. WITH NEGATIVE RETURNS 531 44 0 0
MAXIMUM RETURN 137.57 68.70 48.50 25.75
MINIMUM RETURN -48.44 -5.60 5.46 8.84
OUTPERFORMANCE AGAINST BENCHMARK 69.99 89.21 96.79 100.00
NIFTY 500 TRI 1 YR ROLLING 3 YRS ROLLING 5 YRS ROLLING 10 YRS ROLLINGNO OF OBSERVATION 4539 4042 3548 2308
AVERAGE RETURNS 13.79 12.12 11.52 11.06
NO OF OBS. WITH NEGATIVE RETURNS 450 0 0 0
MAXIMUM RETURN 54.34 30.54 25.28 15.27
MINIMUM RETURN -29.08 1.89 3.82 7.05
● Returns are on a CAGR basis. Data is for Sept 30, 2002 to Dec 31, 2021● Actual performance of the client portfolio may differ from the simulated results
Disclaimer: The simulation is used to explain the concept and is for illustration purpose only and should not be used for development or implementation of an investment approach. Past performance may or may not sustain in future.

www.njpms.in31Portfolio Management Services
HISTORIC ASSET ALLOCATION TIMELINE
For private circulation only. This presentation contains 51 slides and must be viewed in its entirety.
● Source: NSE, Internal Research
Time Line Equity Debt NIFTY 500 TRI Level
Apr 4, 2016 65 35 9,279.23
Oct 1, 2016 35 65 10,677.17
Apr 4, 2017 50 50 11,682.98
Oct 1, 2017 40 60 12,577.95
Mar 1, 2018 35 65 13,531.83
Oct 1, 2018 35 65 13,569.58
Apr 1, 2019 40 60 14,421.49
Oct 1, 2019 50 50 13,840.55
Mar 12, 2020 70 30 11,879.69
Mar 27, 2020 75 25 10,550.20
Apr 3, 2020 80 20 10,000.86
Time Line Equity Debt NIFTY 500 TRI Level
Apr 7, 2020 85 15 10,770.05
Jul 15, 2020 75 25 13,124.91
Jul 30, 2020 65 35 13,648.72
Aug 19, 2020 45 55 14,237.02
Oct 5, 2020 30 70 14,403.97
Jan 5, 2021 20 80 17,848.06
Apr 13, 2021 25 75 18,562.24
May 31, 2021 45 55 20,138.10
Jul 2, 2021 40 60 20,585.64
Dec 20, 2021 55 45 21,918.48
Dec 31, 2021 55 45 22,990.88

www.njpms.in32Portfolio Management ServicesFor private circulation only. This presentation contains 51 slides and must be viewed in its entirety.
DYNAMIC STOCK ALLOCATION PORTFOLIO (DSAP) AGGRESSIVE

www.njpms.in33Portfolio Management Services
DSAP AGGRESSIVEOBJECTIVE AND INVESTMENT APPROACH
For private circulation only. This presentation contains 51 slides and must be viewed in its entirety.
● Investment Objective: To provide capital appreciation in the medium to long term with relatively lower volatility through a dynamically managed portfolio of equities and debt securities.
● This approach shall invest in following securities:○ Equity & equity related securities (0-100%)○ Cash, Debt oriented Mutual Fund schemes, Debt Exchange Traded Funds, Liquid Funds and
Arbitrage Funds (Direct Plans) (0-100%)
● The proposed investment approach is as summarised below :○ Rule-based asset allocation based on in-house proprietary model with focus on equities,
interest rate & other factors○ For equities, the methodology would be similar to our Bluechip portfolio○ For debt, selection of securities is based on lower credit risk and lower volatility○ Asset allocation re-balancing reviewed quarterly and security rebalancing reviewed half-yearly○ Benchmark would be NIFTY 50 Hybrid Composite Debt 50:50 Index
For detailed risk factors please refer to the disclosure document

www.njpms.in34Portfolio Management Services
PERFORMANCE OF DSAP(A) (TWRR)
For private circulation only. This presentation contains 51 slides and must be viewed in its entirety.
● Performance is as on Dec 31, 2021; Calculated on a TWRR (time-weighted rate of return) basis ● *Inception Date: April 02, 2016● Past performance may or may not sustained in future and does not guarantee future return● Past performance is post expenses and pre-tax● Above performance data is not verified by SEBI
PERIODDSAP (A) NIFTY 50 Hybrid Composite
Debt 50:50 Index AVERAGE EQUITY PROPORTIONRETURN VOLATILITY RETURN VOLATILITY
12 M 21.40 6.08 14.53 7.86 34.00
24 M 20.05 11.94 15.54 12.19 46.00
36 M 13.93 10.14 14.45 10.70 44.00
60M 11.39 8.75 13.07 9.05 42.00
SINCE INCEPTION* 11.13 8.56 12.88 8.78 44.00

www.njpms.in35Portfolio Management ServicesFor private circulation only. This presentation contains 51 slides and must be viewed in its entirety.
DYNAMIC ETF ALLOCATIONPORTFOLIO (DEAP) AGGRESSIVE
www.njpms.in36Portfolio Management Services
DEAP AGGRESSIVEOBJECTIVE AND INVESTMENT APPROACH
For private circulation only. This presentation contains 51 slides and must be viewed in its entirety.
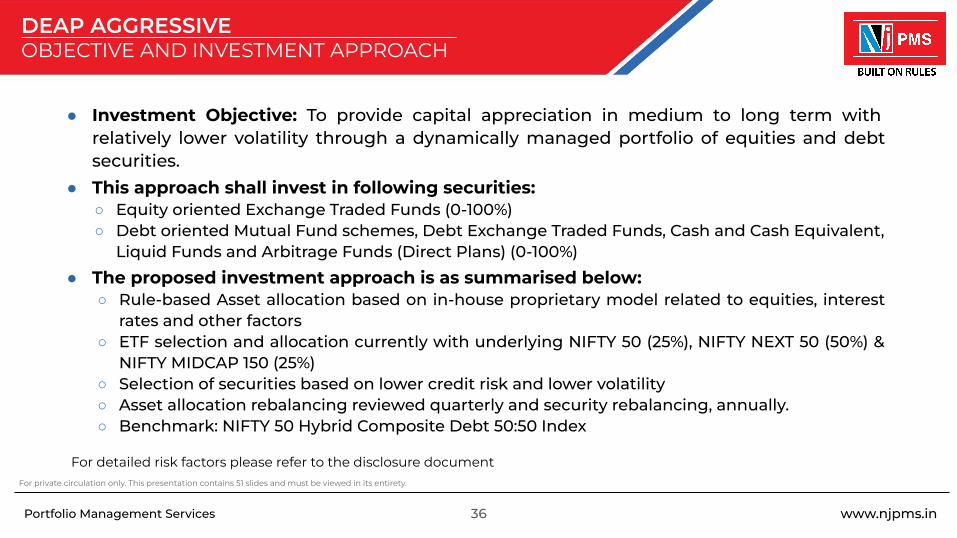
● Investment Objective: To provide capital appreciation in medium to long term with relatively lower volatility through a dynamically managed portfolio of equities and debt securities.
● This approach shall invest in following securities:○ Equity oriented Exchange Traded Funds (0-100%)○ Debt oriented Mutual Fund schemes, Debt Exchange Traded Funds, Cash and Cash Equivalent,
Liquid Funds and Arbitrage Funds (Direct Plans) (0-100%)
● The proposed investment approach is as summarised below:○ Rule-based Asset allocation based on in-house proprietary model related to equities, interest
rates and other factors○ ETF selection and allocation currently with underlying NIFTY 50 (25%), NIFTY NEXT 50 (50%) &
NIFTY MIDCAP 150 (25%)○ Selection of securities based on lower credit risk and lower volatility○ Asset allocation rebalancing reviewed quarterly and security rebalancing, annually.○ Benchmark: NIFTY 50 Hybrid Composite Debt 50:50 Index
For detailed risk factors please refer to the disclosure document

www.njpms.in37Portfolio Management Services
DIVERSIFICATION IS THE ONLY FREE LUNCH
For private circulation only. This presentation contains 51 slides and must be viewed in its entirety.
● All the Index values are INR denominated● All portfolios are re-balanced yearly● Back-tested period is from January 1, 1986 to July 31, 2020 (approx. 35 yrs)
STATISTICS SENSEX SENSEX & BANK FDCAGR 13% 13%
Standard deviation 25% 19%Downside deviation 15% 11%
Sharpe ratio 0.25 0.32Sortino ratio 0.41 0.52
Worst drawdown -61% -46%Worst month return -31% -20%Best month return 42% 31%Profitable months 58% 59%

www.njpms.in38Portfolio Management Services
PERFORMANCE OF DEAP(A) (TWRR)
For private circulation only. This presentation contains 51 slides and must be viewed in its entirety.
● Performance is as on Dec 31, 2021; Calculated on a TWRR (time-weighted rate of return) basis ● *Inception Date: March 12, 2018● Past performance may or may not sustained in future and does not guarantee future return● Past performance is post expenses and pre-tax● Above performance data is not verified by SEBI
PERIODDEAP (A) NIFTY 50 Hybrid Composite
Debt 50:50 Index AVERAGE EQUITY PROPORTIONRETURN VOLATILITY RETURN VOLATILITY
12 M 12.45 4.43 14.53 7.86 34.00
24 M 14.87 11.09 15.54 12.19 46.00
36 M 11.53 9.54 14.45 10.70 44.00
SINCE INCEPTION* 10.05 8.60 12.95 9.99 42.00

www.njpms.in39Portfolio Management ServicesFor private circulation only. This presentation contains 51 slides and must be viewed in its entirety.
DYNAMIC STOCK ALLOCATIONPORTFOLIO (DSAP) CONSERVATIVE
www.njpms.in40Portfolio Management Services
DSAP CONSERVATIVE OBJECTIVE AND INVESTMENT APPROACH
For private circulation only. This presentation contains 51 slides and must be viewed in its entirety.
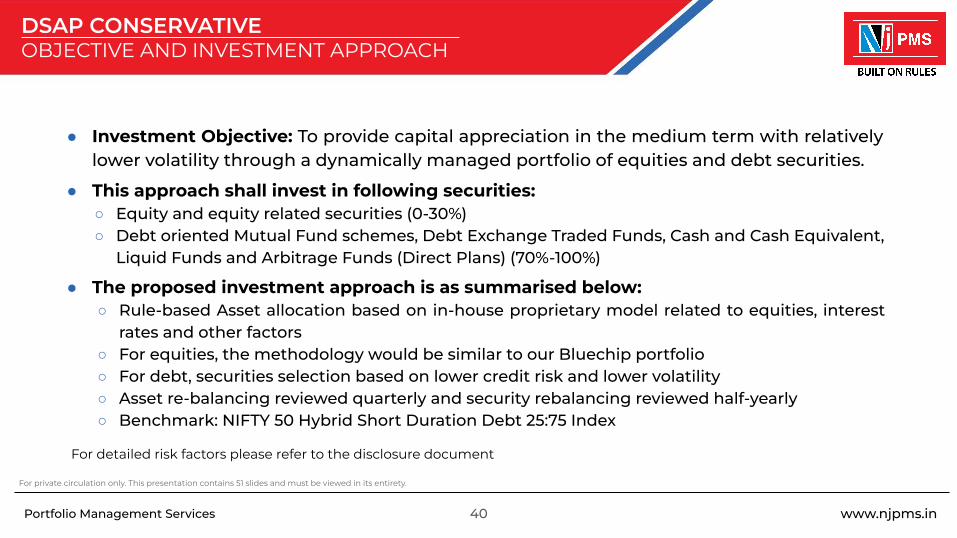
● Investment Objective: To provide capital appreciation in the medium term with relatively lower volatility through a dynamically managed portfolio of equities and debt securities.
● This approach shall invest in following securities:○ Equity and equity related securities (0-30%)○ Debt oriented Mutual Fund schemes, Debt Exchange Traded Funds, Cash and Cash Equivalent,
Liquid Funds and Arbitrage Funds (Direct Plans) (70%-100%)
● The proposed investment approach is as summarised below:○ Rule-based Asset allocation based on in-house proprietary model related to equities, interest
rates and other factors○ For equities, the methodology would be similar to our Bluechip portfolio○ For debt, securities selection based on lower credit risk and lower volatility○ Asset re-balancing reviewed quarterly and security rebalancing reviewed half-yearly○ Benchmark: NIFTY 50 Hybrid Short Duration Debt 25:75 Index
For detailed risk factors please refer to the disclosure document

www.njpms.in41Portfolio Management Services
PERFORMANCE OF DSAP(C) (TWRR)
For private circulation only. This presentation contains 51 slides and must be viewed in its entirety.
● Performance is as on Dec 31, 2021; Calculated on a TWRR (time-weighted rate of return) basis ● *Inception Date: January 21, 2021● Past performance may or may not sustained in future and does not guarantee future return● Past performance is post expenses and pre-tax● Above performance data is not verified by SEBI
PERIODDSAP (C)
NIFTY 50 HYBRIDSHORT DURATION DEBT
25:75 INDEXAVERAGE EQUITY
PROPORTIONRETURN VOLATILITY RETURN VOLATILITY
1 M 1.16 2.56 0.61 4.38 12.00
3 M 1.76 2.50 0.18 3.85 12.00
6 M 4.51 2.15 4.37 3.28 12.00
SINCE INCEPTION* 8.74 1.73 9.29 4.01 10.00

www.njpms.in42Portfolio Management ServicesFor private circulation only. This presentation contains 51 slides and must be viewed in its entirety.
DYNAMIC ETF ALLOCATIONPORTFOLIO (DEAP) CONSERVATIVE
www.njpms.in43Portfolio Management Services
DEAP CONSERVATIVEOBJECTIVE AND INVESTMENT APPROACH
For private circulation only. This presentation contains 51 slides and must be viewed in its entirety.
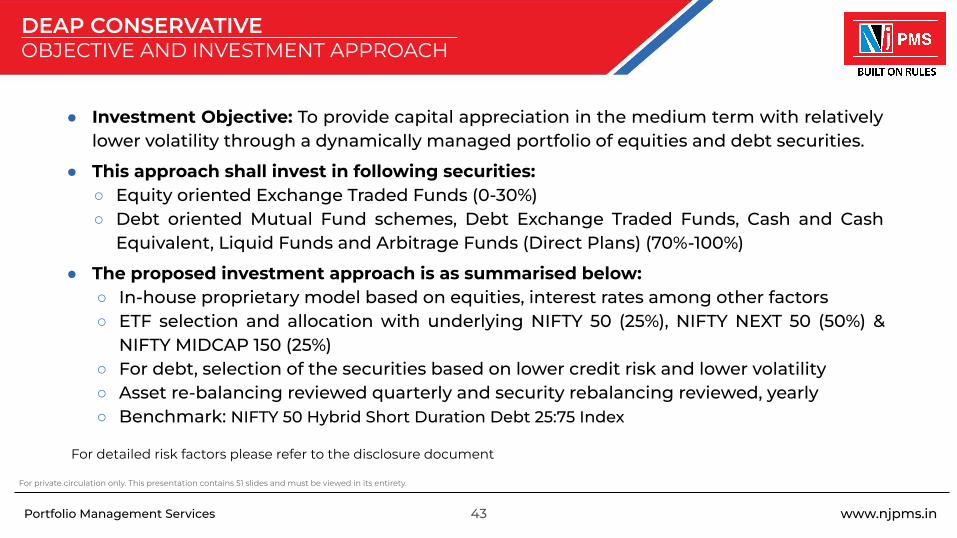
● Investment Objective: To provide capital appreciation in the medium term with relatively lower volatility through a dynamically managed portfolio of equities and debt securities.
● This approach shall invest in following securities:○ Equity oriented Exchange Traded Funds (0-30%)○ Debt oriented Mutual Fund schemes, Debt Exchange Traded Funds, Cash and Cash
Equivalent, Liquid Funds and Arbitrage Funds (Direct Plans) (70%-100%)
● The proposed investment approach is as summarised below:○ In-house proprietary model based on equities, interest rates among other factors○ ETF selection and allocation with underlying NIFTY 50 (25%), NIFTY NEXT 50 (50%) &
NIFTY MIDCAP 150 (25%)○ For debt, selection of the securities based on lower credit risk and lower volatility○ Asset re-balancing reviewed quarterly and security rebalancing reviewed, yearly○ Benchmark: NIFTY 50 Hybrid Short Duration Debt 25:75 Index
For detailed risk factors please refer to the disclosure document

www.njpms.in44Portfolio Management Services
PERFORMANCE OF DEAP(C) (TWRR)
For private circulation only. This presentation contains 51 slides and must be viewed in its entirety.
● Performance is as on Dec 31, 2021; Calculated on a TWRR (time-weighted rate of return) basis ● *Inception Date: January 21, 2021● Past performance may or may not sustained in future and does not guarantee future return● Past performance is post expenses and pre-tax● Above performance data is not verified by SEBI
PERIODDEAP (C)
NIFTY 50 HYBRIDSHORT DURATION DEBT
25:75 INDEX AVERAGE EQUITY PROPORTION
RETURN VOLATILITY RETURN VOLATILITY
1 M 0.47 2.16 0.61 4.38 12.00
3 M 0.81 1.89 0.18 3.85 12.00
6 M 2.77 1.57 4.37 3.28 12.00
SINCE INCEPTION* 5.84 1.31 9.29 4.01 10.00

www.njpms.in45Portfolio Management Services For private circulation only. This presentation contains 51 slides and must be viewed in its entirety.
LIQUID PORTFOLIO

www.njpms.in46Portfolio Management Services
LIQUID PORTFOLIOOBJECTIVE AND INVESTMENT APPROACH
For private circulation only. This presentation contains 51 slides and must be viewed in its entirety.
● Investment Objective: To generate reasonable returns commensurate with low risk by investing in appropriate Mutual Fund schemes.
● This approach shall invest in following securities:○ Arbitrage Funds (Direct Plans) (0-100%)○ Liquid Funds (Direct Plans) (0-100%)○ Overnight Funds (Direct Plans) (0-50%)
● The proposed investment approach is as summarised below:○ Schemes selected based on low credit risk and interest rate risks, consistency of performance,
lower exit load.○ Investments in any Mutual Fund scheme shall generally not be greater than 45% of portfolio○ Single AMC exposure will generally be restricted to 70% of the portfolio○ Re-balancing of portfolio reviewed annually ○ Benchmark: NIFTY Liquid Index
For detailed risk factors please refer to the disclosure document

www.njpms.in47Portfolio Management Services
PERFORMANCE OF LIQUID PORTFOLIO (TWRR)
For private circulation only. This presentation contains 51 slides and must be viewed in its entirety.
● Performance is as on Dec 31, 2021; Calculated on a TWRR (time-weighted rate of return) basis ● *Inception Date: September 30, 2020● Past performance may or may not sustained in future and does not guarantee future return● Past performance is post expenses and pre-tax● Above performance data is not verified by SEBI
PERIODLIQUID PORTFOLIO NIFTY LIQUID INDEX
RETURN RETURN
1 M 0.28 0.31
3 M 0.80 0.90
6 M 1.52 1.76
12 M 3.01 3.49
SINCE INCEPTION* 2.99 3.46

www.njpms.in48Portfolio Management Services
FEES & CHARGES
For private circulation only. This presentation contains 51 slides and must be viewed in its entirety.
INVESTMENTAPPROACH
UPFRONTCHARGES FEE SLAB MANAGEMENT FEE
PER ANNUM*
Bluechip PortfolioDynamic Stock Allocation Portfolio - AggressiveMulticap Portfolio
Nil
Investment Value < 2 CrInvestment Value >= 2 Cr to < 5 CrInvestment Value >= 5 Cr to < 10 CrInvestment Value >= 10 Cr to <20 CrInvestment Value >= 20 Cr to < 30 CrInvestment Value >= 30 Cr to < 50 CrInvestment Value >= 50 Cr
Upto 2.50% Upto 2.00%
Upto 1.50%Upto 1.20%Upto 1.00%Upto 0.80%Upto 0.70%
Dynamic Stock AllocationPortfolio - Conservative Nil
Investment Value < 2 CrInvestment Value >= 2 Cr to < 5 CrInvestment Value >= 5 Cr
Upto 1.00% Upto 0.80%Upto 0.60%
Freedom ETF PortfolioDynamic ETF AllocationPortfolio - Aggressive
Nil
Investment Value < 2 CrInvestment Value >= 2 Cr to < 10 CrInvestment Value >= 10 Cr to <20 CrInvestment Value >= 20 Cr to < 30 CrInvestment Value >= 30 Cr to < 50 CrInvestment Value >= 50 Cr
Upto 1.00%Upto 0.50%Upto 0.30%Upto 0.25%Upto 0.20%Upto 0.20%
Dynamic ETF AllocationPortfolio - Conservative Nil
Investment Value < 2 CrInvestment Value >= 2 Cr to < 5 CrInvestment Value >= 5 Cr
Upto 0.60%Upto 0.40%Upto 0.30%
Liquid Portfolio Nil Investment Value < 30 CrInvestment Value >= 30 Cr
Upto 0.20%Upto 0.15%
*Excluding GST @ 18%

www.njpms.in49Portfolio Management Services
FEES & CHARGES
For private circulation only. This presentation contains 51 slides and must be viewed in its entirety.
COMMON
FEATURES
ACROSS
PRODUCTS
Minimum Investment Per Client
Minimum Investment per Investment Approach for Conservative Portfolios
Minimum Investment per Investment Approach (Excl Conservative Portfolios)
Top Up
Mode of Investment
Exit Fees
Audit Fees
INR 50 Lacs*, Multiples of INR 1 thereafter
INR 25 Lacs, Multiples of INR 1 thereafter
INR 5 Lacs, Multiples of INR 1 thereafter
INR 5 Lacs for New Investment Approach INR 1 Lac for existing Investment Approach
Cheque, RTGS, NEFT,Security Transfer(Sell)
1% on withdrawal amount (If redeemed within 1 year)
No Exit Fees on Liquid Portfolio
Upto INR 1200 Per Annum(Currently INR 590 Per Annum)**
*Subject to change as per SEBI ( Portfolio Managers ) Regulations, 2020. | ** May change from time to timeNote: The Portfolio Manager offers the option of direct on-boarding to clients under the Discretionary Services. At the time of on-boarding of clients directly, no charges except statutory charges shall be levied for the on-boarding. The Client may download the application Form from the website of the Portfolio Manager at www.njmutualfund.com for availing the Portfolio Management Services and submit the same with required details and documents for direct on-boarding at the office of the Portfolio Manager.

www.njpms.in50Portfolio Management Services
For private circulation only. This presentation contains 51 slides and must be viewed in its entirety.
RISK FACTORS & DISCLAIMER
Investing in securities involves certain risks and considerations associated generally with making investments in securities. The value of the portfolio investments may be affected generally by factors affecting financial markets, such as price and volume, volatility in interest rates, currency exchange rates, changes in regulatory and administrative policies of the Government or any other appropriate authority (including tax laws) or other political and economic developments. Consequently, there can be no assurance that the objective of the Portfolio would be achieved. The value of the portfolios may fluctuate and can go up or down. Prospective investors are advised to carefully review the Disclosure Document, Client Agreement, and other related documents carefully and in its entirety and consult their legal, tax and financial advisors to determine possible legal, tax and financial or any other consequences of investing under this Portfolio and to understand the risk factors, before making an investment decision. Please note that past performance of the financial products, instruments and the portfolio does not necessarily indicate the future prospects and performance thereof. Such past performance may or may not be sustained in future. Portfolio Manager’s investment decisions may not be always profitable, as actual market movements may be at variance with anticipated trends. The investors are not being offered any guaranteed or assured returns. The PM may be engaged in buying/selling of such securities.
Individual returns of Clients for a particular portfolio type may vary significantly from the data on performance of the portfolios as may be depicted by the Portfolio Manager from time to time. This is due to factors such as timing of entry and exit, timing of additional flows and redemptions, individual client mandates, specific portfolio construction characteristics or structural parameters, which may have a bearing on individual portfolio performance. No claims may be made or entertained for any variances between the performance depictions and individual portfolio performance. Neither NJ Asset Management Private Limited (erstwhile NJ Advisory Services Private Limited) (the “Portfolio Manager” or “PM”) nor its Directors or Employees shall be in any way liable for any variations noticed in the returns of individual portfolios. The Client shall not make any claim against the Portfolio Manager against any losses (notional or real) or against any loss of opportunity for gain under various PMS Products, on account of or arising out of such circumstance/ change in market condition or for any other reason which may specifically affect a particular sector or security.
All data/information used in the preparation of this material is dated and may or may not be relevant any time after the issuance of this material. The Portfolio Manager/ the PM take no responsibility of updating any data/information in this material from time to time. In the preparation of this material the PM has used information that is publicly available, including information developed in-house. Some of the material used herein may have been obtained from members/persons other than the PM and/or its affiliates and which may have been made available to the PM and/or to its affiliates. Information gathered and material used herein is believed to be from reliable sources. The PM however does not warrant the accuracy, reasonableness and/or completeness of any information. For data reference to any third party in this material no such party will assume any liability for the same. We have included statements/opinions/recommendations in this material, which contain words, or phrases such as “will”, “expect”, “should”, “believe” and also PE ratios, EPS and Earnings Growth for forthcoming years and similar expressions or variations of such expressions that are “forward looking statements”. Actual results may differ materially from those suggested by the forward looking statements due to risk or uncertainties associated with our expectations with respect to, but not limited to, exposure to market risks, general economic and political conditions in India and other countries globally, the monitory and interest policies of India, inflation, unanticipated turbulence in interest rates, foreign exchange rates, equity prices, the performance of the financial markets in India and globally, changes in domestic and foreign laws, regulations and taxes and changes in competition in the industry
www.njpms.in51Portfolio Management Services
For private circulation only. This presentation contains 51 slides and must be viewed in its entirety.
NJ PMS CONTACT DESK
THANK YOU0261-4025000 / 0261-6155000
[email protected] www.njmutualfund.com
Related Documents