NITROUS OXIDE EMISSION FROM RIPARIAN BUFFERS IN AGRICULTURAL LANDSCAPES OF INDIANA Katelin Rose Fisher Submitted to the faculty of the University Graduate School in partial fulfillment of the requirements for the degree Master of Science in the Department of Earth Science, Indiana University August 2013

Welcome message from author
This document is posted to help you gain knowledge. Please leave a comment to let me know what you think about it! Share it to your friends and learn new things together.
Transcript
NITROUS OXIDE EMISSION FROM RIPARIAN BUFFERS IN
AGRICULTURAL LANDSCAPES OF INDIANA
Katelin Rose Fisher
Submitted to the faculty of the University Graduate School in partial fulfillment of the requirements
for the degree Master of Science
in the Department of Earth Science, Indiana University
August 2013
ii
Accepted by the Faculty of Indiana University, in partial
fulfillment of the requirements for the degree of Master of Science.
______________________________________ Pierre-André Jacinthe, Ph.D., Chair
Master’s Thesis Committee
______________________________________ Philippe G. Vidon, Ph.D.
______________________________________ Meghna Babbar-Sebbens, Ph.D.

iii
ACKNOWLEDGEMENTS
First and foremost, I would like to earnestly thank my adviser, mentor, and friend,
Pierre Jacinthe, for his exceptional advice, guidance, and patience. His first-class
knowledge and support were integral to the success of this document and my graduate
career; I always left our meetings feeling uplifted and smarter. I send many, many thanks
to Philippe Vidon for his expert guidance and wonderful humor throughout this process.
And I would like to thank Meghna Babbar-Sebens for her valuable input in committee
meetings.
I would further like to thank my research and field-partner-in-crime, Xiaoqiang
Liu, for his hard work during sampling and for keeping our spirits high. Timely analysis
and collection of samples would not have been possible without the awesome efforts
Lauren Thomas, Lori Bebinger and Charlotte Mason, all of whom I had the pleasure to
work with in the field and in SL32. I would further like to thank a host of individuals for
their efforts in collection and collaboration including Vince Hernly, Bob Barr, Matt
Hennessey, Ryan McAtee, Jake Lemon, Anchal Bangar and Allyson Smith, as well as the
land-owners who provided access to sites making our experiments possible.
I extend an extra thanks to Allyson Smith for keeping me both sane and
caffeinated and offering not only a stellar example of a grad student but an amazing
friendship. I thank Kathy Licht for her ever present and much needed support in the
completion of this document (“just keep swimming!”) and my graduate career. Thanks to
Josh for the necessary tough love and technical support. Thank you to Dan Bain, my
undergraduate research adviser, for getting me off to a good start. And always, always,
always I thank my parents in all ways. And last but not least, thank you to the IUPUI

iv
Earth and Sciences Department for offering a venue for one of the most valuable
experiences of my life.
This project was funded by USDA-NRI grant 2009-35112-05241 to Drs. Pierre-Andre
Jacinthe, Philippe Vidon and Matt Baker.
v
ABSTRACT
Katelin Rose Fisher
NITROUS OXIDE EMISSION FROM RIPARIAN BUFFERS IN AGRICULTURAL
LANDSCAPES OF INDIANA
Riparian buffers have well documented capacity to remove nitrate (NO3-) from
runoff and subsurface flow paths, but information on field-scale N2O emission from these
buffers is lacking. This study monitored N2O fluxes at two agricultural riparian buffers in
the White River watershed (Indiana) from December 2009 to May 2011 to assess the
impact of landscape and hydrogeomorphologic factors on emission. Soil chemical and
biochemical properties were measured and environmental variables (soil temperature and
moisture) were monitored in an attempt to identify key drivers of N2O emission. The
study sites included a mature riparian forest (WR) and a riparian grass buffer (LWD);
adjacent corn fields were also monitored for land-use comparison. With the exception of
net N mineralization, most soil properties (particle size, bulk density, pH, denitrification
potential, organic carbon, C:N) showed little correlation with N2O emission. Analysis of
variance (ANOVA) identified season, land-use (riparian buffer vs. crop field), and site
geomorphology as major drivers of N2O emission. At both study sites, N2O emission
showed strong seasonal variability; the largest emission peaks in the riparian buffers (up
to 1,300 % increase) and crop fields (up to 3,500 % increase) occurred in late spring/early
summer as a result of flooding, elevated soil moisture and N-fertilization. Nitrous oxide
emission was found to be significantly higher in crop fields than in riparian buffers at
both LWD (mean: 1.72 and 0.18 mg N2O-N m-2 d-1) and WR (mean: 0.72 and 1.26 mg
vi
N2O-N m-2 d-1, respectively). Significant difference (p=0.02) in N2O emission between
the riparian buffers was detected, and this effect was attributed to site geomorphology
and the greater potential for flooding at the WR site (no flooding occurred at LWD).
More than previously expected, the study results demonstrate that N2O emission in
riparian buffers is largely driven by landscape geomorphology and land-stream
connection (flood potential).
Pierre-André Jacinthe, Ph.D., Chair
vii
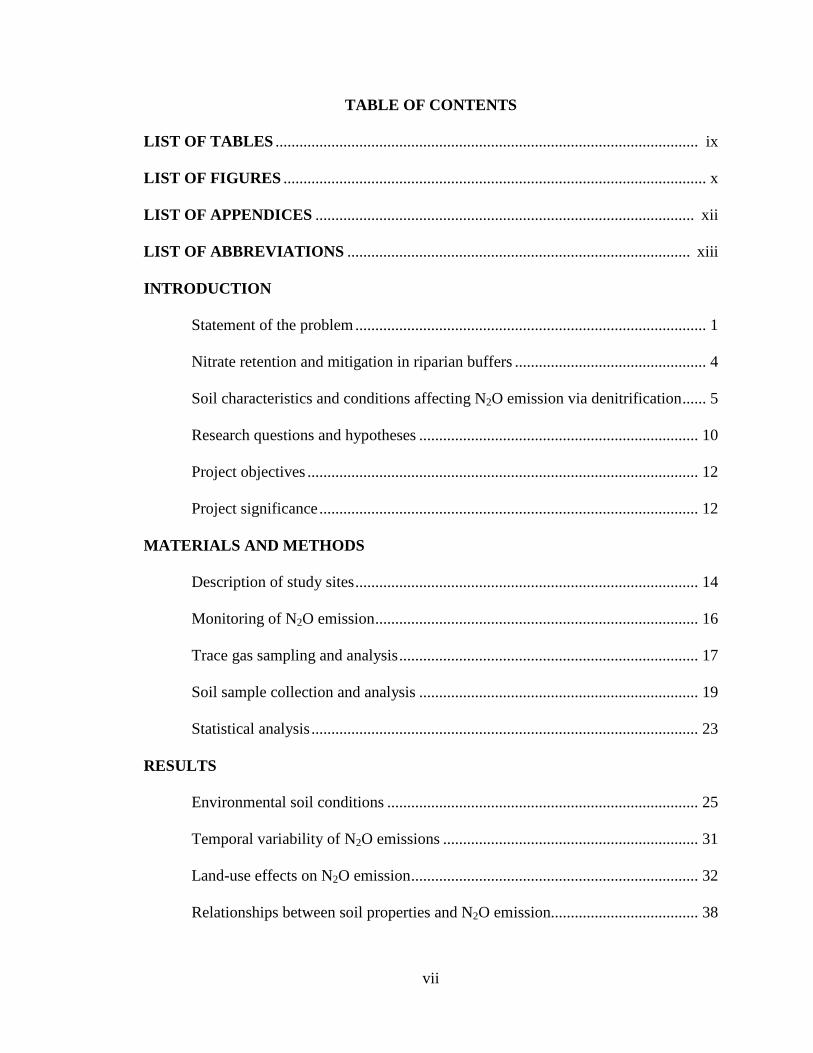
TABLE OF CONTENTS
LIST OF TABLES .......................................................................................................... ix
LIST OF FIGURES .......................................................................................................... x
LIST OF APPENDICES ............................................................................................... xii
LIST OF ABBREVIATIONS ...................................................................................... xiii
INTRODUCTION
Statement of the problem ........................................................................................ 1
Nitrate retention and mitigation in riparian buffers ................................................ 4
Soil characteristics and conditions affecting N2O emission via denitrification ...... 5
Research questions and hypotheses ...................................................................... 10
Project objectives .................................................................................................. 12
Project significance ............................................................................................... 12
MATERIALS AND METHODS
Description of study sites ...................................................................................... 14
Monitoring of N2O emission ................................................................................. 16
Trace gas sampling and analysis ........................................................................... 17
Soil sample collection and analysis ...................................................................... 19
Statistical analysis ................................................................................................. 23
RESULTS
Environmental soil conditions .............................................................................. 25
Temporal variability of N2O emissions ................................................................ 31
Land-use effects on N2O emission ........................................................................ 32
Relationships between soil properties and N2O emission..................................... 38

viii
Spatial variability of N2O fluxes in relation to landscape geomorphology .......... 51
DISCUSSION
Land-use effects on N2O emissions ...................................................................... 56
Spatial variability of N2O emissions ..................................................................... 58
Effects of geomorphology and drainage on N2O emission ................................... 61
Implications of the study ....................................................................................... 63
Limitations of the study ........................................................................................ 65
CONCLUSION ............................................................................................................... 67
APPENDICES ................................................................................................................. 68
REFERENCES ................................................................................................................ 81
CURRICULUM VITAE
ix
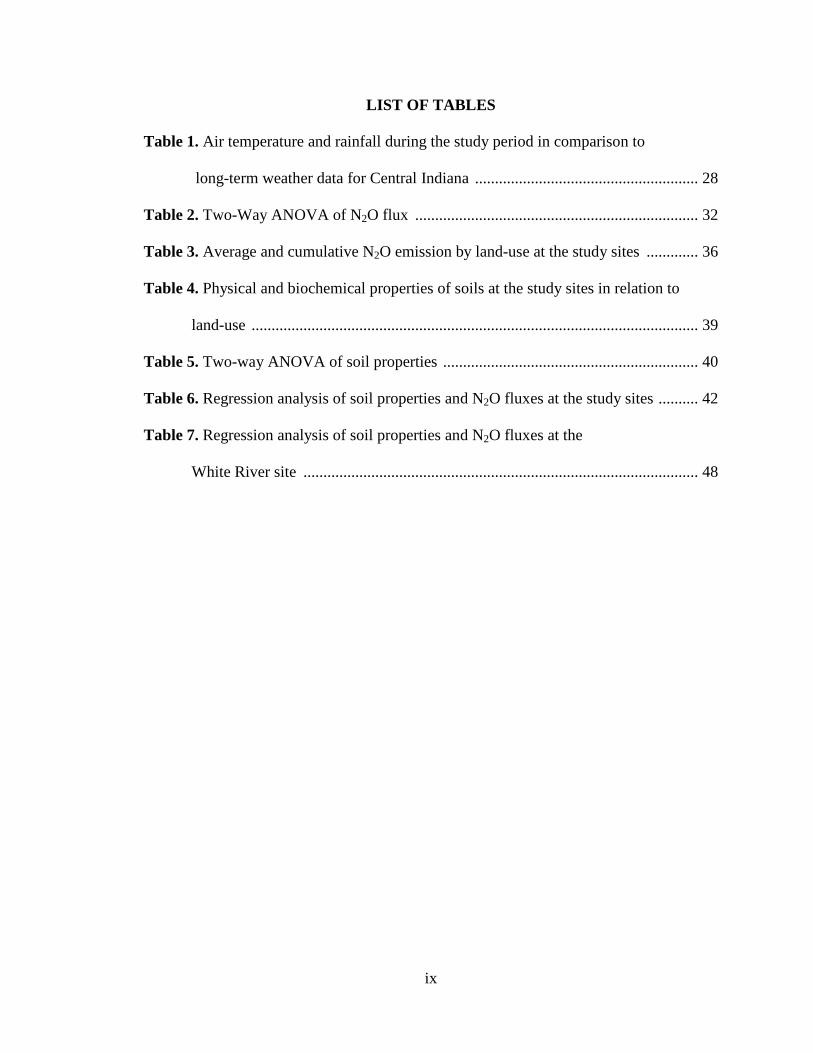
LIST OF TABLES
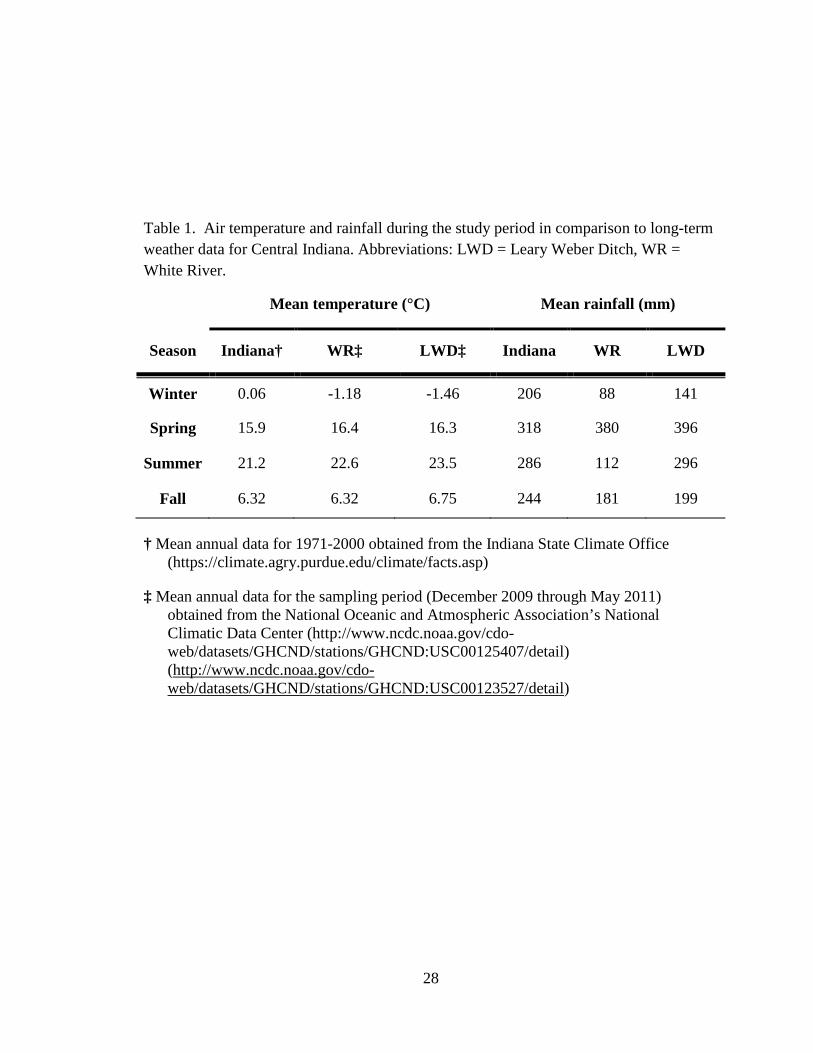
Table 1. Air temperature and rainfall during the study period in comparison to
long-term weather data for Central Indiana ........................................................ 28
Table 2. Two-Way ANOVA of N2O flux ....................................................................... 32
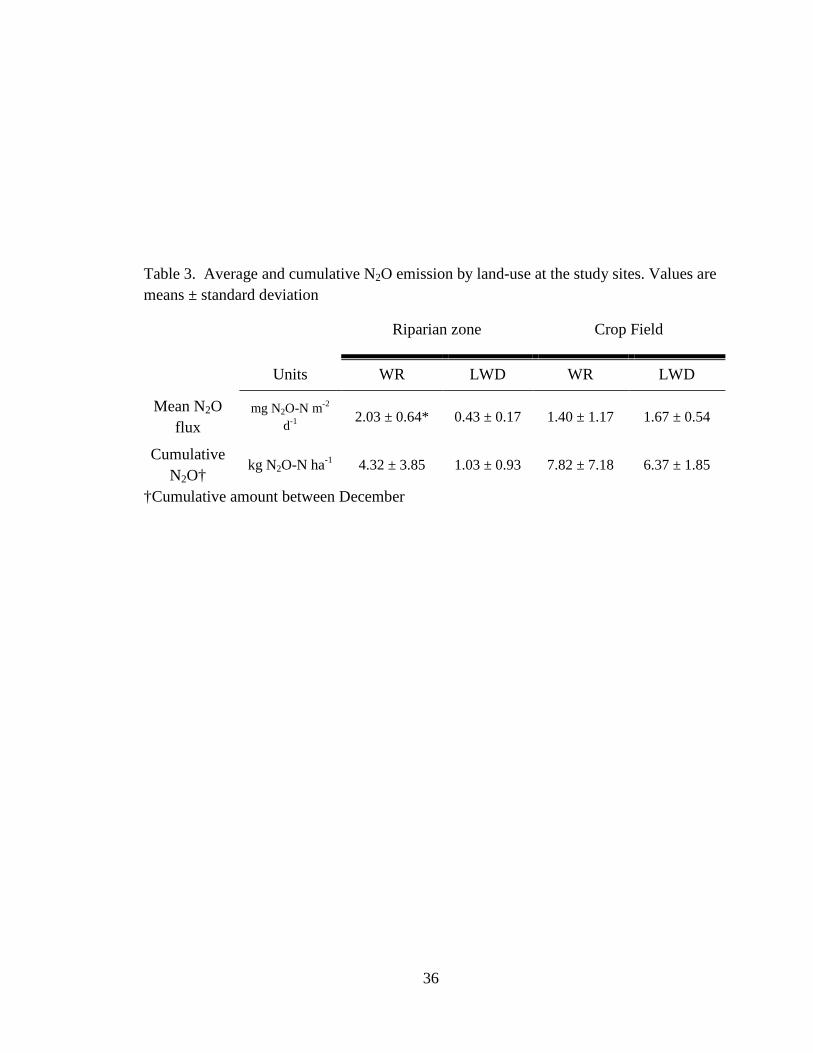
Table 3. Average and cumulative N2O emission by land-use at the study sites ............. 36
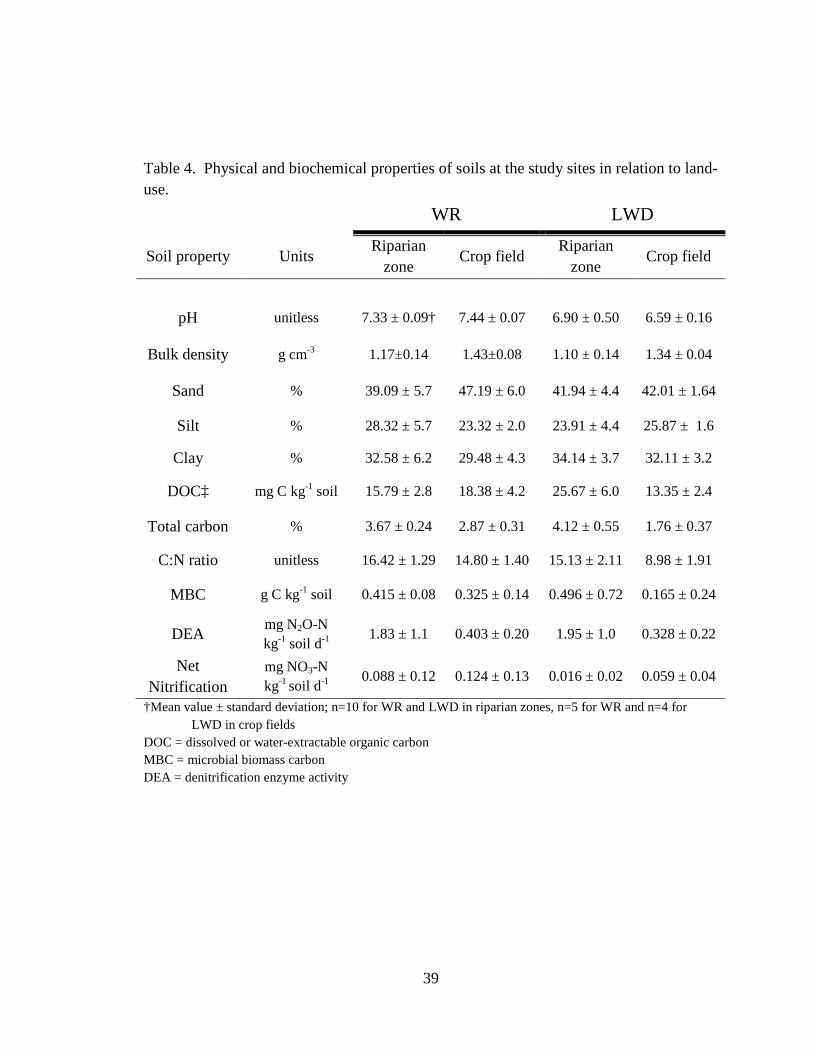
Table 4. Physical and biochemical properties of soils at the study sites in relation to
land-use ................................................................................................................ 39
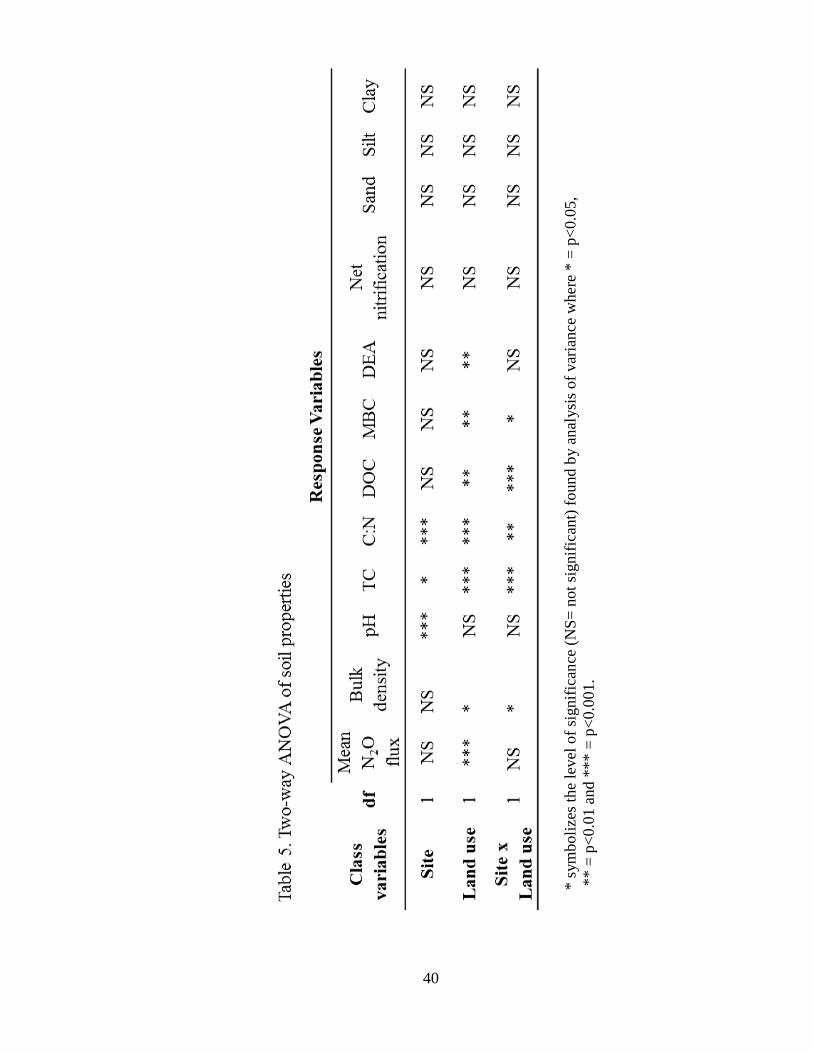
Table 5. Two-way ANOVA of soil properties ................................................................ 40
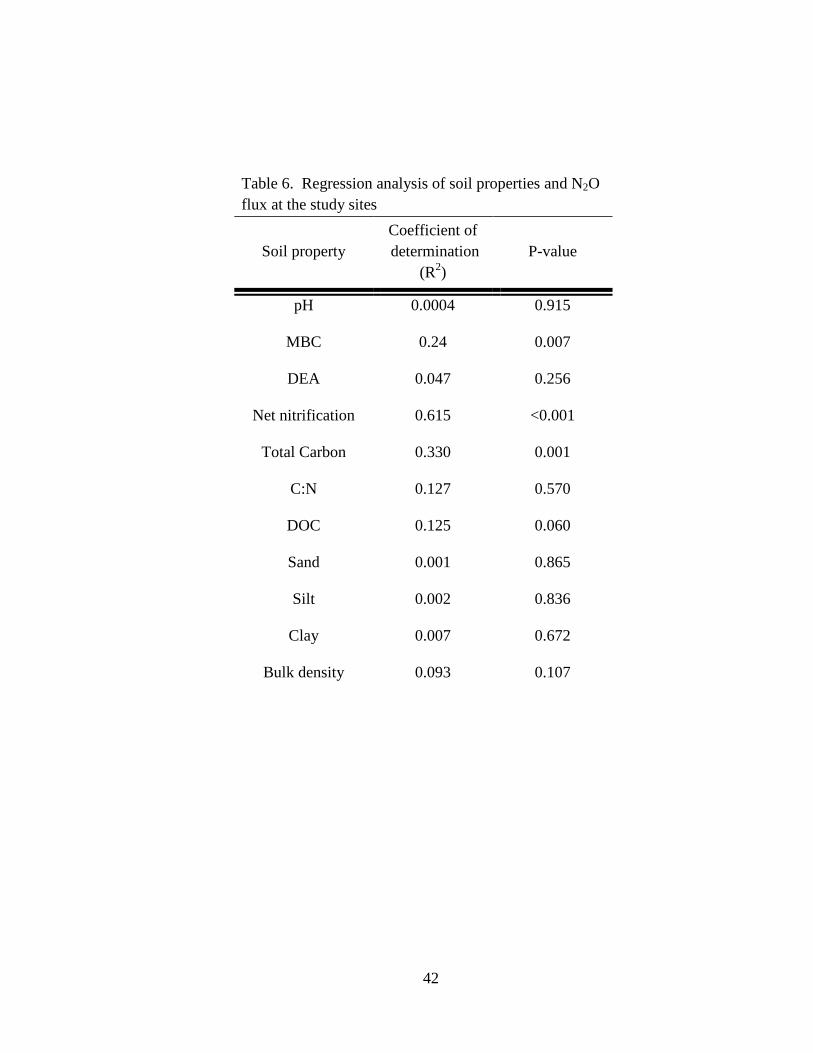
Table 6. Regression analysis of soil properties and N2O fluxes at the study sites .......... 42
Table 7. Regression analysis of soil properties and N2O fluxes at the
White River site ................................................................................................... 48
x
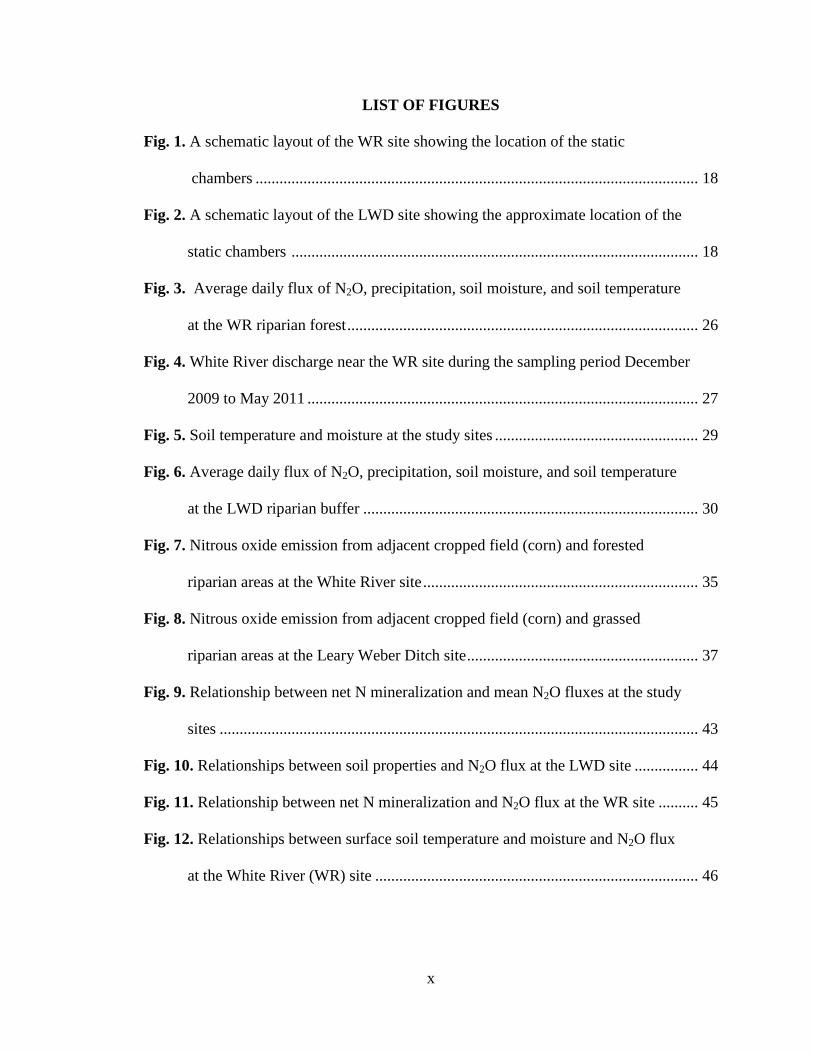
LIST OF FIGURES
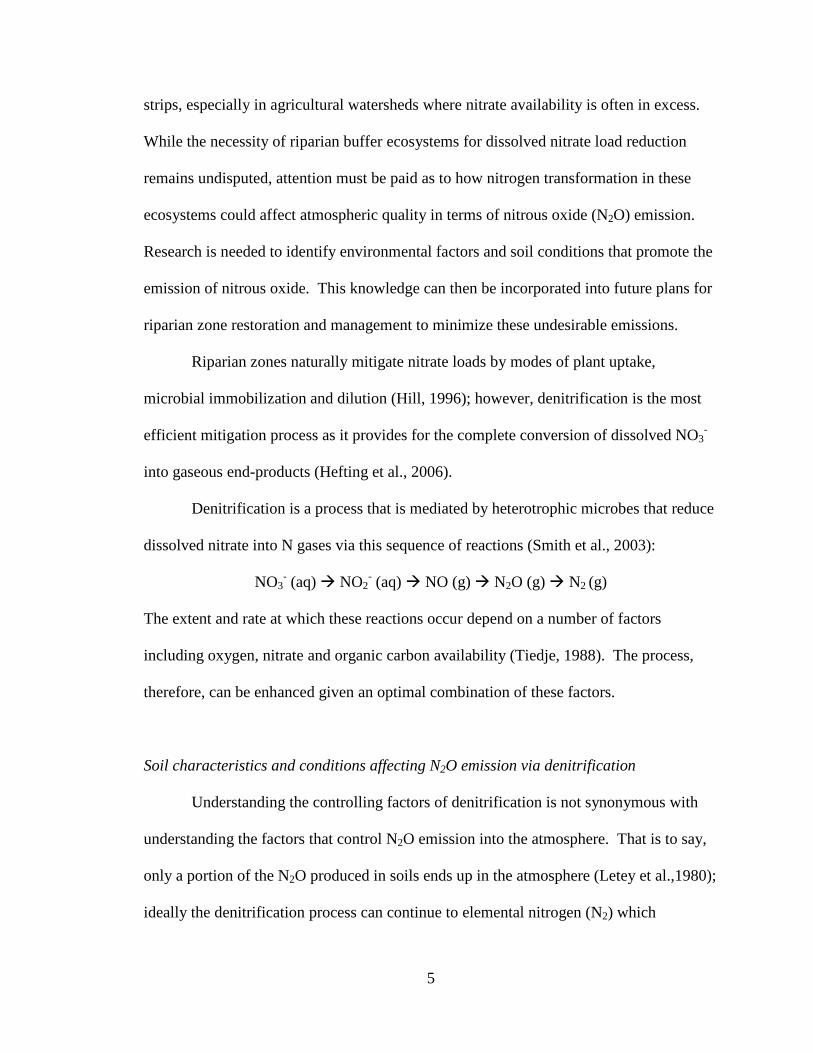
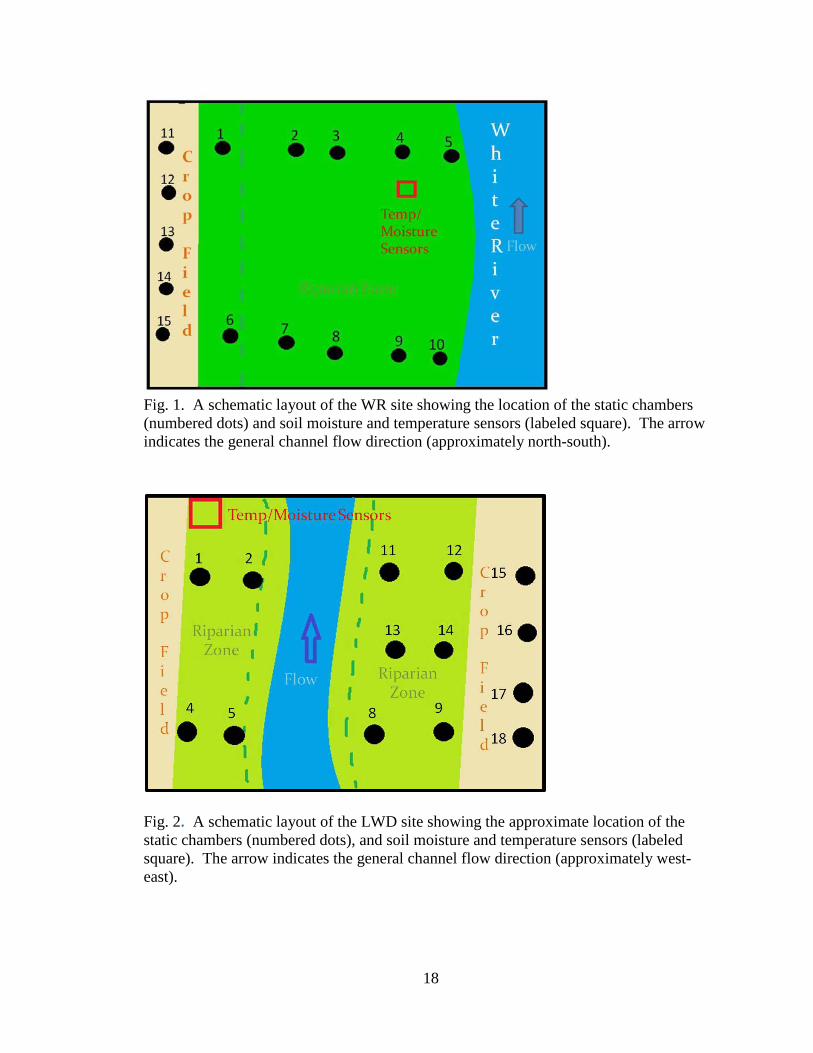
Fig. 1. A schematic layout of the WR site showing the location of the static
chambers ............................................................................................................... 18
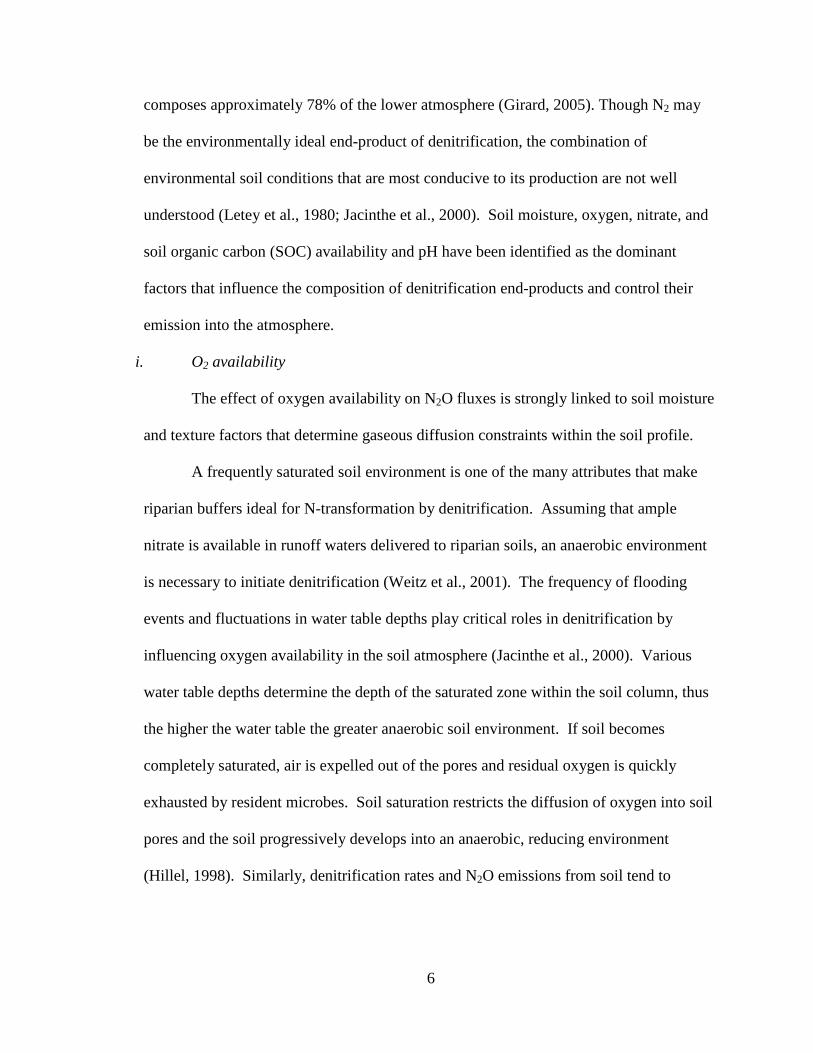
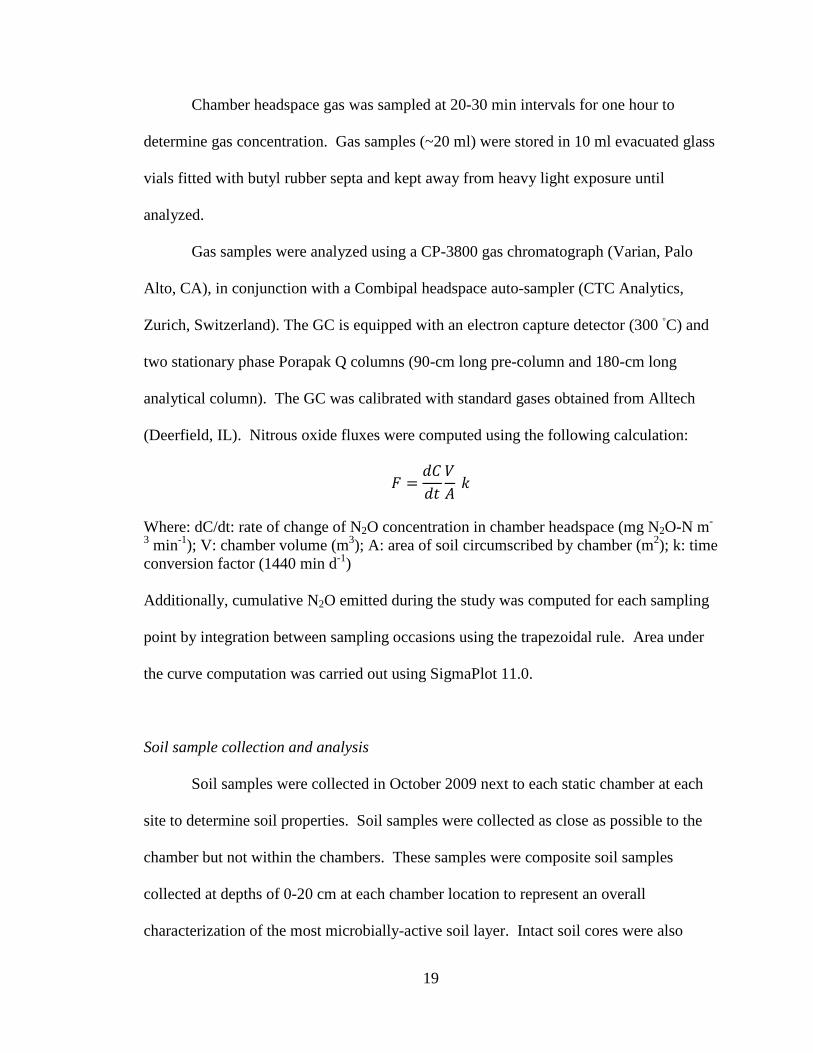
Fig. 2. A schematic layout of the LWD site showing the approximate location of the
static chambers ...................................................................................................... 18
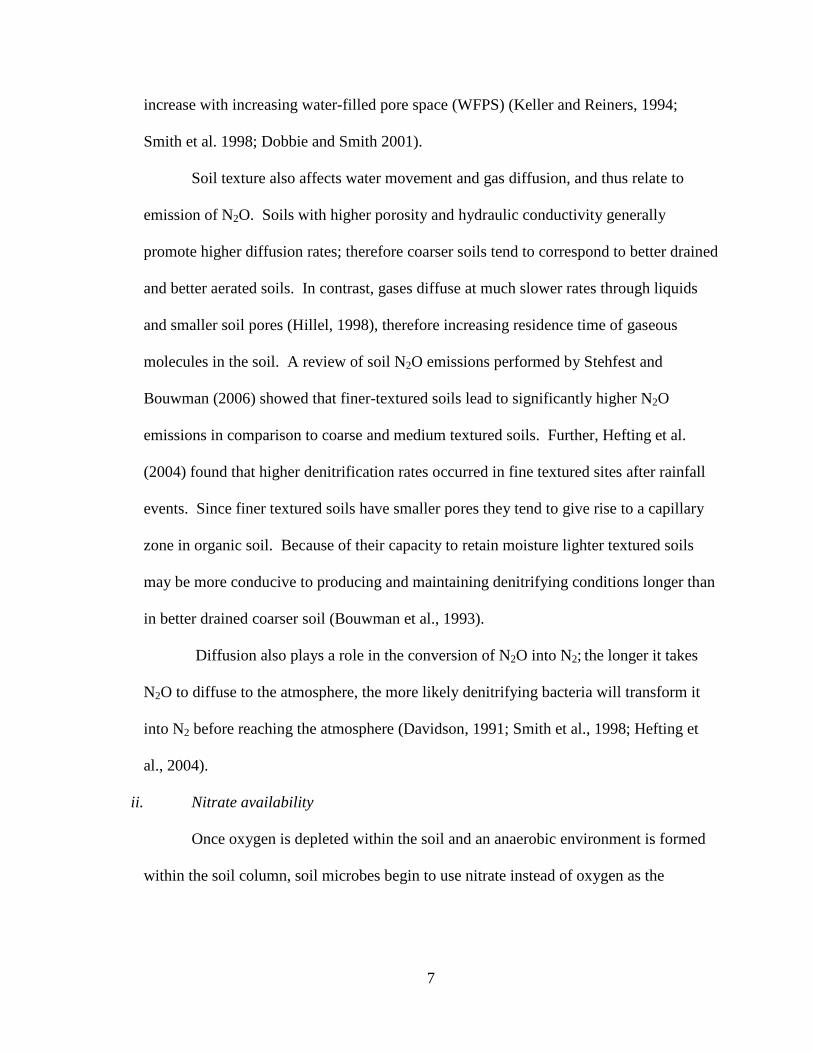
Fig. 3. Average daily flux of N2O, precipitation, soil moisture, and soil temperature
at the WR riparian forest ........................................................................................ 26
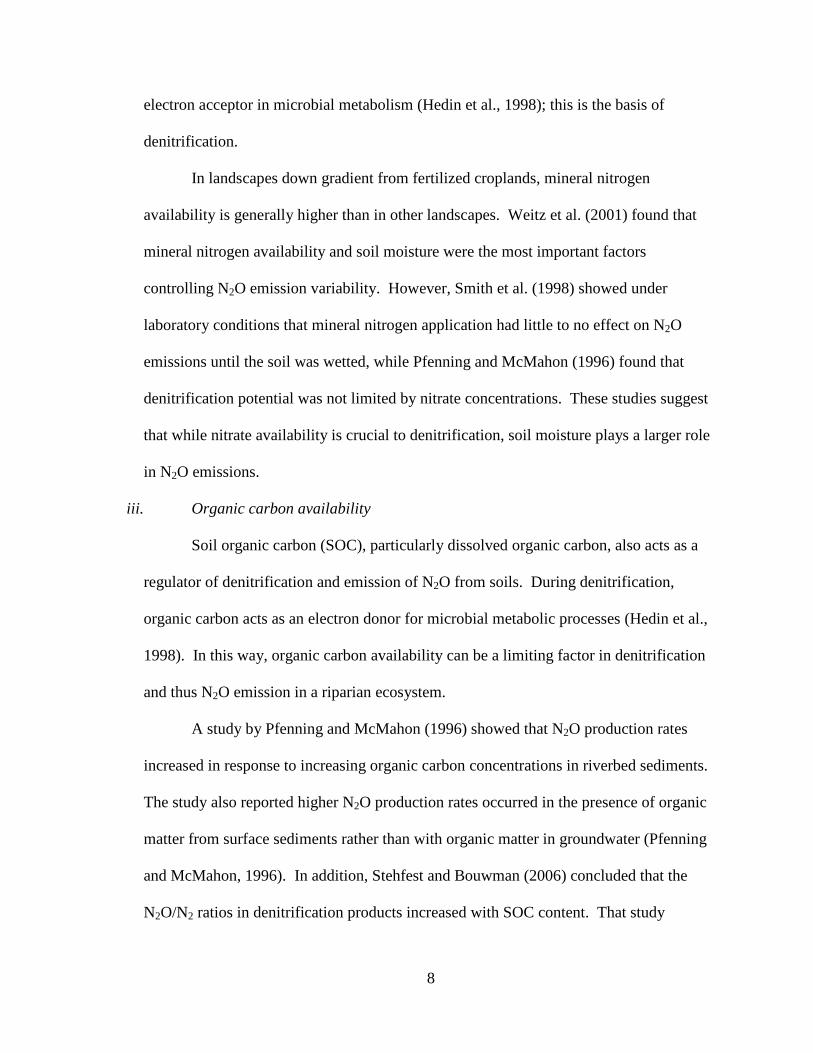
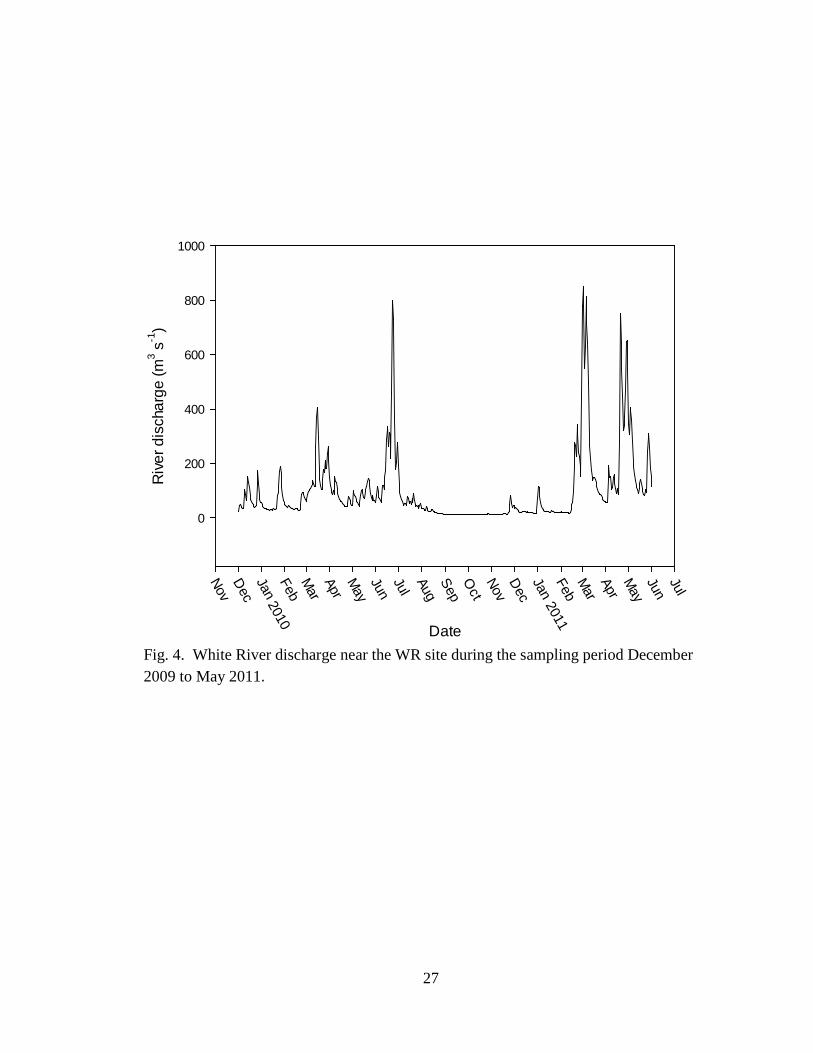
Fig. 4. White River discharge near the WR site during the sampling period December
2009 to May 2011 .................................................................................................. 27
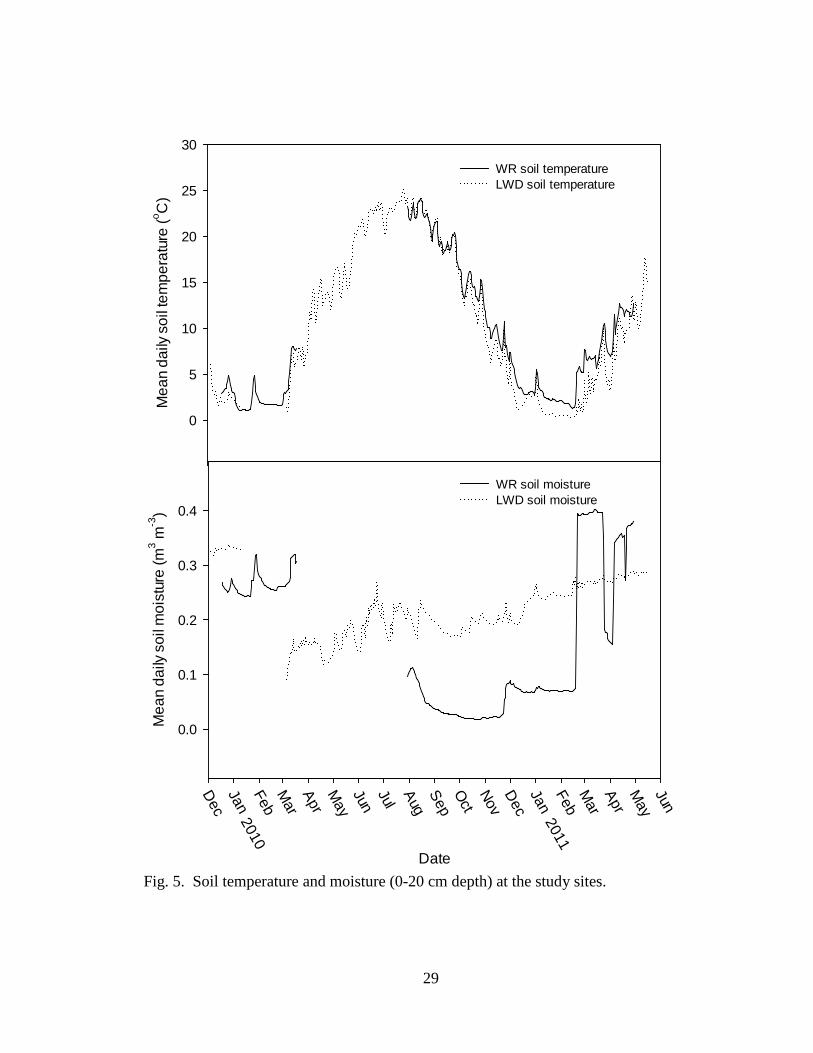
Fig. 5. Soil temperature and moisture at the study sites ................................................... 29
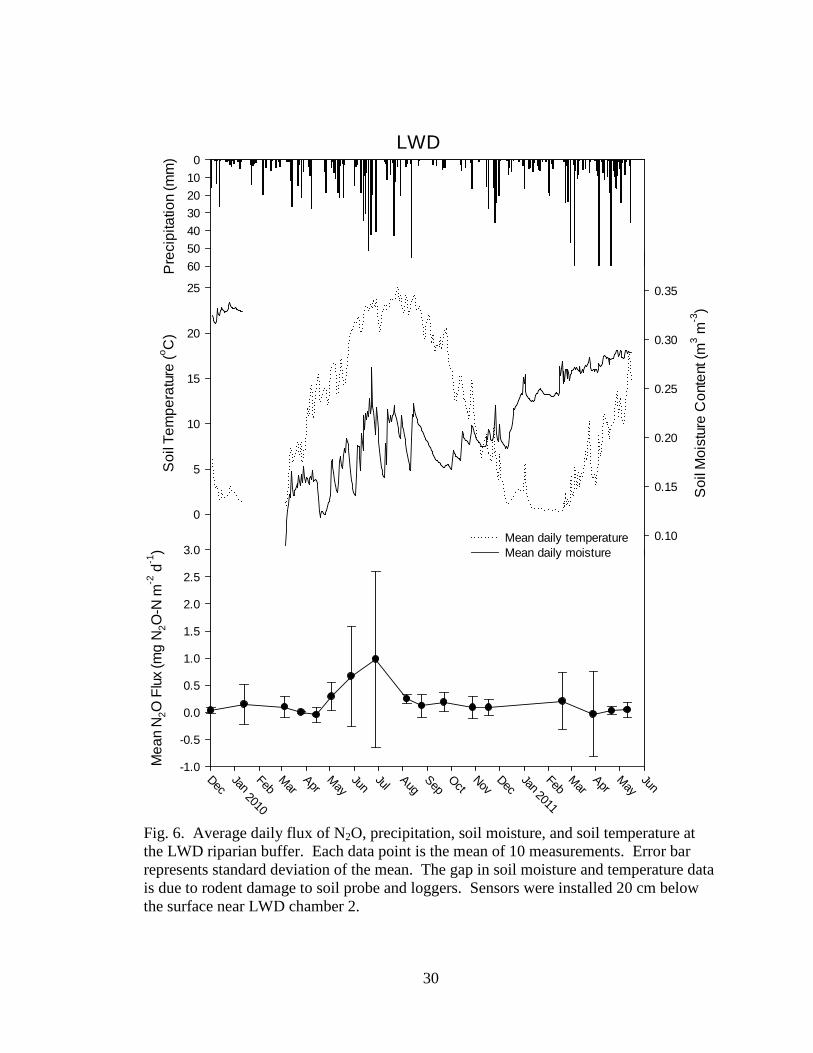
Fig. 6. Average daily flux of N2O, precipitation, soil moisture, and soil temperature
at the LWD riparian buffer .................................................................................... 30
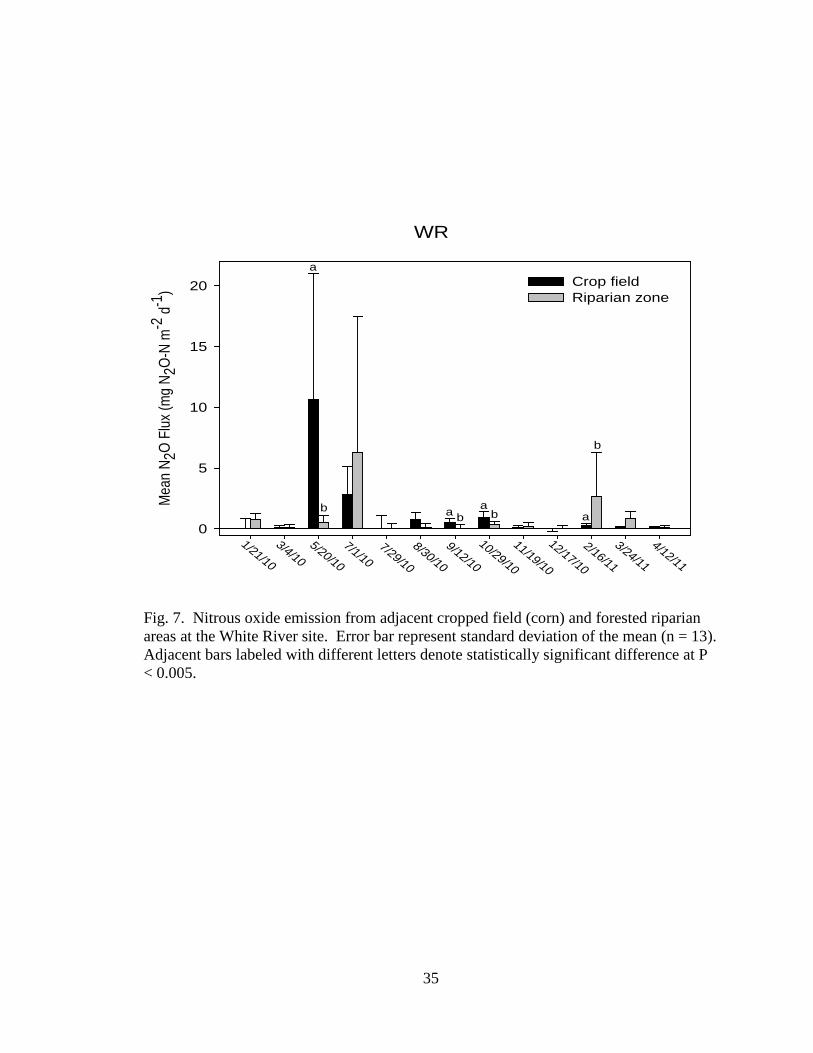
Fig. 7. Nitrous oxide emission from adjacent cropped field (corn) and forested
riparian areas at the White River site ..................................................................... 35
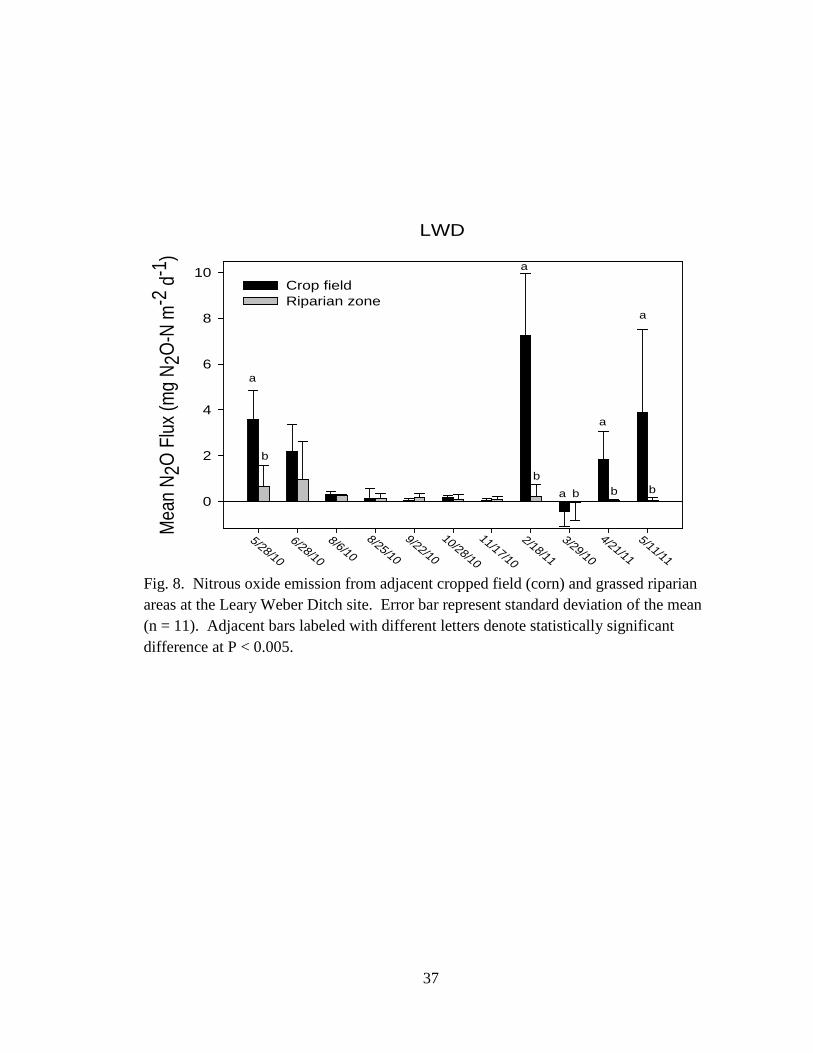
Fig. 8. Nitrous oxide emission from adjacent cropped field (corn) and grassed
riparian areas at the Leary Weber Ditch site .......................................................... 37
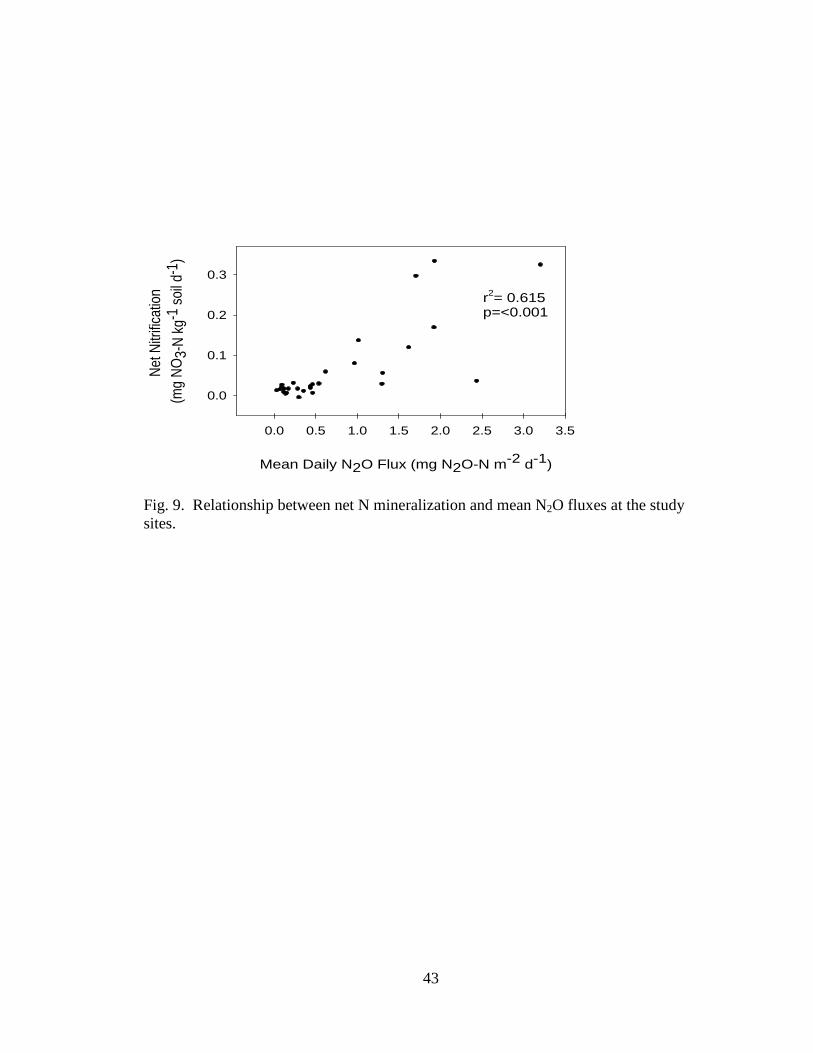
Fig. 9. Relationship between net N mineralization and mean N2O fluxes at the study
sites ........................................................................................................................ 43
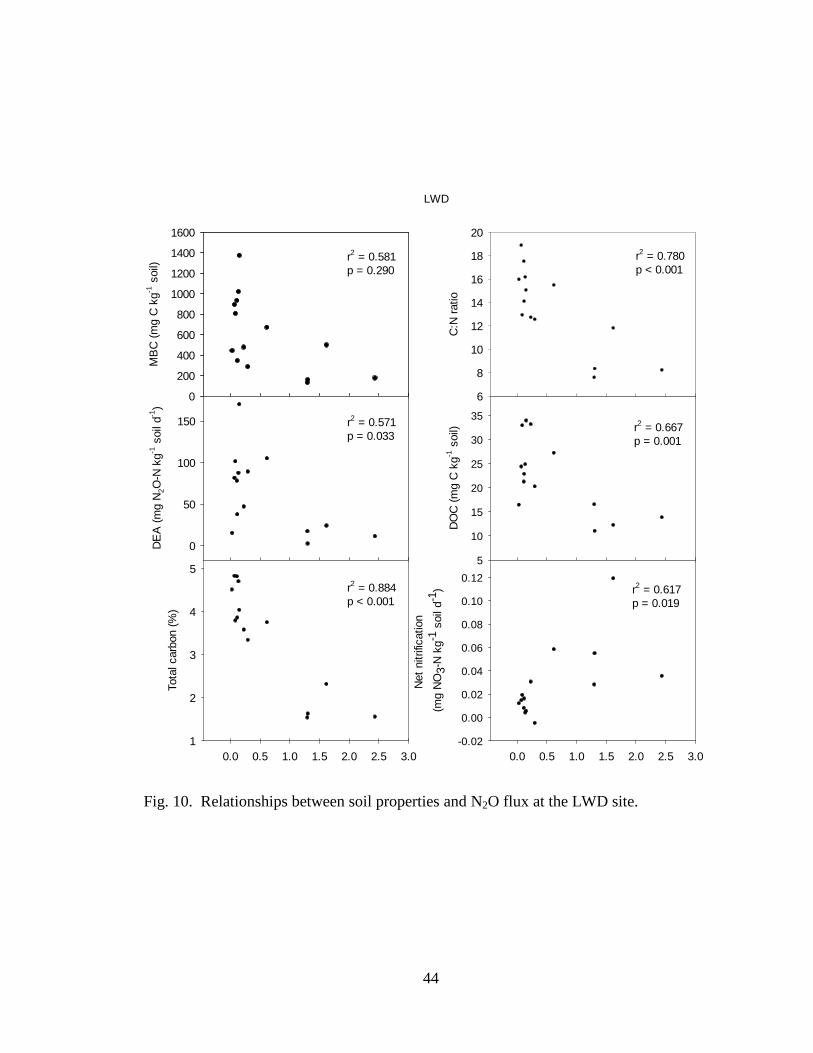
Fig. 10. Relationships between soil properties and N2O flux at the LWD site ................ 44
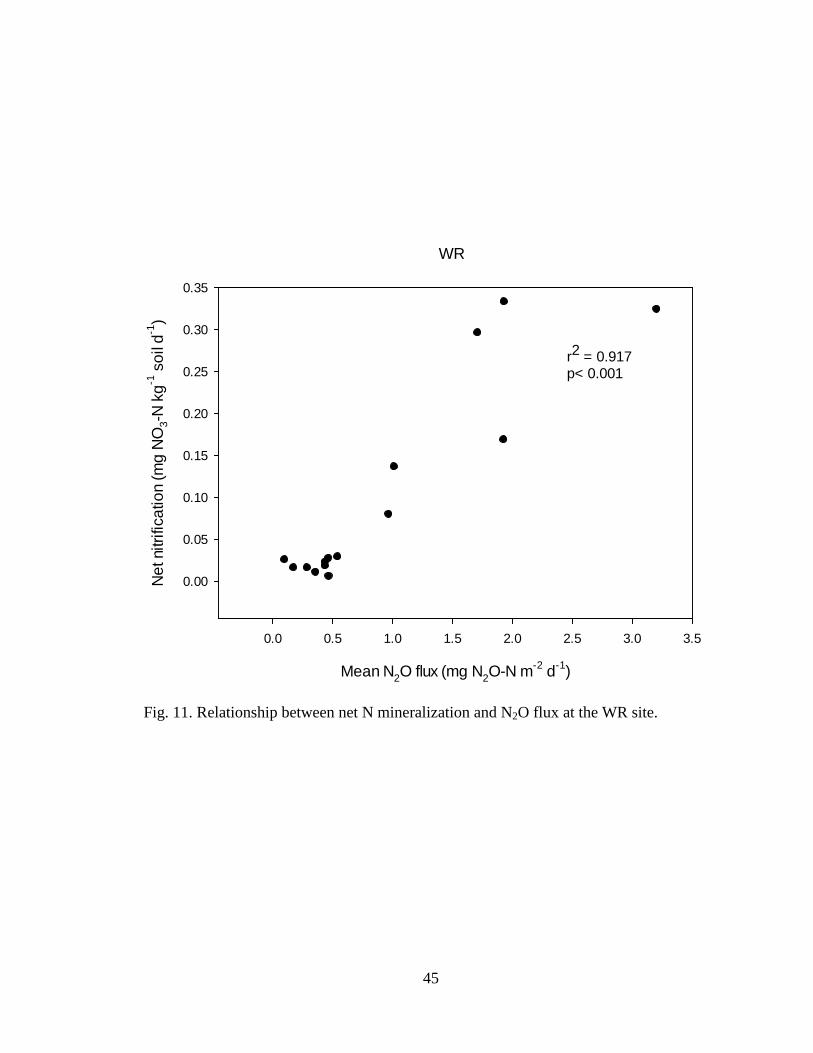
Fig. 11. Relationship between net N mineralization and N2O flux at the WR site .......... 45
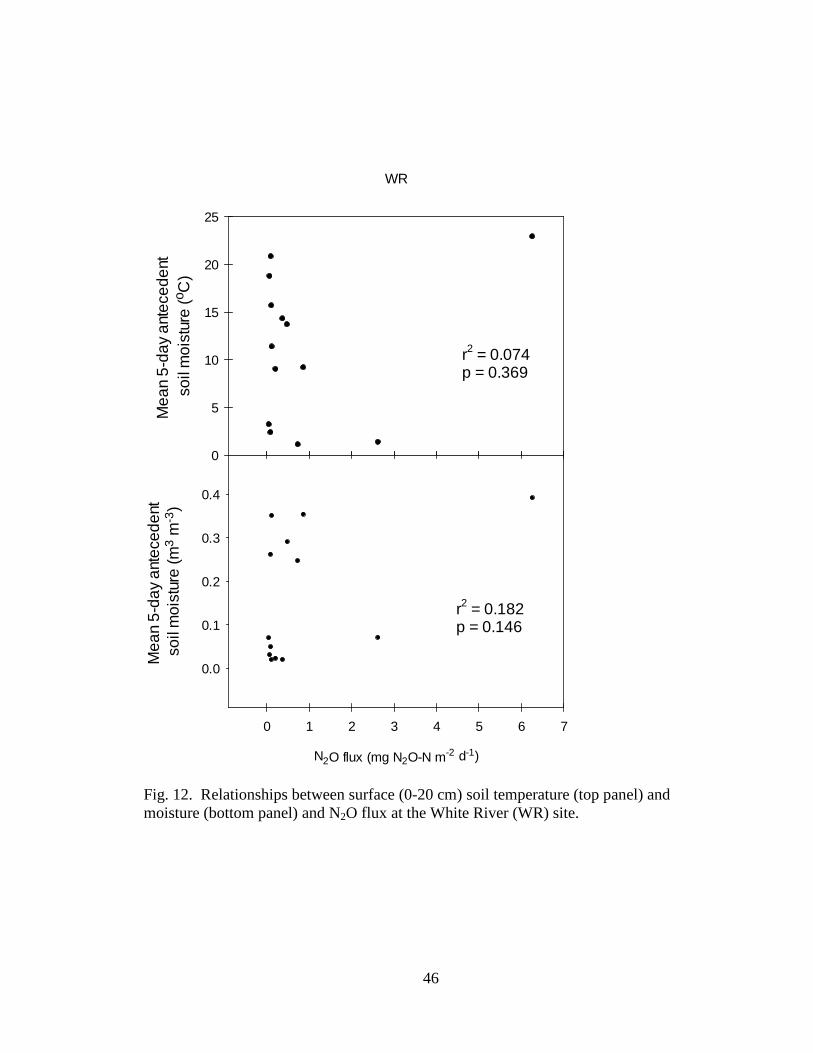
Fig. 12. Relationships between surface soil temperature and moisture and N2O flux
at the White River (WR) site ................................................................................. 46
xi
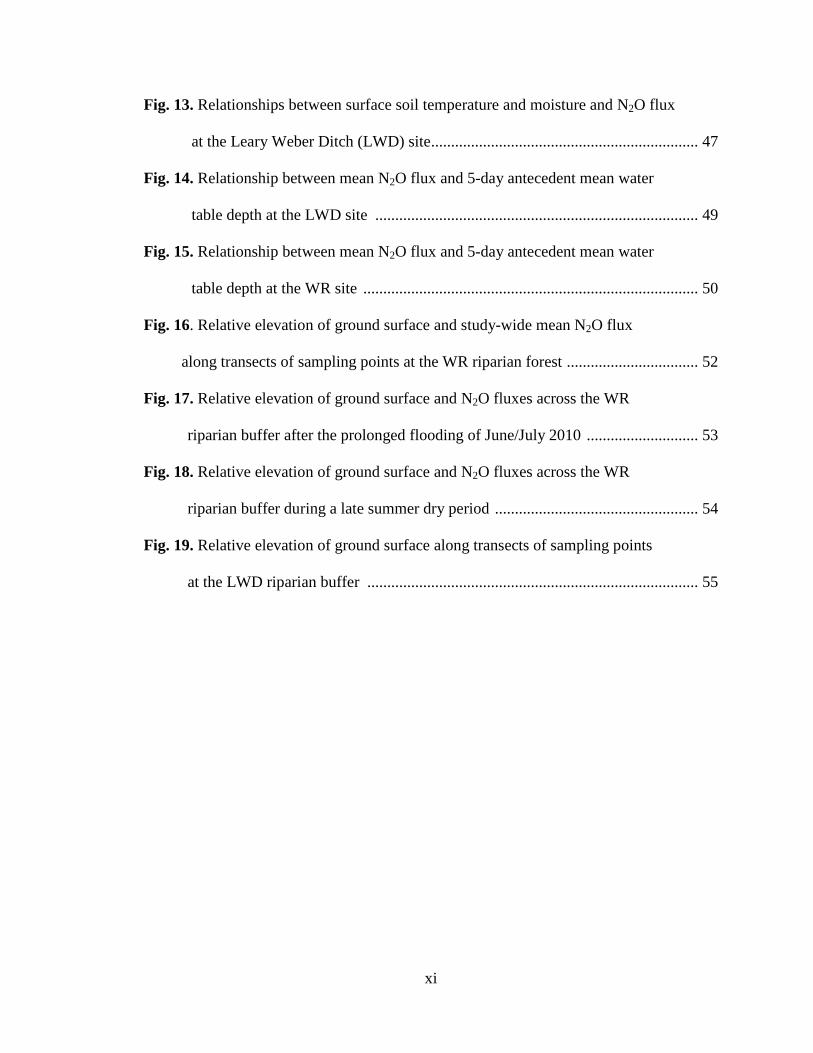
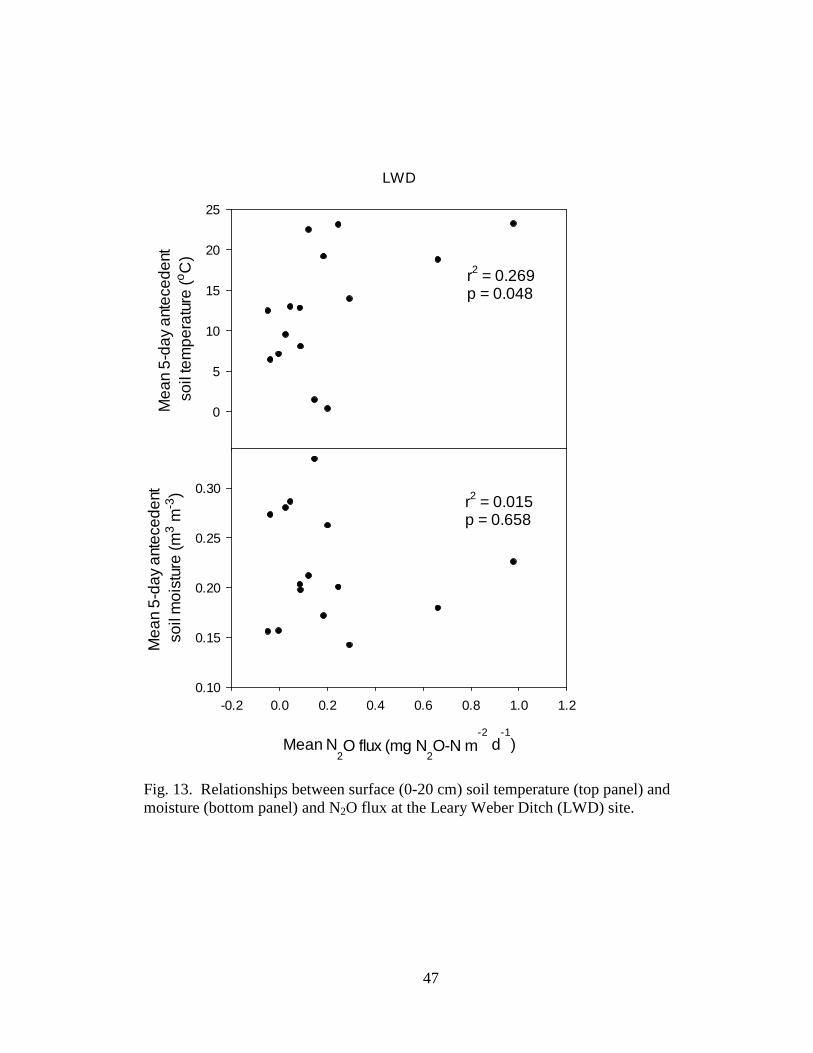
Fig. 13. Relationships between surface soil temperature and moisture and N2O flux
at the Leary Weber Ditch (LWD) site ................................................................... 47
Fig. 14. Relationship between mean N2O flux and 5-day antecedent mean water
table depth at the LWD site ................................................................................. 49
Fig. 15. Relationship between mean N2O flux and 5-day antecedent mean water
table depth at the WR site .................................................................................... 50
Fig. 16. Relative elevation of ground surface and study-wide mean N2O flux
along transects of sampling points at the WR riparian forest ................................. 52
Fig. 17. Relative elevation of ground surface and N2O fluxes across the WR
riparian buffer after the prolonged flooding of June/July 2010 ............................ 53
Fig. 18. Relative elevation of ground surface and N2O fluxes across the WR
riparian buffer during a late summer dry period ................................................... 54
Fig. 19. Relative elevation of ground surface along transects of sampling points
at the LWD riparian buffer ................................................................................... 55
xii
LIST OF APPENDICES
Appendix A. N2O flux at the White River site (WR) ..................................................... 68
Appendix B. N2O flux at the Leary Weber Ditch site (LWD) ........................................ 74
Appendix C. Soil properties at the White River site (WR) ............................................ 79
Appendix D. Soil properties at the Leary Weber Ditch site (LWD) ............................... 80

xiii
LIST OF ABBREVIATIONS
WR White River site
LWD Leary Weber Ditch site
N2O Nitrous oxide
DEA Denitrification enzyme activity
SOC Soluble organic carbon
MBC Microbial biomass carbon
TC Total carbon
DOC Dissolved organic carbon
C:N Carbon to nitrogen ratio
IPCC Intergovernmental Panel on Climate Change
1
INTRODUCTION
Statement of the problem
In modern agricultural systems, large amounts of synthetic fertilizer are applied to
crop fields in order to maintain soil fertility and productivity. These inputs, especially
nitrogen (N) fertilizer, are expected to continue to grow in light of increased demand,
both in the US and abroad, for food, animal feed and ethanol production (U.S. EIA,
2008). However, agricultural ecosystems are notoriously leaky with leaching and runoff
loss accounting for up to 20-30% of N applied (Owens et al., 1995; Klocke et al., 1999).
Therefore, there is legitimate concern that intensification of agricultural production could
result in greater nitrate (NO3-) export from cultivated fields into surface water systems.
Located at the interface between upland and streams, riparian buffers provide a
natural filter for a wide range of nutrients and agricultural pollutants, especially nitrate
(Schipper et al., 1993). Within a riparian buffer, soil microbial processes like
denitrification offer a mode of N-transformation by which dissolved nitrogen (N)
compounds in cropland runoff can be converted into gaseous nitrogen compounds. Since
denitrification has the potential to terminate as nitrous oxide (N2O), a major greenhouse
gas and ozone depleting gas (IPCC, 2006), it becomes critical to understand riparian soil
characteristics that favor N2O emission.
Riparian zones in the agricultural region of the US Midwest provide particularly
interesting venues to assess for these settings as N2O sources. First, both overland and
subsurface pathways contribute to N inputs in the low-gradient landscapes that
characterize the region’s riparian buffers. These landscape attributes lead to reduced
flow velocity and increased residence time, thus allowing for longer “filtering time” and
2
more effective N transformation before the discharge of nitrate-enriched runoff onto
adjacent streams. This function is often offered as one of the primary justifications for
the preservation and restoration of riparian buffers (Fennessy and Cronk, 1997).
Secondly, the US Midwest is characterized by intensive corn (Zea mays, L) production
systems subject to large-scale annual application of nitrogen fertilizer (150-200 kg N ha-1
yr-1). This agricultural land-use presents an environment where substantial loads of N can
be transported to riparian zones. While the denitrification potential in riparian soils has
been widely investigated in the laboratory, field-scale measurements of N2O emissions in
these ecosystems are sorely lacking (Groffman et al., 1998; Mosier et al., 1998). This
investigation is an effort fill in this information gap and to identify soil properties and
environmental factors controlling N2O emission from these high nitrate-loaded and often
water-saturated environments.
Continued increase in N2O concentration in the atmosphere has been linked to the
accelerated greenhouse effect and global climate change (IPCC, 2006). Depending on
land-use and management, soils can be major sources and sinks of nitrous oxide (N2O).
The contribution of terrestrial ecosystems to atmospheric N2O has been the focus of
numerous studies in recent decades. These studies examined the effect of land-use
(forest, grassland, cropland; Ambus, 1998; Vilain et al., 2010), management and climate
(Dowrick, 1999; Flechard et al., 2007) on N2O emission. Vilain et al. (2010) investigated
the effect of slope position and land use on N2O emissions. While the effect of tillage
practices and fertilizer application on N2O emission from agricultural fields was the focus
of numerous studies (Eichner, 1990; Jacinthe and Dick, 1997; Yanai et al., 2003), there
have been far fewer assessments of N2O emission form riparian buffers. Hefting et al.
3
(2003) evaluated N2O emission in chronically-loaded riparian zones in the Netherlands
and supported a significant effect of land-use (forest vs. grassland) on emission. McLain
and Martens (2006) measured lower N2O fluxes in semi-arid riparian zones in Arizona
but also noted an effect of vegetation type. To our knowledge, only two published
studies (Kim et al. 2009; Jacinthe et al. 2012) have focused on agricultural riparian
systems in the US Midwest.
Available data indicate that agricultural land-use and fertilizer application
contribute at least 67% of total anthropogenic N2O emission in the US (U.S. EPA, 2009).
However, N2O emission inventories (eg, IPCC, EPA) have generally failed to discretely
estimate the contribution of riparian zones in agricultural watersheds. Research on
nitrogen cycling in riparian ecosystems indicates that these landscape elements can be
hotspots for N2O emissions, especially if denitrification is incomplete (Ambus, 1998;
Groffman et al., 1998; Hefting et al., 2003). In the US Midwest where large amounts
nitrogen fertilizers are applied to hundreds of square miles of croplands annually, N2O
emissions may be substantial. In agricultural watersheds where ample NO3- is available
for microbial transformation, it is important to identify the soil drivers responsible for
N2O emissions not only in the cropped area but also in the riparian zones that periodically
receive cropland runoff. Since riparian buffer restoration has become increasingly
popular for their nutrient-removal ability, there is a need to understand N2O emission
dynamics and to quantify the contribution of these landscape hotspots to watershed-scale
N2O emission inventories.

4
Nitrate retention and mitigation in riparian buffers
In agricultural watersheds, fertilized croplands represent the dominant source of
mineral nitrogen entering the buffer zones via several pathways including subsurface,
groundwater and runoff flow (Groffman et al., 1998). Riparian buffer zones are
biogeochemically and hydrologically unique ecosystems (Triska et al., 1993) that serve
as a filter between terrestrial upland and open-channel waters. In many cases, riparian
zones offer a low-gradient landscape where the velocity of incoming water can be
considerably reduced resulting in a temporary water-detention area and providing a
greater opportunity for biochemical transformations or immobilization (microbial and
plant uptake) of dissolved nutrients (Osbourne and Kovacic, 1993; Hill 1996; Fennessy
and Cronk, 1997). This function is of particular importance to the removal of dissolved
nitrate before it reaches an open water channel (Triska et al., 1993; Vought et al., 1995;
Burt et al., 1999).
If massive amounts of nitrate made its way to surface waters, a host of
environmental and public health concerns could arise such as eutrophication and
methemoglobinemia. Eutrophication of aquatic systems results in enhanced microbial
respiration depleting the dissolved oxygen supply. These low oxygen conditions
drastically degrade water quality and negatively impact the integrity of aquatic habitats
(Carpenter et al., 1998). A public health concern regarding ingestion of nitrate loaded
water can result in methemoglobinemia in infants, commonly known as “blue baby
syndrome”. Blue baby syndrome is a condition in which the body transforms nitrate into
nitrite blocking the oxygen carrying capacity of blood hemoglobin (Johnson et al., 1987).
These concerns alone provide enough support for restoring and preserving riparian buffer
5
strips, especially in agricultural watersheds where nitrate availability is often in excess.
While the necessity of riparian buffer ecosystems for dissolved nitrate load reduction
remains undisputed, attention must be paid as to how nitrogen transformation in these
ecosystems could affect atmospheric quality in terms of nitrous oxide (N2O) emission.
Research is needed to identify environmental factors and soil conditions that promote the
emission of nitrous oxide. This knowledge can then be incorporated into future plans for
riparian zone restoration and management to minimize these undesirable emissions.
Riparian zones naturally mitigate nitrate loads by modes of plant uptake,
microbial immobilization and dilution (Hill, 1996); however, denitrification is the most
efficient mitigation process as it provides for the complete conversion of dissolved NO3-
into gaseous end-products (Hefting et al., 2006).
Denitrification is a process that is mediated by heterotrophic microbes that reduce
dissolved nitrate into N gases via this sequence of reactions (Smith et al., 2003):
NO3- (aq) NO2
- (aq) NO (g) N2O (g) N2 (g)
The extent and rate at which these reactions occur depend on a number of factors
including oxygen, nitrate and organic carbon availability (Tiedje, 1988). The process,
therefore, can be enhanced given an optimal combination of these factors.
Soil characteristics and conditions affecting N2O emission via denitrification
Understanding the controlling factors of denitrification is not synonymous with
understanding the factors that control N2O emission into the atmosphere. That is to say,
only a portion of the N2O produced in soils ends up in the atmosphere (Letey et al.,1980);
ideally the denitrification process can continue to elemental nitrogen (N2) which
6
composes approximately 78% of the lower atmosphere (Girard, 2005). Though N2 may
be the environmentally ideal end-product of denitrification, the combination of
environmental soil conditions that are most conducive to its production are not well
understood (Letey et al., 1980; Jacinthe et al., 2000). Soil moisture, oxygen, nitrate, and
soil organic carbon (SOC) availability and pH have been identified as the dominant
factors that influence the composition of denitrification end-products and control their
emission into the atmosphere.
i. O2 availability
The effect of oxygen availability on N2O fluxes is strongly linked to soil moisture
and texture factors that determine gaseous diffusion constraints within the soil profile.
A frequently saturated soil environment is one of the many attributes that make
riparian buffers ideal for N-transformation by denitrification. Assuming that ample
nitrate is available in runoff waters delivered to riparian soils, an anaerobic environment
is necessary to initiate denitrification (Weitz et al., 2001). The frequency of flooding
events and fluctuations in water table depths play critical roles in denitrification by
influencing oxygen availability in the soil atmosphere (Jacinthe et al., 2000). Various
water table depths determine the depth of the saturated zone within the soil column, thus
the higher the water table the greater anaerobic soil environment. If soil becomes
completely saturated, air is expelled out of the pores and residual oxygen is quickly
exhausted by resident microbes. Soil saturation restricts the diffusion of oxygen into soil
pores and the soil progressively develops into an anaerobic, reducing environment
(Hillel, 1998). Similarly, denitrification rates and N2O emissions from soil tend to
7
increase with increasing water-filled pore space (WFPS) (Keller and Reiners, 1994;
Smith et al. 1998; Dobbie and Smith 2001).
Soil texture also affects water movement and gas diffusion, and thus relate to
emission of N2O. Soils with higher porosity and hydraulic conductivity generally
promote higher diffusion rates; therefore coarser soils tend to correspond to better drained
and better aerated soils. In contrast, gases diffuse at much slower rates through liquids
and smaller soil pores (Hillel, 1998), therefore increasing residence time of gaseous
molecules in the soil. A review of soil N2O emissions performed by Stehfest and
Bouwman (2006) showed that finer-textured soils lead to significantly higher N2O
emissions in comparison to coarse and medium textured soils. Further, Hefting et al.
(2004) found that higher denitrification rates occurred in fine textured sites after rainfall
events. Since finer textured soils have smaller pores they tend to give rise to a capillary
zone in organic soil. Because of their capacity to retain moisture lighter textured soils
may be more conducive to producing and maintaining denitrifying conditions longer than
in better drained coarser soil (Bouwman et al., 1993).
Diffusion also plays a role in the conversion of N2O into N2; the longer it takes
N2O to diffuse to the atmosphere, the more likely denitrifying bacteria will transform it
into N2 before reaching the atmosphere (Davidson, 1991; Smith et al., 1998; Hefting et
al., 2004).
ii. Nitrate availability
Once oxygen is depleted within the soil and an anaerobic environment is formed
within the soil column, soil microbes begin to use nitrate instead of oxygen as the
8
electron acceptor in microbial metabolism (Hedin et al., 1998); this is the basis of
denitrification.
In landscapes down gradient from fertilized croplands, mineral nitrogen
availability is generally higher than in other landscapes. Weitz et al. (2001) found that
mineral nitrogen availability and soil moisture were the most important factors
controlling N2O emission variability. However, Smith et al. (1998) showed under
laboratory conditions that mineral nitrogen application had little to no effect on N2O
emissions until the soil was wetted, while Pfenning and McMahon (1996) found that
denitrification potential was not limited by nitrate concentrations. These studies suggest
that while nitrate availability is crucial to denitrification, soil moisture plays a larger role
in N2O emissions.
iii. Organic carbon availability
Soil organic carbon (SOC), particularly dissolved organic carbon, also acts as a
regulator of denitrification and emission of N2O from soils. During denitrification,
organic carbon acts as an electron donor for microbial metabolic processes (Hedin et al.,
1998). In this way, organic carbon availability can be a limiting factor in denitrification
and thus N2O emission in a riparian ecosystem.
A study by Pfenning and McMahon (1996) showed that N2O production rates
increased in response to increasing organic carbon concentrations in riverbed sediments.
The study also reported higher N2O production rates occurred in the presence of organic
matter from surface sediments rather than with organic matter in groundwater (Pfenning
and McMahon, 1996). In addition, Stehfest and Bouwman (2006) concluded that the
N2O/N2 ratios in denitrification products increased with SOC content. That study

9
concluded that denitrifying microbes showed a preference for the transformation of
nitrate to nitrous oxide rather than nitrous oxide to dinitrogen in the presence of an ample
supply organic carbon to denitrifiers (Stehfest and Bouwman, 2006). Burford and
Bremner (1975) also suggested that, where an abundant supply of nitrate and SOC exists,
microbes preferentially transform nitrate to N2O instead of the conversion of N2O to N2.
iv. Soil temperature and pH
Soil temperature also plays a role in N2O emission of soils. Pfenning and
McMahon (1996) found that lowering incubation temperatures of nitrate-rich riverbed
sediments from 22 to 4 ◦C resulted in a 77 % decrease in N2O production rates. These
findings are consistent with a previous study by Hanson et al. (1994) suggesting that
denitrification rates were affected by annual temperature changes. Additionally, Dobbie
and Smith (2001) showed that identical soil cores amended with the same amounts of
nitrate and water showed an appreciable increase in N2O emissions with increased soil
temperature. However, Goossens et al. (2001) found that 7-76 % of the total annual N2O
emitted occurred during the winter months (October-February) and consequently
suggested that annual N2O emission budgets should not overlook colder winter months as
this could result in underestimation of annual emissions.
Additionally, N2O emissions can be affected by soil pH. According to Stehfest
and Bouwman (2006), higher N2O emissions were correlated with lower soil pH.
Although the exact relationship has not been fully elucidated, it has been hypothesized
that low soil pH (4.9-6) enhances denitrifying capabilities of soil microbial communities
(Simek et al., 2002). In contrast, study where soil pH was adjusted to pH values of 3.9,
10
5.9, and 7.6, Yamulki et al. (1997) concluded that average N2O emissions decreased
significantly with decreasing pH.
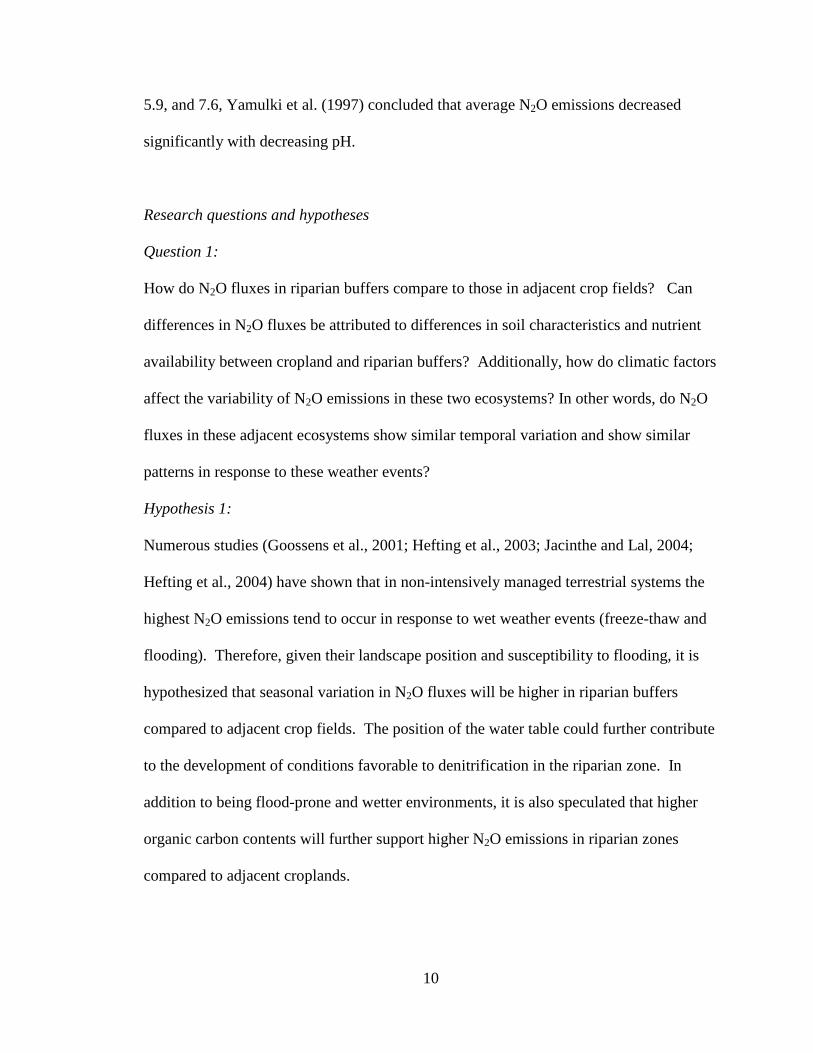
Research questions and hypotheses
Question 1:
How do N2O fluxes in riparian buffers compare to those in adjacent crop fields? Can
differences in N2O fluxes be attributed to differences in soil characteristics and nutrient
availability between cropland and riparian buffers? Additionally, how do climatic factors
affect the variability of N2O emissions in these two ecosystems? In other words, do N2O
fluxes in these adjacent ecosystems show similar temporal variation and show similar
patterns in response to these weather events?
Hypothesis 1:
Numerous studies (Goossens et al., 2001; Hefting et al., 2003; Jacinthe and Lal, 2004;
Hefting et al., 2004) have shown that in non-intensively managed terrestrial systems the
highest N2O emissions tend to occur in response to wet weather events (freeze-thaw and
flooding). Therefore, given their landscape position and susceptibility to flooding, it is
hypothesized that seasonal variation in N2O fluxes will be higher in riparian buffers
compared to adjacent crop fields. The position of the water table could further contribute
to the development of conditions favorable to denitrification in the riparian zone. In
addition to being flood-prone and wetter environments, it is also speculated that higher
organic carbon contents will further support higher N2O emissions in riparian zones
compared to adjacent croplands.
11
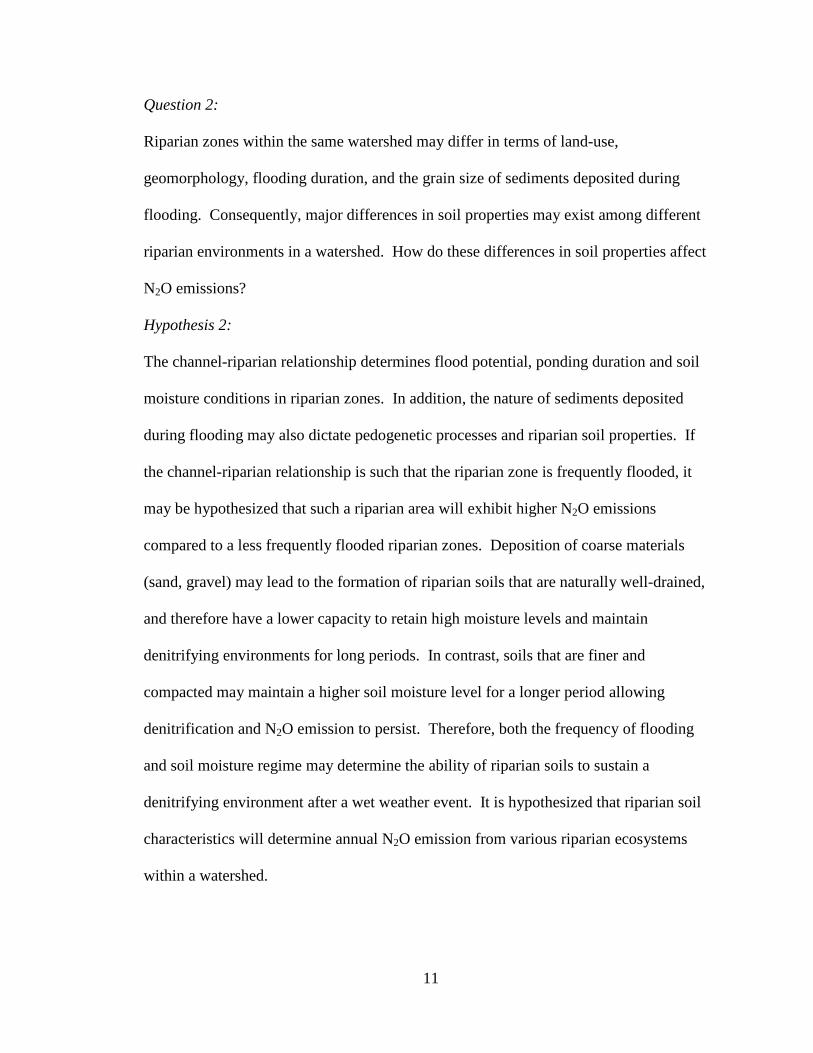
Question 2:
Riparian zones within the same watershed may differ in terms of land-use,
geomorphology, flooding duration, and the grain size of sediments deposited during
flooding. Consequently, major differences in soil properties may exist among different
riparian environments in a watershed. How do these differences in soil properties affect
N2O emissions?
Hypothesis 2:
The channel-riparian relationship determines flood potential, ponding duration and soil
moisture conditions in riparian zones. In addition, the nature of sediments deposited
during flooding may also dictate pedogenetic processes and riparian soil properties. If
the channel-riparian relationship is such that the riparian zone is frequently flooded, it
may be hypothesized that such a riparian area will exhibit higher N2O emissions
compared to a less frequently flooded riparian zones. Deposition of coarse materials
(sand, gravel) may lead to the formation of riparian soils that are naturally well-drained,
and therefore have a lower capacity to retain high moisture levels and maintain
denitrifying environments for long periods. In contrast, soils that are finer and
compacted may maintain a higher soil moisture level for a longer period allowing
denitrification and N2O emission to persist. Therefore, both the frequency of flooding
and soil moisture regime may determine the ability of riparian soils to sustain a
denitrifying environment after a wet weather event. It is hypothesized that riparian soil
characteristics will determine annual N2O emission from various riparian ecosystems
within a watershed.
12
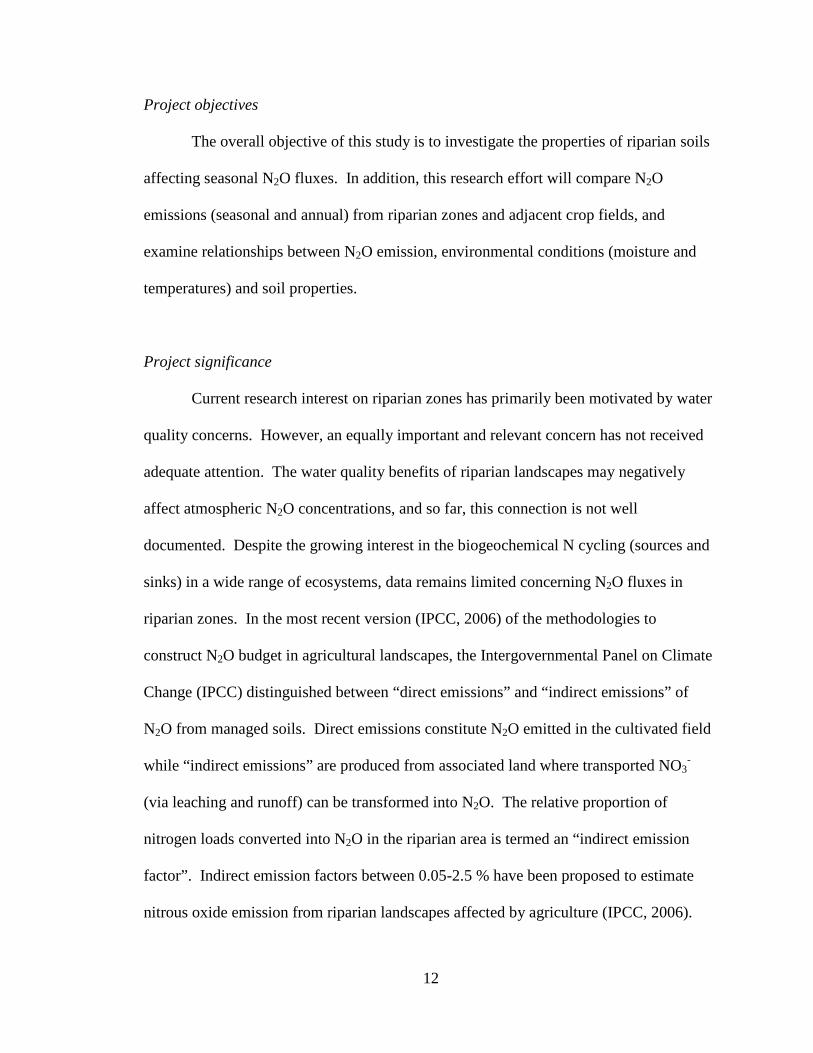
Project objectives
The overall objective of this study is to investigate the properties of riparian soils
affecting seasonal N2O fluxes. In addition, this research effort will compare N2O
emissions (seasonal and annual) from riparian zones and adjacent crop fields, and
examine relationships between N2O emission, environmental conditions (moisture and
temperatures) and soil properties.
Project significance
Current research interest on riparian zones has primarily been motivated by water
quality concerns. However, an equally important and relevant concern has not received
adequate attention. The water quality benefits of riparian landscapes may negatively
affect atmospheric N2O concentrations, and so far, this connection is not well
documented. Despite the growing interest in the biogeochemical N cycling (sources and
sinks) in a wide range of ecosystems, data remains limited concerning N2O fluxes in
riparian zones. In the most recent version (IPCC, 2006) of the methodologies to
construct N2O budget in agricultural landscapes, the Intergovernmental Panel on Climate
Change (IPCC) distinguished between “direct emissions” and “indirect emissions” of
N2O from managed soils. Direct emissions constitute N2O emitted in the cultivated field
while “indirect emissions” are produced from associated land where transported NO3-
(via leaching and runoff) can be transformed into N2O. The relative proportion of
nitrogen loads converted into N2O in the riparian area is termed an “indirect emission
factor”. Indirect emission factors between 0.05-2.5 % have been proposed to estimate
nitrous oxide emission from riparian landscapes affected by agriculture (IPCC, 2006).
13
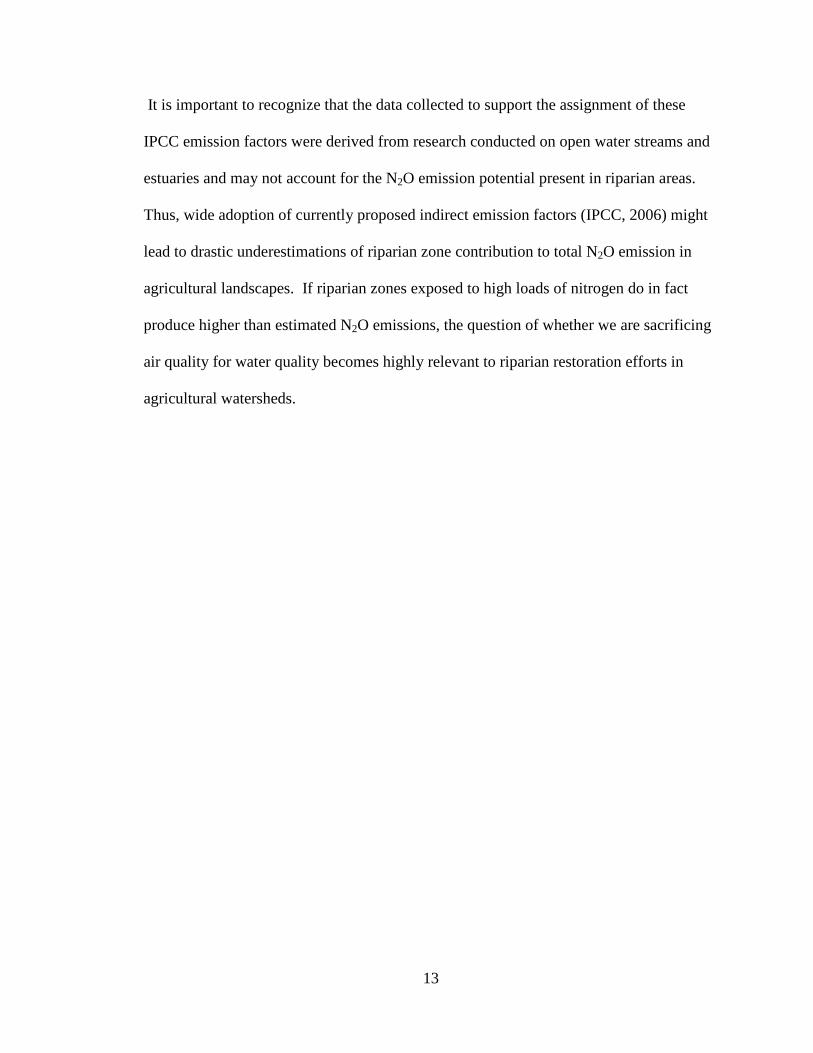
It is important to recognize that the data collected to support the assignment of these
IPCC emission factors were derived from research conducted on open water streams and
estuaries and may not account for the N2O emission potential present in riparian areas.
Thus, wide adoption of currently proposed indirect emission factors (IPCC, 2006) might
lead to drastic underestimations of riparian zone contribution to total N2O emission in
agricultural landscapes. If riparian zones exposed to high loads of nitrogen do in fact
produce higher than estimated N2O emissions, the question of whether we are sacrificing
air quality for water quality becomes highly relevant to riparian restoration efforts in
agricultural watersheds.
14
MATERIALS AND METHODS
Description of study sites
This study was conducted at two riparian buffers and adjacent crop fields in
central Indiana. At both sites the riparian buffer is located down-slope from intensively
managed agricultural fields under corn-soybean (Glycea max, L) rotation. The sites
present contrasting physical and geomorphological characteristics (drainage properties,
channel geomorphology and land-use). The first site (39⁰ 29’ 39.49” N, 86⁰ 25’ 2.39”
W; Morgan County) is a riparian forest south of Indianapolis (hereafter referred to as
White River, WR) and the second site is located east of Indianapolis (39⁰ 51’ 20.34”N,
85⁰ 50’ 24.68”W; Hancock County) consisting of a mixture of grasses and shrubs
(hereafter referred to as Leary Weber Ditch, LWD). These riparian sites are drastically
different in terms of vegetation cover, soil drainage, and geomorphology of the adjacent
channel; these factors should affect soil texture, organic carbon availability and soil
moisture conditions, and ultimately N2O emission. As hypothesized, these contrasts
could result in significant difference in N2O fluxes.
The White River site (WR) is a riparian forest bordering a 4th order segment of the
White River. At this deciduous riparian forest, vegetation consists of sugar maple (Acer
rubrum), silver maple (Acer saccharinum), beech (Fagus sylvatica L.), sycamore
(Platanus occidentalis), oak (Quercus bicolor) and ash (Fraxinus pennsylvanica). The
riparian area is approximately 150 m wide strip of land between the river channel and the
cultivated field at its northern edge. Field observations and regional surficial geology
maps indicate that soils at this site derive from alluvium deposits associated with flooding
events of the White River and last glaciation. The overall coarser (silt to sand) alluvial
15
soils that dominate this site are the products of the White River geomorphology and
flooding events since the last glacial maximum. This site is estimated to have
approximately 2 m of silt loam soil atop a 50 cm layer of compacted gravel. This layer
represents the lower boundary of the effective water table. As a floodplain of the White
River, this site is highly susceptible to floods, which often occur after early spring
snowmelt and major rain events in late spring and early summer. The entire site can be
under up to 4 m of floodwater for extended periods of time during the most extreme of
these events. Soils are well-drained predominantly classified as Genesee silt loam (fine-
loamy mesic fluventic Eutrudepts) and Stonelick sandy loam (USDA-NCRS Web Soil
Survey). Upland land-use is primarily corn (Zea mays) and soybean (Glycine max)
rotation; however, in both the 2009 and 2010 growing seasons when N2O fluxes were
monitored for this study, the upland crop field at WR was in corn. This site is estimated
to have approximately 2 m of silt loam soil atop a 50 cm compacted gravel layer. This
low permeability layer represents the lower water table boundary. As a floodplain of the
White River, this site is highly susceptible to floods, which often occur after early spring
snowmelt and major rain events in late spring and early summer. The entire site can be
under up to 4 m of floodwater for extended periods of time during the most extreme of
these events.
The Leary Weber Ditch site (LWD) is a grassland-shrub riparian zone
approximately 25 m wide on both sides of an agricultural ditch flowing west to east
within the reach of the study site. To prevent flooding of adjacent crop fields in this flat
landscape, the ditch has periodically been dredged, straightened and artificially deepened.
As a result of these alterations, the riparian zone is not subject to active sediment
16
deposition from flooding events as might be expected with a non-modified channel. This
site is dominated by fine-textured and poorly-drained soils mostly classified as Brookston
loam (fine-loamy mesic typic Argiaquolls). Soils at this site develop above a compacted
glacial till layer at a depth of approximately 2 m below the surface (SCS, 1978). A tile
drainage network, located approximately 1 m above this till layer, flows underneath the
crop field and riparian area, and discharge into the Leary Weber ditch. At the LWD site,
the adjacent crop fields are also in soybean-corn rotation. During this study the north
side of the ditch was in soybean while corn was planted on the south side of the ditch.
Before planting corn in the spring of 2010, 121.5 kg N ha-1 of urea ammonium-nitrate
(UAN) was applied to the south field.
Monitoring of N2O emission
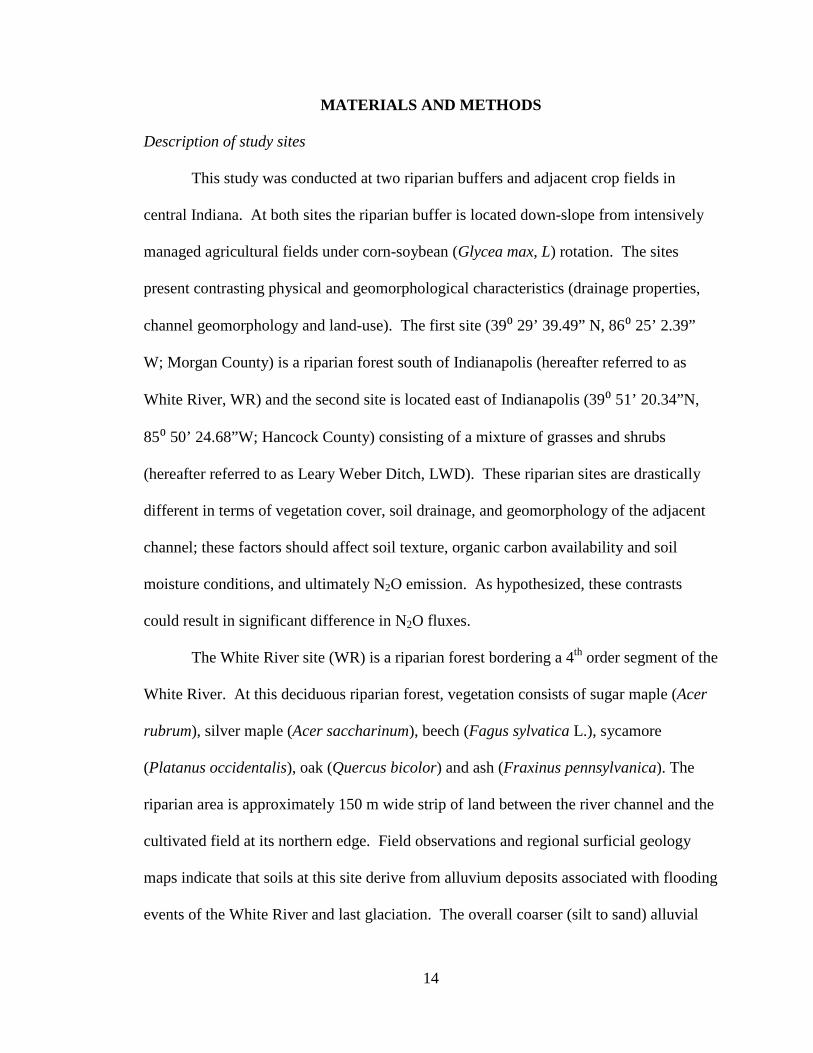
Nitrous oxide emission was monitored from December 2009 to May 2011. At the
White River site, N2O emission and soil properties were measured along three transects
with two transects in the riparian zone, and one transect in the crop field. In the riparian
area, transects were delineated so as to include high (ridge) and low (swale) topography,
and extended from the field edge to the river channel edge. A schematic layout of the
WR site is shown in Fig. 1. Along each of the riparian zone transects 5 static chambers
were installed and remained in place for the duration of the study. The chambers
installed in the crop field were removed during harvest and fertilizer application. Next to
the chamber near the middle of the first transect (chambers 1-5), soil probes (HOBO
Micro Station Logger with 12-bit Temperature Smart Sensor S-TMB-M006 and Soil
17
Moisture Smart Sensor S-SMA-M005) were installed for continuous measurement of soil
moisture and temperature at 20 cm below the surface.
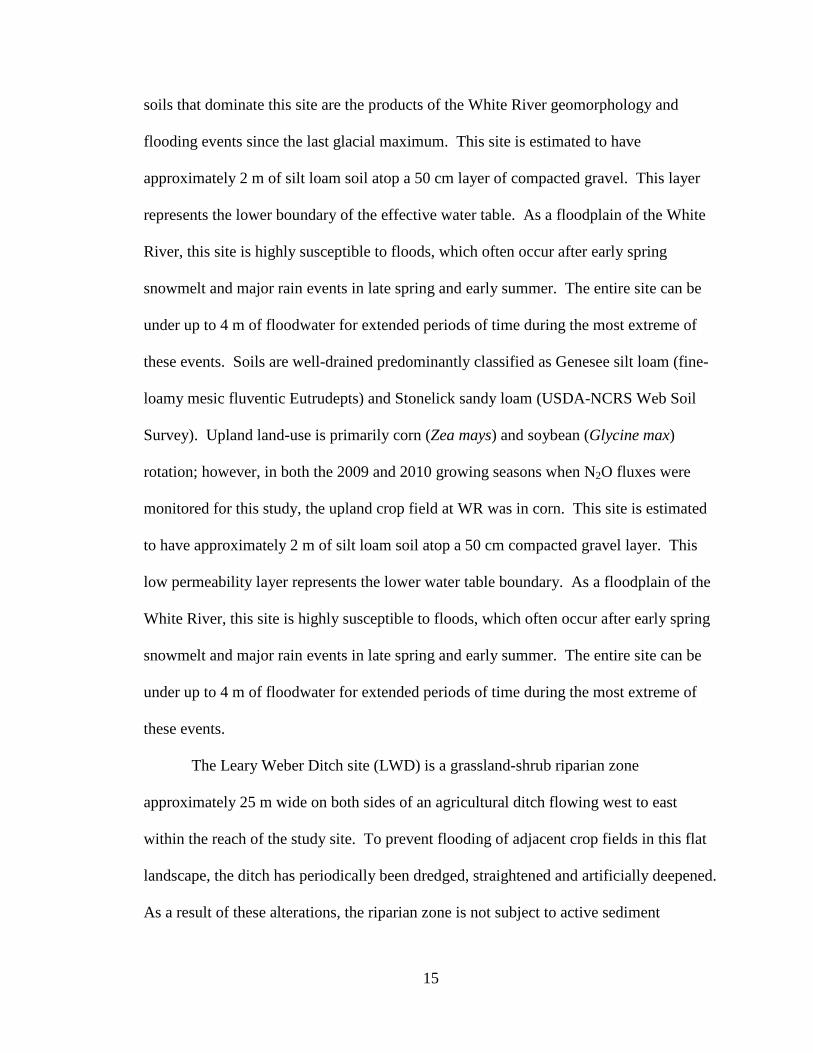
Likewise at the LWD site, static chambers and soil moisture and temperature
probes (also at 20cm depth) were deployed in both the crop field and riparian zone. To
maintain consistency throughout the study with the field crop type, the crop field transect
remained on the south field to follow the corn-rotation; for the 2010 growing season the
north riparian buffer reflected emissions adjacent to soybean cultivation. Given the flat
topography and uniform landscape at LWD, chambers were installed along a
predetermined grid from field to ditch edge (Fig. 2). Chambers installed in the crop
fields were removed as needed to accommodate agricultural field operations including
fertilizer application, seeding and fall harvest.
Trace gas sampling and analysis
Nitrous oxide gas samples were collected in the field at both sites on a monthly to
bi-monthly basis between December 2009 and May 2011. Sampling frequency was be
adjusted with occurrence of wet weather events and site accessibility (frozen or heavily
flood chambers limited accessibility). Deployed static chambers consisted of 30 cm
inner-diameter PVC cylinders securely inserted 8-10 cm into the ground with an above
ground headspace average height of 12-15 cm. The bottom edge of the chamber was
beveled to facilitate ground insertion. During sampling, chambers were covered with
PVC lids secured on the base with bungee cords and metal hooks. The lid was fitted with
a gasket at its underside edge to make an air-tight seal, and butyl rubber septa at its center
to form a sampling port.
18
Fig. 1. A schematic layout of the WR site showing the location of the static chambers (numbered dots) and soil moisture and temperature sensors (labeled square). The arrow indicates the general channel flow direction (approximately north-south).
Fig. 2. A schematic layout of the LWD site showing the approximate location of the static chambers (numbered dots), and soil moisture and temperature sensors (labeled square). The arrow indicates the general channel flow direction (approximately west-east).
19
Chamber headspace gas was sampled at 20-30 min intervals for one hour to
determine gas concentration. Gas samples (~20 ml) were stored in 10 ml evacuated glass
vials fitted with butyl rubber septa and kept away from heavy light exposure until
analyzed.
Gas samples were analyzed using a CP-3800 gas chromatograph (Varian, Palo
Alto, CA), in conjunction with a Combipal headspace auto-sampler (CTC Analytics,
Zurich, Switzerland). The GC is equipped with an electron capture detector (300 ◦C) and
two stationary phase Porapak Q columns (90-cm long pre-column and 180-cm long
analytical column). The GC was calibrated with standard gases obtained from Alltech
(Deerfield, IL). Nitrous oxide fluxes were computed using the following calculation:
𝐹 =𝑑𝐶𝑑𝑡
𝑉𝐴
𝑘
Where: dC/dt: rate of change of N2O concentration in chamber headspace (mg N2O-N m-
3 min-1); V: chamber volume (m3); A: area of soil circumscribed by chamber (m2); k: time conversion factor (1440 min d-1) Additionally, cumulative N2O emitted during the study was computed for each sampling
point by integration between sampling occasions using the trapezoidal rule. Area under
the curve computation was carried out using SigmaPlot 11.0.
Soil sample collection and analysis
Soil samples were collected in October 2009 next to each static chamber at each
site to determine soil properties. Soil samples were collected as close as possible to the
chamber but not within the chambers. These samples were composite soil samples
collected at depths of 0-20 cm at each chamber location to represent an overall
characterization of the most microbially-active soil layer. Intact soil cores were also
20
extracted to determine surface bulk density and total porosity. The intact soil cores were
then dried in an oven at 105 ◦C for 48 hrs to obtain total mass of dry soil within the core.
Subsequently, soil bulk density is determined using the following equation:
𝜌𝑠 =𝑀𝑠
𝑉𝑐
Where: ρs = soil bulk density (g cm-3); Ms = dry soil mass (g); Vc = core volume (cm3)
Using soil bulk density the total porosity of the soil can be determined using the
following equation:
𝜑 = 1 − �𝜌𝑠/𝜌𝑝�
Where: 𝜑 = total soil porosity; ρs = soil bulk density (g cm-3); ρp = soil particle density (2.65 g cm-3);
Each composite soil sample was split into a moist and dry fraction. The moist
fraction was used for assessment of biochemical properties whereas the dry fraction was
used to determine physical and mineral properties. Soil analysis will focus on properties
that are most likely to influence N2O fluxes and denitrification. All results were reported
on a dry soil mass basis in which the soil was dried at 105 ◦C for 48 h. All tests were run
in duplicate.
The biochemical factors analyzed were nitrogen mineralization rates (net
nitrification), soil microbial biomass, denitrification enzyme activity (DEA) and
dissolved organic carbon (water extractable carbon).
Nitrogen mineralization rates were determined using an amended laboratory
method described by Jacinthe et al. (2002). First, inorganic nitrogen is extracted from
fresh, field moist soil (sieved 2 mm) in 1 M KCl solution, filtered (Whatman 42) and

21
analyzed for mineral nitrogen concentrations (t1 conc). Then, 10 g of field moist soil (2
mm) was incubated at 25 ◦C for 15 days. After incubation, mineral nitrogen was
extracted again following the procedure described above (t2conc). Net N-mineralization
rate was then calculated by dividing the change in mineral N concentration (t2conc - t1 conc)
by the time of incubation (15 days). This mineralization rate can be viewed as the net
nitrification activity occurring within the soil.
Soil microbial biomass was determined using the substrate-induced respiration
procedure, which employs the stimulation of microbial respiration by glucose amendment
and assumes that the subsequent respiration activity is proportional to the size of the
microbial biomass in the soil (Anderson and Domsch, 1978). First, 20 g of fresh, field
moist soil (sieved 2 mm) was amended with a glucose-talc mixture (1:4) and placed
inside an air-tight jar fitted with a sampling port. To obtain initial values (t1CO2), a jar
with only glucose-talc was also incubated. After a 2 h incubation period (22 ⁰C), the jar
headspace is sampled (~20 ml air) and analyzed for CO2 concentration by gas
chromatography (t2CO2). The rate of CO2 production (t2CO2 - t1CO2 divided by incubation
time) was used to calculate the soil microbial biomass.
Denitrification enzyme activity (DEA) was performed to determine the total
denitrification potential of the soil by using the acetylene (C2H2) inhibition method. This
technique was adapted from Smith and Tiedje (1979) with the exception that
chloramphenicol was be used. First, 5 mL of deionized water and 5 mL of a potassium
nitrate solution (1.43 g L-1) was added to 10 g field moist soil (sieved 2 mm) in a 160 mL
serum bottle. The bottle was then crimp-sealed and vigorously shaken to create a slurry,
then evacuated and flushed 3 times with a stream of N2 gas to expel oxygen from the
22
bottle. The bottle was brought to atmospheric pressure and 15 mL of C2H2 was added to
obtain a final C2H2 partial pressure of ~10 kPa. After a 2 h incubation (22 ◦C) period, 15
ml of bottle headspace was extracted and analyzed for N2O by gas chromatography
(t2N2O). To obtain an initial N2O value (t1N2O), a bottle containing only DI water and
potassium nitrate was included. The rate of N2O production (t2N2O - t1N2O divided by
incubation time) was used to calculate denitrification potential.
Dissolved organic carbon was determined as described in Burford and Bremner
(1975). Dissolved organic carbon was extracted at laboratory temperature (22 ◦C) from
soil suspension (20 mL deionized water added to 10 g field moist soil). The suspension
was shaken for 1 h and centrifuged (6,000 rpm for 5 minutes). The supernatant was then
filtered through 0.45 µm nylon filters (Sartorius Biolab) and analyzed for TOC using an
Elementar Vario TOC/TNb Cube Analyzer (Mt. Laurel, NJ).
Other soil characteristics analyzed were soil organic carbon, pH and texture. Soil
organic carbon was determined using a dry combustion method. Soil was dried (105 °C,
48 h) and finely ground and sieved (150 µm). Soil sub-samples (8-15 mg in tin capsule)
were combusted at approximately 900 °C (Elementar Vario TOC/TNb Cube Analyzer) to
determine C and N content. Determination of soil pH involved the addition of deionized
water to dry soil sample (sieved 2mm), shaking for 30 minutes and values obtained using
a pH meter (Accumet model 25 pH/ion meter). Texture analysis was performed using the
Bouyoucos (hydrometer) method (Bouyoucos, 1936). First, to burn off all organic matter
(OM), 40 g dried (105⁰C, 48h), sieved (2 mm) soil and was treated with 30% hydrogen
peroxide (H2O2) and heated to dryness. Next, sodium hexametaphosphate (50 g L-1) was
added to the sample and shaken overnight for complete dispersion of soil materials.
23
Hydrometer readings were taken at 40 seconds (approximate settling time for sand) and 2
hours (silt settling time). The percentage of sand, silt and clay was then calculated from
these readings.
An additional aspect to field sampling included monitoring the depth of the water
table. Next to most of the static chambers located within the riparian area (with
exception of chambers 13 and 14 at the LWD site, see Fig. 2), wells were dug to monitor
water table depth. Groundwater samples were periodically taken to determine mineral
nitrogen concentration and dissolved organic C. Dissolved oxygen, oxidation-reduction
potential and water temperature were also measured during well sampling.
Although physical, chemical and biochemical characteristics were based on
laboratory analysis, defining these properties aimed to aid in the effort to determine if and
how variability of these properties affect in situ N2O emission measurements. While
literature supports soil moisture as the leading controller of denitrification and associated
N2O emission, an understanding of the combination of factors and how these soil factors
differ between ecosystems (both between cropland and riparian zone and between
differing riparian zones) hoped to bring insight into what soil conditions promote N2O
emissions in the field.
Statistical analysis
Analysis of variance (ANOVA) was carried out to assess the effect of
geomorphology and land-use on N2O fluxes. In this analysis, the response variable was
N2O flux and the class variables were geomorphology (glacial outwash at WR and till
plain at LWD) and land-use (riparian buffer and cropland). Additionally, the effect of
24
sampling date was assessed using repeated-measured ANOVA with sampling occasion as
the time-repeated factor (Little, 1989). For separation of means, t-tests were also
conducted in order to compare overall N2O fluxes between sites and land-use. Prior to
ANOVA, the data was first tested for normality. If the data did exhibit a normal
distribution, transformations (i.e. log, reciprocal, square root, exponential, or square law)
were applied to normalize the data. If the data could not be normalized with one of the
transformation methods listed above, the non-parametric equivalent test was used. A
statistically significant difference confidence level of p<0.05 was used for all tests.
Additionally, biochemical, chemical and physical soil properties, as well as
environmental conditions (soil temperature, moisture, and water table depth) were
included in regression analysis to investigate links between soil properties, environmental
conditions and N2O emission.
25
RESULTS
Environmental soil conditions
The two study sites exhibited different soil moisture and temperature regimes
probably due to differing soil types and hydrogeomorphic settings (Figs. 3-4). The Leary
Weber Ditch (LWD) site resides in the Tipton till plain dominated by poorly drained
Brookston soils that require subsurface tile drainage for agriculture. In fact, our sampling
area was located between two tile drains (40 m space between tiles) that discharge into
LWD ditch. In contrast, soils at the WR site are well-drained Alfisols overlying glacial
outwash and alluvium deposits. Additionally, the LWD site received higher rainfall
amounts during the study than the White River (WR) site (Table 1). The combination of
these factors contributes to the overall higher soil moisture at LWD than at WR (0.16 and
0.21 m3m-3, respectively; Fig. 5). On the other hand, soil temperature was comparable
between the two sites remaining within 1-3 ºC during the sampling period (Fig. 5).
The study sites were also variably affected by flood events. While no indication
of flooding was observed at LWD, the WR site was flooded at least 4-5 times during the
study period with the most extensive flood occurring after major rainstorms in the
spring/summer 2010 and spring 2011. During these events, flood waters reached up to 4
m above ground level within the riparian buffer, and it took up to 2-3 weeks (June 1,
2010) for the waters to fully recede. Though water table regimes at the sites were quite
different, difference in surface soil moisture was more muted (Fig. 5). Soil moisture
content tended to peak in late spring to early summer and generally dropped starting in
late summer (Figs. 3 and 6). Additional climate comparisons are displayed in Table 1.
26
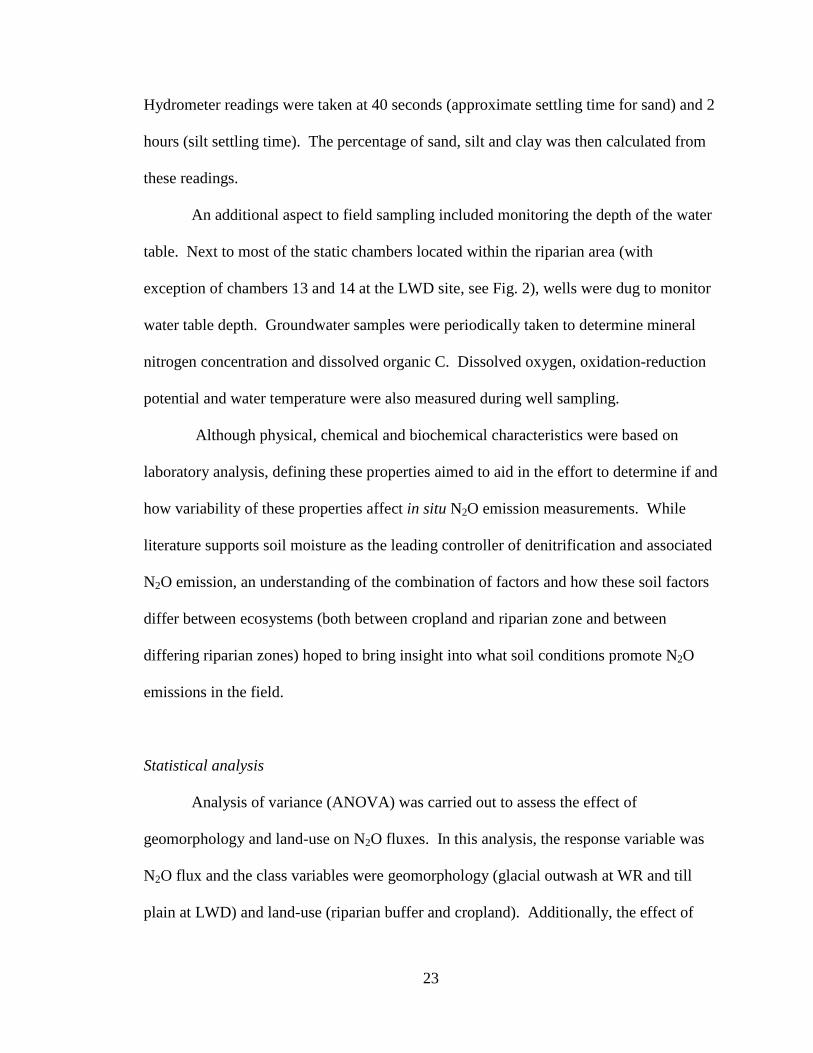
Fig. 3. Average daily flux of N2O, precipitation, soil moisture, and soil temperature at the WR riparian forest. Each data point is the mean of 13 measurements. Error bar represents standard deviation of the mean. The gap in soil moisture and temperature data is due to soil probe and logger malfunction due to stagnant flood water. Sensors were installed at approximately 20 cm below the soil surface near WR chamber 4.
20102011
WR
Dec Jan
Feb Mar
Apr May
Jun Jul
Aug Sep
Oct Nov
Dec Jan
Feb Mar
Apr May
Mea
n N
2O F
lux
(mg
N2O
-N m
-2 d
-1)
-10
-5
0
5
10
15
20
Soi
l Tem
pera
ture
(o C)
0
5
10
15
20
25
Soi
l Moi
stur
e C
onte
nt (m
3 m-3
)
0.0
0.1
0.2
0.3
0.4
Mean Daily Temp.Mean Daily MoistureMean MoistureMean Temp.
Pre
cipi
tatio
n (m
m) 0
1020304050
27
Date
Nov Dec Jan Feb Mar Apr May Jun Jul Aug Sep O
ct Nov Dec Jan Feb Mar Apr May Jun Jul
Riv
er d
isch
arge
(m3 s
-1)
0
200
400
600
800
1000
2010
2011
Fig. 4. White River discharge near the WR site during the sampling period December 2009 to May 2011.
28
Table 1. Air temperature and rainfall during the study period in comparison to long-term weather data for Central Indiana. Abbreviations: LWD = Leary Weber Ditch, WR = White River.
Mean temperature (°C) Mean rainfall (mm)
Season Indiana† WR‡ LWD‡ Indiana WR LWD
Winter 0.06 -1.18 -1.46 206 88 141
Spring 15.9 16.4 16.3 318 380 396
Summer 21.2 22.6 23.5 286 112 296
Fall 6.32 6.32 6.75 244 181 199
† Mean annual data for 1971-2000 obtained from the Indiana State Climate Office (https://climate.agry.purdue.edu/climate/facts.asp)
‡ Mean annual data for the sampling period (December 2009 through May 2011) obtained from the National Oceanic and Atmospheric Association’s National Climatic Data Center (http://www.ncdc.noaa.gov/cdo-web/datasets/GHCND/stations/GHCND:USC00125407/detail) (http://www.ncdc.noaa.gov/cdo-web/datasets/GHCND/stations/GHCND:USC00123527/detail)
29
Mea
n da
ily s
oil t
empe
ratu
re (o C
)
0
5
10
15
20
25
30
WR soil temperatureLWD soil temperature
Date
Dec Jan Feb M
ar Apr M
ay Jun Jul Aug Sep Oct Nov Dec Jan Feb M
ar Apr M
ay Jun
Mea
n da
ily s
oil m
oist
ure
(m3 m
-3)
0.0
0.1
0.2
0.3
0.4
WR soil moistureLWD soil moisture
2010
2011
Fig. 5. Soil temperature and moisture (0-20 cm depth) at the study sites.
30
Fig. 6. Average daily flux of N2O, precipitation, soil moisture, and soil temperature at the LWD riparian buffer. Each data point is the mean of 10 measurements. Error bar represents standard deviation of the mean. The gap in soil moisture and temperature data is due to rodent damage to soil probe and loggers. Sensors were installed 20 cm below the surface near LWD chamber 2.
LWD
20102011
Dec Jan
Feb Mar
Apr May
Jun Jul
Aug Sep
Oct Nov
Dec Jan
Feb Mar
Apr May
Jun
Mea
n N
2O F
lux
(mg
N2O
-N m
-2 d
-1)
-1.0
-0.5
0.0
0.5
1.0
1.5
2.0
2.5
3.0
Soi
l Tem
pera
ture
(o C)
0
5
10
15
20
25
Soi
l Moi
stur
e C
onte
nt (m
3 m-3
)
0.10
0.15
0.20
0.25
0.30
0.35
Mean daily temperatureMean daily moisture
Pre
cipi
tatio
n (m
m) 0
102030405060
31
Temporal variability of N2O emissions
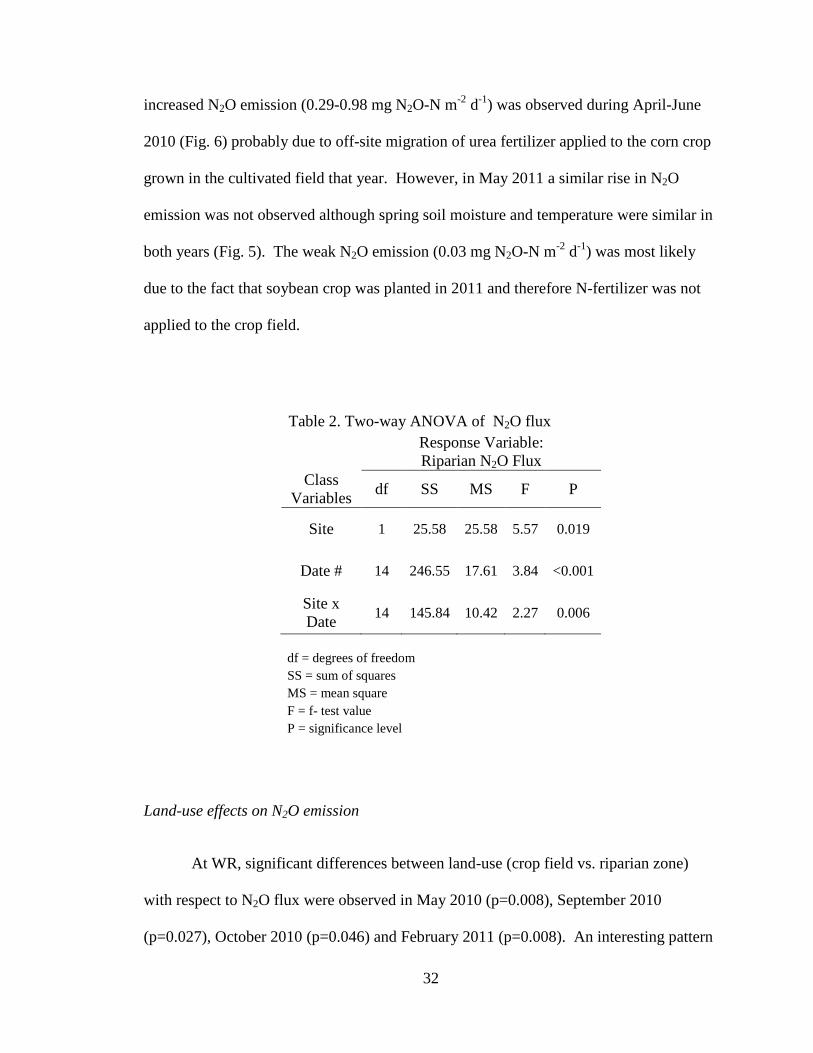
Nitrous oxide emissions were temporally variable regardless of site and land use
(Figs. 3 and 6). Seasonal variability was most pronounced during the wettest period of
the year (mid to late spring). At both riparian sites, seasonal peaks of N2O emission were
highest during periods of increased precipitation and increased soil moisture (coefficient
of variation: ~150 % in July 2010, Figs. 3 and 6). These periods of increased N2O flux
often corresponded to seasonal peaks in soil temperature. These combinations of factors
contributed to the statistical significance of sampling dates shown by ANOVA (Table 2).
Seasonal variation in N2O flux at the WR riparian site reflected to a large extent
the temporal pattern observed at LWD, but there were some important differences. The
highest (mean: 6.26 mg N2O-N m-2 d-1) and the most variable N2O flux (coefficient of
variation: 250%) at the WR riparian site was recorded in spring/summer 2010 (Fig. 3).
This peak flux also corresponded with a period of prolonged precipitation, and increased
soil moisture and soil temperature (Fig. 3). This riparian area was flooded for several
days with flood water levels ~2.5 m above ground during and following maximum White
River discharge (Fig. 4). The gap in soil temperature and moisture data (May-July 2010)
was due to flood-related damage to the sensors; hand samples were taken during
sampling events to compensate for loss of sensor data. Another, but smaller, peak of N2O
emission was observed at WR during the spring-thaw event of February 2011 (mean flux:
2.63 mg N2O-N m-2 d-1). Soil moisture increased abruptly due to the melting of snow/ice
when soil temperatures increased to above 5 ◦C.
In addition to weather-related factors, farming activities may have indirectly
affected N2O emission in riparian buffers. At the LWD riparian buffer, a period of
32
increased N2O emission (0.29-0.98 mg N2O-N m-2 d-1) was observed during April-June
2010 (Fig. 6) probably due to off-site migration of urea fertilizer applied to the corn crop
grown in the cultivated field that year. However, in May 2011 a similar rise in N2O
emission was not observed although spring soil moisture and temperature were similar in
both years (Fig. 5). The weak N2O emission (0.03 mg N2O-N m-2 d-1) was most likely
due to the fact that soybean crop was planted in 2011 and therefore N-fertilizer was not
applied to the crop field.
Table 2. Two-way ANOVA of N2O flux
Response Variable: Riparian N2O Flux
Class Variables df SS MS F P
Site 1 25.58 25.58 5.57 0.019
Date # 14 246.55 17.61 3.84 <0.001
Site x Date 14 145.84 10.42 2.27 0.006
df = degrees of freedom SS = sum of squares MS = mean square F = f- test value P = significance level
Land-use effects on N2O emission
At WR, significant differences between land-use (crop field vs. riparian zone)
with respect to N2O flux were observed in May 2010 (p=0.008), September 2010
(p=0.027), October 2010 (p=0.046) and February 2011 (p=0.008). An interesting pattern
33
was observed from May to July 2010. After an early May 2010 urea fertilizer application
to the crop field, measured N2O emission was significantly larger in the crop field (10.63
mg N2O-N m-2 d-1) than the adjacent riparian zone (0.48 mg N2O-N m-2 d-1; Fig. 3). This
pattern was reversed at the next sampling occasion in July 2010 after two weeks of
sustained flooding during which the riparian zone was inaccessible for sampling due to
high flood waters. Although a statistically significant effect of land-use was not detected
due to numerous outliers, N2O flux was noticeably more intense in the riparian zone than
within the crop field (Fig. 7). Another significant difference in land-use was observed
during the February 2011 spring-thaw during which mean flux was significantly higher in
the riparian zone (2.63 mg N2O-N m-2 d-1) than in the crop field (0.24 mg N2O-N m-2 d-1).
In contrast, LWD displays a much different behavior in N2O fluxes between
riparian zone and crop field. Overall, the crop field at LWD was a stronger N2O emitter
than either LWD or WR riparian zones (Table 3). Crop field N2O fluxes were
significantly higher than riparian fluxes in May 2010 (p=0.013), February 2011
(p=0.006), April 2011 (p=0.006) and May 2011 (p=0.014). The largest N2O fluxes from
the crop field occurred in February 2011 at the first true thaw of the spring at which point
surface soil temperatures began to rise above freezing (Fig. 6). During this February
2011 thaw, the LWD crop field exhibited a significantly higher N2O emission than the
riparian buffer (Fig. 8). This trend was the opposite of what was observed at WR with
much greater emission from the forested buffer than from the crop field (Fig. 7). This
opposing behavior was also apparent in the June/July 2010 sampling occasion during
which crop field emission exceeded riparian buffer emission at LWD whereas at WR the
forested riparian buffer was a stronger N2O emitter than the crop field during that
34
sampling period (Figs. 4 and 6). The other large N2O fluxes were associated with
increased soil moisture and temperature in late spring and early summer after N-fertilizer
application (Fig. 6).
Cumulative N2O emission from the crop fields averaged 6.37 and 7.82 kg N2O-N
ha-1 at LWD and WR, respectively. This annual emission corresponds to 5-6.4 % of the
N fertilizer applied. Cumulative N2O emission (Table 3) from the WR riparian forest
(4.32 kg N2O-N ha-1) was significantly higher than emission from the LWD buffer (1.03
kg N2O-N ha-1). At the WR site, the amount of N2O emitted from the riparian buffer
during the late spring/early summer flooding of 2010 (mean flux: 6.24 mg N2O-N m-2 d-1;
overall emission: 2.29 kg N2O-N ha-1) accounted for 51% of the total N2O emitted during
the 2-year study.
35
Fig. 7. Nitrous oxide emission from adjacent cropped field (corn) and forested riparian areas at the White River site. Error bar represent standard deviation of the mean (n = 13). Adjacent bars labeled with different letters denote statistically significant difference at P < 0.005.
Mea
n N 2
O Fl
ux (m
g N 2
O-N
m-2
d-1
)
0
5
10
15
20 Crop fieldRiparian zone
1/21/10
3/4/105/20/10
7/1/107/29/10
8/30/10
9/12/10
10/29/10
11/19/10
12/17/10
2/16/11
3/24/11
4/12/11
a
b a ba
b a
b
WR
36
Table 3. Average and cumulative N2O emission by land-use at the study sites. Values are means ± standard deviation
Riparian zone Crop Field
Units WR LWD WR LWD
Mean N2O flux
mg N2O-N m-2 d-1 2.03 ± 0.64* 0.43 ± 0.17 1.40 ± 1.17 1.67 ± 0.54
Cumulative N2O†
kg N2O-N ha-1 4.32 ± 3.85 1.03 ± 0.93 7.82 ± 7.18 6.37 ± 1.85
†Cumulative amount between December
37
Fig. 8. Nitrous oxide emission from adjacent cropped field (corn) and grassed riparian areas at the Leary Weber Ditch site. Error bar represent standard deviation of the mean (n = 11). Adjacent bars labeled with different letters denote statistically significant difference at P < 0.005.
Mea
n N 2
O Fl
ux (m
g N 2
O-N
m-2
d-1
)
0
2
4
6
8
10Crop fieldRiparian zone
LWD
5/28/10
6/28/10
8/6/108/25/10
9/22/10
10/28/10
11/17/10
2/18/11
3/29/10
4/21/11
5/11/11
a
b
a
b
a
b
a
ba b
38
Relationships between soil properties and N2O emission
Analysis of variance showed significant effect of land use and site for several of
the soil properties considered in the study (Table 4). Although the sites were located in
geomorphologically-distinct landscapes (glacial till plains for LWD and glacial outwash
for WR), no significant difference in soil texture was found (Tables 4 and 5). While
significant effect of land-use was found for several variables, these trends generally
varied with site (as indicated by several significant site by land-use interactions, Table 5).
The water-extractable DOC data may serve as a good illustration of that trend. While at
the WR site the amount of extractable DOC was similar regardless of land use, at LWD
nearly twice as much DOC was extracted from the grassy riparian buffer than from the
cropland (Table 4). Regardless of study site, net nitrification was higher and C:N ratios
lower in the crop field than in the riparian buffers. Conversely, SOC, total soil N, MBC
and DEA were several-fold higher in the riparian zone compared to the crop field (Table
4). Contrary to expectations, higher values of these soil parameters did not translate into
higher N2O emission from the riparian buffers. During the study period, mean N2O
emission was 1.8-6 times higher in the cultivated fields than in the riparian areas. While
cumulative mean N2O emission was similar at the two cultivated sites, WR showed a
much higher deviation around the mean emission compared to LWD. The riparian buffer
emission also varied between sites, being 4 times higher at the WR compared to the LWD
site (Table 3); however a significant site by land-use effect was not detected (Table 5).
This unexpected insignificance has been attributed to high emission peaks during
flooding being deemed as outliers and therefore do not occur frequently enough in the
sample data to reflect overall site by land-use effects.
39
Table 4. Physical and biochemical properties of soils at the study sites in relation to land-use.
WR LWD
Soil property Units Riparian
zone Crop field
Riparian zone
Crop field
pH unitless 7.33 ± 0.09† 7.44 ± 0.07 6.90 ± 0.50 6.59 ± 0.16
Bulk density g cm-3 1.17±0.14 1.43±0.08 1.10 ± 0.14 1.34 ± 0.04
Sand % 39.09 ± 5.7 47.19 ± 6.0 41.94 ± 4.4 42.01 ± 1.64
Silt % 28.32 ± 5.7 23.32 ± 2.0 23.91 ± 4.4 25.87 ± 1.6
Clay % 32.58 ± 6.2 29.48 ± 4.3 34.14 ± 3.7 32.11 ± 3.2
DOC‡ mg C kg-1 soil 15.79 ± 2.8 18.38 ± 4.2 25.67 ± 6.0 13.35 ± 2.4
Total carbon % 3.67 ± 0.24 2.87 ± 0.31 4.12 ± 0.55 1.76 ± 0.37
C:N ratio unitless 16.42 ± 1.29 14.80 ± 1.40 15.13 ± 2.11 8.98 ± 1.91
MBC g C kg-1 soil 0.415 ± 0.08 0.325 ± 0.14 0.496 ± 0.72 0.165 ± 0.24
DEA mg N2O-N kg-1 soil d-1
1.83 ± 1.1 0.403 ± 0.20 1.95 ± 1.0 0.328 ± 0.22
Net Nitrification
mg NO3-N kg-1 soil d-1
0.088 ± 0.12 0.124 ± 0.13 0.016 ± 0.02 0.059 ± 0.04
†Mean value ± standard deviation; n=10 for WR and LWD in riparian zones, n=5 for WR and n=4 for LWD in crop fields
DOC = dissolved or water-extractable organic carbon MBC = microbial biomass carbon DEA = denitrification enzyme activity
40
* sy
mbo
lizes
the
leve
l of s
igni
fican
ce (N
S= n
ot si
gnifi
cant
) fou
nd b
y an
alys
is o
f var
ianc
e w
here
* =
p<0
.05,
*
* =
p<0.
01 a
nd *
** =
p<0
.001
.
41
While ANOVA revealed significant effects of site and land-use with respect to
several soil properties, regression analysis showed that net N mineralization was the only
soil property that significantly correlated with N2O flux (Table 6 and Fig. 9). When
regression analysis was conducted for each site separately much stronger correlations of
MBC, DEA, SOC, C:N, and net N mineralization with N2O flux were observed at LWD
(Fig. 10). However, net N mineralization remained the only soil property significantly
correlated with N2O flux at the WR site (Fig. 11). Since MBC, DEA, SOC, C:N, and net
N mineralization are indicators of N-cycling in soils, weak and insignificant correlations
with N2O flux were somewhat surprising.
Regression analysis was conducted to evaluate possible linkages between daily
fluxes of N2O and antecedent soil moisture and temperature (mean for the previous five
days before a N2O sampling occasion). While no trend was observed at WR (Fig. 12),
data from the LWD site yielded a marginal (yet significant) correlation between soil
temperature and N2O flux (Fig. 13). Results of the correlation analysis (r2 and
significance level) between soil properties and N2O flux at the study sites are reported in
Table 7.
Links between 5-day antecedent water table depths and N2O fluxes were
examined, but the regression analysis yielded mixed results. At LWD, water table depth
marginally but significantly correlated with mean N2O flux (Fig. 14). However, at WR
no such trend was observed (Fig. 15). Thus, relationships between water table depth and
N2O flux can be complex and site-dependent.
42
Table 6. Regression analysis of soil properties and N2O flux at the study sites
Soil property Coefficient of determination
(R2) P-value
pH 0.0004 0.915
MBC 0.24 0.007
DEA 0.047 0.256
Net nitrification 0.615 <0.001
Total Carbon 0.330 0.001
C:N 0.127 0.570
DOC 0.125 0.060
Sand 0.001 0.865
Silt 0.002 0.836
Clay 0.007 0.672
Bulk density 0.093 0.107
43
Fig. 9. Relationship between net N mineralization and mean N2O fluxes at the study sites.
0.0 0.5 1.0 1.5 2.0 2.5 3.0 3.5
Net N
itrific
ation
(m
g NO
3-N
kg-1
soil d
-1)
0.0
0.1
0.2
0.3
r2= 0.615p=<0.001
Mean Daily N2O Flux (mg N2O-N m-2 d-1)
44
Fig. 10. Relationships between soil properties and N2O flux at the LWD site.
C:N
ratio
6
8
10
12
14
16
18
20
r2 = 0.780p < 0.001
LWD
MB
C (m
g C
kg-1
soi
l)
0
200
400
600
800
1000
1200
1400
1600
r2 = 0.581p = 0.290
DE
A (m
g N
2O-N
kg-1
soi
l d-1
)
0
50
100
150 r2 = 0.571p = 0.033
0.0 0.5 1.0 1.5 2.0 2.5 3.0
Tota
l car
bon
(%)
1
2
3
4
5r2 = 0.884p < 0.001
DO
C (m
g C
kg-1
soi
l)
5
10
15
20
25
30
35r2 = 0.667p = 0.001
0.0 0.5 1.0 1.5 2.0 2.5 3.0
Net
nitr
ifica
tion
(mg
NO
3-N
kg-1
soi
l d-1
)
-0.02
0.00
0.02
0.04
0.06
0.08
0.10
0.12r2 = 0.617p = 0.019
45
Fig. 11. Relationship between net N mineralization and N2O flux at the WR site.
WR
Mean N2O flux (mg N2O-N m-2 d-1)
0.0 0.5 1.0 1.5 2.0 2.5 3.0 3.5
Net
nitr
ifica
tion
(mg
NO
3-N
kg-1
soi
l d-1
)
0.00
0.05
0.10
0.15
0.20
0.25
0.30
0.35
r2 = 0.917p< 0.001
46
Fig. 12. Relationships between surface (0-20 cm) soil temperature (top panel) and moisture (bottom panel) and N2O flux at the White River (WR) site.
WRM
ean
5-da
y an
tece
dent
so
il m
oist
ure
(o C)
0
5
10
15
20
25
r2 = 0.074p = 0.369
N2O flux (mg N2O-N m-2 d-1)
0 1 2 3 4 5 6 7
Mea
n 5-
day
ante
cede
nt
soil
moi
stur
e (m
3 m
-3)
0.0
0.1
0.2
0.3
0.4
r2 = 0.182p = 0.146
47
Fig. 13. Relationships between surface (0-20 cm) soil temperature (top panel) and moisture (bottom panel) and N2O flux at the Leary Weber Ditch (LWD) site.
LWDM
ean
5-da
y an
tece
dent
so
il te
mpe
ratu
re (o C
)
0
5
10
15
20
25
r2 = 0.269p = 0.048
Mean N2O flux (mg N
2O-N m
-2 d
-1)
-0.2 0.0 0.2 0.4 0.6 0.8 1.0 1.2
Mea
n 5-
day
ante
cede
nt
soil
moi
stur
e (m
3 m-3
)
0.10
0.15
0.20
0.25
0.30r2 = 0.015p = 0.658
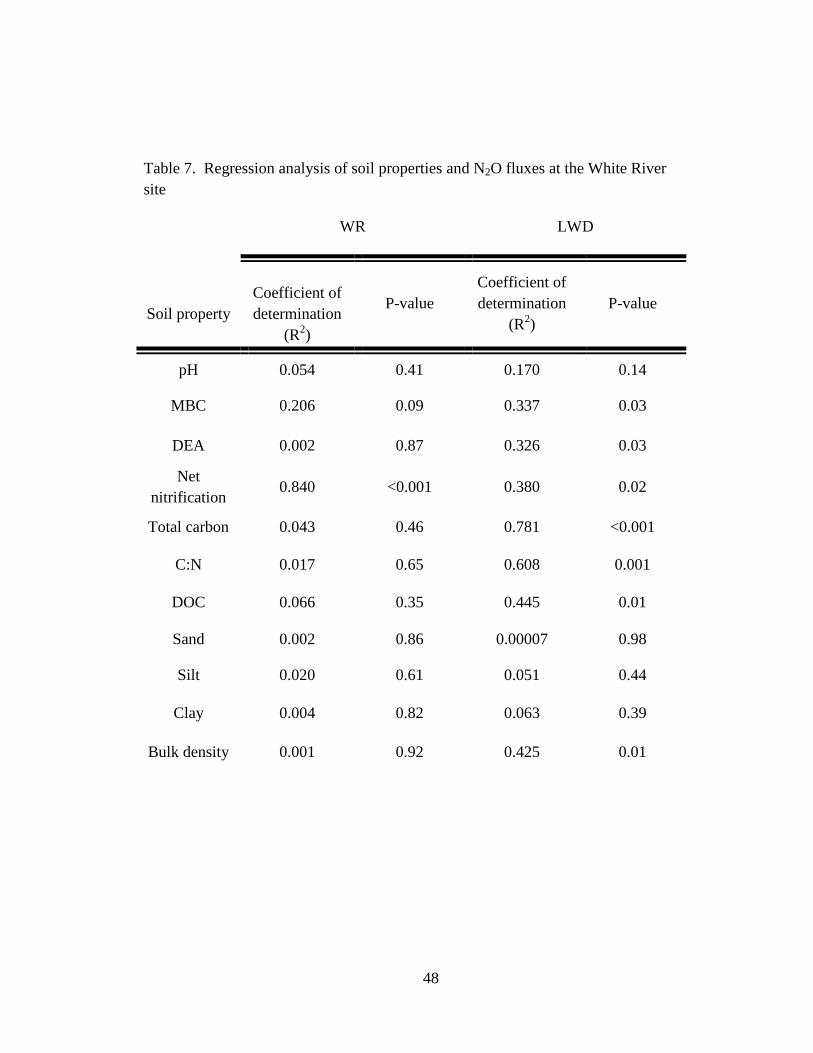
48
Table 7. Regression analysis of soil properties and N2O fluxes at the White River site
Soil property
WR LWD
Coefficient of determination
(R2)
P-value Coefficient of determination
(R2) P-value
pH 0.054 0.41 0.170 0.14
MBC 0.206 0.09 0.337 0.03
DEA 0.002 0.87 0.326 0.03
Net nitrification
0.840 <0.001 0.380 0.02
Total carbon 0.043 0.46 0.781 <0.001
C:N 0.017 0.65 0.608 0.001
DOC 0.066 0.35 0.445 0.01
Sand 0.002 0.86 0.00007 0.98
Silt 0.020 0.61 0.051 0.44
Clay 0.004 0.82 0.063 0.39
Bulk density 0.001 0.92 0.425 0.01
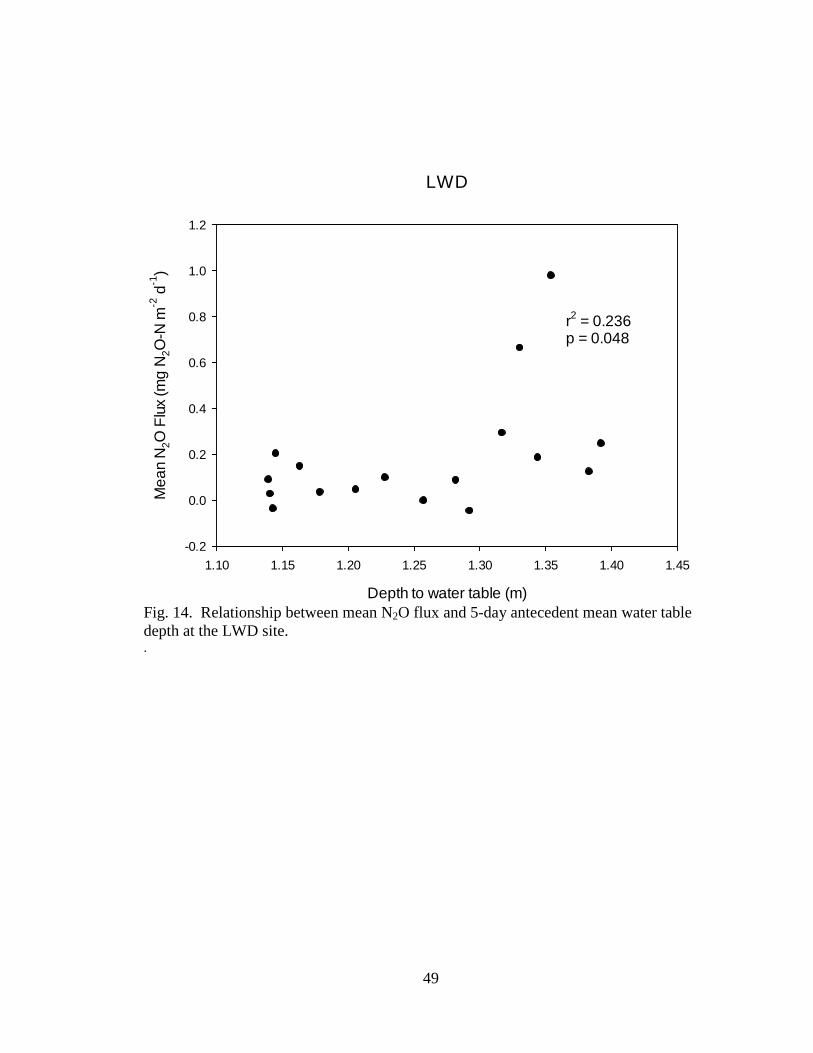
49
Fig. 14. Relationship between mean N2O flux and 5-day antecedent mean water table depth at the LWD site. .
LWD
Depth to water table (m)
1.10 1.15 1.20 1.25 1.30 1.35 1.40 1.45
Mea
n N
2O F
lux
(mg
N2O
-N m
-2 d
-1)
-0.2
0.0
0.2
0.4
0.6
0.8
1.0
1.2
r2 = 0.236p = 0.048
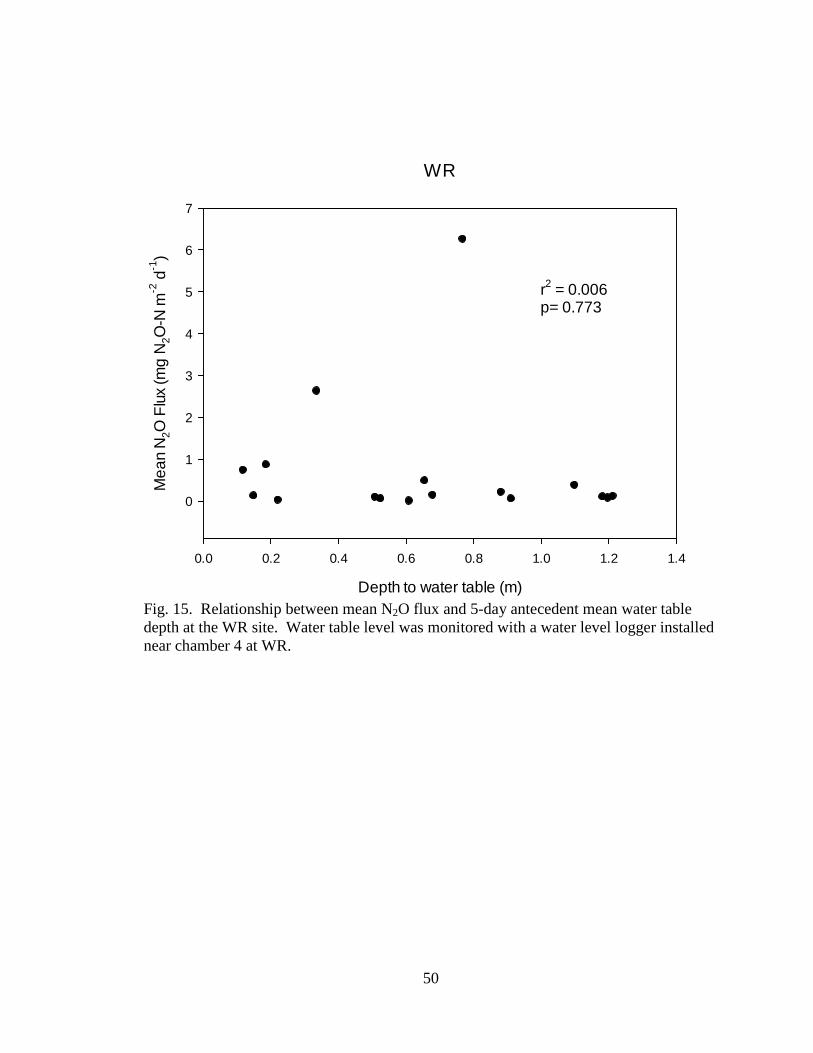
50
Fig. 15. Relationship between mean N2O flux and 5-day antecedent mean water table depth at the WR site. Water table level was monitored with a water level logger installed near chamber 4 at WR.
WR
Depth to water table (m)
0.0 0.2 0.4 0.6 0.8 1.0 1.2 1.4
Mea
n N
2O F
lux
(mg
N2O
-N m
-2 d
-1)
0
1
2
3
4
5
6
7
r2 = 0.006p= 0.773
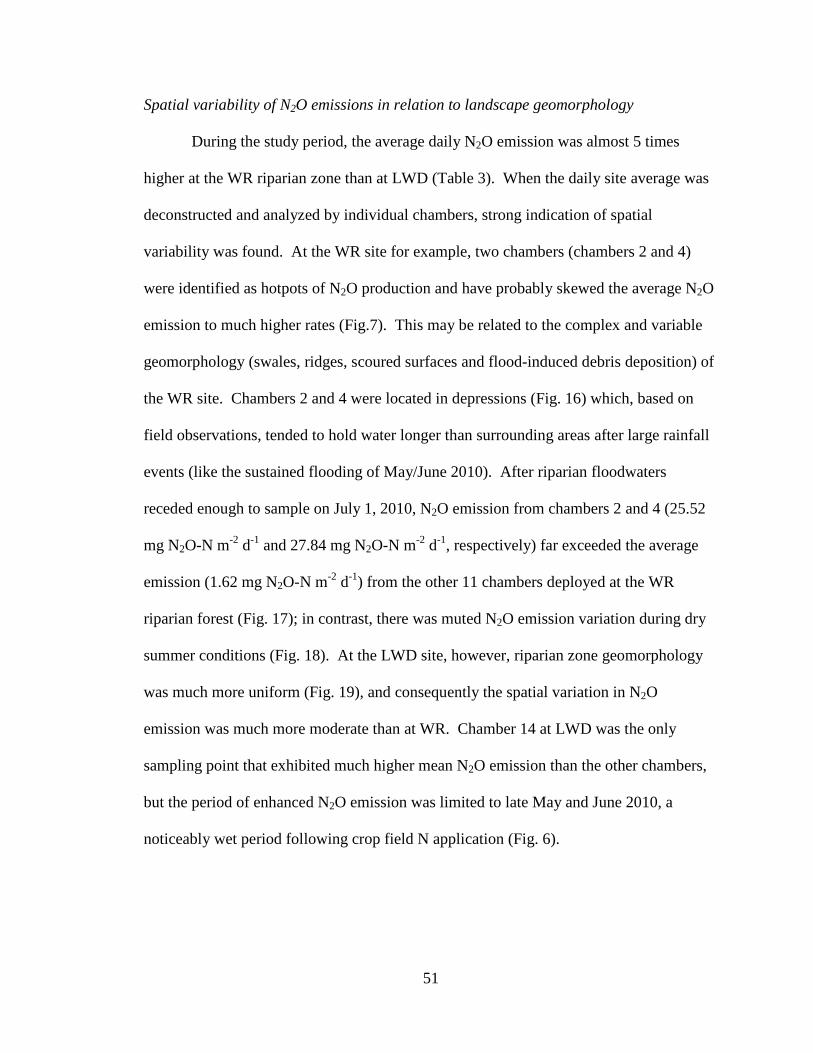
51
Spatial variability of N2O emissions in relation to landscape geomorphology
During the study period, the average daily N2O emission was almost 5 times
higher at the WR riparian zone than at LWD (Table 3). When the daily site average was
deconstructed and analyzed by individual chambers, strong indication of spatial
variability was found. At the WR site for example, two chambers (chambers 2 and 4)
were identified as hotpots of N2O production and have probably skewed the average N2O
emission to much higher rates (Fig.7). This may be related to the complex and variable
geomorphology (swales, ridges, scoured surfaces and flood-induced debris deposition) of
the WR site. Chambers 2 and 4 were located in depressions (Fig. 16) which, based on
field observations, tended to hold water longer than surrounding areas after large rainfall
events (like the sustained flooding of May/June 2010). After riparian floodwaters
receded enough to sample on July 1, 2010, N2O emission from chambers 2 and 4 (25.52
mg N2O-N m-2 d-1 and 27.84 mg N2O-N m-2 d-1, respectively) far exceeded the average
emission (1.62 mg N2O-N m-2 d-1) from the other 11 chambers deployed at the WR
riparian forest (Fig. 17); in contrast, there was muted N2O emission variation during dry
summer conditions (Fig. 18). At the LWD site, however, riparian zone geomorphology
was much more uniform (Fig. 19), and consequently the spatial variation in N2O
emission was much more moderate than at WR. Chamber 14 at LWD was the only
sampling point that exhibited much higher mean N2O emission than the other chambers,
but the period of enhanced N2O emission was limited to late May and June 2010, a
noticeably wet period following crop field N application (Fig. 6).
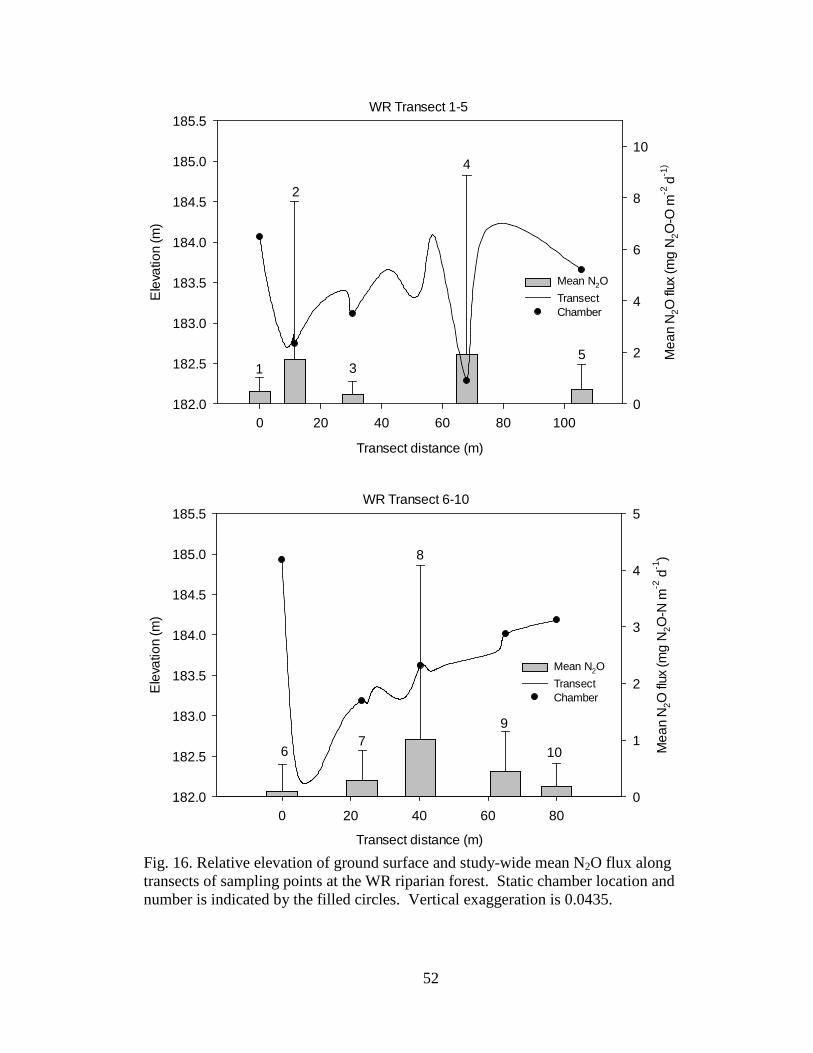
52
WR Transect 6-10
Transect distance (m)
0 20 40 60 80
Mea
n N
2O fl
ux (m
g N
2O-N
m-2
d-1
)
0
1
2
3
4
5
Ele
vatio
n (m
)
182.0
182.5
183.0
183.5
184.0
184.5
185.0
185.5
Mean N2O TransectChamber
WR Transect 1-5
Transect distance (m)
0 20 40 60 80 100
Mea
n N
2O fl
ux (m
g N
2O-O
m-2
d-1)
0
2
4
6
8
10E
leva
tion
(m)
182.0
182.5
183.0
183.5
184.0
184.5
185.0
185.5
Mean N2O TransectChamber
1
2
3
4
5
67
8
9
10
Fig. 16. Relative elevation of ground surface and study-wide mean N2O flux along transects of sampling points at the WR riparian forest. Static chamber location and number is indicated by the filled circles. Vertical exaggeration is 0.0435.
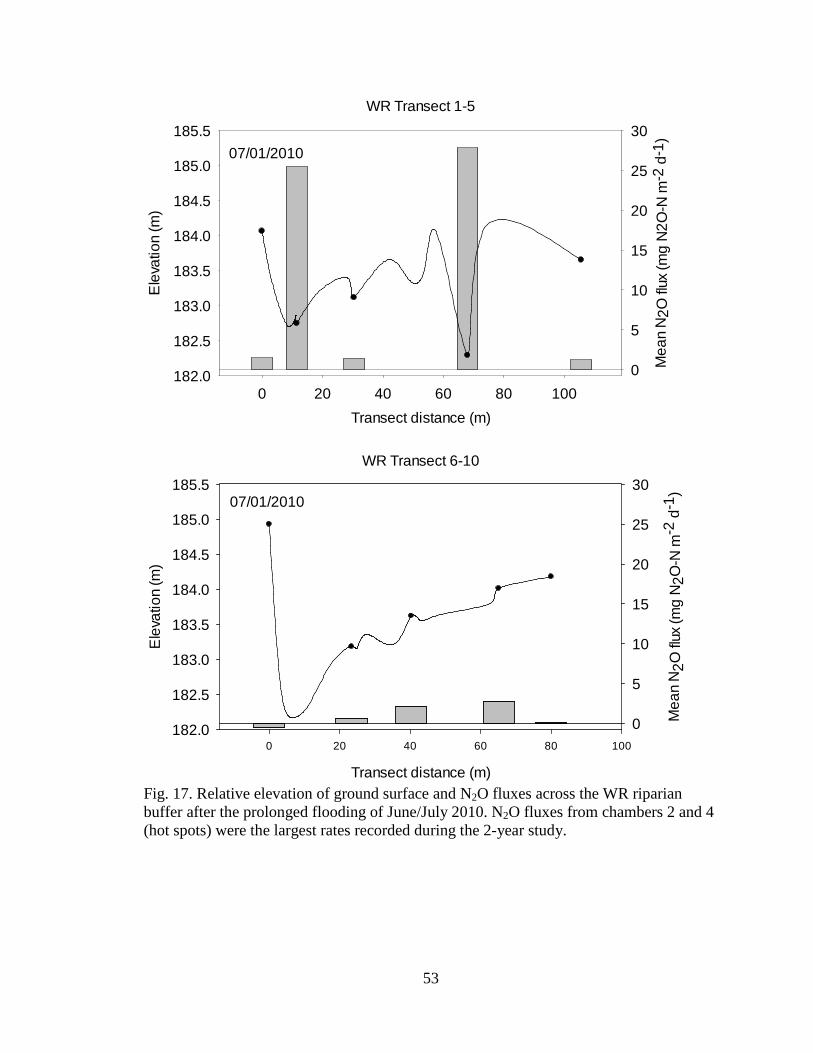
53
WR Transect 1-5
Transect distance (m)0 20 40 60 80 100
Mea
n N
2O fl
ux (m
g N
2O-N
m-2
d-1
)
0
5
10
15
20
25
30E
leva
tion
(m)
182.0
182.5
183.0
183.5
184.0
184.5
185.0
185.5
WR Transect 6-10
Transect distance (m)
0 20 40 60 80 100
Mea
n N
2O fl
ux (m
g N
2O-N
m-2
d-1
)
0
5
10
15
20
25
30
Ele
vatio
n (m
)
182.0
182.5
183.0
183.5
184.0
184.5
185.0
185.507/01/2010
07/01/2010
Fig. 17. Relative elevation of ground surface and N2O fluxes across the WR riparian buffer after the prolonged flooding of June/July 2010. N2O fluxes from chambers 2 and 4 (hot spots) were the largest rates recorded during the 2-year study.
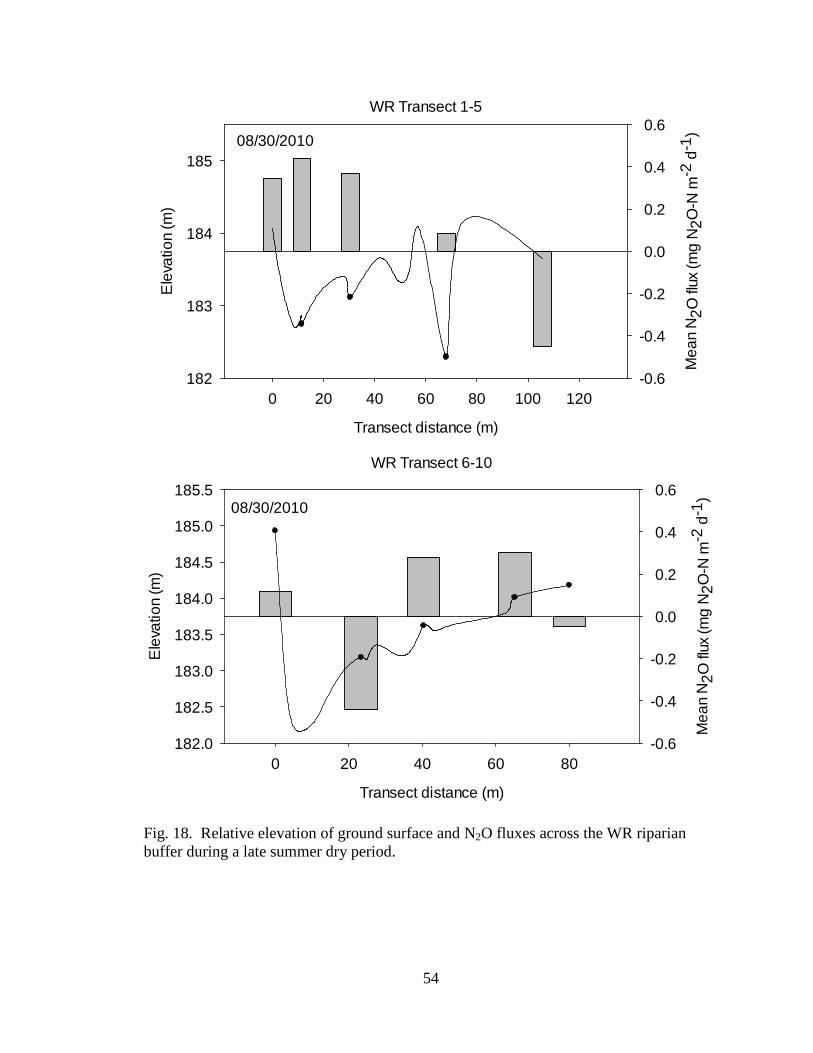
54
WR Transect 1-5
Transect distance (m)
0 20 40 60 80 100 120
Ele
vatio
n (m
)
182
183
184
185
Mea
n N
2O fl
ux (m
g N
2O-N
m-2
d-1
)
-0.6
-0.4
-0.2
0.0
0.2
0.4
0.6
WR Transect 6-10
Transect distance (m)
0 20 40 60 80
Mea
n N
2O fl
ux (m
g N
2O-N
m-2
d-1
)
-0.6
-0.4
-0.2
0.0
0.2
0.4
0.6
Ele
vatio
n (m
)
182.0
182.5
183.0
183.5
184.0
184.5
185.0
185.508/30/2010
08/30/2010
Fig. 18. Relative elevation of ground surface and N2O fluxes across the WR riparian buffer during a late summer dry period.
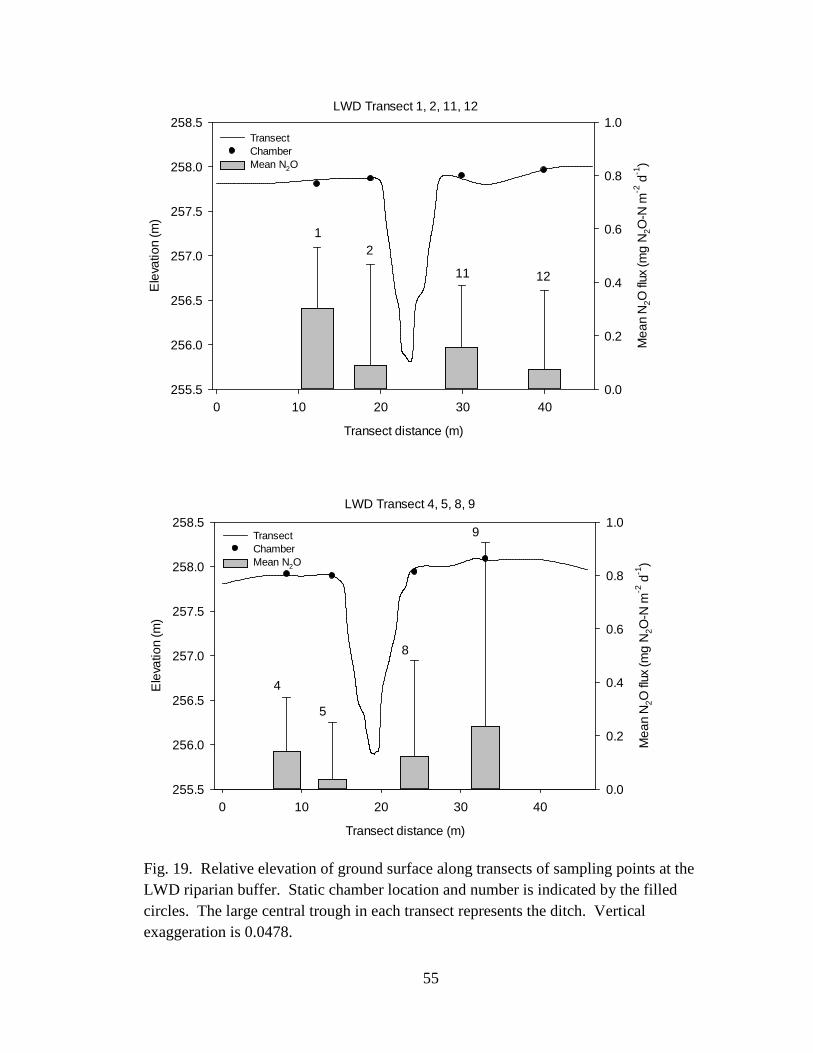
55
LWD Transect 1, 2, 11, 12
Transect distance (m)
0 10 20 30 40
Ele
vatio
n (m
)
255.5
256.0
256.5
257.0
257.5
258.0
258.5
Mea
n N
2O fl
ux (m
g N
2O-N
m-2
d-1
)
0.0
0.2
0.4
0.6
0.8
1.0TransectChamberMean N2O
LWD Transect 4, 5, 8, 9
Transect distance (m)
0 10 20 30 40
Ele
vatio
n (m
)
255.5
256.0
256.5
257.0
257.5
258.0
258.5
Mea
n N
2O fl
ux (m
g N
2O-N
m-2
d-1
)
0.0
0.2
0.4
0.6
0.8
1.0TransectChamberMean N2O
12
11 12
4
5
8
9
Fig. 19. Relative elevation of ground surface along transects of sampling points at the LWD riparian buffer. Static chamber location and number is indicated by the filled circles. The large central trough in each transect represents the ditch. Vertical exaggeration is 0.0478.
56
DISCUSSION
Riparian landscapes are characterized by dynamic water tables and, depending on
landscape features, are periodically affected by flood events. In the US Midwest, riparian
ecosystems can potentially receive significant amounts of mineral N from surrounding
crop fields, and thus could be strong sources of N2O in agricultural watersheds. This
study, conducted in the White River watershed in Indiana, was initiated with the
expectation that soil conditions would be more favorable to denitrification, and
consequently N2O fluxes would be larger in riparian buffers than in adjacent agricultural
fields. The study also aimed to identify the factors controlling N2O emission in these
ecosystems. Results showed significant interactions between land-use (riparian buffer vs.
crop field), geomorphology and climatic events on N2O emission.
Land-use effects on N2O emissions
To be considered a threat to air quality despite their water quality values, riparian
buffers would have to exhibit significantly greater N2O emission intensity in comparison
to adjacent crop fields. Previous studies have reported mean daily N2O emission from
riparian zones ranging between -0.85 to 11.56 mg N2O-N m-2 d-1 across various types of
land-use and landscapes (Hefting et al., 2003; Dhondt et al., 2004; Kim et al., 2009;
Jacinthe et al., 2012). Mean riparian N2O fluxes measured in this study ranged between
0.002 and 6.26 mg N2O-N m-2 d-1 at WR, and from -0.04 and 0.98 mg N2O-N m-2 d-1 at
LWD (Table 3). In the adjacent crop fields, N2O fluxes ranged from -0.004 to 10.63 mg
N2O-N m-2 d-1 at WR and -0.42 to 7.26 mg N2O-N m-2 d-1 at LWD. These values are not
atypical of what has been previously reported (range: 0.40 - 4.60 mg N2O-N m-2 d-1) for
57
corn, soybean and wheat fields (Ambus and Christensen, 1995; Hernandez-Ramirez et
al., 2009; Kim et al., 2009). This comparison indicates that, at WR, the riparian zone has
the potential to emit N2O at the same level as cultivated fields. Because frequently-
flooded and chronically nitrate-loaded riparian areas similar to the WR buffers can emit
N2O at a level similar to adjacent croplands, one may justifiably be concerned about the
air quality impact of riparian buffers as these buffers continue to be restored and installed
next to streams and rivers. That would not be the case, however, for riparian buffers
similar to the one investigated at LWD.
This study showed that, on average, the crop fields were higher emitters of N2O
than the riparian buffers (Table 4); however, the WR riparian buffer exhibited
significantly higher N2O emissions than the adjacent crop field after flooding events (Fig.
3). Kim et al. (2009) reported similar results in a comparison of cropland and riparian
sites in Iowa. This is a surprising result given that soil properties (SOC, DOC, microbial
biomass and denitrification potential) known to be favorable to N2O production were
higher in the riparian soils. Greater N2O emission from the cultivated field at LWD was
likely the result of high N availability due to mineral N-fertilizer application as indicated
by the N2O emission peak observed following spring N-fertilization in preparation for the
corn crop. This observation is in accord with several past studies (Ambus and
Christensen, 1995; Jacinthe and Dick, 1997; Skiba and Smith, 1999; Hernandez-Ramirez
et al., 2009) that have reported enhancements in N2O emission following N fertilizer
application to corn. Studies have also shown that up to 80 % of the annual N2O emission
can occur during that short time period (Jacinthe and Dick, 1997; Dunesbury et al. 2008;
58
Hernandez-Ramirez et al., 2009). In the present study, 51% of annual emission occurred
within the weeks immediately following N application.
In this study, spring fertilizer application may have also indirectly affected N2O
production in the riparian buffers. The data collected at the WR site in spring/summer
2010 support that interpretation. The timing of N2O peak at the WR riparian buffers
relative to that in the crop field suggests a possible downslope migration of fertilizer-N
from the crop field to the riparian buffer. Following N application, N2O emission was
nearly 25 times higher in the crop field than in the riparian buffer on May 20, 2010 (Fig.
5). However, a few weeks later (July 1, 2010; Fig. 5), and during which the riparian
buffer experienced extensive flooding (Fig. 5), a reversal in N2O emission intensity by
land-use was observed. On that sampling occasion, N2O emission was 3 times higher in
the riparian buffer than in the crop field. This temporal trend was likely due to the export
of mineral N, either via runoff or subsurface leaching, from the crop field into the
riparian zone. It should be noted that, besides the adjacent crop field, increased mineral
N-availability in the riparian buffer during that period may have also been associated
with the deposition of nutrients by flood waters from the White River.
Seasonal variability of N2O emission
In this study, strong seasonality in N2O emission was noted under both types of
land-use. In the riparian buffers, seasonal variation in emission was driven by flood
events and wet soil conditions. In the cultivated fields, the data suggest a marked effect
of freeze-thaw phenomena. The effect of soil moisture on N2O emission from riparian
zone has been reported in previous studies (Dhondt et al., 2004; Ambus, 1998; Wagner-
59
Riddle et al., 1996; McLain and Martens, 2006; Kim et al., 2009; Jacinthe et al. 2012). In
general, N2O emission was much lower in semi-arid Arizona riparian buffer (0.1 to 1.21
mg N2O-N m-2 d-1; McLain and Martens, 2006) than reported in recent studies from the
Midwest (Kim et al., 2009; Jacinthe et al., 2012) reflecting the effect of precipitation.
These studies suggest that the wet spring and summer months that are characteristic of
the US Midwest (humid continental climate) could yield higher N2O emissions from
riparian ecosystems. Jacinthe et al. (2012) found that frequently-flooded riparian zones
in south-central Indiana emitted significantly higher amounts of N2O than buffers that are
occasionally-flooded. Post-flood emission up to 81 mg N2O-N m-2 d-1 was reported
(Jacinthe et al., 2012)-a level of emission three times the highest N2O peak measured at
WR after 3 weeks of sustained flooding. Since the floods investigated were short-lived
and soils at their study sites were well-drained, these authors (Jacinthe et al., 2012)
speculated that these conditions favor the onset of denitrification (short residence time of
N2O in coarse-textured soil) but not the conversion of N2O to N2. As a result, N2O
emission was extremely enhanced. This line of reasoning would suggest that N2O
emission will progressively decrease with longer flood duration. It is also consistent with
the relatively lower post-flood N2O emission observed in the present study. Thus, the
true N2O emission peaks associated with the spring 2010 flood event may have been
missed.
Nitrous oxide emission peaks were also found to be significant at both LWD and
WR during spring-thaw. In Central Iowa riparian buffers, Kim et al. (2009) estimated that
freeze-thaw events contributed 70 % of annual emission (wet periods accounting for only
11% of annual N2O emission). During the February 2011 spring thaw at the WR site,

60
N2O emission from the riparian forest was more than 10 times higher than in the adjacent
crop field (Fig. 6). On that sampling date, it was observed that soil in the cultivated field
was still frozen (at least 3 cm below surface) while the riparian soil was completely
thawed. The earlier thaw of the riparian forest may be due to ground insulation by dead
plant residues preventing substantial soil freezing in the forested buffer (McKinney,
1929; Pikul et al., 1986). Ground insulation in the crop field is likely to be insignificant
due to crop residue incorporation during fall tillage. At the LWD site, however, N2O
emission induced by spring-thaw was detected, not in the riparian zone, but in the crop
field. It should be noted that, at LWD, the surface soil layer was completely thawed in
both the riparian zone and the crop field at the time of sampling (approximately 2.5 ºC;
Fig. 3). Therefore, the LWD sampling schedule may have only captured the tail end of
the freeze-thaw event. This seems likely because sampling at LWD occurred later than at
WR and the ground, therefore, may have had more time to thaw. Further, in contrast to
the WR site where the riparian forest shadow may have retarded soil thawing in the
cultivated field (northeast of forested buffer), the LWD site may have received more solar
radiation due to its orientation and the absence of a forest cover.
Vigorous N2O bursts during freeze-thaw cycles have been reported in previous
studies (Goodroad and Keeney, 1984; Cates and Keeney, 1987; Christensen and Teidje,
1990; Burton and Beauchamp, 1994; Jacinthe and Lal, 2003). Müller et al. (2002) found
that thawing contributed more than 70 % of the total annual N2O loss from grassland
soils in Germany. Kaiser et al. (1998) found that N2O peaks during freeze-thaw
accounted for 50 % of annual N2O emission from arable lands, and attributed these
results, not to rising soil temperatures, but to increased mineralization of the biomass of
61
microbes killed by sub-freezing temperatures. Furthermore, Wagner-Riddle et al. (2007)
found that, in general, soils that are not well insulated by snow and plant residues exhibits
higher N2O peaks during soil thaw. These past studies indicate that seasonal thaw events
can be hot moments of N2O emission in a variety of terrestrial ecosystems. However,
emission associated with these events may have not been fully captured by the bi-weekly
sampling schedule adopted in the present study. Future investigations should take note of
this limitation.
Effects of geomorphology and drainage on N2O emission
Because soil type and landscape attributes are different at the WR and LWD sites,
it was expected that these differences would be reflected in soil properties and N2O
fluxes. For the most part, biochemical soil properties showed differences due to land-use,
but limited effect of site on these parameters was detected (Table 4). The pattern and
magnitude of N2O flux at the study sites was found to be primarily dictated by landscape
variability and geomorphology at each site. Flooding frequency, as controlled by
landscape morphology and human modifications of stream channel, plays a dominant role
in determining the difference in N2O flux between the riparian buffers at WR and LWD.
As mentioned earlier, Jacinthe et al. (2012) reported a relationship between flood
frequency and N2O emission intensity - compared to rarely-flooded buffers, riparian
forests most susceptible to flooding were larger N2O emitters, both during flood and non-
flood periods. During the present study (2009-2011), the riparian zone at WR
experienced intense flooding (as high as 2-4 m above ground) during the spring and early
62
summer months. In contrast, water level at LWD always remained below bank full
during these times, and consequently this riparian buffer was not subject to flood events.
Furthermore, the present study also demonstrates an indirect effect of flooding on
N2O emission through increased heterogeneity of riparian landscapes. Located on the
inside bend of a meander of the White River, the WR riparian landscape has been
sculpted by the migrating river. The riparian landscape is characterized by a series of
ridges and swales. Depressions (swales) within the site tended to be associated with the
highest N2O emission rates measured during the study (Fig. 12). Vilain et al. (2010)
investigated the effect of slope position on N2O emission, and found that toe-slope
positions produced 4-5 times more N2O annually than side-slope. This trend was linked,
not to the availability of substrates, but primarily to increased water-filled pore space
(Vilain et al., 2010). Ambus and Christensen (1995) also observed higher N2O emission
from low-lying areas than from upper landscape positions. It was evident in this study
that the depressions were N2O emission hotspots during floods and may have skewed the
overall mean riparian N2O fluxes at WR (Fig. 15). Because the LWD riparian buffer was
not affected by flooding and the landscape was fairly uniform, this help explained the
substantially lower (4-5 times lower) riparian emission at LWD compared to WR.
Besides a lack of topographical heterogeneity, the LWD site is located in a tile-
drained landscape. Although nitrate export from croplands may be substantial (David et
al., 1997), most of this nitrate is probably transported through underground tile drains and
may completely bypass the riparian buffer on its way to drainage ditches (Vought et al.,
1994). Thus, in tile-drained riparian buffers such as LWD, lower N2O emission can be
63
attributed to low mineral N availability and limited interaction of NO3-containing water
with the riparian buffer due to tile drainage.
Implications of the study
This study attempted to identify the environmental, soil and landscape
characteristics that drive field-scale N2O emissions in riparian zones. Results have
elucidated the effects of season and geomorphology on N2O emission from riparian zones
in agricultural landscapes. In the literature, N2O fluxes are reportedly controlled
primarily by soil moisture, nitrate availability and soil temperature (Skiba et al., 1998;
Van Cleemput, 1998; Heincke and Kaupenjohann, 1999). While these factors are widely
accepted as controlling variables of denitrification, it remains difficult to understand how
these factors combine in the environment and how these combinations translate into
variable N2O emission intensity (Hefting et al., 2003). Further, because of the
differences in physical characteristics between the riparian zones investigated, it is also
unclear as to which factor is the most important controller of N2O emission. While
several factors may have played a role, the study results suggest a clear effect of season
within this hierarchy of factors controlling N2O emission.
Results of the study have also identified hydrogeomorphology as a determining
driver of the magnitude and variability of N2O emission from these buffers. Biological
and chemical soil properties played weaker supporting roles. Since hydro-
geomorphological characteristics (flooding, drainage, topography and soil types) are
accessible in public databases (U.S. Geological Survey, USDA Natural Resource
Conservation Service, USDA Soil Conservation Service), an implication of this research
64
is that regional N2O emission from agricultural riparian buffers in the US Midwest can be
modeled and estimated using these landscape parameters. These databases could provide
the landscape parameters needed to generate watershed- and regional-scale N2O emission
budgets for riparian areas of the US Midwest by extrapolating emission rates to riparian
buffers where landscape attributes have been characterized. Additionally, as we begin to
better under why some buffers are seasonal hotspots of N2O emission, it might possible
to incorporate this knowledge into the design and restoration of buffers that favor a more
complete denitrification (termination in N2) on intercepted nitrate.
This study results suggests that application of the IPCC (2007) methodology to
agricultural riparian zones in the US Midwest would result in underestimation of N2O
emission. According to the “indirect” N2O emission factors proposed by the IPCC
(2007), between 0.005 and 2 % of fertilizer N applied to cropland could result in N2O
emission in adjacent riparian buffers. Based on these factors and the application of 121.5
kg N ha-1 yr-1 N to the crop fields during the present study, emission from for riparian
zones should be in the range of 0.002-0.78 kg N yr-1. While the IPCC method marginally
estimates (based on upper range estimations) N2O emission from the LWD buffer (0.93
kg N2O-N ha-1, Table 3), annual emission measured at the WR riparian buffer (3.62 kg
N2O-N ha-1, Table 3) was severely underestimated. However, when applied to the crop
fields, the IPCC methodology suggests N2O emission in the range of 8.12-9.16 kg N yr-1.
These estimates are reasonable and represent very well the N2O emission measured at the
WR and LWD crop fields (7.82 and 6.37 kg N2O-N yr-1, respectively). It is likely that
the IPCC methodology to estimate emissions from crop fields is more robust, probably
because it is based on a more comprehensive literature and research data. This reasoning
65
would also suggest that more empirical data is required to build a better model for
estimating N2O emissions from agricultural riparian buffers. The work presented in this
thesis is a step toward that goal. The currently proposed indirect emission factors (IPCC,
2007) do not take into account landscape features. As this study results have clearly
demonstrated, successful modeling attempts of N2O emission in riparian buffers must
incorporate hydrology and geomorphology, and modifications of these attributes by
human intervention (tile drainage, channelization, dredging).
Limitations of the study
In this study, as with any gas sampling study of similar nature, the accuracy of
N2O emission estimates may have been affected by failure of sampling protocol to fully
account for heterogeneity of soil properties and landscape attributes. The addition of
more sampling chambers across these landscapes in conjunction with higher sampling
frequency would always aid in providing higher resolution data for estimation of
landscape scale N2O emission. Additionally, it would have been useful to have had
continuous soil moisture and temperature sensors in the crop fields (although these
sensors would have to be removed during regular farming operations). Also, installing
monitoring wells coupled with gas sampling chambers in riparian zone would have
further elucidated the effects of water table dynamics on N2O emission in riparian zones
in comparison to crop fields. However, for a number of practical constraints, this was not
possible.
Flooding events have a highly significant effect on both the temporal variability
and the amount of N2O emitted from riparian buffers. Efforts must be made to better
66
capture these events in future studies. When sites are not accessible, it might be possible
to sample flood waters and derive N2O emission from measurements of dissolved N2O
concentrations. Likewise, “floating-chambers” can be deployed for direct measurement
of N2O emission from flooded riparian buffers. After the recession of floodwaters,
sampling with static chambers can be resumed. The combination of these monitoring
approaches would help generate more refined and more temporally-resolved data for a
better understanding of N2O emission dynamics during these hot-moments.
67
CONCLUSION
Because of their capacity to sustain high rates of denitrification, riparian buffers
can be sites of intense of N transformation, and thus could mitigate the export of mineral
N from agricultural landscapes. Since this transformation often results in the emission of
N2O, improvement in water quality can have a negative impact on air quality. In contrast
to past studies, regression models incorporating soil properties (denitrification potential,
organic carbon, C:N, particle size, bulk density, pH) showed limited capacity to predict
N2O emission at the riparian sites included in the present investigation. The present
study showed that the likelihood of riparian buffers to become hotspots of N2O emission
depends largely on flooding potential and land-stream linkage. Low-lying riparian areas
that were subject to frequent flooding emitted up to 1,700 % more N2O than non-flooded
adjacent areas, especially during the weeks after fertilizer application to crop fields.
Considering the limitations noted above, further research is needed to confirm these
results and their range of applicability. These studies must include landscapes of similar
attributes as well as riparian systems outside of the US Midwest. Ultimately, these
efforts will lead to more data, better methodologies, and more robust models to assess the
contribution of riparian buffers to N2O budgets in agricultural watersheds across a range
of eco-regions.

68
APPENDICES
Appendix A. Nitrous oxide flux at White River site (WR).
Site Date Chamber ID N2O flux (mg N2O-N m-2 d-1)
WR 12/7/2009 1 0.012 WR 12/7/2009 2 0.018 WR 12/7/2009 3 0.021 WR 12/7/2009 4 -0.009 WR 12/7/2009 5 0.000 WR 12/7/2009 6 0.065 WR 12/7/2009 7 0.047 WR 12/7/2009 8 0.012 WR 12/7/2009 9 0.049 WR 12/7/2009 10 0.033 WR 1/21/2010 1 1.212 WR 1/21/2010 2 1.570 WR 1/21/2010 3 1.129 WR 1/21/2010 4 0.949 WR 1/21/2010 5 1.218 WR 1/21/2010 6 -0.158 WR 1/21/2010 7 0.516 WR 1/21/2010 8 0.243 WR 1/21/2010 9 0.320 WR 1/21/2010 10 0.348 WR 1/21/2010 11 0.959 WR 1/21/2010 12 -1.022 WR 1/21/2010 13 -0.004 WR 1/21/2010 14 0.256 WR 3/4/2010 1 -0.072 WR 3/4/2010 2 0.078 WR 3/4/2010 3 -0.143 WR 3/4/2010 4 -0.200 WR 3/4/2010 5 0.194 WR 3/4/2010 6 -0.326 WR 3/4/2010 7 0.542 WR 3/4/2010 8 0.207 WR 3/4/2010 9 0.388 WR 3/4/2010 10 0.280 WR 3/4/2010 11 0.132 WR 3/4/2010 12 0.004 WR 3/4/2010 13 0.292 WR 3/4/2010 14 -0.002
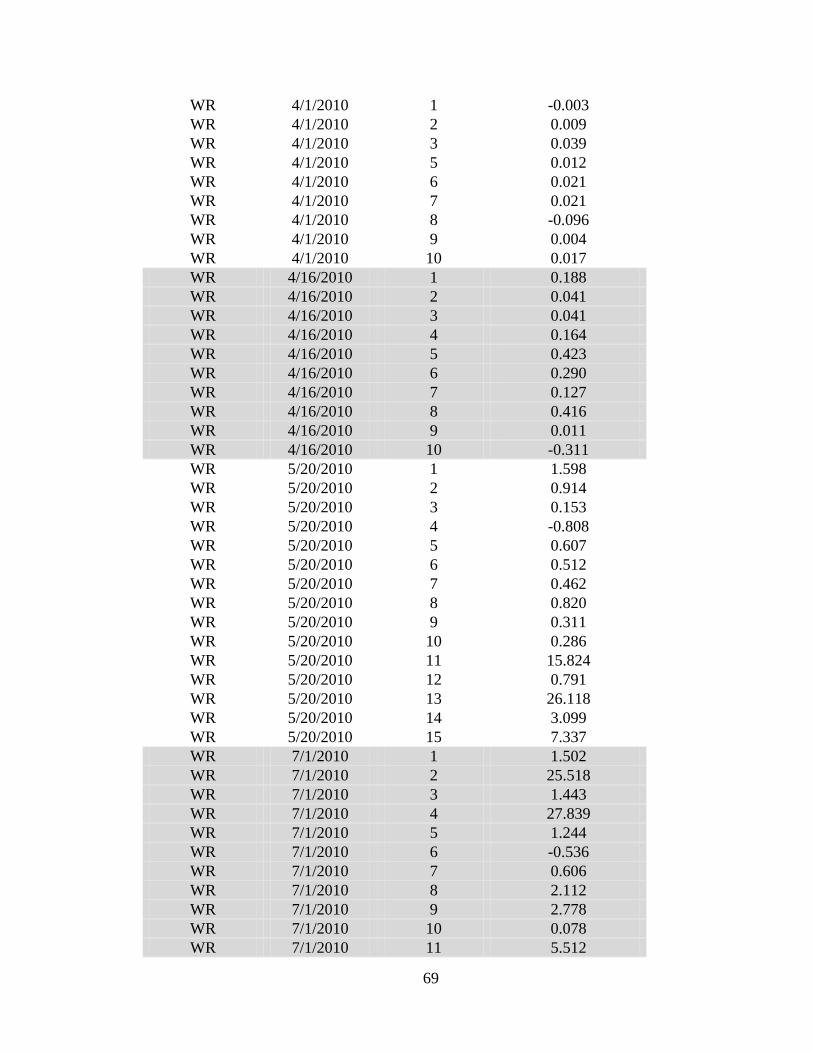
69
WR 4/1/2010 1 -0.003 WR 4/1/2010 2 0.009 WR 4/1/2010 3 0.039 WR 4/1/2010 5 0.012 WR 4/1/2010 6 0.021 WR 4/1/2010 7 0.021 WR 4/1/2010 8 -0.096 WR 4/1/2010 9 0.004 WR 4/1/2010 10 0.017 WR 4/16/2010 1 0.188 WR 4/16/2010 2 0.041 WR 4/16/2010 3 0.041 WR 4/16/2010 4 0.164 WR 4/16/2010 5 0.423 WR 4/16/2010 6 0.290 WR 4/16/2010 7 0.127 WR 4/16/2010 8 0.416 WR 4/16/2010 9 0.011 WR 4/16/2010 10 -0.311 WR 5/20/2010 1 1.598 WR 5/20/2010 2 0.914 WR 5/20/2010 3 0.153 WR 5/20/2010 4 -0.808 WR 5/20/2010 5 0.607 WR 5/20/2010 6 0.512 WR 5/20/2010 7 0.462 WR 5/20/2010 8 0.820 WR 5/20/2010 9 0.311 WR 5/20/2010 10 0.286 WR 5/20/2010 11 15.824 WR 5/20/2010 12 0.791 WR 5/20/2010 13 26.118 WR 5/20/2010 14 3.099 WR 5/20/2010 15 7.337 WR 7/1/2010 1 1.502 WR 7/1/2010 2 25.518 WR 7/1/2010 3 1.443 WR 7/1/2010 4 27.839 WR 7/1/2010 5 1.244 WR 7/1/2010 6 -0.536 WR 7/1/2010 7 0.606 WR 7/1/2010 8 2.112 WR 7/1/2010 9 2.778 WR 7/1/2010 10 0.078 WR 7/1/2010 11 5.512
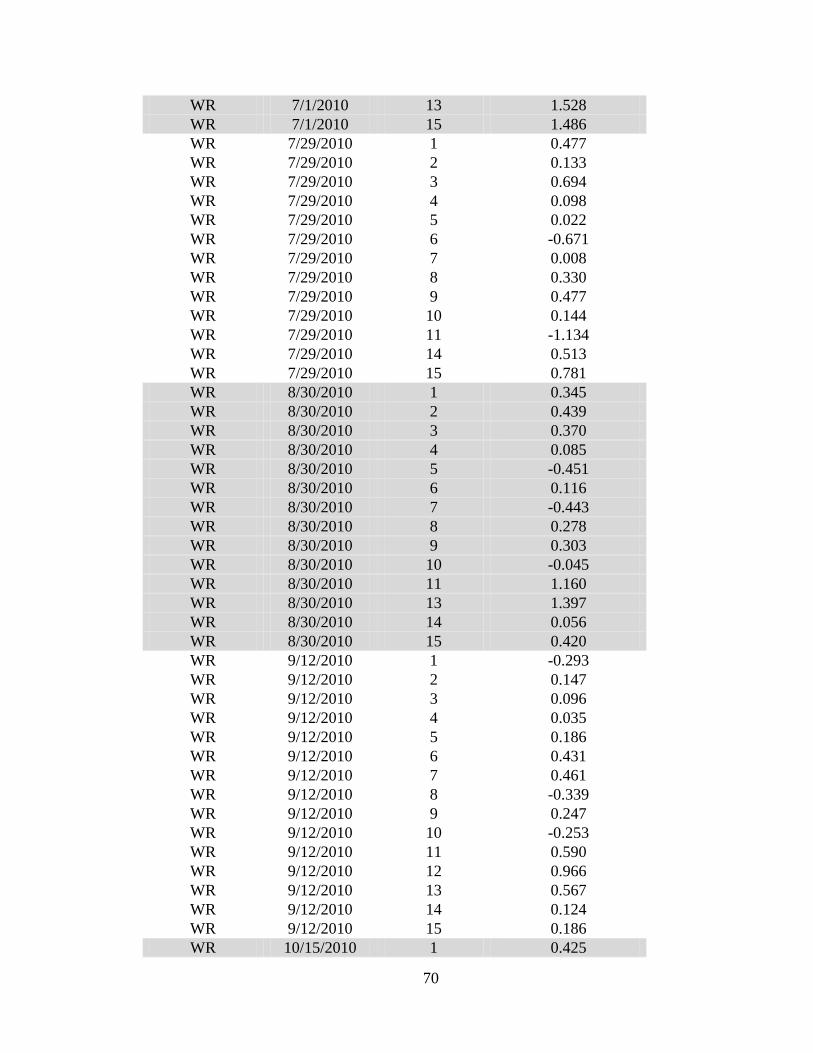
70
WR 7/1/2010 13 1.528 WR 7/1/2010 15 1.486 WR 7/29/2010 1 0.477 WR 7/29/2010 2 0.133 WR 7/29/2010 3 0.694 WR 7/29/2010 4 0.098 WR 7/29/2010 5 0.022 WR 7/29/2010 6 -0.671 WR 7/29/2010 7 0.008 WR 7/29/2010 8 0.330 WR 7/29/2010 9 0.477 WR 7/29/2010 10 0.144 WR 7/29/2010 11 -1.134 WR 7/29/2010 14 0.513 WR 7/29/2010 15 0.781 WR 8/30/2010 1 0.345 WR 8/30/2010 2 0.439 WR 8/30/2010 3 0.370 WR 8/30/2010 4 0.085 WR 8/30/2010 5 -0.451 WR 8/30/2010 6 0.116 WR 8/30/2010 7 -0.443 WR 8/30/2010 8 0.278 WR 8/30/2010 9 0.303 WR 8/30/2010 10 -0.045 WR 8/30/2010 11 1.160 WR 8/30/2010 13 1.397 WR 8/30/2010 14 0.056 WR 8/30/2010 15 0.420 WR 9/12/2010 1 -0.293 WR 9/12/2010 2 0.147 WR 9/12/2010 3 0.096 WR 9/12/2010 4 0.035 WR 9/12/2010 5 0.186 WR 9/12/2010 6 0.431 WR 9/12/2010 7 0.461 WR 9/12/2010 8 -0.339 WR 9/12/2010 9 0.247 WR 9/12/2010 10 -0.253 WR 9/12/2010 11 0.590 WR 9/12/2010 12 0.966 WR 9/12/2010 13 0.567 WR 9/12/2010 14 0.124 WR 9/12/2010 15 0.186 WR 10/15/2010 1 0.425
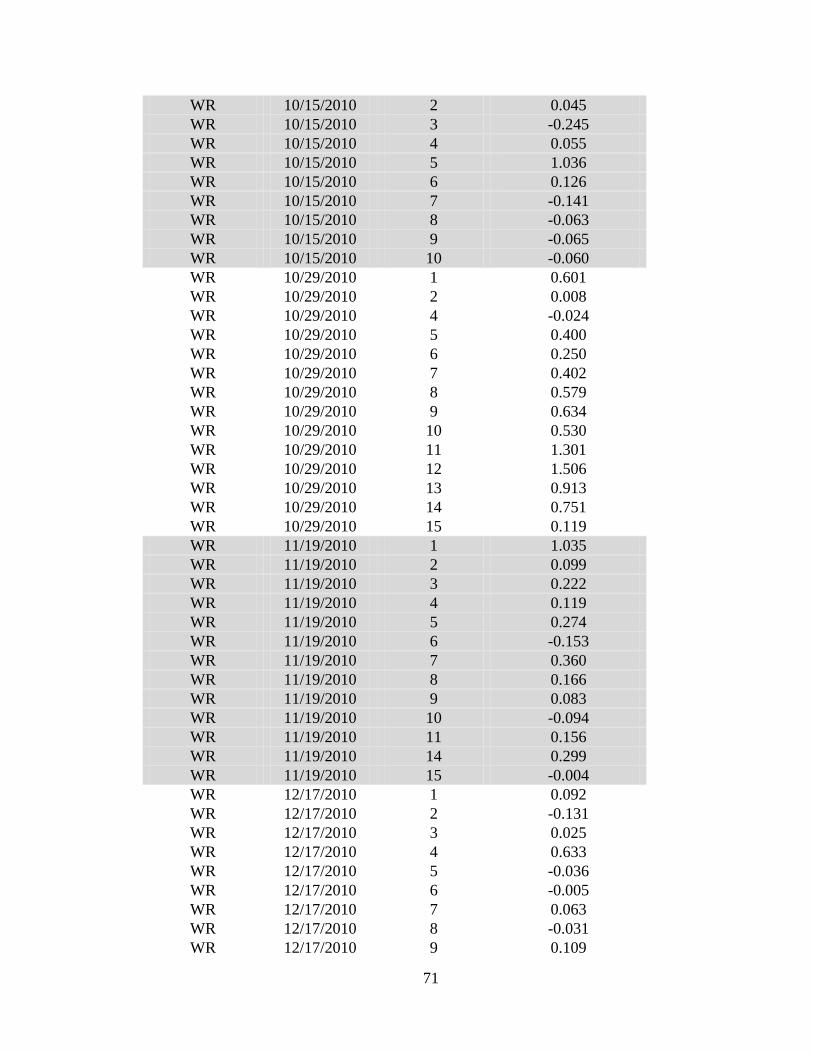
71
WR 10/15/2010 2 0.045 WR 10/15/2010 3 -0.245 WR 10/15/2010 4 0.055 WR 10/15/2010 5 1.036 WR 10/15/2010 6 0.126 WR 10/15/2010 7 -0.141 WR 10/15/2010 8 -0.063 WR 10/15/2010 9 -0.065 WR 10/15/2010 10 -0.060 WR 10/29/2010 1 0.601 WR 10/29/2010 2 0.008 WR 10/29/2010 4 -0.024 WR 10/29/2010 5 0.400 WR 10/29/2010 6 0.250 WR 10/29/2010 7 0.402 WR 10/29/2010 8 0.579 WR 10/29/2010 9 0.634 WR 10/29/2010 10 0.530 WR 10/29/2010 11 1.301 WR 10/29/2010 12 1.506 WR 10/29/2010 13 0.913 WR 10/29/2010 14 0.751 WR 10/29/2010 15 0.119 WR 11/19/2010 1 1.035 WR 11/19/2010 2 0.099 WR 11/19/2010 3 0.222 WR 11/19/2010 4 0.119 WR 11/19/2010 5 0.274 WR 11/19/2010 6 -0.153 WR 11/19/2010 7 0.360 WR 11/19/2010 8 0.166 WR 11/19/2010 9 0.083 WR 11/19/2010 10 -0.094 WR 11/19/2010 11 0.156 WR 11/19/2010 14 0.299 WR 11/19/2010 15 -0.004 WR 12/17/2010 1 0.092 WR 12/17/2010 2 -0.131 WR 12/17/2010 3 0.025 WR 12/17/2010 4 0.633 WR 12/17/2010 5 -0.036 WR 12/17/2010 6 -0.005 WR 12/17/2010 7 0.063 WR 12/17/2010 8 -0.031 WR 12/17/2010 9 0.109
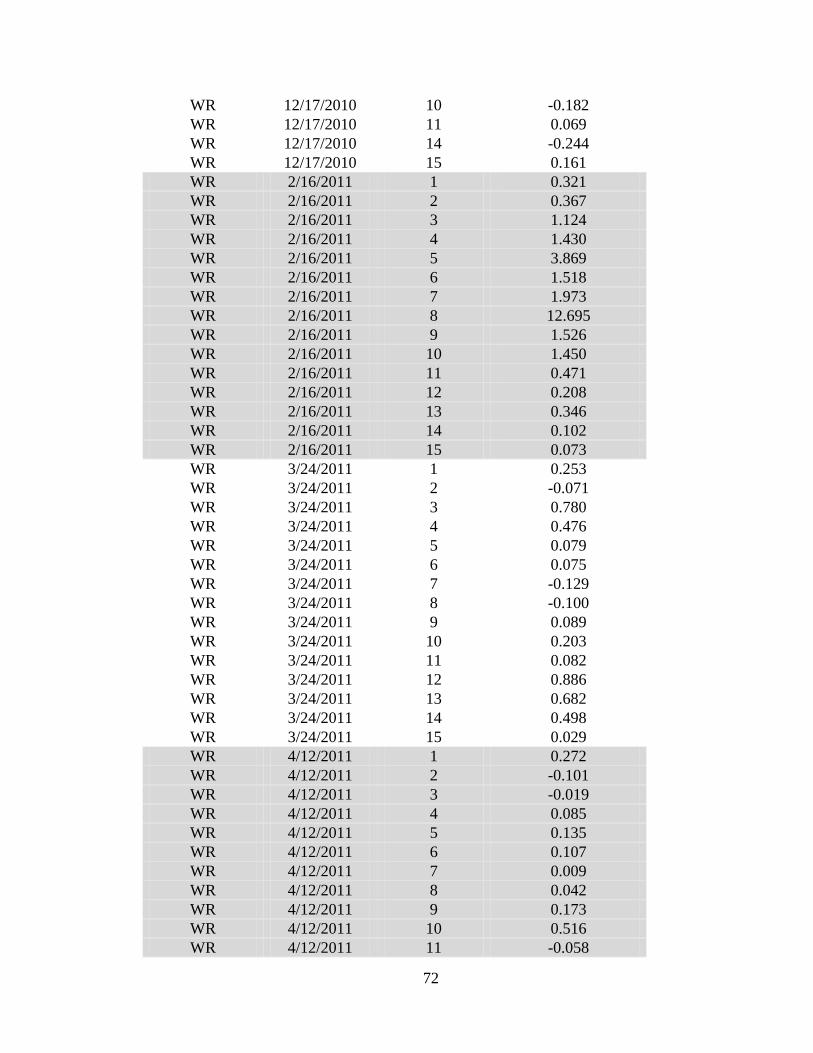
72
WR 12/17/2010 10 -0.182 WR 12/17/2010 11 0.069 WR 12/17/2010 14 -0.244 WR 12/17/2010 15 0.161 WR 2/16/2011 1 0.321 WR 2/16/2011 2 0.367 WR 2/16/2011 3 1.124 WR 2/16/2011 4 1.430 WR 2/16/2011 5 3.869 WR 2/16/2011 6 1.518 WR 2/16/2011 7 1.973 WR 2/16/2011 8 12.695 WR 2/16/2011 9 1.526 WR 2/16/2011 10 1.450 WR 2/16/2011 11 0.471 WR 2/16/2011 12 0.208 WR 2/16/2011 13 0.346 WR 2/16/2011 14 0.102 WR 2/16/2011 15 0.073 WR 3/24/2011 1 0.253 WR 3/24/2011 2 -0.071 WR 3/24/2011 3 0.780 WR 3/24/2011 4 0.476 WR 3/24/2011 5 0.079 WR 3/24/2011 6 0.075 WR 3/24/2011 7 -0.129 WR 3/24/2011 8 -0.100 WR 3/24/2011 9 0.089 WR 3/24/2011 10 0.203 WR 3/24/2011 11 0.082 WR 3/24/2011 12 0.886 WR 3/24/2011 13 0.682 WR 3/24/2011 14 0.498 WR 3/24/2011 15 0.029 WR 4/12/2011 1 0.272 WR 4/12/2011 2 -0.101 WR 4/12/2011 3 -0.019 WR 4/12/2011 4 0.085 WR 4/12/2011 5 0.135 WR 4/12/2011 6 0.107 WR 4/12/2011 7 0.009 WR 4/12/2011 8 0.042 WR 4/12/2011 9 0.173 WR 4/12/2011 10 0.516 WR 4/12/2011 11 -0.058

73
WR 4/12/2011 12 0.166 WR 4/12/2011 13 0.230 WR 4/12/2011 14 0.141 WR 4/12/2011 15 0.066
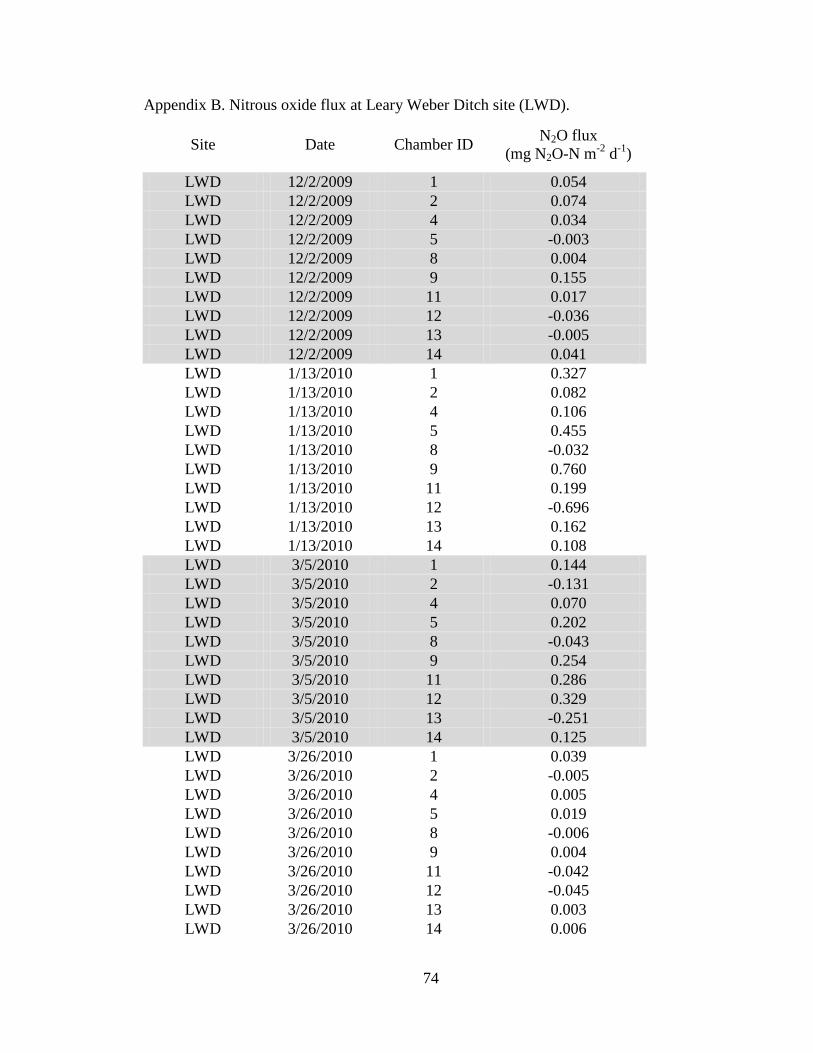
74
Appendix B. Nitrous oxide flux at Leary Weber Ditch site (LWD).
Site Date Chamber ID N2O flux (mg N2O-N m-2 d-1)
LWD 12/2/2009 1 0.054 LWD 12/2/2009 2 0.074 LWD 12/2/2009 4 0.034 LWD 12/2/2009 5 -0.003 LWD 12/2/2009 8 0.004 LWD 12/2/2009 9 0.155 LWD 12/2/2009 11 0.017 LWD 12/2/2009 12 -0.036 LWD 12/2/2009 13 -0.005 LWD 12/2/2009 14 0.041 LWD 1/13/2010 1 0.327 LWD 1/13/2010 2 0.082 LWD 1/13/2010 4 0.106 LWD 1/13/2010 5 0.455 LWD 1/13/2010 8 -0.032 LWD 1/13/2010 9 0.760 LWD 1/13/2010 11 0.199 LWD 1/13/2010 12 -0.696 LWD 1/13/2010 13 0.162 LWD 1/13/2010 14 0.108 LWD 3/5/2010 1 0.144 LWD 3/5/2010 2 -0.131 LWD 3/5/2010 4 0.070 LWD 3/5/2010 5 0.202 LWD 3/5/2010 8 -0.043 LWD 3/5/2010 9 0.254 LWD 3/5/2010 11 0.286 LWD 3/5/2010 12 0.329 LWD 3/5/2010 13 -0.251 LWD 3/5/2010 14 0.125 LWD 3/26/2010 1 0.039 LWD 3/26/2010 2 -0.005 LWD 3/26/2010 4 0.005 LWD 3/26/2010 5 0.019 LWD 3/26/2010 8 -0.006 LWD 3/26/2010 9 0.004 LWD 3/26/2010 11 -0.042 LWD 3/26/2010 12 -0.045 LWD 3/26/2010 13 0.003 LWD 3/26/2010 14 0.006
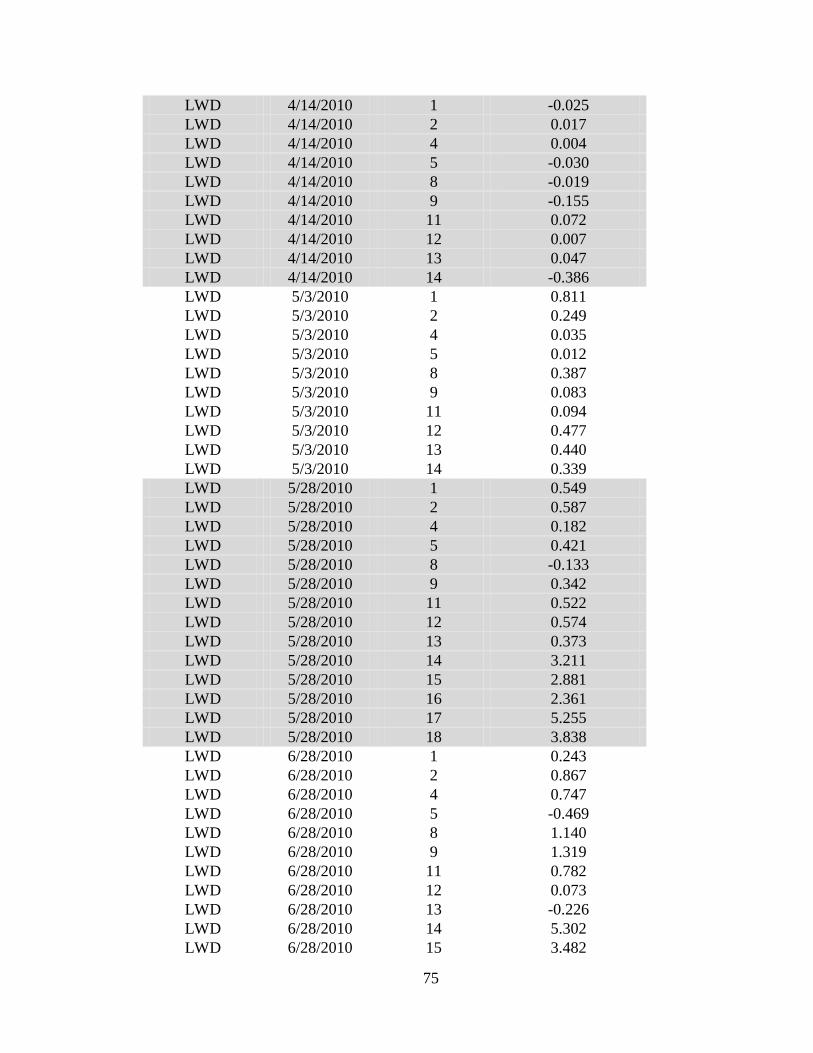
75
LWD 4/14/2010 1 -0.025 LWD 4/14/2010 2 0.017 LWD 4/14/2010 4 0.004 LWD 4/14/2010 5 -0.030 LWD 4/14/2010 8 -0.019 LWD 4/14/2010 9 -0.155 LWD 4/14/2010 11 0.072 LWD 4/14/2010 12 0.007 LWD 4/14/2010 13 0.047 LWD 4/14/2010 14 -0.386 LWD 5/3/2010 1 0.811 LWD 5/3/2010 2 0.249 LWD 5/3/2010 4 0.035 LWD 5/3/2010 5 0.012 LWD 5/3/2010 8 0.387 LWD 5/3/2010 9 0.083 LWD 5/3/2010 11 0.094 LWD 5/3/2010 12 0.477 LWD 5/3/2010 13 0.440 LWD 5/3/2010 14 0.339 LWD 5/28/2010 1 0.549 LWD 5/28/2010 2 0.587 LWD 5/28/2010 4 0.182 LWD 5/28/2010 5 0.421 LWD 5/28/2010 8 -0.133 LWD 5/28/2010 9 0.342 LWD 5/28/2010 11 0.522 LWD 5/28/2010 12 0.574 LWD 5/28/2010 13 0.373 LWD 5/28/2010 14 3.211 LWD 5/28/2010 15 2.881 LWD 5/28/2010 16 2.361 LWD 5/28/2010 17 5.255 LWD 5/28/2010 18 3.838 LWD 6/28/2010 1 0.243 LWD 6/28/2010 2 0.867 LWD 6/28/2010 4 0.747 LWD 6/28/2010 5 -0.469 LWD 6/28/2010 8 1.140 LWD 6/28/2010 9 1.319 LWD 6/28/2010 11 0.782 LWD 6/28/2010 12 0.073 LWD 6/28/2010 13 -0.226 LWD 6/28/2010 14 5.302 LWD 6/28/2010 15 3.482
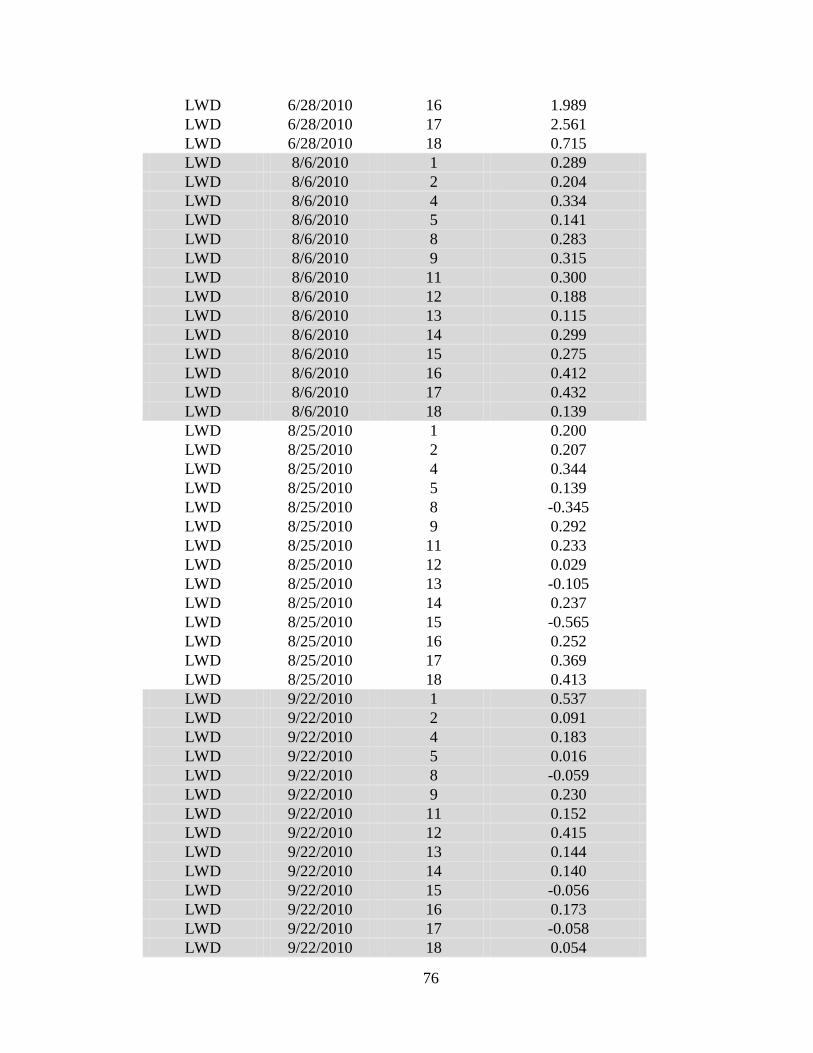
76
LWD 6/28/2010 16 1.989 LWD 6/28/2010 17 2.561 LWD 6/28/2010 18 0.715 LWD 8/6/2010 1 0.289 LWD 8/6/2010 2 0.204 LWD 8/6/2010 4 0.334 LWD 8/6/2010 5 0.141 LWD 8/6/2010 8 0.283 LWD 8/6/2010 9 0.315 LWD 8/6/2010 11 0.300 LWD 8/6/2010 12 0.188 LWD 8/6/2010 13 0.115 LWD 8/6/2010 14 0.299 LWD 8/6/2010 15 0.275 LWD 8/6/2010 16 0.412 LWD 8/6/2010 17 0.432 LWD 8/6/2010 18 0.139 LWD 8/25/2010 1 0.200 LWD 8/25/2010 2 0.207 LWD 8/25/2010 4 0.344 LWD 8/25/2010 5 0.139 LWD 8/25/2010 8 -0.345 LWD 8/25/2010 9 0.292 LWD 8/25/2010 11 0.233 LWD 8/25/2010 12 0.029 LWD 8/25/2010 13 -0.105 LWD 8/25/2010 14 0.237 LWD 8/25/2010 15 -0.565 LWD 8/25/2010 16 0.252 LWD 8/25/2010 17 0.369 LWD 8/25/2010 18 0.413 LWD 9/22/2010 1 0.537 LWD 9/22/2010 2 0.091 LWD 9/22/2010 4 0.183 LWD 9/22/2010 5 0.016 LWD 9/22/2010 8 -0.059 LWD 9/22/2010 9 0.230 LWD 9/22/2010 11 0.152 LWD 9/22/2010 12 0.415 LWD 9/22/2010 13 0.144 LWD 9/22/2010 14 0.140 LWD 9/22/2010 15 -0.056 LWD 9/22/2010 16 0.173 LWD 9/22/2010 17 -0.058 LWD 9/22/2010 18 0.054
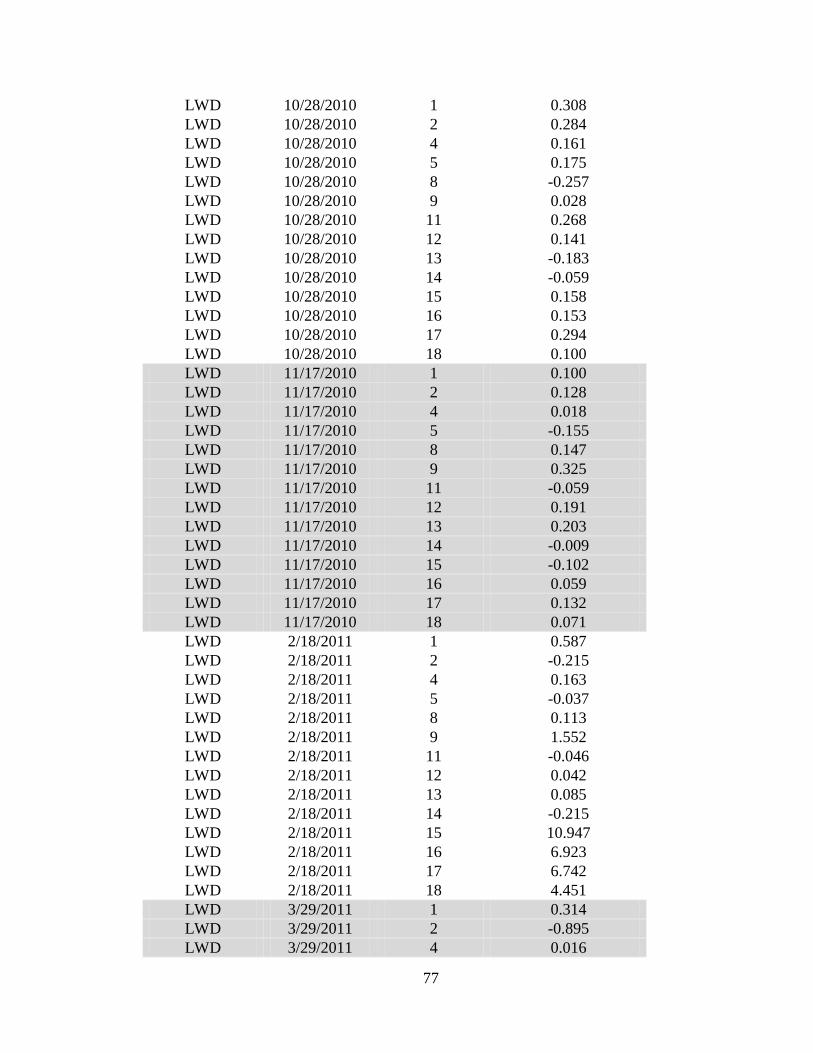
77
LWD 10/28/2010 1 0.308 LWD 10/28/2010 2 0.284 LWD 10/28/2010 4 0.161 LWD 10/28/2010 5 0.175 LWD 10/28/2010 8 -0.257 LWD 10/28/2010 9 0.028 LWD 10/28/2010 11 0.268 LWD 10/28/2010 12 0.141 LWD 10/28/2010 13 -0.183 LWD 10/28/2010 14 -0.059 LWD 10/28/2010 15 0.158 LWD 10/28/2010 16 0.153 LWD 10/28/2010 17 0.294 LWD 10/28/2010 18 0.100 LWD 11/17/2010 1 0.100 LWD 11/17/2010 2 0.128 LWD 11/17/2010 4 0.018 LWD 11/17/2010 5 -0.155 LWD 11/17/2010 8 0.147 LWD 11/17/2010 9 0.325 LWD 11/17/2010 11 -0.059 LWD 11/17/2010 12 0.191 LWD 11/17/2010 13 0.203 LWD 11/17/2010 14 -0.009 LWD 11/17/2010 15 -0.102 LWD 11/17/2010 16 0.059 LWD 11/17/2010 17 0.132 LWD 11/17/2010 18 0.071 LWD 2/18/2011 1 0.587 LWD 2/18/2011 2 -0.215 LWD 2/18/2011 4 0.163 LWD 2/18/2011 5 -0.037 LWD 2/18/2011 8 0.113 LWD 2/18/2011 9 1.552 LWD 2/18/2011 11 -0.046 LWD 2/18/2011 12 0.042 LWD 2/18/2011 13 0.085 LWD 2/18/2011 14 -0.215 LWD 2/18/2011 15 10.947 LWD 2/18/2011 16 6.923 LWD 2/18/2011 17 6.742 LWD 2/18/2011 18 4.451 LWD 3/29/2011 1 0.314 LWD 3/29/2011 2 -0.895 LWD 3/29/2011 4 0.016
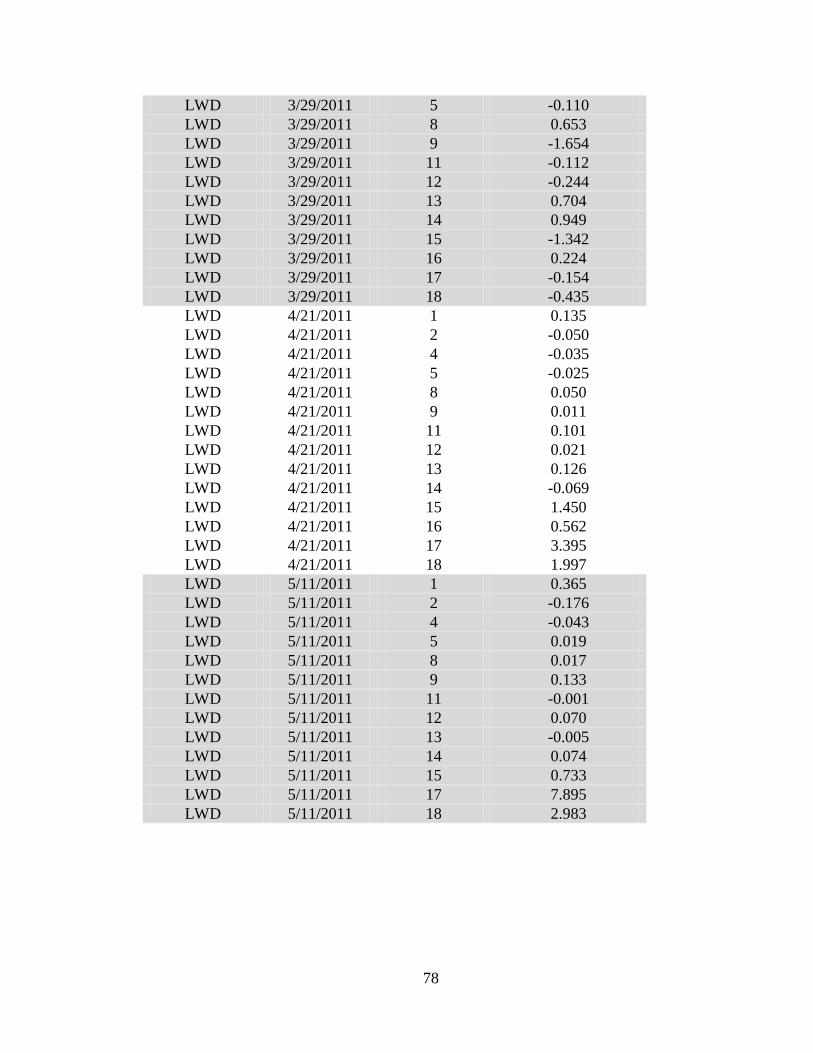
78
LWD 3/29/2011 5 -0.110 LWD 3/29/2011 8 0.653 LWD 3/29/2011 9 -1.654 LWD 3/29/2011 11 -0.112 LWD 3/29/2011 12 -0.244 LWD 3/29/2011 13 0.704 LWD 3/29/2011 14 0.949 LWD 3/29/2011 15 -1.342 LWD 3/29/2011 16 0.224 LWD 3/29/2011 17 -0.154 LWD 3/29/2011 18 -0.435 LWD 4/21/2011 1 0.135 LWD 4/21/2011 2 -0.050 LWD 4/21/2011 4 -0.035 LWD 4/21/2011 5 -0.025 LWD 4/21/2011 8 0.050 LWD 4/21/2011 9 0.011 LWD 4/21/2011 11 0.101 LWD 4/21/2011 12 0.021 LWD 4/21/2011 13 0.126 LWD 4/21/2011 14 -0.069 LWD 4/21/2011 15 1.450 LWD 4/21/2011 16 0.562 LWD 4/21/2011 17 3.395 LWD 4/21/2011 18 1.997 LWD 5/11/2011 1 0.365 LWD 5/11/2011 2 -0.176 LWD 5/11/2011 4 -0.043 LWD 5/11/2011 5 0.019 LWD 5/11/2011 8 0.017 LWD 5/11/2011 9 0.133 LWD 5/11/2011 11 -0.001 LWD 5/11/2011 12 0.070 LWD 5/11/2011 13 -0.005 LWD 5/11/2011 14 0.074 LWD 5/11/2011 15 0.733 LWD 5/11/2011 17 7.895 LWD 5/11/2011 18 2.983
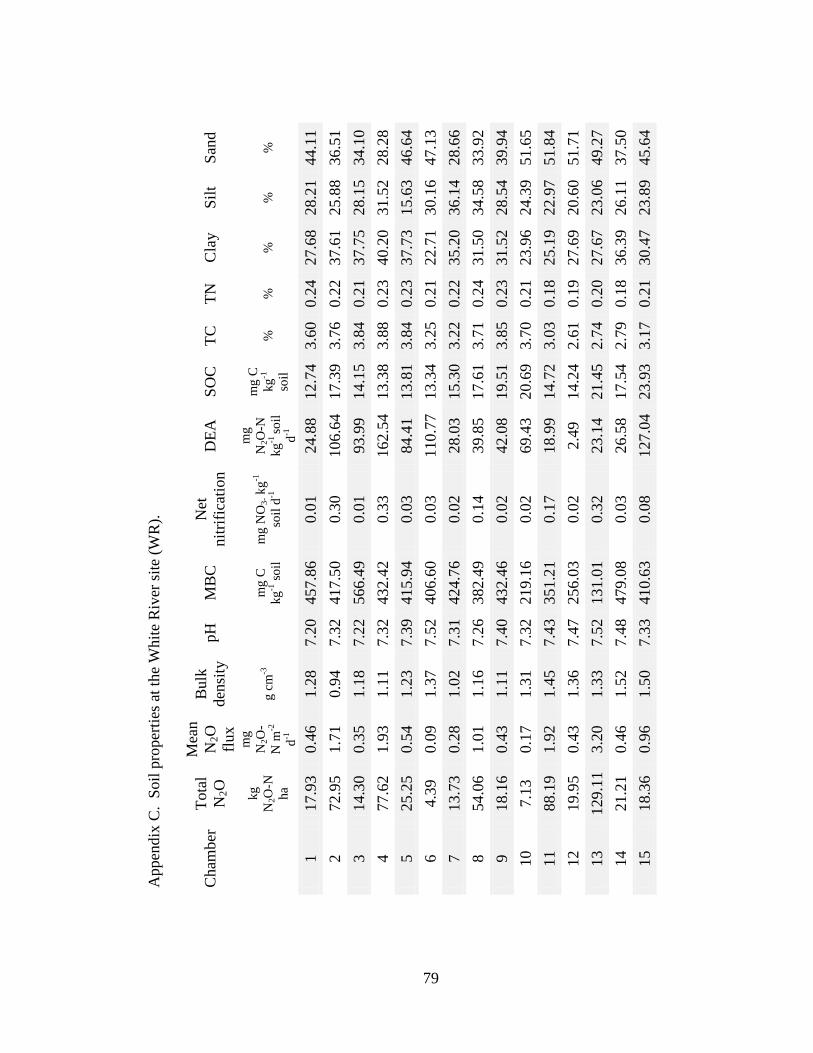
79
App
endi
x C
. So
il pr
oper
ties a
t the
Whi
te R
iver
site
(WR
).
Cha
mbe
r To
tal
N2O
Mea
n N
2O
flux
Bul
k de
nsity
pH
M
BC
N
et
nitri
ficat
ion
DEA
SO
C
TC
TN
Cla
y Si
lt Sa
nd
kg
N
2O-N
ha
mg
N2O
-N
m-2
d-1
g cm
-3
m
g C
kg
-1 so
il m
g N
O3-
kg-1
so
il d-1
mg
N2O
-N
kg-1
soil
d-1
mg
C
kg-1
so
il %
%
%
%
%
1 17
.93
0.46
1.
28
7.20
45
7.86
0.
01
24.8
8 12
.74
3.60
0.
24
27.6
8 28
.21
44.1
1 2
72.9
5 1.
71
0.94
7.
32
417.
50
0.30
10
6.64
17
.39
3.76
0.
22
37.6
1 25
.88
36.5
1 3
14.3
0 0.
35
1.18
7.
22
566.
49
0.01
93
.99
14.1
5 3.
84
0.21
37
.75
28.1
5 34
.10
4 77
.62
1.93
1.
11
7.32
43
2.42
0.
33
162.
54
13.3
8 3.
88
0.23
40
.20
31.5
2 28
.28
5 25
.25
0.54
1.
23
7.39
41
5.94
0.
03
84.4
1 13
.81
3.84
0.
23
37.7
3 15
.63
46.6
4 6
4.39
0.
09
1.37
7.
52
406.
60
0.03
11
0.77
13
.34
3.25
0.
21
22.7
1 30
.16
47.1
3 7
13.7
3 0.
28
1.02
7.
31
424.
76
0.02
28
.03
15.3
0 3.
22
0.22
35
.20
36.1
4 28
.66
8 54
.06
1.01
1.
16
7.26
38
2.49
0.
14
39.8
5 17
.61
3.71
0.
24
31.5
0 34
.58
33.9
2 9
18.1
6 0.
43
1.11
7.
40
432.
46
0.02
42
.08
19.5
1 3.
85
0.23
31
.52
28.5
4 39
.94
10
7.13
0.
17
1.31
7.
32
219.
16
0.02
69
.43
20.6
9 3.
70
0.21
23
.96
24.3
9 51
.65
11
88.1
9 1.
92
1.45
7.
43
351.
21
0.17
18
.99
14.7
2 3.
03
0.18
25
.19
22.9
7 51
.84
12
19.9
5 0.
43
1.36
7.
47
256.
03
0.02
2.
49
14.2
4 2.
61
0.19
27
.69
20.6
0 51
.71
13
129.
11
3.20
1.
33
7.52
13
1.01
0.
32
23.1
4 21
.45
2.74
0.
20
27.6
7 23
.06
49.2
7 14
21
.21
0.46
1.
52
7.48
47
9.08
0.
03
26.5
8 17
.54
2.79
0.
18
36.3
9 26
.11
37.5
0 15
18
.36
0.96
1.
50
7.33
41
0.63
0.
08
127.
04
23.9
3 3.
17
0.21
30
.47
23.8
9 45
.64
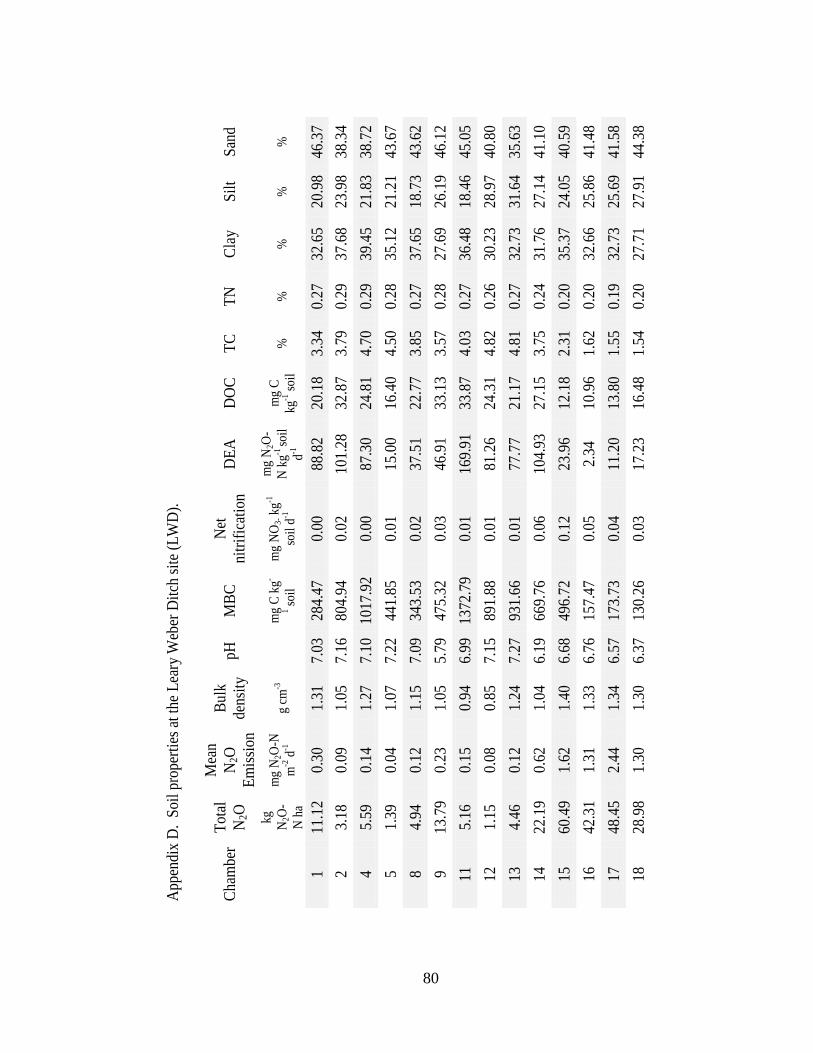
80
Appe
ndix
D.
Soil
prop
ertie
s at t
he L
eary
Web
er D
itch
site (
LWD)
.
Cham
ber
Total
N 2
O
Mea
n N 2
O Em
issio
n
Bulk
de
nsity
pH
M
BC
Net
nitri
ficati
on
DEA
DOC
TC
TN
Clay
Si
lt Sa
nd
kg
N 2
O-N
ha
mg
N 2O-
N m
-2 d
-1
g cm
-3
m
g C
kg-
1 soil
mg
NO3-
kg-1
so
il d-1
mg
N 2O-
N kg
-1 so
il d-1
mg
C kg
-1 so
il %
%
%
%
%
1 11
.12
0.30
1.
31
7.03
28
4.47
0.
00
88.8
2 20
.18
3.34
0.
27
32.6
5 20
.98
46.3
7 2
3.18
0.
09
1.05
7.
16
804.
94
0.02
10
1.28
32
.87
3.79
0.
29
37.6
8 23
.98
38.3
4 4
5.59
0.
14
1.27
7.
10
1017
.92
0.00
87
.30
24.8
1 4.
70
0.29
39
.45
21.8
3 38
.72
5 1.
39
0.04
1.
07
7.22
44
1.85
0.
01
15.0
0 16
.40
4.50
0.
28
35.1
2 21
.21
43.6
7 8
4.94
0.
12
1.15
7.
09
343.
53
0.02
37
.51
22.7
7 3.
85
0.27
37
.65
18.7
3 43
.62
9 13
.79
0.23
1.
05
5.79
47
5.32
0.
03
46.9
1 33
.13
3.57
0.
28
27.6
9 26
.19
46.1
2 11
5.
16
0.15
0.
94
6.99
13
72.7
9 0.
01
169.
91
33.8
7 4.
03
0.27
36
.48
18.4
6 45
.05
12
1.15
0.
08
0.85
7.
15
891.
88
0.01
81
.26
24.3
1 4.
82
0.26
30
.23
28.9
7 40
.80
13
4.46
0.
12
1.24
7.
27
931.
66
0.01
77
.77
21.1
7 4.
81
0.27
32
.73
31.6
4 35
.63
14
22.1
9 0.
62
1.04
6.
19
669.
76
0.06
10
4.93
27
.15
3.75
0.
24
31.7
6 27
.14
41.1
0 15
60
.49
1.62
1.
40
6.68
49
6.72
0.
12
23.9
6 12
.18
2.31
0.
20
35.3
7 24
.05
40.5
9 16
42
.31
1.31
1.
33
6.76
15
7.47
0.
05
2.34
10
.96
1.62
0.
20
32.6
6 25
.86
41.4
8 17
48
.45
2.44
1.
34
6.57
17
3.73
0.
04
11.2
0 13
.80
1.55
0.
19
32.7
3 25
.69
41.5
8 18
28
.98
1.30
1.
30
6.37
13
0.26
0.
03
17.2
3 16
.48
1.54
0.
20
27.7
1 27
.91
44.3
8

81
REFERENCES
Ambus, P. 1998. Nitrous oxide production by denitrification and nitrification in temperate forest, grassland and agricultural soils. European Journal of Soil Science 49:495-502.
Anderson, J.P.E. and Domsch, K.H. 1978. A physiological method for the quantitative
measurement of microbial biomass in soil. Soil Biology and Biochemistry 10:215-221.
Bouwman, A.F., Fung, I., Matthews, E. and John, J. 1993. Global analysis of potential for
N2O production in natural soils. Global Biogeochemical Cycles 7:557-597. Bouyoucos, G.J. 1936. Directions for making mechanical analyses of soils by the
hydrometer method. Michigan Agricultural Experimental Station 269:225-228. Burford, J.R. and Bremner, J.M. 1975. Relationships between the denitrification
capacities of soils and total water-soluble and readily decomposable soil organic matter. Soil Biology and Biochemistry 7:389-394.
Burt, T.P., Matchett, L.S., Goulding, K.W.T., Webster, C.P. and Haycock, N.E. 1999.
Denitrification in riparian buffer zones: the role of floodplain hydrology. Hydrological Processes 13:1451-1463.
Burton, D.L. and Beauchamp, E.G. 1994. Profile of Nitrous oxide and carbon dioxide
concentrations in a soil subject to freezing. Soil Science Society of America Journal 58:115-122.
Carpenter, S.R., Caraco, N.F., Correll, D.L., Howarth, R.W., Sharpley, A.N. and Smith,
V.H. 1998. Nonpoint pollution of surface waters with phosphorus and nitrogen. Ecological Applications 8:559-568.
Chapuis-Lardy, L., Wrage, N., Metay, A., Chotts, J.L. and Bernoux, M. 2007. Soils, a
sink for N2O? A review. Global Change Biology 13:1-17. Davidson, E.A. 1991. Fluxes of nitrous oxide and nitric oxide from terrestrial
ecosystems. In: Microbial production and consumption of greenhouse gases (eds. J. Rogers and W.B. Whitman), pp. 219-235. American Society of Microbiology, Washington D.C.
Dobbie, K.E. and Smith, K.A. 2001. The effects of temperature, water-filled pore space
and land use on N2O emissions from an imperfectly drained gleysol. European Journal of Soil Science 52:667-673.
82
Dowrick, D.J., Hughes, S., Freeman, C., Lock, M.A., Reynolds, B. and Hudson, J.A. 1999. Nitrous oxide emissions from a gully mire in mid-Wales, UK, under simulated summer drought. Biogeochemistry 44:151-162.
Dunesbury, M.P., Engel, R.E., Miller, P.R., Lemke, R.L. and Wallander, R. 2008. Nitrous oxide emissions from a northern Great Plains soil as influenced by nitrogen management and cropping systems. Journal of Environmental Quality 37:542-550.
Duxbury, J.M. and Mosier, A.R. 1993. Status and issues concerning agricultural emissions of greenhouse gases. In: Kaiser, H.M. and Drennen, T.E. (eds) Agricultural Dimensions of Global Climate Change, pp. 229-258. St. Lucie Press. Delray Beach, FL.
Eichner, M.J. 1990. Nitrous oxide emissions from fertilized soils: summary of available
data. Journal of Environmental Quality 19:272-280. Fennessy, M.S. and Cronk, J.K. 1997. The effectiveness and restoration potential of
riparian ecotones for the management of nonpoint source pollution, particularly nitrate. Critical Reviews in Environmental Science and Technology 27:285-317.
Flechard, C.R., Ambus, P., Skiba, U., Rees, R.M., Hensen, A., van Amstel, A., van den
Polvan Dasselaar, A., Soussana, J.F., Jones, M., Clifton-Brown, Raschi, A., Horvath, L., Neftel, A., Jocher, M., Amman, C., Leifeld, J., Furher, J., Calanca, P., Thalman, E., Pilegaard, K., di Marco, C., Campbell, C., Nemitz, E., Hargreaves, K.J., Levy, P.E., Ball, B.C., Jones, S.K., van de Bulk, W.C.M., Groot, T., Blom, M., Domingues, R., Kasper, G., Allard, V., Ceschia, E., Cellier, P., Laville, P., Henault, C., Bizoud, F., Abdalla, M., Williams, M., Baronti, S., Berretti, F. and Grosz, B. 2007. Effects of climate and management intensity on nitrous oxide emissions in grassland systems across Europe. Agriculture Ecosystems & Environment 121:135-152.
Girard, J., 2005. Principles of Environmental Chemistry, pp. 78-79. Jones and Bartlett
Publishers, Inc., Sudbury, Massachusetts. Goossens, A., De Visscher, A., Boeckx, P. and van Cleempt, O. 2001. Two-year field
study on the emission of N2O from coarse and middle-textured Belgian soils with different land use. Nutrient Cycling in Agroecosystems 60:23-34.
Groffman, P.M., Gold, A.J. and Jacinthe, P.A. 1998. Nitrous oxide production in riparian
zones and groundwater. Nutrient Cycling in Agroecosystems 52:179-186. Hanson, G.C., Groffman, P.M. and Gold, A.J. 1994. Denitrification in riparian wetlands
receiving high and low groundwater nitrate inputs. Journal of Environmental Quality 25:917-922.
83
Hedin, L.O., von Fischer, J.C., Ostrom, N.E., Kennedy, B.P., Brown, M.P. and Robertson, G.P. 1998. Thermodynamic constraints on nitrogen transformations and other biogeochemical processes at soil-stream interfaces. Ecology 79:684-703.
Hefting, M.M., Bobbink, R., and de Caluwe, H. 2003. Nitrous oxide emission and denitrification in chronically-loaded riparian buffer zones. Journal of Environmental Quality 32:1194-1203.
Hefting, M.M., Beltman, B., Karsenberg, D., Rebel, K., van Riessen, M. and Spijker, M.
2006. Water quality dynamics and hydrology in nitrate loaded riparian zones in the Netherlands. Environmental Pollution 139:143-156.
Hefting, M.M., Clement, J.C., Dowrick, D., Cosandey, A.C., Bernal, S., Cimpian, C.,
Tatur, A., Burt, T.P. and Pinay, G. 2004. Water table elevation controls on soil nitrogen cycling in riparian wetland along a European climatic gradient. Biogeochemistry 67:113-134.
Hill, A.R. 1996. Nitrate removal in stream riparian zones. Journal of Environmental
Quality 25:743-755. Hillel, D. 1998. Environmental Soil Physics, pp. 275-287. Academic Press, San Diego,
California. IPCC. 2006. Guidelines for National Greenhouse Gas Inventories: Intergovernmental
Panel on Climate Change. Jacinthe, P.A. and Dick, W.A. 1997. Soil management and nitrous oxide emissions from
cultivated fields in southern Ohio. Soil & Tillage Research 41:221-235. Jacinthe, P.A., Dick, W.A. and Brown, L.C. 2000. Bioremediation of nitrate-
contaminated shallow soils and waters via water table management techniques: evolution and release of nitrous oxide. Soil Biology and Biochemistry 32:371-382.
Jacinthe, P.A., Dick, W.A. and Owens, L.B. 2002. Overwinter soil denitrification activity
and mineral nitrogen pools as affected by management practices. Biology of Fertilized Soils 36:1-9.
Jacinthe, P.A., Bills, J.S., Tedesco, L.P. and Barr, R.C. 2012. Nitrous oxide emission
from riparian buffers in relation to vegetation and flood frequency. Journal of Environmental Quality 41:95-105.
Johnson, C.J., Bonrud, P.A., Dosch, T.L., Kilness, A.W., Senger, K.A., Busch, D.C. and
Meyer, M.R. 1987. Fatal outcome of methemoglobinemia in an infant. Journal of the American Medical Association 257:2796-2797.
84
Keller, M. and Reiners, W.A. 1994. Soil-atmosphere exchange of nitrous oxide, nitric oxide, and methane under secondary succession of pasture to forest in the Atlantic lowlands of Costa Rica. Global Biogeochemical Cycles 8:399-409.
Klocke, N.L., Watts, D.G., Schneekloth, J.P., Davison, D.R., Todd, R.W. and Parkhurst,
A.M. 1999. Nitrate leaching in irrigated corn and soybean in a semi-arid climate. Transactions of the American Society of Agricultural Engineers 42: 1621-1630.
Letey, J., Valoras, N., Hadas, A. and Focht, D.D. 1980. Effect of air-filled porosity,
nitrate concentration, and time on the ratio N2O/N2 during denitrification. Journal of Environmental Quality 9:227-231.
Littell, R.C. 1989. Statistical analysis of experiments with repeated measurements.
HortScience 24:37-40. McLain, J.E.T. and Martens, D.A. 2006. Moisture controls on trace gase fluxes in semi-
arid riparian soils. Soil Science Society of America Journal 70:367-377. Mosier, A., Kroeze, C., Nevison, C., Onema, O., Seitzinger, S. and van Cleemput, O.
1998. Closing the global N2O budget: nitrous oxide emissions through the agricultural nitrogen cycle. Nutrient Cycling in Agroecosystems 52:225-248.
Osbourne, L.L. and Kovacic, D.A. 1993. Riparian vegetated buffer strips in water-quality
restoration and stream management. Freshwater Biology 29:243-258. Owens, L.B., W. M. Edwards and Shipitalo, M.J. . 1995. Nitrate leaching through
lysimeters in a corn-soybean rotation. Soil Science Society American Journal 59:902-907.
Parkin, T.B. and Meisinger, J. 1989. Denitrification below the crop rooting zone as
influenced by surface tillage. Journal of Environmental Quality 24:360-366. Pfenning, K.S. and McMahon, P.B. 1996. Effect of nitrate, organic carbon, and
temperature on potential denitrification rates in nitrate-rich riverbed sediments. Journal of Hydrology 187:283-295.
Pikul, P.L., Jr., Zuzal, J.F. and Greenwalt, R.N. 1986. Formation of soil frost as
influenced by tillage and residue management. Journal of Soil and Water Conservation 41:196-199.
Simek, M., Jisova, L. and Hopkins, D.W. 2002. What is the so-called optimum pH for
denitrification in soil? Soil Biology and Biochemistry 34:1227-1234. Schipper, L.A., Cooper, A.B., Harfoot, C.G. and Dyck, W.J. 1993. Regulators of
denitrification in an organic riparian soil. Soil Biology and Biochemistry 25:925-933.
85
SCS. 1978. Soil Survey of Hancock County, Indiana. USDA Soil Conservation Service, National Cooperative Soil Survey.
Smith, K.A., Ball, T., Conen, F., Dobbie, K.E., Massheder, J. and Rey, A. 2003.
Exchange of greenhouse gases between soil and atmosphere: interactions of soil and physical factors and biological processes. European Journal of Soil Science 54:779-791.
Smith, K.A., Thomson, P.E., Clayton, H., McTaggart, I.P. and Conen, F. 1998. Effects of
temperature, water content and nitrogen fertilization on emissions of nitrous oxide by soils. Atmospheric Environment 32:3301-3309.
Smith, M.S. and Tiedje, J.M. 1979. Phases of denitrification following oxygen depletion
in soil. Soil Biology and Biochemistry 11:261-267. Stehfest, E. and Bouwman L. 2006. N2O and NO emission from agricultural fields and
soils under natural vegetation: summarizing available measurement data and modeling of global annual emissions. Nutrient Cycling in Agroecosystems 74:207-228.
Tiedje, J.M. 1988. Ecology of denitrification and dissimilatory nitrate reduction to
ammonium. In: Biology of Anaerobic Microorganisms (ed. A.J.B. Zehnder), pp. 179-244. John Wiley & Sons, New York.
Triska, F.J., Duff, J.H. and Avanzino, R.J. 1993. The role of water exchange between a
stream channel and its hyporheic zone in nitrogen cycling at the terrestrial-aquatic interface. Hydrobiologia 251:167-184.
U.S. Energy Information Administration. 2009. Emissions of greenhouse gases in the
United States 2008. pp. 35-37. U.S. Department of Energy, Washington, D.C. U.S. Environmental Protection Agency. 2009. Inventory of U.S. greenhouse gas
emissions and sinks: 1990-2007. Vilain, G., Garnier, J., Gaelle, T. and Cellier, P. 2010. Effect of slope and land use on
nitrous oxide (N2O) emissions (Seine Basin, France). Agricultural and Forest Meteorology 150:1192-1202.
Vought, L.B.M., Pinay, G., Fuglsang, A. and Ruffinoni, C. 1995. Structure and function
of buffer strips from a water quality perspective in agricultural landscapes. Lanscape and Urban Planning 31:323-331.
Weitz, A.M., Linder, E., Frolking, S., Crill, P.M. and Keller, M. 2001. N2O emissions
from humid tropical agricultural soils: effects of soil moisture, texture and nitrogen availability. Soil Biology and Biochemistry 33:1077-1093.

86
Yamulki, S., Harrison, R.M., Goulding, K.W.T. and Webster, C.P. 1997. N2O, NO and NO2 fluxes from a grassland: Effect of soil pH. Soil Biology and Biochemistry 29:1199-1208.
Yanai, J., Sawamoto, T., Oe, T., Kusa, K., Yamakawa, K., Sakamoto, K., Naganawa, T.,
Inubushi, K., Hatano, R. and Kosaki, T. 2003. Spatial variability of nitrous oxide emissions and their soil-related factors in an agricultural field. Journal of Environmental Quality 32: 1965-1977.
CURRICULUM VITAE
Katelin Rose Fisher
Education M.S. Geology, Indiana University-Purdue University, Indianapolis, IN August 2013 B.S. Geology, University of Pittsburgh, Pittsburgh, PA May 2009 Professional Experience Physical Science Technician, United States Department of Agriculture-Agricultural
Research Servcie-National Soil Erosion Research Laboratory (USDA-ARS-NSERL), West Lafayette, IN July 2011 – Present
Research Assistant, Department of Earth Sciences, Indiana University-Purdue University,
Indianapolis, IN August 2009 – July 2011 Conference presentations Baker M., Jacinthe P.A., Vidon P., Panunto M., Fisher K., Liu X. 2012.
Hydrogeomorphic classification of riparian ecosystems in Central Indiana. AWRA Specialty Conference, Riparian Ecosystems, June 25-27, 2012, Denver, CO.
Panunto M., Baker M., Jacinthe P.A., Vidon P. 2012. River network path-dependence: effect of valley segment sequencing on floodplain hydroperiods. AWRA Specialty Conference, Riparian Ecosystems, June 25-27, 2012, Denver, CO.
Jacinthe P.A., Vidon P., Baker M., Liu X., Fisher K., Panunto M. 2012. Hydrogeomorphic controls of nitrous oxide fluxes in riparian buffers of Central Indiana. AWRA Specialty Conference, Riparian Ecosystems, June 25-27, 2012, Denver, CO.
Vidon, P., Jacinthe P.A., Baker M., Liu X., Fisher K., Panunto M. 2012. Landscape controls on multiple contaminant dynamics in riparian zones. AWRA Specialty Conference, Riparian Ecosystems, June 25-27, 2012, Denver, CO.
Vidon P., Jacinthe P.A., Baker M., Liu X., Fisher K., Panunto M. 2012. Multi-contaminant dynamics and pollution tradeoffs in a restored wetland-riparian zone system: 10 years later. BIOGEOMON conference. Northport, ME, July 2012.
Related Documents