Nitrogen Flux and Sources in the Mississippi River Basin by Donald A. Goolsby, William A. Battaglin, Brent T. Aulenbach, and Richard P. Hooper ABSTRACT Nitrogen from the Mississippi River Basin is believed to be at least partly responsible for the large zone of oxygen-depleted water that develops in the Gulf of Mexico each summer. Historical data show that concentrations of nitrate in the Mississippi River and some of its tributaries have increased by factors of 2 to more than 5 since the early 1900s. We have used the historical streamflow and concentration data in regression models to estimate the annual flux of nitrogen (N) to the Gulf of Mexico and to determine where the nitrogen originates within the Mississippi Basin. Results show that for 1980- 96 the mean annual total N flux to the Gulf of Mexico was 1,568,000 metric tons per year (t/yr). The flux was about 61% nitrate as N, 37% organic N, and 2% ammonium as N. The flux of nitrate to the Gulf has approximately tripled in the last 30 years with most of the increase occurring between 1970 and 1983. The mean annual N flux has changed little since the early 1980s, but large year-to-year variations in N flux occur because of variations in precipitation. During wet years the N flux can increase by 50 percent or more due to flushing of nitrate that has accumulated in the soils and unsaturated zones in the basin. The principal source areas of N are basins in southern Minnesota, Iowa, Illinois, Indiana, and Ohio that drain agricultural land. Basins in this region yield 800 to more than 3,100 kilograms total N per square kilometer per year (kg/km 2 /yr) to streams, several times the N yield of basins outside this region. Assuming conservative transport of N, streams draining Iowa and Illinois contribute on average about 35% of the total N discharged by the Mississippi River to the Gulf of Mexico. In years with high precipitation they can contribute a larger percentage. INTRODUCTION The Mississippi and Atchafalaya Rivers are the primary riverine sources of freshwater and nutrients discharged to the Gulf of Mexico. The combined mean annual streamflow for the Mis- sissippi and Atchafalaya Rivers since 1980 is nearly 22,000 cubic meters per second and represents about 80 percent of the estimated freshwater discharge from the United States to the Gulf (Dunn, 1996). These two rivers also account for an estimated 90 percent of total nitrogen (N) flux discharged annually to the Gulf (Dunn, 1996). Nitrogen along with other nutrients leads to increased production of algae in the Gulf and has been implicated as a possible cause of hypoxia (dissolved oxygen less than 2 milligrams per liter) in a large zone of bottom water in the Gulf along the Louisiana-Texas coast ( Rabalais and others, 1996, 1998). The seasonal decrease in dissolved oxygen develops each year during late spring following inflows of freshwater and nutrients to the Gulf. Hypoxia reaches a maximum in late summer and disappears each fall. Estimates of the size of the hypoxic zone during 1985-1992 averaged about 7,000-9,000 square kilometers (km 2 ). Following the 1993 Mississippi River flood, the hypoxic zone doubled to about 17,000 km 2 , an area twice the size of Chesapeake Bay. In the summers of 1994- 97, the hypoxic zone was reported to be as large as or larger than during the summer of 1993 (Rabalais and others, 1998; Rabalais, 1997). Because of the public concern that has developed over the hypoxia issue, the White House Committee on Environment and Natural Resources (CENR) was asked in 1997 to conduct a scientific assessment of the causes and

Welcome message from author
This document is posted to help you gain knowledge. Please leave a comment to let me know what you think about it! Share it to your friends and learn new things together.
Transcript
Nitrogen Flux and Sources in the Mississippi River Basin by Donald A. Goolsby, William A. Battaglin, Brent T. Aulenbach, and Richard P. Hooper
ABSTRACT
Nitrogen from the Mississippi River Basin is believed to be at least partly responsible for the large zone of oxygen-depleted water that develops in the Gulf of Mexico each summer. Historical data show that concentrations of nitrate in the Mississippi River and some of its tributaries have increased by factors of 2 to more than 5 since the early 1900s. We have used the historical streamflow and concentration data in regression models to estimate the annual flux of nitrogen (N) to the Gulf of Mexico and to determine where the nitrogen originates within the Mississippi Basin. Results show that for 1980-96 the mean annual total N flux to the Gulf of Mexico was 1,568,000 metric tons per year (t/yr). The flux was about 61% nitrate as N, 37% organic N, and 2% ammonium as N. The flux of nitrate to the Gulf has approximately tripled in the last 30 years with most of the increase occurring between 1970 and 1983. The mean annual N flux has changed little since the early 1980s, but large year-to-year variations in N flux occur because of variations in precipitation. During wet years the N flux can increase by 50 percent or more due to flushing of nitrate that has accumulated in the soils and unsaturated zones in the basin. The principal source areas of N are basins in southern Minnesota, Iowa, Illinois, Indiana, and Ohio that drain agricultural land. Basins in this region yield 800 to more than 3,100 kilograms total N per square kilometer per year (kg/km2/yr) to streams, several times the N yield of basins outside this region. Assuming conservative transport of N, streams draining Iowa and Illinois contribute on average about 35% of the total N discharged by the Mississippi River to the Gulf of Mexico. In years with high precipitation they can contribute a larger percentage.
INTRODUCTION
The Mississippi and Atchafalaya Rivers are the primary riverine sources of freshwater and nutrients discharged to the Gulf of Mexico. The combined mean annual streamflow for the Mis-sissippi and Atchafalaya Rivers since 1980 is nearly 22,000 cubic meters per second and represents about 80 percent of the estimated freshwater discharge from the United States to the Gulf (Dunn, 1996). These two rivers also account for an estimated 90 percent of total nitrogen (N) flux discharged annually to the Gulf (Dunn, 1996). Nitrogen along with other nutrients leads to increased production of algae in the Gulf and has been implicated as a possible cause of hypoxia (dissolved oxygen less than 2 milligrams per liter) in a large zone of bottom water in the Gulf along the Louisiana-Texas coast ( Rabalais and others, 1996, 1998). The seasonal decrease in
dissolved oxygen develops each year during late spring following inflows of freshwater and nutrients to the Gulf. Hypoxia reaches a maximum in late summer and disappears each fall. Estimates of the size of the hypoxic zone during 1985-1992 averaged about 7,000-9,000 square kilometers (km2). Following the 1993 Mississippi River flood, the hypoxic zone doubled to about 17,000 km2, an area twice the size of Chesapeake Bay. In the summers of 1994-97, the hypoxic zone was reported to be as large as or larger than during the summer of 1993 (Rabalais and others, 1998; Rabalais, 1997).
Because of the public concern that has developed over the hypoxia issue, the White House Committee on Environment and Natural Resources (CENR) was asked in 1997 to conduct a scientific assessment of the causes and
consequences of Gulf of Mexico hypoxia, and to identify gaps in the understanding of this problem. As part of this assessment, the U.S. Geological Survey was asked to estimate the flux and sources of nutrients (nitrogen, phosphorus, and silica) entering the Gulf of Mexico from the MARB, and to determine which human activities are most significant in contributing these nutrients. This paper presents a summary of the flux and sources of nitrogen entering the Gulf from the MARB.
METHODS
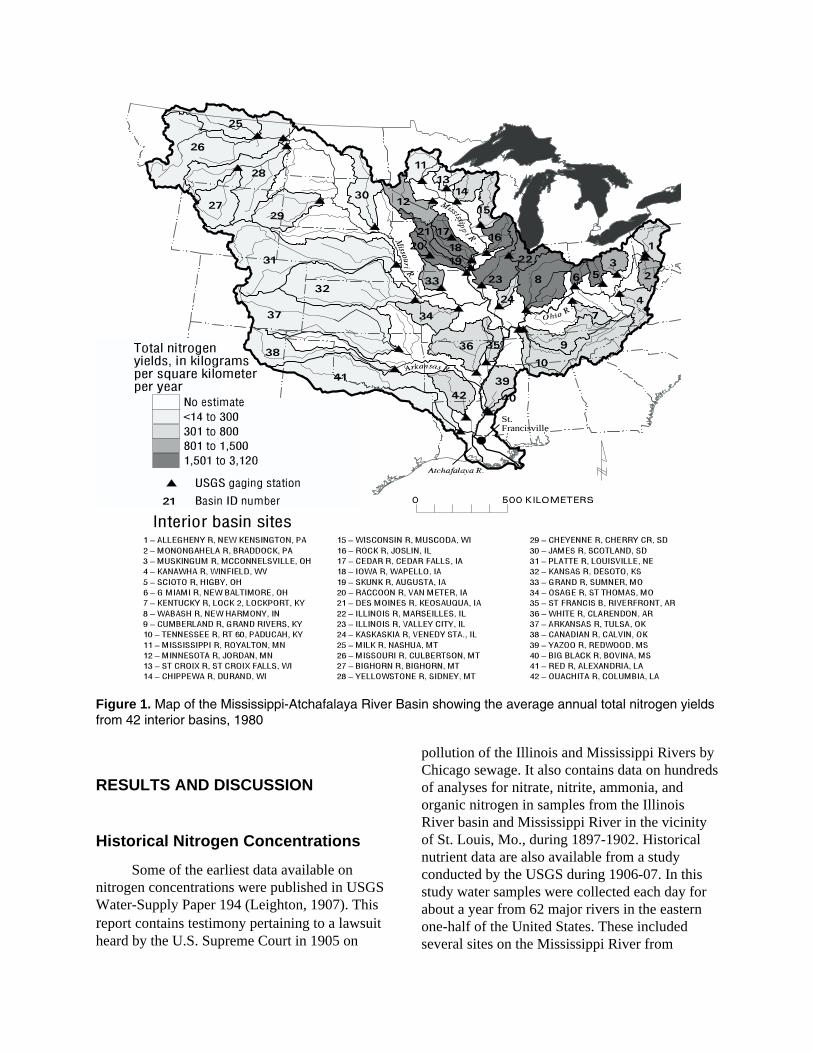
Historical data on streamflow and concentrations of dissolved nitrite plus nitrate as nitrogen (hereafter nitrate) and total N (total organic N plus ammonium plus nitrate) were used in regression models to estimate the daily and annual flux of nitrogen from the Mississippi-Atchafalaya River Basin (MARB) to the Gulf of Mexico. Nitrate concentrations have been measured numerous times each year since 1955, and total N concentrations have been measured since 1975 in the lower Mississippi River at St Francisville, La. To determine the source areas of the nitrogen transported to the Gulf, regression models were also developed for 42 smaller interior basins within the MARB (figure 1). These 42 basins, in aggregate, comprise about 70 percent of the MARB. Nitrate and total N fluxes were estimated for these basins for the period 1980 to 1996.
Regression model structure
Multiple regression models were developed to relate the flux of nitrate and total N to stream discharge. Consistent with many past studies (e.g., Cohn and others, 1992), a seven-parameter model was developed of the form:
ln[Φ] = β0 + β1 ln[QQ
] + β2 ln[QQ
]
2
+ β3[T − T ]
+β4[T − T ]2 + β5 sin[2πT ] + β6 cos[2πT ] + ε
where: ln [ ]is the natural logarithm of the
argument in brackets;
Φ is the flux of the solute (C•Q ) ; C is the solute concentration; Q is the daily average streamflow; Q is a centering term (a constant) to
ensure that the linear and quadratic flow terms are independent;
T is time, expressed in decimal years; T is a centering term (a constant) to ensure
that the linear and quadratic time terms are independent;
ε is the error term; and β0...β6 are the fitted parameters in the
multiple regression model. This model captures the dependence of
concentration on discharge, season (the sine and cosine terms), and any long-term trend. Quadratic terms were included to account for curvature that remained after transformation. Model parameters were estimated using the SAS system (SAS Institute Inc., 1990). Standard diagnostics (e.g., plots of observed vs. predicted values, and various residual plots) were calculated and examined for all models. All terms were retained in the models, even if the model parameters were not significant, to simplify calculation of models across all sites and solutes. Daily streamflow was not measured at sites 17 and 21 (fig. 1) and streamflow from a nearby gaging station was used in the regression model to estimate nutrient flux. For six sites (4, 27, 35,36, 39, and 42, fig. 1), continuous measurement of streamflow was not available. For these sites, the annual flux was estimated using the average of the instantaneous discharge measurements made when samples were collected and flow-weighted average nutrient concentrations.
Daily fluxes estimated from the models were summed over time to provide annual and long-term average flux estimates from the 42 basins and to the Gulf of Mexico. Nutrient yields (mass per unit area per unit time) were calculated for each basin by dividing the annual fluxes by the basin drainage area. This normalized the fluxes so that comparisons could be made among basins.
St.Francisville
Figure 1. Map of the Mississippi-Atchafalaya River Basin showing the average annual total nitrogen yields from 42 interior basins, 1980
RESULTS AND DISCUSSION
Historical Nitrogen Concentrations
Some of the earliest data available on nitrogen concentrations were published in USGS Water-Supply Paper 194 (Leighton, 1907). This report contains testimony pertaining to a lawsuit heard by the U.S. Supreme Court in 1905 on
pollution of the Illinois and Mississippi Rivers by Chicago sewage. It also contains data on hundreds of analyses for nitrate, nitrite, ammonia, and organic nitrogen in samples from the Illinois River basin and Mississippi River in the vicinity of St. Louis, Mo., during 1897-1902. Historical nutrient data are also available from a study conducted by the USGS during 1906-07. In this study water samples were collected each day for about a year from 62 major rivers in the eastern one-half of the United States. These included several sites on the Mississippi River from
Minneapolis, Minn. to New Orleans, La., and sites on rivers in Arkansas, Illinois, Indiana, Iowa, Minnesota, Ohio, and Pennsylvania. The daily samples were composited at about 10-day intervals and analyzed for numerous solutes, including nitrate. Results of these analyses have been published in at least two USGS reports (Dole, 1909; Clarke, 1924). The USGS National Water Information System database provided additional data on nitrate concentrations in the Mississippi River and for several rivers in Iowa for 1944 to1996.
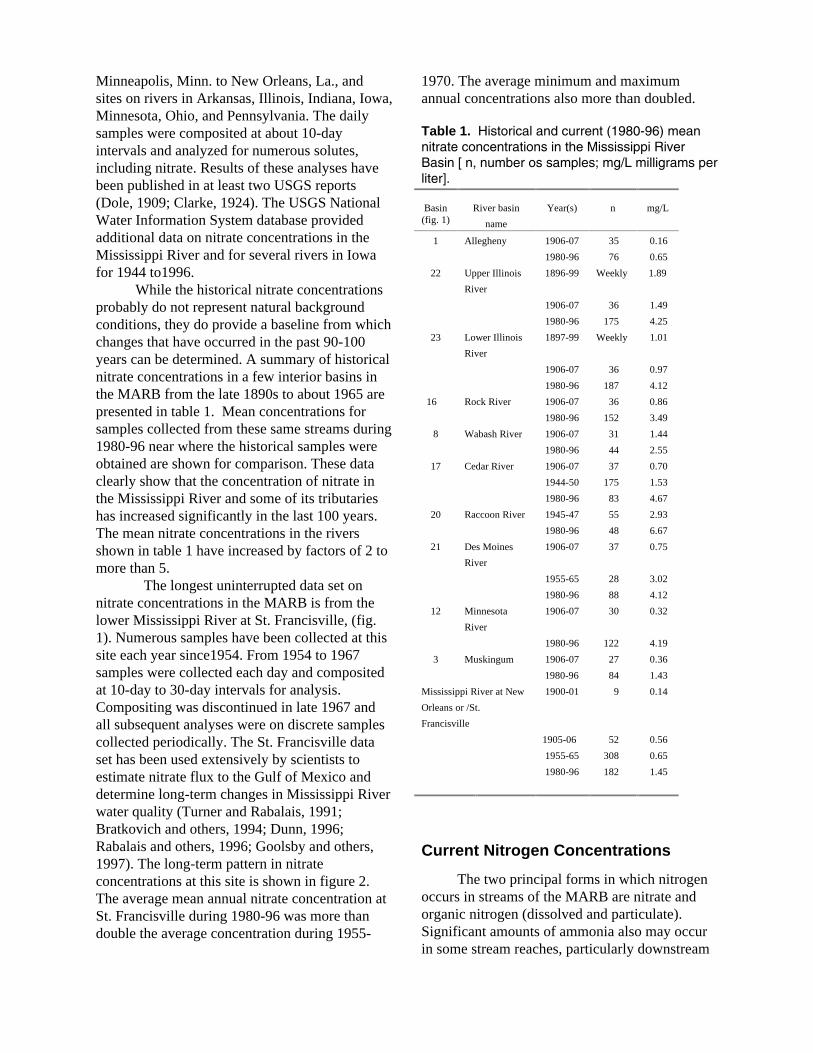
While the historical nitrate concentrations probably do not represent natural background conditions, they do provide a baseline from which changes that have occurred in the past 90-100 years can be determined. A summary of historical nitrate concentrations in a few interior basins in the MARB from the late 1890s to about 1965 are presented in table 1. Mean concentrations for samples collected from these same streams during 1980-96 near where the historical samples were obtained are shown for comparison. These data clearly show that the concentration of nitrate in the Mississippi River and some of its tributaries has increased significantly in the last 100 years. The mean nitrate concentrations in the rivers shown in table 1 have increased by factors of 2 to more than 5.
The longest uninterrupted data set on nitrate concentrations in the MARB is from the lower Mississippi River at St. Francisville, (fig. 1). Numerous samples have been collected at this site each year since1954. From 1954 to 1967 samples were collected each day and composited at 10-day to 30-day intervals for analysis. Compositing was discontinued in late 1967 and all subsequent analyses were on discrete samples collected periodically. The St. Francisville data set has been used extensively by scientists to estimate nitrate flux to the Gulf of Mexico and determine long-term changes in Mississippi River water quality (Turner and Rabalais, 1991; Bratkovich and others, 1994; Dunn, 1996; Rabalais and others, 1996; Goolsby and others, 1997). The long-term pattern in nitrate concentrations at this site is shown in figure 2. The average mean annual nitrate concentration at St. Francisville during 1980-96 was more than double the average concentration during 1955-
1970. The average minimum and maximum annual concentrations also more than doubled.
Table 1. Historical and current (1980-96) mean nitrate concentrations in the Mississippi River Basin [ n, number os samples; mg/L milligrams per liter].
Basin (fig. 1)
River basin
name
Year(s) n mg/L
1 Allegheny 1906-07 35 0.16
1980-96 76 0.65
22 Upper Illinois
River
1896-99 Weekly 1.89
1906-07 36 1.49
1980-96 175 4.25
23 Lower Illinois
River
1897-99 Weekly 1.01
1906-07 36 0.97
1980-96 187 4.12
16 Rock River 1906-07 36 0.86
1980-96 152 3.49
8 Wabash River 1906-07 31 1.44
1980-96 44 2.55
17 Cedar River 1906-07 37 0.70
1944-50 175 1.53
1980-96 83 4.67
20 Raccoon River 1945-47 55 2.93
1980-96 48 6.67
21 Des Moines
River
1906-07 37 0.75
1955-65 28 3.02
1980-96 88 4.12
12 Minnesota
River
1906-07 30 0.32
1980-96 122 4.19
3 Muskingum 1906-07 27 0.36
1980-96 84 1.43
Mississippi River at New
Orleans or /St.
Francisville
1900-01 9 0.14
1905-06 52 0.56
1955-65 308 0.65
1980-96 182 1.45
Current Nitrogen Concentrations
The two principal forms in which nitrogen occurs in streams of the MARB are nitrate and organic nitrogen (dissolved and particulate). Significant amounts of ammonia also may occur in some stream reaches, particularly downstream
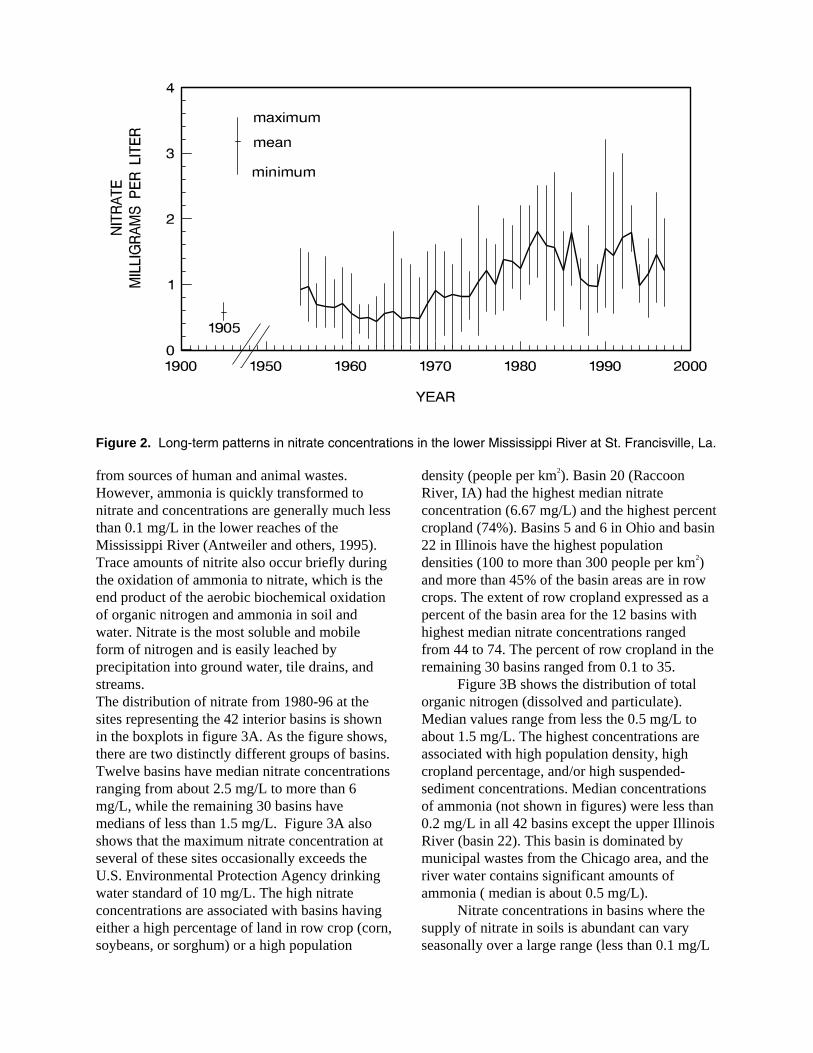
Figure 2. Long-term patterns in nitrate concentrations in the lower Mississippi River at St. Francisville, La.
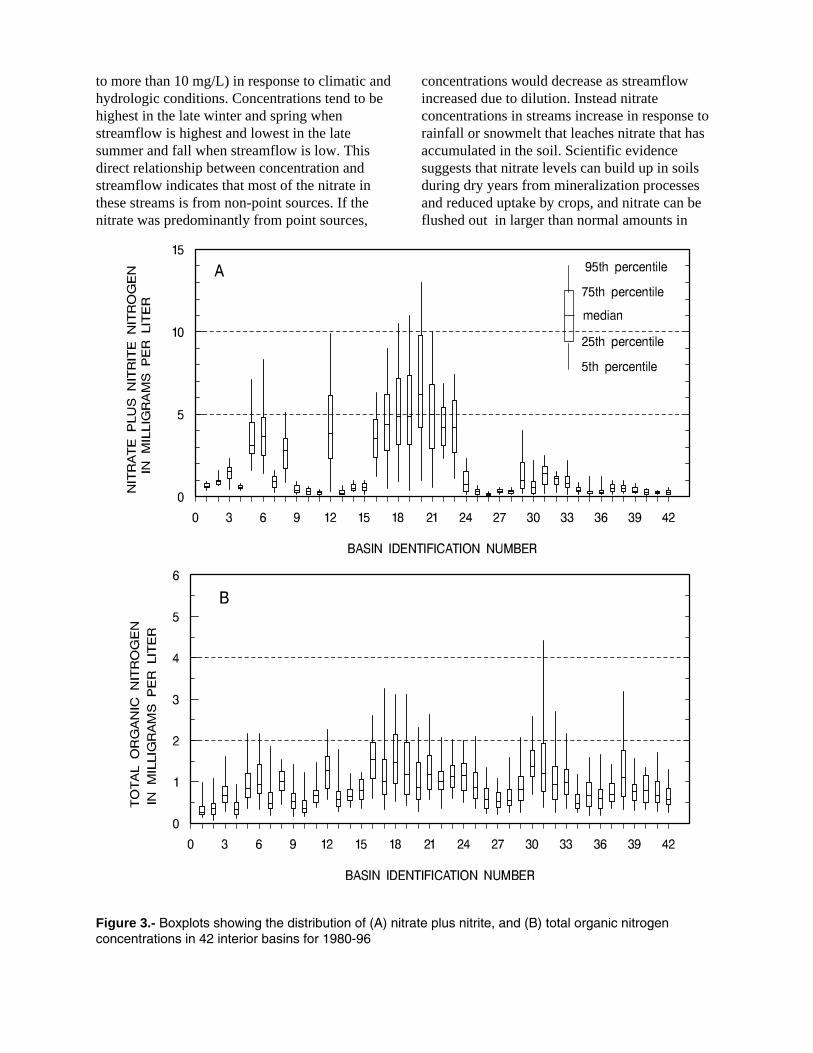
from sources of human and animal wastes. However, ammonia is quickly transformed to nitrate and concentrations are generally much less than 0.1 mg/L in the lower reaches of the Mississippi River (Antweiler and others, 1995). Trace amounts of nitrite also occur briefly during the oxidation of ammonia to nitrate, which is the end product of the aerobic biochemical oxidation of organic nitrogen and ammonia in soil and water. Nitrate is the most soluble and mobile form of nitrogen and is easily leached by precipitation into ground water, tile drains, and streams. The distribution of nitrate from 1980-96 at the sites representing the 42 interior basins is shown in the boxplots in figure 3A. As the figure shows, there are two distinctly different groups of basins. Twelve basins have median nitrate concentrations ranging from about 2.5 mg/L to more than 6 mg/L, while the remaining 30 basins have medians of less than 1.5 mg/L. Figure 3A also shows that the maximum nitrate concentration at several of these sites occasionally exceeds the U.S. Environmental Protection Agency drinking water standard of 10 mg/L. The high nitrate concentrations are associated with basins having either a high percentage of land in row crop (corn, soybeans, or sorghum) or a high population
density (people per km2). Basin 20 (Raccoon River, IA) had the highest median nitrate concentration (6.67 mg/L) and the highest percent cropland (74%). Basins 5 and 6 in Ohio and basin 22 in Illinois have the highest population densities (100 to more than 300 people per km2) and more than 45% of the basin areas are in row crops. The extent of row cropland expressed as a percent of the basin area for the 12 basins with highest median nitrate concentrations ranged from 44 to 74. The percent of row cropland in the remaining 30 basins ranged from 0.1 to 35.
Figure 3B shows the distribution of total organic nitrogen (dissolved and particulate). Median values range from less the 0.5 mg/L to about 1.5 mg/L. The highest concentrations are associated with high population density, high cropland percentage, and/or high suspended-sediment concentrations. Median concentrations of ammonia (not shown in figures) were less than 0.2 mg/L in all 42 basins except the upper Illinois River (basin 22). This basin is dominated by municipal wastes from the Chicago area, and the river water contains significant amounts of ammonia ( median is about 0.5 mg/L).
Nitrate concentrations in basins where the supply of nitrate in soils is abundant can vary seasonally over a large range (less than 0.1 mg/L
to more than 10 mg/L) in response to climatic and hydrologic conditions. Concentrations tend to be highest in the late winter and spring when streamflow is highest and lowest in the late summer and fall when streamflow is low. This direct relationship between concentration and streamflow indicates that most of the nitrate in these streams is from non-point sources. If the nitrate was predominantly from point sources,
concentrations would decrease as streamflow increased due to dilution. Instead nitrate concentrations in streams increase in response to rainfall or snowmelt that leaches nitrate that has accumulated in the soil. Scientific evidence suggests that nitrate levels can build up in soils during dry years from mineralization processes and reduced uptake by crops, and nitrate can be flushed out in larger than normal amounts in
Figure 3.- Boxplots showing the distribution of (A) nitrate plus nitrite, and (B) total organic nitrogen concentrations in 42 interior basins for 1980-96
succeeding wet years (Randall and others, 1997). Nitrate can enter streams through agricultural drains, ground-water discharge, and direct runoff. Nitrate concentrations generally decrease in the summer and fall as streamflow and agricultural drainage decrease. Assimilation of nitrate by agricultural crops on the land and aquatic plants in streams also aids in decreasing the nitrate concentrations in streams during summer months.
Agricultural drainage plays a major role in transporting nitrate from cropland to streams in the MARB. More than 50 million acres, mostly cropland, have been drained through use of tiles, ditches, and streams in Illinois, Indiana, Iowa, Ohio, Minnesota, Missouri, and Wisconsin (USDA, 1987). This practice “short-circuits” the flow of water by draining the top of the saturated zone directly into streams, and eventually the Mississippi River. This drainage practice can result in the leaching of large amounts of nitrate that are stored in the soil zone and unsaturated zone. Nitrate concentrations in agricultural drains can be very high -- 20-40 mg/L N or more (Fenelon, 1998; Gentry and others, 1998; Zucker and Brown, 1998; David and others, 1997; Randall and others, 1997).
Flux of Nitrogen to the Gulf of Mexico
The mean annual flux of nitrogen compounds from the MARB to the Gulf of Mexico for 1980-96 is summarized in table 2. This period includes the drought of 1988-89 when fluxes were very low and the flood of 1993 when the flux was very high. The mean annual flux of all forms of nitrogen was 1,568,000 (t/yr). This is within 2% of the flux estimate of 1,597,000 t/yr by Dunn (1996) for 1972-93 and about 14% less than the 1982-87 estimate of 1,824,000 t/yr made by Turner and Rabalais (1991). About three-quarters of the nitrogen flux from the MARB enters the Gulf of Mexico via the Mississippi River channel and the remainder discharges through the Atchafalaya River. However, nearly all of the nitrogen discharging from the Atchafalaya River is diverted into the Atchafalaya from the Mississippi River in northern Louisiana. The
total N flux is about 61% nitrate, 2% ammonia and the remaining 37% is dissolved and particulate organic nitrogen. The flux of ammonia and the fraction of organic nitrogen present in dissolved and particulate forms was estimated from concentration data.
Table 2. Mean annual flux of nitrogen from the Mississippi-Atchafalaya River Basin to the Gulf of Mexico, 1980-96.
Nitrogen species Metric tons
Percent of
total
Standard error of estimate
Metric % of tons mean
Nitrate 953,000 61 37,030 3.9
Ammonium 31,000 2 -- --
Dissolved organic N 378,000 24 -- --
Particulate organic N 206,000 13 -- --
Total N 1,568,000 100 58,500 3.7
The annual flux of nitrate to the Gulf
increased significantly over the period 1955-96 as shown in figure 4. This increase in flux parallels the increase in concentration shown in figure 2. A Kendall’s tau test for trend (Helsel and Hirsch, 1992) shows the increase in nitrate flux to be highly significant (p <0.001), with a trend slope of about 19,000 t/yr. During 1955-70 nitrate flux averaged 328,000 t/yr. However, during 1980-96 the nitrate flux averaged 952,700 t/yr, almost a 3-fold increase. Nearly all of this increase occurred between 1970 and 1983. There is no statistically significant trend, upward or downward, in nitrate from 1980 to 1996, even if the flood year of 1993 is removed.
All of the increase in total N that has occurred since 1972 (figure 4) can be attributed to the increase in nitrate. The large year to year differences in flux are caused by variations in streamflow. The flux of nitrate was relatively low during the drought years of 1988-89 (500,000-600,000 t), but was high (>1,500,000 t) during the flood year of 1993. Nitrate flux was also high during 1979 and during 1982-86 when streamflow was abnormally high.
It should also be noted that streamflow in the MARB generally increased during the 1955-96 period (figure 4) and this could account for part of the increase in nitrate flux. The average
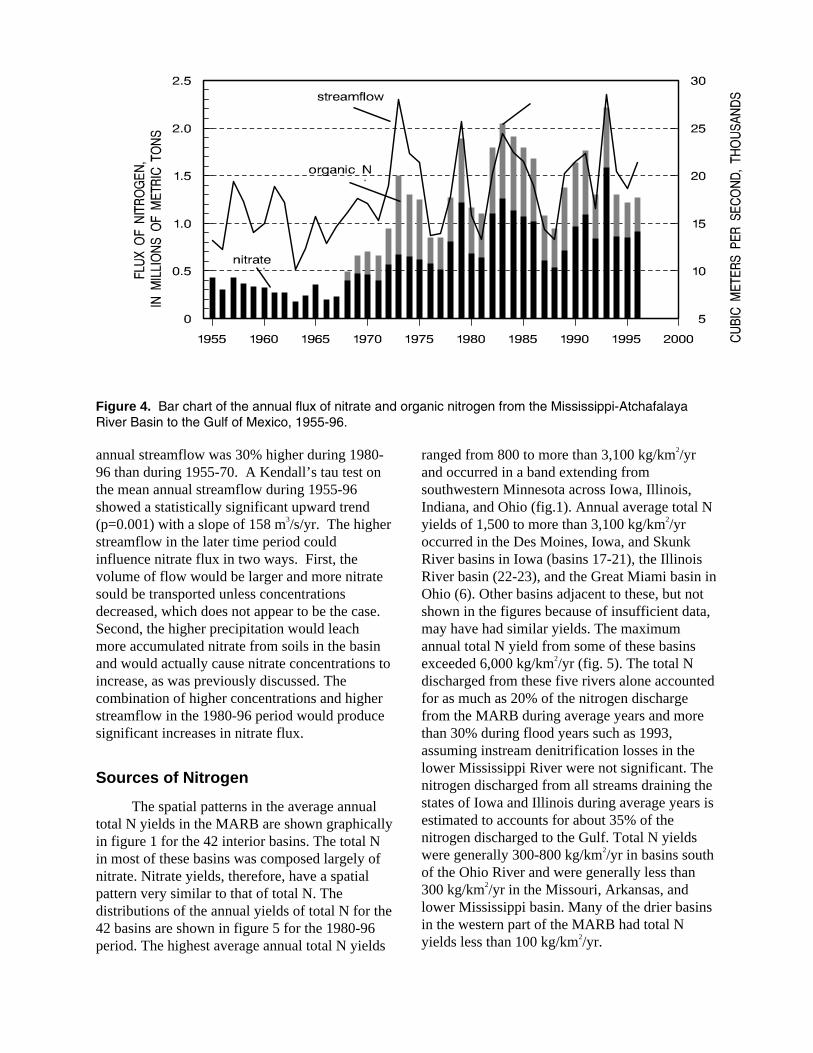
Figure 4. Bar chart of the annual flux of nitrate and organic nitrogen from the Mississippi-Atchafalaya River Basin to the Gulf of Mexico, 1955-96.
annual streamflow was 30% higher during 1980-96 than during 1955-70. A Kendall’s tau test on the mean annual streamflow during 1955-96 showed a statistically significant upward trend (p=0.001) with a slope of 158 m3/s/yr. The higher streamflow in the later time period could influence nitrate flux in two ways. First, the volume of flow would be larger and more nitrate sould be transported unless concentrations decreased, which does not appear to be the case. Second, the higher precipitation would leach more accumulated nitrate from soils in the basin and would actually cause nitrate concentrations to increase, as was previously discussed. The combination of higher concentrations and higher streamflow in the 1980-96 period would produce significant increases in nitrate flux.
Sources of Nitrogen
The spatial patterns in the average annual total N yields in the MARB are shown graphically in figure 1 for the 42 interior basins. The total N in most of these basins was composed largely of nitrate. Nitrate yields, therefore, have a spatial pattern very similar to that of total N. The distributions of the annual yields of total N for the 42 basins are shown in figure 5 for the 1980-96 period. The highest average annual total N yields
ranged from 800 to more than 3,100 kg/km2/yr and occurred in a band extending from southwestern Minnesota across Iowa, Illinois, Indiana, and Ohio (fig.1). Annual average total N yields of 1,500 to more than 3,100 kg/km2/yr occurred in the Des Moines, Iowa, and Skunk River basins in Iowa (basins 17-21), the Illinois River basin (22-23), and the Great Miami basin in Ohio (6). Other basins adjacent to these, but not shown in the figures because of insufficient data, may have had similar yields. The maximum annual total N yield from some of these basins exceeded 6,000 kg/km2/yr (fig. 5). The total N discharged from these five rivers alone accounted for as much as 20% of the nitrogen discharge from the MARB during average years and more than 30% during flood years such as 1993, assuming instream denitrification losses in the lower Mississippi River were not significant. The nitrogen discharged from all streams draining the states of Iowa and Illinois during average years is estimated to accounts for about 35% of the nitrogen discharged to the Gulf. Total N yields were generally 300-800 kg/km2/yr in basins south of the Ohio River and were generally less than 300 kg/km2/yr in the Missouri, Arkansas, and lower Mississippi basin. Many of the drier basins in the western part of the MARB had total N yields less than 100 kg/km2/yr.
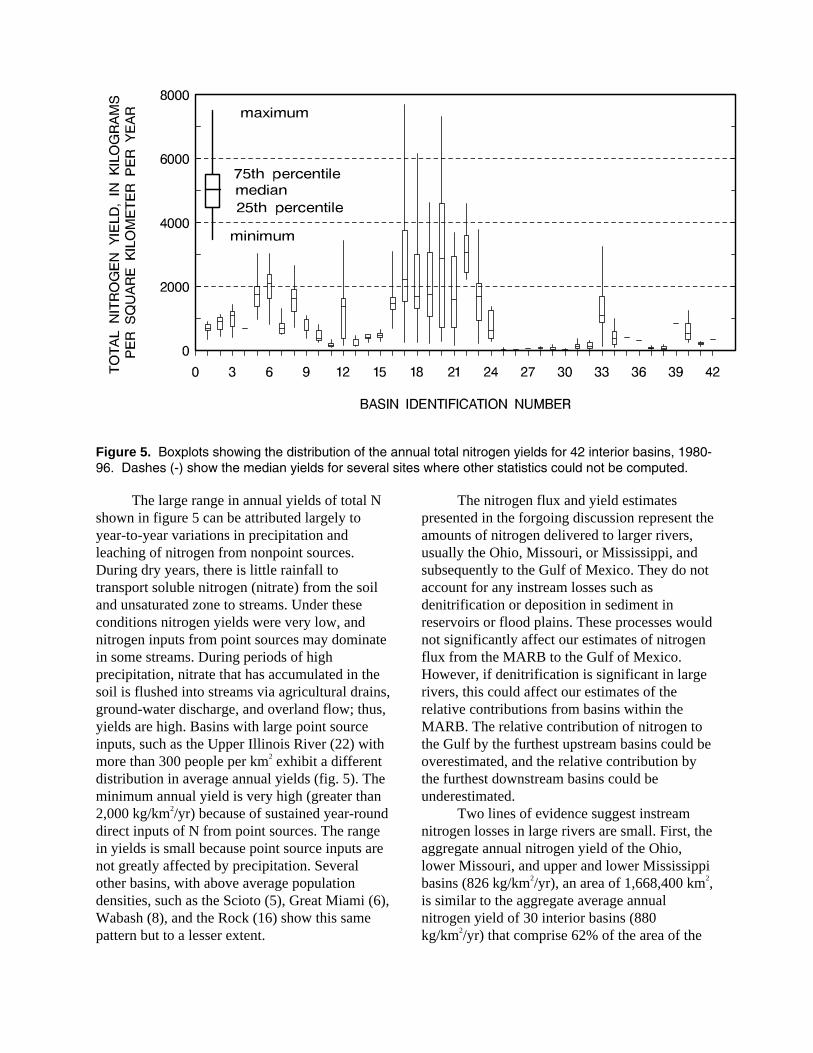
Figure 5. Boxplots showing the distribution of the annual total nitrogen yields for 42 interior basins, 1980-96. Dashes (-) show the median yields for several sites where other statistics could not be computed.
The large range in annual yields of total N shown in figure 5 can be attributed largely to year-to-year variations in precipitation and leaching of nitrogen from nonpoint sources. During dry years, there is little rainfall to transport soluble nitrogen (nitrate) from the soil and unsaturated zone to streams. Under these conditions nitrogen yields were very low, and nitrogen inputs from point sources may dominate in some streams. During periods of high precipitation, nitrate that has accumulated in the soil is flushed into streams via agricultural drains, ground-water discharge, and overland flow; thus, yields are high. Basins with large point source inputs, such as the Upper Illinois River (22) with more than 300 people per km2 exhibit a different distribution in average annual yields (fig. 5). The minimum annual yield is very high (greater than 2,000 kg/km2/yr) because of sustained year-round direct inputs of N from point sources. The range in yields is small because point source inputs are not greatly affected by precipitation. Several other basins, with above average population densities, such as the Scioto (5), Great Miami (6), Wabash (8), and the Rock (16) show this same pattern but to a lesser extent.
The nitrogen flux and yield estimates presented in the forgoing discussion represent the amounts of nitrogen delivered to larger rivers, usually the Ohio, Missouri, or Mississippi, and subsequently to the Gulf of Mexico. They do not account for any instream losses such as denitrification or deposition in sediment in reservoirs or flood plains. These processes would not significantly affect our estimates of nitrogen flux from the MARB to the Gulf of Mexico. However, if denitrification is significant in large rivers, this could affect our estimates of the relative contributions from basins within the MARB. The relative contribution of nitrogen to the Gulf by the furthest upstream basins could be overestimated, and the relative contribution by the furthest downstream basins could be underestimated.
Two lines of evidence suggest instream nitrogen losses in large rivers are small. First, the aggregate annual nitrogen yield of the Ohio, lower Missouri, and upper and lower Mississippi basins (826 kg/km2/yr), an area of 1,668,400 km2, is similar to the aggregate average annual nitrogen yield of 30 interior basins (880 kg/km2/yr) that comprise 62% of the area of the
large basins. The upper Missouri and Arkansas basins were excluded from this calculation because they contain reservoirs and have low precipitation rates and low nitrogen yields. This small difference in yields, about 6%, is well within the standard errors, and is an indication that no significant denitrification occurs between the outlets of the interior basins and the outlets of the large basins.
The second line of evidence is based on the results of a model that Howarth and others (1996) applied to rivers draining to the North Atlantic Ocean. The model relates nitrogen loss, which is largely denitrification, to the ratio of mean water depth to water residence time of rivers. The deeper the rivers are, the less time nitrate in the water column is in contact with benthic zones where denitrification could occur. They suggest that 5-20% of the nitrogen inputs to streams might be lost through denitrification in larger rivers. The large rivers in the MARB should be near the low end of these denitrification estimates. Short-term removal of nitrogen in algal and plant biomass should be accounted for in the long-term flux estimates if nitrogen is later released in dissolved or particulate forms. The above discussion suggests that most (>90%) of the nitrogen that enters the Ohio, lower Missouri, and Mississippi Rivers is eventually discharged to the Gulf of Mexico. Denitrification may result in significant losses of nitrogen in streams smaller and shallower than those used in this analysis. If this is true, then nitrogen yields in smaller watersheds could be significantly higher than those reported here for the 42 interior basins.
REFERENCES
Antweiler, R.C., D.A. Goolsby, and H.E. Taylor. 1995, Nutrients in the Mississippi River, in R. Meade, [ed.] Contaminants in the Mississippi River, 1987-92: U.S. Geological Survey Circular 1133, p. 73-86.
Bratkovich, A., S.P. Dinnel, and D.A. Goolsby,
1994, Variability and prediction of freshwater and nitrate fluxes for the Louisiana-Texas shelf: Mississippi and Atchafalaya River source functions: Estuaries v. 17(4), p.766-778.
Clarke, F.W. 1924. The composition of the river and lake waters of the United States: U.S. Geological Survey Professional Paper 135, 199 p.
Cohn, T.A., D.L. Caulder, E.J. Gilroy, L.D. Zynjuk, and R.M. Summers, 1992, The validity of a simple statistical model for estimating fluvial constituent loads: An empirical study involving nutrient loads entering Chesapeake Bay: Water Resources Research v. 28(9), p. 2352-2363.
David, M.B., L.E. Gentry, D.A. Kovacic, and
K.M. Smith, 1997, Nitrogen balance in and export from an agricultural watershed: Journal of Environmental Quality v. 26, p. 1038-1048.
Dole, R.B., 1909, The quality of surface waters in
the United States: Part I. -- Analysis of waters east of the one hundredth meridian: U.S. Geological Survey Water-Supply Paper 236, 123 p.
Dunn, D.D. 1996, Trends in nutrient inflows to
the Gulf of Mexico from streams draining the conterminous United States, 1972-93: U.S. Geological Survey Water-Resources Investigations Report 96-4113, 60 p.
Fenelon, J.M., 1998, Water quality in the White
River basin, Indiana, 1992-96: U.S. Geological Survey Circular 1150, 34 p.
Gentry, L.E., M.B. David, K.M. Smith, and D.A.
Kovacic, 1998, Nitrogen cycling and tile drainage nitrate loss in a corn/soybean watershed: Agricultural Ecosystems and Environment v. 68, p. 85-97.
Goolsby, D.A., W.A. Battaglin, and R.P. Hooper,
1997, Sources and transport of nitrogen in the Mississippi River Basin: American Farm Bureau Federation Workshop, St. Louis, Mo., 6 6 p. (online at: http://wwwrcolka.cr.usgs.gov/midconherb/st.louis.hypoxia.html)
Helsel, D.R., and R.M. Hirsch. 1992. Studies in
environmental science 49: Statistical methods in water resources: Elsevier Publishers, New York, 522 p.
Howarth, R.W., G. Billen, D. Swaney, A.
Townsend, N. Jaworski, K. Lajtha, J.A. Downing, R. Elmgren, N Caraco, T. Jordan, F. Berendse, J. Freney, V. Kudeyarov, P. Murdoch, and Z. Zhao-Liang, 1996, Regional nitrogen budgets and riverine N & P fluxes for the drainages to the North Atlantic Ocean: Natural and human influences: Biogeochemistry v. 35, p. 75-139.139.
Leighton, M.O., 1907, Pollution of Illinois and
Mississippi Rivers by Chicago sewage: A digest of the testimony taken in the case of the State of Missouri v. the State of Illinois and the Sanitary District of Chicago: U.S. Geological Survey Water-Supply and Irrigation Paper No. 194. 369 p.
Rabalais, N.N., R.E. Turner, W.J. Wiseman, and
Q. Dortch, 1998, Consequences of the 1993 Mississippi River Flood in the Gulf of Mexico. Regulated Rivers: Research and Management v. 14, p. 161-177.
Rabalais, N.N., R.E. Turner, Q. Dortch, W.J.
Wiseman, Jr., and B.K. Sen Gupta, 1996, Nutrient changes in the Mississippi River and system responses on the adjacent continental shelf: Estuaries v. 19 (28), p. 366-407.
Rabalais, N.N., 1997, Press release dated July 29,
1997: Louisiana Universities Consortium, Cocodrie, LA.
Randall, G.W., D.R. Huggins, M.P. Russelle, D.J.
Fuchs, W.W. Nelson, and J.L. Anderson, 1997, Nitrate losses through subsurface tile drainage in conservation reserve program, alfalfa, and row crop systems: Journal of Environmental Quality v. 26, p. 1240-1247.
SAS Institute Inc. 1990, SAS/STAT Users Guide,
volume 1 and 2: Cary, NC: SAS Institute, Inc. 1686 p.
Turner, R.E., and N.N. Rabalais, 1991, Changes
in Mississippi River water quality this century: Implications for coastal food webs: BioScience v. 41(3), p. 141-147.
U.S. Department of Agriculture, 1987, Farm drainage in the United States: History, Status, and Prospects: Economic Research Service, Miscellaneous Publication No. 1455. 170 p.
Zucker, L.A. and L.C. Brown, eds., 1998,
Agricultural drainage: Water quality impacts and subsurface drainage studies in the Midwest: Ohio State University Extension, Bulletin 871, 40 p
AUTHOR INFORMATION
Donald A. Goolsby and William A. Battaglin, U.S. Geological Survey, Denver, Colorado ([email protected], [email protected]) Brent T. Aulenbach, U.S. Geological Survey, Atlanta, Georgia ([email protected]) Richard P. Hooper, U.S. Geological Survey, Marlborough, Massachusetts ([email protected])

Related Documents