Nitrogen Carry-over Impacts in Irrigated Cotton Production, Southern High Plains of Texas Eduardo Segarra, Don E. Ethridge, Curtis R. Deussen, and Arthur B. Onken A dynamic optimization model which introduces an intertemporal nitrate-nitrogen residual function is used to derive and evaluate nitrogen fertilizer optimal decision rules for irrigated cotton production in the Southern High Plains of Texas. Results indicate that optimal nitrogen applications critically depend on initial nitrate-nitrogen levels and nitrogen-to-cotton price ratios. Also, the results indicate that single-year optimization leads to suboptimal nitrogen applications, which helps explain long-term cotton yield declines in the Southern High Plains of Texas; but single-year optimization does not significantly impact the net present value of returns of irrigated cotton operations. Key words: dynamic optimization, nitrogen carry-over, production efficiency. The agricultural sector's economic and polit- ical environment coupled with producers' in- ability to influence either output or input prices highlight the importance of input use efficiency in production as a key component for profit- ability and survival. In this study, efficiency in irrigated cotton production stemming from optimal nitrogen fertilizer applications is ad- dressed. The primary objective of this study is to empirically derive and evaluate nitrogen fer- tilizer optimal decision rules for irrigated cot- ton in the Southern High Plains of Texas. In particular, a dynamic optimization model of nitrogen utilization which introduces an in- tertemporal nitrate-nitrogen carry-over func- Eduardo Segarra, Don E. Ethridge, and Curtis R. Deussen are an assistant professor, a professor, and a former graduate student, respectively, Department of Agricultural Economics, Texas Tech University. Arthur B. Onken is a professor, Texas Agricultural Experiment Station, Texas A&M University, Lubbock. This is Texas Tech University College of Agricultural Sciences Publication No. T-1-280. The authors appreciate Art Stoecker's valuable contributions to this analysis. tion in the optimization procedure is pre- sented. The Study Area The Southern High Plains of Texas (SHPT) is a semiarid region located in the western part of the state, encompassing some 22 million acres (35,000 square miles) in 42 counties. Three major soil resource areas can be iden- tified in the SHPT: hardlands, composed of fine-textured clays and clay loams, comprising 54% of the area; mixedlands, composed pri- marily of medium-textured loams and loamy sands, representing 23% of the area; and sandylands, composed of coarse-textured sands, also representing 23% of the area (Lee). The major crops produced in the area are cotton, wheat, and grain sorghum. Cotton's relative importance increased from 35% of the planted acreage during the 1971-82 period to 59% in 1985 (Texas Agricultural Statistics Ser- vice). The fact that cotton is the most impor- tant crop in the SHPT coupled with evidence of declining profit margins in recent years (Eth- Western Journal of Agricultural Economics, 14(2): 300-309 Copyright 1989 Western Agricultural Economics Association

Welcome message from author
This document is posted to help you gain knowledge. Please leave a comment to let me know what you think about it! Share it to your friends and learn new things together.
Transcript
Nitrogen Carry-over Impacts in IrrigatedCotton Production, Southern High Plainsof Texas
Eduardo Segarra, Don E. Ethridge, Curtis R. Deussen,and Arthur B. Onken
A dynamic optimization model which introduces an intertemporal nitrate-nitrogenresidual function is used to derive and evaluate nitrogen fertilizer optimal decisionrules for irrigated cotton production in the Southern High Plains of Texas. Resultsindicate that optimal nitrogen applications critically depend on initial nitrate-nitrogenlevels and nitrogen-to-cotton price ratios. Also, the results indicate that single-yearoptimization leads to suboptimal nitrogen applications, which helps explain long-termcotton yield declines in the Southern High Plains of Texas; but single-yearoptimization does not significantly impact the net present value of returns of irrigatedcotton operations.
Key words: dynamic optimization, nitrogen carry-over, production efficiency.
The agricultural sector's economic and polit-ical environment coupled with producers' in-ability to influence either output or input priceshighlight the importance of input use efficiencyin production as a key component for profit-ability and survival. In this study, efficiencyin irrigated cotton production stemming fromoptimal nitrogen fertilizer applications is ad-dressed.
The primary objective of this study is toempirically derive and evaluate nitrogen fer-tilizer optimal decision rules for irrigated cot-ton in the Southern High Plains of Texas. Inparticular, a dynamic optimization model ofnitrogen utilization which introduces an in-tertemporal nitrate-nitrogen carry-over func-
Eduardo Segarra, Don E. Ethridge, and Curtis R. Deussen are anassistant professor, a professor, and a former graduate student,respectively, Department of Agricultural Economics, Texas TechUniversity. Arthur B. Onken is a professor, Texas AgriculturalExperiment Station, Texas A&M University, Lubbock.
This is Texas Tech University College of Agricultural SciencesPublication No. T-1-280.
The authors appreciate Art Stoecker's valuable contributions tothis analysis.
tion in the optimization procedure is pre-sented.
The Study Area
The Southern High Plains of Texas (SHPT) isa semiarid region located in the western partof the state, encompassing some 22 millionacres (35,000 square miles) in 42 counties.Three major soil resource areas can be iden-tified in the SHPT: hardlands, composed offine-textured clays and clay loams, comprising54% of the area; mixedlands, composed pri-marily of medium-textured loams and loamysands, representing 23% of the area; andsandylands, composed of coarse-texturedsands, also representing 23% of the area (Lee).
The major crops produced in the area arecotton, wheat, and grain sorghum. Cotton'srelative importance increased from 35% of theplanted acreage during the 1971-82 period to59% in 1985 (Texas Agricultural Statistics Ser-vice). The fact that cotton is the most impor-tant crop in the SHPT coupled with evidenceof declining profit margins in recent years (Eth-
Western Journal of Agricultural Economics, 14(2): 300-309Copyright 1989 Western Agricultural Economics Association

Nitrogen Carry-over in Cotton Production 301
ridge and Bowman) stimulated this study fo-cusing on optimization of nitrogen fertilizerapplications in irrigated cotton production.
The Optimization Model
Contemporary studies addressing the impactsof nitrogen fertilizer applications and nitrate-nitrogen residual on crop yields (Carter, Jen-sen, and Bosma; Hooker, Gwin, and Gallagh-er; Onken and Sunderman; Onken, Matheson,and Nesmith; Roberts, Weaver, and Helps)have revealed that accumulation of residualnitrate-nitrogen in sufficient quantities affectscrop yields. That is, total nitrogen available toplants at a given time is a function of appliednitrogen and residual nitrate-nitrogen at thattime. Further, residual nitrate-nitrogen at aparticular point in time is, in turn, a functionof previous nitrogen applications and previouslevels of residual nitrate-nitrogen. Therefore,in deriving optimal decision rules for nitrogenfertilizer applications, a dynamic model whichaccounts for such relationships must be used.Previous studies addressing both deterministicand stochastic derivation of optimal fertiliza-tion decision rules which introduce carry-overfunctions include Godden and Helyar; Ken-nedy (1980, 1986a, b); Kennedy et al.; Stauber,Burt, and Linse; and Taylor.
The deterministic specification of the em-pirical dynamic optimization model formu-lated in this study to derive nitrogen fertilizeroptimal decision rules follows that of Kennedyet al.:
(1) Max Z = C {[Pt* Y(NT,) - CNt*NAt]{NAt} t=0
* (1 + r)- t
subject to:
(2)(3)(4)and
NTt = NA, + NRt,NRt+, = f[NAt, NRJ,
NRo = NR(O),
NAt, NR,, NT, > 0 for all t,
where, Z is the per-acre present value ($) ofreturns to land, irrigation water, overhead, risk,and management from cotton production; n isthe length of the planning horizon, in years, ofthe decision maker (the farmer in this case); P,is the cotton price ($/lb.) in year t; Yt is thecotton yield function (lbs./acre) in year t; NTtis the nitrogen available to the cotton plants
(lbs./acre) in year t; CNt is the price of nitrogen($/lb.) in year t; NAt is the nitrogen applied(lbs./acre) in year t; r is the discount rate; andNRt is the nitrate-nitrogen residual (lbs./acre)in year t.
Equation (1) represents the objective func-tion, or performance measure, of the optimi-zation model. Equation (2) is an equality con-straint which adds up the applied nitrogen andnitrate-nitrogen residual at time t, and is usedas a variable in equation (1) to compute thecurrent cotton yield. Equation (3) is the equa-tion of motion of the model which updates thenitrate-nitrogen residual necessary for equa-tion (2). Equation (4) is an initial condition onnitrate-nitrogen residual. Finally, the nonne-gativity constraints on the decision and statevariables of the model are specified.
The yield response function, Yt in equation(1), and the nitrate-nitrogen residual function,equation (3), were estimated using data fromthree experimental sites in the SHPT over athree-year period (Sunderman; Sunderman,Onken, and Jones). Additional data on irri-gation, rainfall, temperature, residual nitro-gen, and soil moisture conditions were ob-tained from experimental records at the TexasAgricultural Experiment Station at Lubbock,Texas, and the National Oceanic and Atmo-spheric Administration (U.S. Department ofCommerce).
Variables directly under the farmer's controland which influence irrigated cotton yields in-clude the level of fertilization, level of irriga-tion, row spacing, seed variety, and plantingdata. Other factors not directly under thefarmer's control influencing irrigated cottonyields include 'soil type, level of rainfall, andtemperature. Alternative model specificationsand explanatory variables, using logarithmic,Mitscherlich-Spillman, and quadratic func-tional forms to capture diminishing marginalreturns, of the yield response function wereestimated using linear and nonlinear regres-sion techniques. The best function obtained inthe process was:
(5) Yt = 177.84 + 15.03[1n(NT7*HU7)](.69) (2.64)
+ 38.15[ln(Wt*HU,)] + 18.33 RWSP(1.61) (3.70)
+ 39.10 VAR - 51.28 MDEF,(3.61) (-8.29)
- 203.48 ST1 - 32.89 ST2(-12.27) (-2.14) R 2 = .367,
Segarra et al.
Western Journal of Agricultural Economics
where, Yt and NTt are as defined previously;HUt, the accumulated daily heat units receivedduring the cotton-growing season in year t indegrees Fahrenheit (daily heat units are com-puted as [(daily high temperature + daily lowtemperature)/2] -60); Wt, the inches of waterreceived during the growth period in year t;R WSP, the number of rows per 40-inch bed;VAR, a dummy variable to indicate cotton va-riety, VAR = 0 for Paymaster Dwarf and VAR= 1 for Dunn 56-C; MDEFt, the cumulativesoil moisture deficiency measured as in inchesof water needed to fill the soil profile duringthe cotton-growing season in year t; ST1 andST2, dummy variables to indicate soil re-source area where ST1 = ST2 = 0 indicatesmixedlands, ST1 = 1 indicates hardlands, andST2 = 1 indicates sandylands; and In denotesthe natural logarithm of the variable.
The values in parenthesis below the esti-mated parameters in equation (5) are their as-sociated t-values. Each of the estimated pa-rameters was significant at the .05 level withthe exceptions of the intercept, which was sig-nificant at the .21 level, and the parameter ofthe ln( Wt*HUt) variable, which was significantat the .10 level.
Based on prior information with respect tothe specification of the adequate functionalform of the residual nitrate-nitrogen carry-overfunction for irrigated cotton production in thetop six inches of the soil profile for the mixed-lands soil resource area by Sunderman and bySunderman, Onken, and Jones, the estimatedcarry-over function was:
(6) NRt+= -2.167+ .0199 NA, + .9922 NRt(-2.12) (6.07) (14.77)
R2 = .86,
where the variables are defined as before andparameter t-values are reported as before. Es-timated parameters in equation (6) were sig-nificant at the .01 level except for the intercept,which was significant at the .05 level.
To derive optimal decision rules with re-spect to nitrogen applications, cotton produc-tion experts were consulted to specify repre-sentative appropriate levels of all variables inequation (5) except for the nitrogen variable(Lyle; Onken; Supak). That is, representativelevels for HU, W, R WSP, and MDEF in equa-tion (5) for irrigated cotton production weresubstituted to derive six cotton yield functions,corresponding to two cotton varieties and the
three alternative soil resource areas for theSHPT. Values substituted in equation (5) were:W, = 6.50, MDEF, = 4.30, RWSPt = 1, andHUt = 2,271. These substitutions and appro-priate substitution of the dummy variables inequation (5) provided the following generalfunctional form of the cotton yield function:
(7) ,= Is + 15.03 ln(NTt),
where Is corresponds to the intercept of theyield function for a given soil resource areaand cotton variety combination. In particular,the intercepts were: 293.66 pounds for theDunn variety and 254.56 pounds for the Pay-master variety grown in the hardlands, 497.14pounds for the Dunn variety and 458.04pounds for the Paymaster variety grown in themixedlands, and 464.25 pounds for the Dunnvariety and 425.15 pounds for the Paymastervariety grown in the sandylands. Equation (7)provided the yield functions used to solve theoptimization model in equation (1).
Results
The optimization model depicted in equations(1)-(4) was solved for the mixedlands soil re-source area (MSRA) and the Dunn 56-C cottonvariety combination assuming: (a) a ten-yearplanning horizon; (b) five alternative levels ofcotton price (.40, .45, .50, .55, .60 dollars perpound); (c) five alternative levels of nitrogenprice (.10, .15, .20, .25, .30 dollars per pound);and (d) two alternative initial conditions ofnitrate-nitrogen residual in pounds per acre(16.3 and 30.0). Also, alternative discount rateswere used, but the results reported here cor-respond to those with a 5% discount rate (r =.05).
As expected, optimal decision rules for ap-plied nitrogen varied across periods for a givennitrogen and cotton price combination at agiven nitrate-nitrogen initial condition. How-ever, because a more stable optimal decisionrule was desired to simplify management im-plementation, for a given nitrogen and cottonprice combination and initial residual nitrogencondition, an additional constraint equatingnitrogen applications across periods was intro-duced. Another justification for the introduc-tion of this additional constraint is the fact thatnitrogen and cotton prices vary year to year,
302 December 1989
Nitrogen Carry-over in Cotton Production 303
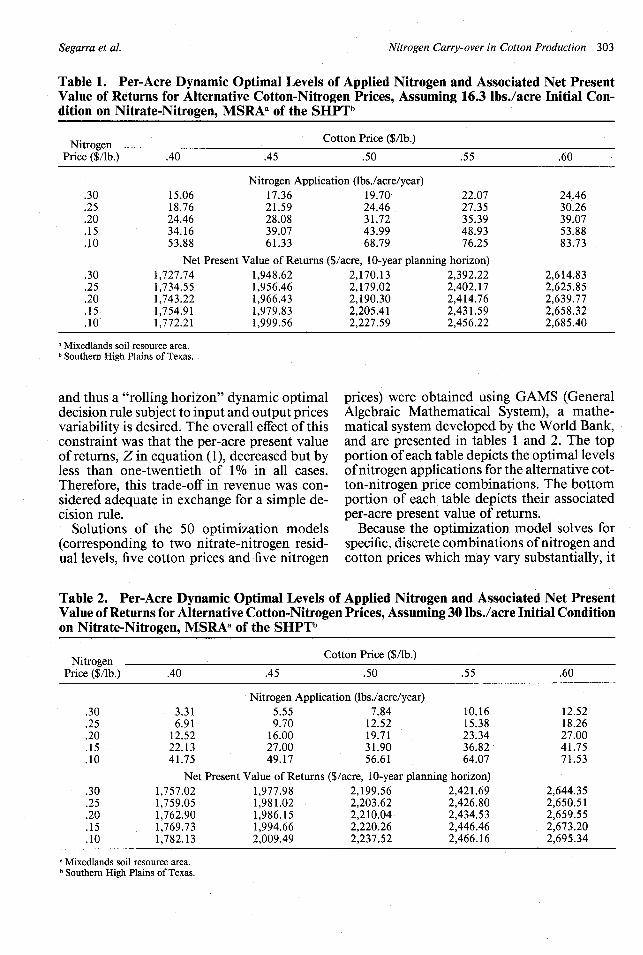
Table 1. Per-Acre Dynamic Optimal Levels of Applied Nitrogen and Associated Net PresentValue of Returns for Alternative Cotton-Nitrogen Prices, Assuming 16.3 Ibs./acre Initial Con-dition on Nitrate-Nitrogen, MSRAa of the SHPTb
... ~~~~~Nitrogen ~Cotton Price ($/lb.)NitrogenPrice ($/lb.) .40 .45 .50 .55 .60
Nitrogen Application (lbs./acre/year).30 15.06 17.36 19.70 22.07 24.46.25 18.76 21.59 24.46 27.35 30.26.20 24.46 28.08 31.72 35.39 39.07.15 34.16 39.07 43.99 48.93 53.88.10 53.88 61.33 68.79 76.25 83.73
Net Present Value of Returns ($/acre, 10-year planning horizon).30 1,727.74 1,948.62 2,170.13 2,392.22 2,614.83.25 1,734.55 1,956.46 2,179.02 2,402.17 2,625.85.20 1,743.22 1,966.43 2,190.30 2,414.76 2,639.77.15 1,754.91 1,979.83 2,205.41 2,431.59 2,658.32.10' 1,772.21 1,999.56 2,227.59 2,456.22 2,685.40
a Mixedlands soil resource area.b Southern High Plains of Texas.
and thus a "rolling horizon" dynamic optimaldecision rule subject to input and output pricesvariability is desired. The overall effect of thisconstraint was that the per-acre present valueof returns, Z in equation (1), decreased but byless than one-twentieth of 1% in all cases.Therefore, this trade-off in revenue was con-sidered adequate in exchange for a simple de-cision rule.
Solutions of the 50 optimization models(corresponding to two nitrate-nitrogen resid-ual levels, five cotton prices and five nitrogen
prices) were obtained using GAMS (GeneralAlgebraic Mathematical System), a mathe-matical system developed by the World Bank,and are presented in tables 1 and 2. The topportion of each table depicts the optimal levelsof nitrogen applications for the alternative cot-ton-nitrogen price combinations. The bottomportion of each table depicts their associatedper-acre present value of returns.
Because the optimization model solves forspecific, discrete combinations of nitrogen andcotton prices which may vary substantially, it
Table 2. Per-Acre Dynamic Optimal Levels of Applied Nitrogen and Associated Net PresentValue of Returns for Alternative Cotton-Nitrogen Prices, Assuming 30 lbs./acre Initial Conditionon Nitrate-Nitrogen, MSRAa of the SHPTb
,..~~~~~Nitrogen ~Cotton Price ($/lb.)NitrogenPrice ($/lb.) .40 .45 .50 .55 .60
Nitrogen Application (lbs./acre/year).30 3.31 5.55 7.84 10.16 12.52.25 6.91 9.70 12.52 15.38 18.26.20 12.52 16.00 19.71 23.34 27.00.15 22.13 27.00 31.90 36.82 41.75.10 41.75 49.17 56.61 64.07 71.53
Net Present Value of Returns ($/acre, 10-year planning horizon).30 1,757.02 1,977.98 2,199.56 2,421.69 2,644.35.25 1,759.05 1,981.02 2,203.62 2,426.80 2,650.51.20 1,762.90 1,986.15 2,210.04 2,434.53 2,659.55.15 1,769.73 1,994.66 2,220.26 2,446.46 2,673.20.10 1,782.13 2,009.49 2,237.52 2,466.16 2,695.34
a Mixedlands soil resource area.b Southern High Plains of Texas.
Segarra et al.
Western Journal ofAgricultural Economics
0
La0.zw00
z0
0z0iL
0.01 0.11 0.21 0.31 0.41 0.51 0.61 0.71 0.81 0.91
NITROGEN TO COTTON PRICE RATIO0 16.3 Lbs./Acre + 30.0 Lbs./Acre
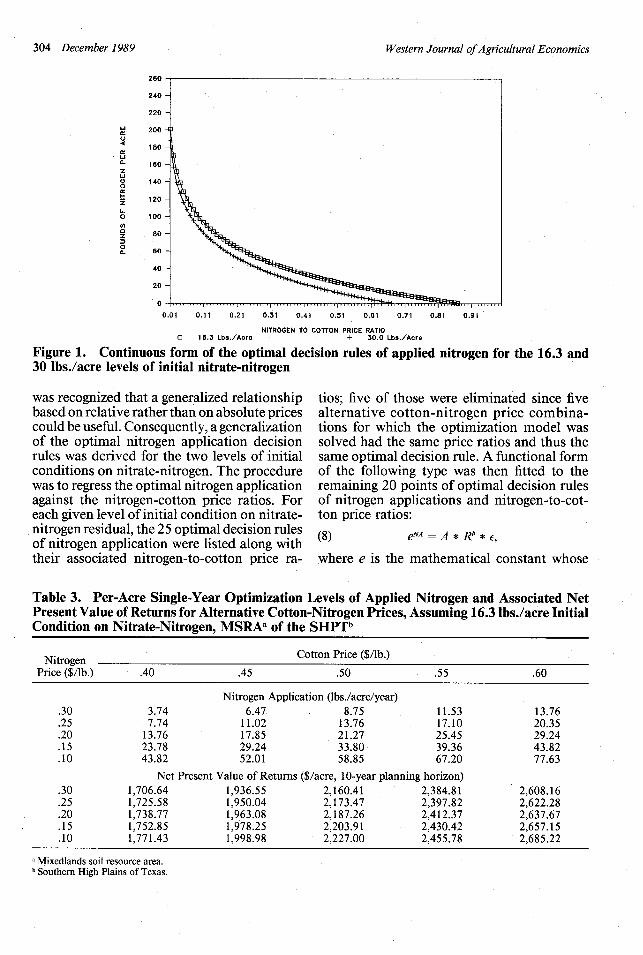
Figure 1. Continuous form of the optimal decision rules of applied nitrogen for the 16.3 and30 lbs./acre levels of initial nitrate-nitrogen
was recognized that a generalized relationshipbased on relative rather than on absolute pricescould be useful. Consequently, a generalizationof the optimal nitrogen application decisionrules was derived for the two levels of initialconditions on nitrate-nitrogen. The procedurewas to regress the optimal nitrogen applicationagainst the nitrogen-cotton price ratios. Foreach given level of initial condition on nitrate-nitrogen residual, the 25 optimal decision rulesof nitrogen application were listed along withtheir associated nitrogen-to-cotton price ra-
tios; five of those were eliminated since fivealternative cotton-nitrogen price combina-tions for which the optimization model wassolved had the same price ratios and thus thesame optimal decision rule. A functional formof the following type was then fitted to theremaining 20 points of optimal decision rulesof nitrogen applications and nitrogen-to-cot-ton price ratios:
(8) eNA = A * RO * c,
where e is the mathematical constant whose
Table 3. Per-Acre Single-Year Optimization Levels of Applied Nitrogen and Associated NetPresent Value of Returns for Alternative Cotton-Nitrogen Prices, Assuming 16.3 Ibs./acre InitialCondition on Nitrate-Nitrogen, MSRA a of the SHPTb
Nitrogen ___________Cotton Price ($/lb.)Price ($/lb.) .40 .45 .50 .55 .60
Nitrogen Application (lbs./acre/year).30 3.74 6.47 8.75 11.53 13.76.25 7.74 11.02 13.76 17.10 20.35.20 13.76 17.85 21.27 25.45 29.24.15 23.78 29.24 33.80 39.36 43.82.10 43.82 52.01 58.85 67.20 77.63
Net Present Value of Returns ($/acre, 10-year planning horizon).30 1,706.64 1,936.55 2,160.41 2,384.81 2,608.16.25 1,725.58 1,950.04 2,173.47 2,397.82 2,622.28.20 1,738.77 1,963.08 2,187.26 2,412.37 2,637.67.15 1,752.85 1,978.25 2,203.91 2,430.42 2,657.15.10 1,771.43 1,998.98 2,227.00 2,455.78 2,685.22
a Mixedlands soil resource area.b Southern High Plains of Texas.
304 December 1989
I

Nitrogen Carry-over in Cotton Production 305
Table 4. Per-Acre Single-Year Optimization Levels of Applied Nitrogen and Associated NetPresent Value of Returns for Alternative Cotton-Nitrogen Prices, Assuming 30.0 lbs./acre InitialCondition on Nitrate-Nitrogen, MSRAa of the SHPTb
~~~~~~~~Nitrogen ~Cotton Price ($/lb.)NitrogenPrice ($/lb.) .40 .45 .50 .55 .60
Nitrogen Application (lbs./acre/year).30 0.00 0.00 0.00 0.00 0.06.25 0.00 0.00 0.06 3.40 6.65.20 0.06 4.15 7.57 11.75 15.54.15 10.08 15.54 20.10 25.66 30.12.10 30.12 38.31 45.15 53.50 63.93
Net Present Value of Returns ($/acre, 10-year planning horizon).30 1,756.14 1,975.66 2,195.17 2,414.69 2,634.34.25 1,756.14 1,975.66 2,195.28 2,420.38 2,645.31.20 1,756.22 1,981.22 2,205.69 2,431.11 2,656.58.15 1,766.80 1,992.44 2,218.19 2,444.83 2,671.88.10 1,781.06 2,008.69 2,236.72 2,465.55 2,695.07
a Mixedlands soil resource area.b Southern High Plains of Texas.
natural logarithm is equal to one; R is the ni- the initial condition on nitrate-nitrogen, thetrogen-to-cotton price ratio; NA is the optimal higher the nitrogen-to-cotton price ratio, thelevel of applied nitrogen; A and 3 are the pa- lower the optimal level of applied nitrogen.rameters to be estimated; and E is the error Information contained in figure 1 can also beterm. Regression results from the linearized presented to farmers in table form. As pointedform of equation (8) for both nitrate-nitrogen out implicitly by Onken, Matheson, and Nes-initial conditions were: mith, this is important because "[the] Use of
(9) (1~6.3~ lbs./acre)fertilizers in a crop production system is an(9) (16.3 lbs./acre)A -. 9103 - 44l42 /na economic investment. Insufficient applica-
-2.378) (-19721) R2 = 4 9558 tions of fertilizers are costly in [terms of] lostyields and over-application results in unwar-ranted production costs" (p. 134).
(10) (30.0 lbs./acre) To address that point, the model in equa-NA=-17.654 - 44.663 ln(R) tions (1)-(4) was solved to derive nitrogen ap-
(-7.054) (-19.475) R2 = .9547, plication optimal decision rules for a single-where the variables are defined as above and year planning horizon. This is representativethe values in parenthesis below the estimated of the common practice in which decisionparameters represent their associated t-values. makers have soil tests performed on their landAll parameter estimates were significant at the and decide how much nitrogen to apply with-.01 level with the exception of the intercept out regard to future residual nutrient consid-for the 16.3 lbs./acre initial condition in ni- erations. Thus, this represents a short-run op-trate-nitrogen, which was significant at the .05 timization in which an annual decision is madelevel. It is important to stress the fact that which implicitly ignores the dynamic natureequations (9) and (10) were estimated to find of nitrogen applications through nitrate-nitro-an approximation of the continuous form of gen carry-over effects. Discrete results of thisthe nitrogen fertilizer optimal decision rules single-year type of decision at alternative ni-rather than to test the significance of the op- trogen and cotton prices for the two alternativetimal decision rules obtained by solving the levels of nitrate-nitrogen existing in the soil atoptimization model in equations (1)-(4). the time the decision is made are presented in
Equations (9) and (10) are presented graph- tables 3 and 4 along with their associated netically in figure 1. As expected, given a nitrogen- present value of returns. Also, the continuousto-cotton price ratio, the higher the initial con- form of the nitrogen applications under thisdition on nitrate-nitrogen, the lower the single-year type decision are presented in fig-optimal level of applied nitrogen. Also, given ures 2 and 3 along with the corresponding op-
Segarra et al.
306 December 1989
w
z
0a
z
o
0v
o
0
0Oz
00.a.
Western Journal of Agricultural Economics
0.01 0.1 0.19 0.28 0.37 0.46 0.55 0.64 0.73 0.82
NITROGEN TO COTTON PRICE RATIO0 10 YEAR MODEL + ONE YEAR MODEL
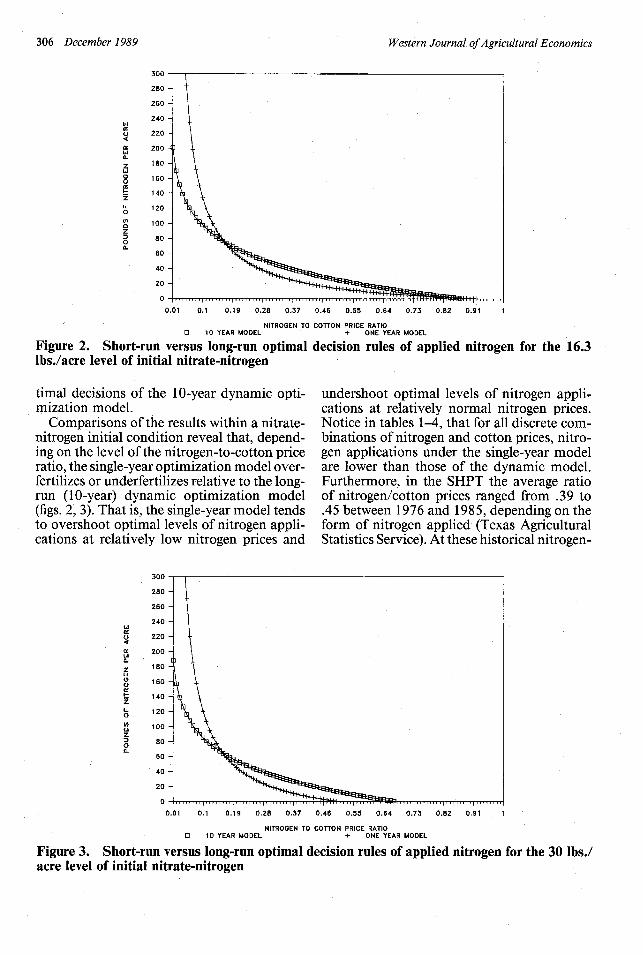
Figure 2. Short-run versus long-run optimal decision rules of appliedlbs./acre level of initial nitrate-nitrogen
0.91 1
nitrogen for the 16.3
timal decisions of the 10-year dynamic opti-mization model.
Comparisons of the results within a nitrate-nitrogen initial condition reveal that, depend-ing on the level of the nitrogen-to-cotton priceratio, the single-year optimization model over-fertilizes or underfertilizes relative to the long-run (10-year) dynamic optimization model(figs. 2, 3). That is, the single-year model tendsto overshoot optimal levels of nitrogen appli-cations at relatively low nitrogen prices and
undershoot optimal levels of nitrogen appli-cations at relatively normal nitrogen prices.Notice in tables 1-4, that for all discrete com-binations of nitrogen and cotton prices, nitro-gen applications under the single-year modelare lower than those of the dynamic model.Furthermore, in the SHPT the average ratioof nitrogen/cotton prices ranged from .39 to.45 between 1976 and 1985, depending on theform of nitrogen applied (Texas AgriculturalStatistics Service). At these historical nitrogen-
Liw
zI1ll-
0
a.
z
z
o
z)
ouu
280
260
240
220
200
180
160
140
120
100
80
60
40
20
0.01 0.1 0.19 0.28 0.37 0.46 0.55 0.64 0.73 0.82 0.91 1
NITROGEN TO COTTON PRICE RATIO0 10 YEAR MODEL + ONE YEAR MODEL
Figure 3. Short-run versus long-run optimal decision rules of applied nitrogen for the 30 lbs./acre level of initial nitrate-nitrogen
U
--
Inn

Nitrogen Carry-over in Cotton Production 307
a-4
0
(
Q
0.01 0.1 0.19 0.28 0.37 0.46 0.55 0.64 0.73 0.82
NITROGEN TO COTTON PRICE RATIO0 LONG-RUN + SHORT-RUN
Figure 4. Dunn variety cotton yields associated with the short-run and long-run optimal levelsof applied nitrogen, assuming a 16.4 lbs./acre level of initial nitrate-nitrogen residual
to-cotton price ratios, the optimum nitrogenapplication rates are always below those de-rived from the dynamic 10-year planning ho-rizon model. This suggests that the single-yearplanning model yields suboptimal or ineffi-cient levels of nitrogen applications, implyinglower irrigated cotton yields than optimal.
In figure 4, the Dunn variety irrigated cottonyields associated with the single-year (short-run) and 10-year (long-run) models for themixedlands soil resource area, assuming 16.3lbs./acre initial level on nitrate-nitrogen, acrossnitrogen-to-cotton price ratios are presented.As can be seen in that figure, given the his-torical nitrogen-to-cotton price ratios, theirrigated cotton yields corresponding to thesingle-year model are lower than those of the10-year model. This finding supports Neal andEthridge's econometric finding that nitrogenfertilizer prices, which in turn affect nitrogenapplication rates, consistently explain more ofthe declining cotton yield trends in the SHPTthan any other factor.
In particular, Neal and Ethridge point outthat: "Since 1966, annual cotton yields in theTexas High Plains have declined at a rate ofabout 10 pounds per acre per year" (p. 27).Cotton yield differentials between the long-runand short-run models (figure 5) show that athistorical nitrogen-to-cotton price ratios, cot-ton yields derived from the series of single-year decision models are 7.5 to 8.5 lbs./acrebelow long-run optimum. This suggests that
short-term planning, perhaps induced by fi-nancial restrictions, may explain as much as75% of the yield declines in the SHPT. It alsosuggests that if nitrogen-to-cotton price ratiosremain near the historical levels, and if deci-sion makers followed the nitrogen applicationoptimal decision rules derived with the long-run model, cotton yields would increase andoperations would be more efficient. However,it is important to point out that by followingthe dynamic optimal decision rules, implyinghigher levels of nitrogen use, net present valueof returns would increase but not significantly(compare net returns in tables 1 and 3 andtables 2 and 4). Kennedy (1986b) reports sim-ilar findings in that, for certain types of re-sponse functions, the gains from adopting theoptimal multiperiod rule over the single-pe-riod rule can be quite low.
Concluding Remarks
The objective of this paper was to derive ni-trogen application optimal decision rules, con-sidering the dynamic nitrate-nitrogen residualimpacts of nitrogen applications, for irrigatedcotton production in the Southern High Plainsof Texas. It was shown that single-year deri-vation of optimal decision rules of nitrogenapplications for cotton which ignores the dy-namic nature of the problem leads to subop-timal nitrogen application levels, implying
Segarra et al.

Western Journal of Agricultural Economics
15
10
J.0
z
oo
Li
z0
0
(.1
5
0
-5
-10
-15
-20
-25
-30
-35
0.01 0.1 0.19 0.28 0.37 0.46 0.55 0.64 0.73 0.82
NITROGEN TO COTTON PRICE RATIO
Figure 5. Dunn variety cotton yield differential between the long-run and short-run optimallevels of applied nitrogen, assuming a 16.3 Ibs./acre level of initial nitrate-nitrogen residual
inefficiencies in irrigated cotton production. Itwas also shown, however, that adoption ofmultiperiod optimal decision rules of nitrogenutilization would not significantly increase netpresent value of returns. The optimal decisionrules derived from the dynamic model whichconsidered the nitrate-nitrogen residual im-pacts were found to be critically influenced byboth the initial condition on nitrate-nitrogenand cotton and nitrogen price ratios.
The results derived in this study can be usedand easily interpreted by decision makers toevaluate the efficiency of their cotton opera-tions. This is important because input use ef-ficiency in production is a key component forprofitability and survival. It is recognized thatthe results stemming from this study are notapplicable to other areas since information re-quirements are quite specific. In particular,critical elements in the derivation of compa-rable results for other areas and crops wouldbe both adequate functional form and esti-mation of the nitrate-nitrogen carry-over func-tion. However, the methods used to derive ni-trogen application optimal decision rules inthis study are applicable to other areas of thecountry to evaluate efficiency and profitabilityof agricultural reproduction not only with re-spect to nitrogen utilization but other produc-tion inputs as well.
Further research is needed to evaluate ni-trate-nitrogen carry-over under sequentialcropping (crop rotations) and anticipated ad-vances in nitrogen fixation biotechnologies,
because they would impact optimal nitrogenlevels. Also, research addressing the variabilityof the marginal rate of substitution betweennitrate-nitrogen residual and applied nitrogenis needed as evidence of its existence is pro-vided by Onken, Matheson, and Nesmith. Forthose interested readers, a documented copyof the GAMS optimization model used in thisstudy is available from the authors.
[Received October 1988; final revisionreceived July 1989.]
References
Carter, J. N., M. E. Jensen, and S. M. Bosma. "Deter-mining Nitrogen Fertilization Needs for SugarbeetsFrom Residual Soil Nitrate and Mineralizable Nitro-gen." Agronomy J. 66(1974):319-23.
Ethridge, D. E., and K. W. Bowman. "Dynamic Patternsin Cotton Production: Is the Structure Changing?"1988 Cotton Research Conferences Proceedings, pp.406-10. Cotton Economics and Marketing Confer-ence, National Cotton Council. Memphis TN, 1988.
Godden, D. P., and K. R. Helyar. "An Alternative Meth-od for Deriving Optimal Fertilizer Rates." Rev. Mar-ket. Agr. Econ. 48(1980):83-97.
Hooker, M. L., R. E. Gwin, and P. Gallagher. "Effects ofLong-Term Annual Applications of N and P on CornGrain Yields and Soil Chemical Properties." Agron-omy J. 75(1983):94-99.
308 December 1989

Nitrogen Carry-over in Cotton Production 309
Kennedy, J. O. S. "An Alternative Method for DerivingOptimal Fertilizer Rates: Comment and Extension."Rev. Market. Agr. Econ. 49(1980):203-09.
. Dynamic Programming: Applications to Agricul-ture and Natural Resources. London: Elsevier AppliedScience, 1986a.
"Rules for Optimal Fertilizer Carryover: An Al-ternative Explanation." Rev. Market. Agr. Econ.54(1986b):3-10.
Kennedy, J. O. S., I. F. Whan, R. Jackson, and J. L. Dillon."Optimal Fertilizer Carryover and Crop RecyclingPolicies for a Tropical Grain Crop." Aust. J. Agr.Econ. 17(1973):104-13.
Lee, J. G. "Risk Implications of the Transition to DrylandAgricultural Production on the Texas High Plains."Unpublished Ph.D. Dissertation, Texas A&M Uni-versity, 1987.
Lyle, W. N. Irrigation Specialist, Texas Agricultural Ex-periment Station, Lubbock TX. Personal commu-nication. February 1988.
Neal, T. J., and D. E. Ethridge. "Analysis of Texas HighPlains Cotton Yields Trends." Texas Tech Univer-sity, College of Agricultural Sciences PublicationT-1-242. October 1986.
Onken, A. B. Soil Fertility Specialist, Texas AgriculturalExperiment Station, Lubbock TX. Personal com-munication. February 1988.
Onken, A. B., and H. D. Sunderman. "Applied and Re-sidual Nitrate-Nitrogen Effects on Irrigated GrainSorghum Yield." Soil Science Society of America Pro-ceedings 36(1972):94-97.
Onken, A. B., R. L. Matheson, and D. M. Nesmith. "Fer-tilizer Nitrogen and Residual Nitrate-Nitrogen Effectson Irrigated Corn Yield." Soil Science Soc. Amer. J.49(1985): 134-39.
Roberts, S., W. H. Weaver, and J. P. Helps. "Use ofNitrate Soil Test to Predict Sweet Corn Response toNitrogen Fertilization." Soil Science Soc. Amer. J.44(1980):306-08.
Stauber, M. S., O. R. Burt, and F. Linse. "An EconomicEvaluation of Nitrogen Fertilization of Grasses WhenCarry-over is Significant." Amer. J. Agr. Econ.57(1975):463-71.
Sunderman, H. D. "Nitrate Concentration in Cotton(Gossypium Hirsutum L.) Petioles as Influenced byCultivar, Row Spacing, and Nitrogen Application Ratein the Texas High Plains." Unpublished Ph.D. Dis-sertation, Texas A&M University, 1976.
Sunderman, H. D., A. B. Onken, and R. M. Jones. "Re-sults of Cooperative Fertilizer Research on SouthernHigh Plains, 1971." Texas A&M University, Agri-cultural Research and Extension Center, Lubbock TX,1972.
Supak, J. R. Cotton Specialist, Texas Agricultural Ex-periment Station, Lubbock TX. Personal communi-cation. February 1988.
Taylor, C. R. "Certainty Equivalence for Determinationof Optimal Fertilizer Application Rates with Carry-over." West. J. Agr. Econ. 8(1983):64-67.
Texas Agricultural Statistics Service. "Texas AgriculturalCrop Acreage, Production, Cash Receipts, Prices Re-ceived and Paid by Farmers." U. S. Department ofAgriculture and Texas Department of Agriculture,Austin TX. Various issues.
United States Department of Commerce. "ClimatologicalData, Texas." National Oceanic and AtmosphericAdministration, Environmental Data Services, Ashe-ville NC, Vol. 76 (1971) and 77 (1972), No. 1-12.
World Bank. GeneralAlgebraic ModelingSystem (GAMS):A Preliminary User's Guide, Washington DC, 1982.
Segarra et al.
Related Documents


