ORIGINAL PAPER Nitrogen availability decreases prokaryotic diversity in sandy soils Silke Ruppel & Vigdis Torsvik & Frida Lise Daae & Lise Øvreås & Jörg Rühlmann Received: 12 October 2005 / Revised: 18 May 2006 / Accepted: 24 May 2006 # Springer-Verlag 2006 Abstract In this study, the interrelation between nitrogen availability and prokaryotic diversity are studied using a well-characterised system from a long-term field experi- ment on a loamy sandy soil. The prokaryotic potential functional diversity and community composition were assessed using community-level physiological profiling (CLPP), and their phylogenetic diversity was analysed using polymerase chain reaction-denaturing gradient gel electrophoresis (PCR-DGGE) in combination with sequenc- ing analysis. Highest prokaryotic potential functional diversity was measured in the control soil receiving no N fertilisation, indicating an efficient as well as versatile utilisation of the substrates in this soil. Both substrate utilisation richness and substrate utilisation evenness, the two constituents of the functional diversity, were decreased with increasing N supply. Furthermore, distinct prokaryotic community compositions were generated in N-enriched soils compared to unfertilised control soils. These differ- ences suggest a dominance of populations adapted to utilising readily available substrates. We demonstrated that the shift in prokaryotic functional diversity was connected to a shift in the phylogenetic structure of the bacterial and archaeal communities. Taken together, our data clearly show that, for the sandy soil system, prokaryotic diversity and N availability were interrelated. Keywords Functional prokaryotic diversity . Phylogenetic community composition . Real-time PCR . PCR-DGGE Introduction Understanding how prokaryotic diversity can influence community structure and function is important when studying ecological processes in soil. Ecosystem function- ing and prokaryotic populations present in the soil are thought to be closely interconnected (Pankhurst 1997a; Torsvik et al. 2002). Moreover, prokaryotic community composition and their functional diversity have been suggested to be essential for stabilising ecosystems as energy and nutrient flow, and transformations of matter are based on biological processes in which many different prokaryotic populations and species have a role (DeRuiter et al. 1998; Torsvik et al. 1996). Diversity studies have been used to monitor successions in soil (Schipper et al. 2001). Generally, the pioneer prokaryotic community contains few species, and during successions a stable climax community with many species evolves and an increase in diversity can be observed (Anderson 1994). Microbial diversity studies also highlighted an interdepen- dency between diversity and plant species (Garland and Mills 1991; Garland 1996), between diversity and soil types (Degens et al. 2000) and diversity and perturbation (Torsvik et al. 1998). However, how nutrient availability in soil affects the prokaryotic community structure is not well understood. Indeed, investigating how prokaryotic commu- nities function in soils and what prokaryotic diversity means with respect to soil health and sustainable agricul- tural production is still a major objective for soil microbial ecologists (Nannipieri et al. 2003). Nearly nothing is known about the importance of the archaeal domain in nutrient Biol Fertil Soils DOI 10.1007/s00374-006-0122-5 S. Ruppel (*) : J. Rühlmann Institute of Vegetable and Ornamental Crops Grossbeeren/Erfurt e.V., Theodor-Echtermeyer-Weg 1, 14979 Grossbeeren, Germany e-mail: [email protected] V. Torsvik : F. L. Daae : L. Øvreås Department of Biology, University of Bergen, Jahnebakken 5, P.O. Box 7800, N-5020 Bergen, Norway

Welcome message from author
This document is posted to help you gain knowledge. Please leave a comment to let me know what you think about it! Share it to your friends and learn new things together.
Transcript

ORIGINAL PAPER
Nitrogen availability decreases prokaryotic diversityin sandy soils
Silke Ruppel & Vigdis Torsvik & Frida Lise Daae &
Lise Øvreås & Jörg Rühlmann
Received: 12 October 2005 /Revised: 18 May 2006 /Accepted: 24 May 2006# Springer-Verlag 2006
Abstract In this study, the interrelation between nitrogenavailability and prokaryotic diversity are studied using awell-characterised system from a long-term field experi-ment on a loamy sandy soil. The prokaryotic potentialfunctional diversity and community composition wereassessed using community-level physiological profiling(CLPP), and their phylogenetic diversity was analysedusing polymerase chain reaction-denaturing gradient gelelectrophoresis (PCR-DGGE) in combination with sequenc-ing analysis. Highest prokaryotic potential functionaldiversity was measured in the control soil receiving no Nfertilisation, indicating an efficient as well as versatileutilisation of the substrates in this soil. Both substrateutilisation richness and substrate utilisation evenness, thetwo constituents of the functional diversity, were decreasedwith increasing N supply. Furthermore, distinct prokaryoticcommunity compositions were generated in N-enrichedsoils compared to unfertilised control soils. These differ-ences suggest a dominance of populations adapted toutilising readily available substrates. We demonstrated thatthe shift in prokaryotic functional diversity was connectedto a shift in the phylogenetic structure of the bacterial andarchaeal communities. Taken together, our data clearlyshow that, for the sandy soil system, prokaryotic diversityand N availability were interrelated.
Keywords Functional prokaryotic diversity . Phylogeneticcommunity composition . Real-time PCR . PCR-DGGE
Introduction
Understanding how prokaryotic diversity can influencecommunity structure and function is important whenstudying ecological processes in soil. Ecosystem function-ing and prokaryotic populations present in the soil arethought to be closely interconnected (Pankhurst 1997a;Torsvik et al. 2002). Moreover, prokaryotic communitycomposition and their functional diversity have beensuggested to be essential for stabilising ecosystems asenergy and nutrient flow, and transformations of matter arebased on biological processes in which many differentprokaryotic populations and species have a role (DeRuiteret al. 1998; Torsvik et al. 1996). Diversity studies havebeen used to monitor successions in soil (Schipper et al.2001). Generally, the pioneer prokaryotic communitycontains few species, and during successions a stableclimax community with many species evolves and anincrease in diversity can be observed (Anderson 1994).Microbial diversity studies also highlighted an interdepen-dency between diversity and plant species (Garland andMills 1991; Garland 1996), between diversity and soil types(Degens et al. 2000) and diversity and perturbation (Torsviket al. 1998). However, how nutrient availability in soilaffects the prokaryotic community structure is not wellunderstood. Indeed, investigating how prokaryotic commu-nities function in soils and what prokaryotic diversitymeans with respect to soil health and sustainable agricul-tural production is still a major objective for soil microbialecologists (Nannipieri et al. 2003). Nearly nothing is knownabout the importance of the archaeal domain in nutrient
Biol Fertil SoilsDOI 10.1007/s00374-006-0122-5
S. Ruppel (*) : J. RühlmannInstitute of Vegetable and OrnamentalCrops Grossbeeren/Erfurt e.V.,Theodor-Echtermeyer-Weg 1,14979 Grossbeeren, Germanye-mail: [email protected]
V. Torsvik : F. L. Daae : L. ØvreåsDepartment of Biology, University of Bergen,Jahnebakken 5, P.O. Box 7800, N-5020 Bergen, Norway
cycling processes in agricultural soils. One of the majorreasons for the absence of information on microbialdiversity in relation to nutrient availability in soils is thelack of suitable methods for assessing this diversity(Nannipieri et al. 2003; Schipper et al. 2001).
The determination of community-level physiologicalprofiles (CLPP) has been used to monitor the potentialfunctional prokaryotic diversity (Garland et al. 2001), and itis based on measurements of substrate utilisation evennessand substrate utilisation richness—the two components ofdiversity (Shannon index, Magurran 1988). The limitation ofthe CLPP method, however, is that it refers only to theculturable part of the microbial population and does not tellanything about phylogenetic community structures. Changesin CLPP are not necessarily based on phylogenetic structuralchanges (Miethling et al. 2003). Until recently, phylogeneticdiversity studies mainly consisted of qualitative analysesusing, for example, PCR-DGGE or PCR-TGGE (Øvreås etal. 1997; Muyzer and Smalla 1998). However, the develop-ment of quantitative real-time PCR methods now offers thepossibility to also quantify genes of interest in environmentalsamples (Neusser 2000; Stubner 2002).
Our objective was to measure and quantify the effect of along-term application of hard- and easy-to-decompose organ-ic matter and mineral N on prokaryotic functional diversity ina sandy soil, and to analyse whether functional prokaryoticdiversity is related to phylogenetic diversity within bothdomains, the bacteria and archaea. The hypothesis of thisstudy was a functional and phylogenetic adaptation of the soilprokaryotic community to the special substrates applied forover the last 27 years, e.g., that prokaryotic diversity iscorrelated to N availability in the sandy soil.
Materials and methods
Long-term field experimental site and treatments
The long-term field experiment involving a 4-year croprotation of vegetable crops unfertilised and fertilised uniform-ly with P, K, Ca andMg is located in Grossbeeren 20 km southof Berlin (Germany) and was established in 1973 (Rühlmann2003). Over the last 50 years, the mean air temperature wasabout 8.4°C and the annual precipitation was 527 mm onaverage. The soil is loamy sand with 53.2% fine sand (20–200 μm), 35.3% coarse sand (200–2,000 μm) and 5.48%clay (<2 μm). The seven types of fertilisation treatments are:(1) unfertilised N (control), (2) amended with hard-to-decompose pine bark, (3) easy-to-decompose harvest resi-dues, (4) manure, (5) combined application of pine bark +harvest residues, (6) combined application of manure +harvest residues and (7) fertilised with mineral N (NH4NO3)(7). Organic material was mixed into the first 30 cm soil
layer. The amount of N and C applied yearly are documentedin Table 1. In the field, each treatment was carried out in a2-m2 soil plot established in a randomised block design andwas replicated four times. In 2000, after 27 years of applyingknown quantities of N and C to the soil, the total N (Nt) andorganic C (Ct) of soil and soil microbial biomass contents foreach of the soil plots were determined (Table 2).
Soil sampling
In spring 2000, before vegetables were planted, soil was takenfrom the 0- to 30-cm soil layer using soil cores (2 cm indiameter). For each plot, eight random samples were taken,mixed, sieved <2mm, aliquoted and stored at −20°C until soilmicrobial and chemical parameters were investigated.
Soil microbial biomass
Microbial biomass carbon (Cmic) content of soil wasdetermined using the substrate-induced respiration activitymeasurement (SIR) with an automatic infrared gas analyser(Heinemeyer et al. 1989). The Cmic content was calculatedaccording to the correlation of SIR with the fumigationincubation method (Anderson and Domsch 1978) using thecalibration factor 40.04. The soil was mixed with glucose(2 mg g−1 soil) and analysed under continuous gas flow at20°C±1 K. Microbial biomass C, which encompasses allrespiratory active soil organisms, are able to metaboliseglucose, is expressed as ‘μg Cmic g
−1’ dry soil. Soil basalrespiration activity (R) was measured by an infrared gasanalyser without addition of substrates (4–16 h, 20°C±1 K)and expressed as ‘μg CO2–C g−1 dry soil h−1’.
The metabolic quotient (qCO2), a measure of specificrespiration activity of the soil microflora (Anderson andDomsch 1993), was calculated as follows:
qCO2 ¼ 0:001 � Rð Þ Cmic ng CO2�C μg�1Cmic h�1
� ��
ð1Þ
Table 1 Yearly total N and C supply via organic and mineralfertilisation of the different treatments
Treatment N supply(kg N ha−1 y−1)
C supply(kg C ha−1 y−1)*
Control (co) 0 (only root residues) 0 (only root residues)Pine bark (pi ba) 15 2,140Harvest residues(res)
45 770
Manure (ma) 100 2,250Pi ba+res 60 2,910Ma+res 145 2,950Mineral N 120 0
*Published in (Rühlmann 2003)
Biol Fertil Soils

Soil prokaryotic potential functional diversity
Prokaryotic potential functional diversity was measured ascommunity-level physiological profiles (CLPP) using theBiolog system and Gram-negative (GN) and Gram-positive(GP) MicroPlates™ (Oxoid GmbH). Prokaryotic cells wereseparated from soil samples by shaking (290 rpm) 10 g soilwith 90 ml 0.05 M NaCl+10 glass beads at 4°C for 1 h. Soilparticles and glass beads were pelleted by centrifugation(664×g, 3 min). Prokaryotic cells in the supernatant werethen harvested by centrifugation (2,872×g, 30 min, 5°C),followed by washing twice in 0.05 M NaCl solution andfurther centrifugation (2,872×g, 30 min, 5°C) to remove allC and nutrient sources that originated from the soil. Next,150 μl of the washed and resuspended prokaryotic cellswere inoculated into each well of the GN and GP Micro-Plates™ and then incubated for 72 h at 29°C. During theincubation, color development was measured using amicroplate reader (anthos htIII) at 590 nm at 24, 30, 48,54 and 72 h. Given that well A1 was blank, the substrateutilisation diversity (H), which encompasses both substrateutilisation richness (S) and substrate utilisation evenness(E), was quantified as:
H ¼ �X
pi ln pið Þ ð2Þwhere pi is the ratio of the activity for a particular substrateto the sum of activities for all substrates. Similarly,substrate utilisation evenness (E) is a measure of the extentof uniformity of activities for all utilised substrates and isgiven by:
E ¼ H=H max ð3Þ
H max ¼ ln S ð4ÞWhere H is the substrate utilisation diversity and S is the
number of different substrates utilised.According to Zak et al. (1994), C substrates from GN
and GP MicroPlates™ were divided into five main
substrate groups: amino acids, carboxylic acids, carbohy-drates, amines/ amides, polymers and miscellaneous.Substrate utilisation patterns of the soil microflora withrespect to the fertilisation treatments were assessed at asingle-point reading of the plates, where the average wellcolor development (AWCD) was nearly equal at all treat-ments (Garland et al. 2001). The classification wasperformed using a stepwise discriminant analysis (canonicalvariate analysis) for the respective F value to enter variablesinto the discriminant function. The F value describes indetail the statistical significance a variable has with respectto the disjunction between the groups. To evaluate thediscriminating power between the respective group meanvalues, squared Mahalanobis distances were calculated andthe correctness of classification was determined on the basisof posterior classification probabilities. Significant dis-tances were obtained when P value <0.05.
Extraction of soil prokaryotic DNA, quantitative real-timePCR, PCR-DGGE and sequencing
Prokaryotic DNAwas extracted from 250 mg soil using theUltraClean™ microbial DNA Isolation Kit (MO BIOLaboratories, Solana Beach, CA, USA). DNA yield andpurity were determined by measuring the absorbance at260 nm (A260) and 280 nm (A280), respectively, and aliquotswere stored at −20°C.
DNA samples isolated directly from the soil were tenfoldand 100-fold diluted in sterile water in duplicate and analyseswere performed on undiluted and the two dilutions of thesamples. Quantitative real-time PCR was conducted usingSYBRGreen™ technology and measured in an iCycler iQ™real-time detection system (BioRad Laboratories, Munich,Germany). To enumerate copy numbers, the bacterialprimers 519f (CAGCMGCCGCGGTAANWC; Seq. 5′-to3′, where M=A+C, N=A+C+G+T and W=A+T) and 907r(CCGTCAATTCMTTTRAGTT; Seq. 5′-to 3′, whereM=A+C, R=A+G) (Lane 1991; Stubner 2002) and thearchaea primers Ar3f (TTCCGGTTGATCCTGCCGGA;
Table 2 Long-term fertilisation effect on soil total C content (Ct), soil total N content (Nt), soil microbial biomass content (Cmic), basal respirationactivity (R) and the metabolic quotient (qCO2)
Treatment Ct (%) Nt (μg g−1 soil) Cmic (μg Cmic g−1 soil) R (μg CO2–C g−1 soil h−1) qCO2 (ng CO2–C μg−1Cmic)
Control (co) 0.64 a 59.67 a 34.26 a 0.15 a 4.46 aPine bark (pi ba) 0.90 c 70.07 b 59.11 b 0.33 b 5.68 abHarvest residues (res) 0.78 b 72.18 bc 56.94 b 0.29 b 5.23 abManure (ma) 1.03 d 94.95 d 65.71 bc 0.34 b 5.16 abPi ba+res 1.04 d 79.68 c 73.31 c 0.42 b 5.84 bcMa+res 1.20 e 100.82 d 59.49 b 0.39 b 6.70 cMineral N 0.71 ab 63.50 ab 43.80 a 0.37 b 6.35 bc
Mean values of four replicatesTukey’s HSD test at a P level of ≤5%; different letters within a row indicate significant differences
Biol Fertil Soils
Seq. 5′to 3′) and Ar9r (CCCGCCAATTCCTTTAAGTTTC;Seq. 5′to 3′) (Jurgens et al. 2000) were used. The real-timePCR reaction mixture contained 12.5 μl QuantiTect SYBR®Green 2x master mix (Qiagen, Hilden, Germany), 300 nM ofeach primer and 2.5 μl of the DNA template in a finalvolume of 25 μl.
The PCR program was initiated with a hot start step of15 min at 95°C required for the activation of the DNApolymerase followed by 50 cycles each consisting of thefollowing steps: 95°C for 15 s, 53°C for 30 s and 72°C for42 s. A final elongation step was performed at 72°C for10 min. This was followed by a DNA melting protocolconsisting of 85 cycles of 30 s with a Δ t of 0.5 K increaseper cycle beginning at 55°C. The melting profile wasrecorded to verify the quality of the SYBRGreen Iquantification to avoid the possibility of false positivesignals induced by primer dimmers or other non-specificPCR products. As standards, purified PCR products wereused (QIAquick PCR purification kit, Qiagen, Hilden,Germany). The standard was set between 1 and 108 copiesμl−1 in tenfold dilutions. The target copy number wascalculated using the molecular weight of one target copyand spectrophotometric DNA quantification taken atλ=260 nm (Eppendorf® spectrophotometer).
The variable V3 region of the 16S rRNA genes (smallsubunit ribosomal RNA) was amplified by PCR as describedby (Øvreås et al. 1997), using primer sets that specificallytarget bacteria and archaea. The archaea were amplified bynested priming using outer primers 21f and 958r (DeLong etal. 1994) and inner primers for the V3 region (Øvreås et al.1997). The forward primers were extended with a GC clamp(Muyzer et al. 1993). Sterile water was used for the no-template negative control. Amplified products were checkedon a 1.7% agarose ethidium bromide stained gel, andsubsequently analysed by DGGE. DGGE was performedwith a Hofer Scientific SE600 vertical dual-cooler system.PCR samples were analysed on 8% (wt/vol) polyacrylamidegels in 0.5% TAE (20 mM Tris, 10 mM acetate, 0.5 mMNa2EDTA, pH 7.4) with a linear gradient of urea andformamide from 25–65% as denaturant. After electrophore-sis, the gels were stained for 45 min with SYBR gold andphotographed on a UV transillumination table with a digitalcamera. Band composition and fingerprint analyses wereconducted using the software Biostep/Phoretics 1D, Database5.2 (Biostep, UK), cluster analysis was based on the Pearsoncoefficient, and dendograms were constructed from neigh-bour-joining algorithms (Biostep, UK).
Distinct bands from the archaeal PCR-DGGE gel werecut out and eluted in water overnight. Eluates were used astemplates and reamplified and then sequenced using theBigDye-terminator cycle sequencing kit (Perkin ElmerApplied Biosystems) according to the manufacture’s rec-ommendations. The sequences were analysed with an ABI
377 DNA sequencer (Perkin Elmer Applied Biosystems).Determination of the phylogenetic affiliation of the SSUrDNA fragments was performed by a BLAST search of theNational Center for Biotechnology Information database.The DGGE band sequences were aligned to relatedsequences retrieved from the GenBank database. Distancematrices were calculated using the Clustal X GraphicalMultiple Alignment Program (Rosalind Franklin Centre forGenomics Research).
Statistics
Comparison of mean values of four field replicates (treat-ments, see Table 1) was performed using ANOVA/MANOVA analysis and Tukey’s HSD test at a P level of≤5%. Pearson-type correlations (r) were calculated at a Plevel of ≤5% (STATISTICA 6.0) (StatSoft 2001). Multi-variate discriminant analysis was calculated using STATIS-TICA 6.0 software. Significant discrimination between soilfertilisation treatments are shown in graphs as ellipses of a95% confidence interval.
Results
Nitrogen supply related to plant yield and the soil microbialbiomass
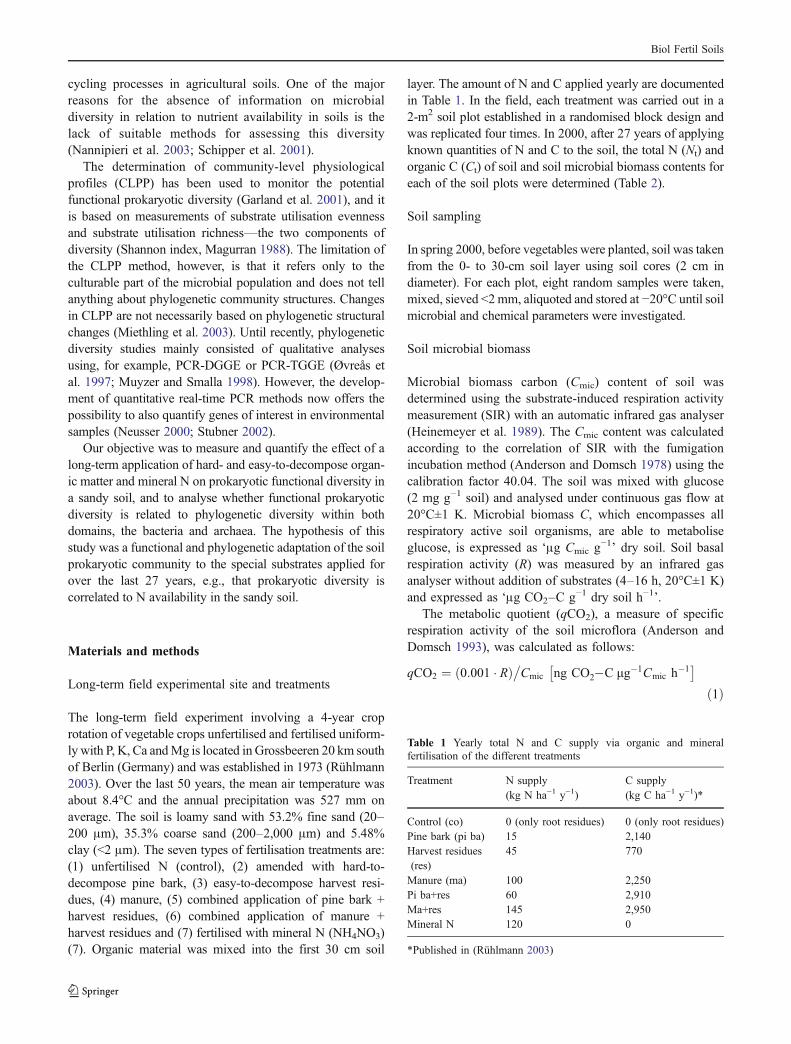
Twenty-seven years of application of hard- or easy-to-decompose organic material with different N contents ormineral N fertilisation led to significant yield differences inplant production. For example, leek yield increased withincreasing amounts of applied N (Fig. 1). Highest leek yieldwas achieved with a mineral N supply of 120 kg N ha−1
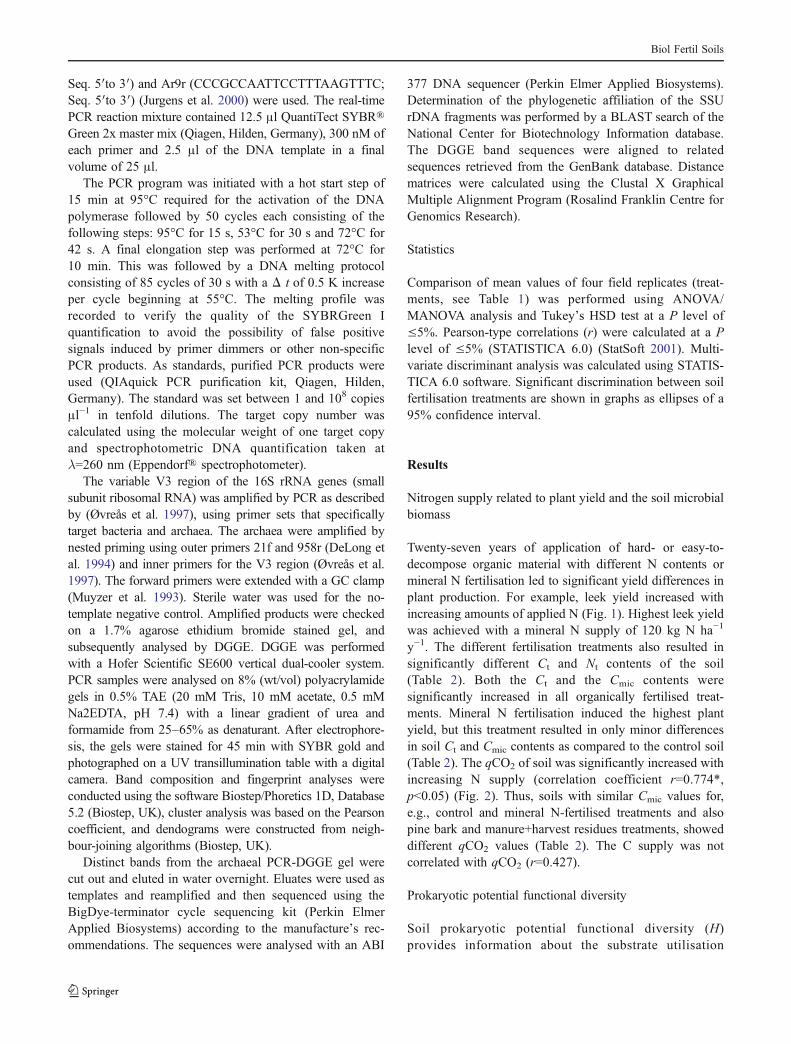
y−1. The different fertilisation treatments also resulted insignificantly different Ct and Nt contents of the soil(Table 2). Both the Ct and the Cmic contents weresignificantly increased in all organically fertilised treat-ments. Mineral N fertilisation induced the highest plantyield, but this treatment resulted in only minor differencesin soil Ct and Cmic contents as compared to the control soil(Table 2). The qCO2 of soil was significantly increased withincreasing N supply (correlation coefficient r=0.774*,p<0.05) (Fig. 2). Thus, soils with similar Cmic values for,e.g., control and mineral N-fertilised treatments and alsopine bark and manure+harvest residues treatments, showeddifferent qCO2 values (Table 2). The C supply was notcorrelated with qCO2 (r=0.427).
Prokaryotic potential functional diversity
Soil prokaryotic potential functional diversity (H)provides information about the substrate utilisation
Biol Fertil Soils
richness (S) and evenness (E) of the fast-growingprokaryotic community in the soils subjected to differentlong-term fertilised treatments. The prokaryotic potentialfunctional diversity was significantly reduced in treat-ments with high N availability, such as the mineralN-fertilised and the manure+harvest residues fertilisedtreatments as compared to the unfertilised control plots.However, the diversity was still quite high, with 76% ofthe maximal possible diversity of 4.55 for our experi-mental set-up. The reduced functional diversity was dueto reduction, both in substrate richness and evenness ofsubstrate utilisation (Table 3). Both prokaryotic evennessand substrate utilisation richness were negatively corre-lated with the amounts of N supplied (Fig. 2). Withincreasing N supply to the soil, the prokaryotic commu-nity shifted to a higher specialised utilisation of lesssubstrates. There were no other significant correlationsbetween prokaryotic potential functional diversity andsoil parameters such as basal respiratory activity, Ct andCmic detectable (r=0.044, r=−0.029, r=0.226, respective-ly). The soil P, K and Mg contents were also not corre-lated with prokaryotic functional diversity (r=0.076,0.057 and 0.008, respectively).
Community-level physiological profiling
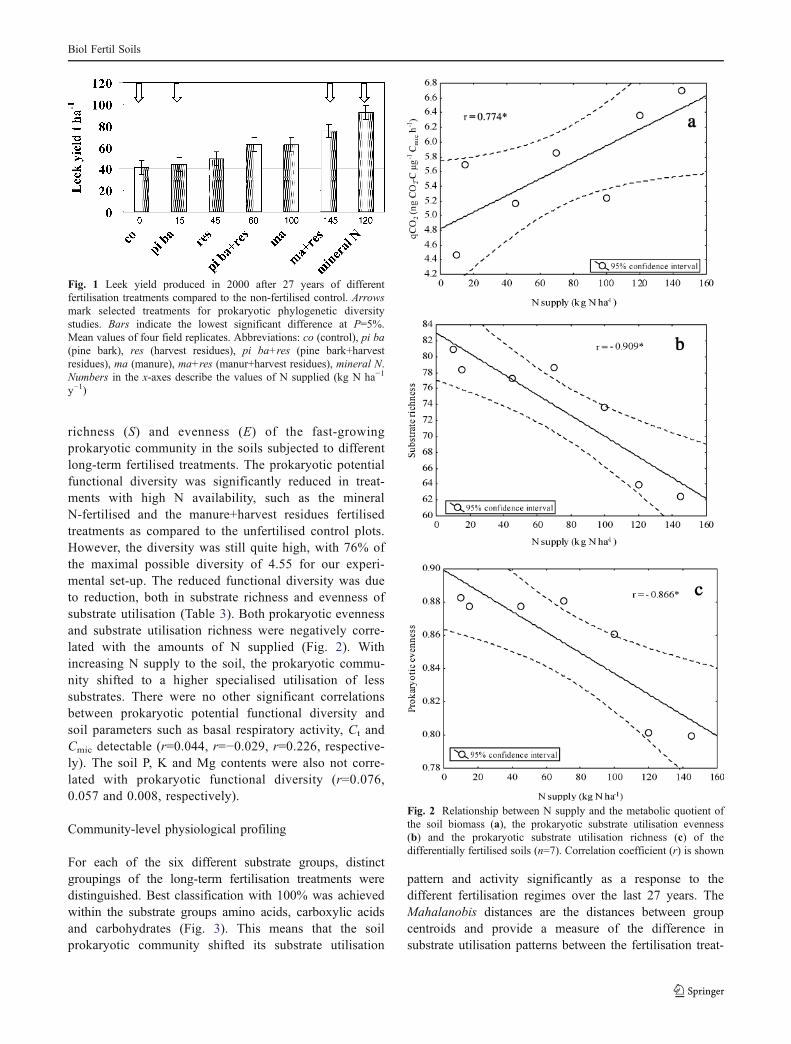
For each of the six different substrate groups, distinctgroupings of the long-term fertilisation treatments weredistinguished. Best classification with 100% was achievedwithin the substrate groups amino acids, carboxylic acidsand carbohydrates (Fig. 3). This means that the soilprokaryotic community shifted its substrate utilisation
pattern and activity significantly as a response to thedifferent fertilisation regimes over the last 27 years. TheMahalanobis distances are the distances between groupcentroids and provide a measure of the difference insubstrate utilisation patterns between the fertilisation treat-
Fig. 2 Relationship between N supply and the metabolic quotient ofthe soil biomass (a), the prokaryotic substrate utilisation evenness(b) and the prokaryotic substrate utilisation richness (c) of thedifferentially fertilised soils (n=7). Correlation coefficient (r) is shown
Fig. 1 Leek yield produced in 2000 after 27 years of differentfertilisation treatments compared to the non-fertilised control. Arrowsmark selected treatments for prokaryotic phylogenetic diversitystudies. Bars indicate the lowest significant difference at P=5%.Mean values of four field replicates. Abbreviations: co (control), pi ba(pine bark), res (harvest residues), pi ba+res (pine bark+harvestresidues), ma (manure), ma+res (manur+harvest residues), mineral N.Numbers in the x-axes describe the values of N supplied (kg N ha−1
y−1)
Biol Fertil Soils

ments. The higher the Mahalanobis distances between thecentroids of the fertilisation treatment groups, the higher arethe differences in the substrate utilisation pattern of themicroflora in the fertilisation treatments.
The major differences in the prokaryotic substrateutilisation patterns were observed between the pine-bark-fertilised treatment and the treatments with the highest Nsupply (ma+res and mineral N), and also between pine barkand the unfertilised control (Fig. 3). Although the function-al diversity, measured as diversity indices (H), evenness (E)
and substrate richness (S), was similar in the control andpine bark treatments (Table 3), their substrate utilisationpatterns were significantly different (Fig. 3). That meansthat although the levels of functional prokaryotic diversity,calculated according to the Shannon index, were the same,the substrate utilisation pattern and activity of the prokary-otic community can be significantly different. Interpretingthe discriminant functions allows the evaluation of thecontribution of each substrate to the discrimination be-tween the groups. The larger the standardised coefficient
Table 3 Long-term fertilisation effect on the prokaryotic functional diversity calculated using substrate richness and substrate utilisation evennesson Gram-negative (GN) and Gram-positive (GP) MicroPlates™
Treatment GN- MicroPlates™ GP- MicroPlates™
Functionaldiversity
Substraterichness
Substrateevenness
Functionaldiversity
Substraterichness
Substrateevenness
Control 4.08 82.05 0.89 4.04 80.95 0.88Pine bark (pi ba) 4.07 81.05 0.89 4.00 78.40 0.88Harvest residues(res)
3.98 76.55 0.87 3.92 73.56 0.86
Manure (ma) 4.05 80.65 0.89 4.00 77.25 0.87Pi ba+res 4.10 83.50 0.90 4.02 78.60 0.88Ma+res 3.97 75.55 0.87 3.65* 62.45* 0.80*Mineral N 3.76* 66.50* 0.82* 3.66* 63.95* 0.80*LSD P=5% 0.25 12.01 0.055 0.33 14.17 0.074
Mean values of four field replicates*Significant differences between the control and treatments analysed using HSD test at P=5%
-30 -20 -10 0 10 20 30 40 50
Root 1
-15
-10
-5
0
5
10
15
20
Roo
t 2
control manure (ma) pine bark (pi ba) harvest residues (res) ma + res mineral N pi ba + res
Fig. 3 Results of thediscriminant analysis ofsubstrate utilisation patternsfrom prokaryotic communitiespresent in soil of long-term different fertilisationtreatments within the substrategroup of carbohydrates.Four replicates of each treatmentwere analysed afterMicroPlate™ incubationof 54 h
Biol Fertil Soils

is, the greater the contribution of the respective substrate tothe discrimination between the groups. Therefore, withinthe substrate group carbohydrates, the prokaryotic differen-tial metabolisation of mannan, α-methyl D-galactoside,N-acetyl-D-glucosamine, cellobiose and D-melizitose con-tributed to the largest extent (had highest standardisedcoefficients of root 1) to the discrimination between thepine-bark-fertilised and the other treatments.
Ratios of archaea vs bacteria in the prokaryoticcommunities
The four most contrasting treatments of functional diver-sity, Cmic and qCO2 studies (Fig. 1 marked with arrows)were chosen for a first investigation of the phylogeneticprokaryotic community structures and interrelatednessbetween plant productivity, N availability and functionalprokaryotic community diversity. Therefore, the domainsbacteria and archaea were quantified in the soil samplesusing real-time PCR, the bacterial and archaeal communitystructures were monitored using PCR-DGGE and domi-nant bands from the archaeal DGGE were sequenced. Thebacterial and archaeal 16S rDNA copy numbers per μgDNA isolated from soil were not significantly affected bythe long-term fertilisation of pine bark or manure+harvestresidues or by mineral N compared to the unfertilisedcontrol treatment (Table 4). Overall, the archaeal copynumbers in our soils amounted to only 0.7 to 3.8% of thebacterial copy numbers. Archaeal abundance remainedlow even after considering that the number of rDNAoperons in archaea varies from 2 to 4, and that in bacteriathis can be as high as 2–15 (E. coli has 7) (The RibosomalRNA Operon Copy Number Database, http://rrndb.cme.
msu.edu/). The proportions of archaeal relative to bacterial16S rDNA copy numbers were lower in the soil sampleswith high N supply (fertilised with the easy-to-decomposemanure+harvest residues and the mineral N) as comparedto the control soil. In the soil fertilised with the hard-to-decompose pine bark, the archaea increased relative to thebacteria (Table 4).
Bacterial community structure
Comparative analyses of the bacterial community compo-sition in the different fertilised treatments of the loamysandy soil was performed by DGGE separation of thebacterial 16S rDNA PCR products, amplified directly fromthe soil prokaryotic DNA. Although the DGGE fingerprintappeared as a smear of bands, between 30 and 42 bands attop of the smear could be analysed from the gel. Clusteranalysis based on band pattern matching established twomain distinct clusters, which indicates that long-termdifferential fertilisation of the sandy soil affected thephylogenetic composition of the bacterial community(Fig. 4). Bacterial communities in soils fertilised with highamounts of N clustered together and showed a similarcomposition of the bacterial community. On the other hand,the control and pine-bark-fertilised treatments, whichreceived nearly no N during the last 27 years and producedthe lowest leek yield, clustered together and exhibited asimilar composition of the bacterial community. Due to thebackground smear detected in the DGGE for the bacterial16S rDNA PCR products, phylogenetic analysis based onsequencing of distinct bands was omitted.
Archaeal phylogenetic community structure
PCR-DGGE fingerprinting analysis of the 16S rDNA frag-ments from the soil archaeal community resulted in profileswith fewer bands compared to those found for bacterialcommunities. The number of archaeal bands varied between24 and 29 with the lowest number of bands (24) beingobserved for soil fertilised with manure+harvest residues andthe highest (29) for soil fertilised with pine bark (Fig. 5).Cluster analysis based on band-pattern matching revealedthree distinct clusters. As for the bacterial community, thearchaeal community profile from the control and the pine-bark-fertilised treatments were similar and clustered together,while the treatments fertilised with mineral N and withmanure+harvest residues showed well-defined band patternscontaining different numbers of distinct bands (Fig. 5). Thus,the composition of archaeal community seems to be affectedby long-term application of readily available N into the soil,while the application of hard-to-decompose pine bark did notaffect the archaeal community composition compared to theunfertilised control.
Table 4 Copy numbers of 16S rDNA of the two domains bacteria andarchaea measured within the sandy soil after long-term differentiallyfertilised treatments
Treatment Archaea (logcopy numbersμg−1 DNA)
Bacteria (logcopy numbersμg−1 DNA)
Proportion ofarchaeal tobacterial copynumbers (%)*
Control 5.96 8.01 0.85Pine bark 6.36 8.36 3.78Manure+harvestresidues
6.51 8.71 1.28
Mineral N 5.56 7.83 0.75LSD P=5% 1.78 1.11
The proportion of Archaea (%) relative to Bacterial copy numbers isprovided. Mean values of four field replicates are shown*Calculation based on non-logarithmic copy numbers
Biol Fertil Soils

Archaeal sequencing and phylogeny
Sequencing of distinct bands from the archaeal DGGE anda Blast search of the NCBI database revealed hits ofuncultured organisms only (Fig. 6). The phylogeneticrelationships of these sequences are depicted in Fig. 6.Most of the sequences, showed phylogenetic affiliationwith sequences derived from uncultured Crenarchaeota. Nosequences affiliated with the Korarchaeota or the meth-anogenic group within the Euryarchaeota were detected.Only one sequence (pl22) was affiliated to a Euryarchaeotastrain from maize roots and it was only detected in the soilsamples collected from the mineral N fertilised treatment.
In treatments with high N supply (manure+harvest resi-dues, mineral N), sequences were derived that were similar tothe uncultured soil archaeon sequences SCA11 and AY017(Fig. 6). Finally, five sequences derived from all four soilfertilisation treatments were found to be affiliated touncultured archaeaon sequences found in a forest arctictundra soil (Accession number in GenBank AY016472).
Discussion
Prokaryotic diversity related to N availability
Prokaryotic communities in soil comprise members fromthe two domains bacteria and archaea. Bacterial communi-ties are known to be among the main driving forces in theprocesses of organic matter decomposition and soil forma-
tion (DeRuiter et al. 1998). Our study provided evidencethat the organic C content and the C composition of thesandy soil is closely related to the soil microbial biomassand their catabolic diversity. Studies on and understandingof archaeal communities in agricultural soils are still in theirinfancy. Previously, archaea were thought to be presentonly in extreme environments including those at hightemperatures, high salinity, extreme pH or strict anoxicconditions (Balows et al. 1992). However, recent identifi-cation of large numbers of archaea in non-extreme habitatssuch as boreal forest soils, pelagic water of a boreal forestlake, temperate estuary sediments (Jurgens 2002), in oceanwater (DeLong 1992; Fuhrman et al. 1992) and also in ourstudies has changed our view of this group.
Nitrogen availability and the potential functional pro-karyotic diversity were correlated, and this it may indicatethat community composition of both the bacterial and thearchaeal domains depend on the long-term application ofspecific substrates. Therefore, the long-term fertilisationexperiment provided an ideal basis to investigate the effectsof alternate organic and inorganic fertilisation with increas-ing N amounts on the physical, chemical and microbiolog-ical characteristics of soil. Long-term experiments areespecially suitable because changes in the soil organicmatter pools (SOM) occur very slowly, and a long time isneeded to determine the impact of fertilisation treatments(Bendig et al. 2000).
In our study, long-term application (more than 27 years) ofqualitatively contrasting organic materials with increasing Namounts and mineral N fertilisers led to significantly different
Fig. 5 Result of PCR-DGGE band composition analysis of archaeal16S rDNA fragments from archaeal communities present in the soil.DNA was extracted directly from soil samples (mean of four
replicates) taken from long-term fertilised treatments without fertilisa-tion (co), fertilised with pine bark (pi ba), manure+harvest residues(ma+res) and mineral N
Fig. 4 Result of PCR-DGGE band pattern analysis of bacterial 16SrDNA fragments from bacterial communities present in the soil. DNAwas extracted directly from soil samples (mean of four replicates)
taken from long-term fertilised treatments without fertilisation (co),fertilised with pine bark (pi ba), manure+harvest residues (ma+res)and mineral N
Biol Fertil Soils

plant yields (Fig. 1), chemical and microbiological soilcharacteristics (Table 2). The same yield increases as withleek were achieved over the last 5 years with differentvegetable species (Ellmer et al. 1999). Our results from asandy soil demonstrated a positive correlation between plantproductivity and N supply and a negative correlation betweenplant productivity (N supply) and potential functionalprokaryotic diversity, describing the diversity of soil prokary-otes, which grow fast on the defined C sources on the Biologmicrotiter plates. These organisms do not reflect the totalcommunity; however, they may contribute significantly tothe nutrient cycling in the soil. Both plant productivity andprokaryotic functional diversity were not correlated to Csupply or availability of P, K or Mg in the soil.
This study highlights the adaptation of the prokaryoticcommunity composition to the N availability in the soil. Bothsubstrate utilisation richness and prokaryotic evenness signif-icantly decreased with increasing N supply to the sandy soil. Incontrast, Schipper et al. (2001) measured only changes in theheterotrophic evenness in five successional sequences anddid not see a change in substrate utilisation richness; theyhypothesised a dependency of heterotrophic evenness fromavailable organic C, as there was a positive correlationbetween evenness and soil respiration activity. In our studies,within a sandy soil and a Ct range between 0.6 to 1.2%, nosignificant correlation between C availability and prokaryoticpotential functional diversity was found. Also, no correlationbetween diversity and soil respiratory activity was detectable.Otherwise, the prokaryotic communities adapted to thesubstrates applied for over the last 27 years.
The prokaryotic community of soil treated with pinebark metabolised the hard-to-decompose C sources, e.g.mannan, cellobiose, Tween 40, Tween 80 and otherpolymers at significantly higher rates than prokaryoticcommunities from soil treated with high N supply (i.e.manure+harvest residues and mineral N fertilised). Thisobservation could be explained either by a shift in theprokaryotic community composition or by a shift in thecatabolic potential of the prokaryotic community and theirability to express several physiological adaptations tonutrient limitations (Konopka 2000).
One common response is to maximise nutrient transportby increased synthesis of membrane-bound permeases forthe limiting nutrient (or by initiating the synthesis of high-affinity transport systems) (Konopka 2000). Mannan isenriched (up to 11% of plant dry matter) in pine trees, andthis substrate proved to be mainly responsible for thefunctional differentiation between the prokaryotic popula-tions in the pine-bark-fertilised soil and the other treat-ments. Additionally, higher levels of bacteria compared toarchaea were measured within the N enriched soil. If, forour system, productivity is defined to be equal to plantyield and plant growth, then in the high-yield treatments,the potential functional diversity was lowest and fewerdifferent substrates were more intensively used. Thisobservation indicates a dominance of species adapted toreadily available substrates.
In our study, we measured the highest functionaldiversity in the unfertilised control soil, which showed thelowest metabolic quotient (qCO2), and this probably
Fig. 6 Phylogenetic tree showing the position of partial SSU rDNAsequences of archaeal DGGE bands retrieved from long-termunfertilised (co), fertilised with pine bark (pi ba), manure+harvestresidues (ma+res) and mineral N soil. Selected SSU rDNA sequences
belong to different subgroups of cultured and uncultured archaealsequences. The numbers of the sequences denote DGGE bandnumbers. The Korarchaeota sequence was used as outgroup reference
Biol Fertil Soils

reflects the presence of a highly efficient substrateutilisation activity of the community of this soil. Anderson(1994) and Torsvik et al. (2002) documented that energet-ically, a community with high diversity has lower entropyand needs less maintenance energy than a community withlow diversity.
This study seems to indicate that the parallels betweenprokaryotic diversity and productivity in aquatic systems(Pankhurst 1997b) are also valid for our soil system.Moreover, we demonstrated that the shift in the prokaryoticfunctional diversity was connected to a shift in theirphylogenetic structure within both domains: bacteria andarchaea.
Phylogenetic diversity
Under conditions of high competitiveness for substrates,members of the archaeal domain seemed to increase relativeto bacterial numbers, even in agricultural soils (Table 4). Toquantify the archaeal and bacterial 16S rDNA copynumbers in DNA extracted from soil samples, a real-timePCR approach using specific primer pairs was used.Formerly, this method has been successfully applied toquantify bacteria by targeting bacterial specific 16S rDNAregions (Stubner 2002), archaeal SSU rDNA sequences(Takai and Horikoshi 2000) and even to quantify genes forproteolytic activity (Bach et al. 2002). The estimatedarchaeal copy numbers reached a maximum of 3.8% ofthe bacterial numbers in the loamy sandy soil fertilised withpine bark over 27 years (Table 4).
Research on the diversity of archaea in soil (apart fromeuryarchaeotal methanogens) is a rather new topic in soilprokaryotic diversity studies and only started after thediscovery of a novel Crenarchaeota in forest soil in Finlandin 1996 (Jurgens 2002). However, our results demonstratethat previously ‘unknown’ archaea also exist in intensivelyused ‘non-extreme’ soil samples, and that most of thesequences are similar to those of uncultured Crenarchaeota.These findings agree with results of Ochsenreiter et al.(2003) who suggested that soil Crenarchaeota represent astable and specific component of the microbiota interrestrial habitats. With nonthermophilic crenarchaeota-specific primers, they established a rapid method toquantify archaeal 16S rDNA in real-time PCR and detecteda relative abundance of crenarchaeotal rDNA of 0.5–3% inbulk soil sample and only 0.16% in the rhizosphere of asandy ecosystem. Similarly, we obtained a figure ofbetween 0.7 and 3.8% where the lower numbers were alsodetected in nutrient-rich conditions. The application of pinebark enriched the proportion of archaea relative to thebacterial numbers in soil. A phenomenon observed in thereal-time PCR results as well as in the increased density ofDGGE bands within the pine-bark-fertilised treatment.
Surprisingly, however, no methanogens were detected inour soils, whether the archaeal community, with only about0.7–3.8% of the bacterial 16S rDNA copy numbers, has asignificant impact on decomposition activity and nutrientcycling in agricultural soils needs to be investigated in thefuture. Further studies should also be performed toelucidate the importance of the shifts in prokaryoticfunctional and phylogenetic diversities and the archaealcontribution to sustaining or improving soil functions.
Acknowledgements We sincerely thank Birgit Wernitz for hermicrobial laboratory work and Dr. Ruth Willmott for language editingthis text. The work was financially supported by DAAD and CostAction 831.
References
Anderson T-H (1994) Physiological analysis of microbial communi-ties in soil: applications and limitations. In: Ritz K, Dighton J,Giller KE (eds) Beyond the biomass. British Society of SoilScience, A Wiley-Sayce Publication, pp 67–76
Anderson JPE, Domsch KH (1978) A physiological method for thequantitative measurement for microbial biomass in soils. SoilBiol Biochem 10:215–221
Anderson T-H, Domsch KH (1993) The metabolic quotient for CO2
(qCO2) as a specific activity parameter to assess the effects ofenvironmental conditions, such as pH, on the microbial biomassof forest soils. Soil Biol Biochem 25:393–395
Bach H-J, Tomanova M, Munch JC (2002) Enumeration of totalbacteria and bacteria with genes for proteolytic activity in purecultures and in environmental samples by quantitative PCRmediated amplification. J Microbiol Methods 49:235–245
Balows A, Trüper HG, Dworkin M, Harder W, Schleifer K-H(1992) The Prokaryotes, vol. I. Budapest, Springer, BerlinHeidelberg New York, London, Paris, Tokyo, Hong Kong,Barcelona, pp 11–18
Bendig GD, Putland C, Rayns F (2000) Changes in microbialcommunity metabolism and labile organic matter fractions asearly indicators of the impact of management on soil biologicalquality. Biol Fertil Soils 31:78–84
Degens BP, Schipper LA, Sparling GP, Vojvodic-Vukovic M (2000)Decrease in organic C reserves in soils can reduce the catabolicdiversity of soil microbial communities. Soil Biol Biochem32:189–196
DeLong EF (1992) Archaeal in costal marine environments. ProcAcad Sci USA 89:5685–5689
DeLong EF, Wu KY, Prezelin BB, Jovine RVM (1994) Highabundance of Archaea in Antarctic marine picoplancton. Nature371:695–697
DeRuiter PC, Neutel A-M, Moore JC (1998) Biodiversity in soilecosystems: the role of energy flow and community stability.Appl Soil Ecol 10:217–228
Ellmer F, Geyer B, Grimm J, Herden S, Mollenhauer S, Peschke H,Richter K, Rühlmann J, Schmaler K (1999) Grundlagenumweltschonender Bodennutzungsstrategien im norddeutschenTiefland. In: Autorenkollektiv (ed) Ökologische Hefte der land-wirtschaftlichen Fakultät: Erträge der Fruchtarten. Heft 11,Humboldt-Universität zu Berlin, S, pp 126–142
Fuhrman JA, McCallum K, Davis AA (1992) Novel major archae-bacterial group from marine plankton. Nature 356:148–149
Biol Fertil Soils

Garland JL (1996) Patterns of potential C source utilization byrhizosphere communities. Soil Biol Biochem 2:223–230
Garland JL, Mills AI (1991) Classification and characterization ofheterotrophic microbial communities on the basis of patterns ofcommunity-level sole-carbon-source utilization. Appl EnvironMicrobiol 57:2351–2359
Garland JL, Mills AL, Young JS (2001) Relative effectiveness ofkinetic analysis vs single point readings for classifying environ-mental samples based on community-level physiological profil-ing (CLPP). Soil Biol Biochem 33:1059–1066
Heinemeyer O, Insam H, Kaiser EA, Walenzik G (1989) Soil microbialbiomass and respiration measurements: an automated techniquebased on infra-red gas analysis. Plant Soil 116:191–195
Jurgens G (2002) Molecular phylogeny of archaea in boreal forestsoil, freshwater and temperate estuarine sediment. Academicdissertation in microbiology, Helsinki University Printing House,Helsinki, Finland
Jurgens G, Glöckner F-O, Amann R, Saano A, Montonen L,Likolammi M, Münster U (2000) Identification of novel Archaeain bacterioplankton of a boreal forest lake by phylogeneticanalysis and fluorescent in situ hybridization. FEMS MicrobiolEcol 34:45–56
Konopka A (2000) Microbial physiological state at low growth rate innatural and engineered ecosystems. Curr Op Microbiol 3:244–247
Lane DJ (1991) 16S/23S rRNA sequencing. In: Stackebrandt E,Goodfellow M (eds) Nucleic acid techniques in bacterialsystematics. Wiley, Chichester, England, pp 205–248
Magurran AE (1988) Ecological diversity and its measurement.Princeton University Press, Princeton, New Jersey
Miethling R, Ahrends K, Tebbe CC (2003) Structural differences inthe rhizosphere communities of legumes are not equally reflectedin community-level physiological profiles. Soil Biol Biochem35:1405–1410
Muyzer G, Smalla K (1998) Application of denaturing gradientgel electrophoresis (DGGE) and temperature gradient gelelectrophoresis (TGGE) in microbial ecology. Antonie vanLeeuwenhoeck 73:127–141
Muyzer G, DeWaal EC, Uitterlinden AG (1993) Profiling of complexmicrobial populations by denaturing gradient gel electrophoresisanalysis of polymerase chain reaction-amplified genes coding for16s r RNA fragments. Appl Environ Microbiol 59:695–700
Nannipieri P, Ascher J, Ceccherini L, Pietramellara G, Renella G(2003) Microbial diversity and soil functions. Eur J Soil Sci 54:655–670
Neusser M (2000) Echtzeit-PCR-Verfahren zur Quantifizierung vonPCR-Produkten. Laborwelt 2
Ochsenreiter T, Selezi D, Quaiser A, Bonch-Osmolovskaya L,Schleper C (2003) Diversity and abundance of Crenarchaeotain terrestrial habitats studied by 16S RNA surveys and real-timePCR. Environ Microbiol 9:787–797
Øvreås L, Forney L Daae FL, Torsvik V (1997) Distribution ofBacterioplankton in Meromictic Lake Salenvannet, as determinedby denaturing gradient gel electrophoresis of PCR-amplified genefragments coding for 16S rRNA. Appl Environ Microbiol63:3367–3373
Pankhurst CE (1997a) Biodiversity of soil organisms as an indicatorof soil health. In: Pankhurst CE, Doube BM, Gupta VVSR(eds) Biological indicators of soil health. CAB International,Wallingford, pp 297–324
Pankhurst CE (1997b) Understanding soil biodiversity. Rural Res175:25–28
Rühlmann J (2003) Der Kastenparzellenversuch Grossbeeren nachsechs Rotationen C- und N-Bilanzen des Dauerversuchs mitgemüsebaulicher Bodennutzung. Arch Agron Soil Sci 49:511–536
Schipper LA, Degens BP, Sparling GP, Duncan LC (2001) Changes inmicrobial heterotrophic diversity along five plant successionalsequences. Soil Biol Biochem 33:2093–2103
StatSoft Incorporation (2001) STATISTICA for Windows [Software-System für Datenanalyse] Version 6. http://www.statsoft.com
Stubner S (2002) Enumeration of 16S rDNA of Desulfotomaculumlineage 1 in rice field soil by real-time PCR with SybrGreen™detection. J Microbiol Methods 50: 155–164
Takai K, Horikoshi K (2000) Rapid detection and quantification ofmembers of the archaeal community by quantitative PCR usingfluorogenic probes. Appl Environ Microbiol 66:5066–5072
Torsvik V, Sorheim R, Goksoyr J (1996) Total bacterial diversity insoil and sediment communities— a review. J Industr Microbiol7:170–178
Torsvik V, Daae FL, Sandaa R-A, Øvreås L (1998) Novel techniquesfor analysing microbial diversity in natural and perturbedenvironments. J Biotech 64:53–62
Torsvik V, Øvreås L, Thingstad TF (2002) Prokaryotic diversity—magnitude, dynamics, and controlling factors. Science 296:1064–1066
Zak JC, Willig MR, Moorhead DL, Wildman HG (1994) Functionaldiversity of microbial communities: a quantitative approach. SoilBiol Biochem 26:1101–1108
Biol Fertil Soils
Related Documents