Max-Planck-Institut für Intelligente Systeme (ehemals Max-Planck-Institut für Metallforschung) Stuttgart Nitriding of Fe-Mo Alloys and Maraging Steel: Structure, Morphology and Kinetics of Nitride Precipitation Holger Selg Dissertation an der Universität Stuttgart Bericht Nr. 242 November 2012

Welcome message from author
This document is posted to help you gain knowledge. Please leave a comment to let me know what you think about it! Share it to your friends and learn new things together.
Transcript
Max-Planck-Institut für Intelligente Systeme (ehemals Max-Planck-Institut für Metallforschung)
Stuttgart
Nitriding of Fe-Mo Alloys and Maraging Steel: Structure, Morphology and Kinetics of Nitride Precipitation
Holger Selg
Dissertation an der Universität Stuttgart
Bericht Nr. 242 November 2012
Nitriding of Fe-Mo Alloys and Maraging Steel: Structure,
Morphology and Kinetics of Nitride Precipitation
Von der Fakultät Chemie der Universität Stuttgart zur Erlangung der
Würde eines Doktors der Naturwissenschaften (Dr. rer. nat.)
genehmigte Abhandlung
vorgelegt von
Holger Selg
aus Riedlingen/Donau
Hauptberichter: Prof. Dr. Ir. E. J. Mittemeijer
Mitberichter: Prof. Dr. J. Bill
Prüfungsvorsitzender: Prof. Dr. T. Schleid
Tag der Einreichung: 04.09.2012
Tag der mündlichen Prüfung: 12.11.2012
MAX-PLANCK-INSTITUT FÜR INTELLIGENTE SYSTEME, STUTTGART
(ehemals MAX-PLANCK-INSTITUT FÜR METALLFORSCHUNG)
INSTITUT FÜR MATERIALWISSENSCHAFT DER UNIVERSITÄT STUTTGART
2012


Contents
1. Introduction ............................................................................................................. 7
1.1 Nitriding ........................................................................................................ 7
1.2 Gaseous nitriding ......................................................................................... 8
1.2.1 Thermodynamics of gas nitriding ................................................... 10
1.3 The microstructure of the nitrided zone .................................................... 12
1.4 Nitriding of Fe-Me alloys ............................................................................ 15
1.5 Excess nitrogen ........................................................................................... 17
1.6 Residual stress ............................................................................................ 20
1.7 Maraging steels .......................................................................................... 22
1.8 Outlook of the thesis .................................................................................. 23 2. Molybdenum-nitride precipitation in recrystallized and cold rolled Fe-1at.% Mo alloy .................................................................................................. 27
2.1 Introduction................................................................................................ 28
2.2 Experimental .............................................................................................. 30
2.2.1 Specimen preparation .................................................................... 30
2.2.2 Nitriding .......................................................................................... 31
2.2.3 Specimen characterization ............................................................. 32
2.3 Results and discussion ................................................................................ 34
2.3.1 Recrystallized specimens................................................................ 34
2.3.2 Cold rolled specimens .................................................................... 51
2.4 Conclusions................................................................................................. 57 3. Defect-dependent nitride surface-layer development upon nitriding of Fe-1 at.% Mo alloys ............................................................................................... 59
3.1 Introduction................................................................................................ 60
3.2 Experimental .............................................................................................. 61
3.2.1 Specimen preparation .................................................................... 61
3.2.2 Nitriding .......................................................................................... 62
3.2.3 Specimen characterization ............................................................. 62
3.3 Cold rolled specimens; results and discussion ........................................... 65
3.3.1 X-ray diffraction; phase analysis .................................................... 65
3.3.2 Microstructure; growth of the γ’-Fe4N1-x layer .............................. 68
3.3.3 γ’-nitride layer-growth kinetics ...................................................... 72
Content
3.4 Recrystallized specimens; results and discussion ...................................... 78
3.4.1 X-ray diffraction – phase analysis .................................................. 78
3.4.2 Occurrence of plate-like morphology of the γ’ phase; the role of dissolved Mo .............................................................................. 84
3.4.3 Orientation relationship γ’ nitride/ferrite ...................................... 93
3.5 Conclusions................................................................................................. 97 4. Microstructural and surface residual stress development during
low-temperature gaseous nitriding of Fe-3.07at.%Mo alloy ............................... 99
4.1 Introduction.............................................................................................. 100
4.2 Experimental ............................................................................................ 101
4.2.1 Specimen preparation .................................................................. 101
4.2.2 Nitriding ........................................................................................ 102
4.2.3 Specimen characterization ........................................................... 102
4.3 Results and discussion .............................................................................. 104
4.3.1 Microstructure ............................................................................. 104
4.3.2 Concentration-depth and microhardness-depth profiles ............ 108
4.3.3 Residual macrostress.................................................................... 111
4.4 Conclusion ................................................................................................ 113 5. Nitriding behaviour of maraging steel: experiments and modelling .................. 116
5.1 Introduction.............................................................................................. 116
5.2 Modelling the kinetics of growth of the nitrided zone ............................ 117
5.3 Experimental ............................................................................................ 121
5.3.1 Specimen preparation .................................................................. 121
5.3.2 Nitriding ........................................................................................ 122
5.3.3 Determination of nitrogen-absorption isotherms ....................... 123
5.3.4 Specimen characterization ........................................................... 125
5.4 Results and discussion .............................................................................. 127
5.4.1 Nitrogen-absorption isotherms .................................................... 127
5.4.2 Nitriding of solution annealed maraging steel (specimens “A”) .. 131
5.4.3 Nitriding of age-hardened maraging steel (specimens “B”) ........ 141
Content
5
5.5 Final remarks on the difference in nitriding response of solution annealed (“A”) and age-hardened (“B”) specimens ................................ 151
5.6 Conclusions............................................................................................... 152
5.7 Acknowledgement ................................................................................... 153 6. Summary .............................................................................................................. 155
6.1 Introduction.............................................................................................. 155
6.2 Experimental ............................................................................................ 156
6.3 Nitriding .................................................................................................... 157
6.4 Specimen characterization ....................................................................... 157
6.5 Results ...................................................................................................... 158
6.5.1 Molybdenum-nitride precipitation in recrystallized and cold rolled Fe-1at.% Mo alloy .............................................................. 158
6.5.2 Defect-dependent nitride surface-layer development upon nitriding of Fe-1 at.% Mo alloys .......................................... 159
6.5.3 Microstructural and surface residual stress development during low-temperature gaseous nitriding of Fe-3.07at.% Mo alloy .............................................................................................. 160
6.5.4 Nitriding behaviour of maraging steel: experiment and modelling ...................................................................................... 161
7. Zusammenfassung ............................................................................................... 163
7.1 Einleitung .................................................................................................. 163
7.2 Experimentalteil ....................................................................................... 164
7.3 Nitrieren ................................................................................................... 165
7.4 Probencharakterisierung .......................................................................... 165
7.5 Ergebnisse ................................................................................................ 166
7.5.1 Molybdännitrid-Ausscheidungen in rekristallisierter und kalt gewalzter Fe-1at.% Mo-Legierung ........................................ 166
7.5.2 Defekt-abhängige Bildung nitrierter Oberflächenschichten beim Nitrieren von Fe-1at.% Mo Legierungen ............................. 167
7.5.3 Entwicklung der Mikrostruktur und Oberflächen-Eigen- spannungen beim Niedertemperatur-Nitrieren einer Fe-3,07at.% Mo Legierung ........................................................... 169
7.5.4 Nitrierverhalten von Maragingstählen: Experiment und Modellierung ......................................................................... 169

Content
7
CHAPTER 1
1 Introduction
The increasing demand for advanced materials along with the necessity to improve the
(surface-) properties of such materials often requires appropriate thermochemical
surface treatments. These treatments involve the simultaneous diffusion of interstitial
elements such as nitrogen and/or carbon into the surface of the specimen during
processing. Among them, nitriding, carburizing and nitrocarburizing are one of the most
important treatments to improve the surface properties of materials, such as resistance
to wear, fatigue and corrosion properties, while the core of the material is not
(deliberately) affected. Thus, a core-shell like (micro-)structure results with largely
improved surface properties (as this is usually the most affected location of loading and
thus requires higher hardness) and a ductile and tough core (to bear impact loads).
Although these surface heat treatments are often employed in practical applications in
industry, there is still a lack of fundamental understanding of the underlying processes.
This is based on the use of technical steels containing several (nitride forming-) alloying
elements which lead to complex reactions and interactions between the inwardly
diffusing species (such as N or C) with the alloying elements. Thus, for relatively simple
binary [1-4] and ternary iron-based alloys [5-7], fundamental studies have been carried
out to understand the mechanism of the underlying change in substrate microstructure.
1.1 Nitriding
Nitriding is the most widely applied thermochemical surface treatment to improve the
surface mechanical (e.g. wear and fatigue) and chemical (corrosion) properties of iron-
based workpieces. Nitriding is usually performed at temperatures ranging from 400 °C
to 580 °C. Thus, no phase transition of the ferrite matrix occurs (as the maximum
nitriding temperature is kept below the Ac1 temperature of steel) as compared to the
ferrite-austenite transition (followed by martensite/bainite transformation) occurring

Chapter 1
8
upon hardening. This is also one of the reasons for the large applicability of nitriding in
industrial practice as the absence of such matrix-phase transformations only yields to
minimum distortions and therefore to a very good control of the workpiece dimensions.
One of the major advantages of nitriding as compared to carburizing is thus the low
demand of post-machining treatments due to the occurrence of only minor dimensional
changes upon nitriding.
Typical nitriding steels are low to medium carbon containing steels alloyed with
nitride forming elements such as Al, Ti, V, Cr, and Mo. These elements can form nitrides
in the ferrite matrix resulting in improved surface properties.
Upon nitriding, nitrogen is introduced in the surface of the iron-based workpiece
through a nitrogen donating species. Nitriding can be performed in plasma (plasma
nitriding), gas phase (gaseous nitriding) and liquid phase (salt bath nitrocarburizing, i.e.
nitrogen and carbon are imposed simultaneously).
Gaseous nitriding is the only nitriding method that allows a precise process
control of the nitrogen uptake via the chemical potential of nitrogen in the gas phase
(see sec. 1.2).
1.2 Gaseous nitriding
Gas nitriding is usually carried out in ammonia/hydrogen gas mixtures at atmospheric
pressure. The nitrogen donating species, ammonia, dissociates catalytically at the
surface of the workpiece leading to atomic nitrogen diffusing into the ferrite matrix.
The gaseous nitriding treatments were carried out in pure ammonia (99.998 vol.%) and
pure hydrogen (99.999 vol.%) gas. In order to keep the nitrogen activity in the gas phase
constant during the heat treatment, it is indispensable to control the flow of the gases
precisely and to ensure that within the furnace, no changes in the chemical composition
of the gas phase occurs. To this end, a total gas flow rate of 500 ml/min was used
corresponding to a linear gas velocity of 13.5 mm/s for the furnace used in the present
work (see Fig. 1.1). The nitriding facility is schematically shown in Fig. 1.1 and consists of
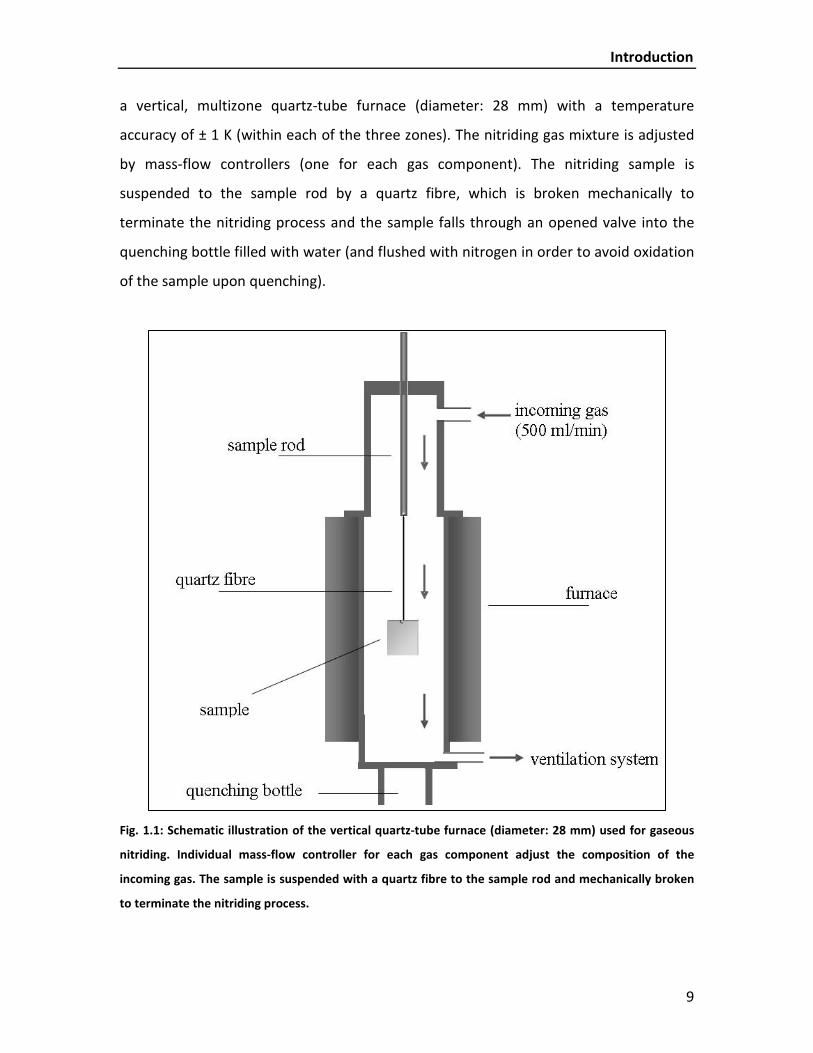
Introduction
9
a vertical, multizone quartz-tube furnace (diameter: 28 mm) with a temperature
accuracy of ± 1 K (within each of the three zones). The nitriding gas mixture is adjusted
by mass-flow controllers (one for each gas component). The nitriding sample is
suspended to the sample rod by a quartz fibre, which is broken mechanically to
terminate the nitriding process and the sample falls through an opened valve into the
quenching bottle filled with water (and flushed with nitrogen in order to avoid oxidation
of the sample upon quenching).
Fig. 1.1: Schematic illustration of the vertical quartz-tube furnace (diameter: 28 mm) used for gaseous
nitriding. Individual mass-flow controller for each gas component adjust the composition of the
incoming gas. The sample is suspended with a quartz fibre to the sample rod and mechanically broken
to terminate the nitriding process.

Chapter 1
10
1.2.1 Thermodynamics of gas nitriding
As described above, gas nitriding is usually performed in ammonia/hydrogen gas
mixtures. This process can be regarded as the sum of the following hypothetical
reactions, as the Gibbs free energy (and therefore the chemical potential) is a state
variable and thus, the value of the Gibbs free energy is independent of the route taken
to reach a particular state.
To this end, nitriding in ammonia/hydrogen gas mixtures can formally be conceived as
the sum of the following reactions [8, 9]
21 N [N]2
(1.1)
3 2 21 3NH N H2 2
+ (1.2)
with [N] representing nitrogen dissolved in the matrix.
Combining reactions (1.1) and (1.2) yields to
3 23NH [N] H2
+ (1.3).
Under the assumption of local equilibrium between the nitriding atmosphere and the
specimen’s surface, the (hypothetical) pressure of N2 gas can be calculated from the
equilibrium (1.2) as follows:
2 3 2
1/2 (2) 3/2N NH H/p K p p= (1.4)
where 3NHp and
2Hp denote the partial pressures of ammonia and hydrogen,
respectively and (2)K is the equilibrium constant for reaction (1.2).
The equilibrium condition between the gas phase and the surface of the specimen
requires
2N ,g ,12 N sµ µ= (1.5)
with the chemical potential µ of nitrogen in the gas phase and (dissolved) in the matrix,
respectively. This thermodynamic equilibrium implies that the flow rate of the
ammonia/hydrogen gas mixture is high enough in order to avoid both the thermal
Introduction
11
decomposition of ammonia (Eq. 1.2) as well as the recombination of nitrogen (according
to Eq. 1.1) at the specimen’s surface [8, 9].
With the definition of the chemical potential it follows that
( )2 2 2
0 0 0N ,g N N N,s N
1 1 ln / ln2 2
RT p p RT aµ µ+ = + (1.6).
If an the same reference state for nitrogen in the gas phase and the solid is selected, the
activity of nitrogen, Na , is then given by
( )2 2
1/21/2 0N N/Na p p= (1.7).
With Eq. (1.1) and (1.2) the activity of nitrogen can be expressed as
( )3 2
(3) 3/2 (3)N NH H N/a K p p K r= = (1.8)
where Nr denotes the nitriding potential.
Hence, the activity of nitrogen at a given temperature depends on the applied nitriding
potential.
Considering the usual nitriding temperatures (450 - 590 °C), it becomes clear that
the activity of nitrogen can be much larger than 1 (Eq. 1.8). Therefore, (hypothetical)
pressures of several thousands of atmospheres would be required to cause the same
activity of nitrogen when using nitrogen gas instead of ammonia and hydrogen gas
mixtures (note the square root dependence of activity and pressure in Eq. 1.7). From
this it follows that pure nitrogen gas is not suitable to use as nitrogen donating
atmosphere.
With the help of (calibrated) mass flow controllers, the desired nitriding
potential can be set in the gas nitriding furnace. This feature makes gas nitriding to a
unique, well-controllable process as the desired microstructure can be set by selecting
appropriate process conditions. This is essential to obtain optimal properties for gas
nitrided components.

Chapter 1
12
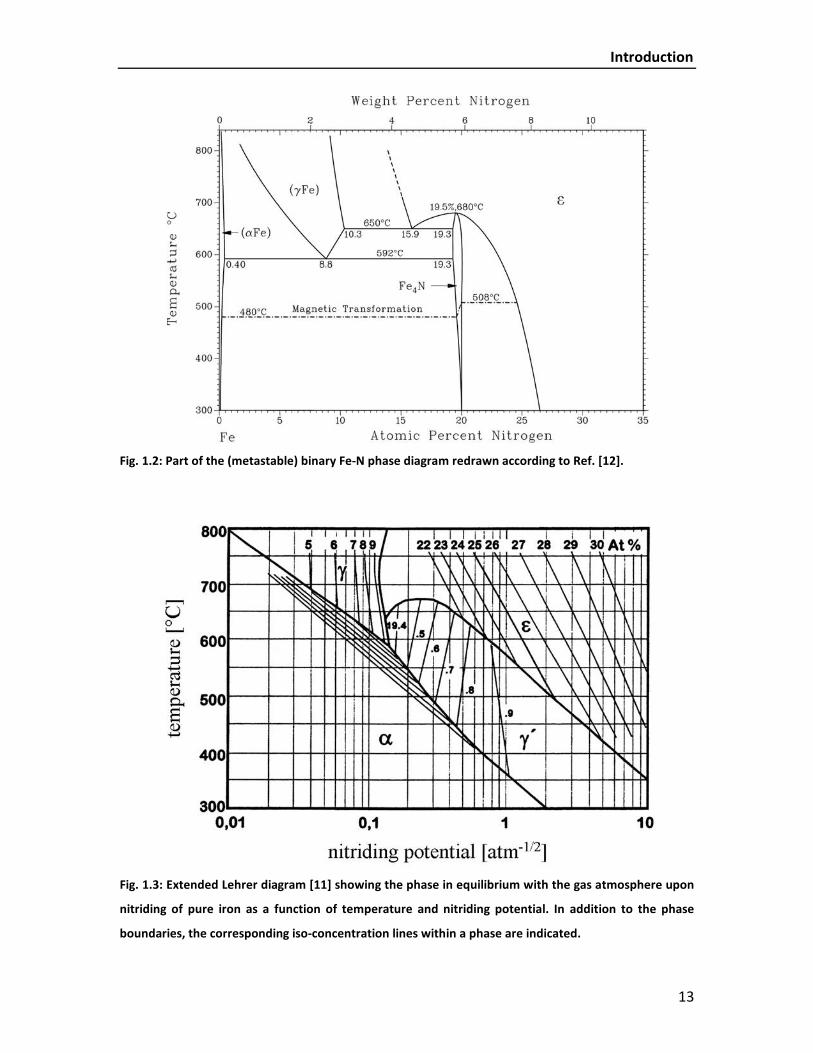
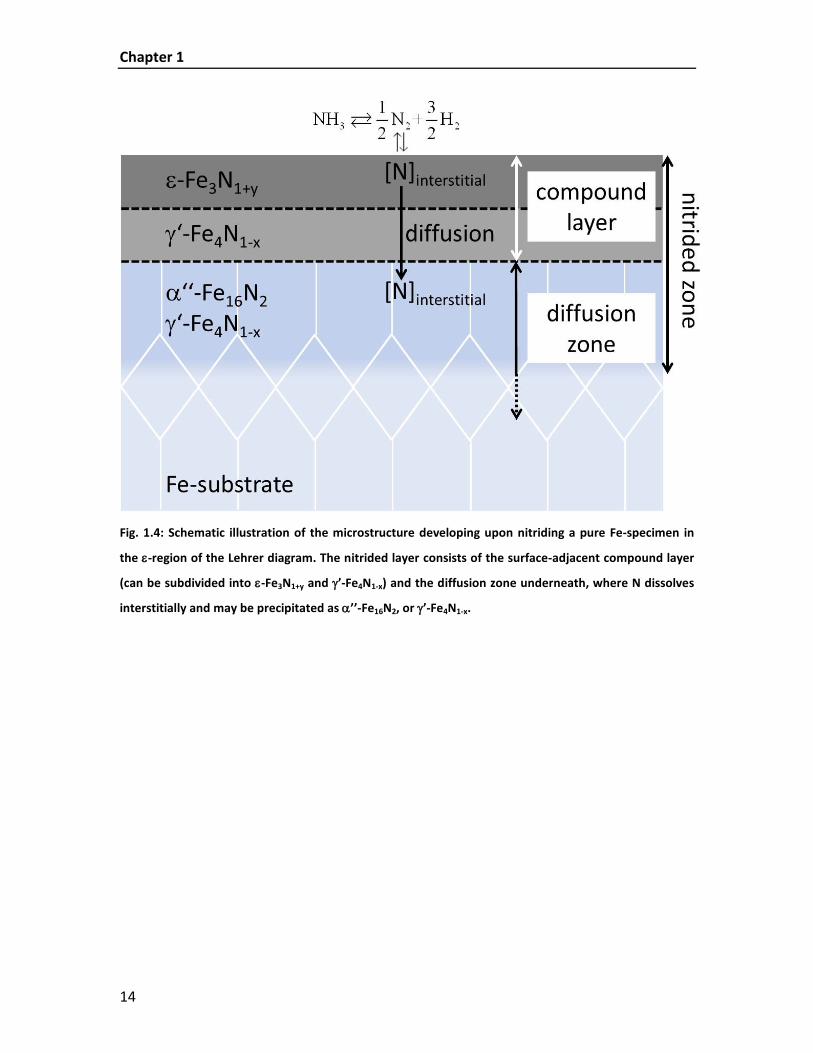
1.3 The microstructure of the nitrided zone
By choosing appropriate nitriding conditions (temperature and nitriding potential) any
phase shown in the Fe-N phase diagram (Fig. 1.2) can be produced at the surface of an
iron specimen. The phase γ’-Fe4N1-x has a quite narrow homogeneity range, whereas the
ε-Fe3N1+y phase exists within a broad compositional range. In order to avoid the
formation of austenite upon nitriding, the temperature is usually kept below 592 °C.
The equilibrium phases at the surface between a pure α-Fe specimen and the gas phase
consisting of an ammonia and hydrogen gas mixture have been determined by Lehrer
[10]. In the so-called Lehrer diagram, the borders of the phase fields are drawn as a
function of nitriding potential and temperature (see Fig. 1.3). In this diagram, besides
the phase boundaries, iso-concentration lines have been indicated [11].
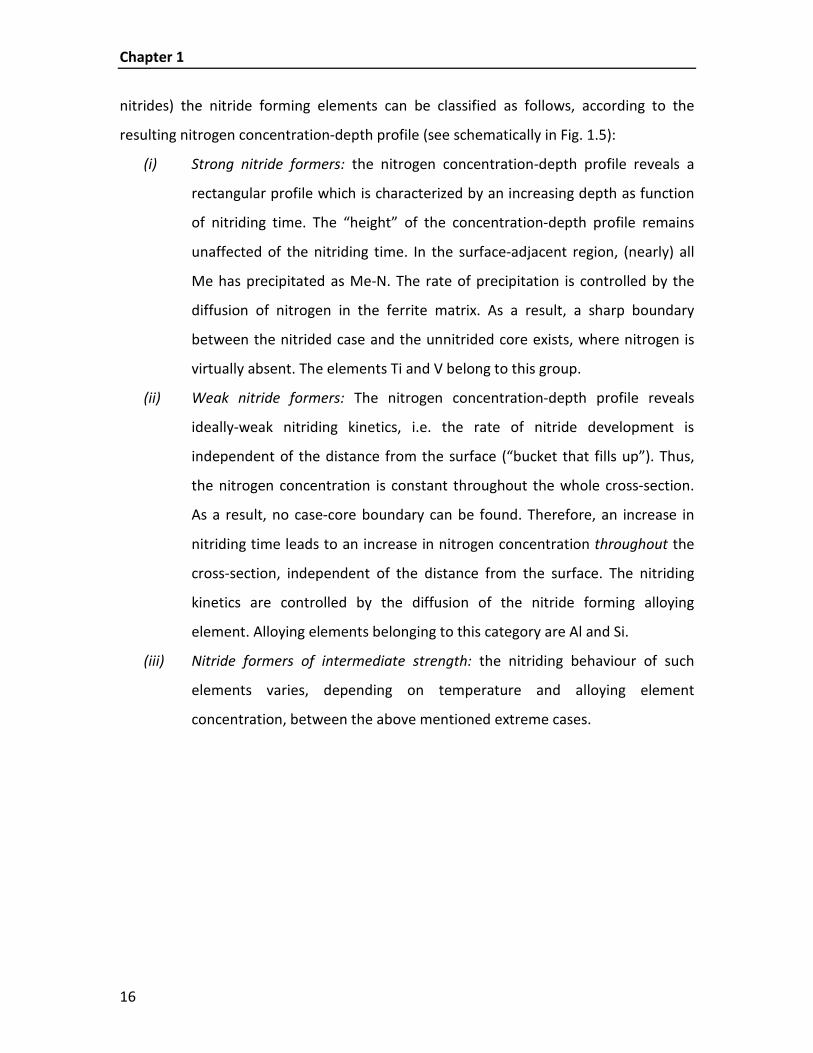
The microstructure of the nitrided zone that develops upon nitriding a pure iron
specimen under conditions thermodynamically allowing the formation of ε-Fe3N1+y (i.e.
a combination of temperature and nitriding potential lying in the ε-phase field of the
Lehrer diagram, cf. Fig. 1.3) is schematically drawn in Fig. 1.4. Directly at the surface, a
so-called compound layer develops consisting of iron nitrides. This layer, which is also
known as “white layer” due to its appearance in the microscope after metallographic
etching (with Nital) can be subdivided into an ε-Fe3N1+y-layer (Fe atoms are arranged in a
hcp-structure, N occupies the octahedral sites in an ordered manner; in the following
referred to as ε) and a γ’-Fe4N1-x-layer underneath (with Fe atoms being arranged in a
fcc-structure and N atoms orderly occupying the octahedral interstitial sites; in the
following referred to as γ’). Beneath the compound layer, the so-called diffusion zone
develops upon nitriding in which nitrogen is dissolved interstitially in the octahedral
sites of the bcc matrix. Upon cooling and subsequent aging, α’’-Fe16N2 (iron atoms are
arranged in a bct-structure with N occupying the octahedral interstices in an ordered
manner) and γ’ can precipitate as (small) needles. The compound layer and the diffusion
zone together are called “nitrided zone”.
Introduction
13
Fig. 1.2: Part of the (metastable) binary Fe-N phase diagram redrawn according to Ref. [12].
Fig. 1.3: Extended Lehrer diagram [11] showing the phase in equilibrium with the gas atmosphere upon
nitriding of pure iron as a function of temperature and nitriding potential. In addition to the phase
boundaries, the corresponding iso-concentration lines within a phase are indicated.
Chapter 1
14
Fig. 1.4: Schematic illustration of the microstructure developing upon nitriding a pure Fe-specimen in
the ε-region of the Lehrer diagram. The nitrided layer consists of the surface-adjacent compound layer
(can be subdivided into ε-Fe3N1+y and γ’-Fe4N1-x) and the diffusion zone underneath, where N dissolves
interstitially and may be precipitated as α’’-Fe16N2, or γ’-Fe4N1-x.

Introduction
15
1.4 Nitriding of Fe-Me alloys
In case of nitriding of Fe-Me alloys containing one or more nitride forming elements
(=Me) such as Al [1, 4, 13, 14], Cr [15-19], Mo [20-26], Ti [27-29] and V [3, 25, 30] under
conditions thermodynamically allowing the formation of a compound layer, these
elements have to be incorporated into the compound layer either as ternary nitrides
(Fe-Me-N), or, especially in case of high affinity between Me and nitrogen, as
precipitated nitrides Me-N. Thus, in case of alloying element precipitation as nitride
prior to the formation of a compound layer, the development of γ’ gets delayed. In case
of less strong interaction between alloying element and nitrogen the formation of the
compound layer can be difficult and even suppressed until all nitride forming elements
have precipitated, or γ’ has to grow under para-equilibrium conditions with Me
dissolved.
Within the diffusion zone, Me precipitates with interstitially dissolved nitrogen
as alloying element nitrides due to their affinity for nitrogen.
The compound layer considerably improves the tribological (resistance to wear
and abrasion) and chemical properties (improvement of the corrosion resistance) due to
its ceramic-like character. A typical area of application for nitrided parts having a
compound layer is in applications of motor production (such as crankshafts). If the main
demand of the nitriding process is to increase the fatigue life time of a component,
usually bright (or “internal”) nitriding is employed; the nitriding parameters are chosen
such that only a diffusion zone develops (i.e. no compound layer can be
thermodynamically formed at the surface). In this case, the development of
compressive residual stresses due to the volume misfit of formed nitrides with the
ferrite matrix is highly beneficial for the improvement of the fatigue properties. Such
nitriding process is often applied for components such as springs of parts of the power
transmission system in vehicles.
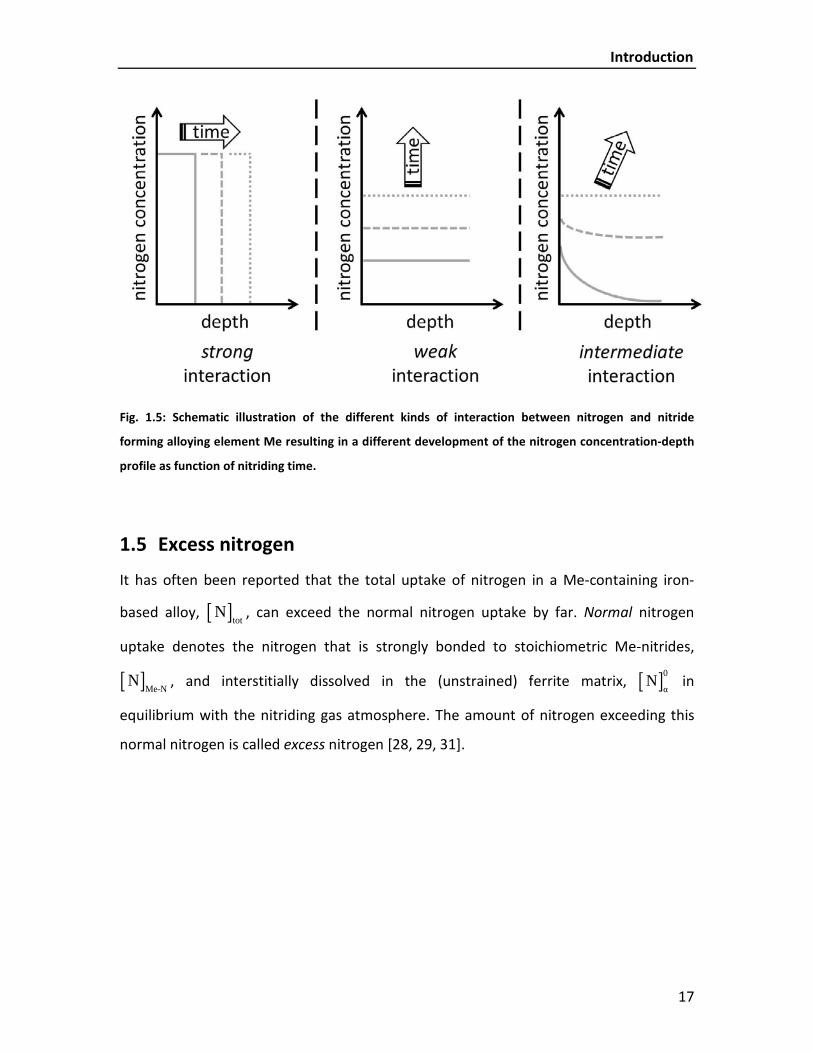
Depending on the strength of the affinity between nitride forming alloying
element and nitrogen (i.e. thermodynamic driving force for the precipitation of Me-
Chapter 1
16
nitrides) the nitride forming elements can be classified as follows, according to the
resulting nitrogen concentration-depth profile (see schematically in Fig. 1.5):
(i) Strong nitride formers: the nitrogen concentration-depth profile reveals a
rectangular profile which is characterized by an increasing depth as function
of nitriding time. The “height” of the concentration-depth profile remains
unaffected of the nitriding time. In the surface-adjacent region, (nearly) all
Me has precipitated as Me-N. The rate of precipitation is controlled by the
diffusion of nitrogen in the ferrite matrix. As a result, a sharp boundary
between the nitrided case and the unnitrided core exists, where nitrogen is
virtually absent. The elements Ti and V belong to this group.
(ii) Weak nitride formers: The nitrogen concentration-depth profile reveals
ideally-weak nitriding kinetics, i.e. the rate of nitride development is
independent of the distance from the surface (“bucket that fills up”). Thus,
the nitrogen concentration is constant throughout the whole cross-section.
As a result, no case-core boundary can be found. Therefore, an increase in
nitriding time leads to an increase in nitrogen concentration throughout the
cross-section, independent of the distance from the surface. The nitriding
kinetics are controlled by the diffusion of the nitride forming alloying
element. Alloying elements belonging to this category are Al and Si.
(iii) Nitride formers of intermediate strength: the nitriding behaviour of such
elements varies, depending on temperature and alloying element
concentration, between the above mentioned extreme cases.
Introduction
17
Fig. 1.5: Schematic illustration of the different kinds of interaction between nitrogen and nitride
forming alloying element Me resulting in a different development of the nitrogen concentration-depth
profile as function of nitriding time.
1.5 Excess nitrogen
It has often been reported that the total uptake of nitrogen in a Me-containing iron-
based alloy, [ ]totN , can exceed the normal nitrogen uptake by far. Normal nitrogen
uptake denotes the nitrogen that is strongly bonded to stoichiometric Me-nitrides,
[ ]Me-NN , and interstitially dissolved in the (unstrained) ferrite matrix, [ ]0
αN in
equilibrium with the nitriding gas atmosphere. The amount of nitrogen exceeding this
normal nitrogen is called excess nitrogen [28, 29, 31].
Chapter 1
18
Such excess nitrogen atoms can be found at different locations in nitrided Fe-Me alloys:
(i) adsorbed at the (coherent) interface between coherent nitride precipitate
and the surrounding ferrite matrix, [ ]interfaceN
(ii) trapped in the strain fields of dislocations, [ ]dislocationN
(iii) additionally dissolved in the strained matrix, [ ]strainN , caused by the
volumetric misfit between nitride precipitate and the surrounding matrix
leading to a hydrostatic tensile stress component in the matrix thus
increasing the solubility of nitrogen [31].
Excess nitrogen of type (i) and (ii) are denoted as immobile excess nitrogen as they do
not take part in the (inward) diffusion of nitrogen, whereas nitrogen that tends to
increase the diffusion zone is called mobile excess nitrogen. Type (iii) belongs to this
mobile excess nitrogen.
The different kinds of (chemically) bonded nitrogen, taken up by a specimen upon
nitriding, can be differentiated by generating an absorption isotherm. Any point in such
a nitrogen concentration versus nitriding potential diagram indicates the equilibrium
content of nitrogen absorbed by the specimen at a given nitriding potential. The
generation of an absorption isotherm requires a homogeneous nitrogen concentration
(i.e. constant concentration throughout the whole cross-section) and a nitride
morphology that does not change upon determination of the absorption isotherm. Thus,
in order to ensure a constant precipitation morphology, a pre-nitriding treatment is
performed at a temperature exceeding the temperature for the generation of the
absorption isotherm. Such nitrogen absorption-isotherm is schematically presented in
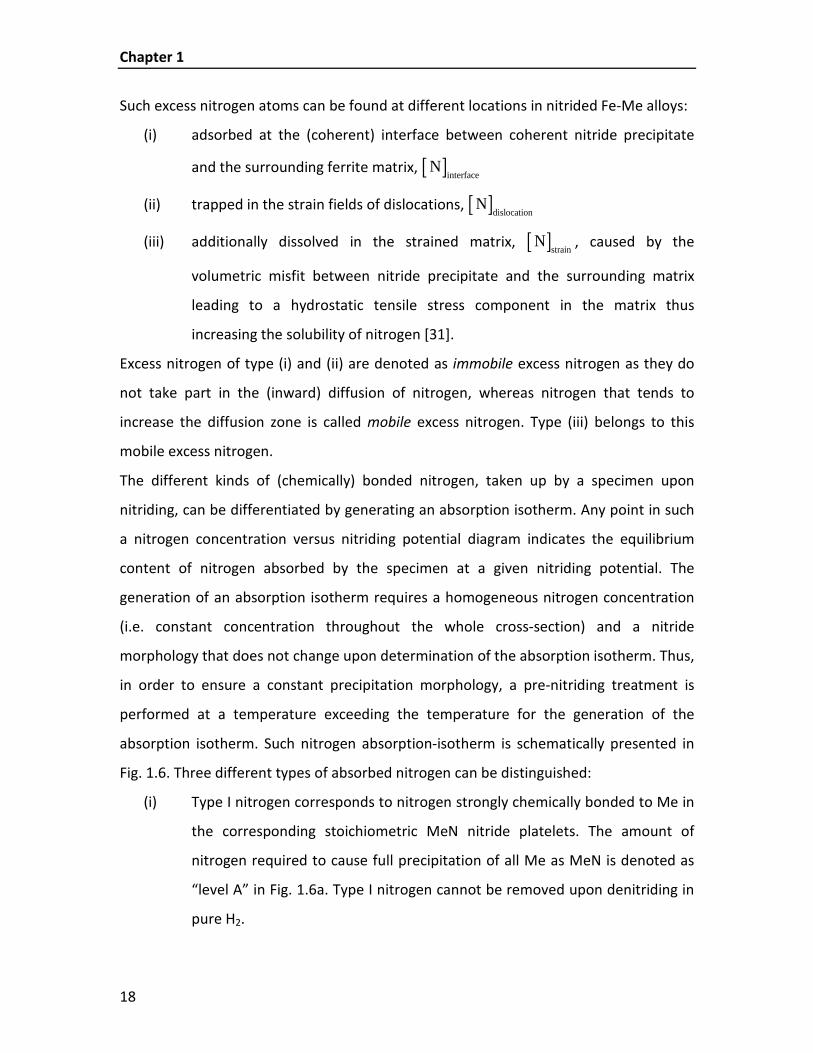
Fig. 1.6. Three different types of absorbed nitrogen can be distinguished:
(i) Type I nitrogen corresponds to nitrogen strongly chemically bonded to Me in
the corresponding stoichiometric MeN nitride platelets. The amount of
nitrogen required to cause full precipitation of all Me as MeN is denoted as
“level A” in Fig. 1.6a. Type I nitrogen cannot be removed upon denitriding in
pure H2.
Introduction
19
(ii) Type II nitrogen is the nitrogen that is adsorbed at the interface between
nitride platelet and the surrounding ferrite matrix ( [ ]interfaceN ). This nitrogen
can often be (partially) removed upon denitriding as it is less strongly
bonded. The amount of interfacially absorbed nitrogen corresponds to the
difference between “level B” and “level A” in Fig. 1.6a.
(iii) Type III nitrogen corresponds to nitrogen that is dissolved at octahedral sites
of the ferrite matrix lattice, the amount of which depends linearly on the
nitriding potential [8, 9]. The difference between the total amount of
dissolved nitrogen and the solubility of nitrogen in a pure, unstrained ferrite
matrix, [ ]strainN , is indicated in Fig. 1.6a. Type III nitrogen can be easily
removed by denitriding.
Fig. 1.6: (a) Schematic illustration of a nitrogen absorption isotherm, (b) type III nitrogen is interstitially
dissolved in the matrix, (c) type II nitrogen is adsorbed at the precipitates/matrix interface (dissolved in
the ferrite matrix) and type I nitrogen is (strongly) bonded in Me-N nitride platelets.
Chapter 1
20
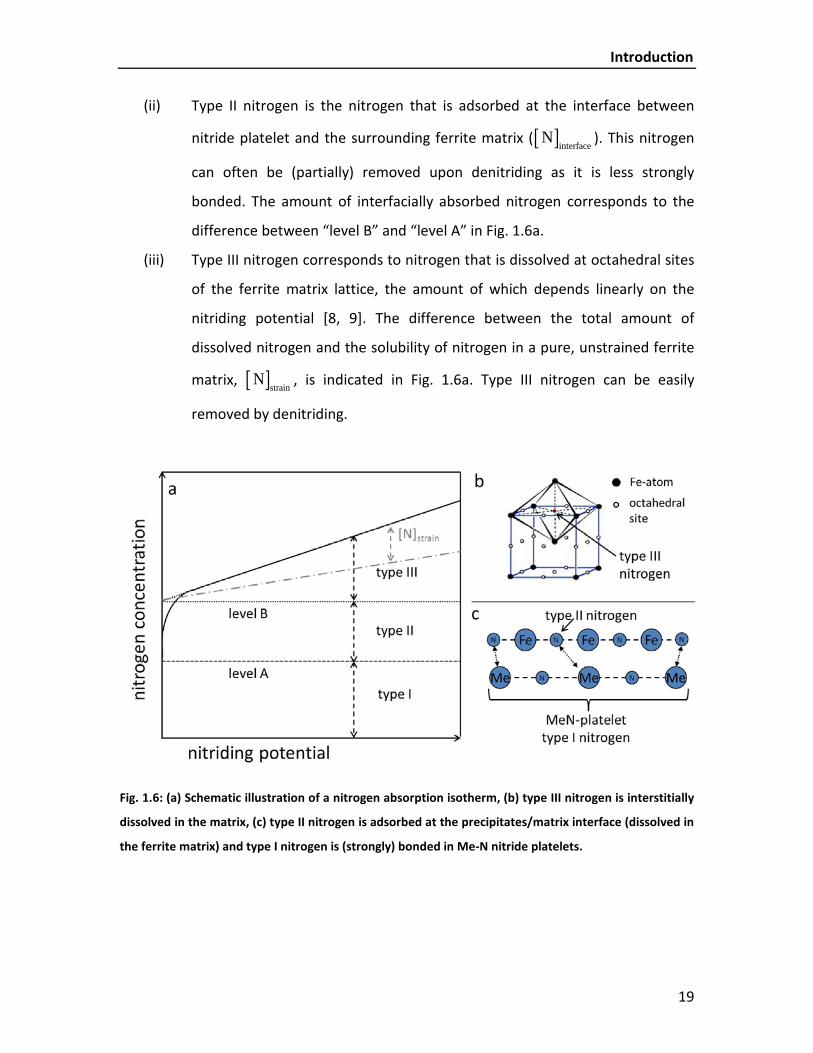
1.6 Residual stress
Residual stresses are self-equilibrating existing in materials at constant temperature and
in the absence of external loading [32]. Residual stresses can have various kinds of
origins, such as mechanical, thermal, plastic, or caused by phase transformations such as
martensitic transformations or the precipitation of inner nitrides. However, residual
stresses are always the result of misfit that can occur between different phases or
different regions [33]. Depending on the length scale over which the lattice parameter
varies, the distinction between micro- and macrostresses can be made [34]. Lattice
parameter variations over large distances are denoted as macrostresses. The presence
of both, micro- and macrostresses can strongly influence the fatigue behaviour of
components [34]. Upon nitriding, nitrogen dissolves in the ferrite matrix and can form
inner nitrides, both leading (theoretically) to an expansion of the nitrided zone due to
the volumetric mismatch between precipitated nitrides and ferrite matrix (see Fig. 1.7b).
As the nitrided zone and the unnitrided core are attached to each other, a compressive
residual stress develops in the nitrided zone (as a result of a self-equilibrating stress
state). The mechanical equilibrium between the nitrided zone and the unnitrided core
requires the development of tensile stresses in the unnitrided core (Fig. 1.7c). Upon
nitriding, a (thin) specimen can become through nitrided (homogeneously nitrided), and
thus does not exhibit macrostresses (-depth profile), as indicated in Fig. 1.7d.

Introduction
21
Fig. 1.7: Schematic illustration of the development of residual stresses upon nitriding (left side) and the
corresponding nitrogen concentration-depth profiles. An unnitrided, macrostress-free specimen is
considered in the initial stage (a), where nitrogen diffuses during nitriding. This leads theoretically to an
expansion of the nitrided zone due to nitrogen dissolved in the octahedral interstices and due to the
formation of inner nitrides MeN (b). As a result, a case-core nitrogen concentration-depth profile
develops. The resulting equilibrium stress state (c) induces compressive macrostresses in the nitrided
zone and tensile macrostresses in the unnitrided core. After through nitriding, the specimen is
macrostress free, but strained (d).
Chapter 1
22
1.7 Maraging steels
Maraging steels belong to the group of ultra-high strength martensitic steels which are
age hardened by the precipitation of intermetallic compounds [35, 36]
(martensite+aging → maraging). These steels have a low carbon content along with a
high content of Ni and (usually) Co. In contrast to conventional high-strength steels,
maraging steels possess certain distinctive characteristics such as lack of distortion
during hardening, good weldability as well as good combinations of strength and
toughness. These advantages have made them attractive for many technical
applications [37, 38] since their development in the early 1960s by the International
Nickel Company (INCO).
The transformation of austenite to martensite depends on austenite
composition. If the carbon content is sufficiently low, this transformation forms a lath
type martensite characterized by a high density of dislocations and the absence of
transformation twins. This martensitic structure typically has a yield strength in the
order of 700 MPa and, more importantly, has excellent ductility and toughness.
Subsequently after the formation of martensite, these steels are precipitation hardened
(aged) at a temperature of about 400 – 520 °C. In the beginning of age hardening,
intermetallic compounds such as Ni3X (X = Ti, Mo, V, W) are formed ([35, 36]). This
precipitation leads to a strong increase in hardness due to the coherency between the
precipitates and the surrounding matrix. Upon prolonged heat treatment, the more
stable phase Fe2Y (Y = Mo, W) forms, characterized by a decrease in hardness
(overaging) [35, 36, 39, 40].
Maraging steels are subdivided into classes (so-called “grades”) depending on
their nominal yield strength (in ksi), e.g. 200, 250, 300 or 350.
In general, it is also difficult to heat treat a single grade of maraging steel to
widely different strength levels. Thus, several different grades of steels, each tailored to
a specific strength level, are needed.
Introduction
23
1.8 Outlook of the thesis
Gaseous nitriding provides a very powerful tool to improve the mechanical and chemical
surface properties of iron-based workpieces and steels. Despite its wide application in
practice, which is often mainly based on experience and empiricism, fundamental
knowledge of the underlying processes occurring upon nitriding is lacking. To this end,
there is a great scientific as well as technical interest in fundamental understanding of
the processing methods in combination with the predictability of material properties.
Investigations of the precipitation morphology and kinetics have been started on
simple binary [1-4] and ternary [5-7] iron-based alloys in the past. With these systems it
is possible to gain a very fundamental approach as there is no other interaction than
that of nitrogen with the nitride forming alloying element (Me) and the pure ferrite
matrix.
However, there is still a great scientific interest in detailed understanding of
binary iron-based alloys, especially for relatively weak nitride formers (such as Mo, W,
Si), as these systems are not very well understood. The literature results, if at all
available, often contradict each other, especially in case of molybdenum (e.g. [26] and
[41]).
The nitriding behaviour of this (binary) system is dealt with in chapters 2, 3 and 4
of the present thesis with the aim to clarify these contradicting literature results and to
provide a detailed understanding in the precipitation kinetics of Mo as nitride.
With the thus gained knowledge about the precipitation sequence of Mo-nitride,
it is possible to understand the nitriding kinetics of technical steels containing Mo as
(only) nitride forming element and, moreover, model the resulting nitrogen
concentration-depth profiles. Such model was applied for a maraging steel for which, for
the very first time in case of a technical steel, an absorption isotherm could be created
(chapter 5).
For microstructural examinations, apart from weight gain measurements based
on weighing the specimens before and after nitriding with a high accuracy microbalance
(accuracy: 1 µg), light microscopy, scanning electron- and transmission electron

Chapter 1
24
microscopy were employed as well as hardness measurements, electron probe micro
analysis and glow discharge optical emission spectroscopy. Additionally, X-ray diffraction
was used for the examination of the microstructure.
In chapter 2, the phenomenon of discontinuous precipitation, occurring upon
nitriding of Fe-1at.% Mo alloy under conditions such that no compound layer develops
at the surface, is described. Hereby, the role of the degree of deformation on the
kinetics of nitride precipitation is investigated in detail. The submicroscopical, fcc Mo2N-
type nitrides, initially largely coherent with the matrix, obeying a Bain-type orientation
relationship, transform in a discontinuous reaction into the incoherent, hcp MoN-type
lamellar precipitates. In case of low dislocation density, a continuous, but slow increase
in nitrogen concentration is observed. However, the corresponding microstructure
finally shows a complete discontinuous transformation, whereas in case of a high
dislocation density, only partial transformation of Mo2N to MoN occurs. The mechanism
underlying this effect is explained with the difference in driving force for the
discontinuous precipitation reaction, depending on the degree of coherency of the
initially formed nitrides.
The effect of the presence of substitutionally dissolved nitride forming alloying
element with relatively weak (as compared to V, Ti) interaction with nitrogen on the
morphology of the formed compound layer consisting of γ’-Fe4N is discussed in
chapter 3. An unusual morphology of the compound layer was observed upon nitriding
of Fe-1at.% Mo alloy in the recrystallized (low defect density) state. This effect was
ascribed to the delayed precipitation kinetics of Mo as nitride thus delaying the
formation of γ’ as the solubility of γ’ for substitutional elements is very low. In case of
nitriding cold deformed material, a microstructure develops similar to nitriding of pure
iron. This can be ascribed to the much faster precipitation kinetics of Mo as nitride. A
detailed kinetic analysis of the growth of the compound layer in case of cold deformed
specimen is presented and discussed in this chapter.
A microstructural analysis of an Fe-3.07at.% Mo alloy is described in chapter 4.
The role of the precipitation of Mo-nitrides, obeying a Bain-type orientation relationship

Introduction
25
with the matrix, on the resulting microstructure upon low-temperature nitriding is
discussed. Strongly asymmetric broadening of ferrite reflections along with pronounced
streaking in the selected area diffraction patterns were indicative for largely coherent
precipitates.
Finally, the nitriding behaviour of maraging steel (grade 300) is reported in
chapter 5. The nitriding kinetics of specimens nitrided in the solution annealed condition
were compared to the nitriding kinetics of specimens that were age hardened prior to
nitriding. The nitrogen concentration-depth profiles were, in both cases, successfully
fitted with a numerical model to the experimentally determined concentration-depth
profiles. As fitting parameters, the diffusion coefficient of nitrogen in the matrix, the
surface concentration, the stoichiometric parameter of the formed nitrides and the
solubility product of the alloying element and nitrogen dissolved in the matrix were
used. Nitrogen-absorption isotherms determined for the maraging steel allowed
distinction of different kinds of (excess-) nitrogen taken up and thus provided starting
values of the fitting parameters for the kinetic model.

Chapter 1
26

27
CHAPTER 2
2 Molybdenum-nitride precipitation in recrystallized and
cold rolled Fe-1at.% Mo alloy
H. Selg, E. Bischoff, R. Schacherl, T. Waldenmaier, E.J. Mittemeijer
Abstract
Nitriding of recrystallized and cold rolled Fe-1at.% Mo-alloy at 580 °C in a NH3/H2 gas
mixture using a nitriding potential of 0.104 atm-1/2 leads to the formation of small, cubic-
type nanometer-sized precipitate platelets of the type Mo2N having a Bain-type orientation
relationship with the ferrite matrix. After prolonged nitriding, micrometer-sized colonies of
lamellae consisting of a hexagonal MoN-type nitride and ferrite develop in a discontinuous
precipitation reaction; these nitride lamellae have a Burgers-type orientation relationship
with the ferrite lamellae. As compared to the recrystallized specimens, in the cold rolled
specimens the precipitation of the initial Mo2N-type platelets occurs much faster and
moreover, leads to (largely) incoherent(ly diffracting), instead of coherent(ly diffracting)
precipitates, and is followed by an also much earlier but only partial occurring transition of
Mo2N-type to MoN-type precipitates. The results indicate that incorporation of iron in the
nitrides can occur, if at all, only up till a negligible level, thereby invalidating earlier data.
Chapter 2
28
2.1 Introduction
Nitriding is a thermochemical surface engineering treatment which is of great industrial
importance in order to improve the mechanical (e.g. fatigue, wear) and chemical (e.g.
corrosion) (surface) properties of ferritic steel components. Ammonia can be used as
nitrogen donator, due to its dissociation at the surface of iron-based alloys at
temperatures between 450 °C and 590 °C [42, 43]. Subsequent inward diffusion of the
adsorbed nitrogen leads to the development of a nitrided zone beneath the surface. The
nitrided surface layer, depending on the nitriding conditions ([10, 23]) can be subdivided
into a compound layer adjacent to the surface, composed of iron nitrides, and a
diffusion zone beneath the compound layer [44]. Within the diffusion zone, nitrogen is
dissolved in the octahedral sites of the ferrite lattice, or has precipitated as internal
nitrides MeNx, if nitride forming elements, such as Ti, Cr, Al, V are present ([4, 7, 27, 29,
45]). The improvement of the fatigue resistance of nitrided workpieces can be ascribed
to the precipitation of these nitride forming elements, whereas the enhancement of the
chemical resistivity and the improvement of the tribological properties is mainly caused
by the compound layer.
Usually, Mo is not added deliberately to nitriding steels, to induce nitride
precipitation, but it is often introduced to improve the tempering brittleness, strength
and weldability [46]. Although a distinct driving force for the precipitation of
molybdenum nitride exists, relatively little of conclusive nature is known about the
precipitation of Mo as nitride upon gaseous nitriding of a Mo-containing iron-based
alloy.
It was claimed for an Fe-5wt.% Mo alloy nitrided at temperatures in the range of
480 °C – 590 °C that intermediate precipitates of structure type α’’-Fe16N2 would
develop, superseded, upon overaging at elevated temperatures (in the range of 700 -
800 °C), by a (more or less) equilibrium precipitate identified differently as fcc Mo2N [21,
23] or η-Fe3Mo3N [47]. The composition of the nitrides, for nitrided Fe-3at.% Mo alloy,
was indicated as Fe3Mo3N2 [20], but also as Fe10Mo6N2 [21], (Mo, Fe)2N and (Mo, Fe)N

Molybdenum-nitride precipitation in Fe-1at.% Mo alloy
29
[26] (where the last two compositions would pertain to nitrides appearing later in the
precipitation sequence). These composition data have all been based on field-ion-
microscopy (FIM)-atom probe analyses. It is noted that this type of composition analysis,
of platelets/discs of thickness only a few atomic layers, can be subject to severe errors.
Indeed, in a very recent study [48], it was shown that surface-diffusion processes of
interstitials, but also of substitutional dissolved elements, can affect the accuracy of
local composition analysis by this technique. The only other work providing composition
data of the nitrides concerned, not based on FIM-atom probe analysis, relies on a
combination of Mössbauer spectroscopy and mass change and indicated that the
nitrides do not incorporate Fe atoms and have the composition MoN [41].
The nature of the microstructure of the iron-based alloy can have dramatic
consequences for the type of nitride that develops. This has been shown for Fe-Al alloy:
in case of a recrystallized matrix hexagonal (wurtzite) AlN may precipitate preferentially,
whereas in case of a deformed (cold rolled) matrix cubic (rock salt) AlN precipitates are
formed [1, 49].
Recognizing the above sketched confusion and controversy regarding the
precipitation sequence and the type of nitride precipitates developing upon nitriding Fe-
Mo alloys, the present project has been designed to clarify the precipitation process in
Fe-Mo alloy upon nitriding and to investigate the effect of the state of deformation of
the microstructure on the precipitation process of nitrides.

Chapter 2
30
2.2 Experimental
2.2.1 Specimen preparation
For the production of an alloy with the composition Fe-1at.% Mo appropriate amounts
of iron (purity: 99.98 wt.%) and molybdenum (purity: 99.99 wt.%) were weighed, pre-
alloyed in an arc furnace and melted in an Al2O3 crucible by means of an inductive
furnace under a protective argon gas atmosphere (purity: 99.999 vol.%). The melt was
cast in a copper mould to obtain a cylindrical rod (Ø: 10 mm, l: 100 mm). The chemical
composition and the amount of impurities were determined by chemical analysis
(inductively coupled plasma - optical emission spectroscopy (for Mo); combustion
method (for C and S) and carrier gas hot extraction (for O and N)). The results are shown
in Table 2.1.
Table 2.1: Amounts of molybdenum and light element impurities for the alloy used in this work
(balance: Fe).
element Mo O N C S
content [wt.%] 1.800±0.020 0.009±0.002 0.003±0.001 0.006±0.001 <0.001
content [at.%] 1.057±0.012 0.032±0.007 0.012±0.004 0.028±0.005 <0.002
The cast rod was cut into 3 pieces of which the shells were removed by grinding.
The remaining pieces were cleaned with ethanol in an ultrasonic bath and then cold
rolled to sheets of a thickness of about 0.12 mm (degree of deformation: 98.8 %). Out of
these sheets, rectangular specimens were cut (dimensions: about 15 x 10 mm2) into
which a hole was drilled (Ø: 1.5 mm) for suspending each specimen during nitriding (see
below). The specimens were ground, cleaned in an ultrasonic bath using ethanol and
then encapsulated in a quartz tube which was filled with argon gas (purity: 99.999
vol.%). Subsequently, a number of specimens were recrystallized in a muffle furnace at
800 °C for 90 min in order to eliminate the deformation introduced by the cold rolling.
Molybdenum-nitride precipitation in Fe-1at.% Mo alloy
31
2.2.2 Nitriding
For nitriding, a gas atmosphere composed of ammonia and hydrogen is often used.
Gaseous nitriding allows an accurate control of the chemical potential of nitrogen in the
nitriding atmosphere. The nitriding potential 3
2
3/2NH
NH
pr
p= is proportional with the
chemical potential/activity of nitrogen in the atmosphere [8]. If so-called local
equilibrium prevails at the surface, it holds that the chemical potential of nitrogen in the
gas atmosphere is equal to the chemical potential of dissolved nitrogen at the surface.
Thus, formation of a compound layer (composed of iron-based nitrides) can be avoided
by control of the nitriding potential [9].
Before nitriding, the specimen surfaces were polished mechanically (final step:
1 µm diamond suspension), cleaned with ethanol in an ultrasonic bath and dried in a
nitrogen gas flow.
The nitriding experiments were performed at a temperature of 580±1 °C for
nitriding times up to 734 h (the time required to achieve through nitriding of a pure
ferrite specimen of thickness 120 µm (see above) is about 5h) in a vertical, multizone
quartz-tube furnace (Ø: 28 mm) employing a NH3/H2 gas-mixture with a flux of 500
ml/min (purity NH3: > 99.998 vol.%, purity H2: 99.999 vol.%). The gas fluxes were
adjusted by mass flow controllers and correspond to a nitriding potential rN = 0.104 atm-
1/2. The nitriding potential was chosen such that no iron nitrides develop at the surface
(see above), i.e. the nitrided surface region consists only of the diffusion zone (possibly)
exhibiting alloying element nitride precipitation. The nitriding process was terminated
by breaking mechanically the quartz fibre at which the specimen was suspended in the
furnace so that the specimen fell through an opened valve into a flask filled with water,
flushed with N2, where the specimen was quenched to room temperature.
Chapter 2
32
2.2.3 Specimen characterization
2.2.3.1 Light microscopy (LM), scanning electron microscopy (SEM) and electron
backscatter diffraction (EBSD)
For these investigations a piece of each nitrided specimen was cut off (Struers Accutom
50, Al2O3 cut-off wheel), embedded in Struers PolyFast, ground and polished (final
polishing step: 1 µm diamond suspension). Each cross-section was etched with 2 % Nital
(2 vol.% HNO3 in ethanol) at room temperature for about 10 s.
LM micrographs were taken using a Zeiss Axiophot microscope equipped with a
digital camera (Olympus ColorView IIIu). SEM was performed employing a Jeol JSM
6300F using an acceleration voltage of 3 kV.
EBSD was performed on the same cross-sections of the specimens used for the
LM and SEM investigations (final polishing step: 0.05 µm OPS-suspension) applying a
Zeiss Leo 438 VP scanning electron microscope equipped with an EDAX TSL EBSD
measurement system. For the analysis, the software OIM version 5 was used.
2.2.3.2 Electron probe microanalysis (EPMA)
For the determination of the nitrogen concentration-depth profiles EPMA was
performed on the same cross-sections as for the LM, SEM and EBSD investigations. For
these measurements, a Cameca SX100 microprobe (acceleration voltage U = 10 kV,
current I = 100 nA, spot size about 1 µm) equipped with five wavelength-dispersive
spectrometers was used. The line scans were performed perpendicular to the surface,
starting at the surface across the cross-section towards the centre of the specimen. To
obtain the element contents at each measurement point, the intensities of the
characteristic X-ray emission peaks were measured and divided by the corresponding
intensities obtained from standard samples of pure Fe, Mo and γ’-Fe4N (for N-Kα).
Elemental concentrations were calculated from the intensity ratios applying the Ф(ρz)
approach [50].
Molybdenum-nitride precipitation in Fe-1at.% Mo alloy
33
2.2.3.3 Microhardness measurement
Microhardness measurements were carried out on cross-sections of the nitrided
specimens applying a Vickers microhardness tester (Leica VMHT Mot) applying a load of
490 mN and a dwell time of 10 s.
2.2.3.4 X-ray diffractometry (XRD)
Phase analysis by means of X-ray diffraction (from the surface of the specimens) was
performed for all specimens before and after nitriding using a PANalytical X’Pert Multi-
Purpose Diffractometer (MPD) with Co-Kα radiation. This instrument is based on a Bragg-
Brentano geometry and is equipped with a graphite monochromator in the diffracted
beam. The diffraction-angle (2θ) range (30 ° < 2θ < 120 °) was scanned in steps of 0.06 °
2θ with a counting time of 320 s per step. For the identification of the phases, based on
the positions of the diffraction peaks, the ICDD database was used [51].
2.2.3.5 Transmission electron microscopy (TEM)
Electron transparent foils for TEM from the centre of the nitrided zone were prepared as
follows: Self-supporting discs (Ø 3 mm) were stamped with a mechanical punch from
sheets produced by removing material mechanically from both faces of the nitrided
specimens (sheets; cf. section 2.2.1). The discs were ground mechanically, dimpled and
subsequently, Ar-ion milled (4 kV, 5 mA, angle of ion incidence: 8 °, time: 4.5 h; liquid
nitrogen cooling stage).
TEM analysis was performed on a Philips CM 200 operated at 200 kV. Bright field
(BF) images, dark field (DF) images and selected area diffraction patterns (SADPs) were
recorded using a CCD camera incorporated in the TEM apparatus.
Chapter 2
34
2.3 Results and discussion
2.3.1 Recrystallized specimens
2.3.1.1 Morphology; discontinuous transformation
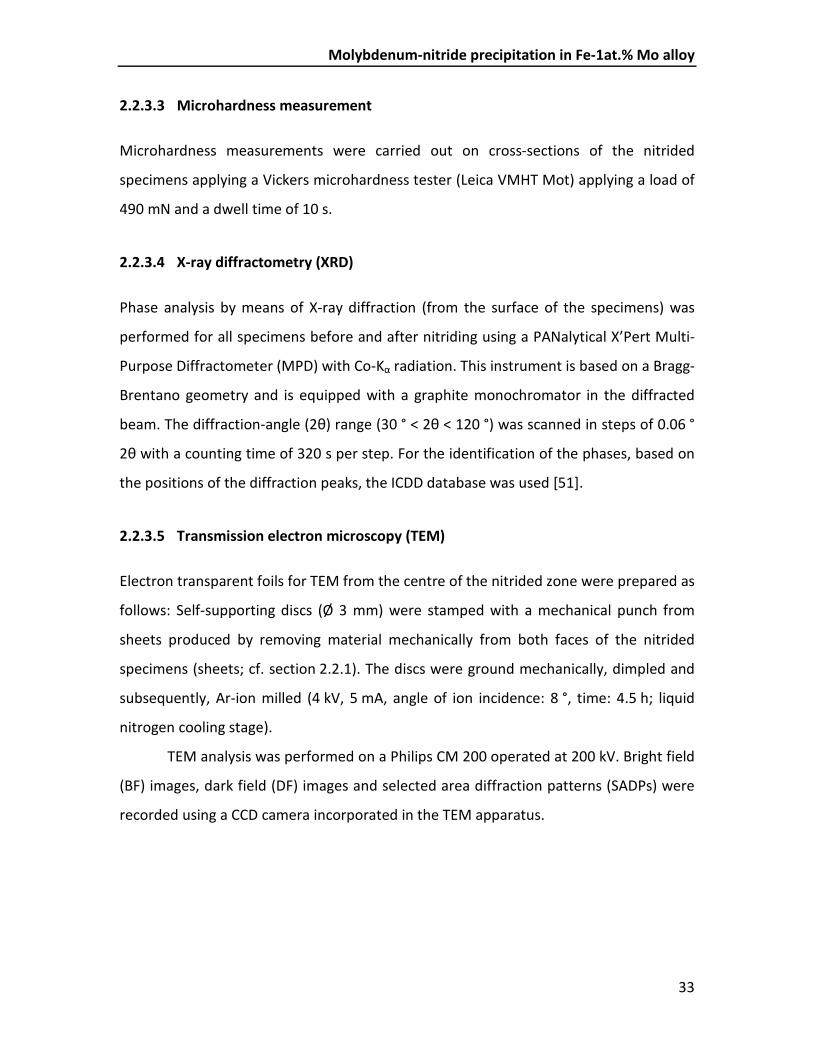
Although nitrogen is taken up by the specimen, no change in morphology can be seen in
the light optical micrographs in the early stages of nitriding (i.e. until a nitriding time of
50 h); yet a distinct increase in hardness is observed (see Fig. 2.1). The observed
increase in hardness is much larger than the hardness increase that can be attained by
dissolved nitrogen (i.e. about 100 HV, due to solid solution strengthening). Thus, (slow)
submicroscopical Mo-nitride precipitation is assumed to occur (see below).
0 10 20 30 400
50
100
150
200
250
300
surfa
ce h
ardn
ess
incr
ease
[HV0
.05]
nitriding time [h]
Fig. 2.1: Increase of surface microhardness, as compared to the initial, recrystallized state, as function of
nitriding time at 580 °C for the early stage of nitriding. Dotted line has been drawn to guide the eye.
Molybdenum-nitride precipitation in Fe-1at.% Mo alloy
35
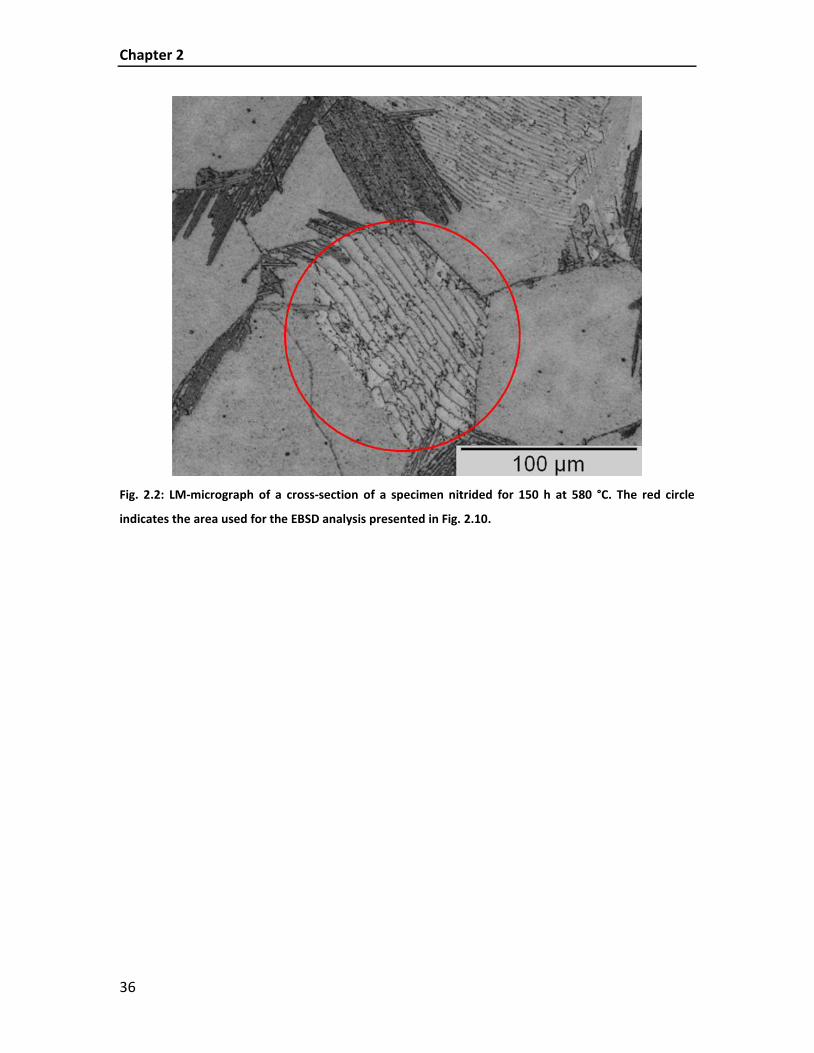
The morphological changes occurring upon nitriding for times > 50 h are
revealed by light optical micrographs (LM) as well as scanning electron micrographs
(SEM); see Figs. 2.2 and 2.4. In the homogeneously nitrided surface zone (see Fig. 2.3)
regions exhibiting a lamellar-like microstructure, apparently evolving from grain
boundaries, can be observed (Fig. 2.2). Such a microstructure is indicative of the
occurrence of a discontinuous precipitation/coarsening reaction [52].
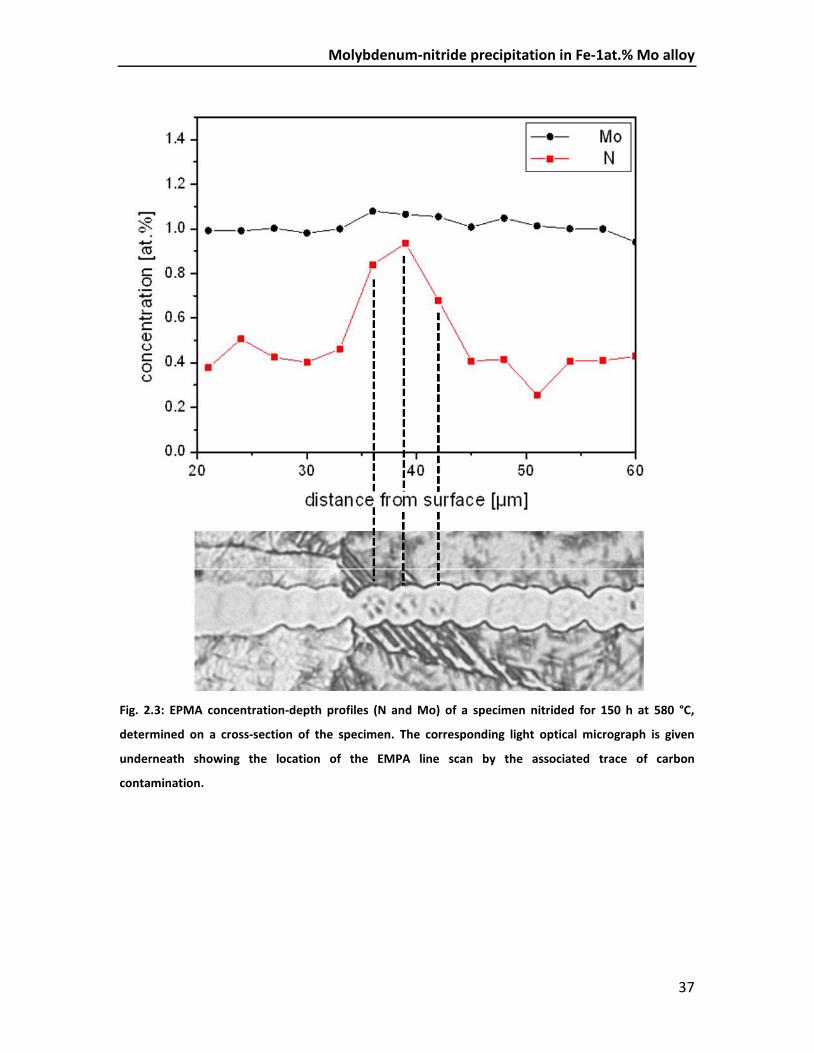
The EPMA line scan across a region showing discontinuous
precipitation/coarsening (Fig. 2.3) indicates an overall nitrogen concentration in the
lamellar region which is distinctly larger than that of the surrounding matrix. In the
matrix, the nitrogen concentration is at the level of 0.45 at.%, thereby exceeding the
maximum (at the nitriding temperature of 580 °C) solubility of nitrogen in pure ferrite
(which is about 0.3 at.%; cf. Ref. [9]), suggesting that precipitation of submicroscopical
nitrides has taken place already within these regions. Apparently, starting from the
ferrite-matrix grain boundaries, these submicroscopical, fine nitrides are replaced by a
(much coarser) lamellar microstructure composed of nitride and ferrite lamellae (for
TEM evidence, see below); i.e. a discontinuous precipitation/coarsening reaction has
occurred.
The nitrogen concentration in the lamellar regions is about twice that in the core
regions of the ferrite-matrix grains where no discontinuous precipitation/coarsening
was observed. This already suggests that the composition of the nitrides in the
discontinuously precipitated/coarsened regions is different: the discontinuous
precipitation/coarsening requires additional (i.e. continued) inward diffusion of
nitrogen. This can explain the long time required to achieve complete transformation:
only after 734 h of nitriding at 580 °C, virtually all grains had transformed by
discontinuous precipitation/coarsening (see Fig. 2.4).
Chapter 2
36
Fig. 2.2: LM-micrograph of a cross-section of a specimen nitrided for 150 h at 580 °C. The red circle
indicates the area used for the EBSD analysis presented in Fig. 2.10.
Molybdenum-nitride precipitation in Fe-1at.% Mo alloy
37
Fig. 2.3: EPMA concentration-depth profiles (N and Mo) of a specimen nitrided for 150 h at 580 °C,
determined on a cross-section of the specimen. The corresponding light optical micrograph is given
underneath showing the location of the EMPA line scan by the associated trace of carbon
contamination.
Chapter 2
38
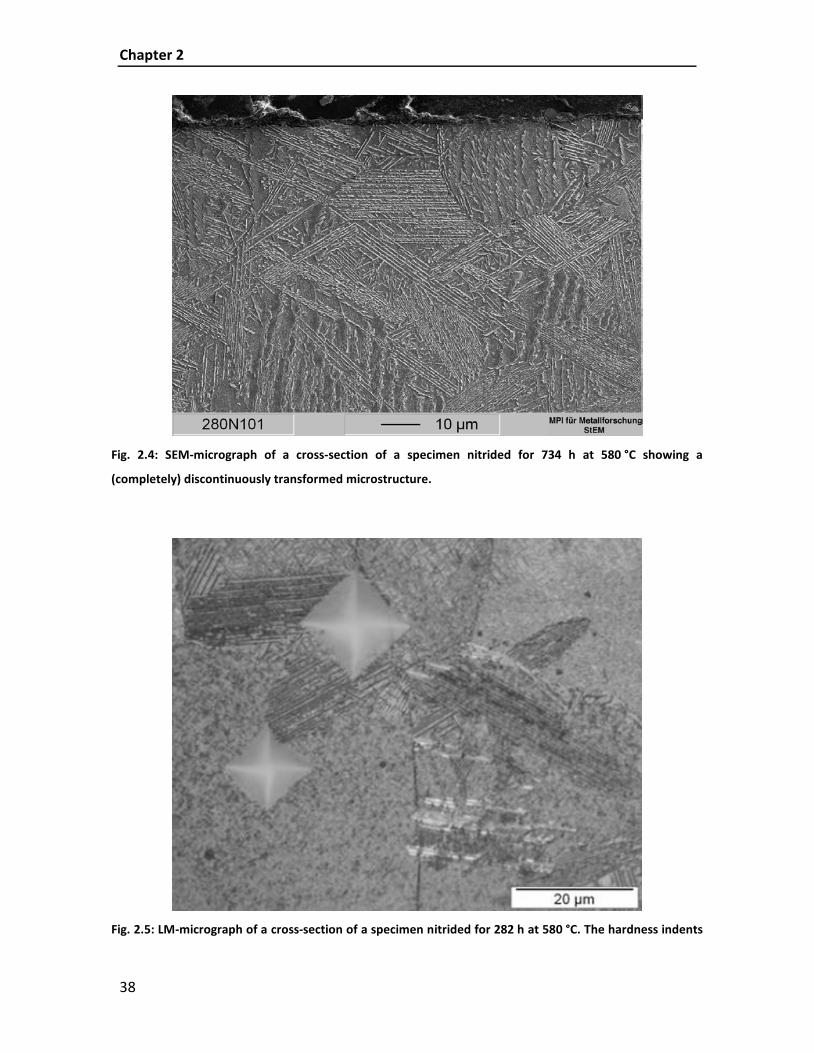
Fig. 2.4: SEM-micrograph of a cross-section of a specimen nitrided for 734 h at 580 °C showing a
(completely) discontinuously transformed microstructure.
Fig. 2.5: LM-micrograph of a cross-section of a specimen nitrided for 282 h at 580 °C. The hardness indents
Molybdenum-nitride precipitation in Fe-1at.% Mo alloy
39
are much larger in a lamellar region than in a not transformed region; i.e. the hardness in the lamellar
region is about 200 HV lower.
The discontinuous precipitation/coarsening leads to a distinct decrease of
hardness (see Fig. 2.5): the hardness difference is more than 200 HV0.05: 470 HV0.05
for the matrix as compared to 260 HV0.05 in the discontinuously precipitated/coarsened
region.
2.3.1.2 Identification of precipitates
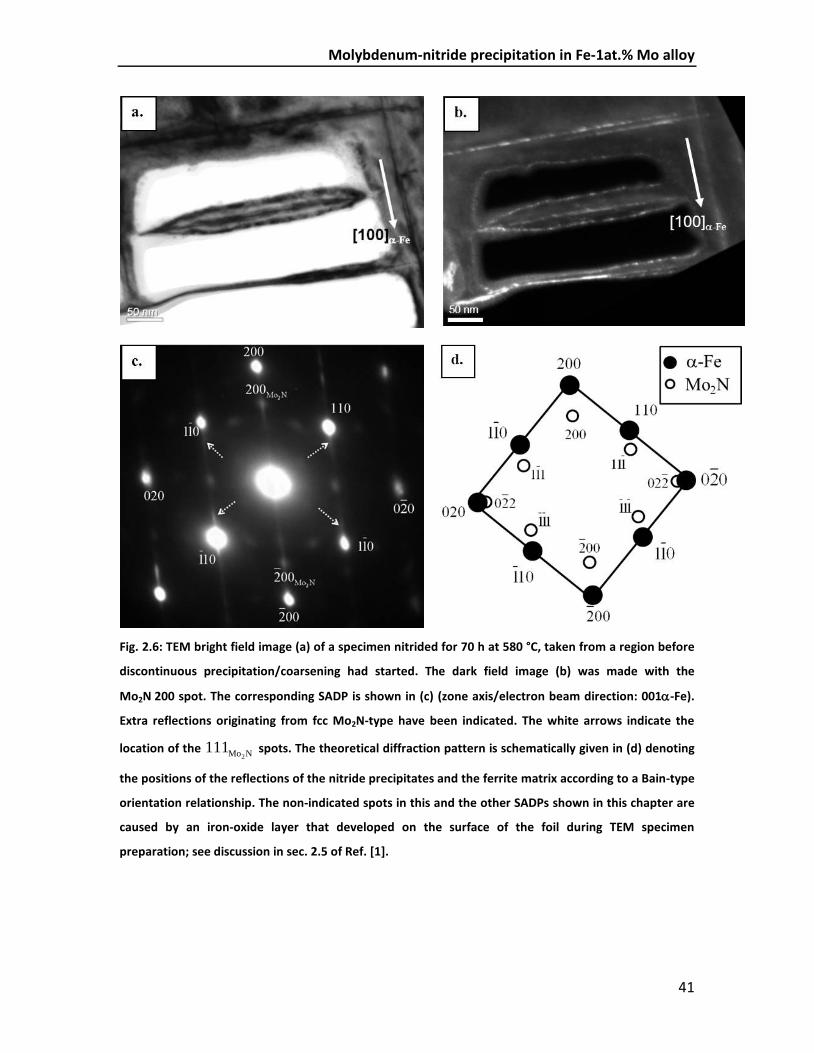
In the TEM bright field image recorded from a specimen nitrided for 70 h (no
discontinuous precipitation/coarsening had occurred at that stage), at a depth of about
20 µm beneath the surface, disc-shaped precipitates can be discerned having a thickness
of only a few nanometers whereas their (lateral) length can be several hundreds of
nanometres and developing with their faces parallel to the {001}α-Fe lattice planes (Fig.
2.6a). The selected area diffraction patterns (SADPs) reveal streaks (see e.g. Fig. 2.6c)
along the <100> α-Fe directions. Apart from streaking, intensity maxima occur on the
streaks in the selected area diffraction pattern which can be ascribed to reflections by
nitrides of the type Mo2N having a fcc crystal structure (defect-NaCl structure with N
occupying half of the octahedral interstices); see dark field image (Fig. 2.6b) taken with
the Mo2N 200 spot. The SADP is compatible with a Bain-type orientation relationship for
nitride (Mo2N-type) precipitates and the matrix [1]: (001)α-Fe // (001)nitride; [100]α-Fe //
[110]nitride.
The (theoretical) positions of diffraction spots of Mo2N, oriented according to a
Bain-type orientation relationship with the ferritic matrix, are shown in Fig. 2.6d.
Indeed, apart from Mo2N 200 reflections, indications for Mo2N 111 spots can be seen in
the experimental SADP as well (Fig. 2.6c), marked with white arrows.
The misfit between the precipitate and the matrix in directions parallel to the
habit plane is relatively small, whereas the misfit perpendicular to the platelet is very
large (cf. section 2.3.1.3 and see [45]). Thus, the development of streaks along the

Chapter 2
40
<100α-Fe > directions as a consequence of strain broadening in particular in the <100α-Fe >
matrix directions can be understood.
Similar observations (i.e. the presence of the fcc-type nitride Mo2N, evidenced by
reflections occurring from fcc Mo2N-type precipitates together with strong streaking in
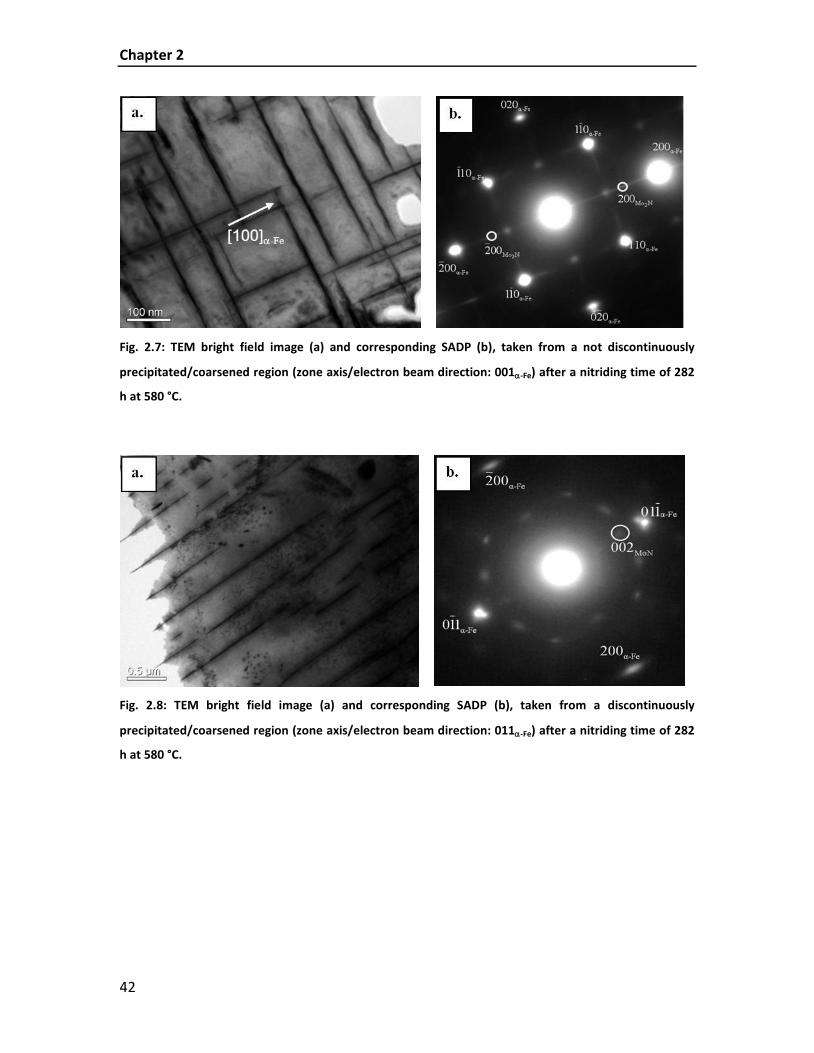
the <100α-Fe > directions), could still be made after a nitriding time of 282 h at 580 °C in
regions where no discontinuous precipitation/coarsening had occurred (see Figs. 2.7a
and b). TEM analysis after the same nitriding time (i.e. 282 h) but from a different
region, where discontinuous precipitation/coarsening had occurred (Figs. 2.8a and b)
and after longer nitriding times (e.g. see Figs. 2.9a and b), shows reflections originating
from hexagonal MoN-type, lamellar precipitates. Thus, at such intermediate stages,
both types of nitrides (i.e. Mo2N as well as MoN) occur concurrently, but in different
regions of the specimen. No streaks occur in the SADPs taken from such regions. The
MoN/α-Fe lamellae have a length of more than 20 µm and a distance of about 1 µm
between the lamellae. The lamellae are oriented such that {001}MoN // {110}α-Fe; i.e.
close packed planes are parallel.
EBSD confirms this TEM analysis: the EBSD image (Fig. 2.10) taken from the
region showing discontinuous precipitation/coarsening in the LM-image (marked with a
red circle in Fig. 2.2), indicates the presence of a hexagonal (MoN-type) phase. The
orientation relationship of the hexagonal MoN-type phase with respect to the ferrite
matrix complies with the Burgers orientation relationship [53]:
( ) α-FeMoN MoN -Fe0001 (110) , 2110 111
α
Molybdenum-nitride precipitation in Fe-1at.% Mo alloy
41
Fig. 2.6: TEM bright field image (a) of a specimen nitrided for 70 h at 580 °C, taken from a region before
discontinuous precipitation/coarsening had started. The dark field image (b) was made with the
Mo2N 200 spot. The corresponding SADP is shown in (c) (zone axis/electron beam direction: 001α-Fe).
Extra reflections originating from fcc Mo2N-type have been indicated. The white arrows indicate the
location of the 2Mo N111 spots. The theoretical diffraction pattern is schematically given in (d) denoting
the positions of the reflections of the nitride precipitates and the ferrite matrix according to a Bain-type
orientation relationship. The non-indicated spots in this and the other SADPs shown in this chapter are
caused by an iron-oxide layer that developed on the surface of the foil during TEM specimen
preparation; see discussion in sec. 2.5 of Ref. [1].
Chapter 2
42
Fig. 2.7: TEM bright field image (a) and corresponding SADP (b), taken from a not discontinuously
precipitated/coarsened region (zone axis/electron beam direction: 001α-Fe) after a nitriding time of 282
h at 580 °C.
Fig. 2.8: TEM bright field image (a) and corresponding SADP (b), taken from a discontinuously
precipitated/coarsened region (zone axis/electron beam direction: 011α-Fe) after a nitriding time of 282
h at 580 °C.

Molybdenum-nitride precipitation in Fe-1at.% Mo alloy
43
Fig. 2.9: TEM bright field image (a) and corresponding SADP (b), taken from a lamellae within the
discontinuously precipitated/coarsened region (zone axis/electron beam direction: 111α-Fe) after a
nitriding time of 420 h at 580 °C. The white arrow marks the position of a MoN 200 reflection.
Fig. 2.10: EBSD image of the region marked with a red circle in Fig. 2.2. The phase map (a) indicates the
presence of a hexagonal (MoN-type) phase by a green colour, while a cubic (α-Fe-type) phase is
presented with a red colour. The orientation map (b) led to determination of a Burgers orientation
relationship of the hexagonal (MoN-type) phase (red colour) and the bcc ferritic matrix (green colour).
Chapter 2
44
2.3.1.3 Anisotropical matrix distortion
In the early stages of nitriding, i.e. before discontinuous precipitation/coarsening can be
detected in the microstructure, in the X-ray diffraction patterns (recorded from the
surface of the specimen) only reflections belonging to ferrite can be observed (see Fig.
2.12; diffraction pattern after 88 h of nitriding). The absence of reflections of the cubic,
fcc-type nitride Mo2N (see the TEM results; section 2.3.1.2) could be due to the small
size of these precipitates (see Figs. 2.6 and 2.7), and also be a consequence of the
coherent nature of these nitride precipitates: coherent diffraction of the nitrides with
the ferritic matrix can occur [45, 54]. Then, because of the correspondingly,
anisotropically, tetragonally distorted ferrite matrix [45], due to the mismatch of ferrite
matrix and nitride platelets (see Fig. 2.13), strongly broadened tetragonal 200/002
doublets in the diffractograms can occur, as observed (see Fig. 2.11): the strongly
asymmetric broadened, originally 200 reflections of the bcc α-Fe matrix cannot be fitted
with a single peak. The best result is obtained with a fitting procedure adopting one
peak for the cubic ferrite and one (of doublet nature) for nitride particle and the
tetragonally distorted surrounding matrix (see Fig. 2.11). As starting values for the fitting
procedure applied to this composite peak, data given in [55] were used for the cubic,
ferrite reflection as well as for the tetragonal doublet reflection (nitride + surrounding
matrix). The intensity “hump” at the high angle side of the measured, composite
reflection (at a 2θ value of about 77.4°; see arrow) is caused by the Co-Kα2 component
in the incident radiation.

Molybdenum-nitride precipitation in Fe-1at.% Mo alloy
45
Fig. 2.11: Measured (red line) diffraction profile of a specimen (homogeneously) nitrided for 156 h at
580 °C. A fitting procedure was applied adopting one peak for the cubic ferrite and one (of doublet
nature) for nitride particle and the tetragonally distorted surrounding matrix (blue line). The
corresponding overlapped, calculated diffraction profile (green line) corresponds well with the
measured one. The arrow indicates the contribution of the Co-Kα2 component in the incident radiation.
Upon nitriding until about 150 h the intensity ratio of the tetragonal to cubic
“ferrite” reflections increases suggesting that the fraction of (partially) coherent Mo2N
precipitates (leading to this tetragonal distorted “ferrite” reflection) increases until a
nitriding time of about 150 h. The transition of Mo2N (fcc, submicroscopical) to MoN
(hexagonal, lamellar), taking place in a discontinuous manner (cf. section 2.3.1.1),
becomes dominant after 150 h of nitriding and is associated with an abrupt drop of this
intensity ratio.
Upon continued nitriding additional reflections emerge in the X-ray diffraction
patterns which can be identified as reflections of the hexagonal MoN-type nitride (e.g.
see results for 268 h and 734 h in Fig. 2.12). This stage is therefore characterized by the
presence of mainly MoN precipitates, which well agrees with the result of the TEM
analysis from discontinuous precipitated/coarsened regions (cf. Figs. 2.8 and 2.9) and is

Chapter 2
46
compatible with the recognition that at this stage the largest part of the specimen had
experienced the discontinuous precipitation/coarsening reaction.
40 60 80
2 θ [deg]
734 h
inte
nsity
[a.u
.]
268 h
MoN 00
2
MoN 20
0
Fe 1
10
MoN 30
1
Fe 200
88 h
BN
Fig. 2.12: X-ray diffraction pattern of the recrystallized specimen before nitriding (BN), and after
nitriding at 580 °C for 88 h, 268 h and 734 h showing reflections belonging to ferrite and the hexagonal
MoN-type nitride (the 200 and 002 reflections of MoN have a relative intensity of 100 % and 49 %,
respectively, according to Ref. [51]).
Fig. 2.13: Schematic view of a Mo2N platelet coherent with the matrix leading to an expansion of the
ferrite lattice-plane spacing in directions parallel to the platelet and a corresponding compression of the
lattice-plane spacing in directions perpendicular to the platelet: the ferrite matrix surrounding the
platelet is distorted tetragonally.

Molybdenum-nitride precipitation in Fe-1at.% Mo alloy
47
The lattice parameter of the unnitrided, annealed specimen, as calculated from
the ferrite-matrix peak positions, is slightly larger than the stress-free equilibrium lattice
parameter of pure iron [51] (see Fig. 2.14), as a consequence of Mo initially being
dissolved in the ferritic matrix [56]. The increase of the lattice parameter in the early
stages of nitriding, as indicated by a shift of the ferrite-matrix peak position to lower 2θ
values, can be ascribed to nitrogen becoming dissolved in the ferrite lattice and to the
elastically accommodated misfit of the Mo-nitride with the ferrite matrix leading to an
overall hydrostatic tensile stress component [31]. The coherent to incoherent transition
of the nitride precipitates, associated with the occurrence of the discontinuous
precipitation/coarsening, then leads to an abrupt decrease of the ferrite-lattice
parameter and thus a shift of the ferrite-matrix peak position to higher 2θ values. The
finally reached value of the lattice parameter corresponds to that of pure ferritic iron,
implying that all Mo present in the specimen has precipitated as (incoherent) nitride.
0 100 200 300 400 500 600 700 8002,865
2,866
2,867
2,868
2,869
2,870
2,871
2,872
2,873 measured pure Fe
latti
ce p
aram
eter
a [Å
]
nitriding time [h]
Fig. 2.14: Lattice parameter of ferrite depending on nitriding time at 580 °C. The black points represent
the lattice-parameter values derived from the measured peak positions of the 200 reflection. The
dotted line represents the lattice parameter of pure, unstrained ferrite [51].

Chapter 2
48
2.3.1.4 The discontinuous transformation
The results presented in the preceding subsections can be summarized as follows. The
nitride precipitation starts with the formation of submicroscopical Mo2N-type
precipitates (no indication of α''-(Fe, Mo)16N2-type precursors (cf. section 2.3.1.2) was
obtained) followed by a discontinuous transformation of the type [57, 58]:
α +γ α+δ′ →
where α' denotes the supersaturated, distorted ferrite-matrix (cf. section 2.3.1.2), γ
represents the submicroscopical likely largely coherent Mo2N-type precipitates and α
and δ represent the ferrite and MoN-type lamellae in the colonies produced by the
discontinuous transformation starting from (mobile) grain boundaries in the ferrite
matrix. Because the crystal structures of γ and δ are not identical, the discontinuous
transformation in this case is a pure discontinuous precipitation reaction and cannot be
considered as a discontinuous coarsening reaction (of the type α +β α+β′ ′ → as
observed and discussed for nitrided Fe-Cr and Fe-V alloys [2, 3]).
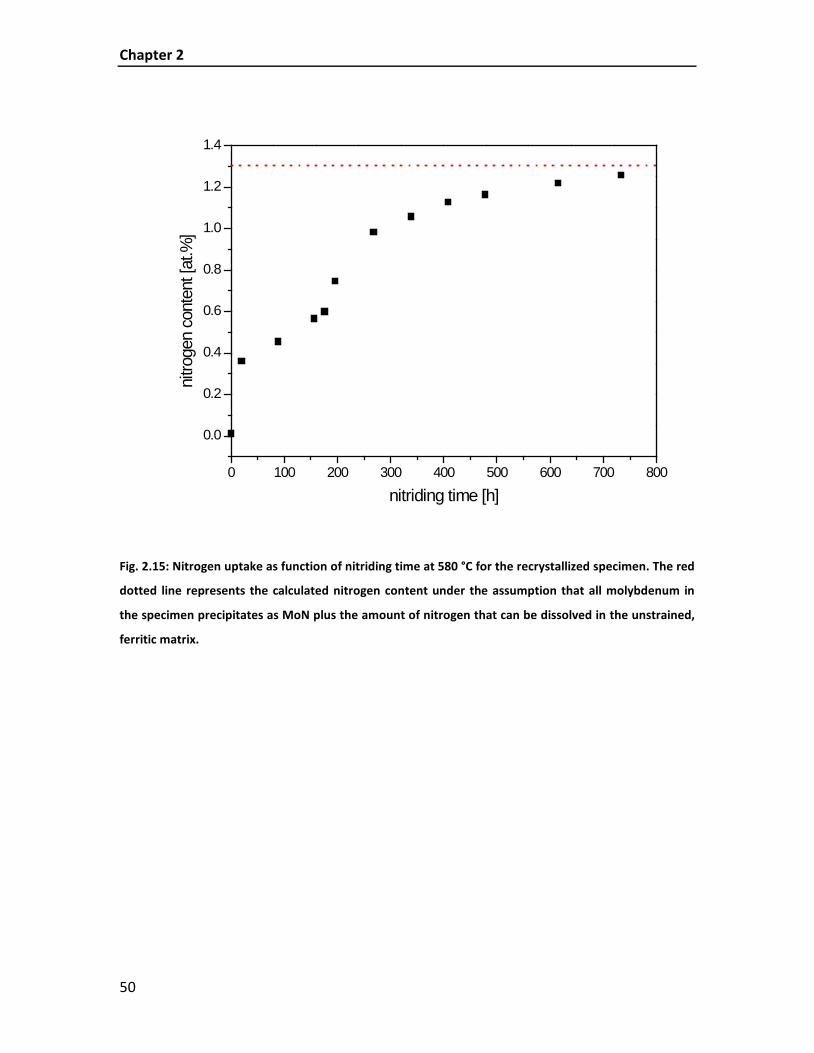
2.3.1.5 Nitrogen uptake
The nitrogen uptake of the specimen was determined by weight gain measurements at
580 °C as function of nitriding time. After about 5 h of nitriding the specimen (thickness
approximately 120 µm) is through nitrided and exhibits an overall compositional
homogeneity (cf. section 2.2.2). Thereafter the mass change by nitrogen uptake
represents the overall homogeneous change of the nitrogen content. The mass uptake
curve (Fig. 2.15) can thus be interpreted recognizing three stages of nitriding:
(i) Nitrogen taken up rapidly by the specimen in an initial stage of nitriding till
about 20 h. This nitrogen is mainly dissolved in the octahedral interstices of
the ferritic lattice: saturation of the matrix is achieved after less than 20 h.
(ii) The continuous, slow increase in nitrogen content between 20 h and about
200 h of nitriding can be ascribed to the slow precipitation of Mo as the
Molybdenum-nitride precipitation in Fe-1at.% Mo alloy
49
extremely small, initially coherent nitrides of Mo2N-type (see Figs. 2.6 and
2.7).
(iii) Discontinuous transformation starts after a nitriding time of about 200 h,
leading to an acceleration of the nitrogen-uptake rate which is ascribed to
the obviously larger capacity per Mo atom for nitrogen incorporation in
MoN-type precipitates, as lamellae in the discontinuously transformed
regions, than in the (submicroscopical) Mo2N-type precipitates. Due to the
change in stoichiometry (Mo2N-type → MoN-type), nitrogen has to diffuse
from the gas phase to the growing lamellae. The theoretically expected
nitrogen content in the specimen, if all Mo has precipitated as MoN, plus the
amount of nitrogen that can be dissolved in the unstrained ferritic matrix
([9]), has been marked with a red dotted line in Fig. 2.15. Indeed, the
measured nitrogen content asymptotically reaches this value upon prolonged
nitriding. This result (a) contradicts earlier FIM-atom probe data [26] that a
substantial amount of Fe would be incorporated in the MoN-type
precipitates (at positions of the Mo atoms in the crystal structure) (see also
section 2.1) and (b) agrees with results obtained in [41].
It is remarked that such controversy about the whether or not incorporation of Fe in
nitride precipitates also exists regarding the precipitation of CrN during nitriding of Fe-Cr
alloys. FIM-atom probe data suggest such Fe incorporation [59], whereas mass-change
data for homogeneously nitrided specimens clearly indicate that all Cr has precipitated
as CrN [17]. It may be that the occurrence of surface diffusion of atoms on the FIM-atom
probe specimens invalidates the local composition analysis by the FIM-atom probe [48].
It strikes that composition analyses based on other techniques, albeit not based on local
composition determination, indicate that the alloying element nitrides do not
incorporate iron atoms from the matrix [17, 30, 41]. Yet, at the present state of
knowledge, it cannot be excluded that some iron is taken up in the nitrides especially at
very early stages of precipitation.
Chapter 2
50
0 100 200 300 400 500 600 700 800
0.0
0.2
0.4
0.6
0.8
1.0
1.2
1.4
nitro
gen
cont
ent [
at.%
]
nitriding time [h]
Fig. 2.15: Nitrogen uptake as function of nitriding time at 580 °C for the recrystallized specimen. The red
dotted line represents the calculated nitrogen content under the assumption that all molybdenum in
the specimen precipitates as MoN plus the amount of nitrogen that can be dissolved in the unstrained,
ferritic matrix.

Molybdenum-nitride precipitation in Fe-1at.% Mo alloy
51
2.3.2 Cold rolled specimens
2.3.2.1 Morphology; discontinuous precipitation reaction
The microstructure of the cold rolled specimen after nitriding is shown in the light
optical micrograph taken after a nitriding time of 90 h (Fig. 2.16). Regions exhibiting a
lamellar-like microstructure due to discontinuous precipitation, as observed for the
recrystallized specimen, can be discerned (cf. Fig. 2.2). The nitrogen concentration-
depth profile, determined by EPMA after nitriding for 90 h and subsequent denitriding
for 70 h at 470 °C (see discussion immediately below), indicates an enhanced nitrogen
concentration within the lamellar-like region, as compared to the surrounding matrix
(also as observed for the recrystallized specimen; cf. Fig. 2.3).
The denitriding treatment was carried out under pure hydrogen in order to
remove the interstitially dissolved nitrogen in the ferritic matrix (and possibly (excess)
nitrogen adsorbed to the faces of the nitride platelets (cf. [30, 31]). Then, the measured
nitrogen concentration in regions where no discontinuous precipitation had taken place
equals about 0.5 at.%. This amount of nitrogen well corresponds to full precipitation of
Mo as nitrides of stoichiometry Mo2N. This suggests that also the (nitrided) Mo2N-type
precipitates incorporate no significant amount of Fe atoms (see discussion in section
2.3.1.5). In the lamellar-like, discontinuously transformed regions, the nitrogen
concentration is distinctly higher than in the surroundings which is due to the change in
nitride stoichiometry from Mo2N to MoN.
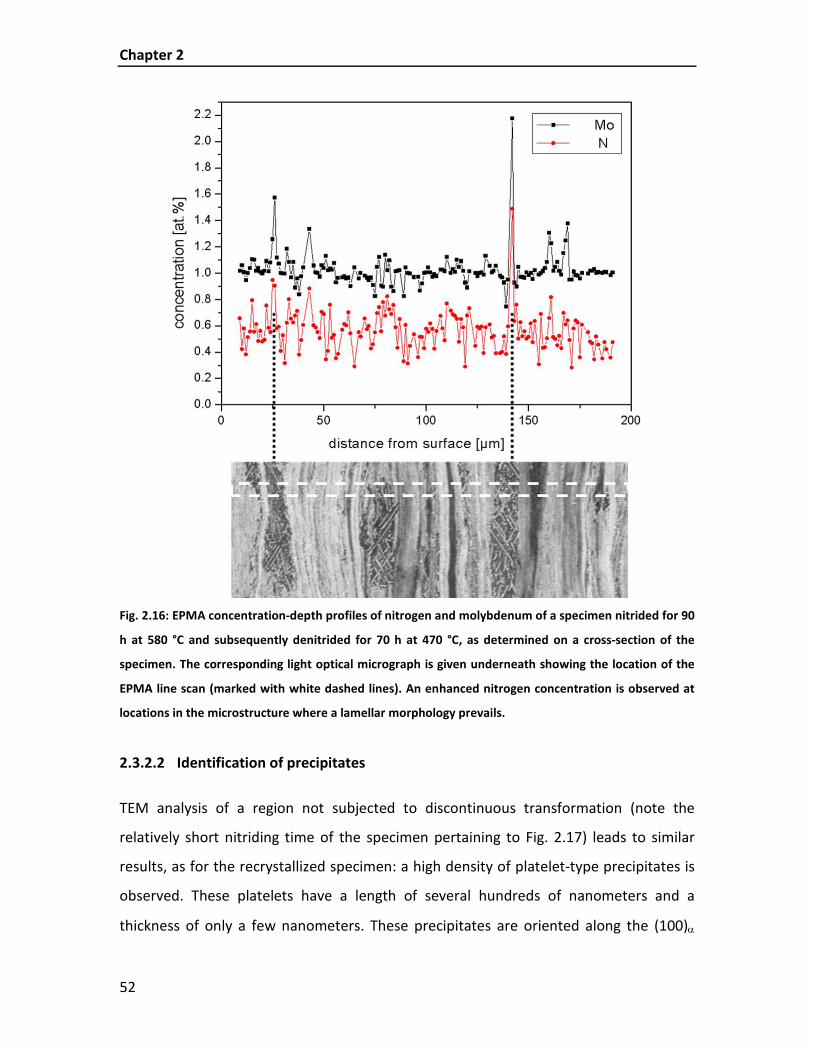
Chapter 2
52
Fig. 2.16: EPMA concentration-depth profiles of nitrogen and molybdenum of a specimen nitrided for 90
h at 580 °C and subsequently denitrided for 70 h at 470 °C, as determined on a cross-section of the
specimen. The corresponding light optical micrograph is given underneath showing the location of the
EPMA line scan (marked with white dashed lines). An enhanced nitrogen concentration is observed at
locations in the microstructure where a lamellar morphology prevails.
2.3.2.2 Identification of precipitates
TEM analysis of a region not subjected to discontinuous transformation (note the
relatively short nitriding time of the specimen pertaining to Fig. 2.17) leads to similar
results, as for the recrystallized specimen: a high density of platelet-type precipitates is
observed. These platelets have a length of several hundreds of nanometers and a
thickness of only a few nanometers. These precipitates are oriented along the (100)α
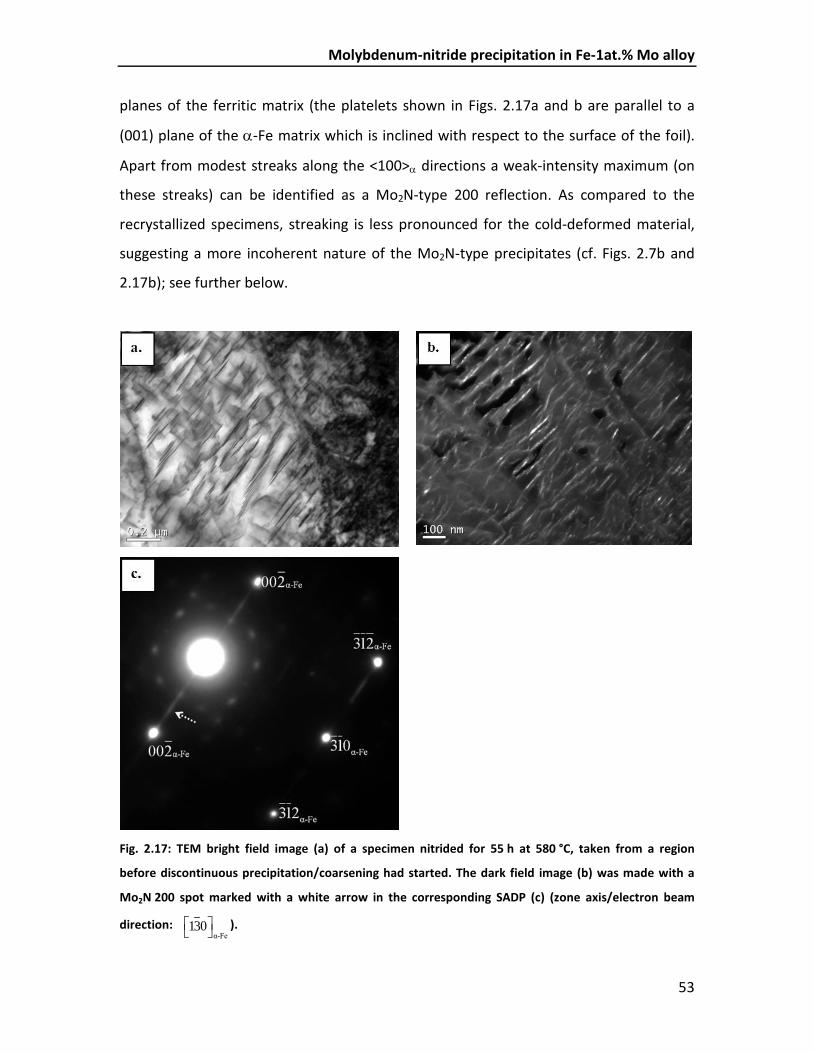
Molybdenum-nitride precipitation in Fe-1at.% Mo alloy
53
planes of the ferritic matrix (the platelets shown in Figs. 2.17a and b are parallel to a
(001) plane of the α-Fe matrix which is inclined with respect to the surface of the foil).
Apart from modest streaks along the <100>α directions a weak-intensity maximum (on
these streaks) can be identified as a Mo2N-type 200 reflection. As compared to the
recrystallized specimens, streaking is less pronounced for the cold-deformed material,
suggesting a more incoherent nature of the Mo2N-type precipitates (cf. Figs. 2.7b and
2.17b); see further below.
Fig. 2.17: TEM bright field image (a) of a specimen nitrided for 55 h at 580 °C, taken from a region
before discontinuous precipitation/coarsening had started. The dark field image (b) was made with a
Mo2N 200 spot marked with a white arrow in the corresponding SADP (c) (zone axis/electron beam
direction: α-Fe
130 ).
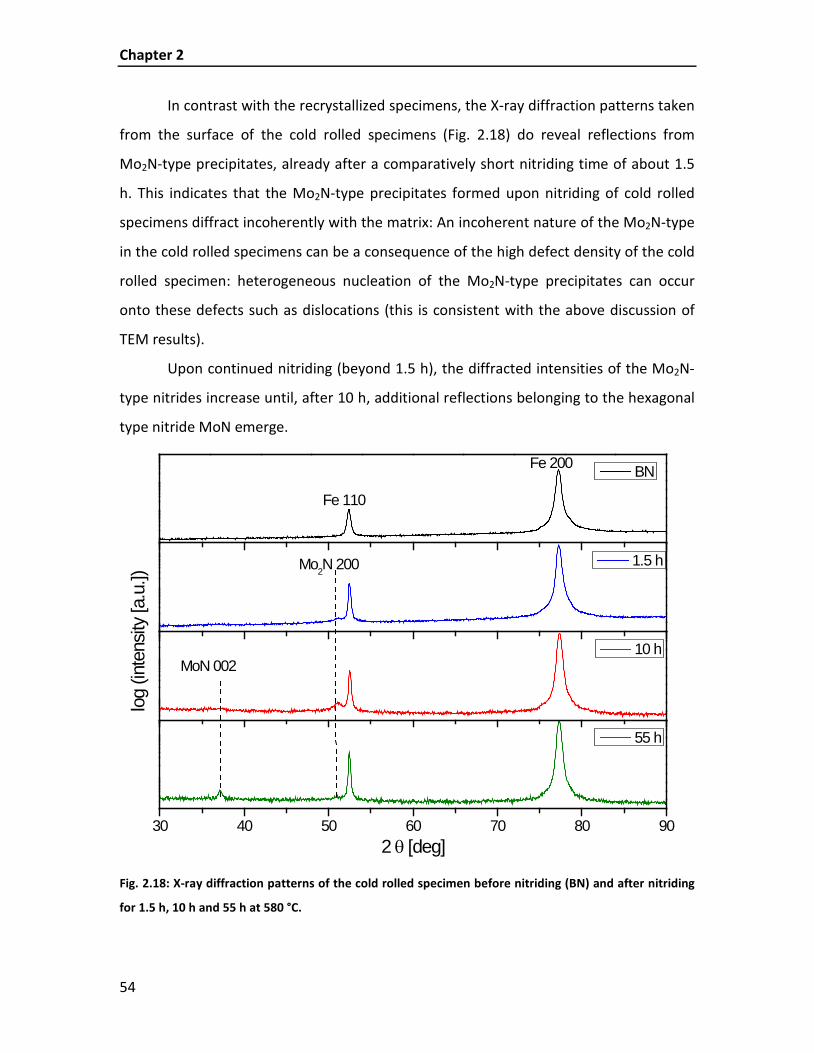
Chapter 2
54
In contrast with the recrystallized specimens, the X-ray diffraction patterns taken
from the surface of the cold rolled specimens (Fig. 2.18) do reveal reflections from
Mo2N-type precipitates, already after a comparatively short nitriding time of about 1.5
h. This indicates that the Mo2N-type precipitates formed upon nitriding of cold rolled
specimens diffract incoherently with the matrix: An incoherent nature of the Mo2N-type
in the cold rolled specimens can be a consequence of the high defect density of the cold
rolled specimen: heterogeneous nucleation of the Mo2N-type precipitates can occur
onto these defects such as dislocations (this is consistent with the above discussion of
TEM results).
Upon continued nitriding (beyond 1.5 h), the diffracted intensities of the Mo2N-
type nitrides increase until, after 10 h, additional reflections belonging to the hexagonal
type nitride MoN emerge.
30 40 50 60 70 80 90
2 θ [deg]
55 h
MoN 002 10 h
Mo2N 200
log
(inte
nsity
[a.u
.])
1.5 h
Fe 200 BN
Fe 110
Fig. 2.18: X-ray diffraction patterns of the cold rolled specimen before nitriding (BN) and after nitriding
for 1.5 h, 10 h and 55 h at 580 °C.
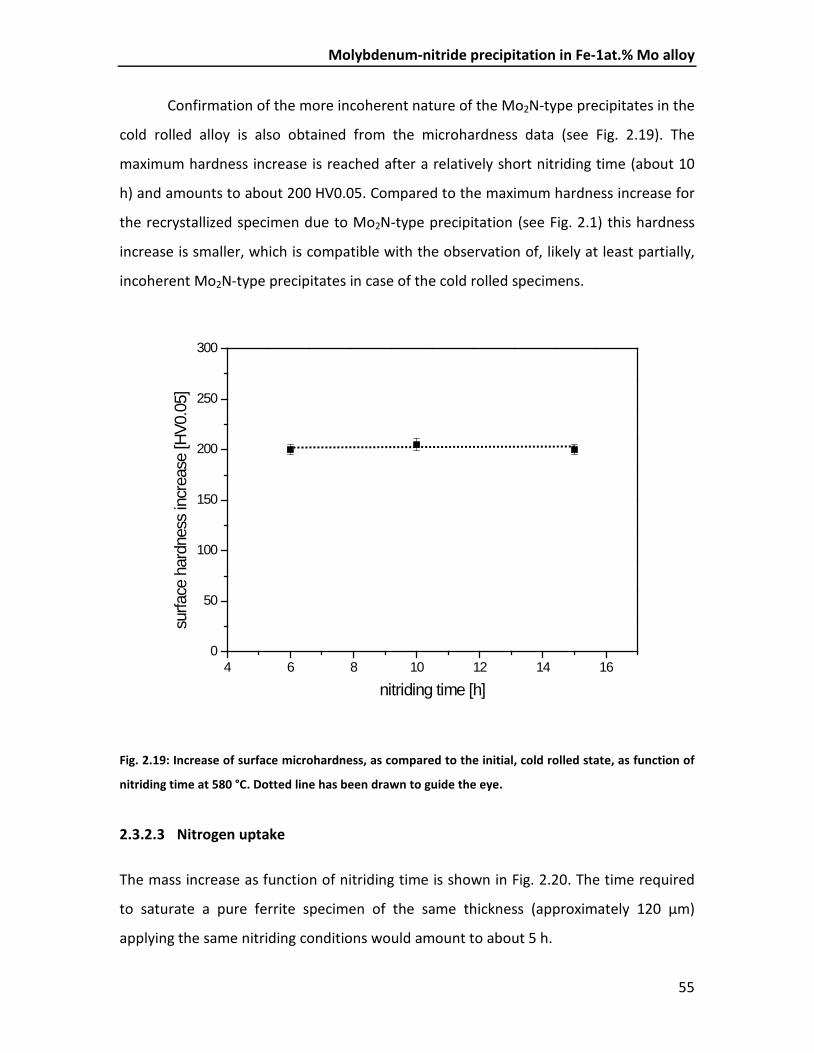
Molybdenum-nitride precipitation in Fe-1at.% Mo alloy
55
Confirmation of the more incoherent nature of the Mo2N-type precipitates in the
cold rolled alloy is also obtained from the microhardness data (see Fig. 2.19). The
maximum hardness increase is reached after a relatively short nitriding time (about 10
h) and amounts to about 200 HV0.05. Compared to the maximum hardness increase for
the recrystallized specimen due to Mo2N-type precipitation (see Fig. 2.1) this hardness
increase is smaller, which is compatible with the observation of, likely at least partially,
incoherent Mo2N-type precipitates in case of the cold rolled specimens.
4 6 8 10 12 14 160
50
100
150
200
250
300
surfa
ce h
ardn
ess
incr
ease
[HV0
.05]
nitriding time [h]
Fig. 2.19: Increase of surface microhardness, as compared to the initial, cold rolled state, as function of
nitriding time at 580 °C. Dotted line has been drawn to guide the eye.
2.3.2.3 Nitrogen uptake
The mass increase as function of nitriding time is shown in Fig. 2.20. The time required
to saturate a pure ferrite specimen of the same thickness (approximately 120 µm)
applying the same nitriding conditions would amount to about 5 h.
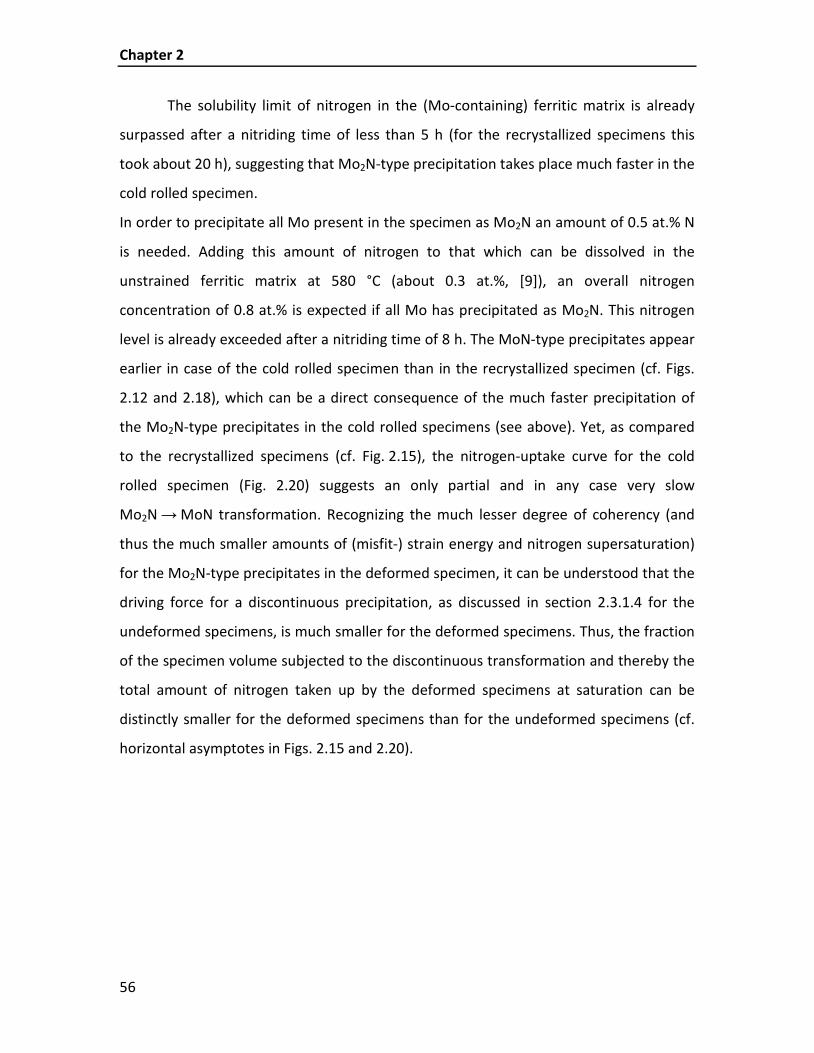
Chapter 2
56
The solubility limit of nitrogen in the (Mo-containing) ferritic matrix is already
surpassed after a nitriding time of less than 5 h (for the recrystallized specimens this
took about 20 h), suggesting that Mo2N-type precipitation takes place much faster in the
cold rolled specimen.
In order to precipitate all Mo present in the specimen as Mo2N an amount of 0.5 at.% N
is needed. Adding this amount of nitrogen to that which can be dissolved in the
unstrained ferritic matrix at 580 °C (about 0.3 at.%, [9]), an overall nitrogen
concentration of 0.8 at.% is expected if all Mo has precipitated as Mo2N. This nitrogen
level is already exceeded after a nitriding time of 8 h. The MoN-type precipitates appear
earlier in case of the cold rolled specimen than in the recrystallized specimen (cf. Figs.
2.12 and 2.18), which can be a direct consequence of the much faster precipitation of
the Mo2N-type precipitates in the cold rolled specimens (see above). Yet, as compared
to the recrystallized specimens (cf. Fig. 2.15), the nitrogen-uptake curve for the cold
rolled specimen (Fig. 2.20) suggests an only partial and in any case very slow
Mo2N → MoN transformation. Recognizing the much lesser degree of coherency (and
thus the much smaller amounts of (misfit-) strain energy and nitrogen supersaturation)
for the Mo2N-type precipitates in the deformed specimen, it can be understood that the
driving force for a discontinuous precipitation, as discussed in section 2.3.1.4 for the
undeformed specimens, is much smaller for the deformed specimens. Thus, the fraction
of the specimen volume subjected to the discontinuous transformation and thereby the
total amount of nitrogen taken up by the deformed specimens at saturation can be
distinctly smaller for the deformed specimens than for the undeformed specimens (cf.
horizontal asymptotes in Figs. 2.15 and 2.20).
Molybdenum-nitride precipitation in Fe-1at.% Mo alloy
57
0 10 20 60 70 80 90 1000.0
0.2
0.4
0.6
0.8
1.0
1.2
1.4
nitro
gen
cont
ent [
at.%
]
nitriding time [h]
Fig. 2.20: Nitrogen uptake as function of nitriding time at 580 °C for the cold rolled specimen. The red
dotted line represents the calculated nitrogen content under the assumption that all molybdenum in
the specimen precipitates as MoN plus the amount of nitrogen that can be dissolved in the unstrained,
ferritic matrix.
2.4 Conclusions
The nitride-precipitation process in recrystallized and cold rolled Fe-1at.%Mo alloy upon
nitriding can be described as follows:
- First, the nitrogen content increases rapidly until nitrogen saturation of the
ferrite matrix has been realized.
- Then, development of cubic Mo2N-type precipitates as platelets of several
hundreds of nm length and thickness of a few atomic layers occurs according to a
Bain-type orientation relationship. In case of the recrystallized specimens the
platelets are largely coherent (diffracting coherently with the matrix) giving rise
to strongly asymmetric ferrite-matrix diffraction peaks. In case of the cold rolled

Chapter 2
58
specimens development of the Mo2N-type precipitation occurs much earlier and
the nitride platelets are at least partially incoherent (giving rise to separate
nitride reflections in the diffraction patterns).
- Upon prolonged treatment a discontinuous precipitation reaction initiating at
ferrite-matrix grain boundaries takes place replacing the submicroscopical Mo2N-
type platelets by a lamellar α-Fe/MoN (hexagonal) microstructure with a
Burgers-type orientation relationship, involving parallelism of close packed
planes in both phases. In case of the recrystallized specimens the discontinuous
precipitation reaction eventually brings about a full transformation of Mo2N-type
precipitates to MoN-type precipitates. In case of the cold rolled specimens the
Mo2N → MoN transformation occurs only partially: the driving force for the
discontinuous precipitation reaction is much smaller in case of the cold rolled
specimen (much less (misfit-) strain energy and nitrogen supersaturation).
- The discontinuous transformation leads to a pronounced increase in the nitrogen
concentration upon transformation due to the change in stoichiometry (Mo2N →
MoN).
- The composition analysis of the Mo2N-type nitrides (submicroscopical) and of
the MoN-type nitrides (lamellae) suggests no incorporation of significant
amounts of Fe in the nitrides. Such earlier data all derive from FIM-atom probe
analyses, which may have been affected by loss of spatial resolution.

59
CHAPTER 3
3 Defect-dependent nitride surface-layer development
upon nitriding of Fe-1 at.% Mo alloys
H. Selg, E. Bischoff, I. Bernstein, T. Woehrle, S. Meka, R. Schacherl, T. Waldenmaier,
E.J. Mittemeijer
Abstract
Upon nitriding of binary Fe-1at.% Mo alloy in a NH3/H2 gas mixture under conditions
(thermodynamically) allowing γ’-Fe4N1-x compound-layer growth (nitriding potential:
0.7 atm-1/2 at 753 K (480 °C) – 823 K (550 °C)) a strong dependency of the morphology of
the formed compound layer on the defect density of the specimen was observed. Nitriding
of cold rolled Fe-1at.% Mo specimens leads to the formation of a closed compound layer of
approximately constant thickness, comparable to nitriding of pure iron. Within the
compound layer, i.e. in the near-surface region, Mo nitrides are present. The growth of the
compound layer could be described by a modified parabolic growth law leading to an
activation energy comparable to literature data for the activation energy of growth of a
γ’-Fe4N1-x layer on pure iron. Upon low temperature nitriding (i.e. ≤ 793 K (520 °C)) of
recrystallized Fe-1at.%Mo specimens an irregular, “needle-like” morphology of γ’- Fe4N1-x
nucleated at the surface occurs. This γ’ iron nitride has an orientation relationship (OR)
with the matrix close to the Nishiyama-Wassermann OR. The different morphologies of the
formed compound layer can be interpreted as consequences of the ease or difficulty of
precipitation of Mo as nitride as function of the defect density.
Chapter 3
60
3.1 Introduction
Thermochemical heat treatments are widely applied in industry in order to improve the
surface properties of iron-based components. Gaseous nitriding is one of the most
important of such treatments leading to pronouncedly improved mechanical
(e.g. fatigue, wear) and chemical (e.g. corrosion) properties of ferritic steel components
and work pieces in many practical applications [43, 60]. Upon nitriding, nitrogen atoms
diffuse into the surface of the specimen. As a nitrogen donator, ammonia can be used,
due to its dissociation at the surface of iron-based alloys, leading to the development of
a nitrided zone at and beneath the surface. Gaseous nitriding, by employing a gas
atmosphere composed of ammonia and hydrogen, allows an accurate control of the
chemical potential of nitrogen in the nitriding atmosphere. The nitriding potential 3
2
3/ 2NH
NH
pr
p= is proportional to the chemical potential/activity of nitrogen in the atmosphere
[61]. If it is assumed that the chemical potential of nitrogen in the gas atmosphere is
equal to the chemical potential of nitrogen absorbed at the surface (then so-called local
equilibrium prevails), the nitrogen uptake can be adjusted very precisely by control of
the composition of the gas atmosphere at constant temperature and pressure [9]. The
nitrided layer itself, depending on the nitriding conditions [10, 23] can be subdivided
into a compound layer adjacent to the surface, composed of iron nitrides and a diffusion
zone beneath the compound layer. Within the diffusion zone, nitrogen is dissolved in
the octahedral interstices of the ferrite lattice, or precipitated as internal nitrides MeNx
if nitride forming elements, such as Me = Ti, Cr, Al, V are present [7, 16, 19, 45].
Recent work has shown that the presence of nitride forming alloying elements
can have a significant influence on the nucleation and growth behaviour of compound
layers consisting of γ’-Fe4N1-x; an unusual needle-like morphology was obtained in the
presence of Al as alloying element [62].
Usually, Mo is not added deliberately to nitriding steels to promote precipitation
of molybdenum nitride but it is often present to improve the tempering brittleness,
strength and weldability [46]. Against this background in this work the influence of Mo

Nitride surface-layer development upon nitriding of Fe-1 at.% Mo alloy
61
on the nucleation and growth behaviour of a nitride surface layer on a Fe-Mo alloy
substrate, and in particular its dependency on the defect density of the alloy substrate,
was investigated.
3.2 Experimental
3.2.1 Specimen preparation
For the production of an alloy with the composition Fe-1at.% Mo appropriate amounts
of pure iron (99.98 wt.%) and pure molybdenum (99.99 wt.%) were weighed, pre-
alloyed in an arc furnace and melted in an Al2O3 crucible by means of an inductive
furnace under a protective argon gas atmosphere (99.999 vol.%). The melt was cast in a
copper mould to obtain a cylindrical rod (Ø: 10 mm, l: 100 mm). The chemical
composition and the amounts of impurities were determined using chemical analysis
(inductively coupled plasma - optical emission spectroscopy, combustion method and
carrier gas hot extraction). The results are shown in Table 3.1.
Table 3.1: Amounts of Mo and light element impurities for the alloy used in this work (balance: Fe).
Element Mo O N C S
content [wt.%] 1.800 ± 0.02 0.009 ± 0.002 0.003 ± 0.001 0.006 ± 0.001 <0.001
content [at.%] 1.057 ± 0.012 0.032 ± 0.007 0.012 ± 0.004 0.028 ± 0.005 <0.002
After casting the rod was cut into 3 pieces and their shells were removed by grinding.
These pieces were cleaned with ethanol in an ultrasonic bath before cold rolling to
sheets of a thickness of about 1 mm (degree of deformation: 90 %). Out of these sheets,
rectangular specimens were cut (dimensions: about 15 x 10 mm2) and a hole was drilled
(Ø: 1.5 mm) for fixing it later during heat treatment. The specimens were ground,
cleaned in an ultrasonic bath using ethanol and then encapsulated in a quartz tube

Chapter 3
62
which was filled with argon gas (purity: 99.999 vol.%). Subsequently, half of the
specimens were recrystallized in a muffle furnace at 1073 K (800 °C) for 90 min.
3.2.2 Nitriding
Before nitriding, the specimen surfaces were polished mechanically (final step: 1 µm
diamond suspension), cleaned with ethanol in an ultrasonic bath and dried in a nitrogen
gas flow. The nitriding experiments were performed at three different temperatures
(753 K (480 °C), 793 K (520 °C) and 823 K (550 °C) ± 1 K) in a vertical, multizone quartz-
tube furnace (Ø: 28 mm) with a NH3/H2 gas mixture using a flux of 500 ml/min (purity
NH3: > 99.998 vol.%, purity H2: 99.999 vol.%). The gas fluxes were adjusted by mass flow
controllers and corresponded to a nitriding potential of rN = 0.7 atm-1/2 allowing
development of γ’-iron nitride at the surface [9]. The nitriding process was terminated
by breaking mechanically the quartz fibre at which the specimen was suspended in the
furnace so that the specimen fell through an opened valve into a flask filled with water,
flushed with N2, where the specimen was quenched to room temperature.
3.2.3 Specimen characterization
3.2.3.1 X-ray diffractometry
Phase analysis by means of X-ray diffraction was performed for the surfaces of all
specimens before and after nitriding by using a PANalytical X’Pert Multi-Purpose
Diffractometer (MPD) and Co-Kα radiation. This instrument uses Bragg-Brentano
geometry and is equipped with a graphite monochromator in the diffracted beam. The
diffraction-angle range (30° < 2θ < 120°) was scanned in steps of 0.06° 2θ with a
counting time of 320 s per step. For the identification of the phases, based on the
positions of the diffraction peaks, data of the ICDD database were used [51].
Glancing angle X-ray diffraction measurements (for enhanced surface sensitivity)
were performed by using a PANalytical X’Pert Materials Research Diffractometer (MRD),
equipped with an Eulerian cradle and a graphite monochromator in the diffracted beam,
Nitride surface-layer development upon nitriding of Fe-1 at.% Mo alloy
63
applying parallel beam geometry and Cu-Kα radiation. The diffraction-angle range
(30° < 2θ < 90°) was scanned in steps of 0.06° 2θ with a counting time of 30 s per step.
3.2.3.2 Electron probe microanalysis
For the determination of the nitrogen concentration-depth profiles electron probe
microanalysis (EPMA) was performed on polished cross sections of the specimens which
were embedded in Struers PolyFast (final polishing step 1 µm diamond suspension). For
these measurements, a Cameca SX100 microprobe (acceleration voltage Ua = 10 kV,
current I = 100 nA, spot size about 1 µm) equipped with five wavelength-dispersive
spectrometers was used. The line scans performed on the cross sections started at the
surface proceeding perpendicular to the surface towards the centre of the specimen. To
obtain the element contents at each measurement point, the intensities of the
characteristic X-ray emission peaks were measured and divided by the corresponding
intensities obtained from standard samples of pure Fe, Mo and γ’-Fe4N (for N-Kα).
Elemental concentrations were calculated from the intensity ratios applying the Ф(ρz)
approach according to Pouchou and Pichoir [50].
3.2.3.3 Auger electron spectroscopy
Auger electron spectroscopy (AES) line scans were performed on polished cross sections
(final polishing step 0.25 µm diamond suspension) to determine the element
concentrations across a sharp interface between the nitride surface layer and the
substrate. For this purpose, an Auger microscope (JEOL JAMP-7830F operating at 10 kV
and 15 nA to 70 nA) was used. AES analysis was carried out employing a focused
electron beam with a diameter of about 30 nm. The element concentrations were
measured after sputter cleaning of the cross-sectional surface using an Ar+ ion beam
(0.5 keV).
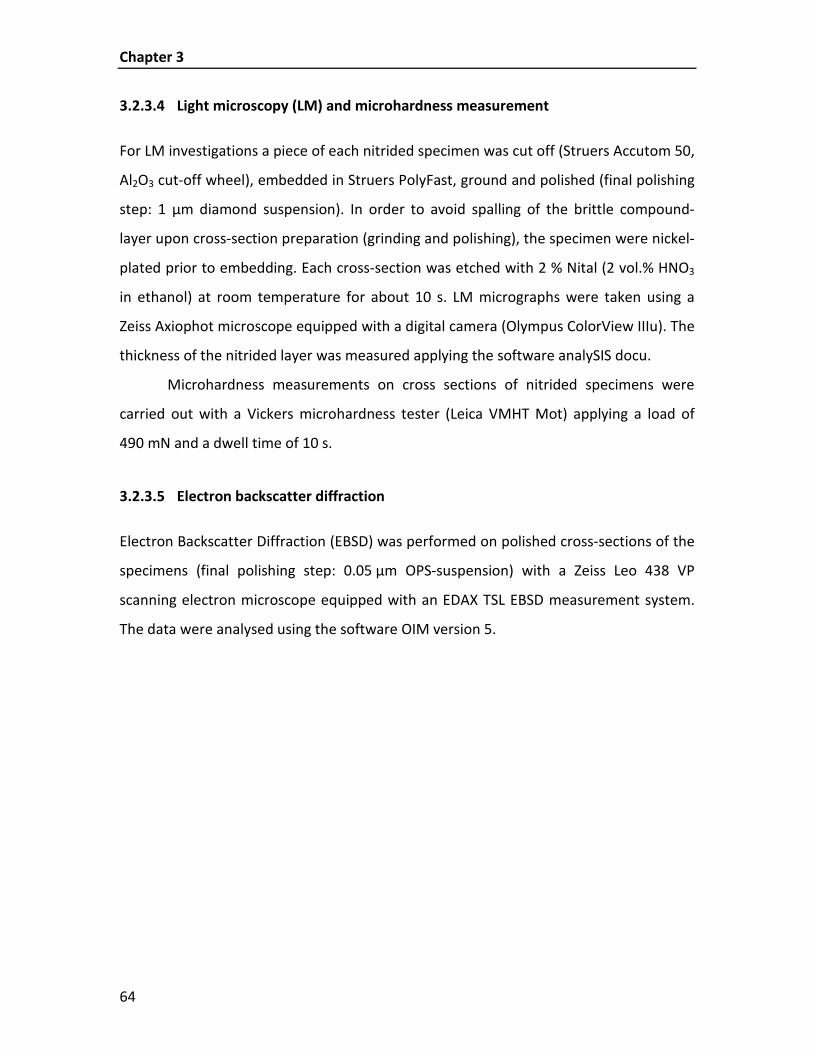
Chapter 3
64
3.2.3.4 Light microscopy (LM) and microhardness measurement
For LM investigations a piece of each nitrided specimen was cut off (Struers Accutom 50,
Al2O3 cut-off wheel), embedded in Struers PolyFast, ground and polished (final polishing
step: 1 µm diamond suspension). In order to avoid spalling of the brittle compound-
layer upon cross-section preparation (grinding and polishing), the specimen were nickel-
plated prior to embedding. Each cross-section was etched with 2 % Nital (2 vol.% HNO3
in ethanol) at room temperature for about 10 s. LM micrographs were taken using a
Zeiss Axiophot microscope equipped with a digital camera (Olympus ColorView IIIu). The
thickness of the nitrided layer was measured applying the software analySIS docu.
Microhardness measurements on cross sections of nitrided specimens were
carried out with a Vickers microhardness tester (Leica VMHT Mot) applying a load of
490 mN and a dwell time of 10 s.
3.2.3.5 Electron backscatter diffraction
Electron Backscatter Diffraction (EBSD) was performed on polished cross-sections of the
specimens (final polishing step: 0.05 µm OPS-suspension) with a Zeiss Leo 438 VP
scanning electron microscope equipped with an EDAX TSL EBSD measurement system.
The data were analysed using the software OIM version 5.

Nitride surface-layer development upon nitriding of Fe-1 at.% Mo alloy
65
3.3 Cold rolled specimens; results and discussion
3.3.1 X-ray diffraction; phase analysis
Diffractograms recorded from specimens nitrided at 753 K (480 °C) for different times
are shown in Fig. 3.1. A distinct, typical 100 rolling-texture is revealed as indicated by
the intensity-dominance of the 200 reflection (Fig. 3.1). Evidently, nitriding of cold rolled
Fe-1at.% Mo alloys at the temperature of 753 K (480 °C), using a nitriding potential of
0.7 atm-1/2, leads to the formation of γ’-Fe4N1-x (primitive cubic; fcc Fe-sublattice).
The development of molybdenum nitrides in the ferrite matrix is revealed by the
asymmetry of especially the α-Fe (ferrite) 200 reflection, as compared to the more
symmetrical α-Fe 110 and 211 reflections: the occurrence of coherent Mo-nitride
precipitates leads to an anisotropically, tetragonally distorted ferrite matrix due to the
mismatch between ferrite matrix and nitride platelets. This results in the appearance of
strongly broadened tetragonal (200/002) doublets in the diffractograms due to coherent
diffraction from the platelets with the surrounding matrix [16, 45]). This asymmetric
broadening decreases with increasing nitriding time as the nitrides become more and
more semi- (or even in-) coherent and therefore inducing less tetragonal distortion.
Eventually, the molybdenum nitrides diffract separately (i.e. incoherently with the
matrix). Indeed, after the longest nitriding time of 64 h, the presence of Mo2N is
indicated by a small reflection at a diffraction angle of 2θ = 50.9°.
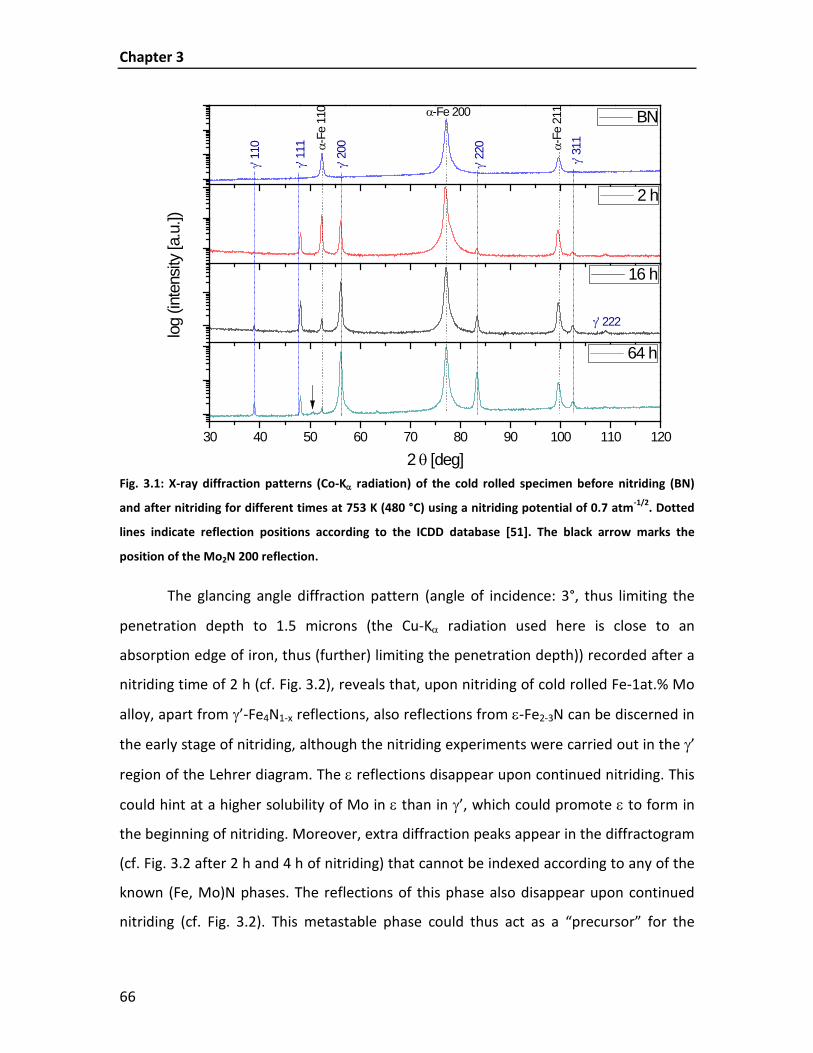
Chapter 3
66
30 40 50 60 70 80 90 100 110 120
2 θ [deg]
64 h
γ' 222
log
(inte
nsity
[a.u
.])
16 h
2 h
γ' 11
1
γ' 22
0
γ' 31
1
γ' 11
0
BN
α-Fe
110 α-Fe 200
α-Fe
211
γ' 20
0
Fig. 3.1: X-ray diffraction patterns (Co-Kα radiation) of the cold rolled specimen before nitriding (BN)
and after nitriding for different times at 753 K (480 °C) using a nitriding potential of 0.7 atm-1/2. Dotted
lines indicate reflection positions according to the ICDD database [51]. The black arrow marks the
position of the Mo2N 200 reflection.
The glancing angle diffraction pattern (angle of incidence: 3°, thus limiting the
penetration depth to 1.5 microns (the Cu-Kα radiation used here is close to an
absorption edge of iron, thus (further) limiting the penetration depth)) recorded after a
nitriding time of 2 h (cf. Fig. 3.2), reveals that, upon nitriding of cold rolled Fe-1at.% Mo
alloy, apart from γ’-Fe4N1-x reflections, also reflections from ε-Fe2-3N can be discerned in
the early stage of nitriding, although the nitriding experiments were carried out in the γ’
region of the Lehrer diagram. The ε reflections disappear upon continued nitriding. This
could hint at a higher solubility of Mo in ε than in γ’, which could promote ε to form in
the beginning of nitriding. Moreover, extra diffraction peaks appear in the diffractogram
(cf. Fig. 3.2 after 2 h and 4 h of nitriding) that cannot be indexed according to any of the
known (Fe, Mo)N phases. The reflections of this phase also disappear upon continued
nitriding (cf. Fig. 3.2). This metastable phase could thus act as a “precursor” for the
Nitride surface-layer development upon nitriding of Fe-1 at.% Mo alloy
67
formation of the later emerging binary Mo-nitrides (see Fig. 3.2 after 4 h and 16 h).
Hence, the nucleation process of the compound layer may be described as follows: at
the beginning of nitriding of cold rolled Fe-1at% Mo alloy, next to γ’ ε and an unknown
precursor phase are formed to incorporate the Mo that cannot dissolve in γ’. In the later
stage of nitriding, Mo-nitride (Mo2N) is formed, upon dissolution of the ε phase and the
precursor phase which are thermodynamically unstable under the chosen nitriding
conditions. For the later stage of growth of the γ’ layer into the substrate, the Mo,
originally dissolved in the ferrite matrix, has precipitated as Mo nitride already and
these Mo nitride particles are then encompassed by the growing γ’ layer (as shown in
the next section 3.3.2).
30 40 50 60 70 80 90
2 θ [deg.]
16h
γ' 11
0
γ' 111γ' 200
γ' 210
γ' 21
1
γ' 220
γ ' 31
0 α 21
1γ' 311γ' 222
*
ε -1-
11
ε -1-
12
ε -2-
11
ε -1-
13*
*
log
(inte
nsity
[a.u
.])
4h*
2h
Fig. 3.2: Glancing angle X-ray diffraction patterns (Cu-Kα radiation) recorded from the surface of cold
rolled specimens nitrided at 793 K (520 °C) for 2 h, 4 h and 16 h. Reflections arising from γ’-Fe4N1-x,
ε-Fe2-3N, Mo2N (reflection positions indicated by a black arrow) and an unknown phase (reflection
positions indicated by a star) can be discerned.
Chapter 3
68
3.3.2 Microstructure; growth of the γ’-Fe4N1-x layer
Nitriding of cold rolled Fe-1at.% Mo alloy specimen using a nitriding potential of
0.7 atm-1/2 leads to the formation of a closed compound layer, similar to that observed
in the case of nitriding pure iron [63]. The thickness of the compound layer increases
with increasing nitriding time and temperature (Figs. 3.3a-f). Some variation in the layer
thickness could be due to the intrinsic inhomogeneity of the deformation by cold rolling
(cf. section 3.2.1): locally enhanced dislocation density can be associated with enhanced
nitride nucleation [64].
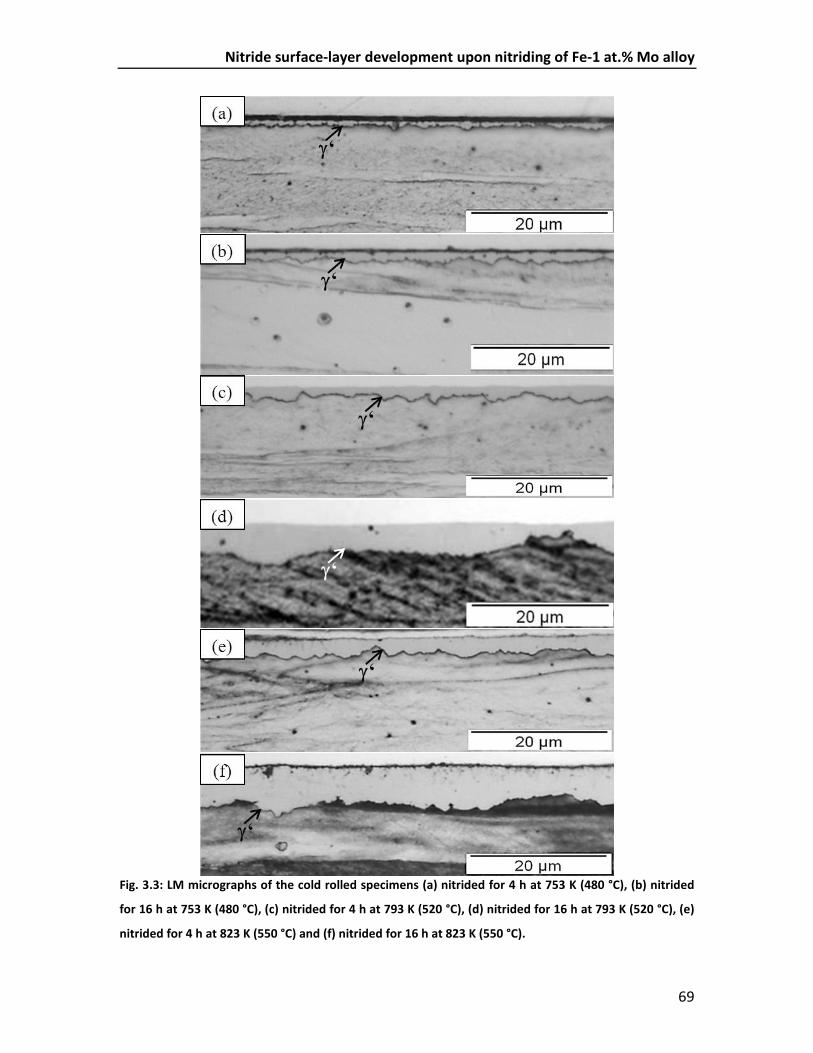
Nitride surface-layer development upon nitriding of Fe-1 at.% Mo alloy
69
Fig. 3.3: LM micrographs of the cold rolled specimens (a) nitrided for 4 h at 753 K (480 °C), (b) nitrided
for 16 h at 753 K (480 °C), (c) nitrided for 4 h at 793 K (520 °C), (d) nitrided for 16 h at 793 K (520 °C), (e)
nitrided for 4 h at 823 K (550 °C) and (f) nitrided for 16 h at 823 K (550 °C).
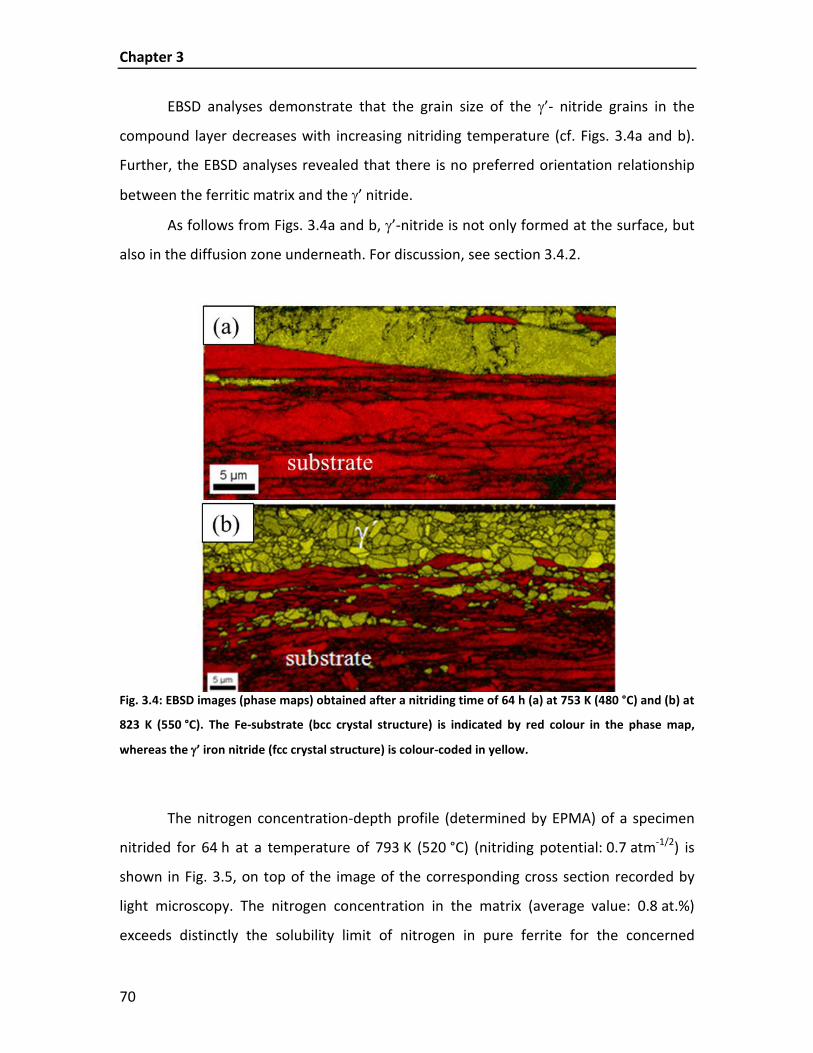
Chapter 3
70
EBSD analyses demonstrate that the grain size of the γ’- nitride grains in the
compound layer decreases with increasing nitriding temperature (cf. Figs. 3.4a and b).
Further, the EBSD analyses revealed that there is no preferred orientation relationship
between the ferritic matrix and the γ’ nitride.
As follows from Figs. 3.4a and b, γ’-nitride is not only formed at the surface, but
also in the diffusion zone underneath. For discussion, see section 3.4.2.
Fig. 3.4: EBSD images (phase maps) obtained after a nitriding time of 64 h (a) at 753 K (480 °C) and (b) at
823 K (550 °C). The Fe-substrate (bcc crystal structure) is indicated by red colour in the phase map,
whereas the γ’ iron nitride (fcc crystal structure) is colour-coded in yellow.
The nitrogen concentration-depth profile (determined by EPMA) of a specimen
nitrided for 64 h at a temperature of 793 K (520 °C) (nitriding potential: 0.7 atm-1/2) is
shown in Fig. 3.5, on top of the image of the corresponding cross section recorded by
light microscopy. The nitrogen concentration in the matrix (average value: 0.8 at.%)
exceeds distinctly the solubility limit of nitrogen in pure ferrite for the concerned
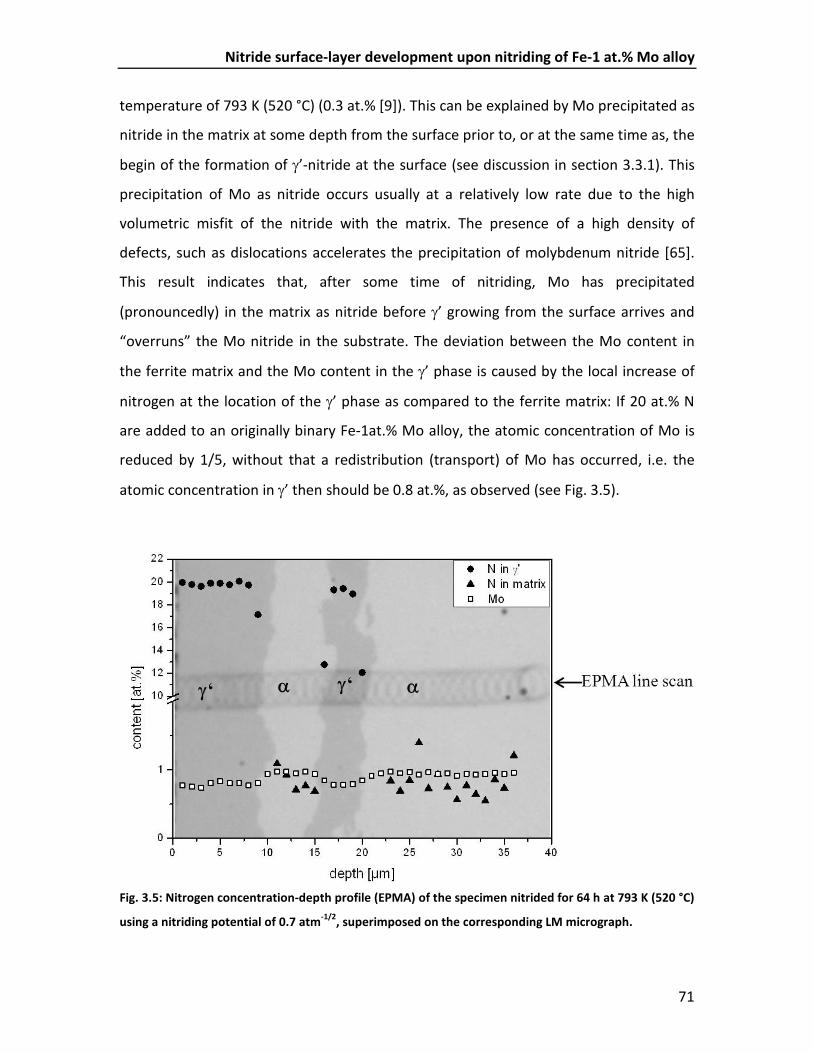
Nitride surface-layer development upon nitriding of Fe-1 at.% Mo alloy
71
temperature of 793 K (520 °C) (0.3 at.% [9]). This can be explained by Mo precipitated as
nitride in the matrix at some depth from the surface prior to, or at the same time as, the
begin of the formation of γ’-nitride at the surface (see discussion in section 3.3.1). This
precipitation of Mo as nitride occurs usually at a relatively low rate due to the high
volumetric misfit of the nitride with the matrix. The presence of a high density of
defects, such as dislocations accelerates the precipitation of molybdenum nitride [65].
This result indicates that, after some time of nitriding, Mo has precipitated
(pronouncedly) in the matrix as nitride before γ’ growing from the surface arrives and
“overruns” the Mo nitride in the substrate. The deviation between the Mo content in
the ferrite matrix and the Mo content in the γ’ phase is caused by the local increase of
nitrogen at the location of the γ’ phase as compared to the ferrite matrix: If 20 at.% N
are added to an originally binary Fe-1at.% Mo alloy, the atomic concentration of Mo is
reduced by 1/5, without that a redistribution (transport) of Mo has occurred, i.e. the
atomic concentration in γ’ then should be 0.8 at.%, as observed (see Fig. 3.5).
Fig. 3.5: Nitrogen concentration-depth profile (EPMA) of the specimen nitrided for 64 h at 793 K (520 °C)
using a nitriding potential of 0.7 atm-1/2, superimposed on the corresponding LM micrograph.

Chapter 3
72
3.3.3 γ’-nitride layer-growth kinetics
On three micrographs of each cold rolled specimen nitrided at different temperatures,
the thickness of the grown γ´-layer was measured using the software analySIS docu.
From each micrograph 200 values for the thickness were obtained and the squared
arithmetically averaged thickness was plotted vs. the treatment time for all
temperatures. A parabolic relationship between layer thickness and treatment time is
expected as the growth of the γ’-nitride layer is likely controlled by the inward diffusion
of nitrogen [63]. Thus, a plot of the squared layer thickness versus the treatment time
should result in a straight line. Such a relationship is indeed observed for treatment
times larger than 2 h (see Fig. 3.6). At the beginning of the nitriding process (t < 2 h) the
γ’-layer grows slower than indicated by the parabolic relation observed for longer times
and indicated with the straight line passing through the origin of the plot1. This can be
discussed as follows: At the beginning of nitriding (a large part of) the inwardly diffusing
nitrogen is consumed by Mo in the surface adjacent region to precipitate as
molybdenum nitride thereby delaying the development of γ’ at the surface. To account
for this initial delay in the development of γ’ a modified parabolic layer growth law is
fitted to the experimental data: 2 2
0( )S t kt S= + (for 2t ≥ h), (3.1)
where S denotes the γ’-layer thickness at time t, k is the growth constant, t is the
treatment time and S0 represents the virtual layer thickness at t=0.
1 This contrasts with what is observed for γ’-layer growth on pure iron, where growth of γ’ in the first stage of nitriding, where no closed layer of γ’ nitride occurs at the surface, is relatively fast, as the nitrogen follows a short-circuit path through the ferrite matrix, by-passing diffusion through the already formed γ’ nuclei (diffusion of N through ferrite is much faster than through γ’ nitride) [63].
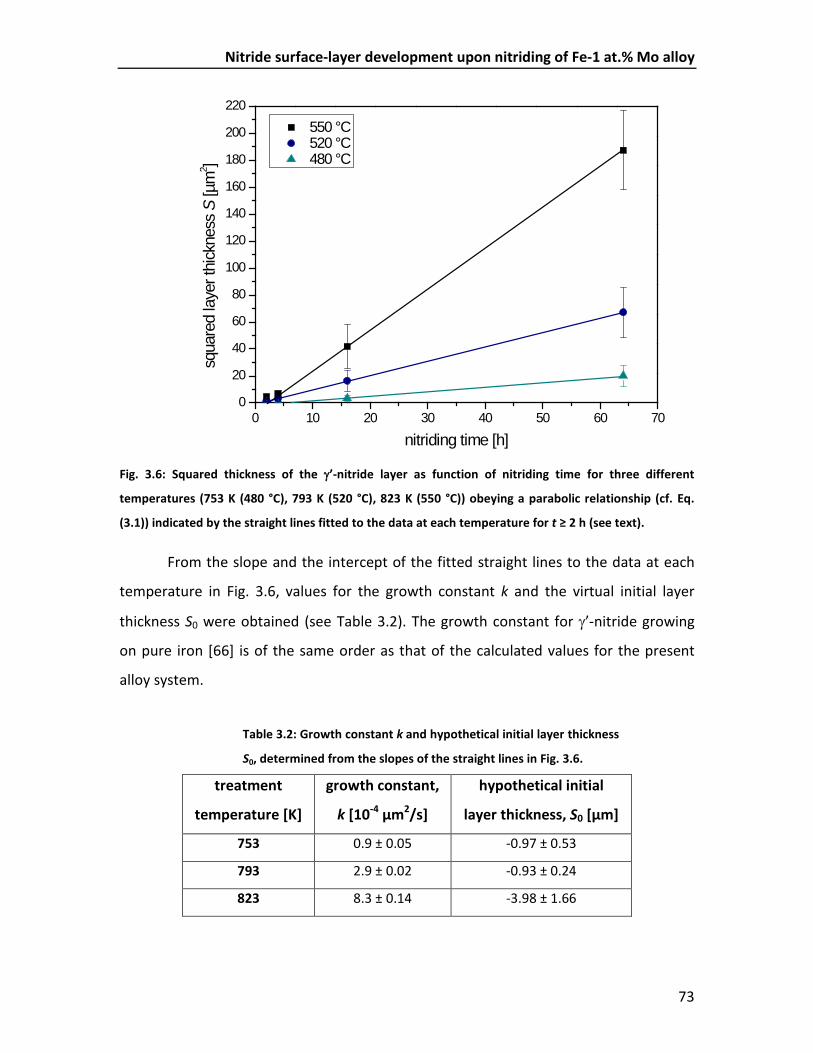
Nitride surface-layer development upon nitriding of Fe-1 at.% Mo alloy
73
0 10 20 30 40 50 60 700
20
40
60
80
100
120
140
160
180
200
220 550 °C 520 °C 480 °C
squa
red
laye
r thi
ckne
ss S
[µm
2 ]
nitriding time [h]
Fig. 3.6: Squared thickness of the γ’-nitride layer as function of nitriding time for three different
temperatures (753 K (480 °C), 793 K (520 °C), 823 K (550 °C)) obeying a parabolic relationship (cf. Eq.
(3.1)) indicated by the straight lines fitted to the data at each temperature for t ≥ 2 h (see text).
From the slope and the intercept of the fitted straight lines to the data at each
temperature in Fig. 3.6, values for the growth constant k and the virtual initial layer
thickness S0 were obtained (see Table 3.2). The growth constant for γ’-nitride growing
on pure iron [66] is of the same order as that of the calculated values for the present
alloy system.
Table 3.2: Growth constant k and hypothetical initial layer thickness
S0, determined from the slopes of the straight lines in Fig. 3.6.
treatment
temperature [K]
growth constant,
k [10-4 µm2/s]
hypothetical initial
layer thickness, S0 [µm]
753 0.9 ± 0.05 -0.97 ± 0.53
793 2.9 ± 0.02 -0.93 ± 0.24
823 8.3 ± 0.14 -3.98 ± 1.66

Chapter 3
74
The growth constant k in the parabolic growth law can be interpreted using a growth
model [63] subject to the following assumptions:
i) the surface of the compound layer and the interface between compound
layer and ferritic matrix are planar and parallel;
ii) the nitrogen concentrations in γ’ at the γ’/gas interface and at the γ’/α
interface are constant and correspond with local thermodynamic
equilibrium.
The flux of nitrogen, ( ')NJ γ , in γ’ (for one-dimensional diffusion) complies with Fick’s first
law [67] according to
( ) ( ) ( )( )
( ) ( )( )
( ) ( )( )' ' '
' ' ' ' ' ' ' *N N NN N N N
ln lnM MN N Nd d a d aJ c c RT c D
dx dx dx
γ γ γγ γ γ γ γ γ γµ
= − = − = − (3.2)
where ( ')NM γ is the mobility of nitrogen in γ’, ( ')
Nγµ is the chemical potential of nitrogen in
γ’, x the depth coordinate, R the gas constant, T the treatment temperature, ( ')Na γ the
activity and ( )'Nc γ the concentration of nitrogen in γ’ and ( ')*
ND γ denotes the self-diffusion
coefficient of N in γ’. Note that the diffusion of iron atoms can be neglected at the
nitriding temperature, i.e. ( ') 0FeD γ ≈ .
Under the assumption of quasi-steady state diffusion of nitrogen in γ’2, equation (3.2)
can be written as [68]
( ) ( )( )'( ')
' ' * N NN N
lnc aJ DS
γγγ γ= −
(3.3)
where ( ')*ND γ and ( )'
Nc γ must be interpreted as effective values (constants over the layer
thickness S). ( )'Nln a γ
denotes the change in nitrogen activity across the γ’ layer, i.e. from
the gas phase/γ’ surface to the γ’/α interface.
2 In quasi-steady-state diffusion, at a given time the diffusive flux through the growing γ’ layer, ( ')
NJ γ , is
constant throughout the γ’ layer and its instantaneous value depends only on the actual layer thickness. This approximation is valid because of the very small composition range of γ’ iron nitride and the large concentration difference between the γ’ layer and the α-iron substrate, as confirmed by numerical calculations [68].
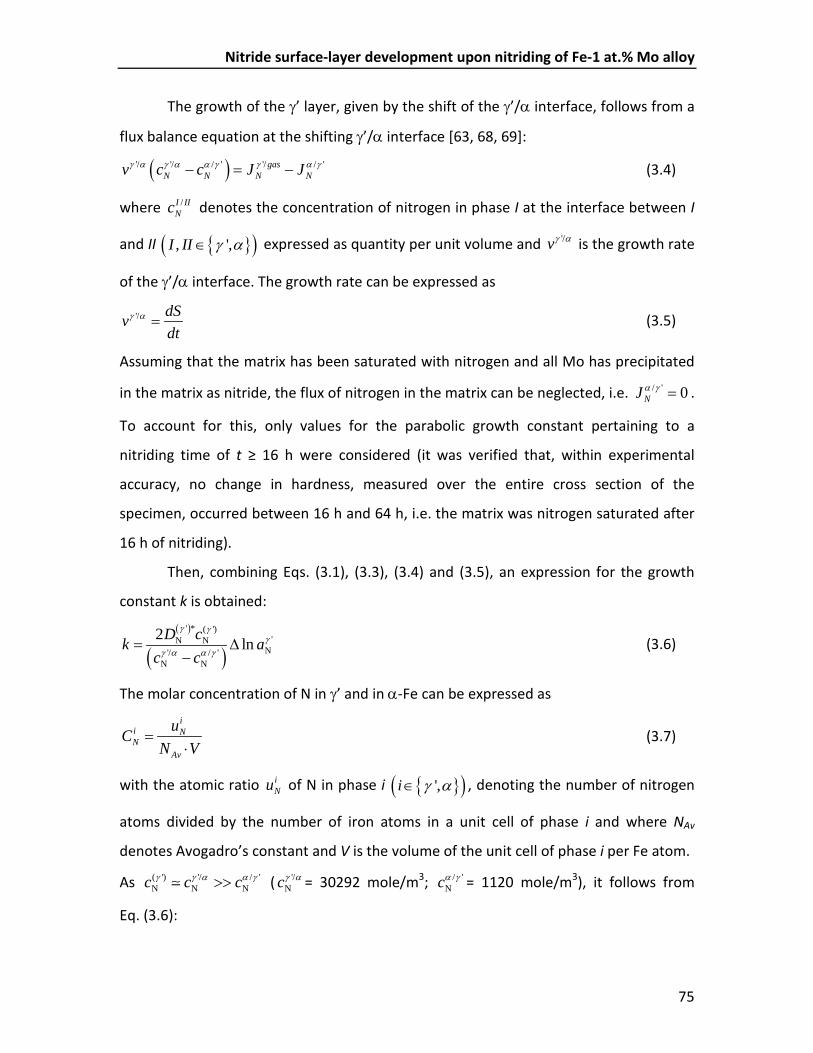
Nitride surface-layer development upon nitriding of Fe-1 at.% Mo alloy
75
The growth of the γ’ layer, given by the shift of the γ’/α interface, follows from a
flux balance equation at the shifting γ’/α interface [63, 68, 69]:
( )'/ '/ / ' '/ / 'gasN N N Nv c c J Jγ α γ α α γ γ α γ− = − (3.4)
where /I IINc denotes the concentration of nitrogen in phase I at the interface between I
and II }{( ), ',I II γ α∈ expressed as quantity per unit volume and '/vγ α is the growth rate
of the γ’/α interface. The growth rate can be expressed as
'/ dSvdt
γ α = (3.5)
Assuming that the matrix has been saturated with nitrogen and all Mo has precipitated
in the matrix as nitride, the flux of nitrogen in the matrix can be neglected, i.e. / ' 0NJ α γ = .
To account for this, only values for the parabolic growth constant pertaining to a
nitriding time of t ≥ 16 h were considered (it was verified that, within experimental
accuracy, no change in hardness, measured over the entire cross section of the
specimen, occurred between 16 h and 64 h, i.e. the matrix was nitrogen saturated after
16 h of nitriding).
Then, combining Eqs. (3.1), (3.3), (3.4) and (3.5), an expression for the growth
constant k is obtained:
( )
( )' * ( ')
'N NN'/ / '
N N
2 lnD ck ac c
γ γγ
γ α α γ= ∆
− (3.6)
The molar concentration of N in γ’ and in α-Fe can be expressed as i
i NN
Av
uCN V
=⋅
(3.7)
with the atomic ratio iNu of N in phase i }{( )',i γ α∈ , denoting the number of nitrogen
atoms divided by the number of iron atoms in a unit cell of phase i and where NAv
denotes Avogadro’s constant and V is the volume of the unit cell of phase i per Fe atom.
As ( ') '/ / 'N N Nc c cγ γ α α γ>> ( '/
Ncγ α = 30292 mole/m3; / 'Ncα γ = 1120 mole/m3), it follows from
Eq. (3.6):

Chapter 3
76
( ) ( )' *'N N2 lnk a D γγ∆ (3.8).
The activity 'Naγ of nitrogen in a γ’ phase, in equilibrium with a nitriding (NH3/H2)
atmosphere of nitriding potential rN, is given by [9]
( )2
1/2( ') 0N N Na p K rγ −
= ⋅ (3.9)
with 2
0Np denoting nitrogen gas at atmospheric pressure and at the temperature
concerned as the reference state, K as the equilibrium constant for the (thermal)
decomposition of ammonia, and thus
( ) ( )' *N N2 lnk r D γ∆ (3.10)
where Nln r∆ denotes the difference in nitriding potential (activity; cf. Eq. (3.8)) of
nitrogen in the γ’ layer at the (gas phase/γ’) surface and of nitrogen at the γ’/α interface.
Hence, the (effective; see above) self-diffusion coefficient of nitrogen in γ’, ( ')*ND γ
, can be calculated from the experimentally determined layer-growth constant, k, the
nitriding potential of the applied gas atmosphere, / 'gasNr
γ , and the nitriding potential at
the interface between γ’ and α (temperature dependent), '/Nrγ α , calculated using
literature data [70]. Adopting an Arrhenius-type temperature dependency for the self-
diffusion coefficient, it holds
( ')*0 exp D
NQD DRT
γ = −
(3.11)
with QD as the activation energy for the (tracer) diffusion of nitrogen in γ’, D0 as a pre-
exponential factor, R as the gas constant and T as the treatment temperature.
Therefore, a plot of the logarithm of the growth constant k divided by ( )N2 ln r∆
versus the reciprocal of the treatment temperature should result in a straight line. This
is observed indeed (see Fig. 3.7). The value obtained from the slope of this straight line
for the activation energy of ( ')*ND γ is 117 kJ/mol. This value for DQ is in the upper part of
the range of values for DQ found in the literature, ranging from 88 kJ/mol [71],
91 kJ/mol [63], (116 ± 30) kJ/mol [72] to 127 kJ/mol [66], as derived from the observed
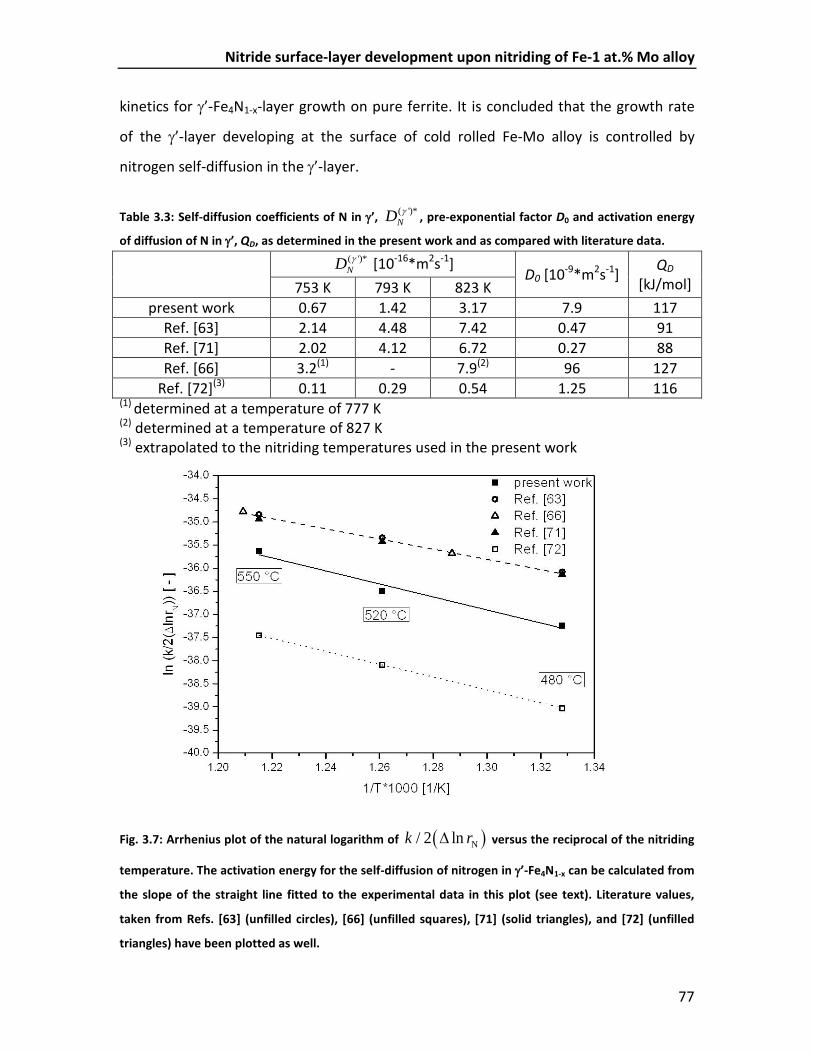
Nitride surface-layer development upon nitriding of Fe-1 at.% Mo alloy
77
kinetics for γ’-Fe4N1-x-layer growth on pure ferrite. It is concluded that the growth rate
of the γ’-layer developing at the surface of cold rolled Fe-Mo alloy is controlled by
nitrogen self-diffusion in the γ’-layer.
Table 3.3: Self-diffusion coefficients of N in γ’, ( ')*
ND γ , pre-exponential factor D0 and activation energy
of diffusion of N in γ’, QD, as determined in the present work and as compared with literature data.
( ')*ND γ [10-16*m2s-1]
D0 [10-9*m2s-1] QD [kJ/mol] 753 K 793 K 823 K
present work 0.67 1.42 3.17 7.9 117 Ref. [63] 2.14 4.48 7.42 0.47 91 Ref. [71] 2.02 4.12 6.72 0.27 88 Ref. [66] 3.2(1) - 7.9(2) 96 127
Ref. [72](3) 0.11 0.29 0.54 1.25 116 (1) determined at a temperature of 777 K (2) determined at a temperature of 827 K (3) extrapolated to the nitriding temperatures used in the present work
Fig. 3.7: Arrhenius plot of the natural logarithm of ( )N/ 2 lnk r∆ versus the reciprocal of the nitriding
temperature. The activation energy for the self-diffusion of nitrogen in γ’-Fe4N1-x can be calculated from
the slope of the straight line fitted to the experimental data in this plot (see text). Literature values,
taken from Refs. [63] (unfilled circles), [66] (unfilled squares), [71] (solid triangles), and [72] (unfilled
triangles) have been plotted as well.

Chapter 3
78
3.4 Recrystallized specimens; results and discussion
3.4.1 X-ray diffraction – phase analysis
Diffractograms recorded from specimens nitrided at 753 K (480 °C) for different times
are shown in Fig. 3.8.
30 40 50 60 70 80 90 100 110 120
2 θ [deg]
64 h
γ' 11
0
γ' 11
1 α-Fe
110
γ' 20
0
γ' 21
0 α-Fe 200
γ' 22
0
α-Fe 211
γ' 31
1
γ' 22
2
log
(inte
nsity
[a.u
.])
16 h
2 h
BN
Fig. 3.8: X-ray diffraction patterns (Co-Kα radiation) of the recrystallized specimen before nitriding (BN)
and after nitriding for different times at 753 K (480 °C) using a nitriding potential of 0.7 atm-1/2. Dotted
lines indicate reflection positions according to the ICDD database [51].
Even for the longest nitriding time investigated (64 h) at 753 K (480 °C), and
apart of reflections of the ferrite substrate, only reflections from γ’ nitride are detected.
Thus, in contrast with the deformed specimens nitrided under similar conditions (cf.
Figs. 3.1, 3.2 and their discussion), no substantial precipitation of Mo as nitride has
occurred in the ferritic matrix of the recrystallized specimens at this stage of nitriding.
Indeed, in contrast with what is observed for the deformed specimens, no asymmetric

Nitride surface-layer development upon nitriding of Fe-1 at.% Mo alloy
79
broadening of the 200 ferrite reflection due to a possible precipitation of coherent
molybdenum nitride (cf. discussion in section 3.3.1) occurs for the recrystallized
specimens (compare Figs. 3.1 and 3.8).
At the elevated nitriding temperature of 793 K (520 °C), an additional reflection
is observed that may be ascribed to cubic Mo2N (see Figs. 3.9a and b after a nitriding
time of 64 h) and upon prolonged nitriding a reflection arises that can be ascribed to
hexagonal MoN (see Figs. 3.9a and b after a nitriding time of 64 h). At the still higher
nitriding temperature of 823 K (550 °C), and also only after prolonged nitriding, an
additional reflection is observed that can be ascribed to hexagonal MoN (see Fig. 3.10).
Previous investigations [65] on bright nitriding (i.e. under conditions such that no iron
nitrides can be formed at the surface) of Fe-1at.% Mo alloy showed that, upon nitriding
such specimens at a temperature of 853 K (580 °C) for longer nitriding times, the nitride
precipitation starts with the formation of submicroscopical Mo2N-type precipitates
followed by a discontinuous precipitation of the type [57, 58]:
α′+γ → α+δ
where α' denotes the supersaturated ferrite matrix, γ represents the submicroscopical,
likely largely coherent cubic Mo2N-type precipitates and α and δ represent the ferrite
and hexagonal MoN-type lamellae in the colonies produced by the discontinuous
transformation starting from (mobile) grain boundaries in the ferrite matrix.
Chapter 3
80
30 40 50 60 70 80 90 100 110 120
64 h
2 θ [deg]
log
(inte
nsity
[a.u
.])
γ' 11
0
γ' 11
1M
o 2N 2
00α-
Fe 1
10γ'
200
γ' 21
0 α-Fe 200
γ' 22
0
α-Fe 211
γ' 31
1
γ' 222MoN
200
16 h
2 h
BN
40 50 60
2 θ [deg.]
64 hlog
(inte
nsity
[a.u
.]) 16 h
MoN
200
α-Fe
110
2 h
γ' 111
Mo 2N
200
γ' 200
Fig. 3.9: X-ray diffraction patterns (Co-Kα radiation) of the recrystallized specimens (a) before nitriding
(BN) and after nitriding for different times at 793 K (520 °C) using a nitriding potential of 0.7 atm-1/2.
Dotted lines indicate reflection positions according to the ICDD database [51]. The 2θ range
40 2 60θ° ≤ ≤ ° is shown magnified in (b) for 2 h, 16 h and 64 h of nitriding.
(a)
(b)
Nitride surface-layer development upon nitriding of Fe-1 at.% Mo alloy
81
30 40 50 60 70 80 90 100 110 120
MoN
200
2 θ [deg]
64 h
log
(inte
nsity
[a.u
.])
16 h
2 h
Mo 2N
200 BN
γ' 11
0
γ' 11
1 α-Fe
110
γ' 20
0
γ' 21
0 α-Fe 200
γ' 22
0
α-Fe 211
γ' 31
1
γ' 222
Fig. 3.10: X-ray diffraction patterns (Co-Kα radiation) of the recrystallized specimen before nitriding (BN)
and after nitriding for different times at 823 K (550 °C) using a nitriding potential of 0.7 atm-1/2. Dotted
lines indicate reflection positions according to the ICDD database [51].
The glancing angle X-ray diffraction patterns of the recrystallized specimens
nitrided at 793 K (520 °C) for 4 h and 6 h are shown in Fig. 3.11. Apart from reflections of
γ’-Fe4N1-x, reflections indicating the presence of ε-Fe2-3N and of the same unknown
(precursor) nitride phase as observed for the cold rolled specimens (cf. Fig. 3.2) can be
detected. The occurrence of these phases in the compound layer is explained in the
same way as for the cold rolled specimens (cf. section 3.3.1): Mo cannot dissolve in the
developing γ’ and, as an intermediate stage, next to γ’ ε and the precursory nitride
develop, which incorporate the Mo originally dissolved in the ferrite matrix. For more
pronounced stages of nitriding (see the glancing angle X-ray diffraction patterns shown
in Fig. 3.12 pertaining to 4 h and 16 h of nitriding at the elevated temperature of 823 K
(550 °C)), precipitation of Mo as an equilibrium, hexagonal MoN phase takes place and
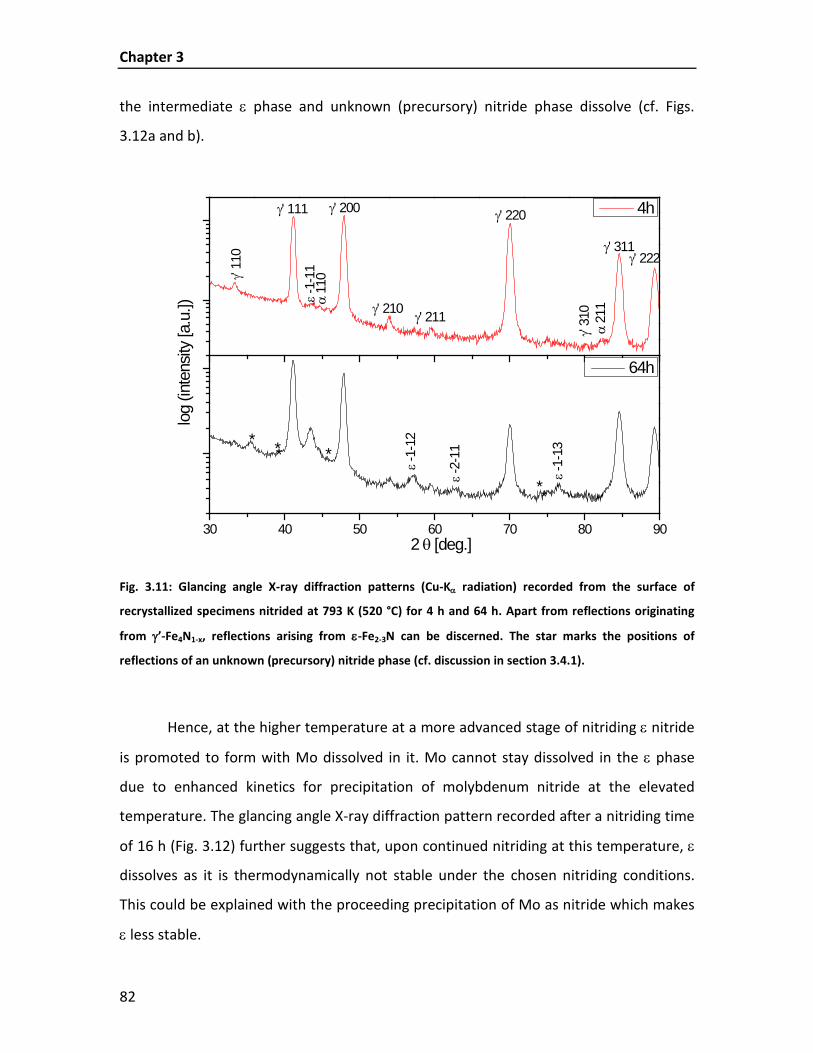
Chapter 3
82
the intermediate ε phase and unknown (precursory) nitride phase dissolve (cf. Figs.
3.12a and b).
30 40 50 60 70 80 90
**
**
ε -1-
11
2 θ [deg.]
64h
ε -1-
13
**
log
(inte
nsity
[a.u
.]) 4h
γ' 11
0
γ' 111
α 11
0
γ' 200
γ' 210γ' 211
γ' 220
γ' 31
0α
211
γ' 311γ' 222
ε -1-
12
ε -2-
11
Fig. 3.11: Glancing angle X-ray diffraction patterns (Cu-Kα radiation) recorded from the surface of
recrystallized specimens nitrided at 793 K (520 °C) for 4 h and 64 h. Apart from reflections originating
from γ’-Fe4N1-x, reflections arising from ε-Fe2-3N can be discerned. The star marks the positions of
reflections of an unknown (precursory) nitride phase (cf. discussion in section 3.4.1).
Hence, at the higher temperature at a more advanced stage of nitriding ε nitride
is promoted to form with Mo dissolved in it. Mo cannot stay dissolved in the ε phase
due to enhanced kinetics for precipitation of molybdenum nitride at the elevated
temperature. The glancing angle X-ray diffraction pattern recorded after a nitriding time
of 16 h (Fig. 3.12) further suggests that, upon continued nitriding at this temperature, ε
dissolves as it is thermodynamically not stable under the chosen nitriding conditions.
This could be explained with the proceeding precipitation of Mo as nitride which makes
ε less stable.
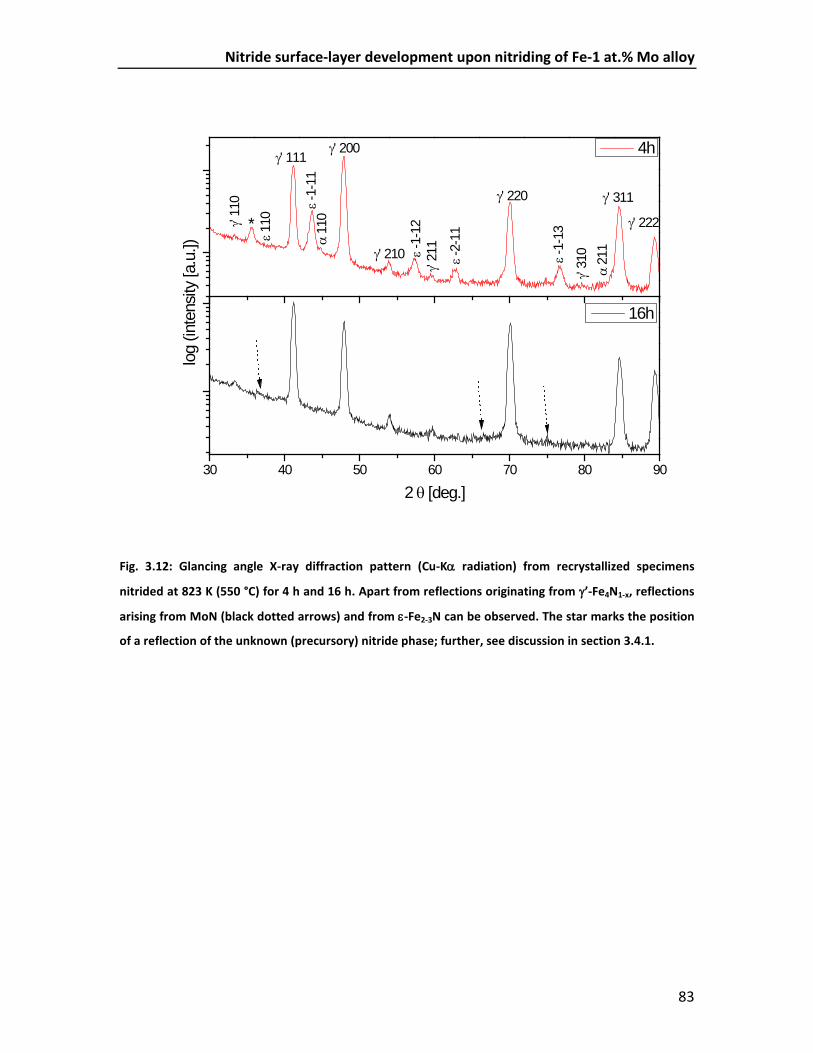
Nitride surface-layer development upon nitriding of Fe-1 at.% Mo alloy
83
30 40 50 60 70 80 90
ε 110
log
(inte
nsity
[a.u
.])
2 θ [deg.]
16h
*
4h
γ' 11
0
γ' 111
ε -1-
11
γ' 200
γ' 210 ε -1-
12γ'
211
ε -2-
11
γ' 220
ε -1-
13
γ' 31
0α
211
γ' 311
γ' 222
α 11
0
Fig. 3.12: Glancing angle X-ray diffraction pattern (Cu-Kα radiation) from recrystallized specimens
nitrided at 823 K (550 °C) for 4 h and 16 h. Apart from reflections originating from γ’-Fe4N1-x, reflections
arising from MoN (black dotted arrows) and from ε-Fe2-3N can be observed. The star marks the position
of a reflection of the unknown (precursory) nitride phase; further, see discussion in section 3.4.1.
Chapter 3
84
3.4.2 Occurrence of plate-like morphology of the γ’ phase; the role of dissolved Mo
The influence of molybdenum (initially) dissolved in the ferrite matrix on the
morphology of the γ’ nitride layer at the initial stage of nitriding of recrystallized
specimens is dramatic, as can be seen by comparing the microstructure adjacent to the
surface of similarly nitrided recrystallized Fe-1at.% Mo alloy (Fig. 3.13a) with pure,
recrystallized iron (Fig. 3.14; note the large difference in penetration by γ’ of the ferrite
matrix). In the case of nitriding of pure iron many nuclei of γ’ nitride have developed at
the surface, which, at the stage of nitriding considered, practically cover the whole
surface, whereas in the case of Fe-1at.% Mo alloy, only a few γ’ nuclei have formed,
which have deeply penetrated the substrate as “plates”.
Upon nitriding at 793 K (520 °C) the density of γ’ plates nucleated at the surface
of the specimen is larger than at 753 K (480 °C) (see Fig. 3.13b). At longer nitriding times,
a compact layer develops at the surface as a consequence of coalescence by lateral
extension of the γ’ plates at the surface, with γ’ plates emanating from the compact part
of the γ’ phase and penetrating deeply the substrate (Fig. 3.13c).
The X-ray diffraction results presented in section 3.4.1 and the morphological
observations reported above lead to the following interpretation. In case of nitriding
Fe-1at.% Mo specimen under conditions allowing the formation of γ’, a competition
between the (very slow [65]) formation of molybdenum nitride and of γ’ occurs: The
equilibrium solubility of Mo in γ’ is likely (very) low, recognizing that the atomic radius of
Mo is much larger than that of Fe [56]. Precipitation of γ’ thus requires either a Mo
partitioning in the ferrite matrix as by a preceding precipitation of Mo as molybdenum
nitride to make possible formation of Mo free γ’, or γ’ is forced to nucleate and grow
with Mo dissolved in it. The precipitation of Mo2N in the recrystallized, ferrite matrix is a
very slow process, due to the large misfit of Mo2N with the ferrite matrix [65]. These
obstacles for the precipitation of both, γ’ and Mo-nitride, lead to a large nitrogen
supersaturation of the ferrite matrix over an extended depth range in the specimen.
This nitrogen supersaturation can become that large that it eventually forces γ’ to

Nitride surface-layer development upon nitriding of Fe-1 at.% Mo alloy
85
nucleate and grow, with Mo dissolved in it, across the extended depth range of high
nitrogen supersaturation. This leads to the plate-like morphology of γ’ deeply
penetrating the substrate.
Fig. 3.13: LM-micrograph of the recrystallized Fe-1at.%Mo specimens nitrided for (a) 15 min at 753 K
(480 °C), (b) 2 h at 793 K (520 °C) and (c) 64 h at 793 K (520 °C).

Chapter 3
86
Fig. 3.14: LM-micrograph of a recrystallized pure Fe specimen nitrided for 15 min at 753 K (480 °C).
The delayed precipitation of Mo2N or even the inability for Mo to precipitate as
Mo2N and the uptake of Mo as dissolved element in the delayedly precipitating γ’ phase
(as plates penetrating the ferrite substrate) can be demonstrated by the following EPMA
and AES results.
The nitrogen concentration in γ’ plates and in the adjacent ferrite matrix was
determined by EPMA line scans for a specimen nitrided for 64 h at 753 K (480 °C) (see
Fig. 3.15). Evidently, in-between the γ’ plates the nitrogen concentration is below
0.3 at.% which corresponds with the solubility of nitrogen in pure ferrite at this
temperature [73]. Hence, Mo has not precipitated as nitride within the recrystallized
matrix in the nitrided zone (note the strikingly different result for the cold rolled
specimens, where the nitrogen content of the matrix adjacent to the γ’ phase is much
larger and indicative of the presence of Mo-nitride precipitates; see Fig. 3.5 and its
discussion in section 3.3.2).
The AES line scan crossing the γ’ plate/α-matrix interface for a specimen nitrided
at 753 K (480 °C) for 16 h demonstrates that the Mo/Fe atomic ratio is the same in the
matrix and γ’ plate. Also no separate molybdenum-nitride phase occurs in the γ’ phase
at the surface (as demonstrated by the glancing angle X-ray diffraction analysis; see
Fig. 3.11). Hence, it can be concluded that γ’-plate development occurs under
incorporation of Mo in the γ’ phase, in agreement with the glancing angle X-ray
diffractogram shown in Fig. 3.11 and the above discussion.

Nitride surface-layer development upon nitriding of Fe-1 at.% Mo alloy
87
Fig. 3.15: Nitrogen concentration-depth profile (EPMA line scan) of the specimen nitrided at 723 K
(480 °C) for 64 h superimposed on the corresponding light optical micrograph. The position of the line
scan is indicated by the contamination spots.

Chapter 3
88
Fig. 3.16: The Mo/Fe atomic ratio across a ferrite-matrix/γ’-plate interface as measured by an AES line
scan on a cross section of the specimen nitrided at 753 K (480 °C) for 16 h. The elemental atomic ratio is
plotted starting from the ferrite-matrix into the γ’ plate onto the corresponding secondary electron
image (light grey: ferritic matrix; dark grey: γ’). The atomic ratio of Mo/Fe is constant within
experimental accuracy.
In order to confirm the above described effect of dissolved molybdenum on the
morphology of the developing γ’ phase, a specimen of Fe-1at.% Mo alloy was first
nitrided at a nitriding potential and temperature such that no γ’ could form and all Mo
could precipitate as nitride (734 h at a temperature of 853 K (580 °C) using a nitriding
potential of 0.104 atm-1/2 [65]). Complete precipitation of MoN in this thin foil specimen
was proven experimentally by weight gain measurements (no further nitrogen uptake
could be observed). Next, this specimen was nitrided at 753 K (480 °C) for 72 h using a
nitriding potential of 0.7 atm-1/2, implying that γ’ phase can develop. The corresponding
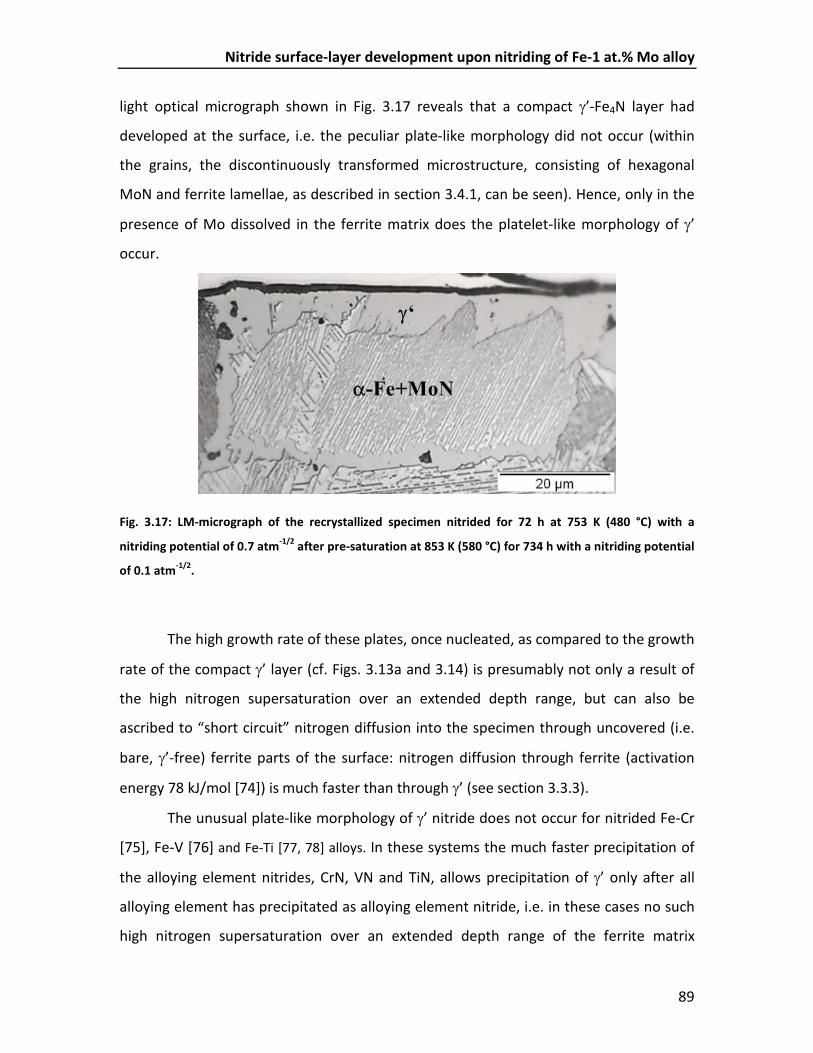
Nitride surface-layer development upon nitriding of Fe-1 at.% Mo alloy
89
light optical micrograph shown in Fig. 3.17 reveals that a compact γ’-Fe4N layer had
developed at the surface, i.e. the peculiar plate-like morphology did not occur (within
the grains, the discontinuously transformed microstructure, consisting of hexagonal
MoN and ferrite lamellae, as described in section 3.4.1, can be seen). Hence, only in the
presence of Mo dissolved in the ferrite matrix does the platelet-like morphology of γ’
occur.
Fig. 3.17: LM-micrograph of the recrystallized specimen nitrided for 72 h at 753 K (480 °C) with a
nitriding potential of 0.7 atm-1/2 after pre-saturation at 853 K (580 °C) for 734 h with a nitriding potential
of 0.1 atm-1/2.
The high growth rate of these plates, once nucleated, as compared to the growth
rate of the compact γ’ layer (cf. Figs. 3.13a and 3.14) is presumably not only a result of
the high nitrogen supersaturation over an extended depth range, but can also be
ascribed to “short circuit” nitrogen diffusion into the specimen through uncovered (i.e.
bare, γ’-free) ferrite parts of the surface: nitrogen diffusion through ferrite (activation
energy 78 kJ/mol [74]) is much faster than through γ’ (see section 3.3.3).
The unusual plate-like morphology of γ’ nitride does not occur for nitrided Fe-Cr
[75], Fe-V [76] and Fe-Ti [77, 78] alloys. In these systems the much faster precipitation of
the alloying element nitrides, CrN, VN and TiN, allows precipitation of γ’ only after all
alloying element has precipitated as alloying element nitride, i.e. in these cases no such
high nitrogen supersaturation over an extended depth range of the ferrite matrix
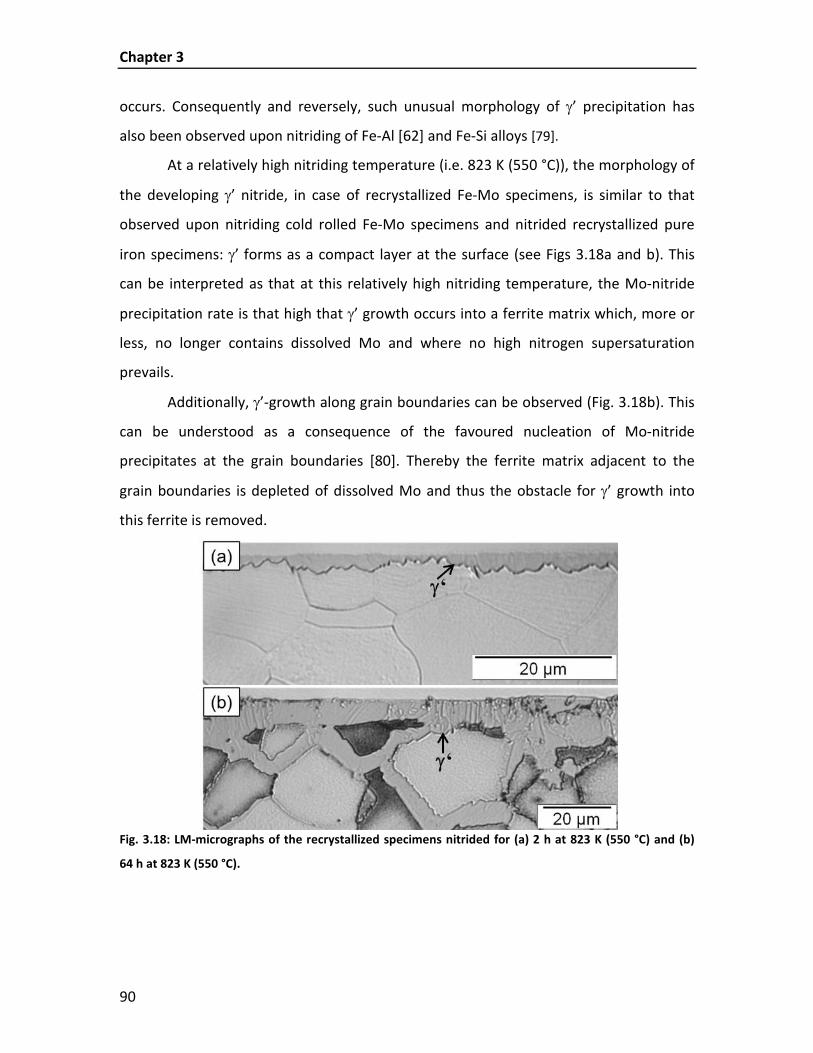
Chapter 3
90
occurs. Consequently and reversely, such unusual morphology of γ’ precipitation has
also been observed upon nitriding of Fe-Al [62] and Fe-Si alloys [79].
At a relatively high nitriding temperature (i.e. 823 K (550 °C)), the morphology of
the developing γ’ nitride, in case of recrystallized Fe-Mo specimens, is similar to that
observed upon nitriding cold rolled Fe-Mo specimens and nitrided recrystallized pure
iron specimens: γ’ forms as a compact layer at the surface (see Figs 3.18a and b). This
can be interpreted as that at this relatively high nitriding temperature, the Mo-nitride
precipitation rate is that high that γ’ growth occurs into a ferrite matrix which, more or
less, no longer contains dissolved Mo and where no high nitrogen supersaturation
prevails.
Additionally, γ’-growth along grain boundaries can be observed (Fig. 3.18b). This
can be understood as a consequence of the favoured nucleation of Mo-nitride
precipitates at the grain boundaries [80]. Thereby the ferrite matrix adjacent to the
grain boundaries is depleted of dissolved Mo and thus the obstacle for γ’ growth into
this ferrite is removed.
Fig. 3.18: LM-micrographs of the recrystallized specimens nitrided for (a) 2 h at 823 K (550 °C) and (b)
64 h at 823 K (550 °C).

Nitride surface-layer development upon nitriding of Fe-1 at.% Mo alloy
91
The microhardness-depth profiles in the nitrided zone of the ferrite matrix
indicate (also) that Mo-nitrides are virtually absent at a comparatively low nitriding
temperature such as 753 K (480 °C): for the extended time range investigated the
hardness increase remains on a level representative of dissolution (only) of nitrogen in
the ferritic matrix (see Fig. 3.19a) [81]. At a higher nitriding temperature such as 823 K
(550 °C) Mo nitride develops in the ferrite matrix leading to a distinct increase of
hardness (see Fig. 3.19b and compare with Fig. 3.19a). The more or less homogeneous
increase in hardness level as function of time across the depth range investigated
suggests that Mo effectively acts as a weak nitride former, i.e. precipitation takes
effectively place at each depth at the same time with the same rate.
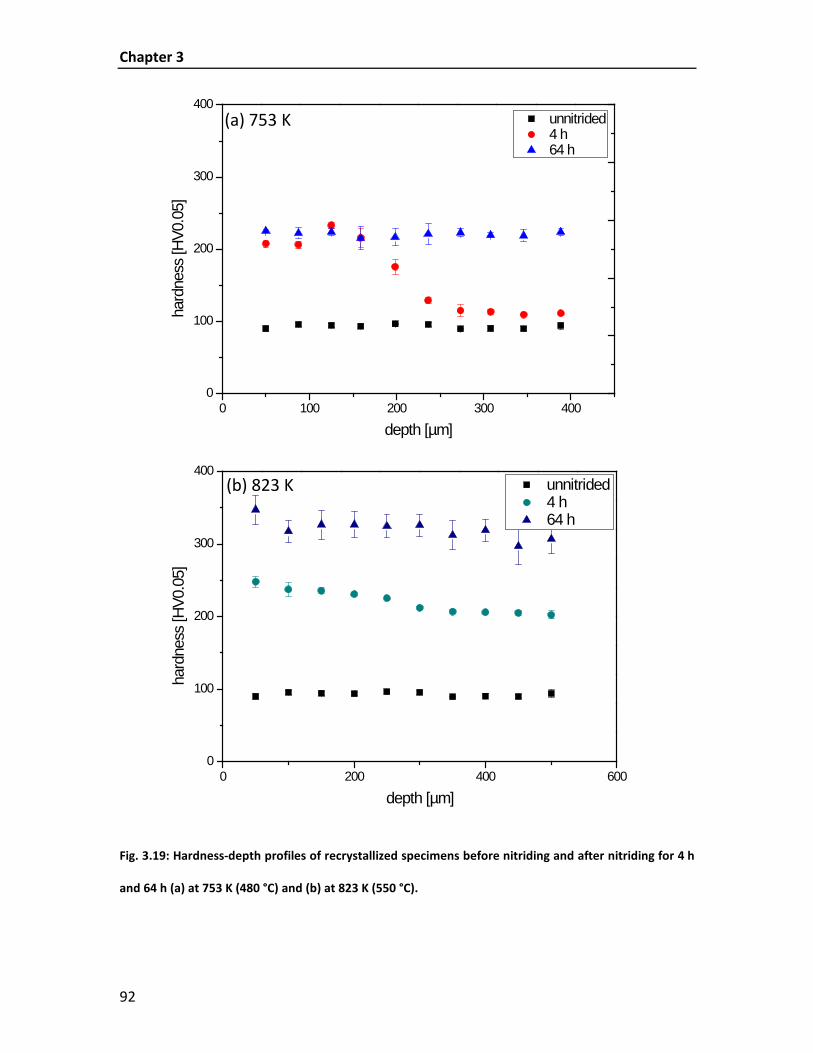
Chapter 3
92
0 100 200 300 4000
100
200
300
400 unnitrided 4 h 64 h
hard
ness
[HV0
.05]
depth [µm]
0 200 400 6000
100
200
300
400 unnitrided 4 h 64 h
hard
ness
[HV0
.05]
depth [µm]
Fig. 3.19: Hardness-depth profiles of recrystallized specimens before nitriding and after nitriding for 4 h
and 64 h (a) at 753 K (480 °C) and (b) at 823 K (550 °C).
(a) 753 K
(b) 823 K
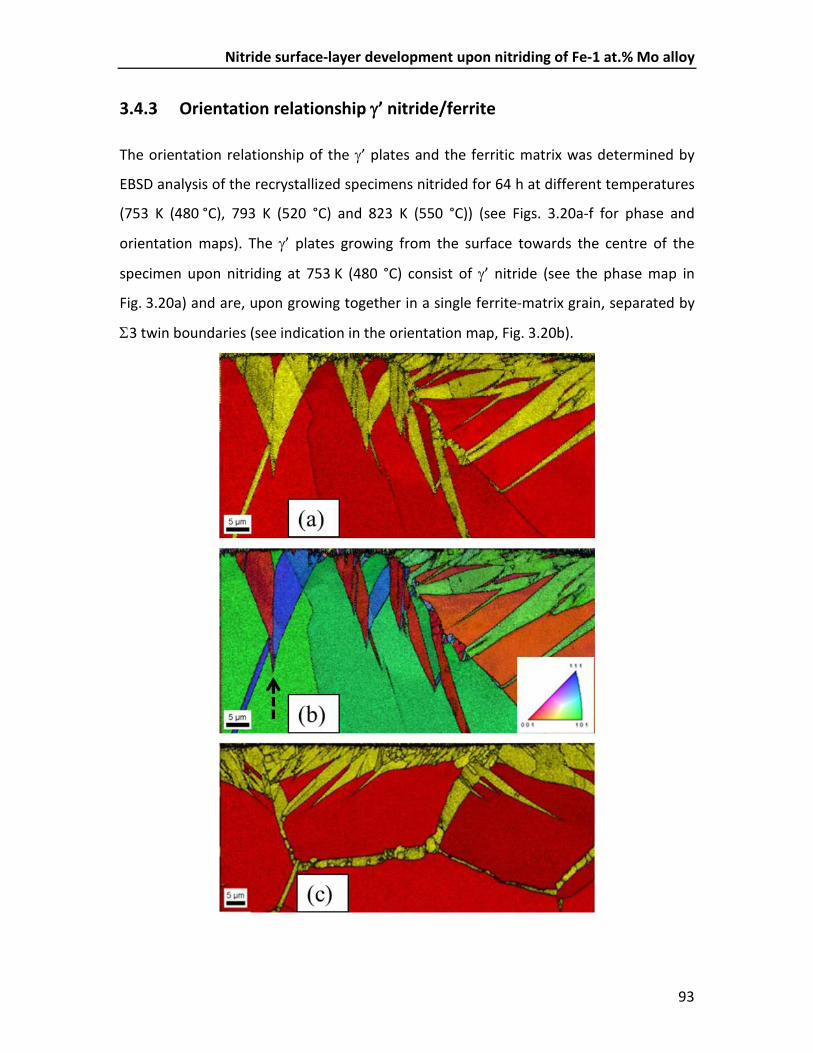
Nitride surface-layer development upon nitriding of Fe-1 at.% Mo alloy
93
3.4.3 Orientation relationship γ’ nitride/ferrite
The orientation relationship of the γ’ plates and the ferritic matrix was determined by
EBSD analysis of the recrystallized specimens nitrided for 64 h at different temperatures
(753 K (480 °C), 793 K (520 °C) and 823 K (550 °C)) (see Figs. 3.20a-f for phase and
orientation maps). The γ’ plates growing from the surface towards the centre of the
specimen upon nitriding at 753 K (480 °C) consist of γ’ nitride (see the phase map in
Fig. 3.20a) and are, upon growing together in a single ferrite-matrix grain, separated by
Σ3 twin boundaries (see indication in the orientation map, Fig. 3.20b).
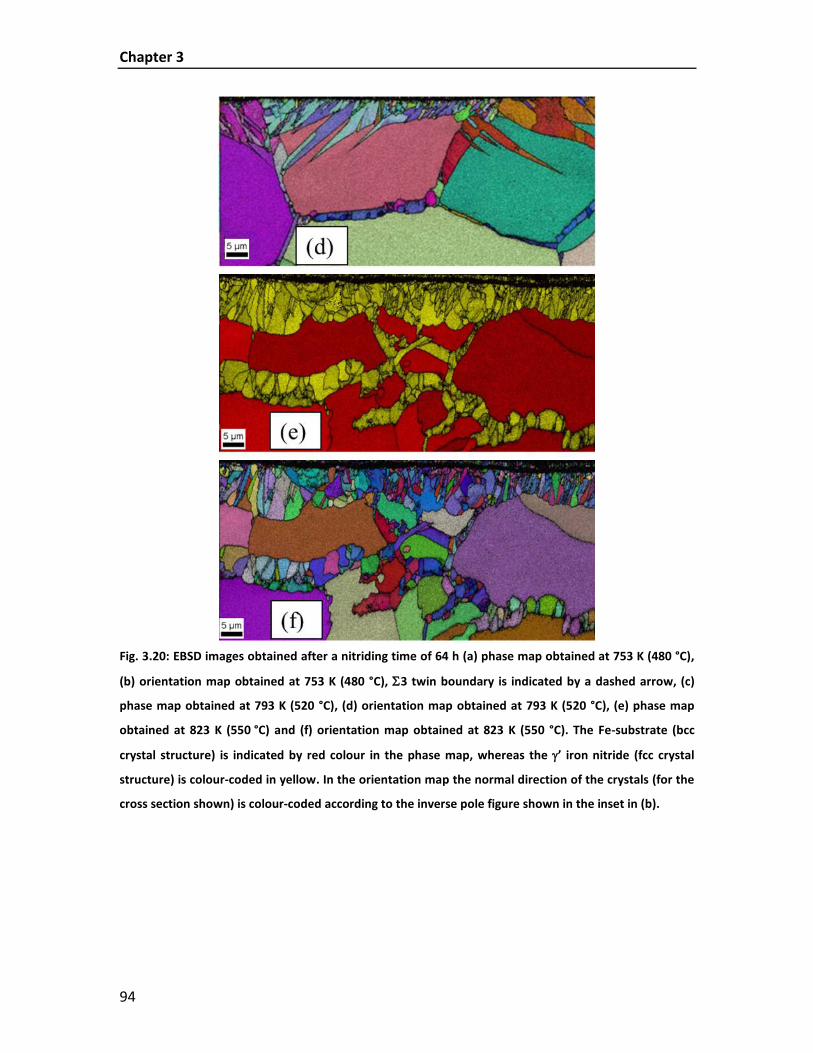
Chapter 3
94
Fig. 3.20: EBSD images obtained after a nitriding time of 64 h (a) phase map obtained at 753 K (480 °C),
(b) orientation map obtained at 753 K (480 °C), Σ3 twin boundary is indicated by a dashed arrow, (c)
phase map obtained at 793 K (520 °C), (d) orientation map obtained at 793 K (520 °C), (e) phase map
obtained at 823 K (550 °C) and (f) orientation map obtained at 823 K (550 °C). The Fe-substrate (bcc
crystal structure) is indicated by red colour in the phase map, whereas the γ’ iron nitride (fcc crystal
structure) is colour-coded in yellow. In the orientation map the normal direction of the crystals (for the
cross section shown) is colour-coded according to the inverse pole figure shown in the inset in (b).
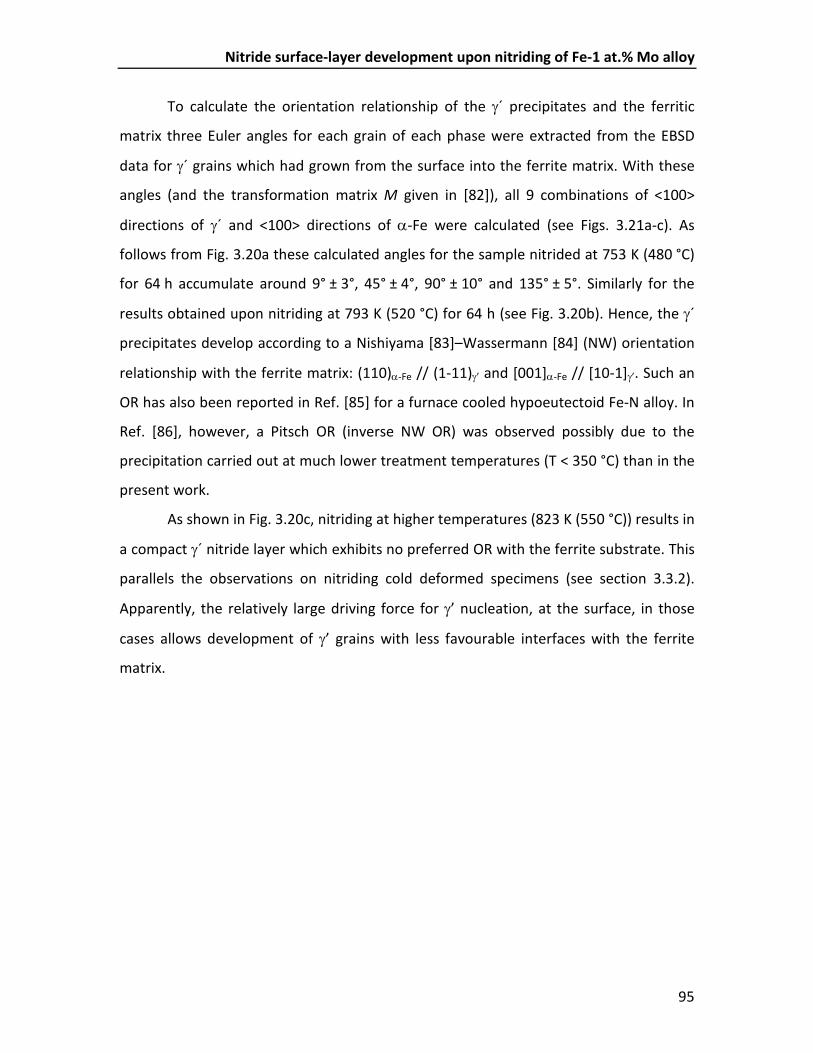
Nitride surface-layer development upon nitriding of Fe-1 at.% Mo alloy
95
To calculate the orientation relationship of the γ´ precipitates and the ferritic
matrix three Euler angles for each grain of each phase were extracted from the EBSD
data for γ´ grains which had grown from the surface into the ferrite matrix. With these
angles (and the transformation matrix M given in [82]), all 9 combinations of <100>
directions of γ´ and <100> directions of α-Fe were calculated (see Figs. 3.21a-c). As
follows from Fig. 3.20a these calculated angles for the sample nitrided at 753 K (480 °C)
for 64 h accumulate around 9° ± 3°, 45° ± 4°, 90° ± 10° and 135° ± 5°. Similarly for the
results obtained upon nitriding at 793 K (520 °C) for 64 h (see Fig. 3.20b). Hence, the γ´
precipitates develop according to a Nishiyama [83]–Wassermann [84] (NW) orientation
relationship with the ferrite matrix: (110)α-Fe // (1-11)γ’ and [001]α-Fe // [10-1]γ’. Such an
OR has also been reported in Ref. [85] for a furnace cooled hypoeutectoid Fe-N alloy. In
Ref. [86], however, a Pitsch OR (inverse NW OR) was observed possibly due to the
precipitation carried out at much lower treatment temperatures (T < 350 °C) than in the
present work.
As shown in Fig. 3.20c, nitriding at higher temperatures (823 K (550 °C)) results in
a compact γ´ nitride layer which exhibits no preferred OR with the ferrite substrate. This
parallels the observations on nitriding cold deformed specimens (see section 3.3.2).
Apparently, the relatively large driving force for γ’ nucleation, at the surface, in those
cases allows development of γ’ grains with less favourable interfaces with the ferrite
matrix.
Chapter 3
96
0 5 10 15 200
15
30
45
60
75
90
105
120
135
150 [001]γ' ̂[001]α-Fe
[001]γ' ̂[010]α-Fe
[001]γ' ̂[100]α-Fe
[010]γ' ̂[001]α-Fe
[010]γ' ̂[010]α-Fe
[010]γ' ̂[100]α-Fe
[100]γ' ̂[001]α-Fe
[100]γ' ̂[010]α-Fe
[100]γ' ̂[100]α-Fe
angl
e [d
eg.]
running number for different α-Fe grains and γ' plates
0 5 10 15 200
15
30
45
60
75
90
105
120
135
150 [001]γ' ̂[001]α-Fe
[001]γ' ̂[010]α-Fe
[001]γ' ̂[100]α-Fe
[010]γ' ̂[001]α-Fe
[010]γ' ̂[010]α-Fe
[010]γ' ̂[100]α-Fe
[100]γ' ̂[001]α-Fe
[100]γ' ̂[010]α-Fe
[100]γ' ̂[100]α-Fe
angl
e [d
eg.]
running number for different α-Fe grains and γ' plates
0 5 10 15 200
15
30
45
60
75
90
105
120
135
150 [001]γ' [̂001]α-Fe
[001]γ' [̂010]α-Fe
[001]γ' [̂100]α-Fe
[010]γ' [̂001]α-Fe
[010]γ' [̂010]α-Fe
[010]γ' [̂100]α-Fe
[100]γ' [̂001]α-Fe
[100]γ' [̂010]α-Fe
[100]γ' [̂100]α-Fe
angl
e [d
eg.]
running number for different α-Fe grains and γ' plates
Fig. 3.21: Calculated angles between the different <100> type directions in ferrite and those in γ´ nitride
for the recrystallized specimens nitrided for 64 h (a) 753 K (480 °C), (b) at 793 K (520 °C) and (c) at 823 K
(550 °C).
(a)
(b)
(c)
Nitride surface-layer development upon nitriding of Fe-1 at.% Mo alloy
97
3.5 Conclusions
The defect density of iron-based Fe-Me alloy, with Me as an (effectively) weak nitride
former (e.g. Me = Mo), has a dramatic effect on the constitution and morphology of the
iron-nitride based compound layer developing upon nitriding:
- Upon nitriding cold rolled Fe-1at.% Mo alloy immediate precipitation of Mo2N
(dislocation facilitated nucleation) occurs, leading to a low nitrogen
supersaturation of the ferrite matrix. γ’ nucleates (only) at the surface resulting
in the development of a compact layer of γ’, incorporating (by overrunning the
formed) Mo2N particles. The γ’ layer growth can be described by a modified
parabolic growth law, accounting for the initial delay in the nucleation of γ’.
Growth of the nitride layer is rate controlled by diffusion of nitrogen through the
layer.
- Upon nitriding recrystallized Fe-1at.% Mo alloy (strongly) delayed precipitation of
Mo2N occurs (if at all): no Mo2N can be found in the matrix even after 64 h of
nitriding at 753 K (480 °C). This is a consequence of the high volumetric misfit
between the ferrite matrix and the Mo2N nitride. Because the solubility of Mo in
γ’ is low, γ’ nitride cannot precipitate easily. These obstacles for Mo-nitride and
γ’-nitride precipitation lead to a high nitrogen supersaturation of the ferrite
matrix over an extended depth range. Eventually, the chosen route for
elimination of this high nitrogen supersaturation is precipitation of γ’ at the cost
of dissolution of Mo in γ’ (para-equilibrium conditions). Plates of γ’ nitride, once
nucleated, grow rapidly across the extended depth range of high nitrogen
supersaturation. The relatively high growth rate of these plates is at least partly
due to short-circuit diffusion of nitrogen through ferrite grains adjacent to the
surface (no compact γ’ layer occurs). The γ’ plates exhibit a Nishiyama-
Wassermann orientation relationship with the ferrite matrix.
- The equilibrium solubility of Mo in γ’ nitride is low. This leads to the emergence
of ε phase and a hitherto unknown (precursory) Mo-nitride phase, next to γ’

Chapter 3
98
phase in the compound layer, upon nitriding the recrystallized Fe-Mo specimens,
and also the cold rolled specimens in a beginning stage of nitriding. Upon
continued nitriding the ε phase and the unknown (precursory) Mo-nitride phase
in the surface adjacent part of the compound layer dissolve and equilibrium Mo-
nitride phases emerge.
99
CHAPTER 4
4 Microstructural and surface residual stress
development during low-temperature gaseous
nitriding of Fe-3.07at.%Mo alloy
H. Selg, E. Bischoff, R. Schacherl, J. Schwarzer, E.J. Mittemeijer
Abstract
Fe-3.07at.% Mo alloy specimens were nitrided at 480 °C in a NH3/H2 gas mixture applying a
nitriding potential of 0.25 atm-1/2 . Selected area electron diffraction patterns (SADPs) of
the nitrided zone showed continuous streaking in <100>α directions, which indicates the
presence of fine, nano-sized precipitate platelets, with a coherent interface parallel to the
{100} planes of the ferrite (α) matrix. The X-ray diffractograms, recorded from the
specimen surface, showed an asymmetric broadening of the ferrite-matrix reflections
which was especially pronounced for the (200) reflections, which hints at a tetragonal
distortion of the (microstressed) ferrite matrix surrounding the precipitates. These
misfitting, nano-sized precipitates cause a relatively high hardness as well as a compressive
residual macrostress parallel to the surface in the nitrided zone adjacent to the surface:
900 HV0.05 and 1100 MPa, respectively.

Chapter 4
100
4.1 Introduction
Nitriding is a thermochemical surface treatment which is of great industrial importance
to improve the surface mechanical and chemical properties of ferritic steel components.
As nitriding medium, a gas atmosphere composed of ammonia and hydrogen gas is
often used. Gaseous nitriding allows an accurate control of the chemical potential of
nitrogen in the nitriding atmosphere. The nitriding potential 3
2
3/2NH
NH
pr
p= is proportional to
the activity of nitrogen in the atmosphere [8]. If it is assumed that the chemical
potential of nitrogen in the gas atmosphere is equal to the chemical potential of
nitrogen absorbed at the surface (so-called local equilibrium), the nitrogen uptake can
be adjusted very precisely by control of the composition of the gas atmosphere at
constant temperature and pressure [9]. Depending on the value of the nitriding
potential, only a diffusion zone or a diffusion zone and a compound layer at the sample
surface can be formed. In the case of the presence of nitride forming elements inner
nitrides will be formed in the diffusion zone.
Mo as substitutionally dissolved element could precipitate as molybdenum
nitride in the nitrided surface region, because of its affinity for nitrogen. Mo is mostly
not added deliberately to promote such precipitation (in contrast with nitride forming
elements such as Cr and Al), but it is often present in nitriding steels in order to improve
the tempering brittleness, the strength and the weldability [46]. Although a distinct
driving force for the precipitation of molybdenum nitride exists, relatively little is known
about this precipitation process.
Upon nitriding of Fe-1.7at.% Mo and Fe-3at.% Mo alloys in the temperature
range of 400 °C to 600 °C a homogenous nucleation of coherent metastable
substitutional-interstitial “zones on {100} matrix ferrite planes” were observed [21]. It
was also reported that the size, composition and structure of the developed “zones”
depend on the amount of Mo, the nitriding temperature as well as the nitriding
potential. Coarsening of these zones led to Mo2N-precipitates of fcc-type structure
having a Bain-orientation relationship [87] with the ferrite matrix [88].
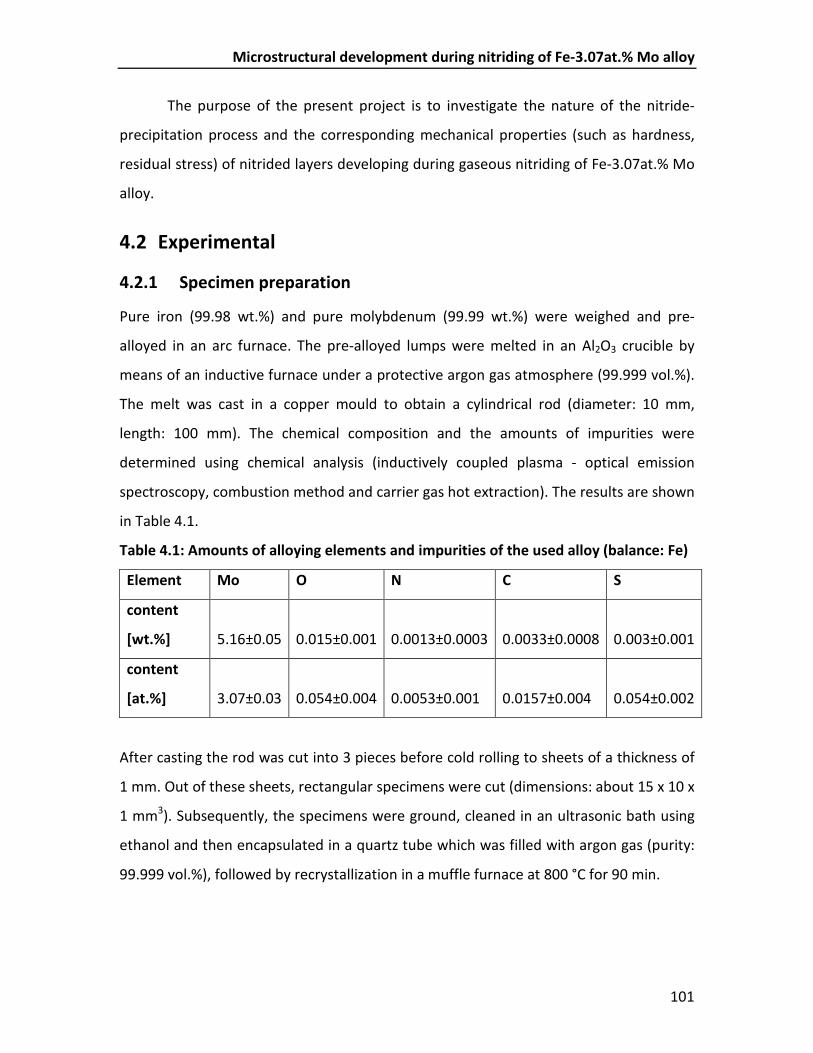
Microstructural development during nitriding of Fe-3.07at.% Mo alloy
101
The purpose of the present project is to investigate the nature of the nitride-
precipitation process and the corresponding mechanical properties (such as hardness,
residual stress) of nitrided layers developing during gaseous nitriding of Fe-3.07at.% Mo
alloy.
4.2 Experimental
4.2.1 Specimen preparation
Pure iron (99.98 wt.%) and pure molybdenum (99.99 wt.%) were weighed and pre-
alloyed in an arc furnace. The pre-alloyed lumps were melted in an Al2O3 crucible by
means of an inductive furnace under a protective argon gas atmosphere (99.999 vol.%).
The melt was cast in a copper mould to obtain a cylindrical rod (diameter: 10 mm,
length: 100 mm). The chemical composition and the amounts of impurities were
determined using chemical analysis (inductively coupled plasma - optical emission
spectroscopy, combustion method and carrier gas hot extraction). The results are shown
in Table 4.1.
Table 4.1: Amounts of alloying elements and impurities of the used alloy (balance: Fe)
Element Mo O N C S
content
[wt.%] 5.16±0.05 0.015±0.001 0.0013±0.0003 0.0033±0.0008 0.003±0.001
content
[at.%] 3.07±0.03 0.054±0.004 0.0053±0.001 0.0157±0.004 0.054±0.002
After casting the rod was cut into 3 pieces before cold rolling to sheets of a thickness of
1 mm. Out of these sheets, rectangular specimens were cut (dimensions: about 15 x 10 x
1 mm3). Subsequently, the specimens were ground, cleaned in an ultrasonic bath using
ethanol and then encapsulated in a quartz tube which was filled with argon gas (purity:
99.999 vol.%), followed by recrystallization in a muffle furnace at 800 °C for 90 min.
Chapter 4
102
4.2.2 Nitriding
Before nitriding, the recrystallized specimen surfaces were polished mechanically (final
step: 1 µm diamond suspension) and cleaned with ethanol in an ultrasonic bath. The
nitriding experiments were performed at a temperature of (480±1) °C in a vertical,
multizone quartz-tube furnace (diameter: 28 mm) with a NH3/H2 gas mixture flux of
500 ml/min (purity NH3: > 99.998 vol.%, purity H2: 99.999 vol.%). The gas fluxes were
adjusted by mass flow controllers and corresponded to a nitriding potential of
rN = 0.25 atm-1/2. The nitriding potential was chosen such that no iron nitrides develop at
the surface [9]. The nitriding process was terminated by quenching the specimens in
water at room temperature.
4.2.3 Specimen characterization
4.2.3.1 X-ray diffractometry
Phase analysis by means of X-ray diffraction (XRD) was performed of all specimens
before and after nitriding by using a PANalytical X’Pert Multi-Purpose Diffractometer
(MPD) with Co-Kα radiation. This instrument uses Bragg-Brentano geometry and is
equipped with a graphite monochromator in the diffracted beam. To improve the
crystallite statistics, the specimens were rotated around their surface normal during the
measurements. The diffraction-angle range (30° < 2θ < 120°) was scanned in steps of
0.06° with a counting time of 30 s per step. For the identification of the phases based on
the positions of the diffraction peaks, data of the ICDD database were used[51].
To determine the residual stress, XRD stress measurements were performed
using the crystallite group method, as described by [89], recognizing the (100)-fibre
texture present after recrystallization, instead of applying the conventional sin2ψ-
method. Stress values were obtained for the case of a macroscopically elastically
isotropic specimen with a plane, rotationally symmetric biaxial state of stress (see also
[90]).
Microstructural development during nitriding of Fe-3.07at.% Mo alloy
103
The measurements were performed using a PANalytical X’Pert Materials-
Research Diffractometer (MRD), equipped with an Eulerian cradle and a graphite
monochromator in the diffracted beam, applying a quasi-parallel beam geometry and
Co-Kα-radiation. The different diffraction-angle ranges for the different reflections (α-Fe
(110) reflection: 45° < 2θ < 60°; α-Fe (200) reflection: 65° < 2θ < 90°; α-Fe (211)
reflection: 90° < 2θ < 110°; α-Fe (220) reflection: 118° < 2θ < 132°) were scanned in
steps of 0.08° using a counting time of 10 s per step.
4.2.3.2 Electron probe microanalysis (EPMA)
For the determination of nitrogen concentration-depth profiles EPMA was performed on
polished cross sections of the specimens using a Cameca SX100 microprobe
(acceleration voltage = 10 kV, current = 100 nA, spot size of about 1 µm). For details, see
Ref. [3].
4.2.3.3 Light microscopy (LM)
Cross sections of the nitrided specimen, embedded in Struers PolyFast, were ground,
polished (final polishing step: 1 µm diamond paste) and finally etched with 2 % Nital
(2 vol.% HNO3 in ethanol) at room temperature for about 30 s. LM micrographs were
taken from these cross sections using a Zeiss Axiophot microscope equipped with a
digital camera (Olympus ColorView IIIu).
4.2.3.4 Microhardness measurement
Microhardness measurements were made on cross sections of the nitrided specimens
(see section 4.2.3.3) using a Vickers microhardness tester (Leica VMHT Mot) applying a
load of 490 mN and a dwell time of 10 s.
Chapter 4
104
4.2.3.5 Transmission electron microscopy (TEM)
A TEM specimen was prepared from the Fe-3.07at.% Mo alloy specimen nitrided for
20 h. Details of the preparation technique have been given in Ref. [5]. TEM analysis was
performed using a Philips CM 200 transmission electron microscope operating at
200 kV. Bright field (BF) images, dark field (DF) images and selected area electron
diffraction patterns (SADPs) were recorded by a CCD camera attached to the TEM
apparatus.
4.3 Results and discussion
4.3.1 Microstructure
X-ray diffractograms recorded from the specimen surfaces before and after nitriding for
different times are shown in Fig. 4.1. In the unnitrided condition, apart from reflections
originating from the ferrite matrix, additional reflections can be expected because the
maximum solubility of Mo in Fe is somewhere between 1 and 1.5 at.% at a temperature
of 527 °C [91]: nitriding was performed in a two-phase region of the Fe-Mo system.
Additional reflections are observed indeed, which can be indexed as reflections
originating from a Fe3Mo3N Laves phase. This phase is stabilized by interstitial elements
such as O, C, and N. The reflections of the Laves-phase Fe3Mo3N decrease and finally
disappear (see diffractogram taken from the 100 h nitrided sample in Fig. 4.1)
completely, since all molybdenum in the specimen is used for the formation of
molybdenum-nitride precipitates. However, no reflections originating from
molybdenum nitrides can be observed (see what follows).

Microstructural development during nitriding of Fe-3.07at.% Mo alloy
105
40 60 80 100 120 2θ [°]
g) 100h
f) 50h
e) 20h
log
(inte
nsity
[a.u
.])
d) 10h
c) 2h
b) 1h
a) unnitrided
Fe 211Fe3Mo3N
Fe 200Fe 110Fe3Mo3NFe3Mo3NFe3Mo3N
Fig. 4.1: X-ray diffractograms taken from the specimen surface before nitriding (a), and after nitriding
for 1 h (b), 2 h (c), 10 h (d), 20 h (e), 50 h (f) and 100 h (g).
With increasing nitriding time an asymmetric peak broadening of the ferrite-
matrix reflections occurs, in particular after 2 h of nitriding, i.e. after significant
precipitation has begun (cf. discussion in section 4.3.2). This can be ascribed to the
development of microstrain due to the formation of largely coherent nitride precipitates
in the matrix, which also diffract coherently with the matrix. This causes the intensity
“hump” at the high-angle side of the matrix reflections, eventually leading to even peak-
splitting after a nitriding time of 100 h. This intensity hump represents the tetragonal
200/002 doublet reflection due to the tetragonally distorted ferrite matrix surrounding
the precipitates, as discussed for VN precipitates in a ferrite matrix [45].
The SADP and the corresponding bright field image of a TEM specimen from a
region near the surface are shown in Fig. 4.2. The platelet-like, very small precipitates,

Chapter 4
106
having a length of 10-15 nm and a thickness of < 1 nm, are oriented with their faces
along {100}α-Fe planes. Due to the very fine platelet-like nature of the coherent
precipitates, diffraction streaks along <100>α-Fe directions are present in the SADP. The
precipitate platelets could be conceived as fcc-type Mo2N nitride exhibiting a Bain-type
orientation relationship with the matrix, as observed by [88] only after coarsening.
Then, this nitride would experience a misfit parallel to the habit plane of only a few
percent, whereas the misfit perpendicular to the habit plane would be very large. An
alternative crystal structure is to conceive the platelets as fcc-type MoN which could
exist according to a theoretical calculation [92]. Also in this case a Bain-type orientation
relationship is anticipated, albeit with a larger misfit parallel to the habit plane than for
Mo2N. Due to the occurrence of only streaking, the determination of the crystal
structure of the formed precipitates is not possible at this stage.
Fig. 4.2: Bright field image and corresponding diffraction pattern of the sample Fe-3.07at.% Mo, nitrided
at a temperature of 480 °C for 20 h using a nitriding potential of rN = 0.25 atm-1/2. [001] zone axis of
ferrite. The streaking has been indicated in the SADP with a white dashed arrow.
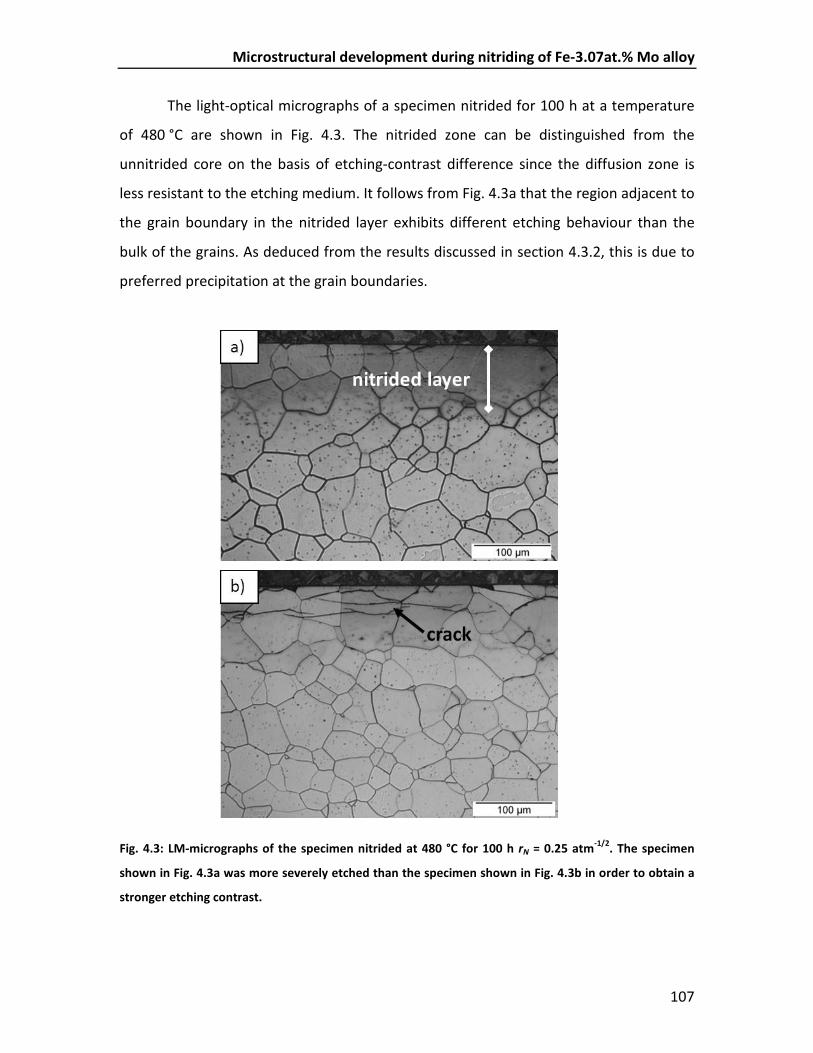
Microstructural development during nitriding of Fe-3.07at.% Mo alloy
107
The light-optical micrographs of a specimen nitrided for 100 h at a temperature
of 480 °C are shown in Fig. 4.3. The nitrided zone can be distinguished from the
unnitrided core on the basis of etching-contrast difference since the diffusion zone is
less resistant to the etching medium. It follows from Fig. 4.3a that the region adjacent to
the grain boundary in the nitrided layer exhibits different etching behaviour than the
bulk of the grains. As deduced from the results discussed in section 4.3.2, this is due to
preferred precipitation at the grain boundaries.
Fig. 4.3: LM-micrographs of the specimen nitrided at 480 °C for 100 h rN = 0.25 atm-1/2. The specimen
shown in Fig. 4.3a was more severely etched than the specimen shown in Fig. 4.3b in order to obtain a
stronger etching contrast.
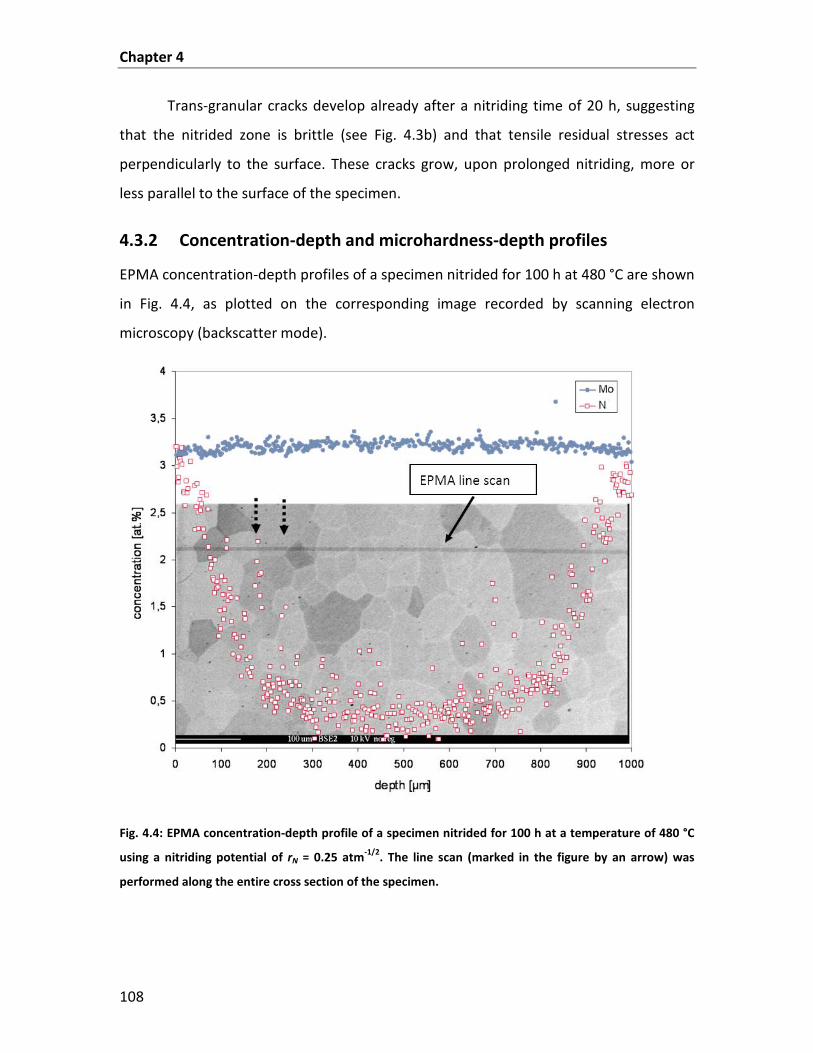
Chapter 4
108
Trans-granular cracks develop already after a nitriding time of 20 h, suggesting
that the nitrided zone is brittle (see Fig. 4.3b) and that tensile residual stresses act
perpendicularly to the surface. These cracks grow, upon prolonged nitriding, more or
less parallel to the surface of the specimen.
4.3.2 Concentration-depth and microhardness-depth profiles
EPMA concentration-depth profiles of a specimen nitrided for 100 h at 480 °C are shown
in Fig. 4.4, as plotted on the corresponding image recorded by scanning electron
microscopy (backscatter mode).
Fig. 4.4: EPMA concentration-depth profile of a specimen nitrided for 100 h at a temperature of 480 °C
using a nitriding potential of rN = 0.25 atm-1/2. The line scan (marked in the figure by an arrow) was
performed along the entire cross section of the specimen.
Microstructural development during nitriding of Fe-3.07at.% Mo alloy
109
The nitrogen-penetration depth is small, which can be attributed to the low nitriding
temperature (100 h at 480 °C). The molybdenum is distributed more or less evenly over
the whole cross section, whereas the nitrogen content shows a pronounced scatter in
the nitrided zone. It follows from Fig. 4.4 that the nitrogen content at the grain
boundaries exceeds the one in the bulk of the grains by a factor of two (see dashed
arrows in Fig. 4.4). This suggests that nucleation of nitride precipitates is favoured at
grain boundaries in the nitrided zone (see discussion of etching contrast at grain
boundaries in section 4.3.1).
Assuming that the nitride precipitates can be conceived as molybdenum nitrides,
the observed value for the nitrogen content in the surface-adjacent region (about
3.2 at.%) can be discussed as follows:
(i) According to [88] (but as observed after coarsening) the fcc-type nitride
precipitates have the composition Mo2N. Thus, an amount of about 1.5 at.% N would be
necessary in order to achieve full precipitation of the Mo as Mo2N in the present,
3-at.% Mo containing specimen. The equilibrium solubility of N in the unstrained ferrite
matrix for the given nitriding conditions is about 0.16 at.%. Then, the difference
between the observed nitrogen content (3.2 at.%) and the expected nitrogen content
(1.5 at.% required for precipitation of Mo2N and 0.16 at.% which can be dissolved in the
unstrained ferrite) is described as excess nitrogen (about 1.54 at.%), located, as
dissolved, in the strained matrix surrounding the precipitates and at the precipitate-
matrix interfaces (see [31]).
(ii) If the Mo-precipitates would have the composition MoN, a similar calculation
as above indicates the presence of a much smaller amount of excess nitrogen (below
0.04 at.%). This observation is rather unlikely since the amount of excess nitrogen is
expected to be much higher due to the large number of nano-sized, coherent
precipitates. Further, in view of the crystal structure of MoN (the equilibrium, hexagonal
modification; cf. section 4.3.1) the precipitation of coherent nitrides is assumed to be
very difficult.

Chapter 4
110
The microhardness-depth profiles of the specimens nitrided at 480 °C for 1 h,
2 h, 10 h, 20 h, 50 h and 100 h are shown in Fig. 4.5. A gradual increase of the hardness
in the region adjacent to the surface is observed. The increase of the hardness during
the early stages of nitriding (up to 2 h at 480 °C) can be attributed to the dissolution of
nitrogen in the ferrite matrix, since the nitrogen content, as demonstrated by EMPA,
was below the saturation limit of dissolved N in the α-Fe matrix.
The recognition that a distinct built-up of hardness during nitriding occurs only
after more than 2 h of nitriding at 480 °C suggests a slow nucleation of the nitride
precipitates. As Mo is a nitride former of only intermediate strength (chemical driving
force for the precipitation of Mo2N is about -81 kJ/mol (for VN : -251 kJ/mol) [93]) and
because it has a large volume misfit with the α-Fe-matrix [21], a non-instantaneous,
gradual nitride formation from the supersaturated matrix can be understood.
0 100 200 300 400 500 600100
200
300
400
500
600
700
800
900
1000
1100
hard
ness
[HV0
.05]
depth [µm]
1 h 2 h 10 h 20 h 50 h 100 h
Fig. 4.5: Microhardness-depth profiles of specimens nitrided for various times at a temperature of
480 °C using a nitriding potential of rN = 0.25 atm-1/2.
Microstructural development during nitriding of Fe-3.07at.% Mo alloy
111
4.3.3 Residual macrostress
The development of the compressive residual stress, parallel to the surface in the near-
surface region, is shown in Fig. 4.6a as function of the nitriding time, whereas the
development of the surface hardness as function of the nitriding time is shown in
Fig. 4.6b. The first increase in compressive residual stress up to a nitriding time of 2 h is
caused by nitrogen dissolved in the ferrite matrix, (cf. discussion in section 4.3.2).
Beyond a nitriding time of 2 h the formation of (largely coherent; cf. section 4.3.1)
nitride precipitates starts. This leads to a strong hardness increase, and a strong increase
of compressive residual stress. After passing through a maximum of about 1150 MPa at
a nitriding time of 67 h, the compressive residual stress tends to decrease. This could be
caused by the progressing nitrogen homogenization of the specimen (see Fig. 4.5): a
homogeneously nitrided specimen will not exhibit a macrostress(-depth profile).

Chapter 4
112
Fig. 4.6: Surface compressive residual stress parallel to the surface (a) and surface hardness (b) as
function of the square root of the nitriding time.
0 2 4 6 8 100
200
400
600
800
1000
1200
1400
com
pres
sive
resid
ual s
tress
[MPa
]
(nitriding time)1/2 [h1/2]
0 2 4 6 8 100
200
400
600
800
1000
hard
ness
[HV0
.05]
(nitriding time)1/2 [h1/2]
a)
b)

Microstructural development during nitriding of Fe-3.07at.% Mo alloy
113
4.4 Conclusions
- Upon low-temperature nitriding of Fe-3.07at.% Mo alloy, precipitation of nano-
sized platelets along {100} planes of the ferrite matrix occurs. Strongly
asymmetric X-ray diffraction ferrite-peak broadening and streaks along <100>
ferrite directions in the selected area electron diffraction pattern suggest that
the nitride precipitates are largely coherent with the surrounding ferrite matrix,
which is distorted tetragonally due to the precipitate/matrix misfit.
- The precipitation process is not instantaneous upon nitrogen saturation of the
ferrite matrix: a gradual development of high hardness and high compressive
residual stress occurs.
- Adopting the composition Mo2N for the largely coherent nitride platelets, it
follows that a distinct amount of “excess nitrogen” is taken up.
Acknowledgement
We are grateful to Dipl.-Ing. P. Kress and Mr. J. Köhler for assistance with the nitriding
experiments, Mrs. S. Haug for assistance with the EPMA experiments, Mr. W.-D. Lang for
TEM sample preparation and Dr. U. Welzel for discussion of the XRD data.

Chapter 4
114
115
CHAPTER 5
5 Nitriding behaviour of maraging steel: experiments
and modelling
H. Selg, S. Meka, M. Kachel, R. Schacherl, T. Waldenmaier, E.J. Mittemeijer
Abstract
The microstructure and the kinetics of growth of the nitrided zone of a Mo-containing
maraging steel was investigated by performing gaseous nitriding at temperatures between
440 °C and 520 °C and at nitriding potentials up to 0.5 atm-1/2 for both solution annealed
and precipitation hardened specimens. The microstructure of the nitrided zone was
investigated by means of X-ray diffraction (phase constitution; crystal imperfection). Fine,
initially largely coherent Mo2N-type precipitates developed in the nitrided zone. The
elemental concentration-depth profiles were determined employing Glow Discharge
Optical Emission Spectroscopy (GDOES). The nitrogen content within the nitrided zone
exceeds the nitrogen content expected on the basis of the molybdenum content and the
equilibrium solubility of nitrogen in a (stress-free) ferritic matrix: excess nitrogen occurs. A
numerical model was applied to predict the nitrogen concentration-depth profile within
the nitrided layer. The model describes the dependence on time and temperature of the
nitrogen concentration-depth profiles with, as fit parameters, the surface nitrogen
concentration, the diffusion coefficient of nitrogen in the matrix, a composition parameter
of the formed nitride and the solubility product of the nitride forming element and
dissolved nitrogen in the matrix. Initial values for the surface nitrogen concentration and
the composition parameter were determined experimentally with an absorption isotherm
and fitted to the measured nitrogen concentration-depth profiles. The results obtained
revealed the striking effects of the amount of excess nitrogen and the extent of
precipitation hardening on the developing nitrogen concentration-depth profile.
Chapter 5
116
5.1 Introduction
Maraging steels are a group of nickel-alloyed steels having a practically carbon-free
martensitic structure and which are age hardened by the precipitation of one or more
intermetallic compounds [35, 36]. Since their development in the early 1960s by the
International Nickel Company (INCO), this class of steels has attracted much interest and
is used in many technical applications ([37, 38]) due to their high strength, high fracture
toughness, high strength to weight ratio and good weldability. The martensitic
transformation is induced by air cooling3 from the solution annealing temperature in the
austenite-phase region. Due to the very low content of interstitials (C, N) the martensite
phase is usually of cubic crystal structure and relatively soft. Upon subsequent age
hardening, extremely fine, coherent intermetallic compounds such as Ni3X (X = Ti, Mo, V,
W) develop [35, 36].
As other alloyed steels, maraging steels are often subjected to an additional,
specific thermochemical heat treatment in order to improve the fatigue properties [52].
Gaseous nitriding is one of the most widely applied of such surface engineering
treatments. In the past, only a few, moreover largely phenomenological studies were
devoted to the nitriding behaviour of maraging steels, mainly to measure the
improvement of the mechanical properties [94, 95]. Little is known about the
microstructure and the growth kinetics of the nitrided zone. In the present study the
microstructural development of the diffusion (nitrided) zone and its growth kinetics
were investigated by performing nitriding experiments at controlled chemical potential
of nitrogen in the nitriding (gaseous) atmosphere. Both the nitriding response of purely
martensitic (solution annealed and quenched) specimens and of subsequently age
hardened specimens were studied. As a result, a numerical model quantitatively
describing the growth kinetics of the diffusion zone was developed (see sec. 5.2). The
modelling required distinction of the different types of nitrogen uptake [19], as
3 In case of maraging steels, air cooling from the solution annealing temperature to room temperature is sufficient to obtain the completely martensitic microstructure.
Nitriding behaviour of maraging steel: experiments and modelling
117
discussed for iron-based alloys in Ref. [31]. For quantitative assessment so-called
nitrogen-absorption isotherms were determined.
5.2 Modelling the kinetics of growth of the nitrided zone
Nitriding of iron-based alloys containing nitride forming alloying elements Me (Me = Al,
Cr, Mo, V,…) leads to the development of nano-sized alloying element nitride
precipitates in the ferrite matrix (i.e. diffusion zone) [1, 3, 15, 20, 27]. The shape of the
resulting nitrogen concentration-depth profile strongly depends on the “strength of the
interaction” [31] between nitride forming element and nitrogen. A number of models
for describing the nitriding kinetics have been proposed in the literature. In the
following, after having indicated very briefly the classical model for “strong” Me-N
interaction, a synopsis of the most general, recent treatment of weak to strong
interaction and incorporating the different effects of the different types of absorbed
nitrogen is presented, which is necessary for understanding this paper. The present
maraging steel has been modeled as a binary Fe-Mo alloy, as Mo is the only nitride
forming element in it.
The simplest model for the case of strong interaction between Me and N (the
presence of only one nitride forming element is supposed) provides an analytical
expression for the nitriding kinetics at constant temperature, which was originally
derived for internal oxidation [15, 96]: N
2 N
Me
2 sC Dz tnC
= (5.1),
where z denotes the extent of the diffusion zone (depth under the surface) across which
all of the nitride forming alloying element has precipitated as nitride, NsC is the
dissolved nitrogen concentration at the specimen surface, ND is the diffusivity of
nitrogen in the matrix, n denotes the stoichiometry of the MeNn precipitates, MeC is the
concentration of the initially dissolved Me in the matrix and t denotes the nitriding time.
Hence, a parabolic relationship should occur between the nitriding time and the

Chapter 5
118
thickness of the diffusion layer at constant temperature. Equation (5.1) presupposes
that a sharp “interface” occurs between the nitrided case and the unnitrided core. In
case of intermediate interaction between Me and N, a shallow transition between the
nitrided case and the unnitrided core occurs. If (ideally) weak interaction prevails, the
transition between nitrided case and unnitrided core vanishes resulting in a constant
nitrogen content independent of the depth in the specimen, i.e. precipitation of Me-N
takes place at the same time at each depth (“bucket that fills up”). The shape of the
transition between the nitrided case and the unnitrided core is governed by the
solubility product of Me and N in the matrix, nMeNK , with respect to the nitride MeNn,
(see below). Moreover, it has been found that a distinction has to be made between the
different types of absorbed nitrogen (immobile and mobile excess nitrogen; see below)
in order to model the nitrogen diffusion-depth profile successfully [19]. The nitrogen
taken up upon nitriding of an iron-based alloy (Fe-Al [97], Fe-Cr- [15, 18], Fe-Ti [27, 29],
Fe-V [30] and Fe-Mo [98]) generally exceeds the so-called normal nitrogen content. The
expected normal nitrogen content is the sum of the equilibrium content of nitrogen
dissolved in the unstrained matrix and the nitrogen needed to precipitate the entire
amount of alloying element as nitride, MeNn. The nitrogen in excess of the normal
nitrogen is called “excess nitrogen”.
Two types of excess nitrogen have been distinguished [30, 31]:
i) nitrogen adsorbed at the precipitate/matrix interface,
ii) nitrogen dissolved additionally (with respect to the equilibrium amount of
dissolved nitrogen (i.e. in the absence of misfit stresses)) in the strained
matrix, due to volume misfit between nitride precipitate and ferrite matrix.
The first type of the above listed excess nitrogen (i) is denoted as immobile excess
nitrogen as this nitrogen is not able to diffuse. The second type of excess nitrogen (ii) is
referred to as mobile excess nitrogen, as it participates in the diffusion flux. The effect of
the different kinds of excess nitrogen on nitriding kinetics is different: the mobile excess
nitrogen increases the extent of the diffusion zone, whereas the immobile excess
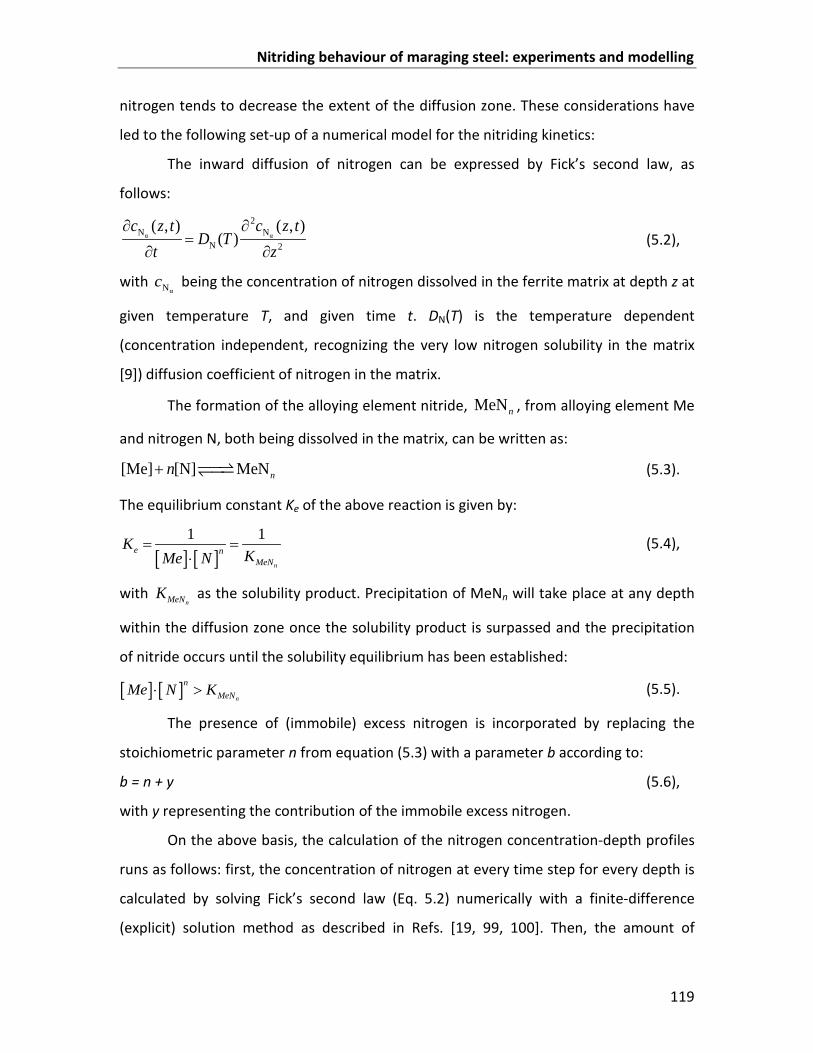
Nitriding behaviour of maraging steel: experiments and modelling
119
nitrogen tends to decrease the extent of the diffusion zone. These considerations have
led to the following set-up of a numerical model for the nitriding kinetics:
The inward diffusion of nitrogen can be expressed by Fick’s second law, as
follows:
α α
2N N
N 2
( , ) ( , )( )
c z t c z tD T
t z∂ ∂
=∂ ∂
(5.2),
with αNc being the concentration of nitrogen dissolved in the ferrite matrix at depth z at
given temperature T, and given time t. DN(T) is the temperature dependent
(concentration independent, recognizing the very low nitrogen solubility in the matrix
[9]) diffusion coefficient of nitrogen in the matrix.
The formation of the alloying element nitride, MeNn , from alloying element Me
and nitrogen N, both being dissolved in the matrix, can be written as:
[Me] [N] MeNnn+
(5.3).
The equilibrium constant Ke of the above reaction is given by:
[ ] [ ]1 1
n
e nMeN
KKMe N
= =⋅
(5.4),
with nMeNK as the solubility product. Precipitation of MeNn will take place at any depth
within the diffusion zone once the solubility product is surpassed and the precipitation
of nitride occurs until the solubility equilibrium has been established:
[ ] [ ]n
nMeNMe N K⋅ > (5.5).
The presence of (immobile) excess nitrogen is incorporated by replacing the
stoichiometric parameter n from equation (5.3) with a parameter b according to:
b = n + y (5.6),
with y representing the contribution of the immobile excess nitrogen.
On the above basis, the calculation of the nitrogen concentration-depth profiles
runs as follows: first, the concentration of nitrogen at every time step for every depth is
calculated by solving Fick’s second law (Eq. 5.2) numerically with a finite-difference
(explicit) solution method as described in Refs. [19, 99, 100]. Then, the amount of
Chapter 5
120
dissolved alloying element content is calculated at every time step for every depth and
the value of the solubility product of MeNn is calculated. If the solubility product
surpasses its equilibrium value, precipitation of MeNn will take place at this location
until [ ] [ ]n
nMeNMe N K⋅ = .
Thus, the nitrogen concentration-depth profile can be numerically calculated
iteratively adopting starting values for following fit parameters:
- the surface concentration of dissolved nitrogen, [ ] [ ]0 strainsN Fe Fe
c N Nα α− −
= + with
[ ]0
FeN
α − as the solubility of nitrogen in the unstrained, ferrite matrix and [ ]strain
FeN
α −
as the solubility of nitrogen in the strained matrix in excess to [ ]0
FeN
α −,
- the composition parameter b = n + y,
- the solubility product nMeNK ; can be estimated according to Ref. [101] on the
basis of standard Gibbs energy of formation of MeNn,
- the diffusion coefficient of nitrogen in the matrix, ND ; can, in case of a ferrite
matrix, be assessed using literature data [9].
Values of [ ]strain
FeN
α − and b have been obtained in this study experimentally from
nitrogen-absorption isotherm determinations. These values were used as starting values
in the fitting procedure. The influence of the fitting parameters is explained as follows:
(i) Effect of SNC : If the surface concentration of dissolved nitrogen increases, the
total nitrogen content increases and also the nitriding depth increases with
increasing SNC due to a larger concentration gradient of the mobile nitrogen.
(ii) Effect of b: If b increases, the total nitrogen concentration increases because the
amount of adsorbed nitrogen increases. This leads, in contrast to an increasing
surface concentration of dissolved nitrogen, to a decrease of the extent of the
nitrided zone.

Nitriding behaviour of maraging steel: experiments and modelling
121
(iii) Effect of nMeNK : The solubility-product value changes the “slope” of the
“interface” between the nitrided case and the unnitrided core. If nMeNK
decreases, as for strong nitride forming elements such as Ti or V, this “interface”
becomes less diffuse.
(iv) Effect of ND : A larger value of the diffusion coefficient obviously increases the
depth of the nitrided zone and makes the “case/core interphase” more diffuse.
5.3 Experimental
5.3.1 Specimen preparation
For the investigations a commercially available maraging steel (Imphy alloys, Arcelor
Group, France) was used. The chemical composition, including the amounts of
impurities, was determined using chemical analysis (inductively coupled plasma - optical
emission spectroscopy, combustion method and carrier gas hot extraction). The results
are shown in Table 5.1.
Table 5.1: Amounts of main alloying elements and impurities for the maraging steel used in this work
(balance: Fe).
maraging steel composition [wt.%] composition [at.%]
Ni 17.9 ± 0.2 17.7
Co 16.6 ± 0.2 16.4
Mo 5.48 ± 0.06 3.3
Cr 0.072 ± 0.001 0.08
Cu 0.062 ± 0.001 0.06
Ti ≤ 0.002 < 0.0025
O 0.024 ± 0.006 0.05
N 0.0034 ± 0.0005 0.014
C 0.0095 ± 0.0009 0.045
Chapter 5
122
The as-supplied sheets (thickness approximately 400 µm) were cut into
rectangular specimens (lateral dimensions: about 15 x 10 mm2) and a hole was drilled
(Ø: 1.5 mm) in them for fixing them later during the age hardening and nitriding
treatments. The specimens were ground, cleaned in an ultrasonic bath using ethanol
and then encapsulated in a quartz tube which was filled with argon gas (purity:
99.999 vol.%). Subsequently, the specimens were solution annealed in a muffle furnace
at 880 °C for 30 min. Before nitriding, the specimen surfaces were polished mechanically
(final step: 1 µm diamond suspension), cleaned with ethanol in an ultrasonic bath and
dried in a nitrogen gas flow.
5.3.2 Nitriding
The nitriding experiments were performed at different calibrated temperatures (440 °C,
460 °C, 480 °C and 520 °C ; temperature accuracy: ±1 °C) in a vertical, multizone quartz-
tube furnace (Ø: 28 mm) with a NH3/H2 gas mixture using a total gas flux of 500 ml/min
(purity NH3: > 99.998 vol.%, purity H2: 99.999 vol.%). The gas fluxes were adjusted by
calibrated mass flow controllers and corresponded to a nitriding potential, 3
2
NHN 3/2
H
pr
p=
[8], of 0.5 atm-1/2. The nitriding potential was chosen such that no γ’-iron nitrides
develop at the surface. Hence, the nitrided layer only consists of a diffusion zone. The
nitriding process was terminated by breaking mechanically the quartz fibre at which the
specimen was suspended in the furnace and for which the hole was drilled so that the
specimen fell into a flask filled with water. In order to minimize the risk of specimen
oxidation, the water in the quenching flask was rinsed with N2 (for about 15 min) before
specimen quenching.
Some of the specimens were subjected to an age hardening treatment (until
peak hardness was reached) at 480 °C for 2 h in a H2 atmosphere prior to the nitriding
treatment. All other specimens were nitrided in the soft condition, i.e., directly after
solution annealing. In the following, the specimens nitrided (at temperatures in the
range of 460 °C to 520 °C) in the soft condition are denoted with “A”, whereas the

Nitriding behaviour of maraging steel: experiments and modelling
123
specimens subjected to age hardening before nitriding (at 440oC) are denoted with “B”.
Note that in the specimens of type “A” nitriding and age-hardening processes could
occur simultaneously.
The nitriding (and pre-treatment) parameters used in the present work have
been listed in Table 5.2.
Table 5.2: Nitriding parameters employed in the present work. The specimens “A” were nitrided in the
solution annealed state, whereas specimens “B” were age-hardened prior to nitriding.
specimen
type
pre-(aging)
treatment
nitriding
temperature [°C]
nitriding
time [h]
nitriding
potential
[atm-1/2]
A - 460, 480, 520 0.5 - 6 0.5
B 2 h at 480 °C in
pure H2 440 1 - 21 0.5
5.3.3 Determination of nitrogen-absorption isotherms
For the determination of the absorption isotherm, i.e. the dependence of nitrogen
uptake on the nitriding potential at constant temperature, a thin foil of approximately
60 µm thickness was prepared by cold-rolling and mechanical grinding followed by a
solution annealing treatment as described in sec. 5.3.1. Subsequently, one such
specimen was age hardened at 480 °C under H2 atmosphere for 2 h (thus peak hardness
was reached). Next, both the solution annealed specimen and the solution annealed and
age hardened specimen were pre-nitrided to saturation level of nitrogen uptake in order
to obtain a homogeneous precipitation morphology throughout the cross section of the
specimen. This pre-nitriding was performed at 480 °C for 110 h with a nitriding potential
of 0.25 atm-1/2 (i.e. until no further nitrogen uptake occurred). A subsequent denitriding
was performed in pure H2 atmosphere at 450 °C for 70 h (i.e. until no further decrease
of mass of the specimen occurred) under pure H2 atmosphere to remove less strongly

Chapter 5
124
bonded interstitially dissolved nitrogen. The nitrogen-absorption isotherms of both
specimens were determined at a temperature below the pre-nitriding temperature, (i.e.
at 440 °C) in order to avoid any change in nitride-precipitate morphology during the
course of absorption-isotherm measurements. For the nitrogen-absorption isotherm
determinations, the pre-nitrided foils were subjected to nitriding at different nitriding
potentials (listed in Table 5.3) until the saturation level of nitrogen uptake was reached
(which was achieved after nitriding for 20 h).
Nitrogen uptake (or loss) was determined by weighing the specimen before and
after the experiment using a Mettler microbalance (accuracy: 1 µg). The average of at
least 5 weight measurements was taken for the determination of the nitrogen uptake
(as compared to the unnitrided specimen). The error bars indicated in Fig. 5.2a and b
represent the standard deviation for that average value.
Table 5.3: Nitriding potential, rN, and corresponding flow-rates of NH3 and H2 used for the
determination of the absorption isotherms.
rN [atm-1/2] NH3 [ml/min] H2 [ml/min]
0.02 10 490
0.05 23 477
0.08 36 464
0.09 40 460
0.12 50 450
0.14 58 442
0.2 78 422
0.3 105 395
0.4 128 372
0.5 148 352
Nitriding behaviour of maraging steel: experiments and modelling
125
5.3.4 Specimen characterization
5.3.4.1 Light microscopy (LM)
For LM investigations a piece of each nitrided specimen was cut off (Struers Accutom 50,
Al2O3 cut-off wheel), embedded in Struers PolyFast, ground and polished (final polishing
step: 1 µm diamond suspension). Each cross section was etched with 2 % Nital (2 vol.%
HNO3 in ethanol) at room temperature for about 10 s. LM micrographs were taken using
a Zeiss Axiophot microscope equipped with a digital camera (Olympus ColorView IIIu).
5.3.4.2 Microhardness measurement
Microhardness measurements on cross sections (for determination of hardness-depth
profiles) and on the surfaces of nitrided specimens were carried out with a Vickers
microhardness tester (Leica VMHT Mot) applying a load of 490 mN and a dwell time of
10 s.
5.3.4.3 X-ray diffractometry
Phase analysis by means of X-ray diffraction was performed for all specimens before and
after nitriding using a PANalytical X’Pert Multi-Purpose Diffractometer (MPD) with Co-Kα
radiation. This instrument uses Bragg-Brentano geometry and is equipped with a
graphite monochromator in the diffracted beam. The diffraction-angle range (30 ° < 2θ <
120 °) was scanned in steps of 0.06 ° with a counting time of 600 s per step. For the
identification of the phases, based on the positions of the diffraction peaks, data of the
ICDD database were used [51].
Residual stress measurements were carried out applying the sin2ψ-method
[102]. Stress values were obtained for the case of a macroscopically elastically isotropic
specimen with a plane, rotationally symmetric biaxial state of stress ( 11 22σ σ σ= =
;
experimentally proven to be applicable). The measurements were performed using a
PANalytical X’Pert Materials-Research Diffractometer (MRD), equipped with an Eulerian

Chapter 5
126
cradle and a graphite monochromator in the diffracted beam, applying a quasi-parallel
beam geometry and Co-Kα radiation. The Fe 211 reflection was scanned in the range of
95° < 2θ < 105° in steps of 0.08° using a counting time of 25 s per step, at various values
of the specimen-tilt angle ψ. Lattice strains were calculated from the peak position of
the Fe 211 reflection in dependence on ψ. The measured diffractograms of the Fe 211
reflection were evaluated by fitting Pseudo-Voigt functions using a custom peak fit
program which, besides other fit parameters, refines the position of the peak maximum.
For calculation of the stress parallel to the surface, σ
, from the slope, macroscopic
elastic constants ( 1SEν
= − and 21 12
SE
ν+= with ν as the Poisson ratio and E as the
Young’s modulus) were calculated from data for ν and E from [103] for a maraging steel
of grade 350.
5.3.4.4 Glow Discharge Optical Emission Spectroscopy
The elemental concentration-depth profiles were determined with a glow discharge
optical emission spectroscope (GDOES) (electron probe micro-analysis (EPMA) could not
be used due to overlap of the N-Kα line with especially the Co-Lα line; cf. Table 5.1). This
instrument (GDA 650 (Spektruma GmbH)), operated at 30 KV and 15 mA, was equipped
with high-resolution CCD optics. The focal spot was 2.5 mm. Prior to the measurement,
the specimens were electrolytically nickel plated in order to determine an accurate
surface nitrogen-concentration (i.e. to minimize the effect of surface contaminations).
The nickel plating was carried out in a Watts bath at 70 °C and at a voltage of 3.5 V
[104].

Nitriding behaviour of maraging steel: experiments and modelling
127
5.4 Results and discussion
5.4.1 Nitrogen-absorption isotherms
For quantitative determination of the (types of) excess N taken up by nitrided maraging
steel, nitrogen-absorption isotherms were determined for both the solution annealed
condition and the age hardened condition. In order to avoid change in size and
morphology of the nitride (Mo2N; see sections 5.4.2.1 and 5.4.3.1) precipitates during
the course of the absorption-isotherm measurements, the specimens had been pre-
nitrided, to obtain homogeneously through nitrided specimens, at a distinctly higher
temperature (480 °C) than the temperature (440 °C) at which the absorption isotherms
were determined (cf. section 5.3.3). After pre-nitriding (480 °C, 110 h, rN 0.25 atm-1/2) a
saturation level of nitrogen uptake of 2.35 at.% N for the age hardened specimen and
2.32 at.% for the solution annealed specimen was determined. The expected normal
nitrogen uptake [ ] [ ] [ ]( )2
0
normal Mo N α-FeN N N= + after pre-nitriding is 1.78 at.% ([ ]
2Mo NN =
1.64 at.% and [ ]0
α-FeN = 0.14 at.% [9]). Thus, it follows for the total amount of excess
nitrogen: [ ] [ ] [ ]excess total normalN N N= − = 2.35 at.% - 1.78 at.% = 0.57 at% for the age
hardened specimen and [ ]excessN = 0.54 at. % for the solution annealed specimen.
The X-ray diffraction patterns, taken after the nitrogen-absorption isotherm
determinations, (i.e. after pre-nitriding at 480 °C, followed by denitriding at 450 °C and
again nitriding at 440 °C during isotherm determination) show, for both types of
specimen, apart from matrix reflections, reflections from a fcc-type Ni-rich phase
(Fe0.64Ni0.36 (identified according to ICDD card No. 00-047-1405) and also reflections
originating from the Mo2N phase can be discerned (see Fig. 5.1). The formation of the
fcc Fe0.64Ni0.36 phase is the consequence of the dissolution of N as austenite (fcc)
stabilizing element and the removal of the ferrite stabilizing element Mo from the
matrix. This Ni-rich, austenitic phase occurs only after prolonged, excessive heat
treatment (e.g. after nitriding at 500 °C for 72 h and after the cumulative nitriding
experiments performed for a single specimen during nitrogen-absorption isotherm
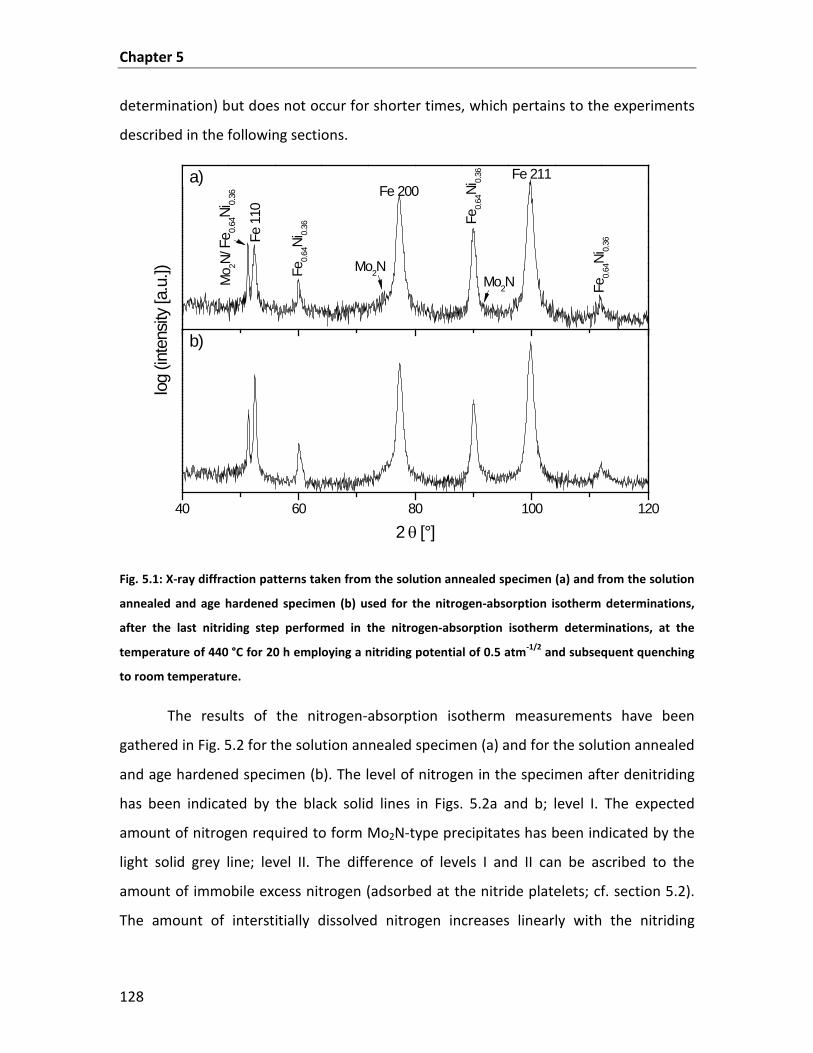
Chapter 5
128
determination) but does not occur for shorter times, which pertains to the experiments
described in the following sections.
40 60 80 100 120
2 θ [°]
b)
log
(inte
nsity
[a.u
.])a)
Mo 2N
/Fe 0.
64Ni
0.36
Fe 1
10
Fe0.
64Ni
0.36
Mo2N
Fe 200
Fe0.
64Ni
0.36
Mo2N
Fe 211
Fe0.
64Ni
0.36
Fig. 5.1: X-ray diffraction patterns taken from the solution annealed specimen (a) and from the solution
annealed and age hardened specimen (b) used for the nitrogen-absorption isotherm determinations,
after the last nitriding step performed in the nitrogen-absorption isotherm determinations, at the
temperature of 440 °C for 20 h employing a nitriding potential of 0.5 atm-1/2 and subsequent quenching
to room temperature.
The results of the nitrogen-absorption isotherm measurements have been
gathered in Fig. 5.2 for the solution annealed specimen (a) and for the solution annealed
and age hardened specimen (b). The level of nitrogen in the specimen after denitriding
has been indicated by the black solid lines in Figs. 5.2a and b; level I. The expected
amount of nitrogen required to form Mo2N-type precipitates has been indicated by the
light solid grey line; level II. The difference of levels I and II can be ascribed to the
amount of immobile excess nitrogen (adsorbed at the nitride platelets; cf. section 5.2).
The amount of interstitially dissolved nitrogen increases linearly with the nitriding
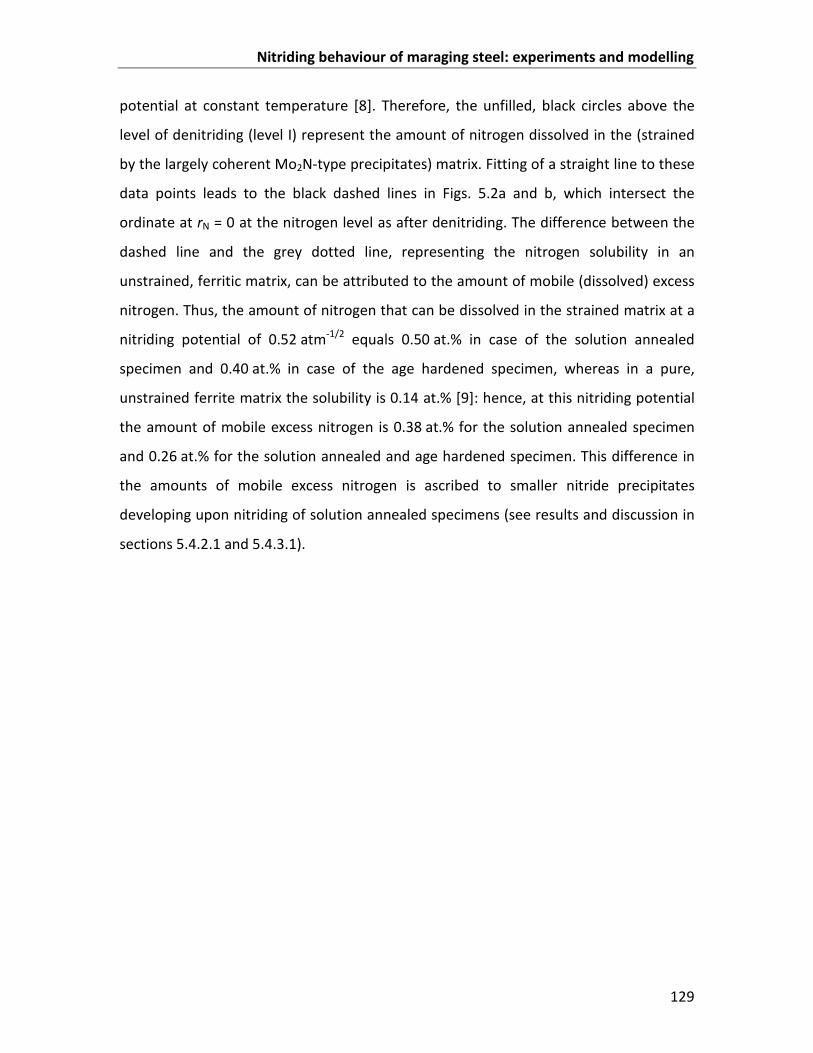
Nitriding behaviour of maraging steel: experiments and modelling
129
potential at constant temperature [8]. Therefore, the unfilled, black circles above the
level of denitriding (level I) represent the amount of nitrogen dissolved in the (strained
by the largely coherent Mo2N-type precipitates) matrix. Fitting of a straight line to these
data points leads to the black dashed lines in Figs. 5.2a and b, which intersect the
ordinate at rN = 0 at the nitrogen level as after denitriding. The difference between the
dashed line and the grey dotted line, representing the nitrogen solubility in an
unstrained, ferritic matrix, can be attributed to the amount of mobile (dissolved) excess
nitrogen. Thus, the amount of nitrogen that can be dissolved in the strained matrix at a
nitriding potential of 0.52 atm-1/2 equals 0.50 at.% in case of the solution annealed
specimen and 0.40 at.% in case of the age hardened specimen, whereas in a pure,
unstrained ferrite matrix the solubility is 0.14 at.% [9]: hence, at this nitriding potential
the amount of mobile excess nitrogen is 0.38 at.% for the solution annealed specimen
and 0.26 at.% for the solution annealed and age hardened specimen. This difference in
the amounts of mobile excess nitrogen is ascribed to smaller nitride precipitates
developing upon nitriding of solution annealed specimens (see results and discussion in
sections 5.4.2.1 and 5.4.3.1).
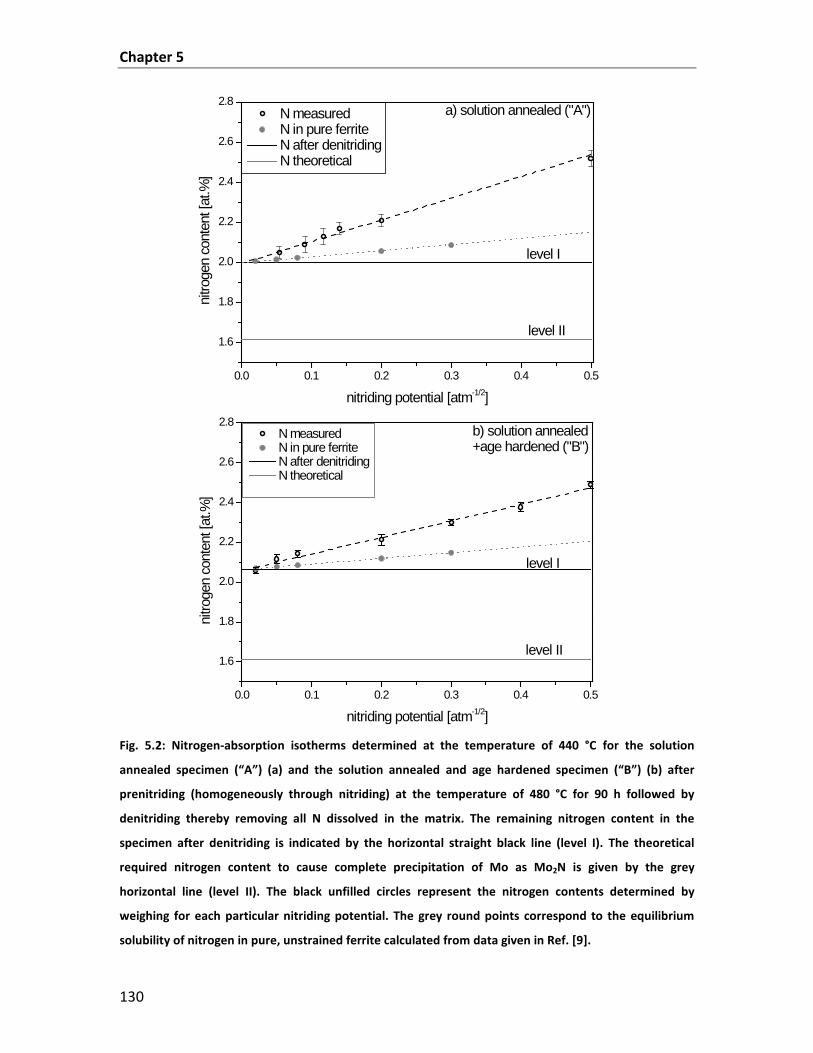
Chapter 5
130
0.0 0.1 0.2 0.3 0.4 0.5
1.6
1.8
2.0
2.2
2.4
2.6
2.8
level I
level II
N measured N in pure ferrite N after denitriding N theoretical
nitro
gen
cont
ent [
at.%
]
nitriding potential [atm-1/2]
a) solution annealed ("A")
0.0 0.1 0.2 0.3 0.4 0.5
1.6
1.8
2.0
2.2
2.4
2.6
2.8 N measured N in pure ferrite N after denitriding N theoretical
nitro
gen
cont
ent [
at.%
]
nitriding potential [atm-1/2]
b) solution annealed+age hardened ("B")
level I
level II
Fig. 5.2: Nitrogen-absorption isotherms determined at the temperature of 440 °C for the solution
annealed specimen (“A”) (a) and the solution annealed and age hardened specimen (“B”) (b) after
prenitriding (homogeneously through nitriding) at the temperature of 480 °C for 90 h followed by
denitriding thereby removing all N dissolved in the matrix. The remaining nitrogen content in the
specimen after denitriding is indicated by the horizontal straight black line (level I). The theoretical
required nitrogen content to cause complete precipitation of Mo as Mo2N is given by the grey
horizontal line (level II). The black unfilled circles represent the nitrogen contents determined by
weighing for each particular nitriding potential. The grey round points correspond to the equilibrium
solubility of nitrogen in pure, unstrained ferrite calculated from data given in Ref. [9].

Nitriding behaviour of maraging steel: experiments and modelling
131
5.4.2 Nitriding of solution annealed maraging steel (specimens “A”)
5.4.2.1 Microstructure
Cross sections of maraging steel specimens nitrided for 4 h with a nitriding potential of
0.5 atm-1/2 at 480 °C and 520 °C are shown in Figs. 5.3a and b. The typical plate-like
microstructure of maraging steels [35, 95] can be seen in the unnitrided core. The
diffusion zone adjacent to the surface (the extent of the diffusion zone has been
indicated with a black dashed line in the figures) shows an etching contrast different
from the unnitrided core. No hints of austenite can be seen in the micrographs, which is
compatible with the XRD phase analysis discussed below (see Fig. 5.7).
Chapter 5
132
Fig. 5.3: LM micrograph of specimens (type “A”) nitrided at (a) the temperature of 480 °C for 4 h and (b)
at the temperature of 520 °C for 4 h, each with a nitriding potential of 0.5 atm-1/2. The extent of the
nitrided zone has been marked with a dashed line.
The surface micro-hardness (measured on the surface) increases initially strongly
with increasing nitriding time until a maximum value of about 1050-1100 HV0.05 is
obtained (Fig. 5.4). The first, very strong hardness increase after a nitriding time of 0.5 h,
from 300 HV0.05 (corresponding to the micro-hardness value of the solution annealed
state) to about 900 HV0.05 (at a nitriding temperature of 460 °C) or to about 1000 HV0.05
(at nitriding temperatures of 480 °C and 520 °C), is ascribed to the precipitation of
Nitriding behaviour of maraging steel: experiments and modelling
133
nitrides and of intermetallic compounds (compare Figs. 5.4 and 5.5). Upon prolonged
nitriding, the micro-hardness decreases due to (over-)aging of the initially largely
coherent precipitates.
The (XRD) surface compressive residual stress ( )11 22σ σ σ= =
evolution as
function of nitriding time for different nitriding temperatures is shown in Fig. 5.6 (at
t = 0, 0σ =
). At all nitriding temperatures, the surface compressive residual stress
increases with increase in nitriding time to a maximum value and then decreases upon
continued nitriding. At 520 °C, a maximum (measured) compressive residual stress of
-460 MPa was reached already after 0.5 h of nitriding, followed by a strong decrease
with increasing nitriding time. This decrease upon continued nitriding is the natural
consequence of the proceeding homogenization of the specimen, supported by
overaging of the formed nitrides and the intermetallic compound particles (cf. Fig. 5.4).
X-ray diffraction phase analysis indicates that after a nitriding time of 0.5 h at 520 °C,
only reflections originating from the matrix can be detected (Fig. 5.7a). In this case,
significant peak broadening, especially of the Fe 200 reflection (Fig. 5.8), occurs
indicating that upon the development of largely coherent nitride precipitates coherent
diffraction of the nitrides with the ferrite matrix can occur [45, 52, 54]: The cubic ferrite
matrix surrounding the nitride precipitate gets tetragonally distorted due to the
occurrence of highly coherent nitride/matrix interface and the large volume misfit
between nitride and matrix. This results in the asymmetric peak broadening (in
particular of 200 peak) as the peaks from cubic and tetragonal ferrite overlap [45]. Upon
increased nitriding time (2 h and 6 h at 520 °C), additional reflections corresponding to
Mo2N emerge (Fig. 5.7b), suggesting that the initially, very fine and coherent Mo2N-type
precipitates, upon continued nitriding, get incoherent, leading to the appearance of
separate precipitate reflections (cf. Figs. 5.7b and a) and associated by decreased
microhardness (Fig. 5.4) and matrix diffraction-line broadening (Fig. 5.8).
It has been shown for binary Fe-Mo alloys that, upon nitriding, the cubic Mo2N-
type nitride precipitates in the early stages of nitriding, which Mo2N precipitates are
subsequently replaced by hexagonal MoN by a discontinuous precipitation reaction [65].

Chapter 5
134
This Mo2N → MoN transition appears to be hindered in the maraging steel (upon
nitriding at comparatively low temperature), likely as a consequence of grain-boundary
pinning by the presence of small (intermetallic) precipitates.
0 1 2 3 4 5 6200
800
1000
1200 460 °C 480 °C 520 °C
surfa
ce h
ardn
ess
[HV0
.05]
nitriding time [h]
Fig. 5.4: Surface hardness as function of nitriding time for the specimens (type “A”) nitrided at different
temperatures (460 °C, 480 °C and 520 °C) employing a nitriding potential of 0.5 atm-1/2. Hardness values
indicated at 0 h of nitriding correspond to the hardness of the unnitrided specimen.
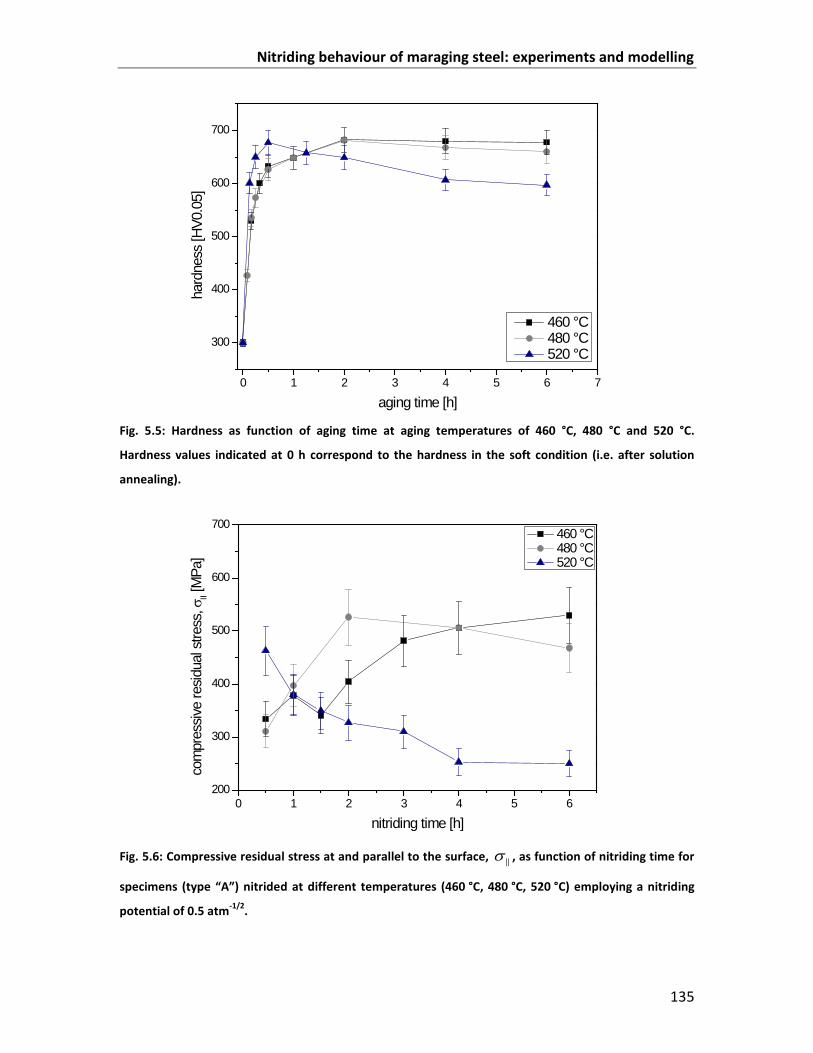
Nitriding behaviour of maraging steel: experiments and modelling
135
0 1 2 3 4 5 6 7
300
400
500
600
700
hard
ness
[HV0
.05]
aging time [h]
460 °C 480 °C 520 °C
Fig. 5.5: Hardness as function of aging time at aging temperatures of 460 °C, 480 °C and 520 °C.
Hardness values indicated at 0 h correspond to the hardness in the soft condition (i.e. after solution
annealing).
0 1 2 3 4 5 6200
300
400
500
600
700 460 °C 480 °C 520 °C
com
pres
sive
resid
ual s
tress
, σII [
MPa
]
nitriding time [h]
Fig. 5.6: Compressive residual stress at and parallel to the surface, σ
, as function of nitriding time for
specimens (type “A”) nitrided at different temperatures (460 °C, 480 °C, 520 °C) employing a nitriding
potential of 0.5 atm-1/2.
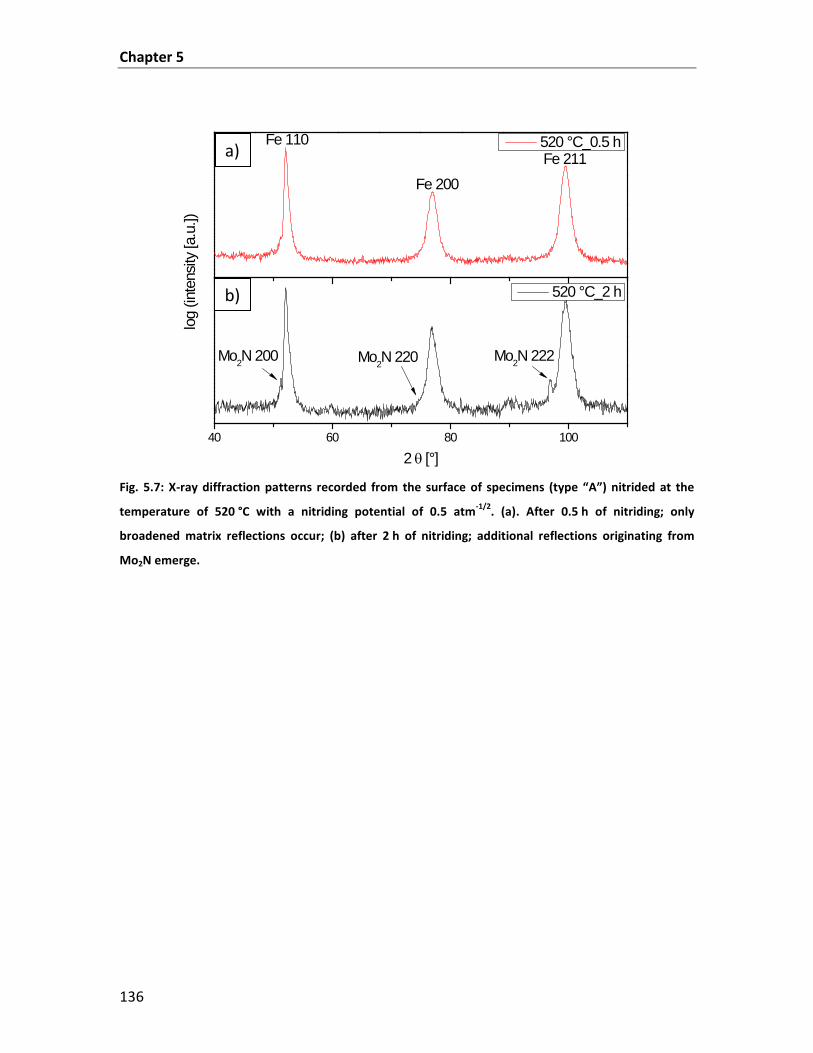
Chapter 5
136
40 60 80 100
Mo2N 220 Mo2N 222Mo2N 200
log
(inte
nsity
[a.u
.])
2 θ [°]
520 °C_2 h
Fe 211Fe 200
520 °C_0.5 hFe 110
Fig. 5.7: X-ray diffraction patterns recorded from the surface of specimens (type “A”) nitrided at the
temperature of 520 °C with a nitriding potential of 0.5 atm-1/2. (a). After 0.5 h of nitriding; only
broadened matrix reflections occur; (b) after 2 h of nitriding; additional reflections originating from
Mo2N emerge.
a)
b)
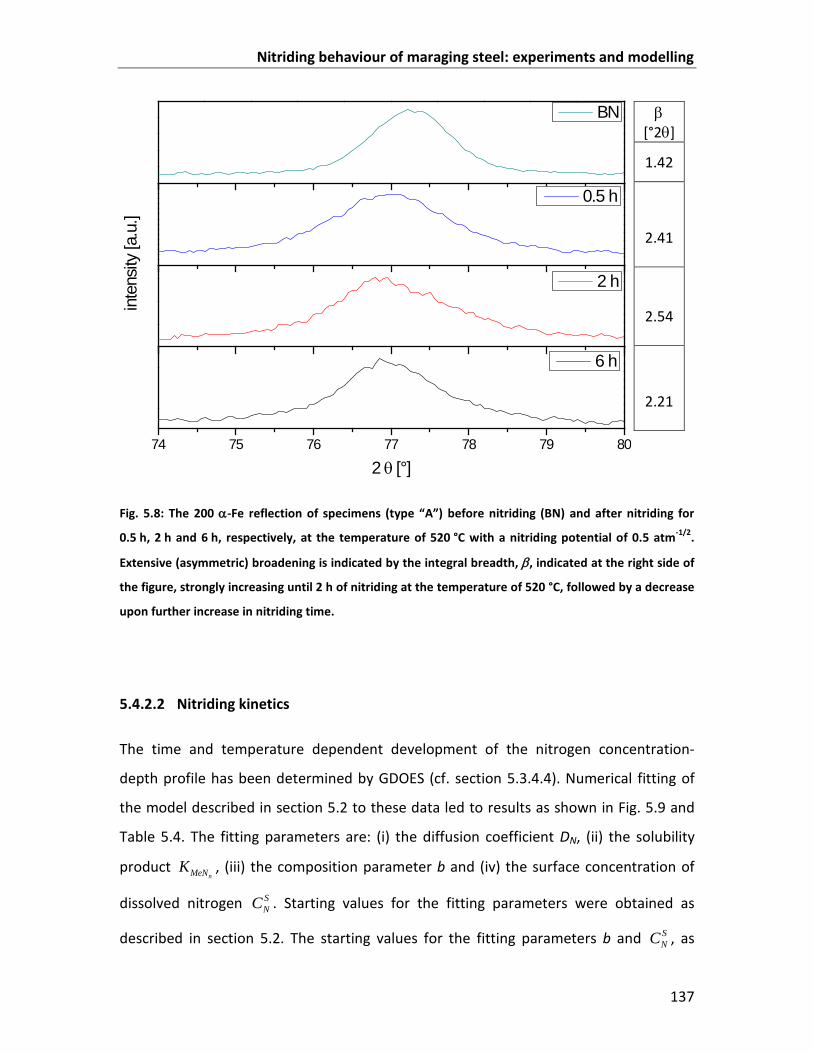
Nitriding behaviour of maraging steel: experiments and modelling
137
74 75 76 77 78 79 80
2 θ [°]
6 h
inte
nsity
[a.u
.]
2 h
0.5 h
BN
Fig. 5.8: The 200 α-Fe reflection of specimens (type “A”) before nitriding (BN) and after nitriding for
0.5 h, 2 h and 6 h, respectively, at the temperature of 520 °C with a nitriding potential of 0.5 atm-1/2.
Extensive (asymmetric) broadening is indicated by the integral breadth, β, indicated at the right side of
the figure, strongly increasing until 2 h of nitriding at the temperature of 520 °C, followed by a decrease
upon further increase in nitriding time.
5.4.2.2 Nitriding kinetics
The time and temperature dependent development of the nitrogen concentration-
depth profile has been determined by GDOES (cf. section 5.3.4.4). Numerical fitting of
the model described in section 5.2 to these data led to results as shown in Fig. 5.9 and
Table 5.4. The fitting parameters are: (i) the diffusion coefficient DN, (ii) the solubility
product nMeNK , (iii) the composition parameter b and (iv) the surface concentration of
dissolved nitrogen SNC . Starting values for the fitting parameters were obtained as
described in section 5.2. The starting values for the fitting parameters b and SNC , as
β [°2θ]
1.42
2.41
2.54
2.21
Chapter 5
138
obtained from the absorption isotherm, were b = 0.6 and 0.52SNC = at.% (see sec. 5.4.1).
Comparing these values with the final values obtained by fitting, it strikes that the fitted
value for b is significantly larger than that determined from the absorption isotherm (0.6
vs. 0.8). This could be explained with smaller nitride precipitates developing in the
beginning of nitriding of the specimens pertaining to Fig. 5.9, whereas the specimen
used for the determination of the nitrogen-absorption isotherm was prenitrided for a
long time (110 h at 480 °C) which can bring about some coarsening; the larger the
interfacial area the higher the amount of immobile, adsorbed (at the interfaces between
nitride particle and matrix) nitrogen and thus the larger the value of b.
The model was fitted to simultaneously two to three nitrogen concentration-
depth profiles, i.e. for two to three different nitriding times for each temperature, with,
for each temperature, as fit parameters: constant b, constant matrixND and constant
nMeNK and variable SNC . Results are shown in Fig. 5.9.
Within experimental accuracy, the model calculated nitrogen concentration-
depth profiles fit very well to the experimentally determined ones. The resulting, refined
values for (the fit parameters and) the excess N quantities as derived from the refined fit
parameters ((i) the difference between sNc and [ ]0
FeN
α −, i.e. the mobile excess N,
[ ]strain
matrixN , and (ii) the difference between b and n, i.e. the immobile excess N) have been
gathered in Table 5.4. Here, it is assumed that local equilibrium prevails at the surface
and that in the surface region all Mo has precipitated as nitride. Indeed, the total
surface nitrogen content does not increase after 2 h of nitriding at 460 °C.
The amount of mobile, dissolved excess N, [ ]strain
matrixN , decreases significantly with
increasing nitriding temperature. This can be attributed to the partial loss of coherency
(relaxation of misfit strain) of the nitride precipitates by coarsening upon increasing
temperature. Evidently, coarsening involves decrease of the amount of nitride/matrix
interfacial area and thus also the immobile (adsorbed at the nitride/matrix interface)
excess N content is expected to decrease with increasing temperature, as observed (see
Table 5.4).
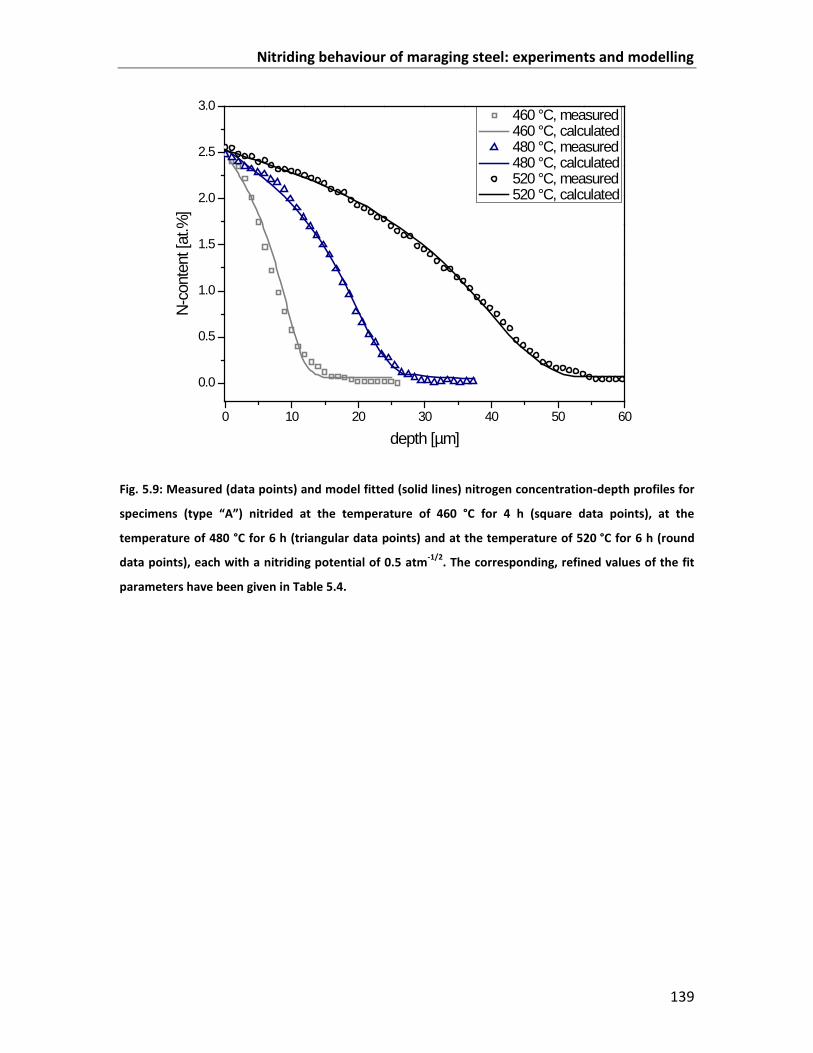
Nitriding behaviour of maraging steel: experiments and modelling
139
0 10 20 30 40 50 60
0.0
0.5
1.0
1.5
2.0
2.5
3.0 460 °C, measured 460 °C, calculated 480 °C, measured 480 °C, calculated 520 °C, measured 520 °C, calculated
N-co
nten
t [at
.%]
depth [µm]
Fig. 5.9: Measured (data points) and model fitted (solid lines) nitrogen concentration-depth profiles for
specimens (type “A”) nitrided at the temperature of 460 °C for 4 h (square data points), at the
temperature of 480 °C for 6 h (triangular data points) and at the temperature of 520 °C for 6 h (round
data points), each with a nitriding potential of 0.5 atm-1/2. The corresponding, refined values of the fit
parameters have been given in Table 5.4.

Chapter 5
140
Table 5.4: The refined values of the fit parameters of the model fitted to the measured nitrogen
concentration-depth profiles and the excess N quantities derived from these fit parameters, for the
specimens (type “A”) nitrided at different temperatures.
tempera-
ture [°C]
fitting parameters
[ ]o
FeN
α −
[at.%]1
excess nitrogen at the
surface
[ ]interfaceN[at.%]
[ ]strain
matrixN[at.%]
total
[at.%] SNC
[at.%] b
nMeNK [(atoms)3/2 ⋅
nm-9/2]
matrixND
[m2s-1]
460 0.56 0.82 0.1011 1.4 ⋅ 10-14 0.14 1.05 0.42 1.47
480 0.54 0.80 0.0934 4.0 ⋅ 10-14 0.17 0.98 0.37 1.35
520 0.52 0.78 0.0895 15.5 ⋅ 10-14 0.26 0.92 0.26 1.18
1 the maximum solubility of nitrogen in ferrite, [ ]o
FeN
α −, at the corresponding nitriding
temperature, as calculated from data in Ref. [9].
The values found for the (effective) diffusion coefficient of nitrogen in the maraging
steel matrix are much lower than those for the diffusion of nitrogen in a pure α-Fe
(ferrite) matrix [74]. This effect may be discussed as follows:
(i) The presence of nitride particles and intermetallic phase particles could act
as obstacles for nitrogen diffusion (“labyrinth-effect” [105]). This effective
decrease of the diffusion coefficient will be more pronounced at a lower
nitriding temperature due to the generally smaller size of the nitride
precipitate particles and the corresponding more homogeneous distribution
of precipitate phase.
(ii) A successive “trapping, de-trapping and re-trapping” effect of nitrogen in Fe-
Me-N configurations could occur (i.e. without that direct formation of MeNn
nitride takes place), especially in the case/core transition zone where not all
Mo has already precipitated as nitride. This effect, as described in Ref. [24,

Nitriding behaviour of maraging steel: experiments and modelling
141
106], leads to an effective reduction of the diffusion coefficient as nitrogen is
temporarily immobilised.
5.4.3 Nitriding of age-hardened maraging steel (specimens “B”)
5.4.3.1 Microstructure
Specimens of type “B” were age hardened (to maximum hardness; see Fig. 5.5) for 2 h at
480 °C prior to nitriding. Thus, no further increase in precipitated volume fraction of
intermetallic phases is expected to occur.
Cross sections of maraging steel specimens nitrided for 7 h and 17 h,
respectively, with a nitriding potential of 0.5 atm-1/2 at 440 °C are shown in Figs. 5.10a
and b. The typical plate-like microstructure of maraging steels [35, 95] can be seen in
the unnitrided core. The diffusion zone adjacent to the surface (the extent of the
diffusion zone has been indicated with a black dashed line in the figures) shows an
etching contrast different from the unnitrided core. No hints of austenite can be seen in
the micrographs, which is compatible with the XRD phase analysis discussed below (see
Fig. 5.13).
In the light optical micrographs (Figs. 5.10a and b) no difference in the
microstructure of the unnitrided core of the age hardened specimen can be observed as
compared to that of the only solution annealed specimen (Figs. 5.3a and b).

Chapter 5
142
Fig. 5.10: LM-micrographs of specimens (type “B”) after a nitriding time of (a) 7 h and (b) 17 h, at the
temperature of 440 °C and rN = 0.5 atm-1/2. The extent of the nitrided zone has been marked with a
dashed line.
Due to the preceding age-hardening treatment no (further) precipitation of
intermetallic compound is expected upon nitriding. The precipitation of nitrides upon
nitriding at 440 °C is strongly time-dependent, as indicated by the continuous increase in
surface hardness and in compressive residual surface stress (Figs. 5.11 and 5.12). The
maximum surface hardness (950 HV) is reached after a nitriding time of 17 h. Similar to

Nitriding behaviour of maraging steel: experiments and modelling
143
the specimens nitrided in the solution annealed condition (cf. Fig. 5.4), prolonged
nitriding leads to decrease of the surface hardness due to nitride-particle coarsening
and coherency loss (Fig. 5.11; cf. section 5.4.2.1). The acceleration observed in hardness
increase and surface stress increase after the first few hours of nitriding at 440 °C
suggests that then distinct nitride precipitation takes place. The (initial) dissolution of
nitrogen in a ferrite matrix already leads to an increase in hardness of about 100 HV by
solid solution strengthening [81] and also leads to the development of moderate
compressive residual stresses in the surface region [107].
0 5 10 15 20600
650
700
750
800
850
900
950
1000
surfa
ce h
ardn
ess
[HV0
.05]
nitriding time [h]
Fig. 5.11: Surface microhardness as function of nitriding time for specimens (type “B”) nitrided at the
temperature of 440 °C employing a nitriding potential of 0.5 atm-1/2.
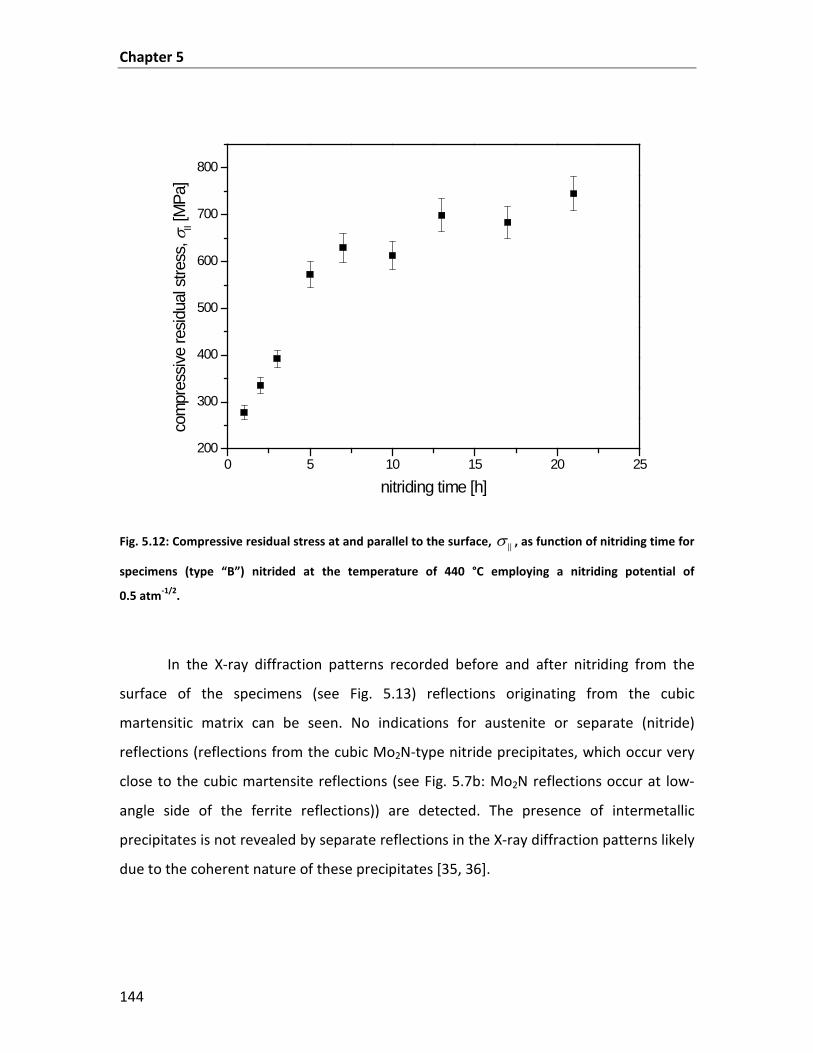
Chapter 5
144
Fig. 5.12: Compressive residual stress at and parallel to the surface, σ
, as function of nitriding time for
specimens (type “B”) nitrided at the temperature of 440 °C employing a nitriding potential of
0.5 atm-1/2.
In the X-ray diffraction patterns recorded before and after nitriding from the
surface of the specimens (see Fig. 5.13) reflections originating from the cubic
martensitic matrix can be seen. No indications for austenite or separate (nitride)
reflections (reflections from the cubic Mo2N-type nitride precipitates, which occur very
close to the cubic martensite reflections (see Fig. 5.7b: Mo2N reflections occur at low-
angle side of the ferrite reflections)) are detected. The presence of intermetallic
precipitates is not revealed by separate reflections in the X-ray diffraction patterns likely
due to the coherent nature of these precipitates [35, 36].
0 5 10 15 20 25200
300
400
500
600
700
800co
mpr
essiv
e re
sidua
l stre
ss, σ
II [M
Pa]
nitriding time [h]

Nitriding behaviour of maraging steel: experiments and modelling
145
Because the nitride forming element, Mo, is incorporated in intermetallic
precipitates at the beginning of the nitriding of the age hardened specimens (“B”), the
formation of nitride precipitates requires more time (at the same nitriding temperature)
than in case of nitriding the solution annealed specimens (“A”) which obstructs
identification of separate nitride reflections in the X-ray diffraction patterns in an early
stage of nitriding (cf. Fig. 5.13); an intensity hump at the lower 2θ side of the ferrite
reflections hints at the presence of reflections from Mo2N-type precipitates (see arrows
after a nitriding time of 21 h in Fig. 5.13).
Upon nitriding strong broadening of the matrix reflections occurs, indicated by
increasing values of the integral breadth, β, as shown in Fig. 5.14 (note that the value of
β for the unnitrided specimens “B” is smaller than for unnitrided specimens “A” (1.14°2θ
vs. 1.42°2θ, cf. Figs. 5.14 and 5.8): the age hardening applied for specimens “B” leads to
pronounced reduction of the crystal imperfection inherent to the cubic martensite
microstructure resulting by quenching after the solution annealing. This broadening is,
especially in the early stages of nitriding, accompanied with a strong asymmetry of the
200 reflection, (see Fig. 5.14), which hints at the precipitation of submicroscopical
Mo2N-type nitrides, diffracting coherently with the matrix, as observed upon nitriding of
binary Fe-Mo alloy [65] and as discussed for the nitrided solution annealed specimens in
section 5.4.2.1.
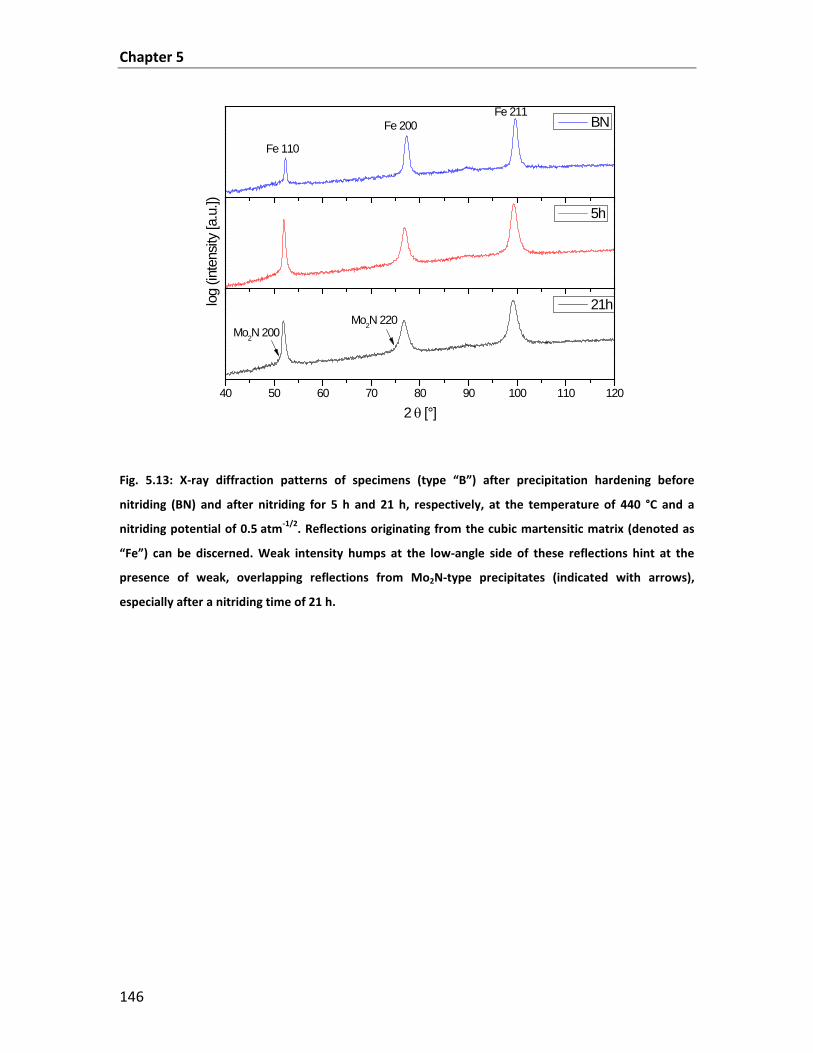
Chapter 5
146
40 50 60 70 80 90 100 110 120
Mo2N 200
2 θ [°]
21hlog
(inte
nsity
[a.u
.]) 5h
BN
Fe 110
Fe 200Fe 211
Mo2N 220
Fig. 5.13: X-ray diffraction patterns of specimens (type “B”) after precipitation hardening before
nitriding (BN) and after nitriding for 5 h and 21 h, respectively, at the temperature of 440 °C and a
nitriding potential of 0.5 atm-1/2. Reflections originating from the cubic martensitic matrix (denoted as
“Fe”) can be discerned. Weak intensity humps at the low-angle side of these reflections hint at the
presence of weak, overlapping reflections from Mo2N-type precipitates (indicated with arrows),
especially after a nitriding time of 21 h.
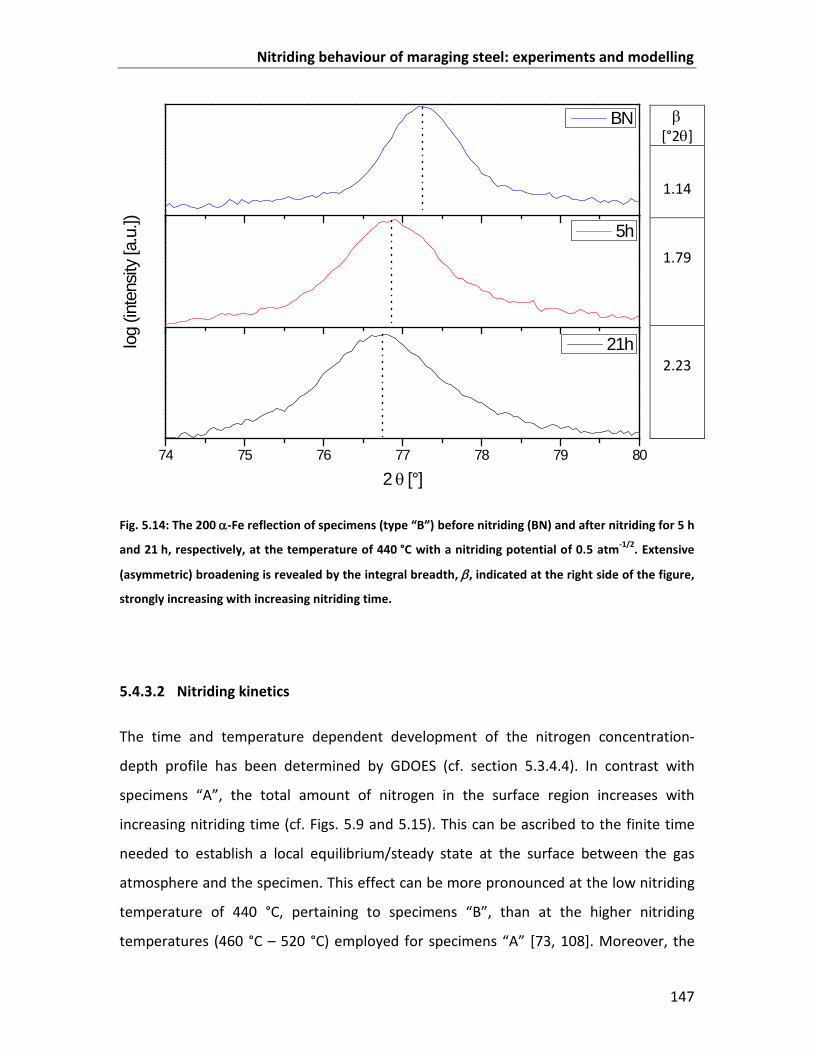
Nitriding behaviour of maraging steel: experiments and modelling
147
74 75 76 77 78 79 80
2 θ [°]
21hlog
(inte
nsity
[a.u
.]) 5h
BN
Fig. 5.14: The 200 α-Fe reflection of specimens (type “B”) before nitriding (BN) and after nitriding for 5 h
and 21 h, respectively, at the temperature of 440 °C with a nitriding potential of 0.5 atm-1/2. Extensive
(asymmetric) broadening is revealed by the integral breadth, β, indicated at the right side of the figure,
strongly increasing with increasing nitriding time.
5.4.3.2 Nitriding kinetics
The time and temperature dependent development of the nitrogen concentration-
depth profile has been determined by GDOES (cf. section 5.3.4.4). In contrast with
specimens “A”, the total amount of nitrogen in the surface region increases with
increasing nitriding time (cf. Figs. 5.9 and 5.15). This can be ascribed to the finite time
needed to establish a local equilibrium/steady state at the surface between the gas
atmosphere and the specimen. This effect can be more pronounced at the low nitriding
temperature of 440 °C, pertaining to specimens “B”, than at the higher nitriding
temperatures (460 °C – 520 °C) employed for specimens “A” [73, 108]. Moreover, the
β [°2θ]
1.14
1.79
2.23

Chapter 5
148
much slower precipitation of Mo-nitride in case of specimens “B” (where Mo initially is
incorporated in intermetallic particles after the age hardening) can contribute to a more
gradual increase of the total nitrogen concentration at the surface.
Numerical fitting of the model described in section 5.2 to these data led to
results as shown in Fig. 5.15. Starting values for the fitting parameters were obtained as
follows. From the absorption-isotherm measurements (see sec. 5.4.1): b (0.63) and SNC
(for the longest nitriding time: 0.40 at.%; for the shorter nitriding time the solubility of
pure, unstrained ferrite (0.14 at.% as given in Ref. [9]). The starting value for the
diffusion coefficient of nitrogen was obtained by fitting the crude model according to
Eq. (5.1) to the experimentally obtained data (diffusion layer thickness as function of
nitriding time). As initial value for the solubility product, thermodynamic data for the
Gibbs energy of formation of Mo2N from [109] were taken to estimate the solubility
product according to [101]. The solubility product, the composition parameter b and the
diffusion coefficient should, at constant temperature, not depend on nitriding time.
Therefore, the model was fitted to simultaneously the three nitrogen concentration-
depth profiles shown in Fig. 5.15 with as fit parameters: constant b, constant matrixND
and constant nMeNK and variable S
NC (one for each nitriding time). The resulting values
for the fit parameters have been gathered in Table 5.5. Within experimental accuracy,
the fitted nitrogen concentration-depth profiles agree well with the experimentally
determined nitrogen concentration-depth profiles.
After the shortest nitriding time of 3 h (Fig. 5.15), the corresponding equilibrium
solubility of nitrogen in an unstrained ferrite matrix (corresponding to 0.14 at.% for
these nitriding conditions, [9]) has already been surpassed but the equilibrium solubility
of nitrogen in maraging steel, as determined from the absorption isotherm (0.40 at.%,
cf. section 5.4.1), has not been attained yet. This equilibrium level of (dissolved and also
total amount of) nitrogen for this particular temperature is reached at the surface of the
specimen after a nitriding time of 17 h (see also hardness data in Fig. 5.11). Hence, for
this nitriding time, the values for SNC and b can be utilized to calculate the amounts of

Nitriding behaviour of maraging steel: experiments and modelling
149
mobile and immobile excess nitrogen (see also Table 5.5). The result implies a large
amount of mobile excess nitrogen (0.26 at.%; cf. section 5.4.1), dissolved in the strained
matrix. The occurrence of immobile excess nitrogen (i.e. nitrogen adsorbed at the
precipitate/matrix interface) is confirmed by the composition parameter b, which is
noticeably larger than 1/2. Comparing the composition parameter, b, of specimens “A”
with specimens “B”, it follows that the amount of immobile excess nitrogen is much
higher in case of nitriding solution annealed specimens (“A”), suggesting that, upon
nitriding specimens “A”, smaller, coherent nitride precipitates develop giving rise to a
higher amount of interfacially adsorbed nitrogen. This statement is also supported by
the higher hardness values reached after nitriding of specimens “A” as compared to
specimens “B” (compare Figs. 5.4 and Fig. 5.11).
0 10 20 30 40 50
0.0
0.5
1.0
1.5
2.0
2.5
3.0 3 h measured 3 h calculated 5 h measured 5 h calculated 17 h measured 17 h calculated
nitro
gen
cont
ent [
at.%
]
depth [µm]
Fig. 5.15: Measured and model fitted (solid line) nitrogen concentration-depth profiles for the specimen
(type “B”) nitrided at the temperature of 440 °C for 3 h (square data points), for 5 h (triangle data
points) and for 17 h (round data points), each with a nitriding potential of 0.5 atm-1/2. The
corresponding refined values of the fit parameters are given in Table 5.5.

Chapter 5
150
Table 5.5: The refined values of the fit parameters of the model fitted to the measured nitrogen
concentration-depth profiles and the excess N quantities derived from these fit parameters, for the
specimens (type “B”) nitrided at the temperature of 440 °C for different times.
nitri-
ding
time
[h]
fitting parameters
[ ]o
FeN
α −
[at.%]1
excess nitrogen at the
surface
[ ]interfaceN[at.%]
mobile
[at.%]
total
[at.%] SNC
[at.%] b
nMeNK
[(atoms)3/2 ⋅
nm-9/2]
matrixND
[m2s-1]
3 0.23 0.63 0.35 1.18 ⋅ 10-14 0.14 - - -
5 0.3 0.63 0.35 1.18 ⋅ 10-14 0.14 - - -
17 0.4 0.63 0.35 1.18 ⋅ 10-14 0.14 0.45 0.26 0.71
1 the maximum solubility of nitrogen in ferrite, [ ]o
FeN
α −, at the corresponding nitriding temperature, as
calculated from data in Ref. [9].

Nitriding behaviour of maraging steel: experiments and modelling
151
5.5 Final remarks on the difference in nitriding response of solution annealed (“A”) and age-hardened (“B”) specimens
It has to be recognized that in age hardened specimens (“B”), prior to nitriding, all Mo
has precipitated as intermetallic compound (age hardening conditions prior to nitriding
had been chosen such that maximum hardness achievable by aging was reached [35,
36]), whereas in the solution annealed specimens all Mo is dissolved in the cubic,
martensite matrix. This results in a higher hardness before nitriding for the age
hardened specimens (650 HV0.05 vs. 300 HV0.05; cf. Figs. 5.4 and 5.11).
As consequence, upon nitriding the solution annealed specimens (“A”) and as
compared to the age hardened specimens (“B”) (i) a larger hardness increase and a
higher hardness are obtained for specimens “A” upon nitriding and (ii) higher amounts
of excess nitrogen (both mobile and immobile) occur for specimens “A” (cf. Table 5.5
and Table 5.4). This can be discussed as follows. Upon nitriding specimens “A” a higher
amount of Mo nitride can precipitate in the early stage of nitriding as all Mo is initially
dissolved in the matrix. Even after nitrogen saturation has been realized at the surface
for specimens “B” (likely after about 17 h at 440 °C; see Fig. 5.11), this maximum
hardness is lower than the maximum hardness for specimens “A” (see Fig. 5.4). This
indicates that the nitride precipitates in specimens “A” are smaller and likely largely
coherent with the matrix (cf. section 5.4.2.1).
Chapter 5
152
5.6 Conclusions
The nitriding behaviour of Mo-containing maraging steel can be summarized as follows:
- Upon nitriding, largely coherent Mo2N-type nitrides develop, surrounded by a
tetragonally distorted matrix. These nitrides cause a strong increase in hardness.
- The development of the nitrogen concentration-depth profiles in maraging steel
upon nitriding can be successfully modelled with a combined diffusion and
precipitation kinetic model, provided that the role of excess nitrogen is
recognized. The model employs the following fit parameters: the composition
parameter of the nitride (expressing the presence of immobile, i.e. adsorbed
excess nitrogen at the nitride/matrix interface), the solubility of nitrogen in the
matrix (recognizing the presence of mobile, i.e. additionally in the strained
matrix, dissolved excess nitrogen), the diffusion coefficient of nitrogen in the
matrix and the solubility product of the nitride precipitates.
- Nitrogen-absorption isotherms determined for the maraging steel allowed
distinction of the different kinds of (excess-) nitrogen taken up and thus provided
starting values of the fitting parameters for the kinetic model.
- The diffusion coefficient of nitrogen in the maraging steel matrix is much lower
than for nitrogen diffusion in pure ferrite. This may be ascribed to the
microstructure of the maraging steel (trapping, de-trapping and re-trapping of
nitrogen at e.g. lattice defects) and the occurrence of a labyrinth-effect due to
precipitated particles.
- Nitriding kinetics are faster in the only solution annealed specimens in
association with rapid saturation of the total amount of nitrogen in the surface
region. In case of the age hardened specimens a more gradually preceding
nitriding reaction takes place due to the necessary preceding dissolution of the
intermetallic compound particles in favour of the developing nitride particles.
- The amounts of (mobile and immobile) excess nitrogen taken up are much larger
in case of the solution annealed specimens indicating the occurrence of finer and
more coherent nitride platelets, than in case of the age hardened specimens.
Nitriding behaviour of maraging steel: experiments and modelling
153
- In view of technological application, nitriding of maraging steels can best be
applied without application of a prior age hardening treatment: distinctly more
nitrogen is taken up more rapidly and a higher hardness is obtained.
5.7 Acknowledgement
We are grateful to Dr. K.S. Jung and Dipl.-Ing. B. Rheingans for helpful discussions and to
Dipl.-Ing. P. Kress (all with the Max Planck Institute for Intelligent Systems) for assistance
with the nitriding experiments.

154

155
CHAPTER 6
6 Summary
6.1 Introduction
Gaseous nitriding is a very powerful tool to improve the surface mechanical (fatigue and
wear) and chemical (corrosion resistance) properties of iron-based workpieces and
steels. Among the technologically important thermochemical surface heat treatments,
such as carburizing, nitrocarburizing and nitriding, which can be carried out in liquid (salt
bath), plasma or gaseous environments, gas nitriding is the most often applied
treatment because of its unique controllability. The desired microstructure and
therefore the resulting surface properties of a material can be precisely set and
controlled upon gaseous nitriding.
Gas nitriding is usually carried out at temperatures ranging from 400 – 580 °C in
ammonia/hydrogen gas mixtures. At these temperatures, ammonia dissociates
catalytically at the surface of the workpiece and atomic nitrogen diffuses into the
surface of the ferrite matrix. Depending on the nitriding conditions, such as temperature
and nitriding potential rN, which is defined as the ratio of the partial pressures of
ammonia and hydrogen ( )( )
3N 3/2
2
NHH
pr
p
=
, different phases can be formed at the surface
of the workpiece, according to the Fe-N phase diagram: α-Fe (with nitrogen dissolved in
the octahedral interstices of the matrix), and the iron nitrides γ’-Fe4N1-x and ε-Fe3N1+y (in
this order with increasing nitrogen content). The formation of iron nitrides at the
surface leads to the development of a so-called compound layer which largely influences
the resistance to wear and corrosion. Beneath the compound layer, nitride forming
alloying elements can precipitate as nitrides in the so-called diffusion zone, which has a
strong influence on the fatigue behaviour.
Chapter 6
156
Despite its wide adoption in industry, fundamental research about the nitriding process
is still needed as the application of this technique in industry is often based on
phenomenology and experience.
Fundamental investigations have been carried out extensively for binary iron-
based alloys containing relatively strong nitride formers such as Ti and V. However,
there is still a great scientific and industrial interest in gaining detailed understanding of
nitriding binary iron-based alloys, especially for relatively weak nitride formers (such as
Mo, W, Si), as these systems are not very well understood. The literature results, if at all
available, often contradict each other, especially in case of molybdenum.
The present thesis focuses on the nitriding behaviour of binary Mo-containing
iron-based alloys and, with the thus gained insight, on the nitriding behaviour of a Mo-
containing maraging steel.
6.2 Experimental
The Fe-Mo alloys were prepared by melting appropriate amounts of pure Fe and Mo in a
protective argon gas atmosphere in an inductive furnace. The melts were cast in a
copper mould to obtain cylindrical rods (Ø: 10 mm, l: 100 mm). The chemical
composition and the amount of impurities were determined by chemical analysis
(inductively coupled plasma - optical emission spectroscopy (for Mo); combustion
method (for C and S) and carrier gas hot extraction (for O and N)). The ingots were cold
rolled to sheets, out of which rectangular specimen were cut. These specimens were
then mechanically ground and polished (last polishing step: 1 µm diamond suspension).
The polished specimen were encapsulated in a quartz tube filled with argon and then
subsequently heat treated at 800 °C for 1.5 h in a muffle furnace to achieve
recrystallization of the cold deformed microstructure.
The commercially available maraging steel sheet was supplied by Imphy alloys, Arcelor
Group, France. Out of these sheets, rectangular specimens were cut and prepared in the
same way as the binary Fe-Mo specimens. After polishing, the specimens were solution
annealed at 880 °C for 0.5 h.
Summary
157
Before nitriding, the specimen were polished (final step: 1 µm diamond
suspension) and cleaned ultrasonically with ethanol.
6.3 Nitriding
Nitriding was performed in a multizone quartz-tube furnace with an ammonia/hydrogen
gas mixture at different temperatures from 440 °C to 580 °C (constancy of
temperature: ±1 °C). The gas fluxes were adjusted by mass-flow controllers and the total
gas flow (500 ml/min) was set such that the linear gas flow was sufficient to avoid any
significant thermal decomposition of ammonia in the nitriding atmosphere.
6.4 Specimen characterization
For light microscopic investigations, cross-sections were prepared (ground and polished)
and etched with Nital (2 vol.-%).
Microhardness measurements on polished (unechted) cross-sections were
carried out before and after nitriding employing a Vickers microhardness tester.
Phase analysis by means of X-ray diffraction was performed for all specimens
before and after nitriding. Identification of the detected phases was conducted by
comparing the 2 θ peak positions of the phases with reference data.
To determine the residual stresses, the conventional sin2ψ-method was applied.
In case of specimens exhibiting a remaining fibre-texture after recrystallization, the
crystallite group method was applied for the determination of the residual stress.
The structure and morphology of the nitride precipitates were investigated by
transmission electron microscopy (TEM). TEM specimens were prepared at selected
depths of the nitrided zone by grinding mechanically, dimpling and Ar-ion milling. Bright
field image (BF), dark field image (DF) and selected area diffraction patterns (SADPs)
were taken to determine the crystal structure and morphology of the formed nitride
precipitates.
Chapter 6
158
Elemental concentration-depth profiles were revealed by electron probe
microanalysis (EPMA) performed on polished cross-sections perpendicular to the
surface, or by glow discharge optical emission spectroscopy (GDOES).
For quantitative analysis of excess nitrogen uptake (i.e. nitrogen adsorbed at the
precipitate/matrix interface and additionally dissolved in the strained matrix due to
alloying element nitride precipitation), nitrogen absorption isotherms were determined.
To this end, thin foils were homogeneously through nitrided and subsequently
denitrided. The nitrogen uptake at constant temperature applying different nitriding
potentials was followed by weight gain measurements.
6.5 Results
6.5.1 Molybdenum-nitride precipitation in recrystallized and cold rolled
Fe-1at.% Mo alloy
Upon nitriding Fe-1at.% Mo alloy under conditions such that no compound layer can be
formed at the surface, cubic Mo2N-type precipitates develop as platelets of several
hundreds of nm length and thickness of a few atomic layers occurs according to a Bain-
type orientation relationship. In case of the recrystallized specimens the platelets are
largely coherent (diffracting coherently with the matrix) giving rise to strongly
asymmetric ferrite-matrix diffraction peaks. In case of the cold rolled specimens
development of the Mo2N-type precipitation occurs much earlier and the nitride
platelets are at least partially incoherent (giving rise to separate nitride reflections in the
diffraction patterns). Upon prolonged treatment a discontinuous precipitation reaction
initiating at ferrite-matrix grain boundaries takes place replacing the submicroscopical
Mo2N-type platelets by a lamellar α-Fe/MoN (hexagonal crystal structure)
microstructure with a Burgers-type orientation relationship, involving parallelism of
close packed planes in both phases. In case of the recrystallized specimens the
discontinuous precipitation reaction eventually brings about a full transformation of
Mo2N-type precipitates to MoN-type precipitates. In case of the cold rolled specimens
Summary
159
the Mo2N → MoN transformation occurs only partially: the driving force for the
discontinuous precipitation reaction is much smaller in case of the cold rolled specimen
(much less (misfit-) strain energy and nitrogen supersaturation).
The discontinuous transformation leads to a pronounced increase in the nitrogen
concentration upon transformation due to the change in stoichiometry (Mo2N → MoN).
The composition analysis of the Mo2N-type nitrides (submicroscopical) and of the MoN-
type nitrides (lamellae) suggests no incorporation of significant amounts of Fe in the
nitrides.
6.5.2 Defect-dependent nitride surface-layer development upon
nitriding of Fe-1at.% Mo alloys
The defect density of iron-based Fe-Me alloy, with Me as an (effectively) weak nitride
former (e.g. Me = Mo), has a dramatic effect on the constitution and morphology of the
iron-nitride based compound layer developing upon nitriding. This is described in the
following.
Upon nitriding cold rolled Fe-1at.%Mo alloy immediate precipitation of Mo2N
(dislocation facilitated nucleation) occurs, leading to a low nitrogen supersaturation of
the ferrite matrix. γ’ nucleates (only) at the surface resulting in the development of a
compact layer of γ’, incorporating (by overrunning the formed) Mo2N particles. The γ’
layer growth can be described by a modified parabolic growth law, accounting for the
initial delay in the nucleation of γ’. Growth of the nitride layer is rate controlled by
diffusion of nitrogen through the layer.
Upon nitriding recrystallized Fe-1at.%Mo alloy (strongly) delayed precipitation of
Mo2N occurs (if at all): no Mo2N can be found in the matrix even after 64 h of nitriding at
480 °C. This is a consequence of the high volumetric misfit between the ferrite matrix
and the Mo2N nitride. Because the solubility of Mo in γ’ is low, γ’ nitride cannot
precipitate easily. These obstacles for Mo-nitride and γ’-nitride precipitation lead to a
high nitrogen supersaturation of the ferrite matrix over an extended depth range.
Chapter 6
160
Eventually, the chosen route for elimination of this high nitrogen supersaturation is
precipitation of γ’ at the cost of dissolution of Mo in γ’ (under para-equilibrium
conditions). Plates of γ’ nitride, once nucleated, grow rapidly across the extended depth
range of high nitrogen supersaturation. The relatively high growth rate of these plates is
at least partly due to short-circuit diffusion of nitrogen through ferrite grains adjacent to
the surface (no compact γ’ layer occurs). The γ’ plates exhibit a Nishiyama-Wassermann
orientation relationship with the ferrite matrix. The equilibrium solubility of Mo in γ’
nitride is low. This leads to the emergence of ε phase and a hitherto unknown
(precursory) Mo-nitride phase, next to γ’ phase in the compound layer, upon nitriding
the recrystallized Fe-Mo specimens, and also the cold rolled specimens in a beginning
stage of nitriding. Upon continued nitriding the ε phase and the unknown (precursory)
Mo-nitride phase in the surface adjacent part of the compound layer dissolve and
equilibrium Mo-nitride phases emerge.
6.5.3 Microstructural and surface residual stress development during
low-temperature gaseous nitriding of Fe-3.07at.% Mo alloy
Upon low-temperature nitriding of Fe-3.07at.% Mo alloy, precipitation of nano-sized
platelets along {100} planes of the ferrite matrix occurs. Strongly asymmetric X-ray
diffraction ferrite-peak broadening and streaks along <100> ferrite directions in the
selected area electron diffraction pattern suggest that the nitride precipitates are largely
coherent with the surrounding ferrite matrix, which is distorted tetragonally due to the
precipitate/matrix misfit. The precipitation process is not instantaneous upon nitrogen
saturation of the ferrite matrix: a gradual development of high hardness and high
compressive residual stress occurs.
Adopting the composition Mo2N for the largely coherent nitride platelets, it
follows that a distinct amount of “excess nitrogen” is taken up.
Summary
161
6.5.4 Nitriding behaviour of maraging steel: experiment and modelling
Upon nitriding of maraging steel, largely coherent Mo2N-type nitrides develop,
surrounded by a tetragonally distorted matrix. These nitrides cause a strong increase in
hardness and compressive residual stress. In case of age hardening the specimens prior
to nitriding, all Mo has precipitated as intermetallic compound, whereas in the solution
annealed specimens all Mo is dissolved in the cubic, martensite matrix. This results in
hardness which is twice as high as the hardness of the solution annealed specimens
before nitriding. As consequence, upon nitriding the solution annealed specimens (“A”)
and as compared to the age hardened specimens (“B”) (i) a larger hardness increase and
a higher hardness are obtained for specimens “A” upon nitriding and (ii) higher amounts
of excess nitrogen (both mobile and immobile) occur for specimens “A”. This can be
discussed as follows. Upon nitriding specimens “A” a higher amount of Mo nitride can
precipitate in the early stage of nitriding as all Mo is initially dissolved in the matrix.
The development of the nitrogen concentration-depth profiles in maraging steel
upon nitriding can be successfully modelled with a combined diffusion and precipitation
kinetic model, provided that the role of excess nitrogen is recognized. The model
employs the following fit parameters: the composition parameter of the nitride
(expressing the presence of immobile, i.e. adsorbed excess nitrogen at the
nitride/matrix interface), the solubility of nitrogen in the matrix (recognizing the
presence of mobile, i.e. additionally in the strained matrix, dissolved excess nitrogen),
the diffusion coefficient of nitrogen in the matrix and the solubility product of the
nitride precipitates.
Nitrogen-absorption isotherms determined for the maraging steel allowed
distinction of the different kinds of (excess-) nitrogen taken up and thus provided
starting values of the fitting parameters for the kinetic model.
The diffusion coefficient of nitrogen in the maraging steel matrix is much lower
than for nitrogen diffusion in pure ferrite. This may be ascribed to the microstructure of
the maraging steel (trapping, de-trapping and re-trapping of nitrogen at e.g. lattice
defects) and the occurrence of a labyrinth-effect due to precipitated particles.

Chapter 6
162
Nitriding kinetics are faster in the only solution annealed specimens in
association with rapid saturation of the total amount of nitrogen in the surface region.
In case of the age hardened specimens a more gradually preceding nitriding reaction
takes place due to the necessary preceding dissolution of the intermetallic compound
particles in favour of the developing nitride particles.
The amounts of (mobile and immobile) excess nitrogen taken up are much larger
in case of the solution annealed specimens indicating the occurrence of finer and more
coherent nitride platelets, than in case of the age hardened specimens.
In view of technological application, nitriding of maraging steels can best be
applied without application of a prior age hardening treatment: distinctly more nitrogen
is taken up more rapidly and a higher hardness is obtained.
163
CHAPTER 7
7 Zusammenfassung
7.1 Einleitung
Das Gasnitrieren ist ein sehr leistungstarkes Verfahren um die Oberflächeneigenschaften
(Ermüdung und Abrasion), sowie die chemischen Eigenschaften
(Korrosionsbeständigkeit) von eisenbasierten Werkstücken und Stählen zu verbessern.
Unter den technologisch bedeutsamen thermochemischen Oberflächenverfahren wie
dem Aufkohlen, Nitrocarburieren und Nitrieren, die in flüssigen, plasma- oder
gasförmigen Medien durchgeführt werden können, ist das Gasnitrieren aufgrund seiner
einzigartigen Kontrollierbarkeit das am weitesten verbreitete Verfahren. Die
gewünschte Mikrostruktur und damit einhergehend die resultierenden
Oberflächeneigenschaften eines Materials können während des Gasnitrierprozesses
präzise eingestellt und kontrolliert werden.
Das Gasnitrieren wird normalerweise bei Temperaturen im Bereich von 400 –
580 °C in Ammoniak/Wasserstoff-Gasmischungen durchgeführt. Bei diesen
Temperaturen dissoziiert Ammoniak katalytisch an der Oberfläche des Werkstückes und
atomarer Stickstoff diffundiert in die Oberfläche der ferritischen Matrix. In Abhängigkeit
von den Ntrierbedingungen wie Temperatur und Nitrierkennzahl kN, welche definiert ist
als das Verhältnis der Partialdrücke von Ammoniak und Wasserstoff ( )( )
3N 3/2
2
NHH
pk
p
=
,
können verschiedene Phasen an der Oberfläche des Werkstückes gebildet werden,
gemäß dem Fe-N-Phasendiagramm: α-Fe (mit auf den Oktaederlücken der ferritischen
Matrix gelöstem Stickstoff), sowie die Eisennitride γ’-Fe4N1-x und ε-Fe3N1+y (in dieser
Reihenfolge mit zunehmendem Stickstoffgehalt). Die Bildung von Eisennitriden an der
Oberfläche führt zur Entstehung einer so genannten Verbindungsschicht, die ihrerseits
sehr stark das Verhalten gegenüber abrasivem Verschleiß und Korrosion verbessert.
Chapter 7
164
Trotz der weit verbreiteten industriellen Anwendung besteht ein großer Bedarf
an Grundlagenforschung bezüglich des Nitrierprozesses, da die Anwendung dieser
Technik in der Industrie oft auf Phänomenologie und Erfahrung beruht.
Umfangreiche Grundlagenuntersuchungen wurden bereits an binären
Eisenbasislegierungen mit relativ starken Nitridbildnern wie Ti und V durchgeführt.
Gleichwohl besteht weiterhin ein großes wissenschaftliches und industrielles Interesse
detalliertes Verständnis bezüglich des Nitrierverhaltens von binären eisenbasierten
Legierungen zu erlangen, insbesondere für schwächere Nitridbildner (wie Mo, W, Si), da
diese Systeme nicht gut verstanden sind. Die Literaturergebnisse, falls überhaupt
verfügbar, widersprechen sich oft gegenseitig, insbesondere im Falle von Mo.
Die vorliegende Arbeit konzentriert sich auf das Nitrierverhalten von solchen
Mo-enthaltenden, eisenbasierten Legierungen und, mit den dadurch erlangten
Erkenntnissen, auf das Nitrierverhalten von Mo-enthaltenden Maragingstählen.
7.2 Experimentalteil
Die Fe-Mo Legierungen wurden durch Einschmelzen entsprechender Mengen an reinem
Fe und Mo unter Schutzgasatmosphäre in einem Induktionsofen hergestellt. Die
Schmelzen wurden in Kupferkokillen abgegossen, um einen zylindrischen Stab (Ø:
10 mm, l: 100 mm) zu erhalten. Die chemische Zusammensetzung und der Gehalt an
Verunreinigungen wurde mittels chemischer Analyse bestimmt (induktiv gekoppeltes
Plasma – optische Emissionssprektroskopie (für Mo), Verbrennungsmethode (für C und
S) und Trägergas-Heißextraktion (für O und N)). Die Abgüsse wurden zu Blechen
kaltgewalzt, aus denen dann rechteckige Proben geschnitten wurden. Diese Proben
wurden dann mechanisch geschliffen und poliert (abschließende Polierstufe: 1 µm
Diamantsuspension). Die polierten Proben wurden in eine mit Argongas gefüllte
Quartzampulle eingekapselt und anschließend bei 800 °C für 1,5 h in einem Muffelofen
wärmebehandelt, um die Rekristallisation der verformten Mikrostruktur zu erzielen.
Das kommerziell erhältliche Maraging-Stahl Blech wurde von Imphy alloys, Arcelor
Group, Frankreich, bezogen. Aus diesem Blech wurden ebenfalls rechteckige Proben
Zusammenfassung
165
geschnitten und gleichermaßen präpariert wie die Fe-Mo Proben. Nach dem Polieren
wurden die Proben bei 880 °C für 0,5 h Lösungsgeglüht.
Vor dem Nitrieren wurden die Proben poliert (finale Polierstufe: 1 µm
Diamantsuspension) und mittels Ethanol im Ultraschallbad gereinigt.
7.3 Nitrieren
Das Nitrieren wurde in einem Mehrzonen-Quartzrohrofen mittels
Ammoniak/Wasserstoff-Gasmischungen bei verschiedenen Temperaturen im Bereich
von 440 °C bis 580 °C (Temperaturkonstanz: ±1 °C) durchgeführt. Die Gasflüsse wurden
durch Massflow-Controller geregelt, wobei der gesamte Gasdurchfluss (500 ml/min) so
gewählt wurde, dass der erzielte lineare Gasdurchfluss ausreichte, um jegliche
signifikante, thermisch bedingte Ammoniakzersetzung in der Nitrieratmosphäre zu
vermeiden.
7.4 Probencharakterisierung
Für die lichtmikroskopischen Untersuchungen wurden Querschliffe hergestellt
(geschliffen und poliert) und anschließend mit Nital (2 Vol.-%) geätzt.
Mikrohärtemessungen wurden an polierten (ungeätzten) Querschliffen vor und
nach dem Nitrieren mittels Vickers Mikrohärteprüfung durchgeführt
Eine Phasenanalyse mithilfe von Röntgendiffraktometrie wurde bei allen Proben
vor und nach dem Nitrieren durchgeführt. Die Identifikation der Phasen erfolgte durch
Vergleich der 2 θ Reflexpositionen der Phasen mit Referenzdaten.
Die Bestimmung der Eigenspannungen erfolgte nach der konventionellen sin2ψ-
Methode. Für den Fall einer nach der Rekristallisation verbleibenden Fasertextur wurde
die Kristallitgruppenmethode zur Bestimmung der Eigenspannungen herangezogen.
Die Struktur und Morphologie der Nitrid-Ausscheidungen wurde mittels
Transmissions-Elektronenmikroskopie (TEM) untersucht. TEM-Proben aus definierten
Tiefen der nitrierten Zone wurden durch mechanisches Schleifen, Dimpeln und Argon-
Ionendünnen hergestellt. Hellfeld-, Dunkelfeldaufnahmen, sowie Beugungsbilder
Chapter 7
166
wurden aufgenommen, um die Kristallstruktur und Morphologie der gebildeten Nitrid-
Ausscheidungen zu bestimmen.
Elementspezifische Konzentrations-Tiefenverläufe wurden mithilfe der
Elektronenstrahl-Mikroanalyse an polierten Querschliffen senkrecht zur Oberfläche,
sowie durch Glimmentladungsspektroskopie, erstellt.
Für die quantitative Analyse der Aufnahme an Überschuss-Stickstoff (an der
Grenzfläche zwischen Nitrid-Ausscheidung und Matrix adsorbierter, bzw. zusätzlich in
der durch Nitrid-Ausscheidungen gedehnten Matrix gelöster Stickstoff) wurde eine
Absorptionsisotherme erstellt. Hierzu wurde eine dünne Folie homogen durchnitriert
und anschließend denitriert. Die Stickstoffaufnahme bei konstanter Temperatur und
verschiedenen Nitrierkennzahlen wurde gravimetrisch bestimmt.
7.5 Ergebnisse
7.5.1 Molybdännitrid-Ausscheidungen in rekristallisierter und kalt
gewalzter Fe-1at.% Mo-Legierung
Beim Nitrieren einer Fe-1at.% Mo-Legierung unter solchen Bedingungen, die keine
Verbindungsschichtbildung an der Oberfläche erlauben, entstehen Ausscheidungen vom
Typ Mo2N als Plättchen mit einer Länge von mehreren hundert nm und einer Dicke von
nur wenigen Atomlagen gemäß einer Bain-Orientierungsbeziehung zur Matrix. Im Falle
rekristallisierter Proben sind die Plättchen in hohem Maße kohärent (beugen kohärent
mit der Matrix) und führen daher zu stark asymmetrischen Ferrit-Matrix
Beugungsreflexen. Im Falle kaltgewalzter Proben enstehen die Ausscheidungen vom Typ
Mo2N viel früher und die Plättchen sind zumindest teilweise inkohärent (führen daher zu
separaten Nitrid-Reflexen im Beugungsbild). Bei längerer Nitrierdauer findet eine
diskontinuierliche Ausscheidungsreaktion statt, welche an den Korngrenzen der Ferrit-
Matrix startet und die submikroskopischen Plättchen vom Typ Mo2N durch eine
lamellare α-Fe/MoN (hexagonale Kristallstruktur) Mikrostruktur mit einer
Orientierungsbeziehung nach Burgers ersetzen, was eine Parallelität der dichtest

Zusammenfassung
167
gepackten Ebene in beiden Phasen zur Folge hat. Im Falle rekristallisierter Proben führt
die diskontinuierliche Ausscheidung letztlich zu einer vollständigen Umwandlung der
Ausscheidungen vom Typ Mo2N zu MoN. Im Falle kaltgewalzter Proben tritt die Mo2N →
MoN-Umwandlung nur partiell auf: die Triebkraft für die diskontinuierliche
Ausscheidungsreaktion is wesentlich kleiner im Falle von kaltgewalzten Proben
(wesentlich geringere (Fehlpassungs-) Verformungsenergie und Stickstoff-
Übersättigung).
Die diskontinuierliche Umwandlung führt zu einem verstärkten Anstieg der Stickstoff-
Konzentration während der Umwandlung aufgrund der Stöchiometrieänderung (Mo2N
→ MoN). Die Zusammensetzungsanalyse der (submikroskopischen) Nitride vom Typ
Mo2N und der (lamellaren) Nitride vom Typ MoN gibt keinen Hinweis auf eine
Eisenaufnahme in den Nitriden.
7.5.2 Defekt-abhängige Bildung nitrierter Oberflächenschichten beim
Nitrieren von Fe-1at.% Mo Legierungen
Die Defektdichte eisenbasierter Fe-Me-Legierungen, wobei Me ein schwacher
Nitridbildner repräsentiert (wie beispielsweise Me= Mo), hat einen starken Einfluss auf
die Konstitution und Morphologie der sich beim Nitrieren bildenden Eisennitrid-
basierten Verbindungsschicht. Dies wird im Folgenden verdeutlicht.
Beim Nitrieren einer kaltgewalzten Fe-1at.% Mo-Legierung tritt sofortige
Ausscheidung von Mo2N auf (versetzungsbegünstigte Keimbildung), welche zu einer
geringen Stickstoffübersättigung der ferritischen Matrix führt. Keimbildung von γ’ findet
(ausschließlich) an der Oberfläche statt, wodurch sich daraus resultierend eine
geschlossene Verbindungsschicht bildet, die Mo2N Partikel (durch „Überrennung“ der
gebildeten Partikel) inkorporiert. Das Wachstum der γ’-Schicht kann durch ein
modifiziertes Wachstumsgesetz beschrieben werden, das die ursprüngliche Verzögerung
in der Keimbildung von γ’ berücksichtigt. Den geschwindigkeitsbestimmende Schritt
beim Wachstum der nitrierten Schicht stellt die Diffusion von Stickstoff durch die
nitrierte Schicht dar.
Chapter 7
168
Beim Nitrieren einer rekristallisierten Fe-1at.% Mo-Legierung tritt (stark)
verzögerte Ausscheidung von Mo2N auf (falls überhaupt): Kein Mo2N kann in der Matrix
gefunden werden, noch nichteinmal nach einer Nitrierzeit von 64 h bei einer
Nitriertemperatur von 480 °C. Dies ist eine Konsequenz der großen Volumenfehlpassung
zwischen der ferritischen Matrix und der Mo2N Nitride. Bedingt dadurch, dass die
Löslichkeit von Mo in γ’ gering ist, wird die γ’-Ausscheidung erschwert. Diese
Erschwerungen der Mo- und γ’-Nitrid-Ausscheidungen führen zu einer starken
Stickstoffübersättigung der Matrix über einen ausgedehnten Tiefenbereich. Letztendlich
könnte die Ausscheidung von γ’ auf Kosten des Auflösens von Mo in γ’ die bevorzugte
Route zur Eliminierung dieser starken Stickstoffübersättigung sein (unter Para-
Gleichgewichtsbedingungen). Die einmal gebildeten γ’-Plättchen wachsen sehr schnell in
dem Bereich der starken Stickstoff-Übersättigung. Die hohe Wachstumsrate dieser
Plättchen wird, zumindest teilweise, durch Kurzschluss-Diffusion von Stickstoff durch zur
Oberfläche benachbarte Ferritkörner hervorgerufen (es entsteht keine geschlossene γ’-
Schicht). Die γ’-Plättchen weisen eine Nishiyama-Wassermann Orientierungbeziehung
zur ferritischen Matrix auf. Die Gleichgewichtslöslichkeit von Mo in γ’ ist sehr gering.
Dies führt zum Auftreten der ε-Phase und einer bis dato unbekannten (Präkursor-) Mo-
Nitridphase, neben der γ’-Phase in der Verbindungsschicht während des Nitrierens von
rekristallisierten Fe-Mo-Proben, sowie ebenfalls bei den kaltgewalzten Proben zu
Beginns des Nitrieren in dem zur Oberfläche benachbarten Teil der Verbindungsschicht.
Bei fortschreitendem Nitrieren lösen sich die ε-Phase und die unbekannte (Präkursor-)
Phase in dem zur Oberfläche benachbarten Teil der Verbindungsschicht und es bildet
sich die Gleichgewichts-Mo-Nitridphase.

Zusammenfassung
169
7.5.3 Entwicklung der Mikrostruktur und Oberflächen-Eigenspannungen
beim Niedertemperatur-Nitrieren einer Fe-3,07at.% Mo-Legierung
Während des Niedertemperatur-Nitrierens einer Fe-3,07at.% Mo-Legierung erfolgt die
Ausscheidung von nano-skaligen Plättchen entlang der {100}-Ebenen der ferritischen
Matrix. Stark asymmetrische Röntgenbeugungs-Reflexverbreiterung und „Streaks“
entlang <100> Ferrit-Ebenen in den elektronenmikroskopischen
Feinbereichsbeugungsbildern weisen darauf hin, dass die Nitrid-Ausscheidungen in
hohem Maße kohärent zur umgebenden Matrix sind, die wiederum aufgrund der
Ausscheidungs/Matrix-Fehlpassung tetragonal verzerrt ist. Der Ausscheidungsprozess
startet nicht unverzüglich nach der Sättigung der Matrix mit Stickstoff: die Ausbildung
einer hohen Härte und hohen Druckeigenspannungen erfolgt sukzessive.
Die Annahme einer Zusammensetzung von Mo2N für die in hohem Maße
kohärenten Nitrid-Plättchen lässt auf eine deutliche Menge an aufgenommenem
„Überschuss-Stickstoff“ schließen.
7.5.4 Nitrierverhalten von Maragingstählen: Experiment und Modellierung
Während des Nitrierens von Maragingstählen bilden sich weitestgehend kohärente
Nitrid-Ausscheidungen vom Typ Mo2N, die von einer tetragonal verzerrten Matrix
umgeben sind. Diese Nitride rufen einen starken Anstieg der Härte und
Druckeigenspannungen hervor. Im Falle des Ausscheidungshärtens der Proben vor dem
Nitrieren wird der gesamte Gehalt an Mo beim Ausscheidungshärten als
intermetallische Verbindung ausgeschieden, wohingegen bei den lösungsgelühten
Proben der gesamte Gehalt an Mo in der kubischen, martensitischen Matrix gelöst ist.
Dies resultiert in einer im Vergleich zu lösungsgeglühten Proben doppelt so hohen Härte
vor dem Nitrieren. Als Folge davon weisen die lösungsgeglühten Proben („A“) im
Vergleich zu den ausscheidungsgehärteten Proben („B“) nach dem Nitrieren (i) einen
stärkeren Härteanstieg und höhere Härtewerte und (ii) höheren Gehalt an

Chapter 7
170
Überschussstickstoff (mobil und immobil) auf. Dies kann wie folgt diskutiert werden.
Während des Nitrierens von Proben „A“ kann zu Beginn eine größere Menge an Mo-
Nitrid ausgeschieden werden, da Mo ursprünglich substitutionell in der Matrix gelöst ist.
Das sich ausbildende Stickstoff-Konzentrationstiefenprofil in Maragingstählen
kann erfolgreich mittels eines kombinierten kinetischen Diffusions- und
Ausscheidungsmodells modelliert werden, unter der Voraussetzung der Beachtung des
Einflusses des Überschussstickstoffs. Das Modell beruht auf folgenden Fitparametern:
der Stöchiomtriekoeffizient des Nitrids (berücksichtigt die Anwesenheit von immobilem,
d.h. an der Grenzfläche zwischen Nitrid-Ausscheidung und Matrix adsorbierten
Überschuss-Stickstoffs), die Löslichkeit von Stickstoff in der Matrix (berücksichtigt die
Anwesenheit von mobilem, d.h. zusätzlich in der gedehnten Matrix gelöstem
Überschuss-Stickstoff), den Diffusionskoeffizient von Stickstoff in der Matrix, sowie das
Löslichkeitsprodukt der Nitridausscheidungen.
Für den Maragingstahl bestimmte Stickstoff-Absorptionsisothermen erlauben die
Unterscheidung zwischen den beim Nitrieren aufgenommenen, verschiedenen Arten
von (Überschuss-) Stickstoff und bieten daher Startwerte für die Fitparameter für das
kinetische Modell.
Der Diffusionskoeffizient von Stickstoff in dem Maragingstahl ist sehr viel
niedriger als für die Stickstoffdiffusion in reinem Ferrit. Dies könnte auf die
Mikrostruktur von Maragingstahl zurückgeführt werden (das „Einfangen“ von Stickstoff
an z.B. Gitterdefekten) sowie auf das Auftreten eines Labyrinth-Effekts durch die
ausgeschiedenen Partikel.
Im lösungsgeglühten Zustand ist die Nitrierkinetik deutlich schneller, verbunden
mit einer schnellen Sättigung des gesamten Stickstoffgehalts in der Oberflächenregion.
Im Falle von ausscheidungsgehärteten Proben tritt eine gradueller fortschreitende
Nitrierreaktion auf, aufgrund des fortschreitenden Auflösens der Partikel der
intermetallischen Verbindungen zugunsten der Bildung der Nitrid-Partikel.
Der Gehalt an Überschuss-Stickstoff (mobil und immobil) ist viel höher im Falle
von vor dem Nitrieren lösungsgeglühten Proben, was auf das, im Vergleich zu

Zusammenfassung
171
ausscheidungsgehärteten Proben, Auftreten von feineren und kohärenteren
Nitridplättchen schließen lässt.
Im Hinblick auf die technologische Anwendung empfiehlt sich eine direkte
Nitrierung im lösungsgeglühten Zustand, d.h. ohne vorherige Ausscheidungshärtung:
deutlich mehr Stickstoff wird in kürzerer Zeit aufgenommen und eine höhere Härte wird
erzielt.

172
173
REFERENCES
[1] M.H. Biglari, C.M. Brakman, E.J. Mittemeijer, Phil. Mag. A 72, (1995), p. 1281.
[2] S.S. Hosmani, R.E. Schacherl, L. Litynska-Dobrzynska, E.J. Mittemeijer, Phil.
Mag. 88, (2008), p. 2411.
[3] S.S. Hosmani, R.E. Schacherl, E.J. Mittemeijer, Acta Mater. 53, (2005), p. 2069.
[4] S. Meka, S.S. Hosmani, A.R. Clauss, E.J. Mittemeijer, Int. J. Mater. Res. 99,
(2008), p. 808.
[5] A.R. Clauss, E. Bischoff, S.S. Hosmani, R.E. Schacherl, E.J. Mittemeijer, Metall.
Mater. Trans. A 40A, (2009), p. 1923.
[6] K.S. Jung, S.R. Meka, R.E. Schacherl, E. Bischoff, E.J. Mittemeijer, Metall. Mater.
Trans. A 43A, (2012), p. 934.
[7] K.S. Jung, R.E. Schacherl, E. Bischoff, E.J. Mittemeijer, Surf. Coat. Technol. 204,
(2010), p. 1942.
[8] E.J. Mittemeijer, J.T. Slycke, Surf. Eng. 12, (1996), p. 152.
[9] E.J. Mittemeijer, M.A.J. Somers, Surf. Eng. 13, (1997), p. 483.
[10] E. Lehrer, Z. Elektrochem. 36, (1930), p. 383.
[11] R. Hoffmann, E.J. Mittemeijer, M.A.J. Somers, HTM 51, (1996), p. 7.
[12] H. Wriedt, N. Gokcen, R. Nafziger, Journal of Phase Equilibria 8, (1987), p. 355.
[13] H.H. Podgurski, H.E. Knechtel, T Metall Soc Aime 245, (1969), p. 1595.
[14] H.H. Podgurski, R.A. Oriani, F.N. Davis, J.C.M. Li, Y.T. Chou, T Metall Soc Aime
245, (1969), p. 1603.
[15] P.M. Hekker, H.C.F. Rozendaal, E.J. Mittemeijer, J. Mater. Sci. 20, (1985), p. 718.
[16] S.S. Hosmani, R.E. Schacherl, E.J. Mittemeijer, Mater. Sci. Technol. 21, (2005), p.
113.
[17] S.S. Hosmani, R.E. Schacherl, E.J. Mittemeijer, J. Mater. Sci. 43, (2008), p. 2618.
[18] R.E. Schacherl, P.C.J. Graat, E.J. Mittemeijer, Z. Metallkd. 93, (2002), p. 468.
[19] R.E. Schacherl, P.C.J. Graat, E.J. Mittemeijer, Metall. Mater. Trans. A 35A, (2004),
p. 3387.
[20] S.S. Brenner, S.R. Goodman, Scr. Metall. 5, (1971), p. 865.
[21] J.H. Driver, J.M. Papazian, Acta Metall. 21, (1973), p. 1139.
174
[22] J.H. Driver, D.C. Unthank, K.H. Jack, Phil. Mag. 26, (1972), p. 1227.
[23] K.H. Jack, Heat Treatment 73 The Metals Society Book 163, (1975), p. 39.
[24] J.D. Kamminga, T.P.C. Klaver, K. Nakata, B.J. Thijsse, G.C.A.M. Janssen, J.
Comput. Aided Mater. Des. 10, (2003), p. 1.
[25] A. Krawitz, Scr. Metall. 11, (1977), p. 117.
[26] R. Wagner, S.S. Brenner, Acta Metall. 26, (1978), p. 197.
[27] D.H. Jack, Acta Metall. 24, (1976), p. 137.
[28] H.H. Podgurski, F.N. Davis, Acta Metall. 29, (1981), p. 1.
[29] D.S. Rickerby, S. Henderson, A. Hendry, K.H. Jack, Acta Metall. 34, (1986), p.
1687.
[30] S.S. Hosmani, R.E. Schacherl, E.J. Mittemeijer, Acta Mater. 54, (2006), p. 2783.
[31] M.A.J. Somers, R.M. Lankreijer, E.J. Mittemeijer, Phil. Mag. A 59, (1989), p. 353.
[32] E. Macherauch, V. Hauk (editors). Origin, measurement and evaluation of residual
stresses. Residual stresses in science and technology., Vol. 1, DGM
Informationsgesellschaft m.b.H., Oberursel, 1987.
[33] P.J. Withers, H.K.D.H. Bhadeshia, Mater. Sci. Technol. 17, (2001), p. 355.
[34] E. Mittemeijer, Journal of Heat Treating 3, (1983), p. 114.
[35] R.F. Decker, S. Floreen, Maraging Steels: Recent Developments and Applications,
TMS-AIME, Warrendale, 1988.
[36] S. Floreen, Metall. Rev. 13, (1968), p. 13.
[37] J.B. Lecomte, C. Servant, G. Cizeron, J. Mater. Sci. 20, (1985), p. 3339.
[38] W. Sha, A. Cerezo, G.D.W. Smith, Metall. Trans. A 24, (1993), p. 1221.
[39] M. Fukamachi, Y. Kawabe, K. Nakazawa, S. Muneki, J. Jpn. Inst. Met. 47, (1983),
p. 237.
[40] Mihalisi.Jr, C.G. Bieber, Jom-J Min Met Mat S 18, (1966), p. 1033.
[41] G.P. Huffman, H.H. Podgurski, Acta Metall. 23, (1975), p. 1367.
[42] H.J. Grabke, Ber. Bunsenges. Physik. Chem. 72, (1968), p. 533.
[43] D. Liedtke, U. Baudis, J. Boßlet, U. Huchel, H. Klümper-Westkamp, W. Lerche,
H.J. Spies, Wärmebehandlung von Eisenwerkstoffen Nitrieren und
Nitrocarburieren, 3rd ed., Expert Verlag, Renningen, 2006.
[44] M.A.J. Somers, Heat Treat. Met. 27, (2000), p. 92.
175
[45] N.E.V. Diaz, S.S. Hosmani, R.E. Schacherl, E.J. Mittemeijer, Acta Mater. 56,
(2008), p. 4137.
[46] V.D. Yakhnina, F.Z. Izmailov, Met. Sci. Heat Treat. 18, (1976), p. 480.
[47] D.L. Speirs, W. Roberts, P. Grieveson, K.H. Jack: 425, I.S.I, Sheffield,
International Symposium on Metallurgical Chemistry, 1971
[48] B. Gault, F. Danoix, K. Hoummada, D. Mangelinck, H. Leitner, Ultramicroscopy
113, (2012), p. 182.
[49] M.H. Biglari, C.M. Brakman, E.J. Mittemeijer, S. van der Zwaag, Metall. Mater.
Trans. A 26, (1995), p. 765.
[50] J.L. Pouchou, F. Pichoir, Rech. Aerosp., (1984), p. 167.
[51] JCPDS-International Centre for Diffraction Data, PCPDFWIN. 2002.
[52] E.J. Mittemeijer, Fundamentals of Materials Science, Springer Verlag, Heidelberg,
Berlin, 2010.
[53] W.G. Burgers, Physica 1, (1934), p. 561.
[54] J.G.M. van Berkum, R. Delhez, T.H. de Keijser, E.J. Mittemeijer, Acta Crystallogr.,
Sect. A 52, (1996), p. 730.
[55] L. Cheng, A. Bottger, T.H. de Keijser, E.J. Mittemeijer, Scr. Metall. Mater. 24,
(1990), p. 509.
[56] W.B. Pearson, A Handbook of Lattice Spacings and Structures of Metals and
Alloys, Vol. 1, Pergamon Press, Oxford, 1958.
[57] I. Manna, S.K. Pabi, W. Gust, Int. Mater. Rev. 46, (2001), p. 53.
[58] D.B. Williams, E.P. Butler, Int. Met. Rev. 3, (1981), p. 153.
[59] R. Danoix, L. Legras, B. Hannoyer, J. Dulcy, F. Danoix: 351, The Minerals, Metals
and Materials Society, Phoenix, AZ, USA, PTM-international conference on solid-
solid transformations in inorganic materials, 2005
[60] J.R. Davis (editor) ASM handbook, Vol. 4, ASM International, Metals Park, Ohio,
1991.
[61] E.J. Mittemeijer, J.T. Slycke, Heat Treat. Met. 23, (1996), p. 67.
[62] S.R. Meka, E. Bischoff, R.E. Schacherl, E.J. Mittemeijer, Phil. Mag. 92, (2012), p.
1083.
[63] M.A.J. Somers, E.J. Mittemeijer, Metall. Mater. Trans. A 26, (1995), p. 57.
176
[64] R.A. Greff, W.D. Leslie, E.A. Setzkorn, J. Am. Oil Chem. Soc. 41, (1964), p. 63.
[65] H. Selg, E. Bischoff, R. Schacherl, T. Waldenmaier, E.J. Mittemeijer, Metall.
Mater. Trans. A submitted, (2012).
[66] K. Schwerdtfeger, P. Grieveson, E.T. Turkdogan, T Metall Soc Aime 245, (1969),
p. 2461.
[67] J. Crank, The Mathematics of Diffusion, 2nd ed., Oxford University Press, Oxford,
1975.
[68] T. Woehrle, A. Leineweber, E.J. Mittemeijer, Metall. Mater. Trans. A submitted,
(2012).
[69] H. Du, J. Agren, Metall. Mater. Trans. A 27, (1996), p. 1073.
[70] B.J. Kooi, M.A.J. Somers, E.J. Mittemeijer, Metall. Mater. Trans. A 27, (1996), p.
1063.
[71] H. Du, J. Agren, Z. Metallkd. 86, (1995), p. 522.
[72] T. Liapina, A. Leineweber, E.J. Mittemeijer, Metall. Mater. Trans. A 37A, (2006),
p. 319.
[73] H.C.F. Rozendaal, E.J. Mittemeijer, P.F. Colijn, P.J. Van der Schaaf, Metall. Trans.
A 14, (1983), p. 395.
[74] J.D. Fast, M.B. Verrijp, J Iron Steel I 176, (1954), p. 24.
[75] S.S. Hosmani, R.E. Schacherl, E.J. Mittemeijer, Int. J. Mater. Res. 97, (2006), p.
1545.
[76] S.S. Hosmani, R.E. Schacherl, E.J. Mittemeijer, J. Mater. Sci. 44, (2009), p. 520.
[77] J. Takada, Y. Oizumi, H. Miyamura, H. Kuwahara, S. Kikuchi, Oxid. Met. 26,
(1986), p. 19.
[78] H. Miyamura, J. Takada, H. Kuwahara, S. Kikuchi, J. Mater. Sci. 21, (1986), p.
2514.
[79] S. Meka, R. Schacherl, E. Bischoff, E.J. Mittemeijer, HTM J. Heat Treatm. Mat.
66, (2011), p. 103.
[80] H. Selg, E. Bischoff, R. Schacherl, J. Schwarzer, E.J. Mittemeijer, HTM J. Heat
Treatm. Mat. 2, (2011), p. 5.
[81] M. Nikolussi, A. Leineweber, E.J. Mittemeijer, Phil. Mag. 90, (2010), p. 1105.
[82] A.L. Schwab, J.P. Meijaard: How to draw Euler angles and utilize Euler

177
parameters, ASME, 2006
[83] Z. Nishiyama, Science Reports of the Tohoku Imperial University, 23, (1934), p.
637.
[84] A. Wassermann, Ber Dtsch Chem Ges 66, (1933), p. 1392.
[85] X.C. Xiong, A. Redjaimia, M. Goune, J. Mater. Sci. 44, (2009), p. 632.
[86] U. Dahmen, P. Ferguson, K.H. Westmacott, Acta Metall. 35, (1987), p. 1037.
[87] E.C. Bain, T Am I Min Met Eng 70, (1924), p. 21.
[88] D.L. Speirs. precipitation in iron-molybdenum-nitrogen alloys. Ph.D. Newcastle:
University of Newcastle upon Tyne, 1969.
[89] U. Welzel, E.J. Mittemeijer, European Powder Diffraction Epdic 8 443-4, (2004), p.
131.
[90] U. Welzel, E.J. Mittemeijer, J. Appl. Phys. 93, (2003), p. 9001.
[91] Landolt-Börnstein (editor) The Landolt-Börnstein Database, Physical Chemistry
IV, Springer Materials, 1995.
[92] J.E. Lowther, J. Alloys Compd. 364, (2004), p. 13.
[93] H.J. Goldschmidt, J. Helmut, Intersticial Alloys, London, 1967.
[94] F. Cajner, D. Landek, S. Solic, H. Cajner, Surf. Eng. 22, (2006), p. 468.
[95] K. Shetty, S. Kumar, P.R. Rao, Surf. Coat. Technol. 203, (2009), p. 1530.
[96] J.L. Meijering, Advances in Materials Research, Wiley-Interscience, New York,
1971.
[97] M.H. Biglari, C.M. Brakman, E.J. Mittemeijer, S. van der Zwaag, Phil. Mag. A 72,
(1995), p. 931.
[98] M.M. Yang, A.D. Krawitz, Metall. Trans. A 15, (1984), p. 1545.
[99] K. Bongartz, D.F. Lupton, H. Schuster, Metall. Trans. A 11, (1980), p. 1883.
[100] K. Bongartz, W.J. Quadakkers, R. Schulten, H. Nickel, Metall. Trans. A 20, (1989),
p. 1021.
[101] Y. Sun, T. Bell, Mat Sci Eng a-Struct 224, (1997), p. 33.
[102] U. Welzel, J. Ligot, P. Lamparter, A.C. Vermeulen, E.J. Mittemeijer, J. Appl.
Crystallogr. 38, (2005), p. 1.
[103] D. Gerlich, R.B. Roberts, G.K. White, R. Tainsh, J. Mater. Sci. 25, (1990), p. 2249.
[104] P.F. Colijn, E.J. Mittemeijer, H.C.F. Rozendaal, Z. Metallkd. 74, (1983), p. 620.
178
[105] A. Engstrom, L. Hoglund, J. Agren, Metall. Mater. Trans. A 25, (1994), p. 1127.
[106] X.F. Hu, Q.L. Ge, Z.L. Wu, Acta Metall. Mater. 41, (1993), p. 1625.
[107] E.I. Mittemeijer, Härterei-Technische Mitteilungen 36, (1981), p. 57.
[108] P.B. Friehling, F.W. Poulsen, M.A.J. Somers, Z. Metallkd. 92, (2001), p. 589.
[109] I. Barin, Thermochemical Data of Pure Substances, VCH, Weinheim, Basel, 1995.
179
8 Danksagung Die vorliegende Dissertation entstand im Zeitraum von März 2009 bis August 2012 am Institut für Materialwissenschaft der Universität Stuttgart, sowie am Max-Planck-Institut für Intelligente Systeme (ehemals Max-Planck-Institut für Metallforschung), Stuttgart, in Kooperation mit der Robert Bosch GmbH, Zentralbereich Forschung und Vorausentwicklung, Schwieberdingen. Nachfolgend möchte ich allen danken, die zum Gelingen dieser Arbeit beigetragen haben. An erster Stelle gebührt mein Dank meinem Doktorvater, Herrn Prof. Dr. Ir. E.J. Mittemeijer für das mir entgegengebrachte Vertrauen, ein solch breitgefächertes und interessantes Thema bearbeiten zu dürfen. Sein herausragendes wissenschaftliches Interesse und seine Begeisterungsfähigkeit haben mich immer wieder aufs Neue fasziniert und motiviert. Für die zielführenden und inspirierenden Diskussionen, die dem Gelingen dieser Arbeit in großem Maße dienlich waren, möchte ich ihm recht herzlich danken. Herrn Prof. Dr. J. Bill möchte ich für die freundliche Übernahme des Mitberichts danken, sowie Herrn Prof. Dr. T. Schleid für seine Bereitschaft, den Prüfungsvorsitz zu übernehmen. Für die Anfertigung einer Dissertation ist die Unterstützung durch Kollegen unerlässlich. Hierfür möchte ich der gesamten Abteilung Mittemeijer meinen Dank aussprechen. Namentlich erwähnen möchte ich insbesondere meinen langjährigen Bürokollegen Thomas Wöhrle, sowie Sairam, Kyung Sub, Gayatri, Silke, Bastian, Katharina und Jendrik, mit deren Hilfe wissenschaftliche und auch kulturelle Fragestellungen im Rahmen unserer regelmäßigen Meetings erörtert wurden. Ein weiterer Dank gebührt meinem täglichen Betreuer, Herrn Dr. R. Schacherl, für seine Unterstützung während meiner Zeit als Doktorand in seiner Arbeitsgruppe, sowie Herrn Dr. E. Bischoff und Herrn Dr. A. Leineweber für ihre stetige Diskussionsbereitschaft.
Des Weiteren möchte ich Herrn Dr. G. Eckstein für die freundliche Aufnahme in seine Abteilung bei der Robert Bosch GmbH danken. Meinen Betreuern Seitens der Robert Bosch GmbH, Herrn Dr. J. Schwarzer und insbesondere Herrn Dr. T. Waldenmaier, der mir durch seine unermüdliche Diskussions- und Hilfsbereitschaft helfend zur Seite stand, gebührt mein außerordentlicher Dank.
Zu guter Letzt gebührt den wichtigsten Personen in meinem Leben, meiner
Freundin Silke, sowie meinen Eltern und meiner Schwester für die mir entgegengebrachte Unterstützung in jeglicher Form, sowie den durch sie stets erfahrenen Rückhalt ein ganz besonderer, nicht in Worte fassbarer Dank.

180
181
9 Curriculum Vitae
Persönliche Daten
Name Holger Selg
geboren am 11. September 1983 in Riedlingen/Donau
Nationalität Deutsch
Schulbildung
1990 - 1994 Grundschule Langenenslingen
1994 - 2003 Kreisgymnasium Riedlingen, mit dem Abschluss der
allgemeinen Hochschulreife
Universitäre Ausbildung
2003-2008 Studium der Werkstoffwissenschaft, Universität Stuttgart
2008-2009 Diplomarbeit am Max-Planck-Institut für Metallforschung
und Institut für Materialwissenschaft, Universität Stuttgart.
Thema der Diplomarbeit: „Microstructure of severly
plastically deformed metals“
Promotion
März 2009 – August 2012 Promotion zum Dr. rer. nat. bei der Robert-Bosch GmbH in
Kooperation mit dem Max-Planck-Institut für Intelligente
Systeme (ehemals Max-Planck-Institut für Metallforschung),
Abteilung von Prof. Dr. Ir. E.J. Mittemeijer und dem Institut
für Materialwissenschaft, Universität Stuttgart. Thema der
Promotion: „Nitriding of Fe-Mo Alloys and Maraging Steel:
Structure, Morphology and Kinetics of Nitride Precipitation”

182
183
10 Erklärung über die Eigenständigkeit der Dissertation
Ich versichere, dass ich die vorliegende Arbeit mit dem Titel
„Nitriding of Fe-Mo Alloys and Maraging Steel: Structure, Morphology and Kinetics of
Nitride Precipitation“
selbständig verfasst und keine anderen als die angegebenen Quellen und Hilfsmittel
benutzt habe; aus fremden Quellen entnommene Passagen und Gedanken sind als
solche kenntlich gemacht.
Name: _______________________________
Unterschrift: _______________________________
Datum: _______________________________
Related Documents