NISS Metabolomics Worksho p, 2005 1 Integrative Analysis of High Dimensional Gene Expression, Metabolite and Blood Chemistry Data Kwan R. Lee, Ph.D. and Lei A. Zhu, Amit Bhattacharyya, J. Alan Menius Biomedical Data Sciences GlaxoSmithKline [email protected]

NISS Metabolomics Workshop, 20051 Integrative Analysis of High Dimensional Gene Expression, Metabolite and Blood Chemistry Data Kwan R. Lee, Ph.D. and.
Dec 14, 2015
Welcome message from author
This document is posted to help you gain knowledge. Please leave a comment to let me know what you think about it! Share it to your friends and learn new things together.
Transcript

NISS Metabolomics Workshop, 2005 1
Integrative Analysis of High Dimensional Gene Expression,
Metabolite and Blood Chemistry Data
Kwan R. Lee, Ph.D.
and
Lei A. Zhu, Amit Bhattacharyya, J. Alan Menius
Biomedical Data Sciences
GlaxoSmithKline
NISS Metabolomics Workshop, 2005 2
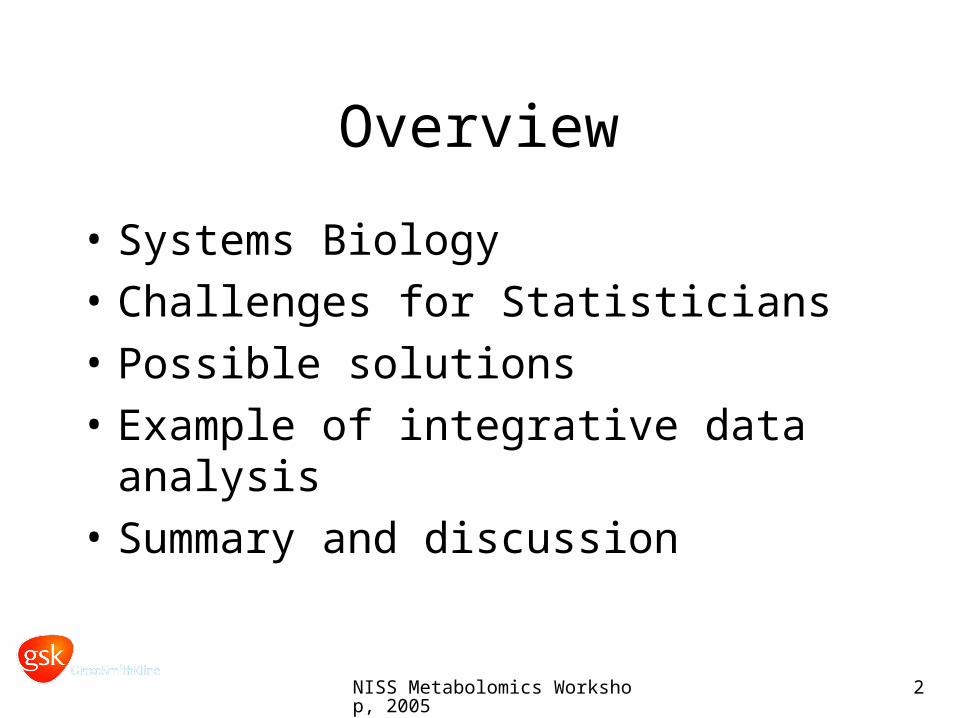
Overview
• Systems Biology
• Challenges for Statisticians
• Possible solutions
• Example of integrative data analysis
• Summary and discussion
NISS Metabolomics Workshop, 2005 3
Of mice and men
?
?
NISS Metabolomics Workshop, 2005 4
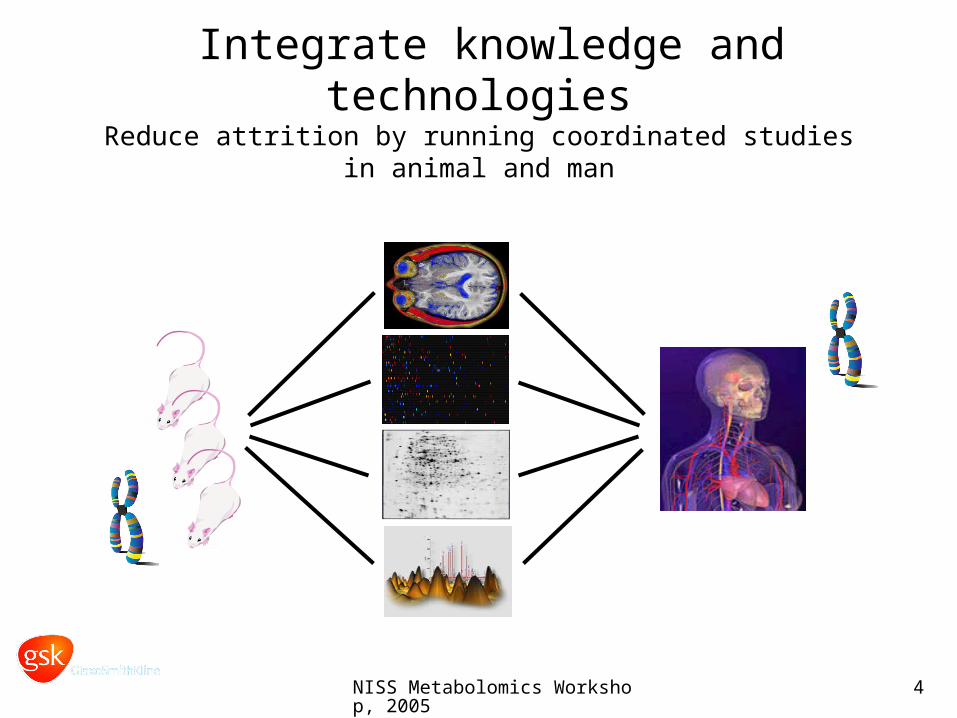
Integrate knowledge and technologiesReduce attrition by running coordinated studies in animal and man

NISS Metabolomics Workshop, 2005 5
Focusing on one platform may miss an obvious signal!!!

NISS Metabolomics Workshop, 2005 6
How can efficacy failures be attacked?
Animal Phenotype Human Phenotype
Classic Phenotypic Approach
Animal Phenotype Human Phenotype
Animal Biomarker Fingerprint
Human Biomarker Fingerprint
Integrative Biology
Few data to support analogy
Many data to support analogy

NISS Metabolomics Workshop, 2005 7
‘Systems Biology’ approach to drug discovery
NISS Metabolomics Workshop, 2005 8
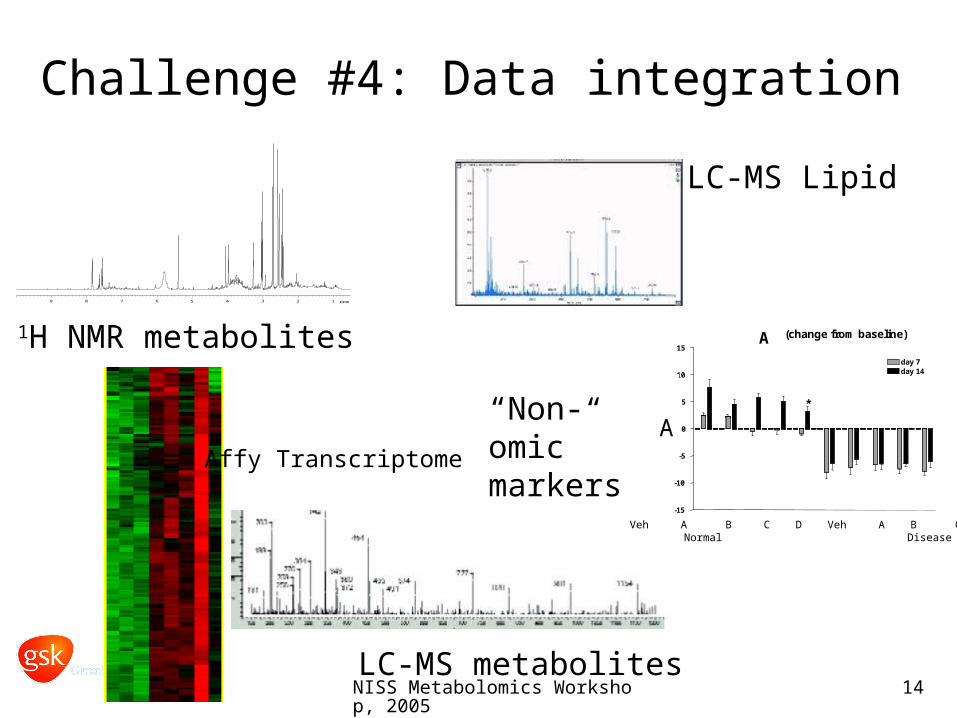
123456789 ppm
1H NMR metabolites
Affy Transcriptome
LC-MS Lipid
LC-MS metabolites
Adiponectin (change from baseline)
-15
-10
-5
0
5
10
15
day 7day 14
db/+ db/db
VehMet30
Gly1
Gly3
Met75
VehMet30
Gly1
Gly3
Met75
*
Ad
ipo
nec
tin
(u
g/m
l)
“Non-omic” markers
Veh A B C D Veh A B C DNormal Disease
A
A
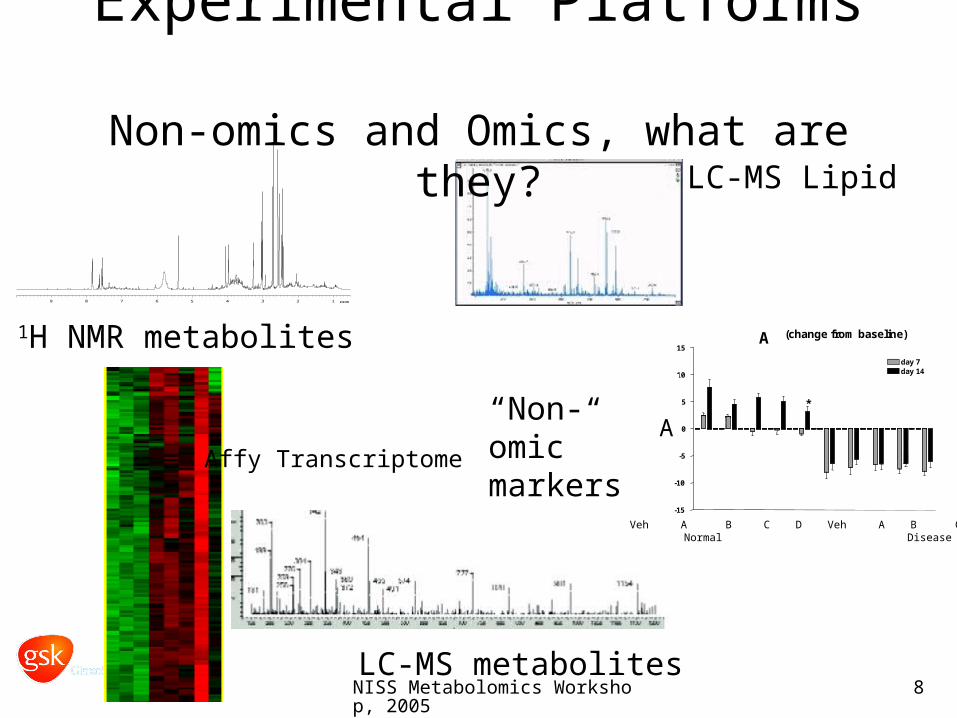
Experimental Platforms Non-omics and Omics, what are they?
NISS Metabolomics Workshop, 2005 9
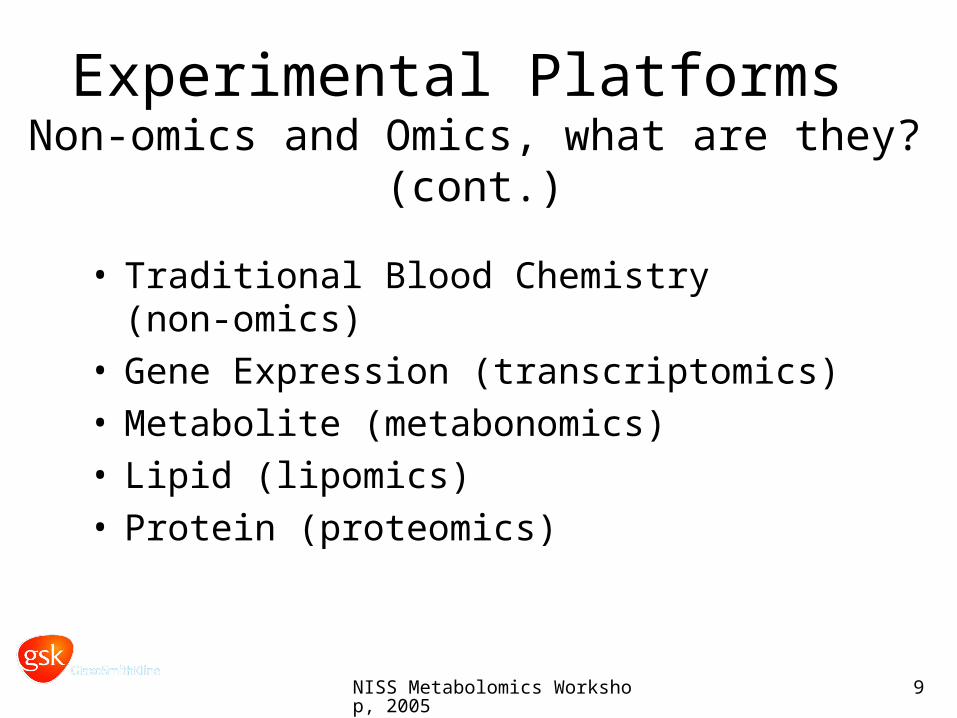
Experimental Platforms Non-omics and Omics, what are they? (cont.)
• Traditional Blood Chemistry (non-omics)• Gene Expression (transcriptomics)• Metabolite (metabonomics)• Lipid (lipomics)• Protein (proteomics)
NISS Metabolomics Workshop, 2005 10
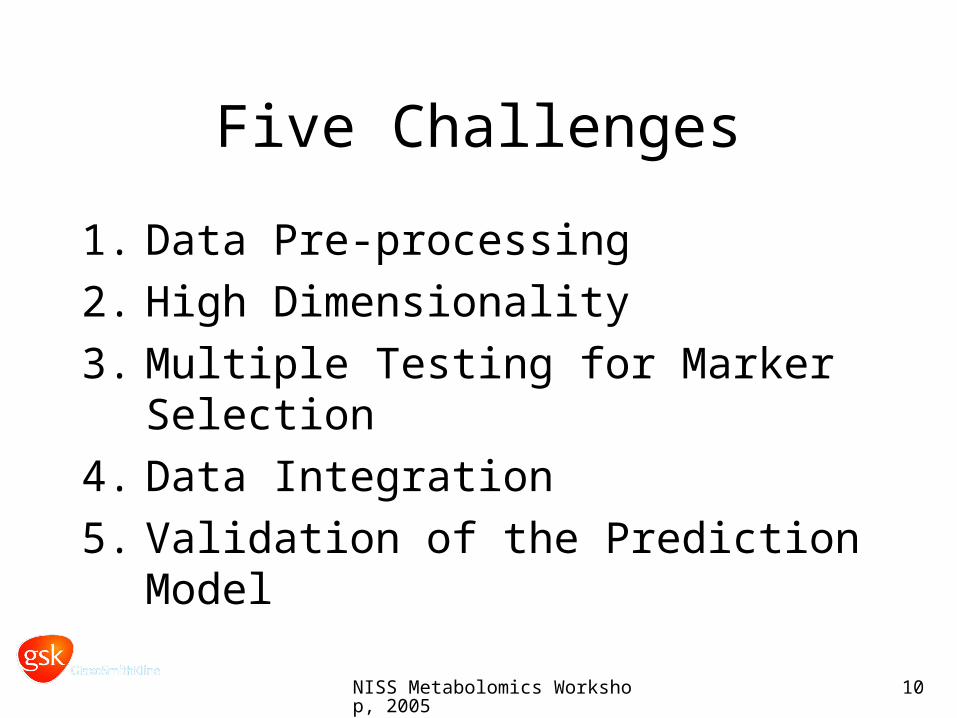
Five Challenges
1. Data Pre-processing
2. High Dimensionality
3. Multiple Testing for Marker Selection
4. Data Integration
5. Validation of the Prediction Model
NISS Metabolomics Workshop, 2005 11
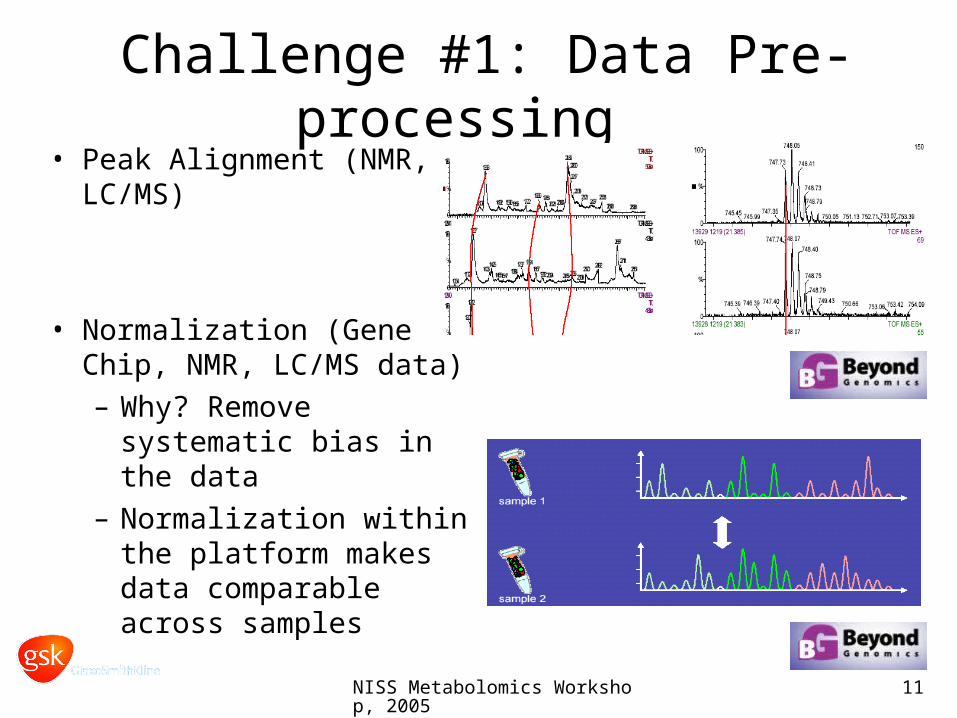
• Peak Alignment (NMR, LC/MS)
• Normalization (Gene Chip, NMR, LC/MS data)
– Why? Remove systematic bias in the data
– Normalization within the platform makes data comparable across samples
Challenge #1: Data Pre-processing
NISS Metabolomics Workshop, 2005 12
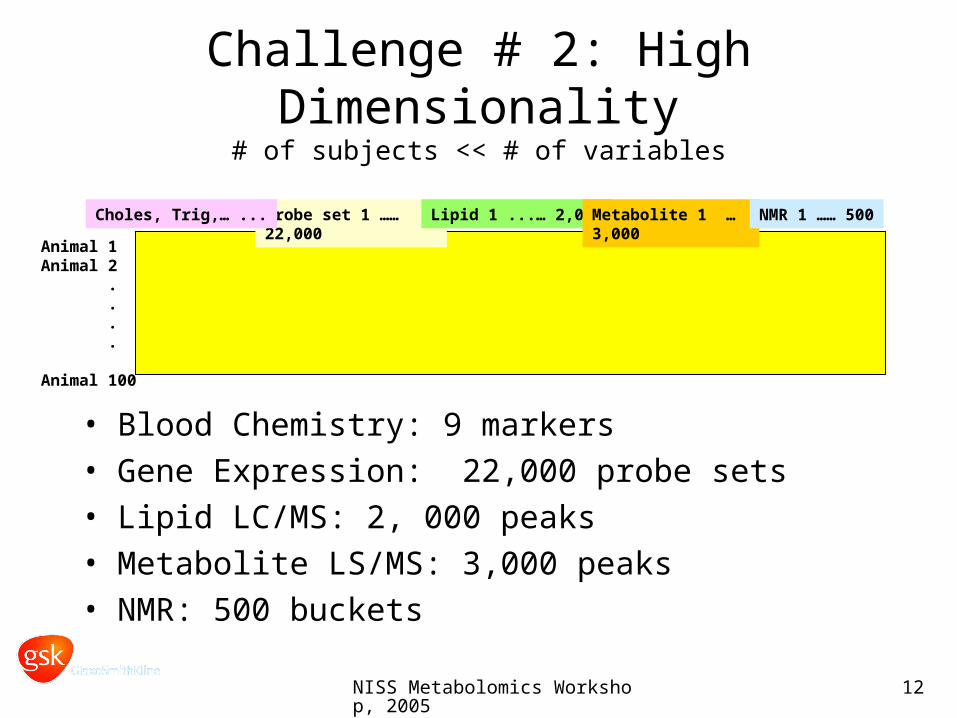
Challenge # 2: High Dimensionality# of subjects << # of variables
• Blood Chemistry: 9 markers
• Gene Expression: 22,000 probe sets
• Lipid LC/MS: 2, 000 peaks
• Metabolite LS/MS: 3,000 peaks
• NMR: 500 buckets
Animal 1Animal 2 . . . .
Animal 100
probe set 1 …… 22,000 Lipid 1 ...… 2,000 Metabolite 1 … 3,000 NMR 1 …… 500Choles, Trig,… ...

NISS Metabolomics Workshop, 2005 13
Noise Signal Signal+Noise
No Adjustment for Multiple Testing
FWERAdjustment
FDR
+ =
Challenge #3: Multiple Testing in Variable Selection
NISS Metabolomics Workshop, 2005 14
123456789 ppm
1H NMR metabolites
Affy Transcriptome
LC-MS Lipid
LC-MS metabolites
Adiponectin (change from baseline)
-15
-10
-5
0
5
10
15
day 7day 14
db/+ db/db
VehMet30
Gly1
Gly3
Met75
VehMet30
Gly1
Gly3
Met75
*
Ad
ipo
nec
tin
(u
g/m
l)
“Non-omic” markers
Veh A B C D Veh A B C DNormal Disease
A
Challenge #4: Data integration
A
NISS Metabolomics Workshop, 2005 15
Platform A20000s var.
Platform B1000s var.
CombinedData
Platform A20000s var.
Platform B1000s var.
Dimension Reduction(eg variable selection)
Platform A1000s var.
Platform B100s var.
CombinedData
Integration Approach 1: Integration Approach 2:
Challenge #4: Data integration (cont.)
NISS Metabolomics Workshop, 2005 16
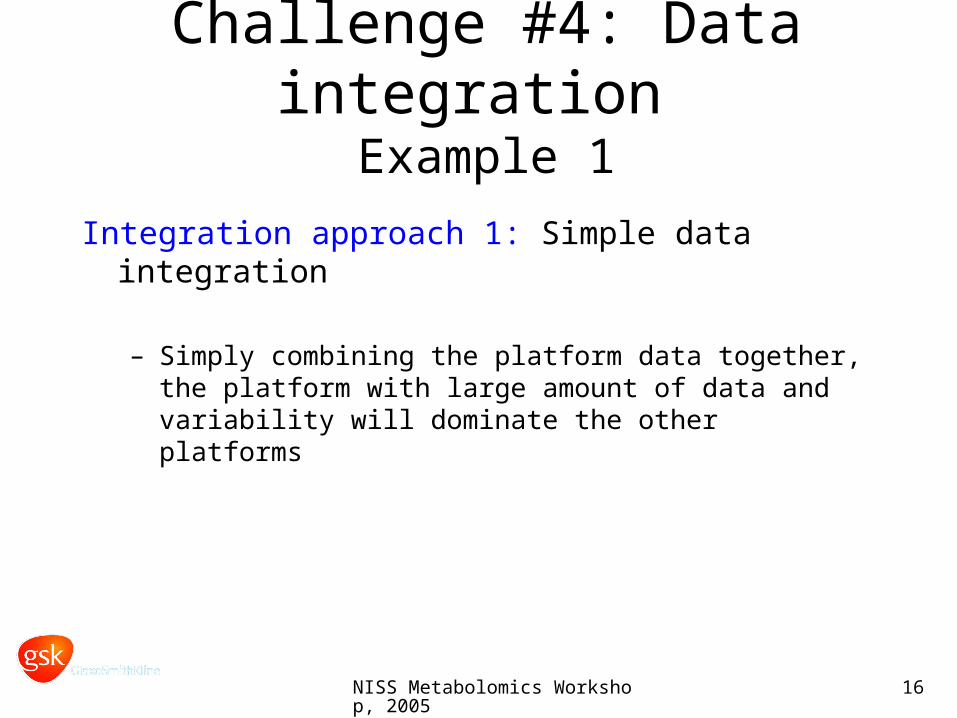
Integration approach 1: Simple data integration
– Simply combining the platform data together, the platform with large amount of data and variability will dominate the other platforms
Challenge #4: Data integration Example 1

NISS Metabolomics Workshop, 2005 17
PCA on Non-omics, Transcriptomics, and Combined.
-8
-6
-4
-2
0
2
4
6
-8 -7 -6 -5 -4 -3 -2 -1 0 1 2 3 4 5 6 7 8
t[2]
t[1]
integrated_orignal_intensity_liver_Epac397.M1 (PCA-X), Non-omics (40 markers) onlyt[Comp. 1]/t[Comp. 2]
Class 1Class 2
1111
1111
11
11
1111
11
1111
1111
11
11
1111
11
11
11
11
11
11
11
11
1111 11
1111
11111111
11 11 11 111111
1111
11
11
58 58
58
58
58
58
58
58
58
58
58
5858
5858
5858
58
58
585858
58
58
58
58
58
58
58
5858
5858 58
58
58
58
58
-80
-60
-40
-20
0
20
40
60
80
-90 -80 -70 -60 -50 -40 -30 -20 -10 0 10 20 30 40 50 60 70 80 90 100 110
t[2]
t[1]
integrated_orignal_intensity_liver_Epac397 Transcriptomics only.M1 (PCA-X)t[Comp. 1]/t[Comp. 2]
Class 1Class 2
11
11
11 1111
11
11
11
11
11
11
11
11
11 1111
1111
11
11
11
11
11
11
1111
11
11
1111
1111
11
11
11
11
11
11
11
11
1111
11
11
58
585858
58
58
58 58
58
5858
5858
58
58
58
58
58
58
58
58
58
58
58
58 58
58
58
5858
58
58
58
58
58
58
58 58
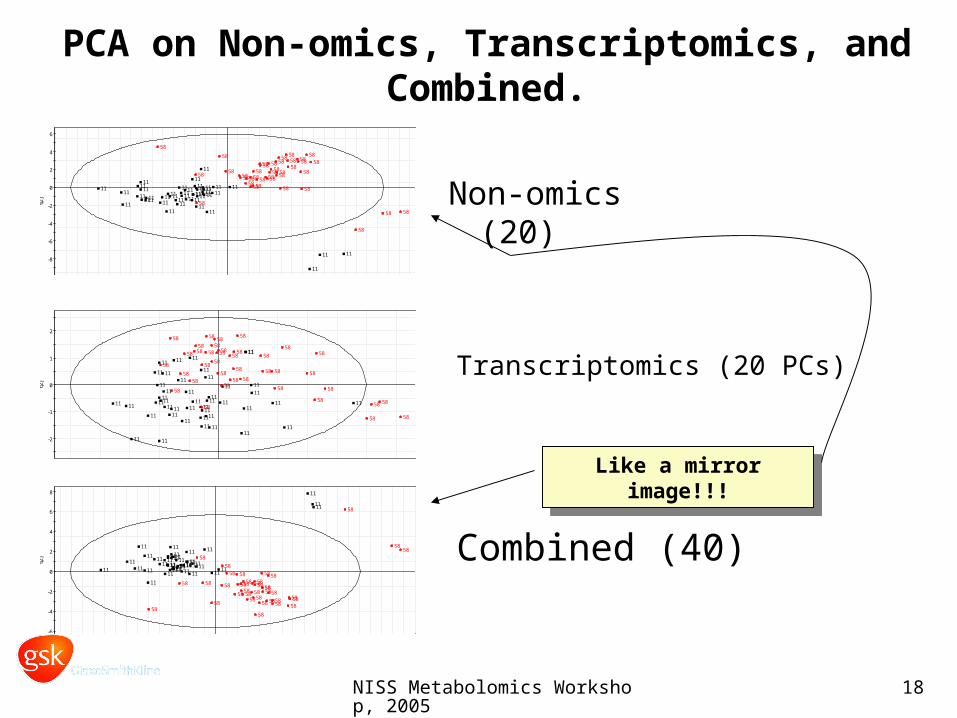
Non-omics (20)
Transcriptomics (12,488)
Combined (12,508)
Mirror image!!!Mirror image!!!
Transcriptomics data dominate Non-omics data!!!
-80
-60
-40
-20
0
20
40
60
80
-90 -80 -70 -60 -50 -40 -30 -20 -10 0 10 20 30 40 50 60 70 80 90 100 110
t[2]
t[1]
integrated_orignal_intensity_liver_Epac397 non-omics 20 n transcriptomics.M1 (PCA-X)t[Comp. 1]/t[Comp. 2]
Class 1Class 2
11
11
11 1111
11
11
11
11
11
11
11
11
11 1111
1111
11
11
11
11
11
11
1111
11
11
1111
1111
11
11
11
11
11
11
11
11
1111
11
11
58
585858
58
58
58 58
58
5858
5858
58
58
58
58
58
58
58
58
58
58
58
58 58
58
58
5858
58
58
58
58
58
58
58 58
NISS Metabolomics Workshop, 2005 18
PCA on Non-omics, Transcriptomics, and Combined.
-8
-6
-4
-2
0
2
4
6
-8 -7 -6 -5 -4 -3 -2 -1 0 1 2 3 4 5 6 7 8
t[2]
t[1]
integrated_orignal_intensity_liver_Epac397.M1 (PCA-X), Non-omics (40 markers) onlyt[Comp. 1]/t[Comp. 2]
Class 1Class 2
1111
1111
11
11
1111
11
1111
1111
11
11
1111
11
11
11
11
11
11
11
11
1111 11
1111
11111111
11 11 11 111111
1111
11
11
58 58
58
58
58
58
58
58
58
58
58
5858
5858
5858
58
58
585858
58
58
58
58
58
58
58
5858
5858 58
58
58
58
58
Non-omics (20)
Transcriptomics (20 PCs)
Combined (40)
Like a mirror image!!!Like a mirror image!!!
-6
-4
-2
0
2
4
6
8
-7 -6 -5 -4 -3 -2 -1 0 1 2 3 4 5 6 7 8 9
t[2]
t[1]
Nonomics20 n Tran20.M1 (PCA-X)t[Comp. 1]/t[Comp. 2]
Class 1Class 2
111111
11
111111 11
11
11
11
11
1111
11
1111
11
11
11
11
11
11
11
11
11
1111
1111
1111
111111 11 11 1111
1111
1111
11
5858
58
58
5858
58
58
58
58
58
5858
5858
58
58
58
58
5858
58
58
58
58
58
58
58
58
5858
5858 58
58
58
58
58
-2
-1
0
1
2
-2 -1 0 1 2 3
t[2]
t[1]
Transcriptome first 20 PCs.M2 (PCA-X)t[Comp. 1]/t[Comp. 2]
Class 1Class 2
11
11
11 1111
11
11
11
11
11
11
11
11
11 1111
1111
11
11
11
11
11
11
1111
11
11
1111
1111
11
11
11
11
11
11
11
11
1111
11
11
58
585858
58
58
58 58
58
5858
5858
58
58
58
58
58
58
58
58
58
58
58
58 58
58
58
5858
58
58
58
58
58
58
58 58
NISS Metabolomics Workshop, 2005 19
Integration approach 2: Integrate on selected markers– 9 blood chemistry + 2000 probe sets + 150 metabolites
– There are still platforms with more selected markers
– How to weight different platforms appropriately? Eg. 9 blood chemistry markers are known to relate to disease or drug
– Identify relationship among the probe sets, metabolites, along with the blood chemistry markers in terms of biological pathways
Challenge #4: Data integrationExample 2

NISS Metabolomics Workshop, 2005 20
NormalDisease
-30
-20
-10
0
10
20
30
-70 -60 -50 -40 -30 -20 -10 0 10 20 30 40 50 60 70
t[2]
t[1]
fat integrated.M11 (PCA-X), Allt[Comp. 1]/t[Comp. 2]Colored according to values in variable fat integrated
Ellipse: Hotelling T2 (0.95)
Series (Settings for DIET)
Missing1158
D10D10
D10
D10D10
D10
D10
D10D30D30
D30
D30D30D30
D30D60
D60
D60
D60D60
D60
Veh
Veh
Veh
Veh
VehVeh
Veh
D10
D10
D10
D10D10D10 D10D10
D10 D30D30 D30
D30
D30
D30
D30
D30
D30D30
D60 D60
D60D60
D60
D60
D60
D60
D60
Veh
Veh
Veh
Veh
VehVeh
VehVeh
SIMCA-P+ 10.5 - 04/23/2004 14:57
Principle Component Analysis (PCA )
Projection of 67 animals of 28 normal (black) , 39 disease (red)
(9 NO, 1991 TA, 115 MT)
All markers used for projection
NISS Metabolomics Workshop, 2005 21
-0.060
-0.050
-0.040
-0.030
-0.020
-0.010
0.000
0.010
0.020
0.030
0.040
0.050
-0.030 -0.020 -0.010 0.000 0.010 0.020 0.030
p[2]
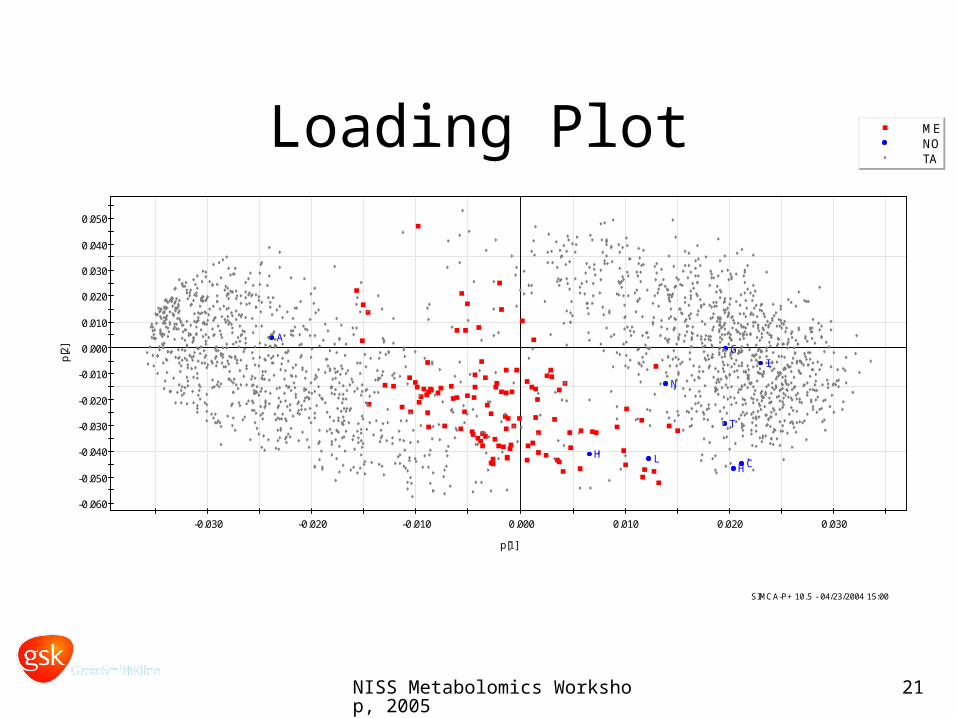
p[1]
fat integrated.M11 (PCA-X), Allp[Comp. 1]/p[Comp. 2]Colored according to Var ID (Platform)
MENOTA
G
C
T
N
HH
I
A
L
SIMCA-P+ 10.5 - 04/23/2004 15:00
Loading Plot

NISS Metabolomics Workshop, 2005 22
-30
-20
-10
0
10
20
30
-80 -70 -60 -50 -40 -30 -20 -10 0 10 20 30 40 50 60 70 80
t[2]
t[1]
fat integrated.M6 (PLS-DA), All platforms, HFDt[Comp. 1]/t[Comp. 2]Colored according to classes in M6
Ellipse: Hotelling T2 (0.95)
Class 1Class 2
Veh
VehVeh
Veh
VehVeh
Veh
VehVeh
Veh
D10
D10
D10 D10
D10D10
D10
D10
D10D30D30
D30
D30
D30
D30
D30
D30
D30 D30
D60 D60D60
D60
D60
D60D60
D60
D60
D60
SIMCA-P+ 10.5 - 04/23/2004 15:13
Partial Least Square Discriminant Analysis (PLS-DA)
Disease group only
VehicleDrug
NISS Metabolomics Workshop, 2005 23
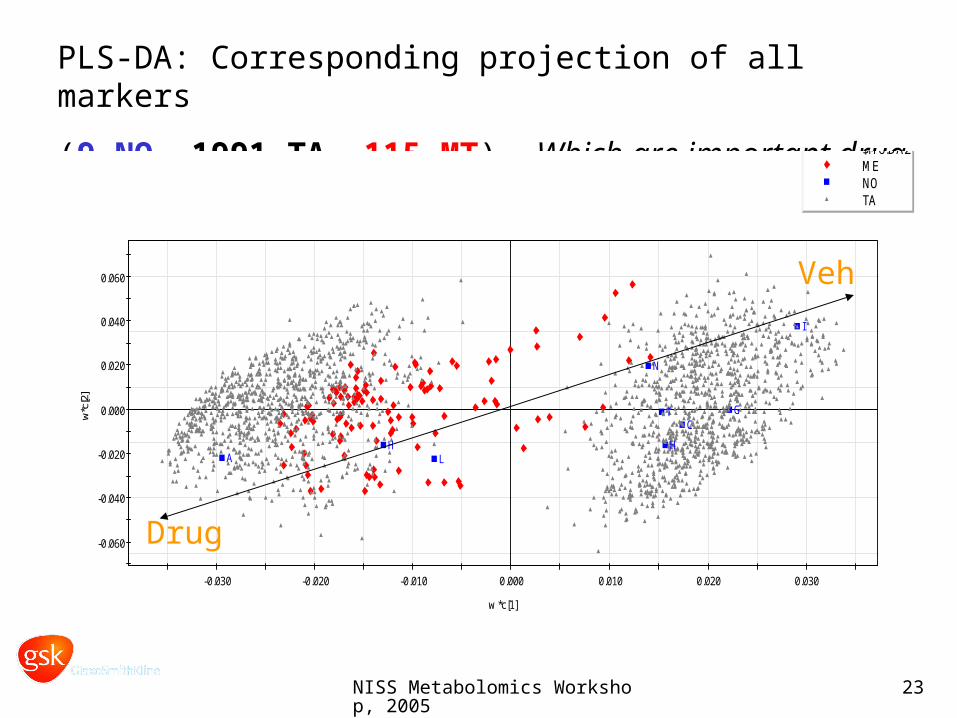
PLS-DA: Corresponding projection of all markers
(9 NO, 1991 TA, 115 MT), Which are important drug markers?
-0.060
-0.040
-0.020
0.000
0.020
0.040
0.060
-0.030 -0.020 -0.010 0.000 0.010 0.020 0.030
w*c
[2]
w *c[1]
fat integrated.M6 (PLS-DA), All platforms, HFDw*c[Comp. 1]/w*c[Comp. 2]Colored according to Var ID (Platform)
$M6.DA1$M6.DA2MENOTA
$
$
GC
T
N
HH
I
A L
SIMCA-P+ 10.5 - 04/23/2004 15:19
Drug
Veh

NISS Metabolomics Workshop, 2005 24
Ranked drug markers by importance or by coefficients.
marker importance by variable importance on projection
Up or down regulation by coefficients
0.00
0.20
0.40
0.60
0.80
1.00
1.20
1.40
1.60
100 200 300 400 500 600 700 800 900 1000 1100 1200 1300 1400 1500 1600 1700 1800 1900 2000 2100
VIP
[4]
fat integrated.M6 (PLS-DA), All platforms, HFDVIP[Comp. 4]
-0.0100
-0.0080
-0.0060
-0.0040
-0.0020
0.0000
0.0020
0.0040
0.0060
0.0080
0.0100
100 200 300 400 500 600 700 800 900 1000 1100 1200 1300 1400 1500 1600 1700 1800 1900 2000 2100
Coe
ffCS
[4](
$M6.
DA
1)
fat integrated.M6 (PLS-DA), All platforms, HFDCoeffCS[Comp. 4](YVar $M6.DA1)
NISS Metabolomics Workshop, 2005 25
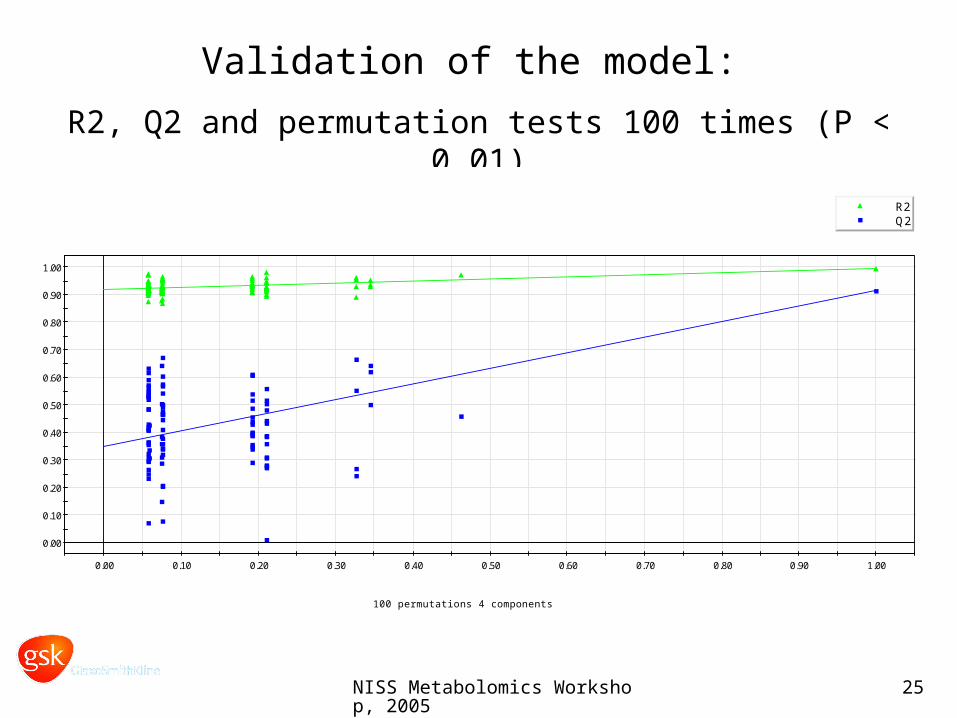
Validation of the model:
R2, Q2 and permutation tests 100 times (P < 0.01)
0.00
0.10
0.20
0.30
0.40
0.50
0.60
0.70
0.80
0.90
1.00
0.00 0.10 0.20 0.30 0.40 0.50 0.60 0.70 0.80 0.90 1.00
fat integrated.M6 (PLS-DA): Validate Model$M6.DA1 Intercepts: R2=(0.0, 0.918), Q2=(0.0, 0.35)
100 permutations 4 components
R2Q2
NISS Metabolomics Workshop, 2005 26
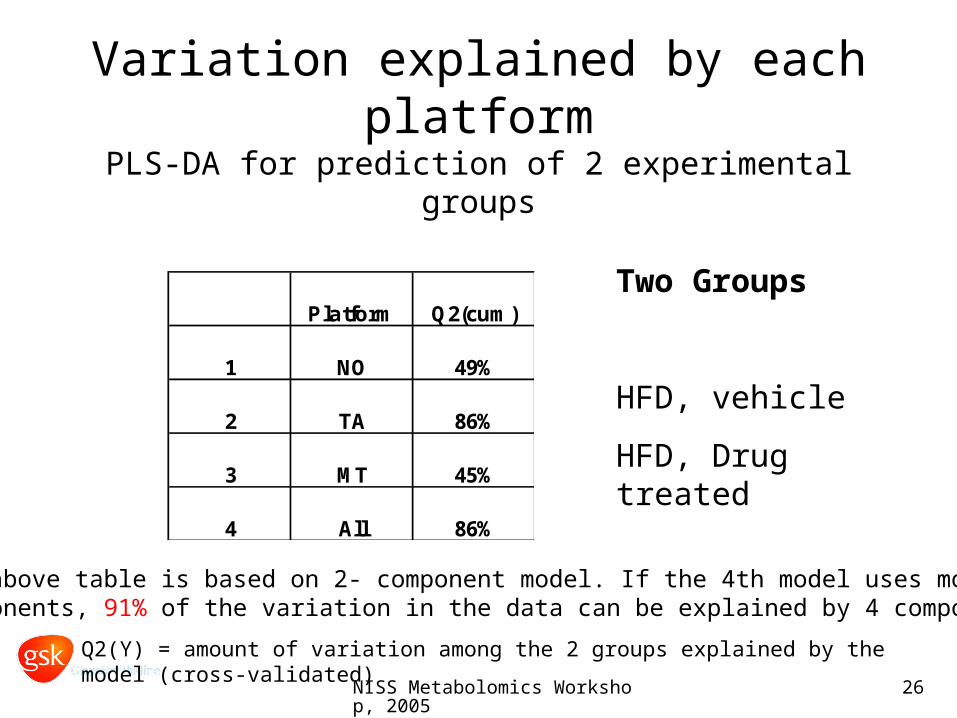
Variation explained by each platformPLS-DA for prediction of 2 experimental groups
Platform Q2(cum)
1 NO 49%
2 TA 86%
3 MT 45%
4 All 86%
Two Groups
HFD, vehicle
HFD, Drug treated
Q2(Y) = amount of variation among the 2 groups explained by the model (cross-validated)
The above table is based on 2- component model. If the 4th model uses morecomponents, 91% of the variation in the data can be explained by 4 components.

NISS Metabolomics Workshop, 2005 27
Challenge #5: Validation of the Prediction Model
• Correct way of doing cross-validation– Especially when the variables are selected
• Is your prediction accuracy significant?

NISS Metabolomics Workshop, 2005 28
Random Noise Data
• Simulate 20,000 marker columns of random noise for 100 patients and one additional column containing arbitrary labels of class indicators.
• Select 5 marker columns showing most correlation with class label.
• Make a prediction model for class indicators based on these 5 selected markers.
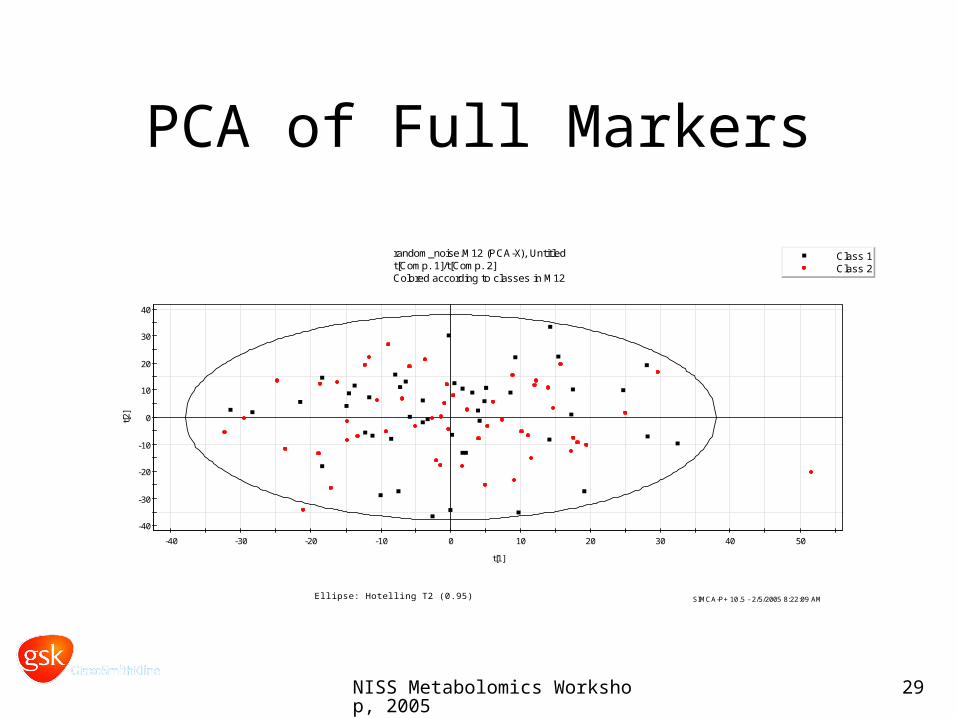
NISS Metabolomics Workshop, 2005 29
PCA of Full Markers
-40
-30
-20
-10
0
10
20
30
40
-40 -30 -20 -10 0 10 20 30 40 50
t[2]
t[1]
random_noise.M12 (PCA-X), Untitledt[Comp. 1]/t[Comp. 2]Colored according to classes in M12
Ellipse: Hotelling T2 (0.95)
Class 1Class 2
SIMCA-P+ 10.5 - 2/5/2005 8:22:09 AM
NISS Metabolomics Workshop, 2005 30
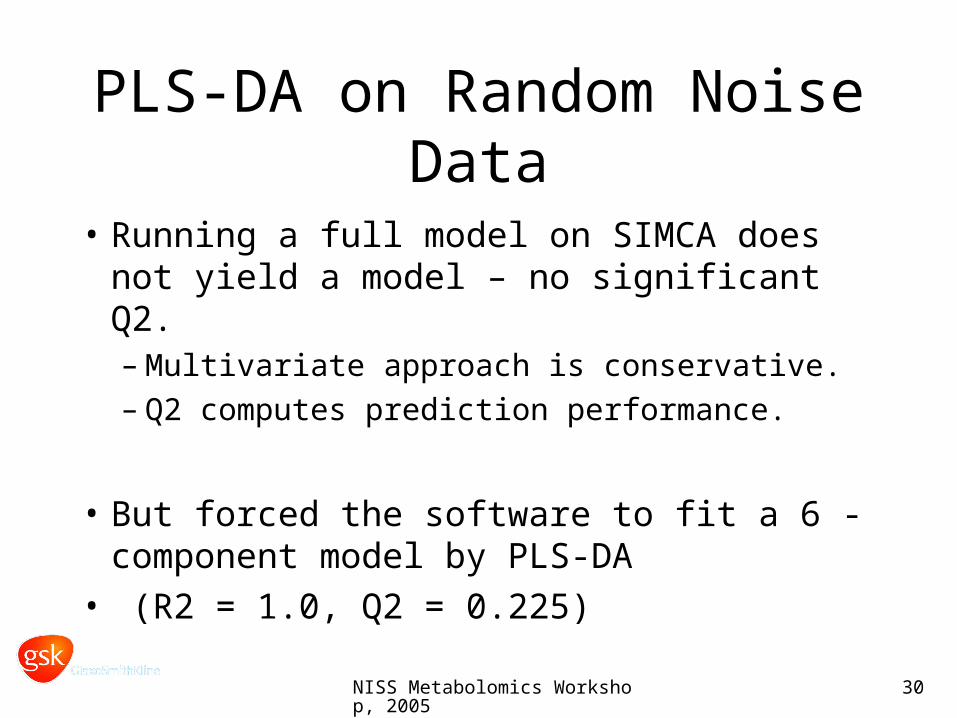
PLS-DA on Random Noise Data
• Running a full model on SIMCA does not yield a model – no significant Q2.– Multivariate approach is conservative.– Q2 computes prediction performance.
• But forced the software to fit a 6 -component model by PLS-DA
• (R2 = 1.0, Q2 = 0.225)

NISS Metabolomics Workshop, 2005 31
Full marker modelPLS-DA
-30
-20
-10
0
10
20
30
-30 -20 -10 0 10 20 30
t[2]
t[1]
random_noise.M1 (PLS-DA), All datat[Comp. 1]/t[Comp. 2]Colored according to classes in M1
Ellipse: Hotelling T2 (0.95)
Class 1Class 2
SIMCA-P+ 10.5 - 2/4/2005 1:20:50 PM

NISS Metabolomics Workshop, 2005 32
Was it real or by chance?
0.20
0.30
0.40
0.50
0.60
0.70
0.80
0.90
1.00
0.00 0.10 0.20 0.30 0.40 0.50 0.60 0.70 0.80 0.90 1.00
random_noise.M1 (PLS-DA): Validate Model$M1.DA1 Intercepts: R2=(0.0, 1), Q2=(0.0, 0.245)
20 permutations 6 components
R2Q2
SIMCA-P+ 10.5 - 2/4/2005 1:19:58 PM
NISS Metabolomics Workshop, 2005 33
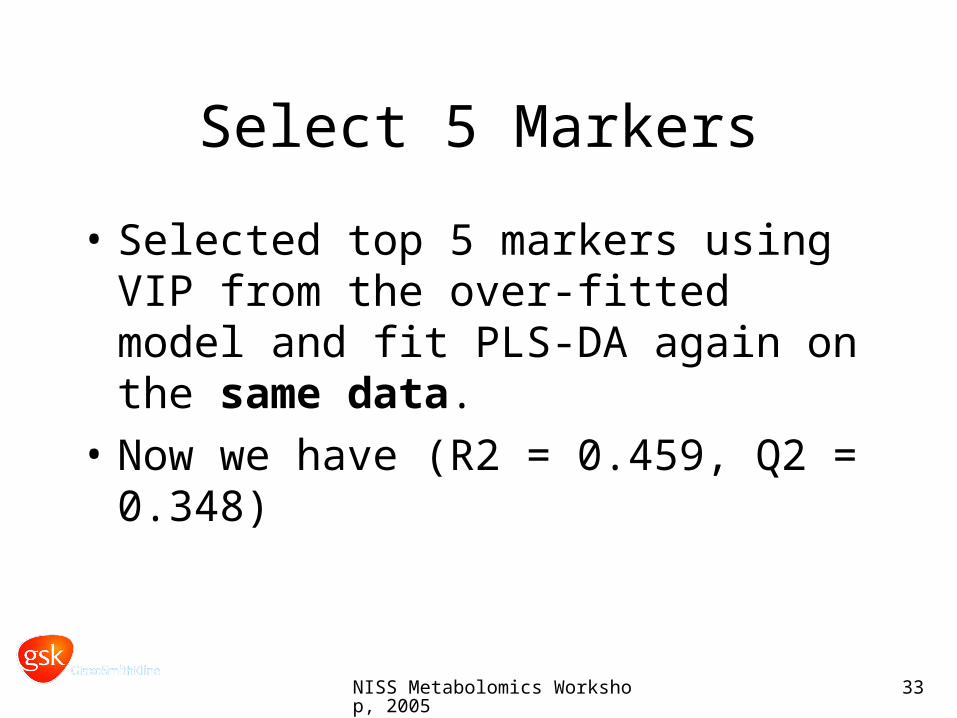
Select 5 Markers
• Selected top 5 markers using VIP from the over-fitted model and fit PLS-DA again on the same data.
• Now we have (R2 = 0.459, Q2 = 0.348)

NISS Metabolomics Workshop, 2005 34
Good prediction from PLS-DA? Q2 = 0.35
-3
-2
-1
0
1
2
-3 -2 -1 0 1 2 3
t[2]
t[1]
random_noise.M11 (PLS-DA), Untitledt[Comp. 1]/t[Comp. 2]R2 = 0.447, Q2=0.348
Ellipse: Hotelling T2 (0.95)
Class 1Class 2
SIMCA-P+ 10.5 - 1/19/2005 10:17:08 PM

NISS Metabolomics Workshop, 2005 35
Validated by permutation test?Significance of Q2
-0.20
0.00
0.20
0.40
0.60
0.80
1.00
0.00 0.10 0.20 0.30 0.40 0.50 0.60 0.70 0.80 0.90 1.00
random_noise.M11 (PLS-DA): Validate Model$M11.DA1 Intercepts: R2=(0.0, 0.0155), Q2=(0.0, -0.17)
20 permutations 2 components
R2Q2
SIMCA-P+ 10.5 - 1/19/2005 10:21:30 PM

NISS Metabolomics Workshop, 2005 36
Selection Bias
• When a prediction model is tested on the same data that were used in the first instance to select the markers, selection bias makes the test error overly optimistic.– Many publications claimed a small set of selected
“genes” is highly predictive.– IBI practice is to use a data set to select markers
and use the same data set to fit a prediction model based on selected markers.
NISS Metabolomics Workshop, 2005 37
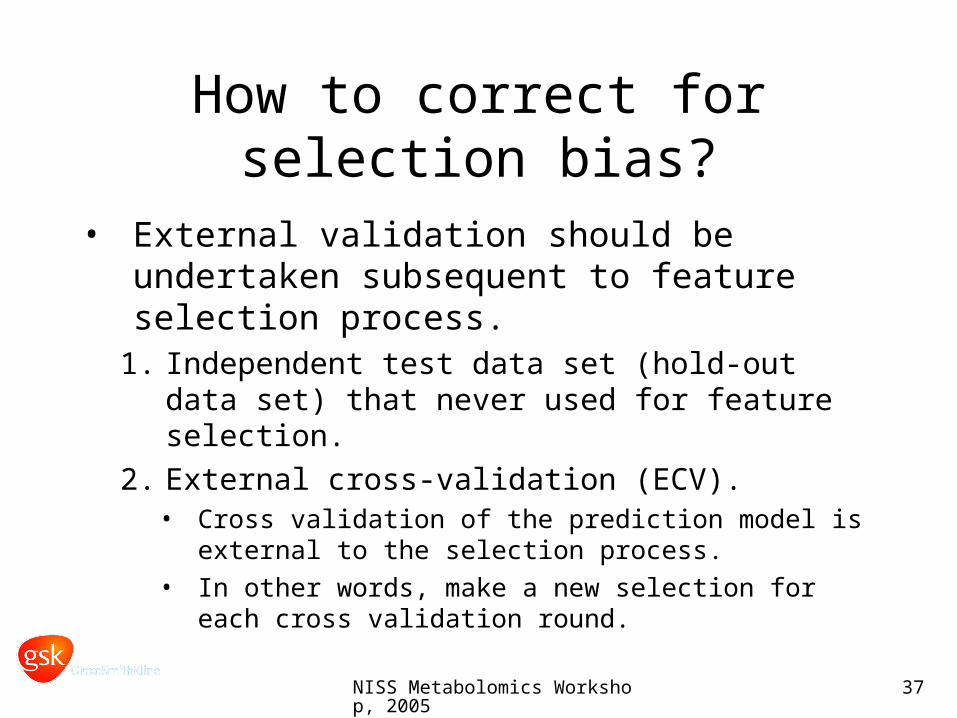
How to correct for selection bias?
• External validation should be undertaken subsequent to feature selection process.
1. Independent test data set (hold-out data set) that never used for feature selection.
2. External cross-validation (ECV).• Cross validation of the prediction model is
external to the selection process.
• In other words, make a new selection for each cross validation round.

NISS Metabolomics Workshop, 2005 38
Externally Validated PLS.Model and variable selection
• Divide the data set randomly into d parts.• Set ecv = 1; (this means hold-out one part and use d-1 parts for modeling)• Set a =1 ; (the number of components, do until 10)• Set k = total number of variables;• Loop: • Fit PLS model with given a and k , PLS (a,k);• Predict hold-out set, compute PRESS (ecv, a, k) and save;• Choose top half of the variables by appropriate statistics (coeff, vip, t-ratio etc);• Set k = k/2;• Go back to Loop until k = 2;• Set a = a + 1;• Go back to Loop until a =10;• Set ecv = ecv + 1;• Go back to Loop until ecv = d;• Compute PRESS (a, k) = Sum over ecv {PRESS (ecv, a, k)};• Compute Q2(a, k) = 1 – PRESS (a, k)/TSS;• Plot Q2(a,k) vs. log2(k);

NISS Metabolomics Workshop, 2005 39
Simulation of 2000 Random DataR. Simon 2003
• 20 x 6000 and 10/10 for class labels
• Repeat 2000 times
• Compute 3 different error rates– Re-substitution (wrong)– Cross validation after selection (wrong)– Cross validation before selection (correct)

NISS Metabolomics Workshop, 2005 40
Results of 2000 Random Data
NISS Metabolomics Workshop, 2005 41
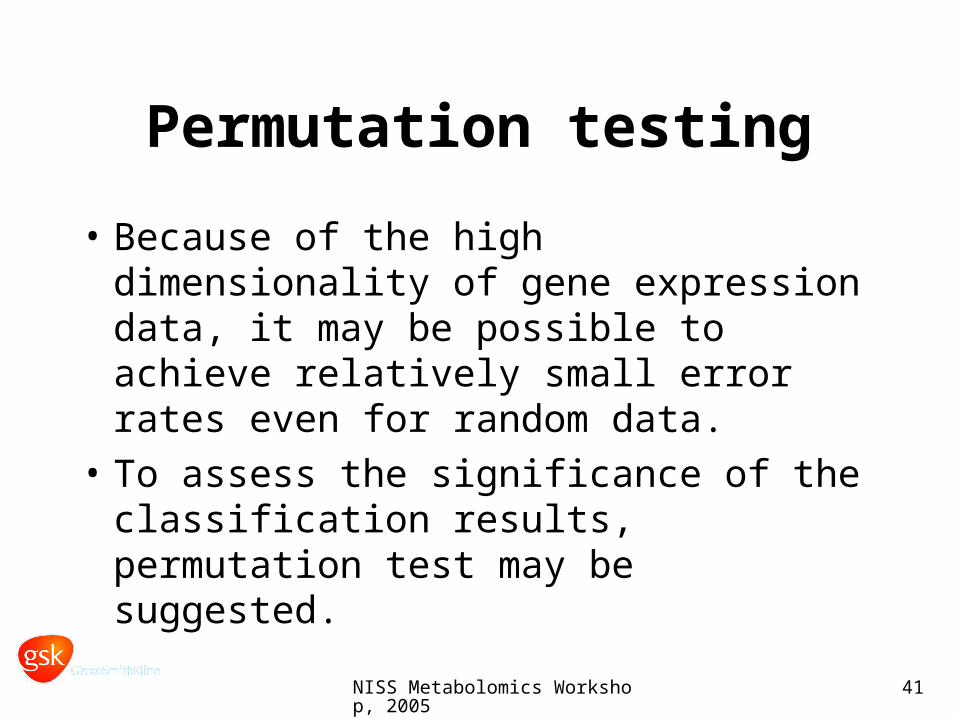
Permutation testing
• Because of the high dimensionality of gene expression data, it may be possible to achieve relatively small error rates even for random data.
• To assess the significance of the classification results, permutation test may be suggested.
NISS Metabolomics Workshop, 2005 42
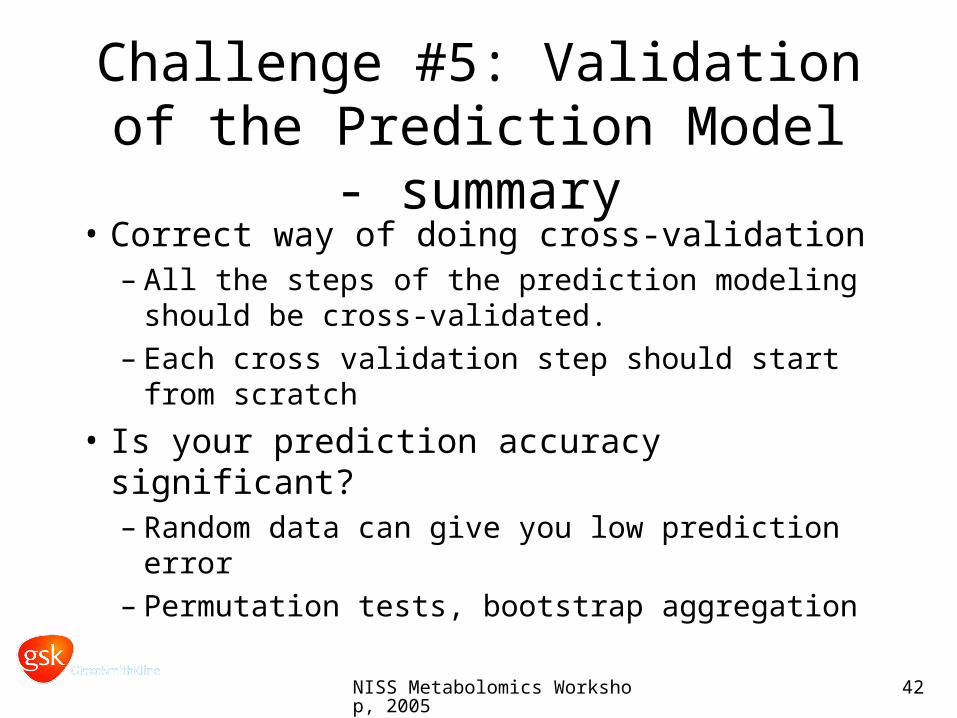
Challenge #5: Validation of the Prediction Model - summary
• Correct way of doing cross-validation– All the steps of the prediction modeling should
be cross-validated.– Each cross validation step should start from
scratch
• Is your prediction accuracy significant?– Random data can give you low prediction error– Permutation tests, bootstrap aggregation

NISS Metabolomics Workshop, 2005 43
Summary and Discussion• Recent technological advances present
challenging and interesting biological data at molecular level.
• Statistics and multivariate analysis play an important role in understanding and extracting knowledge from these type of data.
• Integrative analysis is even more challenging and we presented some solutions to these challenges. There is plenty of room for improvement.

NISS Metabolomics Workshop, 2005 44
Acknowledgement
GlaxoSmithKline– High Throughput Biology– Biomedical Data Sciences– Genomics and Proteomics Science
– Pathology, Cellular & Biochemical Toxicology
– Discovery IT

NISS Metabolomics Workshop, 2005 45
Data exploration: Present Challenges
Data is an extremely valuable asset, but like a cash crop, unless harvested, it is wasted.
- Sid Adelman
Related Documents