NIR Polarimetry: A Viable Alternative for Juice Polarization Analysis Polarization Analysis Marrington McDonald Sugar Industry Research Institute Kendal Road, Mandeville, Jamaica, W.I. Annual JAST Conference 2005 Annual JAST Conference 2005

Welcome message from author
This document is posted to help you gain knowledge. Please leave a comment to let me know what you think about it! Share it to your friends and learn new things together.
Transcript

NIR Polarimetry: A Viable Alternative for Juice Polarization AnalysisPolarization Analysis
Marrington McDonaldgSugar Industry Research InstituteKendal Road, Mandeville, Jamaica, W.I.
Annual JAST Conference 2005Annual JAST Conference 2005

ObjectivesObjectives
• Comprehensive evaluation of NIR• Comprehensive evaluation of NIR Polarimetry.
• Determine Feasibility of the use of NIR Polarimetry in Juice Polarization in Jamaican mills.
IntroductionIntroduction• Polarimeters provide a distinct advantagePolarimeters provide a distinct advantage
as they can be calibrated with certified standards.
• They provide reliable data on which cane payment and process control can be p y pbased.
• However standard polarimeters cannot• However, standard polarimeters cannot analyze dark substances due to their operating wavelength.

Introduction cont’dIntroduction cont d
• The use of chemical clarifiers facilitate• The use of chemical clarifiers facilitate utilizing standard polarimeters but chemicals impact negatively on cost and p g ythe environment.
• NIR polarimeters are developed to measure dark substances provided they are optically clear.

What is NIR Polarimetry?What is NIR Polarimetry?• NIR refers to a specific range ofNIR refers to a specific range of
wavelengths in the electromagnetic spectrum (usually 800-2000 nm).
• NIR is not a method but is used in a number of techniques such as qspectroscopy, refractometry and polarimetry.
• Modern NIR polarimeters typically operate at 882.6 nm.
NIR polarimetryNIR polarimetry• Light waves at 882.6 nm are able to passLight waves at 882.6 nm are able to pass
through highly colored solutions because colored solutions do not absorb light at this wavelengththis wavelength.
• No color removal is required.q
• The retention of all optically active components means that polarizationcomponents means that polarization correspond to a solution that is not altered chemically.
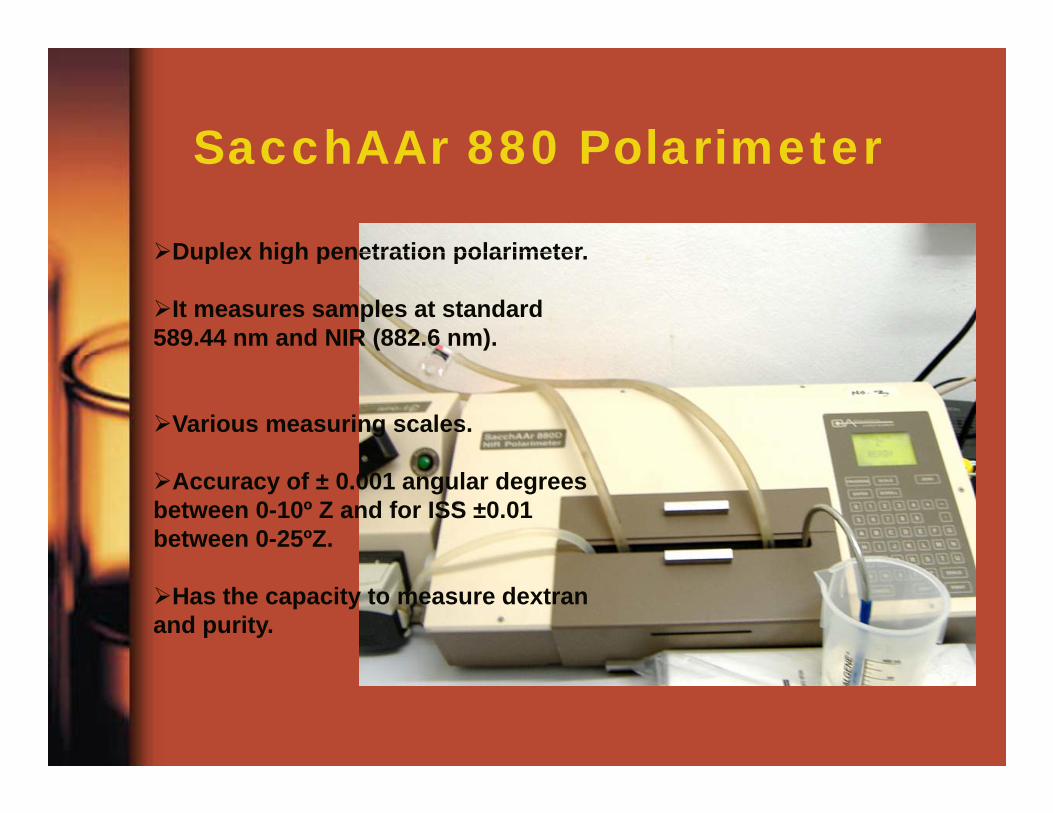
SacchAAr 880 PolarimeterSacchAAr 880 Polarimeter
Duplex high penetration polarimeterDuplex high penetration polarimeter.
It measures samples at standard 589.44 nm and NIR (882.6 nm).
Various measuring scales.
Accuracy of ± 0.001 angular degrees between 0-10º Z and for ISS ±0.01 between 0-25ºZ.
Has the capacity to measure dextran and purity.
SacchAAr 880 PolarimeterSacchAAr 880 Polarimeter
• Instrument has a stable quartz halogenInstrument has a stable quartz halogen lamp light source.
O ti l i t f filt l t• Optical interference filters select wavelength.
• Calibration with standard quartz plate at 589.44 nm.
• NIR calibration usually done with sucrose solution.solution.
SIRI’s ExperienceSIRI s Experience
• 2002 SIRI started work with NIR• 2002 SIRI started work with NIR polarimeters.
• Work involved various phases:» Dextran analyses (juice, sugar and
standards) ongoing» Comparative dextran studies and Method p
Validation» Polarization analysis of sugars (ongoing)» Polarization analysis of juicePolarization analysis of juice

SIRI’s ExperienceSIRI s Experience
• Dextran analysesDextran analyses» Work at Central lab and in the fields with a view
to effectively evaluate method.
» Comparative dextran study
» Due to the emergence of a new method (Midl d™) d i i t t d t thi(Midland™) and some inconsistent data this study was done. Challenges related to accuracy, precision and ambient conditions were encountered.
• Method Validation (DASA)» Done based on previous study and indicated
method was imprecise but fairly accurate.

SIRI’s ExperienceSIRI s Experience
• Juice Polarization• Juice Polarization» Main focus of this report and follows work
at a Core lab A at the inception.
» Current work done at two Core labs B and C.
» Comparison between NIR method and current method (Octapol® clarified).cu e t et od (Octapo ® c a ed)
» Results indicate very good correlation between the two methodsbetween the two methods.
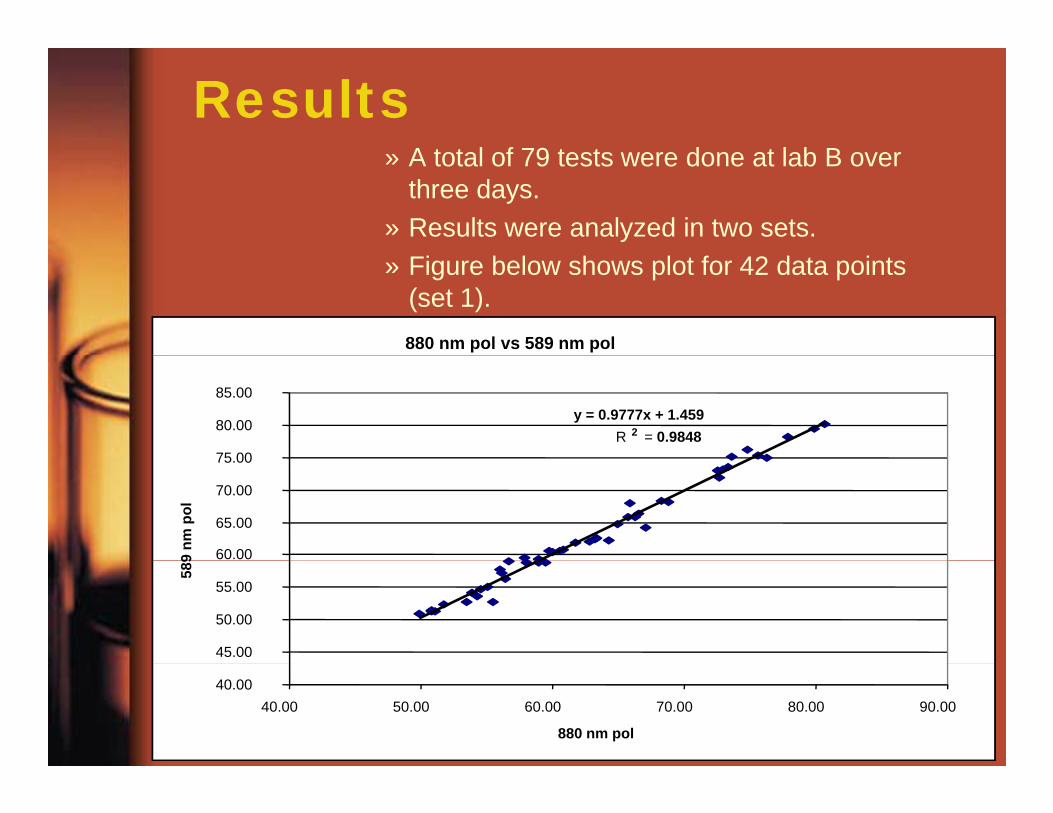
ResultsA t t l f 79 t t d t l b B» A total of 79 tests were done at lab B over three days.
» Results were analyzed in two sets.» Figure below shows plot for 42 data points
(set 1).880 nm pol vs 589 nm pol
y = 0.9777x + 1.459R 2 = 0.9848
75 00
80.00
85.00
60.00
65.00
70.00
75.00
9 nm
pol
45.00
50.00
55.00
589
40.0040.00 50.00 60.00 70.00 80.00 90.00
880 nm pol

Results cont’d» The figure below shows plot for 37 data
points (set 2 lab B).» A lower correlation coefficient is related to
instrument instability (defective filter).
589nm pol vs 880 nm pol (Juice)
y = 0 9704x + 1 6555y = 0.9704x + 1.6555R 2 = 0.8998
85 00
90.00
95.00
100.00
70.00
75.00
80.00
85.00
589
nm p
ol
50 00
55.00
60.00
65.00
50.0050.00 60.00 70.00 80.00 90.00 100.00
880 nm pol

Results cont’d» Two sets of data were also obtained from
lab C.» The figure below shows plot for 125 data g p
points (set 1).
NIR pol vs 589 Pol
y = 0.9786x + 0.597
R 2 =0.98758
0
90
m
60
7058
9 n
pol
Pol
40
50
30 30 4
050
60
70
80 90
NIR (880 nm) pol
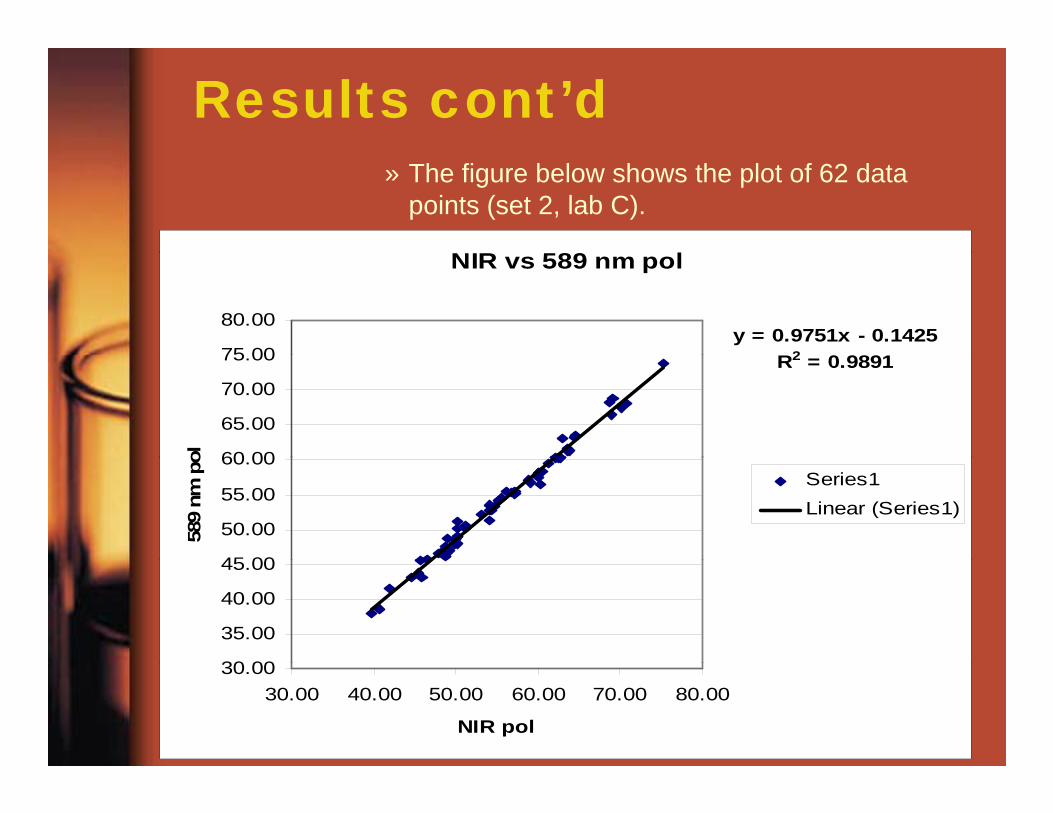
Results cont’d» The figure below shows the plot of 62 data
points (set 2, lab C).
NIR 589 lNIR vs 589 nm pol
y = 0.9751x - 0.1425R2 0 989175 00
80.00
R2 = 0.9891
60 00
65.00
70.00
75.00
ol
45 00
50.00
55.00
60.00
589
nm p
o
Series1Linear (Series1)
30 00
35.00
40.00
45.00
30.0030.00 40.00 50.00 60.00 70.00 80.00
NIR pol

Results cont’d» The figure below shows overall linear
regression for 271 data points.
Overall Linear Regression
y = 0 9957x - 0 4138100.00
y 0.9957x 0.4138R2 = 0.9836
60 00
70.0080.00
90.00
ol
30 00
40.00
50.00
60.00
589
nm p
o
0 00
10.00
20.0030.00
0.000.00 20.00 40.00 60.00 80.00 100.00
880 nm pol
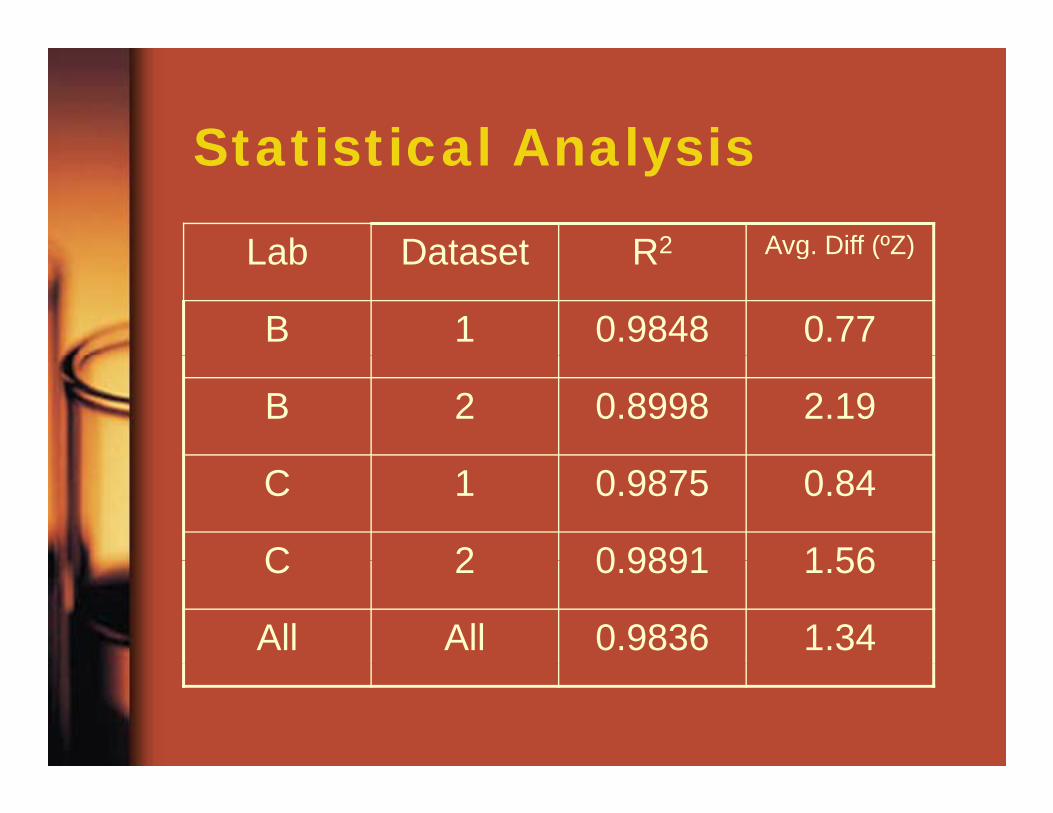
Statistical AnalysisStatistical Analysis
Lab Dataset R2 Avg. Diff (ºZ)Lab Dataset R2 Avg. Diff ( Z)
B 1 0.9848 0.77
B 2 0.8998 2.19
C 1 0.9875 0.84
C 2 0 9891 1 56C 2 0.9891 1.56
All All 0.9836 1.34

Cost AnalysisCost Analysis
Th f ll i t bl Method NIR ($) Conventional ($)– The following table outlines a ten-year cost comparison between the NIR
d ti l
Method NIR ($) Conventional ($)
Instrument 15,536,500.00 12,247,500.00and conventionalmethods.
– 1 Filter cel E– 2 Octapol®
Reagents 6,840,000.001 30,000,000.002
Filter paper 8,100,000.00 8,100,000.00
Filtration 700,000.00Filtration system
700,000.00
Total ($) 31,176,500.00 50,347,500.00
Cost Analysis cont’dCost Analysis cont d– Cost of NIR instrument is based on an Optical p
Activity quotation dated October 25, 2005.
– Cost of instrument for conventional method is based on current price of polAAr 31 polarimeteron current price of polAAr 31 polarimeter.
– Cost of NIR reagent is based on current price (£150/kg) of recommended filter aid.
– Cost of Octapol® is based on 2004 figure.
– Cost of filter paper is current price.
– Total cost is calculated based on an average number of tests of 200 000of tests of 200,000.
Discussion & ConclusionDiscussion & Conclusion
• Challenges related to the use of theChallenges related to the use of the method:
» Method of filtration. This may be affected by quality of filter paper and filter aid used4by quality of filter paper and filter aid used4.
» Impact of ambient conditions.
• Several aspects of analytical procedure were evaluated.
» Robustness» Robustness » Ability to generate accurate, reproducible
results under field conditions.
Discussion & ConclusionDiscussion & Conclusion
• NIR polarimetry has multiple applications and based on the data presented it is a
it bl d i bl l t fsuitable and viable replacement for conventional methods of juice polarization.
• Investigation with dark products will continue throughout the 2005/2006 crop.

AcknowledgementsAcknowledgements
– The Director of SIRI and the JAST SecretariatThe Director of SIRI and the JAST Secretariat for allowing the presentation of this report.
– Mr. Sydney Roman for analytical work.
– Dr. E. Roberts and Mr. J. Jaddoo for editing the paper.
– You, the audience, for listening so attentively.
Related Documents