REVIEW ARTICLE published: 07 August 2014 doi: 10.3389/fpls.2014.00388 NIR and Py-mbms coupled with multivariate data analysis as a high-throughput biomass characterization technique: a review Li Xiao 1 *, Hui Wei 2 , Michael E. Himmel 2 , Hasan Jameel 1 and Stephen S. Kelley 1 * 1 Department of Forest Biomaterials, North Carolina State University, Raleigh, NC, USA 2 National Renewable Energy Laboratory, Biosciences Center, Golden, CO, USA Edited by: Miguel Vega-Sanchez, Lawrence Berkeley National Laboratory, USA Reviewed by: Benjamin Dawson-Andoh, West Virginia University, USA Jason Lupoi, University of Queensland, USA Jakub Sandak, Istituto per la Valorizzazione del Legno e delle Specie Arboree del Consiglio Nazionale delle Ricerche, Italy *Correspondence: Stephen S. Kelley and Li Xiao, Department of Forest Biomaterials, North Carolina State University, Raleigh, NC 27606, USA e-mail: [email protected]; [email protected] Optimizing the use of lignocellulosic biomass as the feedstock for renewable energy production is currently being developed globally. Biomass is a complex mixture of cellulose, hemicelluloses, lignins, extractives, and proteins; as well as inorganic salts. Cell wall compositional analysis for biomass characterization is laborious and time consuming. In order to characterize biomass fast and efficiently, several high through-put technologies have been successfully developed. Among them, near infrared spectroscopy (NIR) and pyrolysis-molecular beam mass spectrometry (Py-mbms) are complementary tools and capable of evaluating a large number of raw or modified biomass in a short period of time. NIR shows vibrations associated with specific chemical structures whereas Py- mbms depicts the full range of fragments from the decomposition of biomass. Both NIR vibrations and Py-mbms peaks are assigned to possible chemical functional groups and molecular structures. They provide complementary information of chemical insight of biomaterials. However, it is challenging to interpret the informative results because of the large amount of overlapping bands or decomposition fragments contained in the spectra. In order to improve the efficiency of data analysis, multivariate analysis tools have been adapted to define the significant correlations among data variables, so that the large number of bands/peaks could be replaced by a small number of reconstructed variables representing original variation. Reconstructed data variables are used for sample comparison (principal component analysis) and for building regression models (partial least square regression) between biomass chemical structures and properties of interests. In this review, the important biomass chemical structures measured by NIR and Py-mbms are summarized.The advantages and disadvantages of conventional data analysis methods and multivariate data analysis methods are introduced, compared and evaluated. This review aims to serve as a guide for choosing the most effective data analysis methods for NIR and Py-mbms characterization of biomass. Keywords: biomass characterization, lignocellulosic biofuel, near infrared spectroscopy, pyrolysis molecular beam, mass spectrometry, multivariate data analysis, high throughput, chemometrics INTRODUCTION FOR BIOMASS CHEMICAL COMPOSITION Biomass is a complicated mixture of organic and inorganic compounds. It is mainly composed of cellulose, hemicelluloses and lignins, as well as minor components, such as proteins, extrac- tives, ash, and other nonstructural mineral materials. Because of its renewable nature and chemical composition, biomass is an attractive feedstock for energy and chemical products (Ragauskas et al., 2006; Himmel et al., 2007; Wei et al., 2009; Sluiter et al., 2010). In order to provide an effective guide for feedstock selec- tion and process development, it is very important to measure biomass chemical composition accurately and efficiently (Sluiter et al., 2010; Templeton etal., 2010; Daystar et al., 2013). In this paper, we will review the use of two high-throughput techniques, near infrared spectroscopy (NIR) and pyrolysis-molecular beam mass spectrometry (Py-mbms) in biomass characterization. The advantages and disadvantages of different data analysis methods, including band/peak assignment, tools for spectral treatments and resolution enhancement and multivariate data analysis methods, are introduced, compared and evaluated. Selected research pub- lications are reviewed and categorized as “case studies” according to the ways they analyzed data and the specific biomass properties that are evaluated. CONVENTIONAL BIOMASS CHARACTERIZATION RELEVANT TO BIOFUEL PRODUCTION Traditional biomass compositional analysis, based on two-stage sulfuric acid hydrolysis followed by gravimetric and instrumental analysis, has been used to measure lignin and carbohydrates for more than 100 years. These methods have been used by researchers for studies of wood materials, animal food, human health, bioen- ergy production, and many other areas related to biomaterials. The history and uses of these methods were reviewed in detail elsewhere (Sluiter et al., 2010). The analytical uncertainty for different methods was also evaluated by statistical analysis and www.frontiersin.org August 2014 | Volume 5 | Article 388 | 1

Welcome message from author
This document is posted to help you gain knowledge. Please leave a comment to let me know what you think about it! Share it to your friends and learn new things together.
Transcript

REVIEW ARTICLEpublished: 07 August 2014
doi: 10.3389/fpls.2014.00388
NIR and Py-mbms coupled with multivariate data analysisas a high-throughput biomass characterization technique: areviewLi Xiao1*, Hui Wei 2 , Michael E. Himmel 2 , Hasan Jameel 1 and Stephen S. Kelley 1*
1 Department of Forest Biomaterials, North Carolina State University, Raleigh, NC, USA2 National Renewable Energy Laboratory, Biosciences Center, Golden, CO, USA
Edited by:
Miguel Vega-Sanchez, LawrenceBerkeley National Laboratory, USA
Reviewed by:
Benjamin Dawson-Andoh, WestVirginia University, USAJason Lupoi, University ofQueensland, USAJakub Sandak, Istituto per laValorizzazione del Legno e delleSpecie Arboree del ConsiglioNazionale delle Ricerche, Italy
*Correspondence:
Stephen S. Kelley and Li Xiao,Department of Forest Biomaterials,North Carolina State University,Raleigh, NC 27606, USAe-mail: [email protected];[email protected]
Optimizing the use of lignocellulosic biomass as the feedstock for renewable energyproduction is currently being developed globally. Biomass is a complex mixture of cellulose,hemicelluloses, lignins, extractives, and proteins; as well as inorganic salts. Cell wallcompositional analysis for biomass characterization is laborious and time consuming. Inorder to characterize biomass fast and efficiently, several high through-put technologieshave been successfully developed. Among them, near infrared spectroscopy (NIR) andpyrolysis-molecular beam mass spectrometry (Py-mbms) are complementary tools andcapable of evaluating a large number of raw or modified biomass in a short period oftime. NIR shows vibrations associated with specific chemical structures whereas Py-mbms depicts the full range of fragments from the decomposition of biomass. BothNIR vibrations and Py-mbms peaks are assigned to possible chemical functional groupsand molecular structures. They provide complementary information of chemical insightof biomaterials. However, it is challenging to interpret the informative results becauseof the large amount of overlapping bands or decomposition fragments contained in thespectra. In order to improve the efficiency of data analysis, multivariate analysis toolshave been adapted to define the significant correlations among data variables, so thatthe large number of bands/peaks could be replaced by a small number of reconstructedvariables representing original variation. Reconstructed data variables are used for samplecomparison (principal component analysis) and for building regression models (partial leastsquare regression) between biomass chemical structures and properties of interests. Inthis review, the important biomass chemical structures measured by NIR and Py-mbms aresummarized.The advantages and disadvantages of conventional data analysis methods andmultivariate data analysis methods are introduced, compared and evaluated. This reviewaims to serve as a guide for choosing the most effective data analysis methods for NIR andPy-mbms characterization of biomass.
Keywords: biomass characterization, lignocellulosic biofuel, near infrared spectroscopy, pyrolysis molecular beam,
mass spectrometry, multivariate data analysis, high throughput, chemometrics
INTRODUCTION FOR BIOMASS CHEMICAL COMPOSITIONBiomass is a complicated mixture of organic and inorganiccompounds. It is mainly composed of cellulose, hemicellulosesand lignins, as well as minor components, such as proteins, extrac-tives, ash, and other nonstructural mineral materials. Because ofits renewable nature and chemical composition, biomass is anattractive feedstock for energy and chemical products (Ragauskaset al., 2006; Himmel et al., 2007; Wei et al., 2009; Sluiter et al.,2010). In order to provide an effective guide for feedstock selec-tion and process development, it is very important to measurebiomass chemical composition accurately and efficiently (Sluiteret al., 2010; Templeton et al., 2010; Daystar et al., 2013). In thispaper, we will review the use of two high-throughput techniques,near infrared spectroscopy (NIR) and pyrolysis-molecular beammass spectrometry (Py-mbms) in biomass characterization. Theadvantages and disadvantages of different data analysis methods,including band/peak assignment, tools for spectral treatments and
resolution enhancement and multivariate data analysis methods,are introduced, compared and evaluated. Selected research pub-lications are reviewed and categorized as “case studies” accordingto the ways they analyzed data and the specific biomass propertiesthat are evaluated.
CONVENTIONAL BIOMASS CHARACTERIZATION RELEVANTTO BIOFUEL PRODUCTIONTraditional biomass compositional analysis, based on two-stagesulfuric acid hydrolysis followed by gravimetric and instrumentalanalysis, has been used to measure lignin and carbohydrates formore than 100 years. These methods have been used by researchersfor studies of wood materials, animal food, human health, bioen-ergy production, and many other areas related to biomaterials.The history and uses of these methods were reviewed in detailelsewhere (Sluiter et al., 2010). The analytical uncertainty fordifferent methods was also evaluated by statistical analysis and
www.frontiersin.org August 2014 | Volume 5 | Article 388 | 1

Xiao et al. Biomass NIR Py-mbms with multivariate
reported as the standard deviation of measurement for each com-ponent (Templeton et al., 2010). Other wet chemical techniquesalso include: acidolysis, thioacidolysis, nitrobenzene oxidation,transesterification, acetyl bromide method, orcinol method, VanSoest method, etc. Routine procedures, a number of less com-mon methods, and new analytical methods developed for researchpurposes in the field of wood chemistry are described in books(Browning, 1967; Sjöström and Alén, 1999). These techniquesquantify important chemical structure biomass, but they are timeconsuming and laborious.
Separately, combustion-related properties are of interest for theutilization of biomass in biofuel and biopower production. Thereare three types of combustion-related properties: morphological,physical, and chemical properties (Braadbaart and Poole, 2008).Traditional fuel analysis of biomass includes ultimate analysis,proximate analysis, and thermogravimetric analysis. In addition,ash composition and sulfur can be determined and used to predictfuel indices, especially for slagging behavior, aerosol formation,and corrosion related risks (Obernberger, 2014).
USE OF SPECTROSCOPIC TOOLS IN BIOMASSCHARACTERIZATION AS HIGH THROUGHPUT TECHNIQUESSpectroscopic methods, such as Fourier transform infrared spec-troscopy (FTIR), NIR, Raman spectroscopy (Raman), and nuclearmagnetic resonance (NMR), are widely used to measure functionalgroups and chemical bonds in biomass. These measurementsare faster and more convenient than most conventional chemi-cal methods used for biomass characterization and fuel analysis.Besides, since there is no degradative chemical treatment usedduring analysis, the information gained from these tools is morerepresentative of the chemical structures in original biomass.However, there are some drawbacks for using these spectroscopictools. For example, data interpretation for FTIR, Raman, andNMR is relatively complicated, sample preparation can be com-plex, and due to the mixed nature of biomass, peak assignmentusually suffers from the overlap of many compounds. A goodsummary of spectroscopic tools used as high throughput tech-niques in biomass study can be found in a recent review (Lupoiet al., 2014).
HIGH THROUGHPUT TECHNIQUES COUPLED WITHMULTIVARIATE STATISTICAL ANALYSISBecause of many chemical features included in a single spectrum,it is challenging to elucidate data directly for a group of samples.Therefore, multivariate analysis (MVA) tools have been widelyused in spectroscopic data analysis (Jin and Xu, 2011; Smith-Moritz et al., 2011; Xu et al., 2013; Lupoi et al., 2014). Amongthem, the two multivariate tools that have been widely used are: (1)Principal component analysis (PCA), and (2) Partial least square(PLS).
Principal component analysis is mainly used for identifyingoutliers, sample comparison, and screening. It relies on projectingoriginal samples variables on several (usually <six) reconstructedvariables which are representative of original sample variation.Those reconstructed variables are known as principal compo-nents (PCs). Samples described with PCs can be plotted in scoresplot, in which similar samples cluster together while samples
different from each other are separated in two-, three-, or n-dimensional coordinates. Together with the scores plot, PCAloadings plot allows for the determination of important chemi-cal features responsible for the sample grouping. In the loadingsplot, variables with large values are highly correlated with samplegrouping (Sykes et al., 2009).
Partial Least Square is used to build prediction correlation mod-els between spectral data and the property of interest. In theapplication of NIR and Py-mbms, spectral data is regarded as“predictors” for the biomass properties of interest. The propertiesof a new sample can then be estimated using a PLS model builtfrom spectral data taken on a set of similar samples with knowncharacteristics. In this way, time consuming experiments for newsamples could be eliminated. Regression coefficients are generatedand can be used to relate chemical features in the spectra to thespecific sample properties (Labbe et al., 2006).
In summary, multivariate tools used in spectroscopic dataanalysis have three functions: (1) comparing sample similaritiesand differences and discovering outliers; (2) building predictionmodels between spectroscopic data and biomass properties ofinterest; and (3) discovering correlations between property dataand spectral data.
BIOMASS CHARACTERIZATION BY NIR SPECTROSCOPYNear infrared spectroscopy is normally considered to be in therange of electromagnetic spectrum from 12,000 to 4000 cm−1
(Smith-Moritz et al., 2011). This wavelength region has two majoradvantages: first, the speed of spectral acquisition is high, whichfacilitates the real-time data collection for process control; sec-ondly, the wide applicability to a diverse ranges of materials withlittle or no sample preparation (Schwanninger et al., 2011). Thisallows NIR to be effective for online monitoring and quality con-trol of a wide variety of product properties and manufacturingprocesses (Workman, 2001; Kelley et al., 2004a; Tsuchikawa, 2007;Jin and Xu, 2011). Because of this, NIR has been extensively usedas a high-throughput method to determine chemical, physical,mechanical, and fuel properties of woody biomass during the past20 years.
However, there are some disadvantages to NIR. Although NIRabsorption spectra have similar patterns to those in the mid-IR,they have wider separation, more anti-symmetry, and weakerintensity due to the fact that it is the combination and over-tone bands from fundamental vibrations involved in NIR region.Therefore, the interpretation of NIR spectra are much harder thanmid-IR (Schwanninger et al., 2011; Lupoi et al., 2014).
The utility of band assignments depends on the purposeof specific research or application. There is ongoing discus-sion around the necessity of interpreting NIR spectra in detail.Chemical/physical information contained in the NIR spectra canbe used for detailed analysis (Schwanninger et al., 2011). How-ever, it is not necessary to fully understand the chemical detailsfor NIR to be useful for quantitative analysis. If NIR is usedas a fast tool in distinguishing samples and in building predic-tion models for biomass properties, the detailed assignmentsare generally not needed. Statistical analysis for extracting use-ful information is essential for this purpose (Xu et al., 2013).Meaningful scientific insight of structural information could be
Frontiers in Plant Science | Plant Biophysics and Modeling August 2014 | Volume 5 | Article 388 | 2
Xiao et al. Biomass NIR Py-mbms with multivariate
better gained with the help of both statistical analysis and bandassignments.
NIR BAND ASSIGNMENT AND DATA PROCESSINGIn NIR analysis, data points are usually collected in reflectanceform (R) and converted to log10(1/R) form, which is equivalent toan absorbance spectrum.
As stated above, knowledge regarding band assignment isimportant for the understanding of chemical structures in biomassand there are several references on NIR band assignments(Tsuchikawa et al., 2003; Schwanninger et al., 2011; Via et al.,2013). Commonly assigned vibrations in the NIR spectra of woodybiomass include (Schwanninger et al., 2011):
(1) 1370–1471 nm: First and second overtones of O–H stretchingvibrations from free or weakly bonded O–H in carbohydratesand first overtones of C–H, Caromatic–H stretching vibrations,such as first overtone of O–H stretching in free OH group orOH group with a weak H-bond from cellulose, xylan, and glu-comannan (1386, 1414, 1428, 1471, 1477–1484), first overtoneof O–H stretching in phenolic hydroxyl groups from extractiveor lignin (1410, 1447, 1448), first overtone of C–H stretchingand bending in aromatic associated C–H from lignin (1417,1440).
(2) 1471–1632 nm: First overtone of O–H stretching fromstrong O–H bonded group, semi-crystalline and crystallineregion of cellulose (1473–1632) or intramolecular H-bond inglucomannan (1471, 1493).
(3) 1666–2000 nm: First overtone of aliphatic and aromatic C–H stretching vibrations and O–H combination bands fromextractives/lignin (e.g., 1668, 1674, 1684, 1726), hemicellu-lose (e.g., 1720, 1724), cellulose (e.g., 1723, 1731), which areoverlapped with each other and water band (e.g., 1887–2000).
(4) ABOVE 2000 nm: Assignment in this region is difficult due tohigh number of possibilities for the coupling of vibrations.
There are a number of well-established NIR spectra preprocess-ing techniques that can be used to achieve resolution enhancementand to more precisely locate band position. Methods for spec-tral data preprocessing include: (1) smoothing and derivatization(Denoyer and Dodd, 2002; Rousset et al., 2011) such as using thealgorithm based method used by Savitzky and Golay (1964), (2)calculation of differential spectra (Rousset et al., 2011), and (3)Fourier self de-convolution, curve fitting (Ozaki et al., 2001) withmore advanced techniques involving PCA (Fackler and Schwan-ninger, 2010) and two dimensional correlation analysis (Ozakiet al., 2001; Schwanninger et al., 2011).
Among those preprocessing methods, derivatives are widelyused to reduce the impact of overlapping peaks and baseline vari-ation. However, there is a concern that generating derivatives canpossibly generate false information. Both the shape of the spec-trum and the data processing algorithms have an impact on bandshape and location. Differences between the location of the bandsbetween the raw and the second derivative spectrum can be morethan 20 cm−1 (5 nm). Researchers have also reported that the sec-ond derivative form was not always more precise than the normalform for the prediction of lignin in wood (Michell, 1995; Xu et al.,2013). Therefore, when spectral data is processed with the second
derivative, possible peak shifts should be taken into consideration.The same consideration is also important for deriving conclusionsfrom processing spectra of PCA and regression coefficients fromPLS (Schwanninger et al., 2011).
NIR SPECTROSCOPY COUPLED WITH PCAThe primary application of NIR coupled with PCA is to classifybiomass samples of various origins or from different pretreat-ments without conducting laborious traditional wet chemistrytechniques on all samples. Related areas of this application aresummarized below:
(1) Related to species/plant fractions (Michell, 1995; Kelley et al.,2004a; Labbe et al., 2008a,b; Nkansah et al., 2010);
(2) Related to genetic engineering of feedstock crops (Baillèreset al., 2002; Sandak and Sandak, 2011; Zhou et al., 2011);
(3) Related to chemical/thermal/biological treatments (Kelleyet al., 2004b; Yang et al., 2007; Houghton et al., 2009;Krongtaew et al., 2010).
For example, in order to evaluate the impact of biomass pre-treatments (including acid and alkaline pretreatments, some incombination with hydrogen peroxide) on the change of cell wallcompositions of wheat and oat straw, FT-NIR was utilized tocharacterize raw and pretreated straw (Krongtaew et al., 2010).Second derivatives from NIR absorption bands were generatedand evaluated to show the changes in properties related to biomassrecalcitrance during subsequent bioethanol production. Theseproperties include the change of lignin, hemicelluloses; as wellas amorphous, semi-crystalline, and crystalline regions of cellu-lose moieties of pretreated sample. PCA of derivative data wasefficiently utilized to differentiate the alterations in chemical struc-ture of straw due to different pretreatment methods as shown inFigure 1. It was demonstrated that FT-NIR coupled with PCA is apowerful tool to assess biomass digestibility, with a potential to beused in process control in the area of biomass utilization or energyconversion.
NIR SPECTROSCOPY COUPLED WITH PLSOne of the main applications of NIR coupled with PLS is tobuild regression models for the prediction of biomass properties,such as lignin content, S/G-lignin ratio, moisture content, heatingvalue (Kelley et al., 2004a; Rousset et al., 2011; Schwanninger et al.,2011).
Related areas of the application of NIR coupled with PLS inexisting literatures are summarized below:
(1) Prediction of cell wall components (Michell, 1995; Sandersonet al., 1996; Tucker et al., 2001; Baillères et al., 2002; Kelley et al.,2004a; Lovett et al., 2004; Yeh et al., 2004; Jin and Chen, 2007;Labbe et al., 2008b; Philip Ye et al., 2008; Wolfrum and Sluiter,2009; Nkansah et al., 2010; Hou and Li, 2011; Sandak andSandak, 2011; Smith-Moritz et al., 2011; Zhou et al., 2011).
For example, in order to identify specific monosaccharideoutliers from a plant mutant population, FT-NIR coupled withPLS regression was utilized to analyze plant leaves of Arabidop-sis (Smith-Moritz et al., 2011). Various Arabidopsis cell wallmutants were analyzed for prediction model building. PCA wasperformed on pre-processed and area-normalized NIR spectra,
www.frontiersin.org August 2014 | Volume 5 | Article 388 | 3

Xiao et al. Biomass NIR Py-mbms with multivariate
FIGURE 1 | PCA scores plot of untreated wheat straw samples (•) and samples treated with acid (���), alkali (���), acid/H2O2 (���), and alkali/H2O2 (�) as
reproduced from literature (Krongtaew et al., 2010).
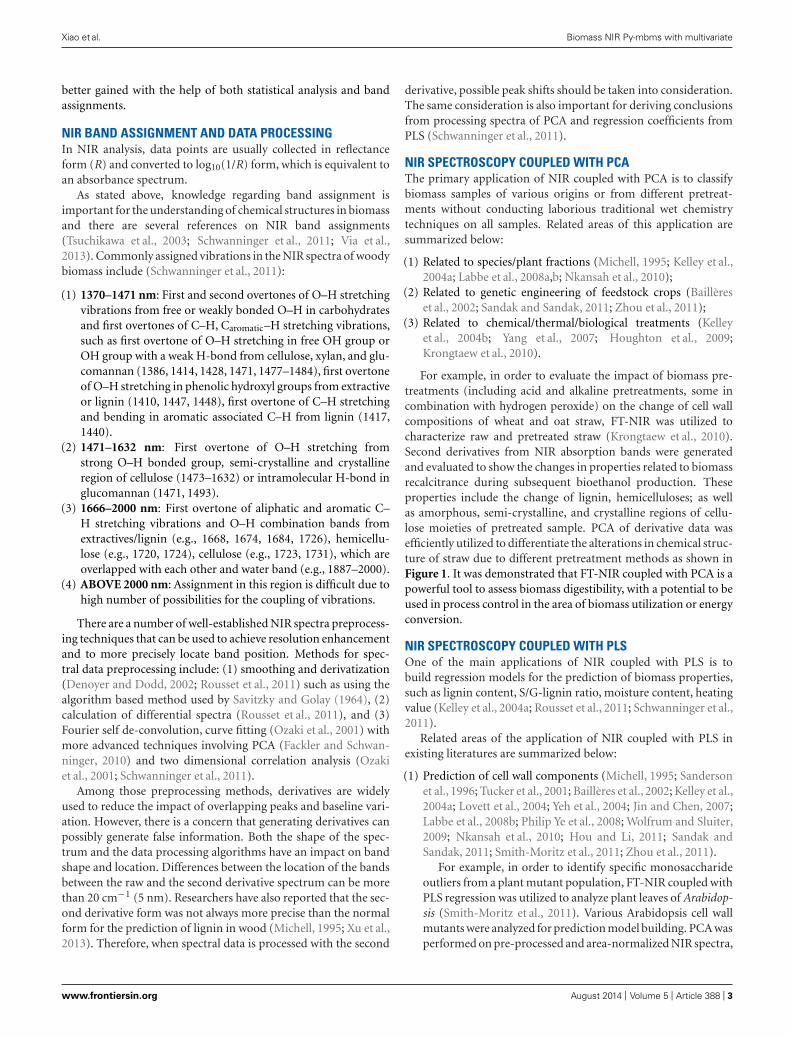
followed by calculation of the Mahalanobis distance, a lineardiscriminate analysis technique to identify outliers using PCAresults. By using this technique, a pilot study was conductedwhich consisted of 550 mutant lines (3590 leaf samples),resulting in a set of 235 leaf samples as Mahalanobis outliers.Quantitative information about monosaccharide compositionis gained by means of PLS modeling with known biochem-ical values and FT-NIR spectra. The correlation betweenpredicted and experiment determined monosaccharide com-position (mol%) of 226 rice leaf samples are shown in Figure 2with R2 = 0.98 (Smith-Moritz et al., 2011).
(2) Prediction of other physical properties (Thygesen, 1994;Hoffmeyer and Pedersen, 1995), mechanical properties (Kelleyet al., 2004a; André et al., 2006), fuel properties (Lestander andRhen, 2005; Labbe et al., 2008a).
For example, NIR coupled with PLS has been used to pre-dict cell wall chemistry and mechanical properties of loblollypine from different radial locations and heights of treesgrown in Arkansas (Kelley et al., 2004a). Mechanical proper-ties include three point bending test and related microfibrilangle. The correlation between experimental data and pre-dicted data from PLS modeling is very strong with correlationcoefficients (r) as high as 0.80. A reduced spectral range (650–1150 nm) usually available in handheld NIR spectrometerswas also demonstrated to be useful for predicting mechanicalproperties.
BIOMASS CHARACTERIZATION BY Py-mbmsPy-mbms has been intensively used for studies of biologicaland synthetic macromolecules, such as wood, grasses, carbonin soil and chars. It has proved to be an efficient and power-ful analytical tool (Evans and Milne, 1987; Kelley et al., 2002;Labbe et al., 2005; Magrini et al., 2007; Sykes et al., 2008; Mannet al., 2009; French and Czernik, 2010). Detailed description ofthis technology is available in the above references. In short,the Py-mbms is composed of a pyrolysis furnace and a free-jet mbms. Typically the furnace is preheated to 500◦C beforeground sample of biomass is inserted into the inert atmo-sphere of the furnace. Pyrolysis products from biomass in thefurnace are swept out of the furnace into the mbms by anargon gas stream. Molecular fragments contained in the pyrol-ysis vapor are expanded in a series of vacuum chambers to bequenched; so that intermolecular collisions are prevented. A low-energy electron beam (17–23 eV) in the triple quadruple massspectrometer is employed to produce a positive ion mass spec-trum. The positive ion stream is magnified and collected by thedetector.
Mass peaks were assigned to chemical fragments producedfrom fast pyrolysis of biomass for direct interpretation (Evans andMilne, 1987). The spectra from Py-mbms is also interpreted withthe help of MVA tools, especially PLS and PCA (Hoover et al.,2002; Kelley et al., 2002, 2004b; Labbe et al., 2005; Magrini et al.,2007; Mann et al., 2009).
Frontiers in Plant Science | Plant Biophysics and Modeling August 2014 | Volume 5 | Article 388 | 4
Xiao et al. Biomass NIR Py-mbms with multivariate
FIGURE 2 | A correlation analysis predicted (PLS model of FT-NIR)
versus experimentally determined monosaccharide composition
(mol%) of rice leaf samples. The correlation coefficient betweenexperimental and predicted values was calculated to be R2 = 0.98 asreproduced from literature (Agblevor et al., 1994; Smith-Moritz et al., 2011).
Py-mbms PEAK ASSIGNMENT AND DATA PROCESSINGDuring data acquisition of Py-mbms, amplified positive ions frombiomass pyrolysis vapor are scanned continuously; then the sig-nal is collected by a computer. Approximate evolution time offast pyrolysis for a sample of 4 mg is less than 1 min. Duringthe evolution time there are typically 50 single scans collected.Biomass with larger sample size will need longer evolution timeand more scans during fast pyrolysis. Together with single scanspectrum, time resolved profile and averaged spectrum can becollected by the computer acquisition software (Evans and Milne,1987).
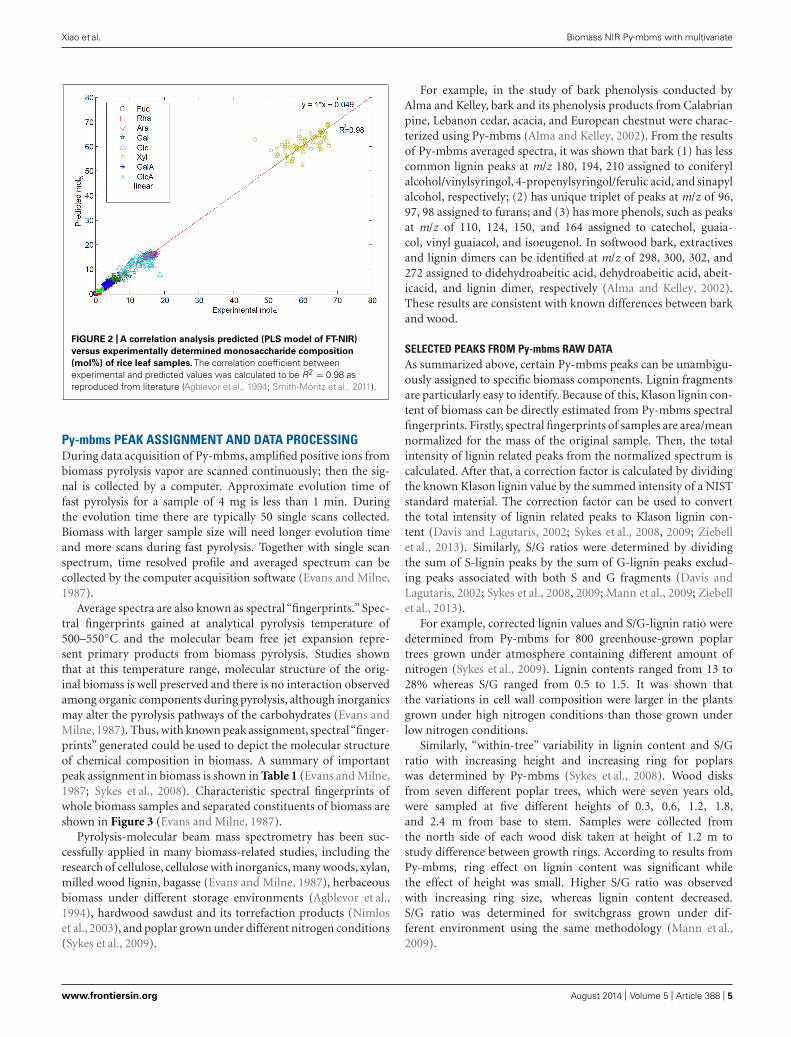
Average spectra are also known as spectral “fingerprints.” Spec-tral fingerprints gained at analytical pyrolysis temperature of500–550◦C and the molecular beam free jet expansion repre-sent primary products from biomass pyrolysis. Studies shownthat at this temperature range, molecular structure of the orig-inal biomass is well preserved and there is no interaction observedamong organic components during pyrolysis, although inorganicsmay alter the pyrolysis pathways of the carbohydrates (Evans andMilne, 1987). Thus, with known peak assignment, spectral“finger-prints” generated could be used to depict the molecular structureof chemical composition in biomass. A summary of importantpeak assignment in biomass is shown in Table 1 (Evans and Milne,1987; Sykes et al., 2008). Characteristic spectral fingerprints ofwhole biomass samples and separated constituents of biomass areshown in Figure 3 (Evans and Milne, 1987).
Pyrolysis-molecular beam mass spectrometry has been suc-cessfully applied in many biomass-related studies, including theresearch of cellulose, cellulose with inorganics, many woods, xylan,milled wood lignin, bagasse (Evans and Milne, 1987), herbaceousbiomass under different storage environments (Agblevor et al.,1994), hardwood sawdust and its torrefaction products (Nimloset al., 2003), and poplar grown under different nitrogen conditions(Sykes et al., 2009).
For example, in the study of bark phenolysis conducted byAlma and Kelley, bark and its phenolysis products from Calabrianpine, Lebanon cedar, acacia, and European chestnut were charac-terized using Py-mbms (Alma and Kelley, 2002). From the resultsof Py-mbms averaged spectra, it was shown that bark (1) has lesscommon lignin peaks at m/z 180, 194, 210 assigned to coniferylalcohol/vinylsyringol, 4-propenylsyringol/ferulic acid, and sinapylalcohol, respectively; (2) has unique triplet of peaks at m/z of 96,97, 98 assigned to furans; and (3) has more phenols, such as peaksat m/z of 110, 124, 150, and 164 assigned to catechol, guaia-col, vinyl guaiacol, and isoeugenol. In softwood bark, extractivesand lignin dimers can be identified at m/z of 298, 300, 302, and272 assigned to didehydroabeitic acid, dehydroabeitic acid, abeit-icacid, and lignin dimer, respectively (Alma and Kelley, 2002).These results are consistent with known differences between barkand wood.
SELECTED PEAKS FROM Py-mbms RAW DATAAs summarized above, certain Py-mbms peaks can be unambigu-ously assigned to specific biomass components. Lignin fragmentsare particularly easy to identify. Because of this, Klason lignin con-tent of biomass can be directly estimated from Py-mbms spectralfingerprints. Firstly, spectral fingerprints of samples are area/meannormalized for the mass of the original sample. Then, the totalintensity of lignin related peaks from the normalized spectrum iscalculated. After that, a correction factor is calculated by dividingthe known Klason lignin value by the summed intensity of a NISTstandard material. The correction factor can be used to convertthe total intensity of lignin related peaks to Klason lignin con-tent (Davis and Lagutaris, 2002; Sykes et al., 2008, 2009; Ziebellet al., 2013). Similarly, S/G ratios were determined by dividingthe sum of S-lignin peaks by the sum of G-lignin peaks exclud-ing peaks associated with both S and G fragments (Davis andLagutaris, 2002; Sykes et al., 2008, 2009; Mann et al., 2009; Ziebellet al., 2013).
For example, corrected lignin values and S/G-lignin ratio weredetermined from Py-mbms for 800 greenhouse-grown poplartrees grown under atmosphere containing different amount ofnitrogen (Sykes et al., 2009). Lignin contents ranged from 13 to28% whereas S/G ranged from 0.5 to 1.5. It was shown thatthe variations in cell wall composition were larger in the plantsgrown under high nitrogen conditions than those grown underlow nitrogen conditions.
Similarly, “within-tree” variability in lignin content and S/Gratio with increasing height and increasing ring for poplarswas determined by Py-mbms (Sykes et al., 2008). Wood disksfrom seven different poplar trees, which were seven years old,were sampled at five different heights of 0.3, 0.6, 1.2, 1.8,and 2.4 m from base to stem. Samples were collected fromthe north side of each wood disk taken at height of 1.2 m tostudy difference between growth rings. According to results fromPy-mbms, ring effect on lignin content was significant whilethe effect of height was small. Higher S/G ratio was observedwith increasing ring size, whereas lignin content decreased.S/G ratio was determined for switchgrass grown under dif-ferent environment using the same methodology (Mann et al.,2009).
www.frontiersin.org August 2014 | Volume 5 | Article 388 | 5

Xiao et al. Biomass NIR Py-mbms with multivariate
Table 1 | Peak assignments associated with Py-mbms spectrum for Populus wood based on literature (Evans and Milne, 1987; Sykes et al., 2008).
Mass peaks (m/z) Assigned products S or G precursor
57, 73, 85, 96, 114 From C5 sugar
57, 60, 73, 98, 126, 144 From C6 sugar
94 Phenol, dimethylcyclopentene
108 Methyl phenol (o-cresol, m/p-cresol)
110 Dihydroxybenzene, 5-methylfurfural
120 Vinylphenol
122 Ethylphenol, ethylphenol, benzoic acid
124 Guaiacol (2-methoxyphenol), trimethylcyclopentenone G
137* Ethylguaiacol, homovanillin, coniferyl alcohol G
138 Methylguaiacol G
150 p-Inylguaiacol, coumaryl alcohol G
152 4-Ethylguaiacol, vanillin G
154 Syringol (2,6-dimethoxyphenol) S
164 Isoeugenenol, eugenol G
167* Ethylsyringol, syrinylacetone, propiosyringone S
168 4-Methyl-2,6-dimethoxyphenol S
178 Coniferyl aldehyde G
180 Coniferyl alcohol, syringylethene S, G
182 Syringaldehyde S
194 4-Propenylsyringol S
208 Synapyl aldehyde S
210 Synapyl alcohol S
*Fragmention.m/z: mass to charge ratio.S, syringyl lignin; G, guaiacol lignin.
Py-mbms COUPLED WITH PCAPyrolysis-molecular beam mass spectrometry coupled with PCAprovides a fast analytical method to distinguish a large number ofbiomass samples. It has been used to study biomass compositionalvariations due to species (Evans and Milne, 1987; Agblevor et al.,1994; Alma and Kelley, 2002; Kelley et al., 2004b), genetic engi-neering (Labbe et al., 2005; Davis et al., 2006), different growthenvironments (Mann et al., 2009; Sykes et al., 2009), thermal(Nimlos et al., 2003)/chemical (Alma and Kelley, 2002; Kelleyet al., 2004b)/biological (Kelley et al., 2002; Arantes et al., 2009)treatments, and various storage/collection (Agblevor et al., 1994)methods.
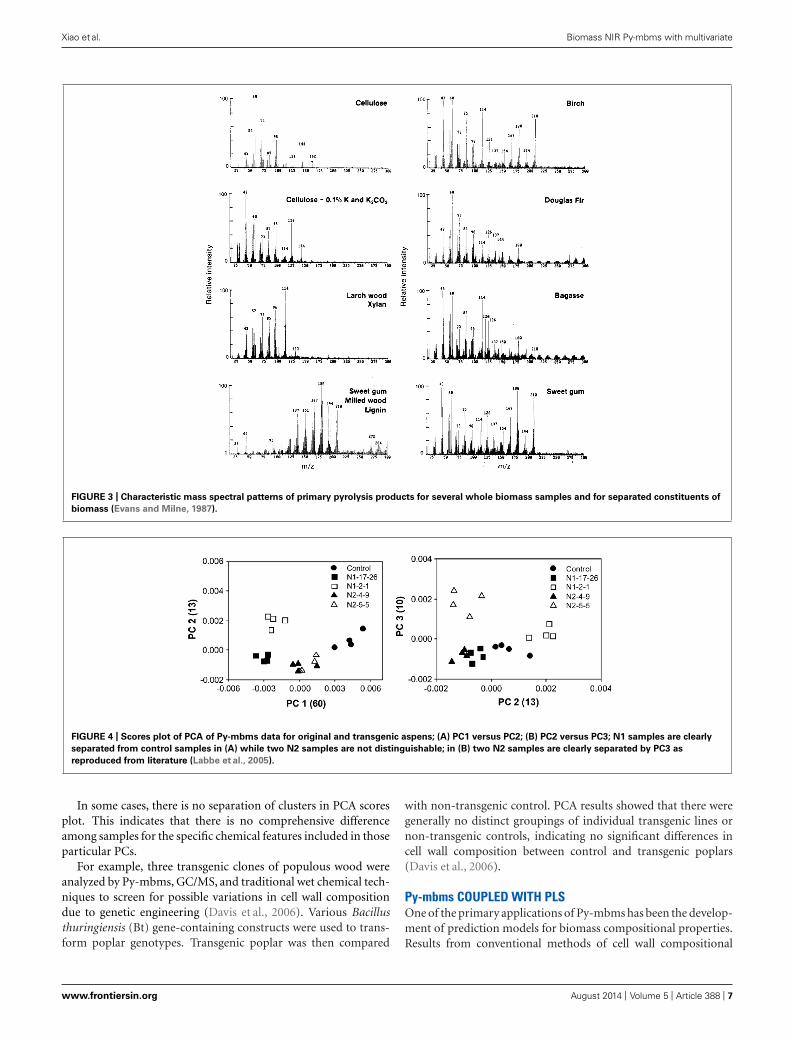
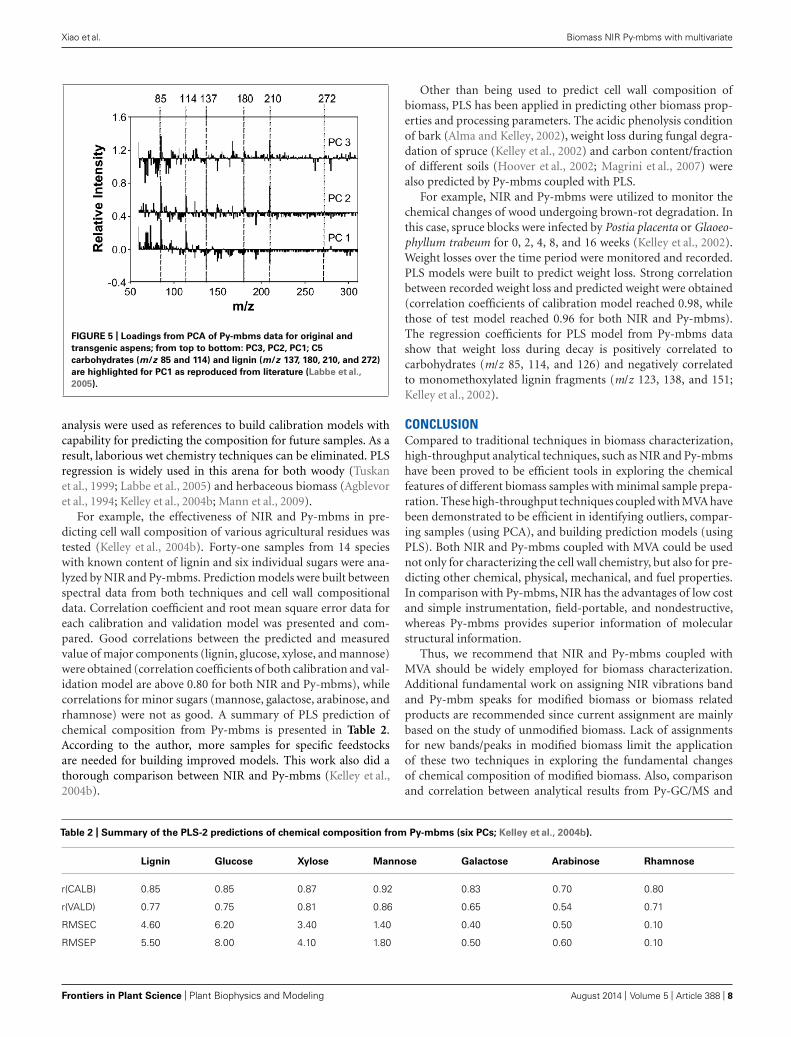
For example, Py-mbms coupled with PCA has been used tomeasure the overall composition between and within a series oforiginal and transgenic aspens (Labbe et al., 2005). Two cloneswere transformed with GRP-iaaM gene (N1-17-26 and N1-2-1)and GRP-iaaM/35S-ACCase (N2-4-9 and N2-5-5). PCA analysiswas conducted for data analysis with an attempt to identify chem-ical differences between the modified and control aspens. Figure 4shows PCA scores plots with four replicate samples from five dif-ferent aspen samples. Figure 4A shows a plot of PC1 versus PC2,while Figure 4B shows a plot of PC2 versus PC3. In Figure 4A,there is clear separation between the two N1 samples while two
N2 samples are indistinguishable. Moreover, two N2 samples areclearly separated from each other along PC3 as shown in Figure 4B.The loadings from PCA are shown in Figure 5. Using PC1 load-ings as an example, C5 carbohydrates (m/z 85 and 114) and lignin(m/z 137, 180, 210, and 272) are highlighted for PC1. This suggeststhere are more C5 sugars and less lignin in controls than those inN1 and N2 samples (Labbe et al., 2005).
Pyrolysis-molecular beam mass spectrometry had been alsoused to study the impact of storage environment on herba-ceous material. Weathered and unweathered fractions of threetypes of herbaceous biomass after storage at 18 different con-ditions for 6–9 months were analyzed by Py-mbms coupledwith PCA (Agblevor et al., 1994). Two major trends in the datawere shown by PCA (factor analysis): major clusters were dis-tinguished by relative nitrogen contents between switchgrass andthe other two herbaceous biomass samples; subgroups of weath-ered and unweathered materials are clearly separated as subgroupswithin the major clusters. According to the variance diagram(similar to loadings plot), lower amount of carbohydrates con-stituted the major chemical difference between weathered andunweathered samples (Agblevor et al., 1994). This observation isconsistent with results from traditional wet chemical analysis andPy-GC/MS.
Frontiers in Plant Science | Plant Biophysics and Modeling August 2014 | Volume 5 | Article 388 | 6
Xiao et al. Biomass NIR Py-mbms with multivariate
FIGURE 3 | Characteristic mass spectral patterns of primary pyrolysis products for several whole biomass samples and for separated constituents of
biomass (Evans and Milne, 1987).
FIGURE 4 | Scores plot of PCA of Py-mbms data for original and transgenic aspens; (A) PC1 versus PC2; (B) PC2 versus PC3; N1 samples are clearly
separated from control samples in (A) while two N2 samples are not distinguishable; in (B) two N2 samples are clearly separated by PC3 as
reproduced from literature (Labbe et al., 2005).
In some cases, there is no separation of clusters in PCA scoresplot. This indicates that there is no comprehensive differenceamong samples for the specific chemical features included in thoseparticular PCs.
For example, three transgenic clones of populous wood wereanalyzed by Py-mbms, GC/MS, and traditional wet chemical tech-niques to screen for possible variations in cell wall compositiondue to genetic engineering (Davis et al., 2006). Various Bacillusthuringiensis (Bt) gene-containing constructs were used to trans-form poplar genotypes. Transgenic poplar was then compared
with non-transgenic control. PCA results showed that there weregenerally no distinct groupings of individual transgenic lines ornon-transgenic controls, indicating no significant differences incell wall composition between control and transgenic poplars(Davis et al., 2006).
Py-mbms COUPLED WITH PLSOne of the primary applications of Py-mbms has been the develop-ment of prediction models for biomass compositional properties.Results from conventional methods of cell wall compositional
www.frontiersin.org August 2014 | Volume 5 | Article 388 | 7
Xiao et al. Biomass NIR Py-mbms with multivariate
FIGURE 5 | Loadings from PCA of Py-mbms data for original and
transgenic aspens; from top to bottom: PC3, PC2, PC1; C5
carbohydrates (m/z 85 and 114) and lignin (m/z 137, 180, 210, and 272)
are highlighted for PC1 as reproduced from literature (Labbe et al.,
2005).
analysis were used as references to build calibration models withcapability for predicting the composition for future samples. As aresult, laborious wet chemistry techniques can be eliminated. PLSregression is widely used in this arena for both woody (Tuskanet al., 1999; Labbe et al., 2005) and herbaceous biomass (Agblevoret al., 1994; Kelley et al., 2004b; Mann et al., 2009).
For example, the effectiveness of NIR and Py-mbms in pre-dicting cell wall composition of various agricultural residues wastested (Kelley et al., 2004b). Forty-one samples from 14 specieswith known content of lignin and six individual sugars were ana-lyzed by NIR and Py-mbms. Prediction models were built betweenspectral data from both techniques and cell wall compositionaldata. Correlation coefficient and root mean square error data foreach calibration and validation model was presented and com-pared. Good correlations between the predicted and measuredvalue of major components (lignin, glucose, xylose, and mannose)were obtained (correlation coefficients of both calibration and val-idation model are above 0.80 for both NIR and Py-mbms), whilecorrelations for minor sugars (mannose, galactose, arabinose, andrhamnose) were not as good. A summary of PLS prediction ofchemical composition from Py-mbms is presented in Table 2.According to the author, more samples for specific feedstocksare needed for building improved models. This work also did athorough comparison between NIR and Py-mbms (Kelley et al.,2004b).
Other than being used to predict cell wall composition ofbiomass, PLS has been applied in predicting other biomass prop-erties and processing parameters. The acidic phenolysis conditionof bark (Alma and Kelley, 2002), weight loss during fungal degra-dation of spruce (Kelley et al., 2002) and carbon content/fractionof different soils (Hoover et al., 2002; Magrini et al., 2007) werealso predicted by Py-mbms coupled with PLS.
For example, NIR and Py-mbms were utilized to monitor thechemical changes of wood undergoing brown-rot degradation. Inthis case, spruce blocks were infected by Postia placenta or Glaoeo-phyllum trabeum for 0, 2, 4, 8, and 16 weeks (Kelley et al., 2002).Weight losses over the time period were monitored and recorded.PLS models were built to predict weight loss. Strong correlationbetween recorded weight loss and predicted weight were obtained(correlation coefficients of calibration model reached 0.98, whilethose of test model reached 0.96 for both NIR and Py-mbms).The regression coefficients for PLS model from Py-mbms datashow that weight loss during decay is positively correlated tocarbohydrates (m/z 85, 114, and 126) and negatively correlatedto monomethoxylated lignin fragments (m/z 123, 138, and 151;Kelley et al., 2002).
CONCLUSIONCompared to traditional techniques in biomass characterization,high-throughput analytical techniques, such as NIR and Py-mbmshave been proved to be efficient tools in exploring the chemicalfeatures of different biomass samples with minimal sample prepa-ration. These high-throughput techniques coupled with MVA havebeen demonstrated to be efficient in identifying outliers, compar-ing samples (using PCA), and building prediction models (usingPLS). Both NIR and Py-mbms coupled with MVA could be usednot only for characterizing the cell wall chemistry, but also for pre-dicting other chemical, physical, mechanical, and fuel properties.In comparison with Py-mbms, NIR has the advantages of low costand simple instrumentation, field-portable, and nondestructive,whereas Py-mbms provides superior information of molecularstructural information.
Thus, we recommend that NIR and Py-mbms coupled withMVA should be widely employed for biomass characterization.Additional fundamental work on assigning NIR vibrations bandand Py-mbm speaks for modified biomass or biomass relatedproducts are recommended since current assignment are mainlybased on the study of unmodified biomass. Lack of assignmentsfor new bands/peaks in modified biomass limit the applicationof these two techniques in exploring the fundamental changesof chemical composition of modified biomass. Also, comparisonand correlation between analytical results from Py-GC/MS and
Table 2 | Summary of the PLS-2 predictions of chemical composition from Py-mbms (six PCs; Kelley et al., 2004b).
Lignin Glucose Xylose Mannose Galactose Arabinose Rhamnose
r(CALB) 0.85 0.85 0.87 0.92 0.83 0.70 0.80
r(VALD) 0.77 0.75 0.81 0.86 0.65 0.54 0.71
RMSEC 4.60 6.20 3.40 1.40 0.40 0.50 0.10
RMSEP 5.50 8.00 4.10 1.80 0.50 0.60 0.10
Frontiers in Plant Science | Plant Biophysics and Modeling August 2014 | Volume 5 | Article 388 | 8

Xiao et al. Biomass NIR Py-mbms with multivariate
Py-mbms should be encouraged because of the important simi-larity and differences in these two techniques are critical for usingthose techniques for the characterization of biomass molecularstructure.
ACKNOWLEDGMENTSThis project is supported by the project of Southeastern Part-nership for Integrated Biomass Supply Systems (IBSS). The IBSSproject is supported by Agriculture and Food Research Initia-tive Competitive Grant No. 2011-68005-30410 from the USDANational Institute of Food and Agriculture. Hui Wei and MichaelE. Himmel are sponsored by the Center for Direct CatalyticConversion of Biomass to Biofuels (C3Bio), an Energy FrontierResearch Center funded by the US Department of Energy, Officeof Science, Office of Basic Energy Sciences under Award Num-ber DE-SC0000997, and also by Laboratory Directed Research& Development (LDRD) program at the National RenewableEnergy Laboratory (NREL). Experimental data in figures andtables were generated with the help of Robert Sykes and MarkDavis at NREL. This work was conducted as part of the BioEn-ergy Science Center (BESC). The BESC is a US Department ofEnergy Bioenergy Research Center supported by the Office ofBiological and Environmental Research in the DOE Office ofScience.
REFERENCESAgblevor, F. A., Evans, R. J., and Johnson, K. D. (1994). Molecular-beam mass-
spectrometric analysis of lignocellulosic materials 1. Herbaceous biomass. J. Anal.Appl. Pyrolysis 30, 125–144. doi: 10.1016/0165-2370(94)00808-6
Alma, M. H., and Kelley, S. S. (2002). The application of pyrolysis-molecular beammass spectrometry for characterization of bark phenolysis products. BiomassBioenergy 22, 411–419. doi: 10.1016/S0961-9534(02)00018-1
André, N., Labbé, N., Rials, T., and Kelley, S. (2006). Assessment of wood loadcondition by near infrared (NIR) spectroscopy. J. Mater. Sci. 41, 1879–1886. doi:10.1007/s10853-006-4433-6.
Arantes, V., Qian, Y. H., Kelley, S. S., Milagres, A. M. F., Filley, T. R., Jellison,J., et al. (2009). Biomimetic oxidative treatment of spruce wood studied bypyrolysis-molecular beam mass spectrometry coupled with multivariate analysisand C-13-labeled tetramethylammonium hydroxide thermochemolysis: implica-tions for fungal degradation of wood. J. Biol. Inorg. Chem. 14, 1253–1263. doi:10.1007/s00775-009-0569-6
Baillères, H., Davrieux, F., and Ham-Pichavant, F. (2002). Near infrared analysisas a tool for rapid screening of some major wood characteristics in a eucalyptusbreeding program. Ann. For. Sci. 59, 479–490. doi: 10.1051/forest:2002032
Braadbaart, F., and Poole, I. (2008). Morphological, chemical and physical changesduring charcoalification of wood and its relevance to archaeological contexts. J.Archaeol. Sci. 35, 2434–2445. doi: 10.1016/j.jas.2008.03.016
Browning, B. L. (1967). Methods of Wood Chemistry. NY: Interscience Publishers, aDivision of John Wiley & Sons.
Davis, M. F., and Lagutaris, R. M. (2002). Comparison of syringyl/guaiacyl(S/G) ratios measured by solid state 13C NMR, pyrolysis molecular beam massspectrometry and thioacidolysis. Abstr. Pap. Am. Chem. Soc. 223, U126–U126.
Davis, M. F., Tuskan, G. A., Payne, P., Tschaplinski, T. J., and Meilan, R. (2006).Assessment of Populus wood chemistry following the introduction of a Bt toxingene. Tree Physiol. 26, 557–564. doi: 10.1093/treephys/26.5.557
Daystar, J. S., Venditti, R. A., Gonzalez, R., Jameel, H., Jett, M., and Reeb,C. W. (2013). Impacts of feedstock composition on alcohol yields and green-house gas emissions from the NREL thermochemical ethanol conversion process.Bioresources 8, 5261–5278.
Denoyer, L. K., and Dodd, J. G. (2002). “Smoothing and derivatives in spectroscopy,”in Handbook of Vibrational Spectroscopy, eds J. M. Chalmers and P. R. Griffiths(Chichester: John Wiley & Sons Ltd.), 12.
Evans, R. J., and Milne, T. A. (1987). Molecular characterization of the pyrolysis ofbiomass 1. Fundamentals. Energy Fuels 1, 123–137. doi: 10.1021/ef00002a001
Fackler, K., and Schwanninger, M. (2010). Polysaccharide degradation and ligninmodification during brown rot of spruce wood: a polarised Fourier transformnear infrared study. J. Near Infrared Spectrosc. 18, 403–416. doi: 10.1255/jnirs.901
French, R., and Czernik, S. (2010). Catalytic pyrolysis of biomass for biofuelsproduction. Fuel Process. Technol. 91, 25–32. doi: 10.1016/j.fuproc.2009.08.011
Himmel, M. E., Ding, S. Y., Johnson, D. K., Adney, W. S., Nimlos, M. R., Brady, J. W.,et al. (2007). Biomass recalcitrance: engineering plants and enzymes for biofuelsproduction. Science 315, 804–807. doi: 10.1126/science.1137016
Hoffmeyer, P., and Pedersen, J. G. (1995). Evaluation of density and strength ofNorway spruce wood by near infrared reflectance spectroscopy. Holz Roh Werkstoff53, 165–170. doi: 10.1007/BF02716418
Hoover, C. M., Magrini, K. A., and Evans, R. J. (2002). Soil carbon content andcharacter in an old-growth forest in northwestern Pennsylvania: a case studyintroducing pyrolysis molecular beam mass spectrometry (py-MBMS). Environ.Pollut. 116, S269–S275. doi: 10.1016/s0269-7491(01)00258-5
Hou, S., and Li, L. (2011). Rapid characterization of woody biomass digestibilityand chemical composition using near-infrared spectroscopy. J. Integr. Plant Biol.53, 166–175. doi: 10.1111/j.1744-7909.2010.01003.x
Houghton, T. P., Stevens, D. M., Pryfogle, P. A., Wright, C. T., and Radtke, C. W.(2009). The effect of drying temperature on the composition of biomass. Appl.Biochem. Biotechnol. 153, 4–10. doi: 10.1007/s12010-008-8406-x
Jin, L., and Xu, Q. (2011). Application of near infrared spectroscopy and multivariateanalysis in the forest products industry. Adv. Mater. Res. (Durnten-Zurich, Switz.)236–238, 1098–1102. doi: 10.4028/www.scientific.net/AMR.236-238.1098
Jin, S., and Chen, H. (2007). Near-infrared analysis of the chemical composition ofrice straw. Ind. Crops Prod. 26, 207–211. doi: 10.1016/j.indcrop.2007.03.004
Kelley, S., Rials, T., Snell, R., Groom, L., and Sluiter, A. (2004a). Use of near infraredspectroscopy to measure the chemical and mechanical properties of solid wood.Wood Sci. Technol. 38, 257–276. doi: 10.1007/s00226-003-0213-215
Kelley, S. S., Rowell, R. M., Davis, M., Jurich, C. K., and Ibach, R. (2004b).Rapid analysis of the chemical composition of agricultural fibers using nearinfrared spectroscopy and pyrolysis molecular beam mass spectrometry. BiomassBioenergy 27, 77–88. doi: 10.1016/j.biomboie.2003.11.005
Kelley, S. S., Jellison, J., and Goodell, B. (2002). Use of NIR and pyrolysis-MBMScoupled with multivariate analysis for detecting the chemical changes associatedwith brown-rot biodegradation of spruce wood. FEMS Microbiol. Lett. 209, 107–111. doi: 10.1111/j.1574-6968.2002.tb11117.x
Krongtaew, C., Messner, K., Ters, T., and Fackler, K. (2010). Characterization ofkey parameters for biotechnological lignocellulose conversion assessed by ft-nirspectroscopy. Part I. Qualitative analysis of pretreated straw. Bioresources 5, 2063–2080.
Labbe, N., Harper, D., and Rials, T. (2006). Chemical structure of wood charcoal byinfrared spectroscopy and multivariate analysis. J. Agric. Food Chem. 54, 3492–3497. doi: 10.1021/jf053062n
Labbe, N., Lee, S. H., Cho, H. W., Jeong, M. K., and Andre, N. (2008a). Enhanced dis-crimination and calibration of biomass NIR spectral data using non-linear kernelmethods. Bioresour. Technol. 99, 8445–8452. doi: 10.1016/j.biortech.2008.02.052
Labbe, N., Ye, X. P., Franklin, J. A., Womac, A. R., Tyler, D. D., and Rials, T. G.(2008b). Analysis of switchgrass characteristics using near infrared spectroscopy.Bioresources 3, 1329–1348.
Labbe, N., Rials, T. G., Kelley, S. S., Cheng, Z. M., Kim, J. Y., and Li, Y. (2005).FT-IR imaging and pyrolysis-molecular beam mass spectrometry: new tools toinvestigate wood tissues. Wood Sci. Technol. 39, 61–77. doi: 10.1007/s00226-004-0274-0
Lestander, T. A., and Rhen, C. (2005). Multivariate NIR spectroscopy models formoisture, ash and calorific content in biofuels using bi-orthogonal partial leastsquares regression. Analyst 130, 1182–1189. doi: 10.1039/B500103J
Lovett, D. K., Deaville, E. R., Mould, F., Givens, D. I., and Owen, E. (2004).Using near infrared reflectance spectroscopy (NIRS) to predict the biologi-cal parameters of maize silage. Anim. Feed Sci. Technol. 115, 179–187. doi:10.1016/j.anifeedsci.2004.02.007
Lupoi, J. S., Singh, S., Simmons, B. A., and Henry, R. J. (2014). Assess-ment of lignocellulosic biomass using analytical spectroscopy: an evolution tohigh-throughput techniques. Bioenergy Res. 7, 1–23. doi: 10.1007/s12155-013-9352-1
Magrini, K. A., Follett, R. F., Kimble, J., Davis, M. F., and Pruessner, E. (2007). Usingpyrolysis molecular beam mass spectrometry to characterize soil organic carbonin native prairie soils. Soil Sci. 172, 659–672. doi: 10.1097/ss.0b013e3180d0a3a5
www.frontiersin.org August 2014 | Volume 5 | Article 388 | 9
Xiao et al. Biomass NIR Py-mbms with multivariate
Mann, D. G. J., Labbe, N., Sykes, R. W., Gracom, K., Kline, L., Swamidoss, I. M., et al.(2009). Rapid assessment of lignin content and structure in switchgrass (Panicumvirgatum L.) grown under different environmental conditions. Bioenergy Res. 2,246–256. doi: 10.1007/s12155-009-9054-x
Michell, A. J. (1995). Pulpwood quality estimation by near-infrared spectroscopicmeasurements on eucalypt woods. Appita J. 48, 425–428.
Nimlos, M., Brooking, E., Looker, M. J., and Evans, R. J. (2003). Biomass torrefactionstudies with a molecular beam mass spectrometer. Abstr. Pap. Am. Chem. Soc. 226,U536–U536.
Nkansah, K., Dawson-Andoh, B., and Slahor, J. (2010). Rapid characterization ofbiomass using near infrared spectroscopy coupled with multivariate data analysis.Part 1: yellow-poplar (Liriodendron tulipifera L.). Bioresour. Technol. 101, 4570–4576. doi: 10.1016/j.biortech.2009.12.046
Obernberger, I. (2014). Strategy for the application of novel characterization meth-ods for biomass fuels: case study of straw. Energy Fuels 28, 1041–1052. doi:10.1021/ef402249x
Ozaki, Y., Šašiè, S., and Jiang, J. (2001). Review: how can we unravel complicatednear infrared spectra?—recent progress in spectral analysis methods for resolutionenhancement and band assignments in the near infrared region. J. Near InfraredSpectrosc. 9, 63–95. doi: 10.1255/jnirs.295
Philip Ye, X., Liu, L., Hayes, D., Womac, A., Hong, K., and Sokhansanj, S. (2008). Fastclassification and compositional analysis of cornstover fractions using Fouriertransform near-infrared techniques. Bioresour. Technol. 99, 7323–7332. doi:10.1016/j.biortech.2007.12.063
Ragauskas, A. J., Williams, C. K., Davison, B. H., Britovsek, G., Cairney, J., Eckert,C. A., et al. (2006). The path forward for biofuels and biomaterials. Science 311,484–489. doi: 10.1126/science.1114736
Rousset, P., Davrieux, F., Macedo, L., and Perre, P. (2011). Characterisation ofthe torrefaction of beech wood using NIRS: combined effects of temperature andduration. Biomass Bioenergy 35, 1219–1226. doi: 10.1016/j.biombioe.2010.12.012
Sandak, J., and Sandak, A. (2011). Fourier transform near infrared assess-ment of biomass composition of shrub willow clones (Salix sp.) for opti-mal bio-conversion processing. J. Near Infrared Spectrosc. 19, 309–318. doi:10.1255/jnirs.950
Sanderson, M. A., Agblevor, F., Collins, M., and Johnson, D. K. (1996). Composi-tional analysis of biomass feedstocks by near infrared reflectance spectroscopy.Biomass Bioenergy 11, 365–370. doi: 10.1016/S0961-9534(96)00039-6
Savitzky, A., and Golay, M. J. E. (1964). Smoothing + differentiation of data by sim-plified least squares procedures. Anal. Chem. 36:1627. doi: 10.1021/ac60214a047
Schwanninger, M., Rodrigues, J. C., and Fackler, K. (2011). A review of band assign-ments in near infrared spectra of wood and wood components. J. Near InfraredSpectrosc. 19, 287–308. doi: 10.1255/jnirs.955
Sjöström, E., and Alén, R. (1999). Analytical Methods in Wood Chemistry, Pulping,and Papermaking. Berlin Heidelberg: Springer-Verlag. doi: 10.1007/978-3-662-03898-7
Sluiter, J. B., Ruiz, R. O., Scarlata, C. J., Sluiter, A. D., and Templeton, D. W. (2010).Compositional analysis of lignocellulosic feedstocks 1. Review and description ofmethods. J. Agric. Food Chem. 58, 9043–9053. doi: 10.1021/jf1008023
Smith-Moritz, A. M., Chern, M., Lao, J., Sze-To, W. H., Heazlewood, J. L., Ronald,P. C., et al. (2011). Combining multivariate analysis and monosaccharide com-position modeling to identify plant cell wall variations by Fourier transform nearinfrared spectroscopy. Plant Methods 7:26. doi: 10.1186/1746-4811-7-26
Sykes, R., Kodrzycki, B., Tuskan, G., Foutz, K., and Davis, M. (2008). Within treevariability of lignin composition in Populus. Wood Sci. Technol. 42, 649–661. doi:10.1007/s00226-008-0199-0
Sykes, R., Yung, M., Novaes, E., Kirst, M., Peter, G., and Davis, M. (2009). “High-throughput screening of plant cell-wall composition using pyrolysis molecularbeam mass spectroscopy,” in Biofuels, ed. J. R. Mielenz (New York, NY: HumanaPress), 169–183.
Templeton, D. W., Scarlata, C. J., Sluiter, J. B., and Wolfrum, E. J. (2010). Compo-sitional analysis of lignocellulosic feedstocks. 2. Method uncertainties. J. Agric.Food Chem. 58, 9054–9062. doi: 10.1021/jf100807b
Thygesen, L. (1994). Determination of dry matter content and basic density ofNorway spruce by near infrared reflectance and transmittance spectroscopy. J.Near Infrared Spectrosc. 2, 127–135. doi: 10.1255/jnirs.39
Tsuchikawa, S. (2007). A review of recent near infrared research for wood and paper.Appl. Spectrosc. Rev. 42, 43–71. doi: 10.1080/05704920601036707
Tsuchikawa, S., Murata, A., Kohara, M., and Mitsui, K. (2003). Spectroscopic mon-itoring of biomass modification by light-irradiation and heat treatment. J. NearInfrared Spectrosc. 11, 401–405. doi: 10.1255/jnirs.391
Tucker, M., Nguyen, Q., Eddy, F., Kadam, K., Gedvilas, L., and Webb, J. (2001).Fourier transform infrared quantitative analysis of sugars and lignin in pre-treated softwood solid residues. Appl. Biochem. Biotechnol. 91–93, 51–61. doi:10.1385/ABAB:91-93:1-9,51
Tuskan, G., West, D., Bradshaw, H. D., Neale, D., Sewell, M., Wheeler, N., et al.(1999). Two high-throughput techniques for determining wood properties aspart of a molecular genetics analysis of hybrid poplar and loblolly pine. Appl.Biochem. Biotechnol. 77–79, 55–65. doi: 10.1385/abab:77:1-3,55
Via, B. K., Adhikari, S., and Taylor, S. (2013). Modeling for proximate analysis andheating value of torrefied biomass with vibration spectroscopy. Bioresour. Technol.133, 1–8. doi: 10.1016/j.biortech.2013.01.108
Wei, H., Xu, Q., Taylor, L. E., Baker, J. O., Tucker, M. P., and Ding, S. Y. (2009).Natural paradigms of plant cell wall degradation. Curr. Opin. Biotechnol. 20,330–338. doi: 10.1016/j.copbio.2009.05.008
Wolfrum, E., and Sluiter, A. (2009). Improved multivariate calibration models forcorn stover feedstock and dilute-acid pretreated corn stover. Cellulose 16, 567–576.doi: 10.1007/s10570-009-9320-2
Workman, J. J. Jr. (2001). Infrared and Raman spectroscopy in paper and pulpanalysis. Appl. Spectrosc. Rev. 36, 139–168. doi: 10.1081/ASR-100106154
Xu, F., Yu, J. M., Tesso, T., Dowell, F., and Wang, D. H. (2013). Qualitative andquantitative analysis of lignocellulosic biomass using infrared techniques: a mini-review. Appl. Energy 104, 801–809. doi: 10.1016/j.apenergy.2012.12.019
Yang, Z., Jiang, Z. H., Fei, B. H., and Qin, D. C. (2007). Discrimination of woodbiological decay by soft independent modeling of class analogy (SIMCA) patternrecognition based on principal component analysis. Spectrosc. Spectral Anal. 27,686–690.
Yeh, T.-F., Chang, H.-M., and Kadla, J. F. (2004). Rapid prediction of solid woodlignin content using transmittance near-infrared spectroscopy. J. Agric. FoodChem. 52, 1435–1439. doi: 10.1021/jf034874r
Zhou, G., Taylor, G., and Polle, A. (2011). FTIR-ATR-based prediction and mod-elling of lignin and energy contents reveals independent intra-specific variationof these traits in bioenergy poplars. Plant Methods 7:9. doi: 10.1186/1746-4811-7-9
Ziebell, A. L., Barb, J. G., Sandhu, S., Moyers, B. T., Sykes, R. W., Doeppke, C.,et al. (2013). Sunflower as a biofuels crop: an analysis of lignocellulosic chem-ical properties. Biomass Bioenergy 59, 208–217. doi: 10.1016/j.biombioe.2013.06.009
Conflict of Interest Statement: The authors declare that the research was conductedin the absence of any commercial or financial relationships that could be construedas a potential conflict of interest.
Received: 16 May 2014; accepted: 22 July 2014; published online: 07 August 2014.Citation: Xiao L,Wei H, Himmel ME, Jameel H and Kelley SS (2014) NIR and Py-mbmscoupled with multivariate data analysis as a high-throughput biomass characterizationtechnique: a review. Front. Plant Sci. 5:388. doi: 10.3389/fpls.2014.00388This article was submitted to Plant Biophysics and Modeling, a section of the journalFrontiers in Plant Science.Copyright © 2014 Xiao, Wei, Himmel, Jameel and Kelley. This is an open-access articledistributed under the terms of the Creative Commons Attribution License (CC BY). Theuse, distribution or reproduction in other forums is permitted, provided the originalauthor(s) or licensor are credited and that the original publication in this journal is cited,in accordance with accepted academic practice. No use, distribution or reproduction ispermitted which does not comply with these terms.
Frontiers in Plant Science | Plant Biophysics and Modeling August 2014 | Volume 5 | Article 388 | 10
Related Documents