Executive Summary Company: NIKE Inc. (NKE) Vision: “NIKE, Inc. is the world’s leading innovator in athletic footwear, apparel, equipment and accessories.” Mission: “To bring inspiration and innovation to every athlete in the world.” SWOT Strength one of the most well-known companies in the world. Huge budget on R&D and becomes one of the most innovative firms Great marketing strategy that increases value of firm Weaknesses low cost competition that arises between among rivalries lacks its own retail stores bad reputation regarding exploiting child labor Opportunities Increased demand for sportswear in US An upcoming World cup 2010 and Olympic 2012 “Mercurial Vapor Superfly ii” Threats Li Ning PCL becomes main competitor for worldwide market Adidas Group’s 20 percent sales increase worldwide GE Model Growth Horizontal Integration SPACE Analysis Aggressive Grand Strategy Quadrant IV BCG Matrix Cash Cow QSPM Result 1. Increasing the number of retail store in abroad 2. Focusing on R&D by creating new fashion trend and the customer's preferences. 3. Nike's Application on smart phone and

NIKE INC EXECUTIVE SUMMARY
Dec 26, 2015
The following paper is the Nike Inc. company profile, financial data, and recommended strategies for Nike Inc. to be considered.
Welcome message from author
This document is posted to help you gain knowledge. Please leave a comment to let me know what you think about it! Share it to your friends and learn new things together.
Transcript

Executive Summary
Company: NIKE Inc. (NKE)Vision: “NIKE, Inc. is the world’s leading innovator in athletic footwear, apparel, equipment and accessories.”Mission: “To bring inspiration and innovation to every athlete in the world.”SWOT Strength one of the most well-known companies in the world.
Huge budget on R&D and becomes one of the most innovative firmsGreat marketing strategy that increases value of firm
Weaknesses low cost competition that arises between among rivalrieslacks its own retail storesbad reputation regarding exploiting child labor
Opportunities Increased demand for sportswear in USAn upcoming World cup 2010 and Olympic 2012
“Mercurial Vapor Superfly ii”Threats Li Ning PCL becomes main competitor for worldwide market Adidas Group’s 20 percent sales increase worldwide
GE Model Growth Horizontal IntegrationSPACE Analysis AggressiveGrand Strategy Quadrant IVBCG Matrix Cash CowQSPM Result 1. Increasing the number of retail store in abroad 2. Focusing on R&D by creating new fashion trend and the customer's
preferences. 3. Nike's Application on smart phone and gadgets 4. Doing marketing plan to increase sales in footwear and apparel 5. Focusing on footwear sales for kid and elder to reach new target 6. After sales service division 7. Discounting price for the new shoes by redeeming the old one 8. Doing more CSR project to help reduce advertising cost and
improve brand image.

NIKE, Incorporation
Nike is an American multinational corporation which is one of the world’s largest
suppliers of athletic shoes and apparel and a major manufacturer of sports equipment. The
company was founded in 1964, as Blue Ribbon Sports by Bill Bowerman and Phil Knight.
Nike products are inclusive of Nike Golf, Nike Pro, Nike+, Air Jordan, Air Force 1, Nike
Dunk, Nike Skateboarding and its subsidiaries brand including Hurley International, Jordan,
and Converse.
Nike sells an assortment of products, including shoes and apparels for sports
activities, namely football, American football, basketball, running, combat sports, tennis,
golf, and cross trainings for men, women, and children. Nike not only sell indoor sports
activities, but also sells products of outdoor activities, such as skateboarding, baseball,
cycling, baseball, volleyball, cheerleading, wrestling, aquatic activities, and other recreational
products. It is well known in youth culture and hip hop culture for its urban fashion clothing.

NIKE’s Mission and Vision
Mission statement: “To bring inspiration and innovation to every athlete in the world.”
The legendary University of Oregon track and field coach, and Nike co-founder, Bill
Bowerman said, “If you have a body, you are an athlete.”
Vision statement: “NIKE, Inc. is the world’s leading innovator in athletic footwear, apparel,
equipment and accessories.”
Nike’s Improved Vision and Mission Statement
Improved Mission statement: “Bringing inspiration and innovation to all.”
Nike’s products can actually be used by everybody in the world. Ranging from the shoes to
clothes and other sports apparels, therefore if Nike uses the term “athlete” customers who do
not often play sports might not feel that he or she is a part of Nike. Even though Bill
Bowerman have said “If you have a body, you are an athlete,” but the it still emphasizes on
the athlete. Therefore by improving the mission to “Bringing inspiration and innovation to
all” it focuses on how Nike still bring inspiration and innovation continuously and to all
which means everyone globally.
Columbia Sportswear
Mission statement: “Design and deliver authentic, outdoor, high-value products for active
consumers of all ages.”
Vision statement: N/A
Li-Ning
Mission statement: “Through sports, we inspire people the desire and power to make
breakthroughs”
Vision statement: “A world’s leading brand in the sports goods industry”
Puma
Mission statement: At PUMA, we believe that our position as the creative leader in
sportlifestyle gives us the opportunity and the responsibility to contribute to a better world for
the generations to come. A better world in our vision—the PUMAVision—would be safer,
more peaceful, and more creative than the world we know today.
Vision statement: Fair, Honest, Positive, Creative
Adidas
Mission statement:“The Adidas Group strives to be the global leader in the sporting goods
industry with brands built on a passion for sports and a sporting lifestyle”
Vision statement: N/A
Conclusion
“To bring inspiration and innovation to every athlete in the world,” is the mission of
Nike. Nike focuses on bringing all the best innovations to the athletes therefore they are able
to play sports more efficiently. “Design and deliver authentic, outdoor, high-value products for
active consumers of all ages,” is the mission of Columbia sportswear. It tends to focus more on the
outdoor activities and they tend to be more how well consumers can use their sports equipment in
doing outdoor activities. Li-Ning’s mission is “Through sports, we inspire people the desire and
power to make breakthroughs” supports the customers to become athletes. “At PUMA, we
believe that our position as the creative leader in sport lifestyle gives us the opportunity and
the responsibility to contribute to a better world for the generations to come.” For Puma it
believes that it is the leader in sports lifestyle that creates opportunities for those who want to
play sports to participate in order to become athletes. “The Adidas Group strives to be the
global leader in the sporting goods industry with brands built on a passion for sports and a
sporting lifestyle” According to Adidas its mission is to be the global leader who build
passion for people to play sports and to live a sporty lifestyle.

NIKE Porter's Five Forces Analysis
Competition Among Current Competitors
Sportswear industry is considered as an intense competitive industry. Focusing on
North America market, the only large and most reputable brands will only be counted; there
are five gigantic market participants exists; Nike, Puma, Adidas, Li Ning, and Skechers.
These top five companies are considered to be leaders of sportswear industry. Their market
shares have increased continuously, and have further expected to grow for decades. Since the
global trend is constantly changing, accompanying with Generation X getting older, it is
expected that world population will be more concerned health and exercises. In addition, the
global economy has recovered after a long financial distress occurred in 2008. After all these
reasons, economy is going to improve, sooner or later, the existing competitors will put more
focus on its operation and try to improve itself more than ever to grab the opportunity and
beat the market. According to the research, top five leading companies do not only offer
products where its headquarter locates but, instead, they have expanded worldwide or even
better they open subsidiaries under different brand offering different products. For Nike Inc.,
it owns several subsidiaries; for example, Cole Haan selling Trendy shoes, accessories, and
outerwear for men and women; another brand under Nike Inc., is Hurley; it offers beach-
active apparel such as board-shorts, wetsuit, and also hoodies etc.. However, its competitors
also become multinational firm opening subsidiaries worldwide. Considering Nike's neck-
and-neck rival; ADIDAS, it also has Rockport to compete with Nike's Cole Haan and Taylor
Made Adidas Golf to rib Nike golf's market share. From now onwards, not only the market
shares and brand loyalty that they are competing for. But, also competing to access to lower
the cost of production. Nowadays, these top five companies are trying to search for new
production base in new emerging market which will allow them to pay lower cost and gain
competitive advantage over its competitors.
Threat of new entrants
Since the past, Sportswear industry has gradually evolved to become one of the most
important industries in people's life. Most leading companies in the industry become
enormous after they have participated in sports sponsorship such as football team, tennis, or
distance runner. Apparently, trustworthy is the most required. From time to time, both small
and large firms take years or even several decades to build close relationship to build such
sports team, and those who require relationship needs a huge amount of capital invested.

Firms who do businesses in sportswear industry need to be willing to spend huge amount of
research and development, since technology and innovations are essential. For instance, the
fabric used to produce sportswear apparel must be able to absorb sweat during the game and
after the game. What is most challenging is how does the firm take its competitive advantage
to breakthrough the customer’s needs. The company who ever moves first gained the most
benefit. Since the firm with low capital for research and development and sponsorship will
eventually be eliminated from the market. Even for those new brands who are trying to enter
this industry, it can be hardly done since it is very difficult to build the brand relationship
between the firm and the customer. Therefore the threat of new entrant is relatively low.
Threat of substitute product
Threat of substitute product is moderate. In sportswear industry, customer is offered a
wide range of product with various price levels. Price is mostly determined by the quality and
reputation of certain brands which sell the product. For those customers who have concerns
about costs, they usually go to Costco and Champs Sport to buy the sports products. On the
other hand, customers who are less concerned with their cost would go to Nike shops, Adidas
shops, Macys, or other department stores to purchase the products. However, when taking a
closer look, those substitute products of Nike are its direct competitors, such as Adidas,
Puma, Li Ning, Skechers, and Columbia sportswear. But the main idea is that, the direct
substitute for each product is not high. For instance, Nike is well-known for its sports shoes,
such as basketball shoes, but other brands like Columbia sportswear are more well-known for
the outdoor activities shoes. So it is said that threat of substitute product is not as high.
Bargaining power of customer
The firms such as Nike, Adidas, Lining, Skechers, Columbia sportswear, and Puma
have offered identical products with similar qualities. Customers of these brands are
considered as price sensitive therefore if any brands increase its price, the customers may
shift to other brands, since customers have high bargaining power. Since in sportswear
industry, customer is also considered as quite loyalty to the bran, which implies that even if
some particular brand increase the price, some customer may shift to the other brand while
most of them still stick with the brand. To conclude, Brand loyalty is a factor which slow
down price sensitiveness of the customer then, the bargaining power of customer is moderate.

Bargaining power of supplier
It is believed that bargaining power of supplier is low. Companies producing and
selling sportswear and athletic product always buy input of production in large amount for
example, rubber, cotton, etc.; Because apparel raw material is accessible, it makes suppliers
has low potential to negotiate about the price and contract. In addition, since globalization
becomes more attractive, many leading companies may find their new manufacturing base
where production cost is lower; supplies or raw material will be provided where the
production is taken place. For example, Vietnam plays gradually a main role in world market
because of its low production cost which is very attractive to multinational firm. In case of
Nike, Vietnam is only one of its production base; workers are paid very low wages, which
indirectly gives Nike a great deal of power over these oftentimes helpless factory workers. In
effect, because Nike can easily switch factories, it controls the suppliers.

Financial Ratio Analysis
Trend Analysis
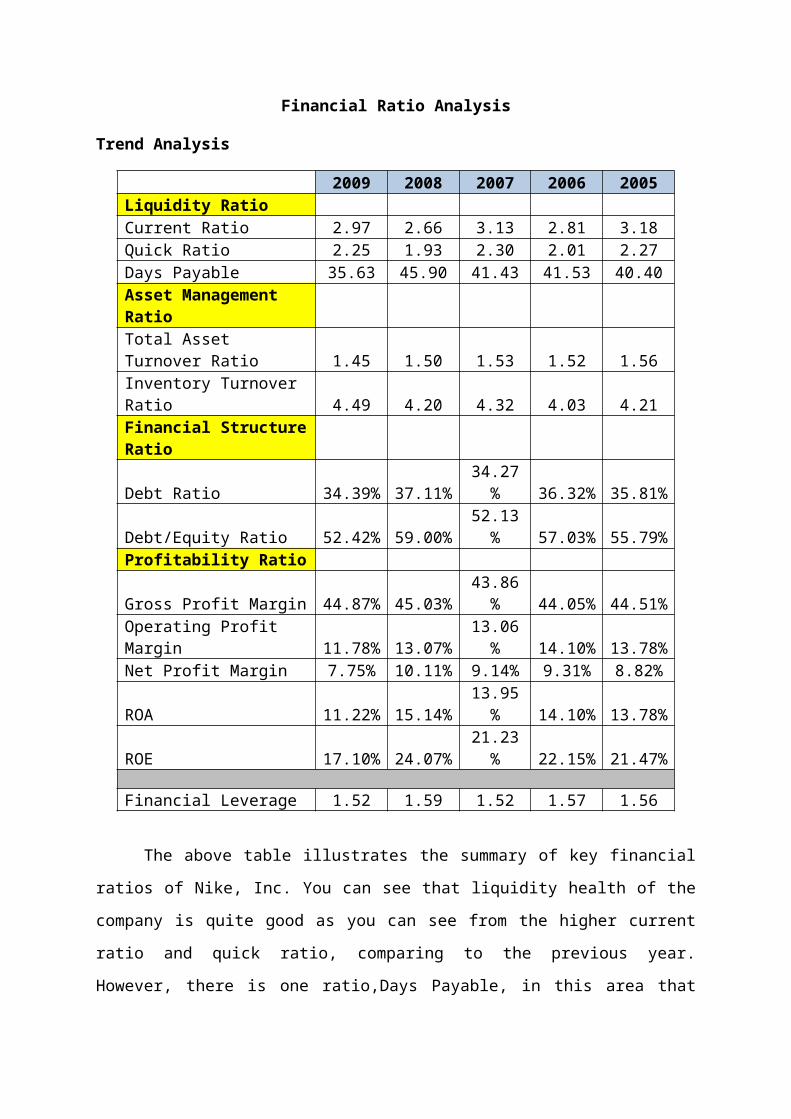
2009 2008 2007 2006 2005Liquidity RatioCurrent Ratio 2.97 2.66 3.13 2.81 3.18Quick Ratio 2.25 1.93 2.30 2.01 2.27Days Payable 35.63 45.90 41.43 41.53 40.40Asset Management RatioTotal Asset Turnover Ratio 1.45 1.50 1.53 1.52 1.56Inventory Turnover Ratio 4.49 4.20 4.32 4.03 4.21Financial Structure RatioDebt Ratio 34.39% 37.11% 34.27% 36.32% 35.81%Debt/Equity Ratio 52.42% 59.00% 52.13% 57.03% 55.79%Profitability RatioGross Profit Margin 44.87% 45.03% 43.86% 44.05% 44.51%Operating Profit Margin 11.78% 13.07% 13.06% 14.10% 13.78%Net Profit Margin 7.75% 10.11% 9.14% 9.31% 8.82%ROA 11.22% 15.14% 13.95% 14.10% 13.78%ROE 17.10% 24.07% 21.23% 22.15% 21.47%
Financial Leverage 1.52 1.59 1.52 1.57 1.56
The above table illustrates the summary of key financial ratios of Nike, Inc. You can
see that liquidity health of the company is quite good as you can see from the higher current
ratio and quick ratio, comparing to the previous year. However, there is one ratio,Days
Payable, in this area that become worse. During the year of 2009, Nike had to pay its payable
faster than its previous five years, reaching the bottom at around 36 days.
For the asset management aspect, Nike’s ability to manage overall its assets is the
worst in 2009 during the past five year. Surprisingly, when we focus on just the part of
inventory management, the company can manage it the best during the past five years. On the
other hand,the financial structure of the company remained quite constant over five years as
you can see from stable debt ratio and debt to equity ratio.
In addition, it is obviously seen that all of the profitability ratios of Nike reach the
bottom during the past five years in 2009, especially ROE which sharply dropped from the
peak at 24.07% in 2008 to 17.10% in 2009. This mainly came from the economic crisis in
US, especially Hamburger crisis and subprime loan crisis which slow down the economy of
US throughout the country.

200920082007200620053.80
4.00
4.20
4.40
4.60
Inventory Turnover Ratio
200920082007200620052.402.602.803.003.203.40
Current Ratio
200920082007200620050.00%2.00%4.00%6.00%8.00%10.00%12.00%
Net Profit Margin
200920082007200620051.35
1.40
1.45
1.50
1.55
1.60
Total Asset Turnover Ratio
Du Pont Analysis (Trend Analysis)
2009 2008 2007 2006 2005Net Profit Margin 7.75% 10.11% 9.14% 9.31% 8.82%Total Asset Turnover Ratio 1.45 1.50 1.53 1.52 1.56Financial Leverage 1.52 1.59 1.52 1.57 1.56ROE 17.10% 24.07% 21.23% 22.15% 21.47%
In order to see which factor causes ROE become lower, we decompose the ROE into
three dimensions: profitability management, efficiency management, and financial leverage.
Not surprisingly, due to the economic problem as mentioned above, all three factors are lower
than the previous year, especially the profitability of the company. This is due to products of
Nike are consumer products, so its sales are vary according to the economic situation.
200920082007200620050.00%5.00%10.00%15.00%20.00%25.00%30.00%
ROE
200920082007200620050.00%
5.00%
10.00%
15.00%
20.00%
ROA
Cross Sectional Analysis
Nike Adidas Puma Skechers Li-NingColumbia
SportswearLiquidity RatioCurrent Ratio 2.97 1.58 2.19 3.42 1.70 5.14Quick Ratio 2.25 1.06 1.63 2.45 1.36 3.90Days Payable 35.63 75.07 79.84 44.82 68.29 51.96Asset Management RatioTotal Asset Turnover Ratio 1.45 1.17 1.22 1.45 1.76 1.03Inventory Turnover Ratio 4.49 3.85 3.44 3.73 6.99 3.24Financial Structure RatioDebt Ratio 34.39% 57.45% 38.44% 24.73% 46.78% 17.78%Debt/Equity Ratio 52.42% 135.04% 62.45% 32.85% 87.90% 21.63%Profitability RatioGross Profit Margin 44.87% 45.39% 51.30% 41.69% 47.33% 42.13%Operating Profit Margin 11.78% 3.10% 7.50% -0.22% 16.00% 7.05%Net Profit Margin 7.75% 2.36% 5.20% 3.80% 11.56% 5.39%ROA 11.22% 2.76% 6.37% 5.49% 18.02% 5.53%ROE 17.10% 6.49% 10.30% 7.30% 33.87% 6.72%
Financial Leverage 1.52 2.35 1.62 1.33 1.88 1.22
The above table illustrates the summary of key financial ratios of Nike, Inc. and its
competitors, including Adidas AG, Puma SE, Skechers, Li Ning and Columbia sportswear
company. As you can see from the liquidity ratio, Columbia sportswear company has an
impressive liquidity position shown by current ratio and quick ratio being higher than other
companies while Nike ranks number 3 which still in the good place. However, Nike has the
lowest days payable ratio. It means that Nike has to pay its bills to suppliers faster than other
companies.
For the asset management aspect, Li Ning can use its assets most efficiently in
generating sales shown by both total asset turnover ratio and inventory turnover ratio that are
above other companies while Nike ranks the second place. Turning to financial structure
ratio, Adidas has the highest debt ratio and debt to equity ratio, indicating that Adidas is more
leveraged than peers. The high debt to equity ratio limits its ability to borrow funds at
reasonable interest rates and leads to high borrowing costs, resulting in the low net income
supported by its net profit margin, 2.36 percent, which is lower than other companies. Not
surprisingly, Adidas faces the highest financial risk measured by financial leverage, 2.35
times. Nike’s financial structure, on the other hand, is financially strong.

For the profitability aspect, all profitability ratios apart from gross profit margin show
that Li Ning is the most successful company in terms of generating returns while Puma has
the highest gross profit margin, 51.3 percent. For Nike Inc., its overall efficiency and
performance measured by profitability ratios ranks the second place follow Li Ning except its
gross profit margin which ranks the fourth place.
Du Pont Analysis (Cross Sectional Analysis)
Nike Adidas Puma Skechers Li-NingColumbia
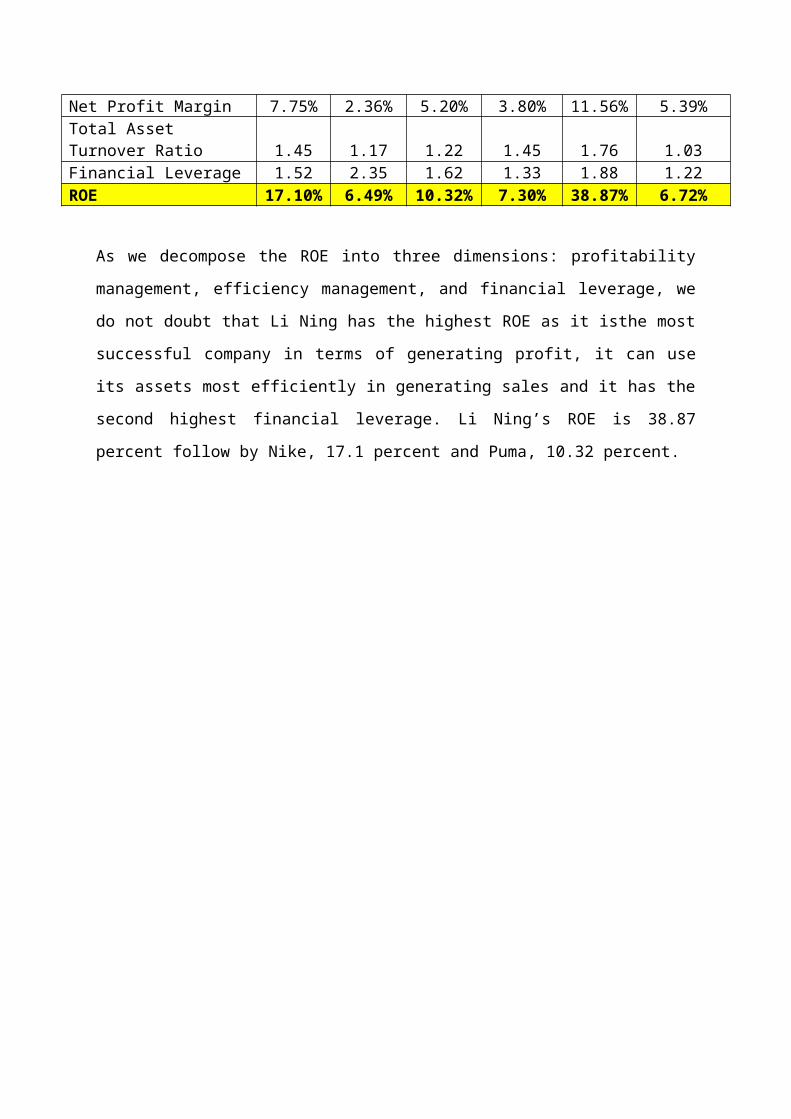
SportswearNet Profit Margin 7.75% 2.36% 5.20% 3.80% 11.56% 5.39%Total Asset Turnover Ratio 1.45 1.17 1.22 1.45 1.76 1.03Financial Leverage 1.52 2.35 1.62 1.33 1.88 1.22ROE 17.10% 6.49% 10.32% 7.30% 38.87% 6.72%
As we decompose the ROE into three dimensions: profitability management, efficiency
management, and financial leverage, we do not doubt that Li Ning has the highest ROE as it
isthe most successful company in terms of generating profit, it can use its assets most
efficiently in generating sales and it has the second highest financial leverage. Li Ning’s ROE
is 38.87 percent follow by Nike, 17.1 percent and Puma, 10.32 percent.
Nike Adidas Puma Skechers Li-Ning Columbia Sportswear
0.00%
5.00%10.00%15.00%20.00%25.00%30.00%35.00%40.00%45.00%
ROE
Nike Adidas Puma Skechers Li-Ning Columbia Sportswear
0.00%2.00%4.00%6.00%8.00%
10.00%12.00%14.00%16.00%18.00%20.00%
ROA
Nike
AdidasPuma
Skech
ers
Li-Ning
Columbia Sp
ortswea
r0.00%2.00%4.00%6.00%8.00%
10.00%12.00%14.00%
Net Profit Margin
Nike
AdidasPuma
Skech
ers
Li-Ning
Columbia Sp
ortswea
r-2.00%
2.00%
6.00%
10.00%
14.00%
18.00%
Operating Profit Margin
Nike
AdidasPuma
Skech
ers
Li-Ning
Columbia Sp
ortswea
r0.00
10.0020.0030.0040.0050.0060.0070.0080.0090.00
Days Payable
Nike
AdidasPuma
Skech
ers
Li-Ning
Columbia Sp
ortswea
r0.00
2.00
4.00
6.00
8.00
Inventory Turnover Ratio
Nike
AdidasPuma
Skech
ers
Li-Ning
Columbia Sp
ortswea
r0.00%
20.00%40.00%60.00%80.00%
100.00%120.00%140.00%160.00%
Debt/Equity Ratio
Nike
AdidasPuma
Skech
ers
Li-Ning
Columbia Sp
ortswea
r0.001.002.003.004.005.006.00
Current Ratio

Organizational Chart of Nike Inc.

The organizational chart above is the functional organizational chart, which is structured with
fewer managers at the top and more people with lower power at the bottom. In this type of
chart, job classifications are well-defined, and authorities were up-down.
The advantages of the functional organizational chart are that it offers high level of
specialization, whereby entry-level employees can develop their specialized skills and
knowledge as they move up the hierarchy. In addition, employees who are experts in their
functional area are eligible to perform with high speed and efficiency. Since the career path in
the functional units are clear, employees are more likely to be motivated to advance their
career path, which will result in employees becoming more productive.
On the other hand, functional organizational chart also comes with drawbacks. Even
though the specialized unit operates with high efficiency, but they might not be able to
perform well with other units. Therefore if a project requires several units to work together,
the units may be unwilling to cooperate with one another and this will lead to the projects to
fall behind schedule. Moreover, as the organization becomes larger, the top manager needs to
delegate more decision making responsibilities to each area, therefore it is challenging top
managers to maintain control and manage the several different units of the organization well.

Recommended Organizational Chart

After having re-organized the structure of Nike Incorporation, it is suggested that the Greater
China and Nike Golf should be under supervision of Chief Operating Officer since Chief
Operating Officer has already taken care of the Nike products according to the territories
assigned. Moreover, the Nike Golf should be under the management of Nike Brand. The
major readjustments to Nike Brand it is divided into the product types, which can be seen on
the right and the interactions to customers, which can be seen on the left hand side.
Market Positioning Map
Nike is recognized as one of top sports brand in the world. It is a brand that offers wide range
of choices for individuals, ranging from sports equipment, athletic shoes, to clothes.
Specifically, Nike shoes have focused primarily on youths, and with its premium brand, they
are positioned together with the well-designed. Nike emphasized its brand image by focusing
on the sports and fantasies.
For Adidas and Puma, which are the key players in the industry. It can be seen that all
three brands, Nike, Adidas, and Puma are the brands that good emphasis on fashion and it has
a good performance. The other competitors, such as Columbia Sportswear, Li-Ning, and
Skechers are less fashionable, but more into technology have a good performance.

Nike Marketing Strategies
Targeting Strategies
As Nike products are produced with high quality and it has continuously gained reputations
from all over the world, it can be seen that the prices of Nike products are more expensive
than most other brands. Consumers who purchase Nike usually perceive it has high-end
products.
The fact that majority of Nike consumers are the sportsmen or even females who play
sports. This is why Nike has been focusing on product sponsorship for professional and well-
known athletic team, college sports team, and even celebrity athletes. Events like American
Football, soccer tournament, golf tournament, and even FIFA World Cup receive sponsorship
from Nike. As a result, Nike becomes successful as it was able to reach many athletes.
Sometimes the manager of the sports team lay down a particular kind of track shoes, so the
team members have no choice, but to purchase them. More marketing strategies of Nike
include the styling of product purpose. When the superstar athlete sponsors Nike, it will be
related to victory. This psychological effect affect the viewers and it is reinforced with
promotions which affirms this.
Pricing Strategies
The pricing strategies of Nike is focuses on product understanding and closeness. This
lead to the fact the Nike set higher costs than its rivalries. The superior quality havelead to the
superior prices which therefore have added the value to the product, as consumers begin to
view Nike as a high-end product.
Distribution Strategies
It is vital for on-time delivery of the Nike products to the consumers, since it results in
the high level of consumer’s satisfaction as well as loyalty. Nike Inc. distributes the products
based on the level. High costs (premiums) products are distributed to particular distributors,
whereby low priced products are to be traded at discounted prices at retail stores.
Communication and Promotional Marketing Strategy
Nike has hired several professionals and sports men celebrities that managed to make
a considerable interest to their products. Athletes such as Ronaldo, Lebron James, or Tiger
Woods are some of the contracted male athletes. This havelead to a high level of Nike
products awareness. Additionally, Nike also increased its brand awareness by using a
selective demand ad targets on higher cost shoes utilized for typical sports.
Firm Operation Location Map & Value Chain Analysis Chart
Nike operates worldwide, over six major territories which comprised of: North America,
Western Europe, Central/Eastern Europe, Emerging Markets (developing countries), Great
China, and Japan. According to the Nike website, the total contract factories under Nike are
612 factories worldwide, which locates in 46 countries globally, with 819,990 workers
worldwide.

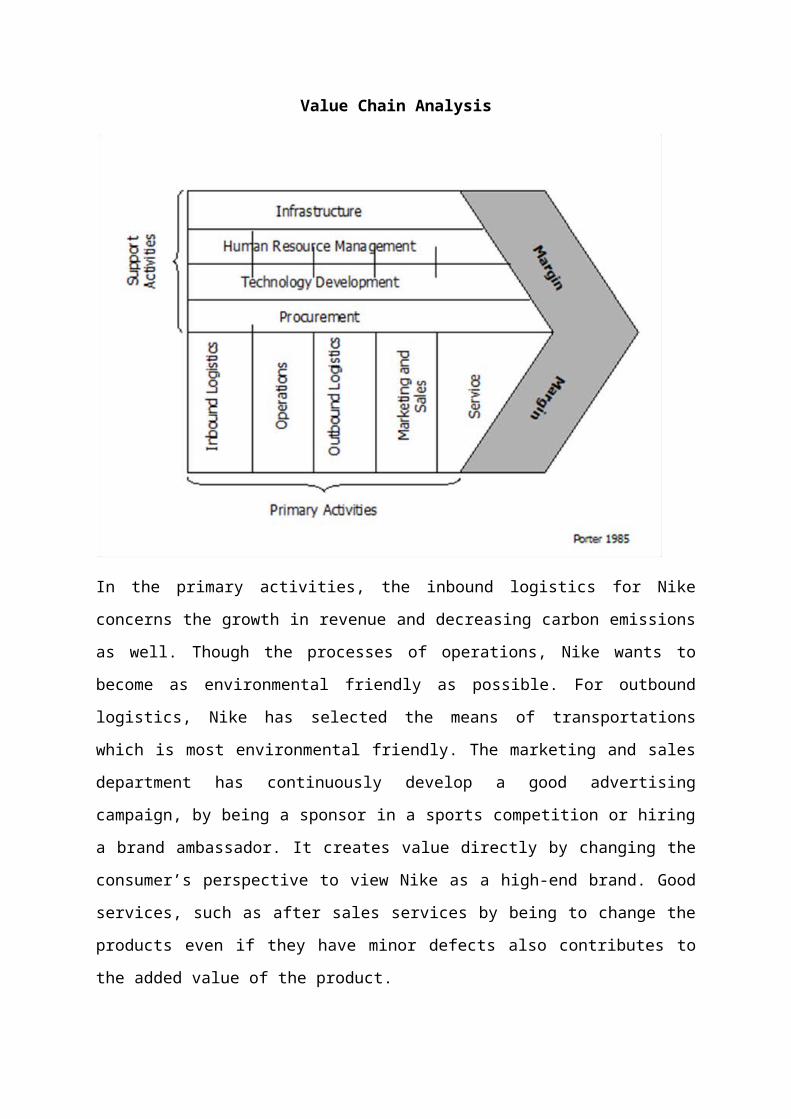
Value Chain Analysis
In the primary activities, the inbound logistics for Nike concerns the growth in revenue and
decreasing carbon emissions as well. Though the processes of operations, Nike wants to
become as environmental friendly as possible. For outbound logistics, Nike has selected the
means of transportations which is most environmental friendly. The marketing and sales
department has continuously develop a good advertising campaign, by being a sponsor in a
sports competition or hiring a brand ambassador. It creates value directly by changing the
consumer’s perspective to view Nike as a high-end brand. Good services, such as after sales
services by being to change the products even if they have minor defects also contributes to
the added value of the product.
According to the supporting activities, the products of Nike has been produced through
factories worldwide. It has been chosen by Nike, concerned already regarding the quality at
acceptable cost. Moreover, the human resource management ensures that the staffs have been
working professionally, focusing on their specialized tasks. Each one has been assigned a
specific tasks. The technological development has allowed Nike to make its running shoes
becoming the most updated technology, which makes running becomes much easier for
athletes.

Nike Website & Nike Online Store
The photo above is the homepage of http://www.nike.com. It can be seen that Nike has been
using Russell Wilson as the brand ambassador, which is consistent with its marketing effort.
The website is relatively fast and easy to use. People of all ages can access the website easily
and look at the products available online.
On the Nike online website, consumers can browse over more than 7,080 products via
internet. The products are well categorized by gender, categories (shoes, clothing), sports,
collections, and even custom made. One cool thing about the Nike online shop is that
consumers can customize their Nike products online with NikeiD.

Value of the Firm Analysis
Estimating Growth Rate
1. Historical Growth Rate
Year Revenue Change in Revenue % Change in Revenue2009 19176.1 549.1 2.95%2008 18627.0 2301.1 14.09%2007 16325.9 1371.0 9.17%2006 14954.9 1215.2 8.84%2005 13739.7 1486.6 12.13%2004 12253.1
5-year average growth rate 9.44%5-year compound average growth rate 8.36%
The above table shows the average growth rate of Nike’s revenue which is computed
from the percentage change in revenue during the year of 2000-2009. In this case, our group
is going to use the 5–year compound average growth since this value gives us more accurate
value than the 5–year average growth rate. Therefore, our historical growth rate is 8.36%.
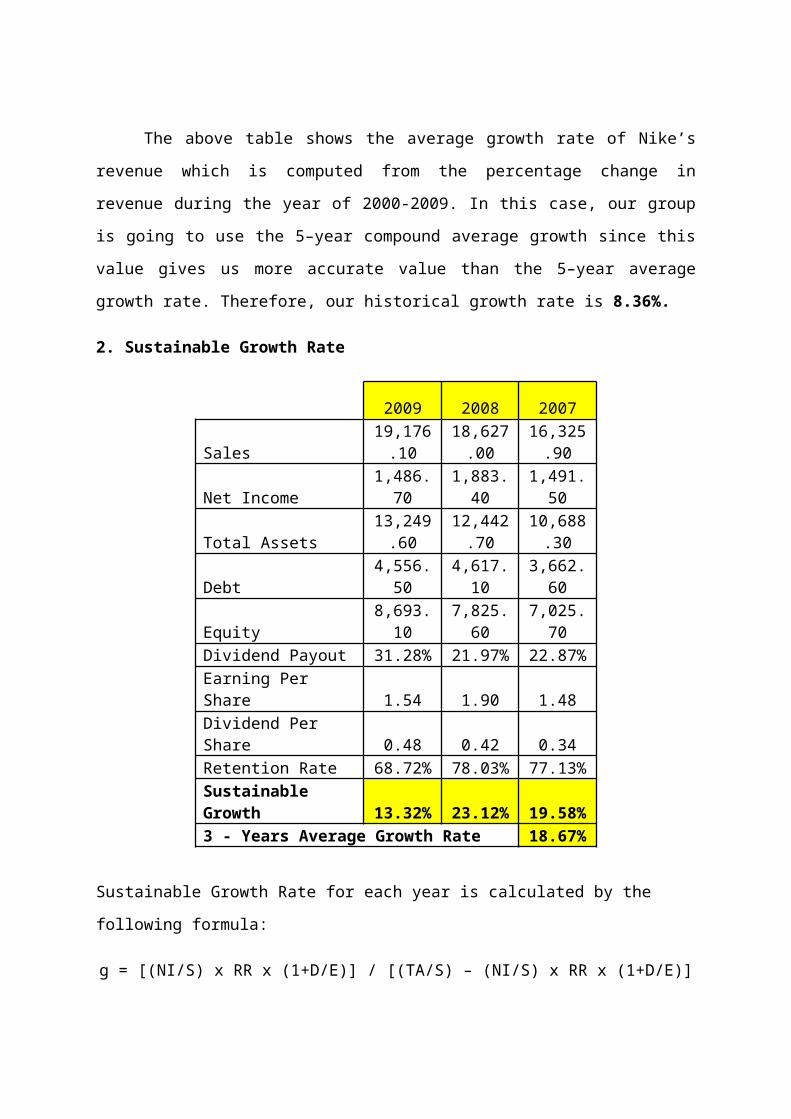
2. Sustainable Growth Rate
2009 2008 2007
Sales19,176.1
018,627.0
016,325.9
0Net Income 1,486.70 1,883.40 1,491.50
Total Assets13,249.6
012,442.7
010,688.3
0Debt 4,556.50 4,617.10 3,662.60Equity 8,693.10 7,825.60 7,025.70Dividend Payout 31.28% 21.97% 22.87%Earning Per Share 1.54 1.90 1.48Dividend Per Share 0.48 0.42 0.34Retention Rate 68.72% 78.03% 77.13%Sustainable Growth 13.32% 23.12% 19.58%3 - Years Average Growth Rate 18.67%
Sustainable Growth Rate for each year is calculated by the following formula:
g = [(NI/S) x RR x (1+D/E)] / [(TA/S) – (NI/S) x RR x (1+D/E)]

The above table shows the sustainable growth rate in each last three years. We are
going to use the average rate of these sustainable growth rates in order to find the sustainable
growth rate. Therefore, the sustainable growth rate is 18.67%.
3. Growth rate from multiple regressions
GDP Growth Industry Growth Company Growth2000 4.10% 1.10% 12.13%2001 1.00% -5.32% 14.55%2002 1.80% 2.87% 8.13%2003 2.80% 1.67% 4.25%2004 3.80% 3.40% 5.44%2005 3.40% 2.55% 2.51%2006 2.70% 1.96% 14.09%2007 1.80% 2.13% 9.17%2008 -0.30% -11.12% 8.84%2009 -2.80% 0.11% 12.13%*2010 2.50% 0.67% 8.64%
* the values in year 2010 are forecasted as the following.
In order to forecast the industry growth rate for 2010, we run simple linear regression
by using GDP Growth as x-variables and Industry Growth as y-variable to find the following
equation: y = -0.0208+1.1027(X1). Therefore, the industry growth of 2013 is 0.67%
The above table is the summary when we run simple linear regression between GDP Growth
and Industry Growth.
In order to forecast the company growth in 2010, we use the forecasted GDP growth and industry growth to run multiple regressions as x-variables:

Therefore, we substitute expected GDP growth and Industry growth in 2010 in the
multiple linear regression and we will get the company growth is 8.64%
4. Qualitative Analysis
According to the world economic problem, we found that in the beginning of 2009,
US has got Hamburger crisis, subprime lending had become too aggressive, many subprime
mortgages were going to go into default, and as a result securities backed by subprime
mortgages were falling in value. This impact creates negative impacts not only to the banking
industry but also to the textile-apparel & accessories industry where Nike fell in. However,
since Nike is the company has the customer based in many countries around the world and its
brand and its products are well recognized and have good reputation, its sales revenue still
increases but not that much, comparing to the previous year. So, we adjust the qualitative
growth rate of the company to be 10%.
Average Growth of 4 methods
Growth from historical growth rate = 8.36%
Growth from sustainable growth rate = 18.67%
Growth from multiple regression = 8.64%
Growth from our qualitative adjustment = 10%
Average growth = 8.36 %+18.67 %+8.64 %+10 %
4= 11.42%

Forecasting Revenues
By looking the past financial statement and the performance in doing business, Nike
can be considered as “Good Company” which has good reputation. Moreover, from the
Internal Assessment analysis, we can see that Nike has several strengths which overweight its
weaknesses. Therefore, we can conclude that Nike is a good company and we think Nike
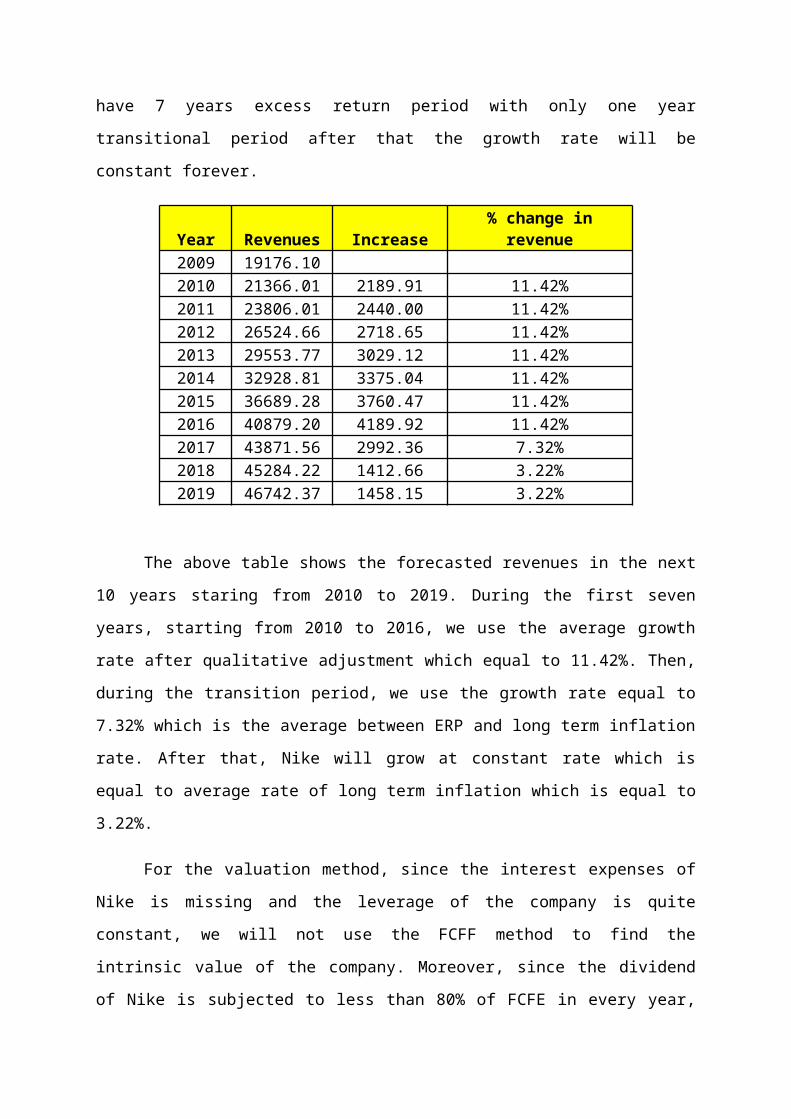
should have 7 years excess return period with only one year transitional period after that the
growth rate will be constant forever.
Year Revenues Increase % change in revenue2009 19176.102010 21366.01 2189.91 11.42%2011 23806.01 2440.00 11.42%2012 26524.66 2718.65 11.42%2013 29553.77 3029.12 11.42%2014 32928.81 3375.04 11.42%2015 36689.28 3760.47 11.42%2016 40879.20 4189.92 11.42%2017 43871.56 2992.36 7.32%2018 45284.22 1412.66 3.22%2019 46742.37 1458.15 3.22%
The above table shows the forecasted revenues in the next 10 years staring from 2010
to 2019. During the first seven years, starting from 2010 to 2016, we use the average growth
rate after qualitative adjustment which equal to 11.42%. Then, during the transition period,
we use the growth rate equal to 7.32% which is the average between ERP and long term
inflation rate. After that, Nike will grow at constant rate which is equal to average rate of
long term inflation which is equal to 3.22%.
For the valuation method, since the interest expenses of Nike is missing and the
leverage of the company is quite constant, we will not use the FCFF method to find the
intrinsic value of the company. Moreover, since the dividend of Nike is subjected to less than
80% of FCFE in every year, the dividend discount model also should not be applied. As a
result, our group chooses to find the intrinsic value of Nike by using FCFE method.
Estimating Cost of Equity: from CAPM formula

Rf(US 10-years Government Bond) = 3.8368%
Beta of Nike = 0.881
Market Return = 9.81%
CostofEquity=Rf +β∗( Rm−Rf )Cost of Equity = 3.8368% + 0.881*(9.81% - 3.8368%)
= 9.10%
Forecasting FCFE
Year FCFE Growth2009 1039.112010 1157.773 11.42%2011 1289.99 11.42%2012 1437.307 11.42%2013 1601.448 11.42%2014 1784.333 11.42%2015 1988.104 11.42%2016 2215.145 11.42%2017 2377.294 7.32%2018 2453.843 3.22%2019 2532.856 3.22%
Calculating Intrinsic Value
Year FCFE Growth Cost of Equity PV of FCFE2009 1039.112010 1157.773 11.42% 9.10% 1061.2112011 1289.99 11.42% 9.10% 1083.7862012 1437.307 11.42% 9.10% 1106.842013 1601.448 11.42% 9.10% 1130.3862014 1784.333 11.42% 9.10% 1154.4322015 1988.104 11.42% 9.10% 1178.9892016 2215.145 11.42% 9.10% 1204.0692017 2377.294 7.32% 9.10% 1184.4342018 2453.843 3.22% 9.10% 1120.6062019 2532.856 3.22% 9.10%
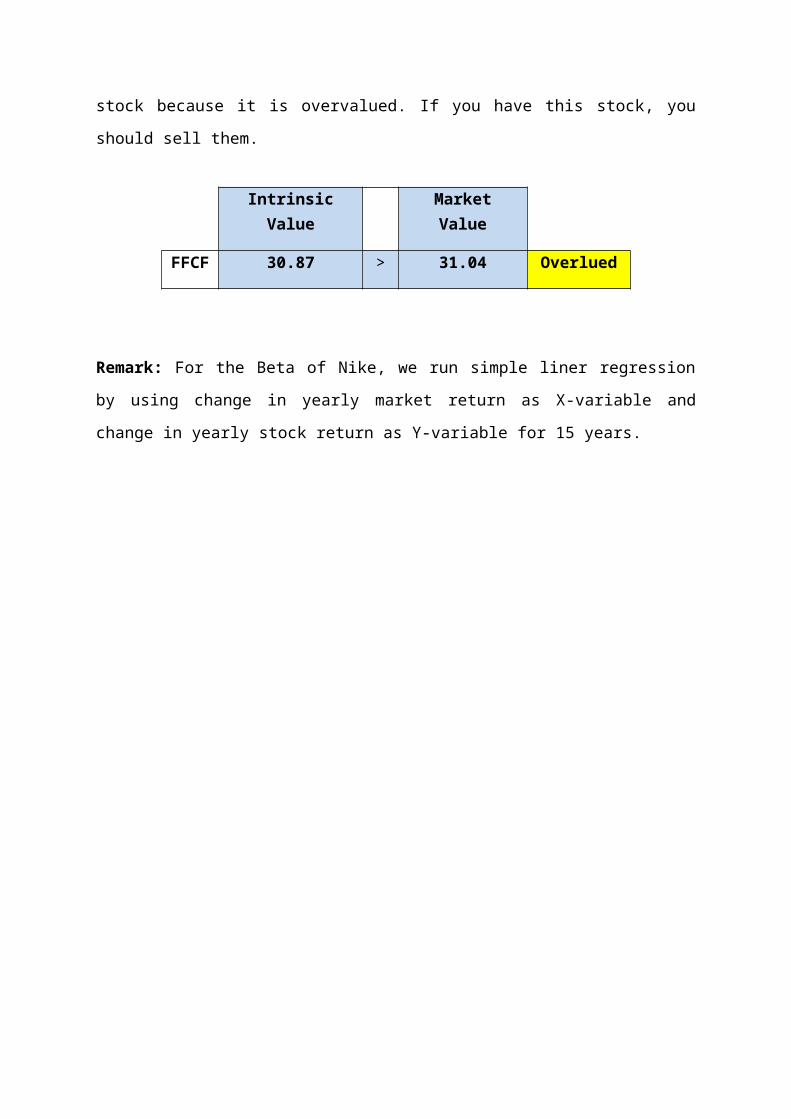
Terminal Value 43081.73PV of Terminal Value 19674.31PV of FCFE 29899.06Number of Shares Outstanding 968.7Intrinsic Value 30.87
Intrinsic Value = $30.87 per Share
Market value = $31.04 per Share

Since Intrinsic Value is less than Market Price, which means IRPC’s stock is
overvalued, so you should not buy this stock because it is overvalued. If you have this stock,
you should sell them.
Remark: For the Beta of Nike, we run simple liner regression by using change in yearly
market return as X-variable and change in yearly stock return as Y-variable for 15 years.
Intrinsic Value Market Value
FFCF 30.87 > 31.04 Overlued

SW Analysis: Strengths
1. Nike is one of the most widely-known companies in the world.
2. Nike’s swoosh logo is widely recognizable.
3. Nike offers various products ranging from athlete footwear to clothing and
accessories.
4. Nike has been listed as the number one most innovative companies in the world.
5. Recognized by Fortunes as “100 Best Companies to Work For”.
6. Nike has established an effective business relationships globally.
7. Nike is able to outsource its product to low-cost factories in Asia, specifically China,
Vietnam, and Indonesia.
8. Nike uses high quality product and was able to pass on to consumers by raising prices,
thereby consumers perceive Nike as premium products.
9. Nike has managed to find ways to innovate product and provide different price range
for different demographics.
10. Nike has the largest market share in the athletic footwear and apparel industry.
11. Nike is the industry leader.
12. Nike is a very competitive organization.
13. Nike has a great marketing strategies in sponsoring the top athletes and gain valuable
coverage.
14. Nike’s product innovation is ahead of the technology curve, therefore attract loyal
followers.
15. The strong free cash flow generated by Nike enhances shareholder’s value.
16. Nike maintains a large Research & Development budget, in order to be ahead of the
competitor.
17. Nike has no ownership of physical factories, so production could be moved to a more
cost effective location.
18. Nike has ventured into several different rebranding opportunities with successful
results.
19. Nike has a easily accessible website which enables the online users to shop via Nike
online store.
20. Nike online users can customize their own Nike products online and this have led
Nike to become aware that it attracts more users who wants to make their shoes
different from other’s shoes.

SW Analysis: Weaknesses
1. Nike has its reputation for exploiting for inexpensive child labor at the Asian factories
where products are produced.
2. Nike has history for its overtime laws and minimum wage rates in Vietnam.
3. Nike has been accused of poor working conditions in the production factories of Nike
products.
4. Nike has constant focal point for negative criticism by anti-globalization groups.
5. The uncovered child labor law in Pakistan led to criticisms about Nike, and as a result
Nike has seen a slight sales decline.
6. Many human right groups formed alliance to pronounce the Nike scandal testimonial
and have ended in the tarnish of Nike reputation.
7. Nike lacks retail stores and its products most of the time has to be ordered online.
8. Boards of directors have an average age of around 60.
9. Even though Nike has a diversified range of sports products, but its income is heavily
depended on footwear market.
10. The low price competition that arises cause Nike to have lowered their price in order
to compete with the competitors. This caused Nike to lose a certain amount of margin.
11. The only way to deal with price cut by retailer is by opening its own physical stores.
However, this would increase the fixed overhead costs (wages, rents, utilities).
12. Nike has a fewer distribution of products (retail stores) when being compared to its
competitors.
13. High advertising cost is a part of concern of Nike. The strategies that involves locking
major athletes has been prove successful, yet comes at a very high price tag.
14. Due to the strong brand, Nike can be seen as exploitative and greedy. Nike can
actually stick its logo on a plain white t-shirt and sell much more over the
manufacturing costs.
15. Supply chain is the most important and vulnerable aspect of Nike business model and
it has to ensure that Nike has a solid supply chain of raw materials to delivery
logistics.
16. Price sensitivity is a major concern for Nike, since its product has already comes with
high costs.
17. Consumers somehow perceive Nike as an expensive brand.
18. As a result of expensive brand perception, consumers begin to turn away from Nike.
19. The low market shares of Nike apparels have caused a concern for Nike.
20. Nike has to find an equilibrium point between price and quality if it still wants to be
the number one player within the shoe industry.
Internal Factor Evaluation Matrix (IFE Matrix)
Internal Strengths Weight Rating Weighted Score1. Nike is one of the most widely-known companies in the world. 5.0% 4 0.22. Nike’s swoosh logo is widely recognizable. 2.0% 3 0.063. Nike offers various products ranging from athlete footwear to clothing andaccessories. 1.0% 3 0.034. Nike has been listed as the number one most innovative companies in theworld. 1.0% 3 0.035. Recognized by Fortunes as “100 Best Companies to Work For”. 0.5% 3 0.0156. Nike has established an effective business relationships globally. 1.0% 4 0.047. Nike is able to outsource its product to low-cost factories in Asia, specificallyChina, Vietnam, and Indonesia. 4.0% 4 0.168. Nike uses high quality product and was able to pass on to consumers byraising prices, thereby consumers perceive Nike as premium products. 3.0% 4 0.129. Nike has managed to find ways to innovate product and provide differentprice range for different demographics. 2.5% 4 0.110. Nike has the largest market share in the athletic footwear and apparelindustry. 3.0% 4 0.1211. Nike is the industry leader. 3.0% 4 0.1212. Nike is a very competitive organization. 3.0% 4 0.1213. Nike has a great marketing strategies in sponsoring the top athletes and gainvaluable coverage. 4.0% 4 0.1614. Nike’s product innovation is ahead of the technology curve, therefore attractloyal followers. 5.0% 4 0.215. The strong free cash flow generated by Nike enhances shareholder’s value. 2.0% 3 0.0616. Nike maintains a large Research & Development budget, in order to beahead of the competitor. 4.0% 4 0.1617. Nike has no ownership of physical factories, so production could be movedto a more cost effective location. 3.0% 4 0.1218. Nike's Inventory Turnover ratio is relatively high when being compared to itscompetitor (cross-sectional analysis) and have improved yearly (trend analysis). 1.0% 3 0.0319. Nike has a easily accessible website which enables the online users to shopvia Nike online store. 1.5% 4 0.0620. Nike online users can customize their own Nike products online and thishave led Nike to become aware that it attracts more users who wants to maketheir shoes different from other’s shoes. 2.0% 3 0.06

Internal Weaknesses Weight Rating Weighted Score1. Nike has its reputation for exploiting for inexpensive child labor at the Asianfactories where products are produced. 1.5% 2 0.032. Nike has history for its overtime laws and minimum wage rates in Vietnam. 2.0% 2 0.043. Nike has been accused of poor working conditions in the productionfactories of Nike products. 2.0% 1 0.024. Nike has constant focal point for negative criticism by anti-globalizationgroups. 3.0% 2 0.065. The uncovered child labor law in Pakistan led to criticisms about Nike, andas a result Nike has seen a slight sales decline. 2.0% 2 0.046. Many human right groups formed alliance to pronounce the Nike scandaltestimonial and have ended in the tarnish of Nike reputation. 2.0% 1 0.027. Nike lacks retail stores and its products most of the time has to be orderedonline. 3.0% 1 0.038. Boards of directors have an average age of around 60. 1.0% 2 0.029. Even though Nike has a diversified range of sports products, but its income isheavily depended on footwear market. 4.0% 2 0.0810. The low price competition that arises cause Nike to have lowered their pricein order to compete with the competitors. This caused Nike to lose a certainamount of margin. 4.0% 1 0.0411. The only way to deal with price cut by retailer is by opening its own physicalstores. However, this would increase the fixed overhead costs (wages, rents,utilities). 3.0% 2 0.0612. Nike has a fewer distribution of products (retail stores) when beingcompared to its competitors. 3.0% 1 0.0313. High advertising cost is a part of concern of Nike. The strategies that involveslocking major athletes has been prove successful, yet comes at a very high pricetag. 3.0% 1 0.0314. Due to the strong brand, Nike can be seen as exploitative and greedy. Nikecan actually stick its logo on a plain white t-shirt and sell much more over themanufacturing costs. 1.5% 2 0.0315. Supply chain is the most important and vulnerable aspect of Nike businessmodel and it has to ensure that Nike has a solid supply chain of raw materials todelivery logistics. 1.5% 2 0.0316. Price sensitivity is a major concern for Nike, since its product has alreadycomes with high costs. 2.0% 1 0.0217. Consumers somehow perceive Nike as an expensive brand. 3.0% 2 0.0618. As a result of expensive brand perception, consumers begin to turn awayfrom Nike. 3.0% 1 0.0319. The low market shares of Nike apparels have caused a concern for Nike. 2.0% 1 0.0220. Nike has to find an equilibrium point between price and quality if it still wantsto be the number one player within the shoe industry. 2.0% 1 0.02major weakness (1), minor weakness (2), minor strength (3), majorstrength (4) - - -Total Weighted Score 100% - 2.675

PEST Analysis
Politic
The United States is a federal constitutional republic, in which the President of the
United State (the head of state and head of government), Congress, and judiciary share
powers reserved to the national government, and the federal government shares sovereignty
with the state governments.
Mr. Barack Obama from Democratic party won the president election and became 44th
president of the United State.
The Democratic Party is one of the 2 majors contemporary political parties in United
state, along with the younger Republican Party. Tracing its origins back to the Democratic-
Republican party, was founded around 1828.There have been 15 Democratic presidents, the
first was Andrew Jackson, who served from 1829 to 1837; the most recent is the current
president, Barack Obama, who just officially gave an oath on Jan 20, 2009.
Figure 1.1
Figure 1.2
What are the 6 dimensions of governance measured by the Worldwide Governance
Indicators?
The WGI measure six broad dimensions of governance:
1. Voice and Accountability (VA) – capturing perceptions of the extent to which a
country's citizens are able to participate in selecting their government, as well as freedom of
expression, freedom of association, and a free media.
2. Political Stability and Absence of Violence (PV) – capturing perceptions of the
likelihood that the government will be destabilized or overthrown by unconstitutional or
violent means, including politically- motivated violence and terrorism.
3. Government Effectiveness (GE) – capturing perceptions of the quality of public
services, the quality of the civil service and the degree of its independence from political
pressures, the quality of policy formulation and implementation, and the credibility of the
government's commitment to such policies.
4. Regulatory Quality (RQ) – capturing perceptions of the ability of the government to
formulate and implement sound policies and regulations that permit and promote private
sector development.

5. Rule of Law (RL) – capturing perceptions of the extent to which agents have
confidence in and abide by the rules of society, and in particular the quality of contract
enforcement, property rights, the police, and the courts, as well as the likelihood of crime and
violence.
6. Control of Corruption (CC) – capturing perceptions of the extent to which public
power is exercised for private gain, including both petty and grand forms of corruption, as
well as "capture" of the state by elites and private interests.
Tracing back to the 9/11 Al-Queda terrorist , since 2001, President George W. Bush
calls for the reconstruction of Afghanistan The U.S. Congress appropriates over $38 billion in
humanitarian and reconstruction assistance to Afghanistan from 2001 to 2009. Still in 2009,
with help of NATO, reconstruction has still implemented and more troop will be sent to
Afghanistan. In 2009, the situation is considered to be quite intense and more pressure than in
2008 which makes the figure and indicators indicate the lower number as a reflection of
negative American perspective.
Since the Obama foreign policy intends to end the war in Iraq, finish the fight against
the Taliban and al Qaeda in Afghanistan, secure nuclear weapons and loose nuclear materials
from terrorists, and renew American diplomacy to support strong alliances and to seek a
lasting peace in the Israeli-Palestinian conflict.
After the first year(2009) of President Obama administration, it is hoped that the
American confidence on government effectiveness will be improved after many policies
implemented.
Figure 1.2.1

Political instability index shows that current politic condition in United state is quite
moderate compared to its comparable competitor such as China which the index shows
warning situation. If China politic condition still remain until 2010, rival company based in
China such as Li Ning PCL will probable get effected. In turn, if Nike can create any
opportunities to launch any product and generate revenue to be exceed those of Li Ning, it
will reduce the Li Ning competitive potential in the long run.
Consumption
During the second half of 2009, As a result of president Barack Obama
administration's policy, the consumer spending is increased intentionally to help boost the
economy. Apart from $787 billion stimulus program, to improve financial stability,
government offers perks, benefits, and incentives throughout the year . For example, cash for
clunkers program, the car trade-in arrangement provided monetary incentives—a credit of
$3,500 to $4,500—to car owners who replaced their existing vehicles with cars that had a
better fuel efficiency. The government pledged $3 billion for the program, and that funding
was depleted in just a few months.
In addition, First-time homebuyers were also given a purchase incentive in the form
of an $8,000 tax credit. Homeowners who had been in their homes for at least five years were

also entitled to a tax credit when buying a new house. Also an extension of unemployment
benefits provided to Americans who had been out of work for an extended period of time.
Benefits to the unemployed were extended by 14 weeks across the country, and by an
additional six weeks for those who lived in states with unemployment rates higher than 8.5%.
figure 1.4
figure 1.4 shows an inflation rate (change in consumer price index over time) of
United state.
Apparently, inflation rate begin to bound back in the second half of 2009 which
reflect the government policy and consumer confidence toward the economy.
Investment spending
Investment from local and foreign in United State started to improve after an
economic recovery. With government policy supported, investment spending will show a
positive sign for United State.
Tax credit policy
During 2009 and 2010, existing businesses will receive a $3,000 refundable tax credit
for each additional full-time employee hired.
Small business investment incentive
By eliminating all capital gains taxes on investments made in small and start-up
businesses. Government also want to cut taxes for the small businesses that create jobs but are
struggling with restricted access to credit on top of skyrocketing health care and energy costs.
Create a national network of public-private business incubators
Obama administration will support entrepreneurship and spur job growth by creating a
national network of public-private business incubators. Business incubators facilitate the
critical work of entrepreneurs in creating start-up companies.$250 million will be invested per
year to increase the number and size of incubators in disadvantaged communities throughout
the country.
figure 1.5
figure 1.5 shows the interest rate during 2007-2009, According to federal reserve,
interest rate will be kept at near-zero level around 0-0.25% for several quarter afterward in
order to bottom United State out of inflation and to provide incentive for investment and
consumption spending. As a result of policies implemented, in 2009, the business confidence
and business profit figure start to show positive figure and was more relief through the
second half of the year.
Government Spending
Since year 2009 is considered to be the year of economic recovery, government put
more effort trying to inject money in to the system; through open market operation. Total
government spending in all categories during 2009 accounts for $3.518 trillion which made a
deficit of $1.413 trillion. Tracking some part of spending; around $644 billion spent for social
security while $408 billion spent on medicare system. Another $360 billion are spent on
unemployment and welfare resolution.
According to president Obama administration’s $787 billion economic stimulus
program it can be divided in 3 categories of spending:
- $288 billion in tax cuts.
- $224 billion in extended unemployment benefit, education and health care.
- $275 billion for job creation using federal contracts, grants and loans.

The package was designed to be spent over ten years. However, to give maximum
impact, $720 billion, or 91.5%, was budgeted for the first three fiscal years: $185 billion in
FY 2009, $400 billion in FY 2010 and $135 billion in FY2011.
The result of government spending is quite well for recovering economy. The
unemployment started to decline during the first time when program was launched, however,
unemployment rate was still quite fluctuated and end the year with an increase several points.
Tax cut tend to attract the investor to invest more both in portfolio and direct investment.
Business owner start to have more confidence on long-term borrowing
Net export
Obama administration put more emphasis on fair trade agreement and stimulate
national export. During 2009, the figure 1.6 shows balance of trade deficit all over the year.
The figure shown in 2009 is considered to be better than those of 2008 whose balance of
trade plummeted to almost the trough. However, the current account shows positive sign--
less negative figure—which means that the barrier-to-product-import measurement works.
In order to improve deficit, president Obama implemented various measures for
example, increase tariff levied on tire exported from china up to 35%. an increase in tariff
will be implemented also on automotive product and meat from china. Apart from tariff,
Since many countries gradually becomes a rising-star in export because of its low cost of
production, United state plan to improve any policy to fight against especially, Chinese
imported product. The value of american dollar was keeping increased during the second half
of 2009 due to more resilience economic stance. Foreign investor begin back to continue
investment in United State both portfolio and foreign direct investment.
US Gross Domestic Product
figure 1.3

According to figure 1.3, in February 2009, President Obama signed a $787 billion
stimulus package into law, with the hope that the money would help to create 3.5 million jobs
for out-of-work and underemployed Americans and help pull the U.S. out of recession. Also
the GDP was expected to improve overtime after implement the policy. In the figure above, it
evidenced that the injection policy was work and was able to stimulate economic growth. By
October 2009, the unemployment rate reached 10.2%, the highest level in 26 years, though a
broader measure tracked by the Labor Department, which includes unemployed,
underemployed, and discouraged workers, stood at 17.5%. The outlook improved by
December, when the unemployment rate declined to 10% and the number of jobs lost was
just 11,000, fall considerably from a January high of 741,000.
US Stock market
figure 1.4
Figure 1.4 : S&P 500 index of US shared listed during the he second half of the year.
The US stock market has improved overtime and is expected to last long til year 2010. These
may be the result of Barack Obama administration's economic stimulus policy. Both local
and foreign investor have more confidence toward US economy proofed by tax incentives
policy, small business investment, and government spending.
US Housing market
figure 1.5
Figure 1.5 shows the graph of housing price index on month-on-month basis.
According to figure 1.5, during Q3/2009, the house price index showed positive
signal toward the economic recovery. However, during Q4/2009, the index fell down only
just a little compared by month on month basis or 1.2 percent year on year basis. This 1.2
percent implies the last longing of recovery because there is only a fluctuated amount at the
end of 2009. Then,in 2010, it is hoped that housing price index will start the year with an
improved performance also positive sign of economy will reflect housing price index in the
same way.
Social Unemployment
In 2009, the unemployment rate still has surged until the end of the year. Apparently,
it implies that even if there is $787 stimilus program to stimulate the economic activity but
however, it is still not translated into employment. Most of employee recently are employed
temporarily. The unemployment rate reached a peak of 10 percent at the end of 2009. the rate
is expected to remain high until March 2010.
•Income Gap and poverty
In 2009, the income gap started widen. Under President Obama, government will
spend more on welfare in a single year than President George W. Bush spent on the war in
Iraq during his entire presidency. According to the Congressional Research Service, the cost
of the Iraq war through the end of the Bush Administration was around $622 billion. By
contrast, annual federal and state means-tested welfare spending will reach $888 billion in FY
2010. Federal welfare spending alone will equal $697 billion in that year.
According to American Community Survey reveals that median household income
fell in the US nearly 3 percent between 2008 and 2009, from $51,726 to $50,221. Median
income declined in 34 states; income gap between the rich and the poor grew to its widest
amount on record as young adults and children struggled to stay afloat in the recession.
Recently, there is no measurement announced to curve out the situation. If the gap widen still
exist witnout any solution, economy will not be able to improve.
Health care insurance reformation
In 2009, the record shows that United state spend a huge amount of money, the
largest investment ever in the history, to reform health care system. The health care
reformation intends to avoid any medicare fraud, investing in electronic health records and
new technology in an effort to reduce errors, bring down costs, ensure privacy and save lives.
Also the reformation will try to equalize doctor supply and demand in order to reduce the cost
of medical care. In the past, the old day health care system ; increasing number of uninsured
rising health-care premiums, is considered to be one of reasons small business closed their
doors and corporations moved overseas. However, if healthcare reformation works, United
state can expect to see more corporation operate locally and bring back ssmall business into
the country.
•Minimum wage and labor force
As retaliation of a surge in unemployment rate throughout the year 2009, the
minimum wage was raised from $6.55 to $7.25 per hour. It is still not sure whether labor
market can absorb a hike especially, during the economic recovery phase with still-sluggish
in sales, it would be hard. An increase in minimum wage has always been considered to be

anti-employed policy. Since when wage is increased, employer will probably hire less. In
turn, labor will have more money left in the pocket to spend more. It depends on which one
economy value and weigh more-- employment or consumer spending. For business in 2010,
if particular business has bad cost structure or bad operating cost leverage, they might be
driven out of the market unless organization is reformed.
Technology
In 2009, it is considered to be the year of breakthrough. There was may technology
breakthrough, especially advance system of mobile phone, for instance the development of
android including navigation, application that was evolved to become an important role in
people's life. However, the most breakthrough that we believe can catch the attention is
“Green Energy Development”. Not only many institution emphasize on further development
on environmental-friendly product but also government was trying to support the research
and development as well; government will provide a tax credit on cash for clunker program,
not only to save cost for car buyer but also to ensure that more fuel efficiency car will be on
the road years afterward. According to the research, in 2009, solar panel was developed in
order to reduce electricity consumption, all electric car and plug-in hybrid car were also put
more further development. All of 2009 research went in the same way trying to focus more
on saving world energy and environment which is limited. By this, as a result, year 2010
trend is expected to be about environment issue. In case of Nike, if the company can produce
products which is environmentally-friendly, it is expected that it is likely to grab an attention
of the people more than just only a regular product.

External Factor Evaluation Matrix (EFE Matrix) External Opportunities Weight Rating Weighted Score
1. Year 2009 to 2012 is considered to be a good year for US recovery after along recession phase occurred a couple years ago. Many industries are expectedto grow. Research shows that the demand in active sportswear will increase from$142.13 billion to $153.52 billion. An increased demand is driven by moreconcern on healthiness and demand for trainers. The growth is expected toincrease each year at an increasing rate and touch 3.6 percent high in Olympicyear 2012. 30.0% 3 0.92. Sketchers Shape-Ups $40 million consumer injury lawsuit; Sketchers' productline called “Shape-Ups” and other toning similar line which, according to theadvertisement, will help wearer to get fit and firm and burn more calories withoutstepping into the gym. Shape-Ups, in turn, created a backlash for the company.Many customers claimed on lawsuit on their hip injury and broken ankle causedby the pairs. 3.0% 4 0.12
3. Aging population in United State tends to increase every decades. In 2010,the projected American aging population starting from 65 and above areexpected to be around 12.96 percent of total population which increased by 0.53percent from year 2000 and by 0.4 percent from year 1990. The growing agingpopulation, in turn, will make people more concern about health awareness bothphysically and mentally. Significantly, health care, hospitality, and nursing sectorwill be prosperous since it relates directly on aging population. However, NIKEwhich relates indirectly to an increased number of aging population will also beaffected in a positive way since people will be more concern on any technology,product, and service that can increase their life span. Since sport is the mosteasiest way and also the lowest cost, people may start buying sport instrumentsand going to gym more frequently. In this sense, NIKE and also other sportswearwholesalers can expect, more or less, a positive effect
3.0% 3 0.094. According to Internet World Statistics as on March 2009, the internetpenetration in the US is about 74.7% of the total population and the user growthhas been 138.3 % in the period from 2000 through 2008.The Company canincrease customer base by utilizing the opportunity to market the brand itselfacross the world through web services. As it is cheaper to maintain online shops;comparing to physical stores, company can save on operational costs. Thecompany already retails through its website and further enhancement of itsinternet service will prove to be beneficial. With the increase in the internetpenetration in the US, the company can foster its growth. 5.0% 3 0.15

5. For an upcoming World Cup 2010, it's a great opportunity for Nike to launchadvertisement to increase its brand awareness. Since Nike is vying with Adidasfor supremacy in the soccer category, both view the World Cup as a majorbattle. Herbert Hainer, Adidas' CEO, gave an interview that the brand hadinvested a lot in maintaining its World Cup dominance: "We have protected ourground fairly well. Football is, of course, the heart and soul of our company."Nike is equally confident and, as a point of differentiation, is outfitting sponsoredteams in gear made from recycled polyester to score some points with consumerswho are concerned about sustainability. 10.0% 4 0.4
6. Obesity and overweighted seems to be hot-issue for United state. The numberof people overweight is expected to be no less than 20%. Thirty-six states areexpected to have a prevalence equal to or greater than 25%; 12 of these states(Alabama, Arkansas, Kentucky, Louisiana, Michigan, Mississippi, Missouri,Oklahoma, South Carolina, Tennessee, Texas, and West Virginia) may reach aprevalence equal to or greater than 30%. In turn, if overweight statistic tends toincrease, sooner or later, government and entities relevant such as US center fordisease control may launch new policy to reduce slow down an upturnoverweight rate. By doing so, NIKE seems to gain benefit as by-product.
5.0% 3 0.157. The vaunted BRIC emerging markets are now down to BIC—and whiledeveloped nations remain hobbled by the financial crisis. Brazil, India and Chinaare emerging stronger than ever, both economically and politically. Many apparelretailers begin to open the store in BIC. Likewise, this will create an opportunityfor Nike to expand more concept store or even production facilities to maintainits cost. 5.0% 3 0.15
8. The Web is evolving into a constantly updating stream of real-time information,conversation, memes and images. This is creating an increasingly mass culture andshifting perceptions of “current,” moving modern life into the “now.” Businessesand brands will gain a real-time data of what consumers are thinking about andinterested in. The challenge, which in turn may be an opportunity, is to respond inreal time and keep up with the hyperactive cycle, taking advantage of short- termopportunities and swatting away potential problems. Since Nike is considered tobe first-runner of industry in new innovation. In this sense, the company canexpect the potential growth following customer trends
3.0% 3 0.09

THREATS
External Threats Weight Rating Weighted Score1. Adidas plan to add more 2,500 stores all over small cities or china. It expectsto gain a market share on second-tier cities and below. 4.0% 2 0.082. In 2010, Adidas plans to launch “NEO”, a casual teen line with will be sold ata half of its current price. 3.0% 2 0.063. In order to penetrate and attract Chinese market, Adidas will organize theAdidas Double-Double Tour in Shanghai, featuring 2009 NBA Defensive Playerof the Year, Dwight Howard, and 2009 NBA Rookie of the year, Derrick Rose.The players set out to recruit 50 young players who will help them open theAdidas Brotherhood Center at the popular Xu Jia Hui Street court. The initiativewill be backed by a major digital campaign, with the players communicating withfans via SMS messaging, photo and video blogging. This content was distributedvia Adidas' Chinese site, as well as video site Youku, portal Sohu and socialnetwork Xiaonei. 2.0% 2 0.044. PUMA opens its new cutting-edge Development Center in Vietnam –representing a milestone in the Sport lifestyle and sporting goods industry. Thewhole complex is the new home for footwear and apparel prototype and samplesuppliers. 3.0% 1 0.035. PUMA launches the v1.10 product line inspired by African football. It issupported by the “Love = Football” campaign set in Africa and features Africanfootball stars such as as Samuel Eto'o, Emmanuel Eboue, John Mensah andChinedou Obasi. 3.0% 1 0.03
6. Columbia Sportswear Company has selected the Demandware e-commerceplatform to build its new consumer online channel. The e-commerce is expectedto serve consumers in the US, with other sites to follow for Europe and Canada. The site will be designed to showcase the brand's extensive range of products,including outwear, sportswear, rugged footwear and accessories.
3.0% 1 0.037. Columbia Sportswear has launched a new interactive social media campaignencouraging customers to select used shipping containers for their online orders.The campaign is called "A Box Life" and starts by engaging customers to select areused box for their shipping items. 3.0% 1 0.038.Sketchers USA has signed a worldwide licensing agreement with VivaInternational group for the launch of Skechers-branded sunglasses andprescription eyewear in Spring 2010. Sketcher expects it can gain more marketshare by fulfilling head-to-toes market's need. The eyewear for men, women andkids is expected to represent the style and attitude of Skechers and feature thebrand name and trademark “S” logo. 3.0% 1 0.039. Columbia sportswear breakthroughs a winter boot line called “Bugathermo”for men and the “Snow Hottie” for women. The heated boots contain ainnovative, rechargeable heating system that keeps feet warm for up to eighthours. Three temperature settings adjust to the coldest conditions, and withwaterproof, breathable Omni-Tech, the feet stays dry and comfy warm. The“Bugathermo” and “Snow Hottie” are currently sold online. However, they willbe officially launched worldwide in January, 2010 2.0% 1 0.02

10. Li Ning, a Chinese sportswear brand, reported an impressive growth in2009. It plans to put more investment on marketing, concept store expansion andalso production facilities. Li Ning plans to officially open its concept store locatedin Portland, Oregon in early 2010 to gain more stake in US market. 4.0% 2 0.0811. Increasing labor cost may have an adverse effect on the retailers, such as thecompany. In the US, the government increased the minimum wage rate in 2009.Furthermore, many states and municipalities in the country have minimum wagerate even higher than $7.25 per hour due to higher cost of living. Such increasesin the minimum wages increase the operating costs of retailers and have anadverse effect on their profits. It reasonable pay. With Nike’s employee base ofmore than 95,000 people, the company is under pressure due to the paymenthikes. 3.0% 2 0.0612. Counterfeiters are benefitting from Nike's brand name, pretending as officialsellers on the internet and playing on customer’s confidence in the company. Thegrowing market for counterfeit merchandises has been on upsurge acrossindustries and is affecting the sales as well as the image of the company’s brands.The fake merchandises in the industry are eating into the market share of thebranded products through their low price offerings. 3.0% 1 0.03major threat (1), minor threat (2), minor opportunity (3), majoropportunity (4) - - -Total Weighted Score 100% - 2.57

GE Model
From the market attractiveness and Nike’s strength from IFE and EFE matrix, we use
these scores to plot on the GE Model and we found that the position of Nike fall in Growth
Horizontal Integration or Stability. From our analysis, Nike is not in the Stability position,
but in Growth Horizontal Integration position, which is consistent with the current strategies
of Nike as you can see that Nike tries to expand its business by both internal and external
expansion. For example, Nike has acquired several apparel and footwear companies over the
course of its history. During the past ten years, in 2002, Nike bought surf apparel
company Hurley International from founder Bob Hurley. In 2003, Nike paid US$309 million
to acquire Converse, makers of the Chuck Taylor All-Stars line of sneakers. The company
acquired Starter in 2004 and Umbro, known as the manufacturers of the England national
football team's kit, in 2008.
Therefore, from this model, we can conclude that Nike has the ability to grow more in
the market since it has not yet reached the maturity state. In order to match with the GE
model, we recommend that during this time, Nike should expand its business by internal
expansion only since the economic situation is not stable. Nike should increase its retail
stores in abroad. As a result, we expected that increasing the retail store in abroad will effect
growing in turnover and consumer base.
Moreover, we also suggest to expand internal business of Nike by developing its main
product line or to find new products to meet the market as demand for health product
increased substantially, especially the product for aging population.

Competitive Profile Matrix

Analysis
From the competitive profile matrix analysis of apparel footwear and accessories
industry companies above, we can see that Nike has the highest total weighted score. The
CPM is the matrix that uses to compare the company and its competitors in the same
industry. The analysis reveals company’s strengths and weaknesses against its competitors.
Nike Inc. has the highest market share, 46.4 percent, compared with its main
competitors and this can show that the company’s brand is well known by most people. These
two factors are the most important factors that we give highest weight and the company get
0.8 score from these two factors. Nike expands its business globally. It sells the products in
over 170 countries around the world for example America, EMEA, Asia, and others so we
give 0.21 for the global expansion factor. Moreover, the company focuses on product
research and development as it believes that the R&D efforts are a key factor in its past
success. The staff of Nike are specialists in the many fields such as biomechanics, chemistry,
exercise physiology, engineering and industrial design. They produce the products that help
to reduce injury, enhance athletic performance and maximize comfort so we do not question
about its quality which score 0.36. However, the price of Nike is not that competitive if we
compare to other competitors so we give 0.27, which is lower than other competitors. For
marketing, Nike spends for advertising 12.26 percent of its revenues while Puma spends
20.08 percent of its revenues for advertisement. Looking at financial position, even though
Nike has many expenses that make its net profit become lower than Li Ning, its profitability
performance is still better than many competitors. The financial ratios of Nike in all parts are
not bad at all compare to other competitors. Summing up the CPM matrix score, Nike gets
total weighted score equal to 3.52. Nike is competitive in terms of market share, product
quality and product research and development. However, Nike should consider its pricing
strategy for better progress.
Puma SE does not grab a lot of market share. However, it has a desirable brand image
as one part maybe because it has done corporate social responsibility projects. The score of
these two factors combines is 0.7. Puma operates its business in geographical areas including
Asia Pacific, EMEA and America. In 2009,Puma spends only 0.02 percent of its sales in
product research and development. However, it spends large amounts to open the new
development center in Vietnam and it continues to guarantee the high quality standards of its
products coming out from the new development center. For advertisement, Puma spends

20.08 percent of its sales, which consider as high percentage so the score is 0.24 which is
higher than competitors. Additionally, the price of Puma is competitive comparing to other
competitors. Looking at financial position, Puma classifies as a good financial position
company. The key financial ratios look good except for its operating profit margin and the
asset turnover. Therefore, the company should keep an eye on its operating expenses and the
efficiency in using its assets to generate sales in order to increase the company’s
performance. The total weighted score of Puma is 3.17 ranking number three follow Adidas.
Adidas Group has the second highest market share, 35.3 percent, among the
competitors and its brand is very well known. The score combined the two factors is 0.8.
Adidas operates its business in many geographic areas such as Europe, North America, Asia
Pacific and Latin America. For product research and development, the company said that
everyone in the Adidas Group is responsible for driving innovation so product innovation is a
prerequisite which it has to come up with new product every year and the quality of its
product is high as well. The score given on product research and development, and product
quality are0.24 and 0.36 respectively, which is same as Nike. The good score on product
research and development can lead to high customer loyalty as well because the company can
come up with the new product responding to the customers’ need. Moreover, the price of
Adidas is quite competitive compare to other competitors. The price range of Adidas is
closely the same as Puma’s product prices. For the company’s financial position, Adidas gets
score only 0.14 which is lowest comparing to other competitors. The reason is because the
company cannot well control its operating expenses, also the debt ratio is very high and the
asset management ratio is not good as well. However, the company gets a good score on
corporate social responsibility as it has done many CSR projects in many fields. Summing up
the CPM matrix score, Adidas gets 3.30, which is the second highest score. The company
should reconsider its financial position for better progress.
Columbia Sportswear has low market share which is 3.24 percent and the brand
recognition is not desirable. The score on market share and brand recognition are 0.2 and 0.2
respectively. However, Columbia Sportswear operates its business in many geographical
areas such as United States, EMEA, Latin America and Asia Pacific so the score for global
expansion is 0.21, which considers as good. Looking at the relationship with manufacturers
and suppliers, the company maintains 13 manufacturing offices, which the personnel in these
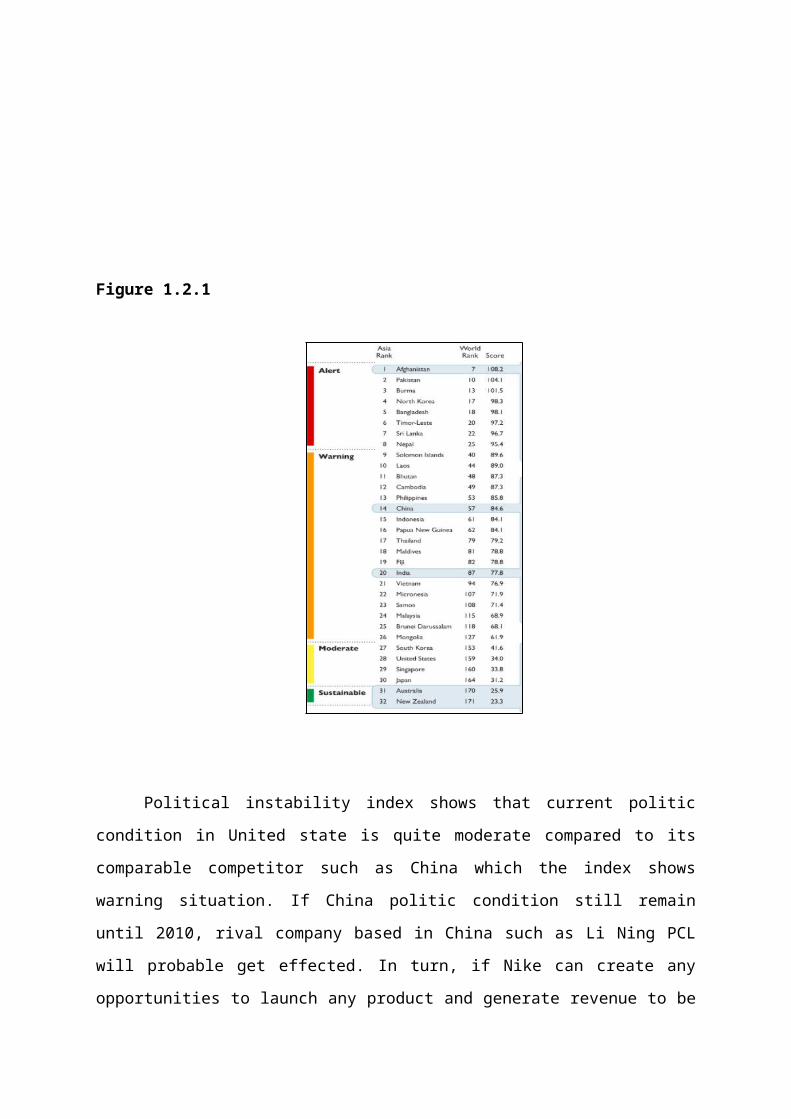
manufacturing offices are direct employees of each region. The company believes that having
employees physically located in each region will enhance the ability to monitor factories for
compliance with its policies, and standard labor practices so we give a good score on this
factor. However, the score on advertising is low as the company spends only 0.88 percent and
this may be the reason that is why its market share is low. For the asset management,
company’s inventory ratio is lower than competitors and the lower inventory turnover ratio
implies that the customer loyalty is low so the score on inventory turnover and customer
loyalty is low. Summing up the CPM level, the company gets 2.79 ranking number five out
of six as many competitors have greater financial, marketing and have achieved greater brand
strength than the company have.
Li Ninghas low market share compare to competitors as its business operates only in
China so the score on market share and global expansion is quite low. However, the quality
of its products is desirable. The company has R&D lab to make the in-depth product research
and set up its libraries of apparel material so the score on product research and development
is 0.24, which is in a good range. Additionally, the price of company’s products is very
competitive as the cost of production is quite low. For advertising, the company spends 15.40
percent of its revenue, which consider as high and the score on advertising is 0.18. Looking at
financial position, the company has strong financial position. The inventory turnover ratio is
quite high compare to competitors, which implies that it has high customer loyalty as well.
Moreover, the profitability ratios are impressive. Lastly, the company gets a good score on
corporate social responsibility as it has done a lot on CSR projects in many aspects for
example the safety environmental protection, and labor aspect. Summing up the score, the
company gets 3.06 ranking the fourth place.
Skechersgains 3.51 percent of market share. The company, however, operates its
business in many geographical areas such as Asia Pacific, EMEA, Australia and South
America. Also, the company aggressively promotes its brand through television, outdoor
campaigns and animated kid’s television campaigns as it believe that brand recognition is an
important element for success. The scores on global expansion and brand recognition are
desirable even though the score on market shareis quite low.For advertising, the company
spends 6.84 percent of its revenue for advertising which rates as moderate and the score on
advertising is 0.12. Moreover, the price of the product is competitive in the market. Looking
at financial ratio, all key financial ratio is okay except for the operating profit margin.
Therefore, the company should be very serious on controlling operating expenses. Moreover,
from our research we do not see that the company has done any corporate social
responsibility projects so we give 0 score on this factors. Summing up the CPM level, the
company gets 2.61 ranking number six.
SWOT Matrix
SWOT Matrix

TOWS Matrix

SPACE Analysis
SPACE analysis table
1) Financial Strength : Rating is 1 (worst) to 6 (best)
Rating Remarks
Net profit margin 2Net profit margin is lower than the previous year even though sales increase yearly.
Liquidity ratio 5Liquidity position is quite good. It does not have to concern about the ability to cover short term debts
Return on asset 5In general, Nike has higher ROA than most of its competitors.
Return on equity 4There is a big gap between Nike and its dominant competitor.
Inventory turnover 6Nike has high inventory turnover than most competitors.
Average Score 4.4
2) Competitive Advantage : Rating is -1 (best) to -6 (worst)
Rating Remarks
Market Share -1Nike's market share is a bit lower than leading competitor.
Product quality -1 Nike is considered as premium brand.
Customer loyalty -2Customer loyalty is high. Most of existing customers are not willing to switch to other brands.
Control over suppliers -2Nike has bargaining power over suppliers because of its sheer size.
Brand image -1 Nike's logo is recognized by people.
Technology know-how -2Nike's products have special features that other competitors cannot imitate easily.
Average Score -1.5
3) Industry Strength : Rating is 1 (worst) to 6 (best)

Rating Remarks
Growth potential 4Though Nike is well established, there still a room to grow.
Resource utilization 4Nike has a lot of supplier to choose from so it can pick the one with highest cost effective.
Market entry ability 3 Moderate ability for Nike to enter the market.
Economies of scale 6Nike is a large firm so it can benefits from the lower cost per unit.
Average Score 4.25
4) Environmental Stability : Rating is -1 (best) to -6 (worst)
Rating Remarks
Competitive pressure -3Globalization makes international firms compete for market share as well.
Price elasticity of demand -4 Customer loyalty is high.
Risk involved in business -2Financial and business risks are relatively low because of outsourcing and strong financial structure.
Economic stability -2Nike imports its product to many parts of the world.
Barrier to entry -1It requires large capital investment to open the factories.
Average Score -2.4
Calculation for X-axis and Y-axis
X-axis = -1.5 + 4.25 = 2.75
Y-axis = -2.4 + 4.40 = 2

Analysis
From the SPACE analysis Calculation, starting from internal analysis, the financial
strength of Nike’s score is 4.4 which is considered quite high. Nike can use its assets
efficiently in generating sales and it has impressive liquidity position, as well as higher
inventory turnover than most competitors. For the competitive advantage score, the score is
quite high. Nike has many internal strengths such as high product quality, high customer
loyalty, good technological know-how and high bargaining power over suppliers. For
external analysis, industry strength score is 4.25. It has high growth potential to grow and can
benefit from economy of scale. Environmental stability score is good because there is low
risk involved in the business and high barriers for new comers to enter the market.
Nike should follow an aggressive strategy because it already has a strong competitive
position and a rapid growth. Nike should focus on internal strengths to take advantage of
external opportunities, fix internal weaknesses, and avoid external threats. Therefore, market
penetration; market development and product development would be appropriated to
implement these strategies.
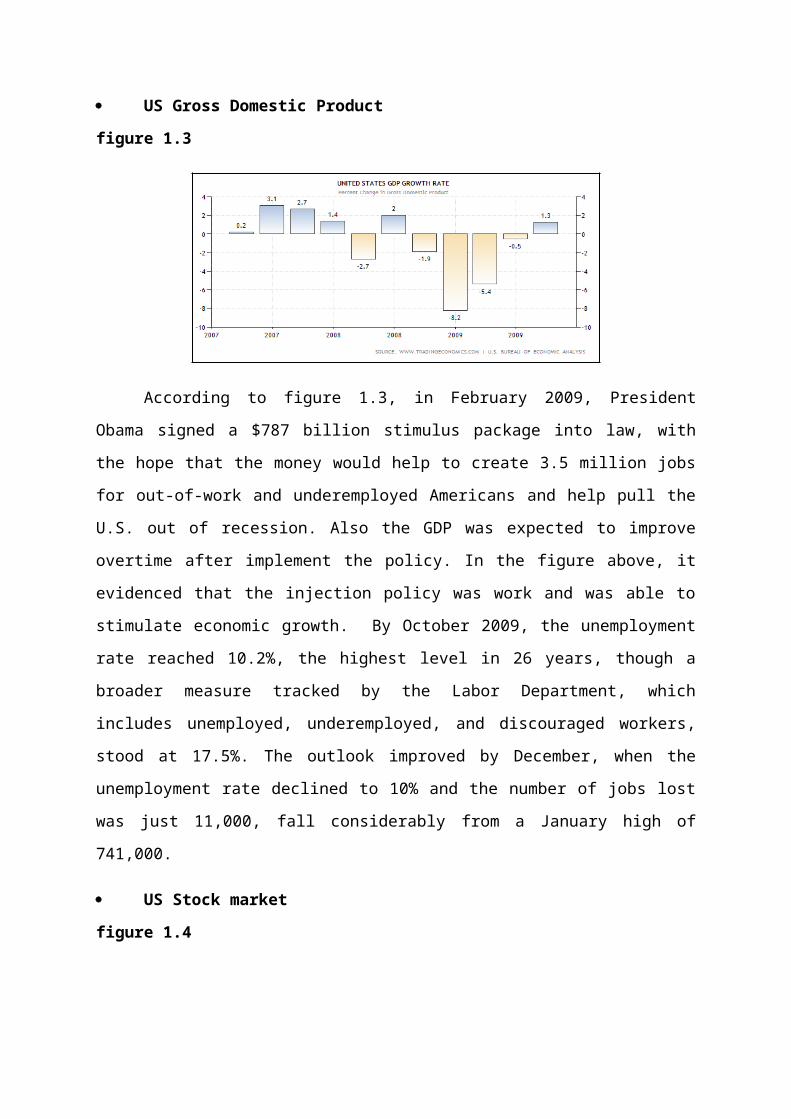
Grand Strategy Matrix
Grand Strategy Matrix has become an effective tool in devising alternative strategies. The
matrix is based on four important elements that can be described as two evaluative
dimensions of market growth and competitive position. These four elements form four
quadrants matrix wherein every organization can be placed in a way the identification and
selection of appropriate strategy becomes an easy task.
According to the diagram of Nikeabove, we can say that Nike belongs to the quadrant
IV. This means that Nike has strong competitive position and market growth is quite low.
The position in quadrant IV implies that recently, Nike has good strategic position already
but market growth is slow. Therefore, it should find the way to increase their sales during
slow market growth.
From both SPACE Analysis and Grand Strategy Matrix, it indicates that the company
falls into competitive area. In order to maintain its position in that area, the company should
concentrate on market penetration, market development, product development, SWOT, and
promotions. For market development, the company used its existing products to reach new
target market group such as focusing on new geographical areas and also target group of
people with new age range. Moreover, the company also took product development strategy
by launching new product that was developed from its existing products. Lastly, the company
offered special promotion during slow market growth period.
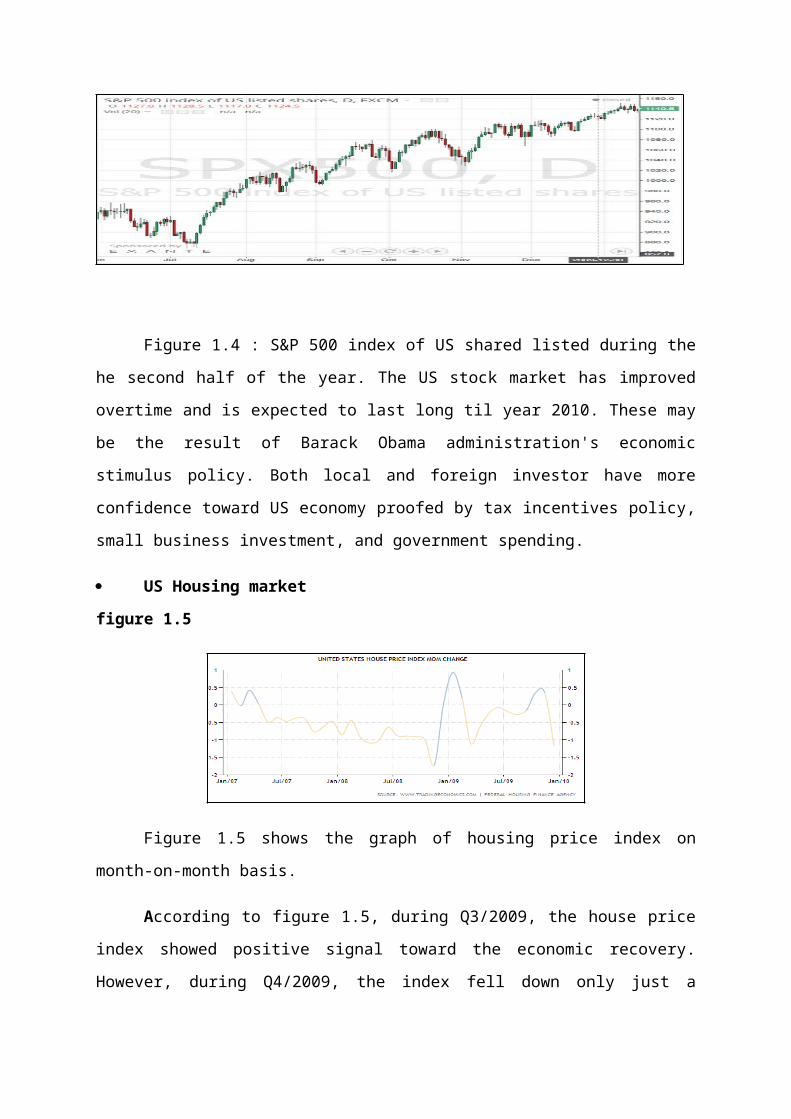
The BCG Matrix
Corp. NameSales ($) in
million (2008)Sales ($) in
million (2009)% Market
Shares (2009)
Nike 18,627.00 19,176.10 46.80%
Puma SE 3,710.57 3,427.99 8.37%
Adidas Group 15,874.52 14,461.73 35.30%
Columbia sportswear 1,317.84 1,244.02 3.04%
Li Ning 962.71 1,227.55 3.00%
Skechers 1,440.74 1,436.44 3.51%
Total 41,933.38 40,973.83 100.00%
Relative market s h are= Salesthis year
Leadingriva l' s sales t h is year
Relative market s h are=19,176.1019,176.10
=1 X
Market growt h rate= Industry sales this year−Industry sales last yearIndustry sales last year
Market growt h rate=40,973.83−41,933.3841,933.38
= -2.29%
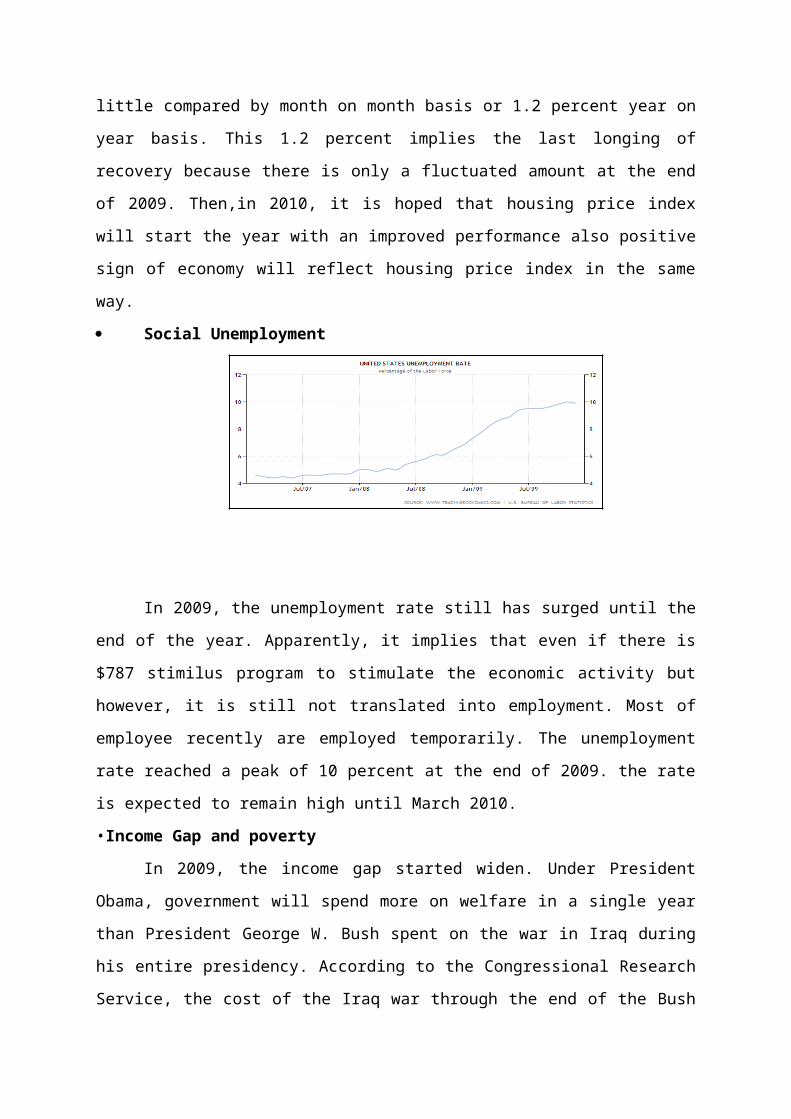
Analysis
Based on the Boston Consulting Group Matrix, shortly BCG matrix, Nike Inc. is
classified in Cash Cow division. According to the research of the NDP Group, Inc., a leading
market research company, it shown that the worldwide sports market has decline since 2005
and the year 2009, the global sportswear market was down supported by the global sales of
sports equipment, apparel and footwear is valued at 282 billion USD which is a 2 percent
decline from 2008. The percentage of market growth rate we calculated above is related to
the research we studied. While the market growth rate is slow-growing industry, Nike has a
strong relative market share, as the company itself is the leading company in the apparel
footwear and accessories. The following session we analyze BCG matrix in each product
line. However, we are going to use only five company including Nike. We do not do anything
with Skechers as the data are not available for us.

Product Line BCG Matrix
Sales ($) in million Nike Puma SE AdidasColumbia
Sportswear Li Ning
2008 2009 2008 2009 2008 2009 2008 2009 2008 2009
Footwear 9,731.60 10,306.70 2,108.42 1,849.75 7,230.93 6,466.75 217.20 214.60 426.19 520.52
Apparel 5,234.00 5,244.70 1,321.97 1,188.17 7,019.25 6,496.01 1032.60 955.00 457.54 575.22
Accessories & Equipment 1,130.40 1,110.40 280.1818 390.0669 1,624.35 1,498.97 68.00 74.40 78.99 131.80
Others 2,531.00 2,514.30
Total 18,627.00 19,176.1 3,710.57 3,427.99 15,874.52 14,461.73 1,317.80 1,244.00 962.71 1,227.55
Sales ($) in millionFootwear Apparel Accessories & Equipment
2008 2009 Mkt. Share 2008 2009 Mkt. Share 2008 2009 Mkt. Share
Nike 9,731.60 10,306.70 53.24% 5,234.00 5,244.70 36.27% 1,130.40 1,110.40 34.64%
Puma SE 2,108.42 1,849.75 9.56% 1,321.97 1,188.17 8.22% 280.1818 390.0669 12.17%
Adidas 7,230.93 6,466.75 33.41% 7,019.25 6,496.01 44.93% 1,624.35 1,498.97 46.76%
Columbia Sportswear 217.20 214.60 1.11% 1032.60 955.00 6.60% 68.00 74.40 2.32%
Li Ning 426.19 520.52 2.69% 457.54 575.22 3.98% 78.99 131.80 4.11%
Total 19,714.33 19,358.33 100.00% 15,065.35 14,459.10 100.00% 3,181.92 3,205.64 100.00%
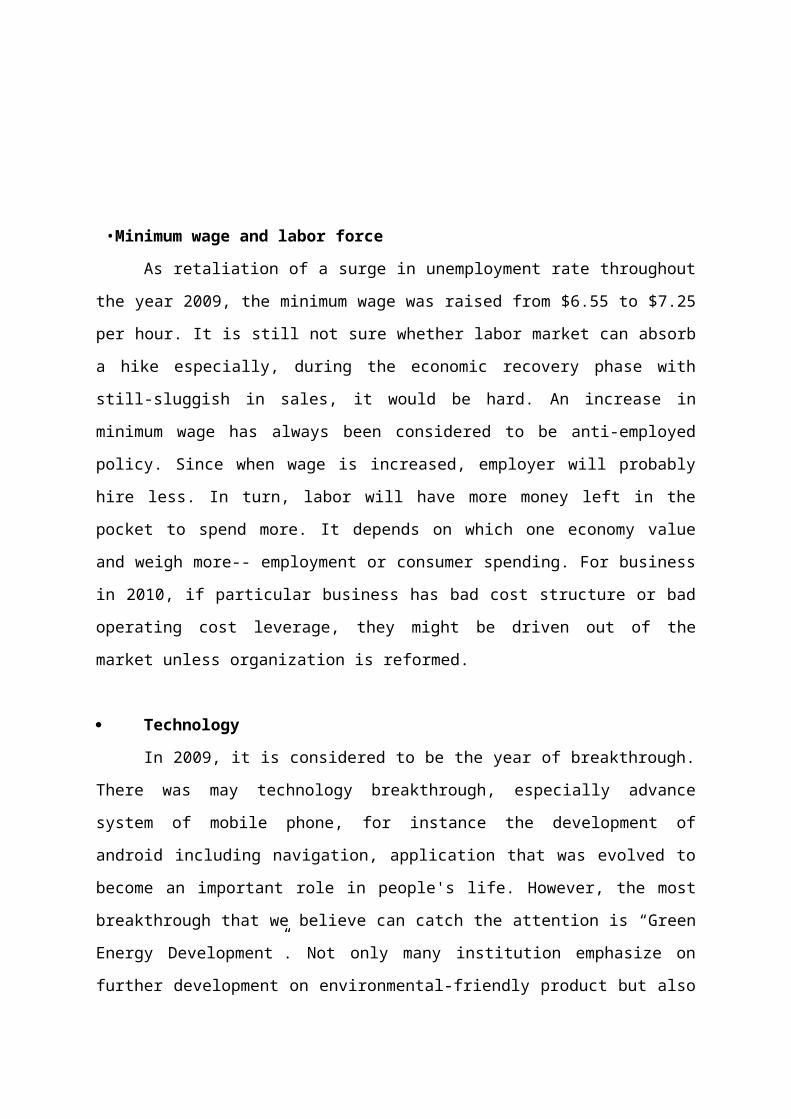
Product Line:
Footwear
Relative market share=10,306.710,306.7
=1 X
Market growthrate=19,358.33−19,714.3319,714.33
= -1.81%
Apparel
Relative market share= 5,244.76,496.01
=0.81 X
Market growthrate=14,459.1−15,065.3515,065.35
= -4.02%
Accessories & Equipment
Relative market share= 1,110.41,498.97
=0.74 X
Market growthrate=40,973.83−41,933.3841,933.38
= 0.75%
Analysis in Product Line
Footwear and Apparelfall in the cash cow division. Both product lines have lower
market growth ratesupported by the decline of 1.81 percent sales of footwear and 4.02
percent sales of apparel in the industry. However, Nike has high relative market share in both
product lines, especially in the footwear sector. Nike grabs the highest market share in
footwear while it has the second highest market share in apparel line. Most people would say
that cash cow is not worth invested, as it will become dog very soon. However, cash cowhas
competitively advantaged lower growth businesses with a large cash generation
capability.Therefore, the company should direct its resources toward maximizing its sales and
marketing resources dedicated to raising awareness about them tend to be money well spent.
Accessories & Equipment falls in the star division. This product line has positive
market growth and the relative market share is quite high but still lower than Adidas. As the
product has high market share,Nike has a strong opportunity to increase its sales by
implementing aggressive strategy. Furthermore, the company is well established. It does not
need to spend a lot on reintroducing brand to the market again only do the promotions on
products and more distribution so as to maximize its revenues.
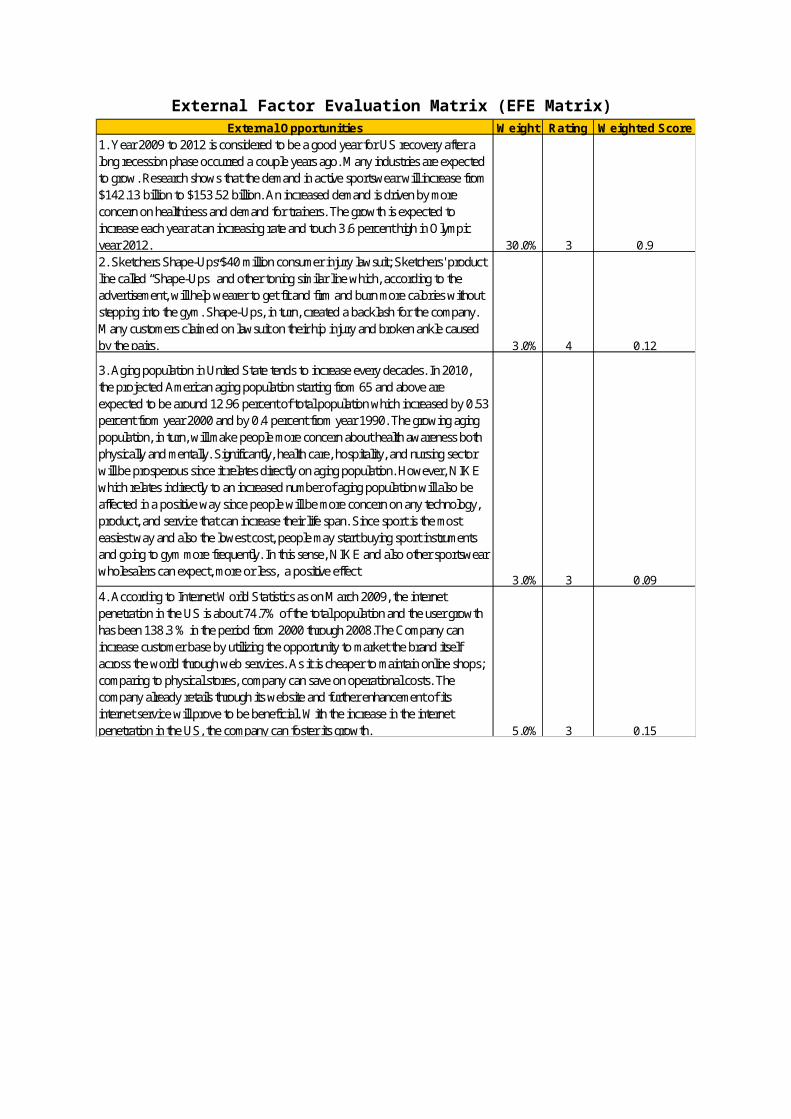
The Internal-External Analysis
Analysis
According to the diagram above, it can be seen that Nike got IFE scores at 2.675 and
EFE scores at 2.81. This means that Nike has quite moderate internal strength to handle with
circumstance in the market and it also has moderate ability to respond with the external
factors. In the beginning of 2009, US has got Hamburger crisis, subprime lending had
become too aggressive, many subprime mortgages were going to go into default. This impact
creates negative impacts not only to the banking industry but also to the textile-apparel &
accessories industry where Nike fell in.However, since Nike is the company has the customer
based in many countries around the world and its brand and its products are well recognized
and have good reputation, its sales revenue still increases but not that much. Furthermore, IE
Matrix indicates that domestic division is in cell 5 which means that the situation is quite
moderate. What the company should do is to grow and build. Market penetration and product
development could be their options.
Company YearSales
(in millions)
Profits
(in millions)
Profit
(%)
IFE
Scores
EFE
Scores
Nike 2009 $19,176.1 $8,604.3944.87
%2.675 2.57


Rank Recommended Strategy Rating Score
1 Increasing the number of retail store in abroad 5.61In order to respond consumer needs directly,Nike plans to increase the retail store in other countries, instead of ordering via online where consumers have to pay more fees.Also, this strategy will make consumers convenient in order not to wait the products for a long time.Moreover,Nike can directly access to potential customers or customers that we can create brand loyalty from them.We also expected that in increasing the retail store in abroad will effect growing in turnover and consumer base.It is because people know more about Nike.
2 Focusing on R&D by creating new fashion trend and the customer's preference
5.5
Because most of Nike product line falls into cash cow category, it is best that the company use part of the streaming cash flow to maintain the high level of support for R&D. Since R&D can result in constantly soars ahead of its competition. It gives useful knowledge that the company can use to further develop its main product line or to find new products to meet the market as demand for health product increased substantially.
3 Nike's Application on smart phone and gadgets 4.96Number of people using smartphone has been growing fast each year, thus Nike should provide application for smartphone users. By providing app and gadget through android,IOS, Symbian and window application to make it easier for them to reach the brand and get up to date information of Nike with convenience instead of having to enterthrough the website to see new collection and other events.Also the faster customer gets the information, thefaster turnover as well.
4 Doing marketing plan to increase sales in footwear and apparel 4.85Main product of Nike, footwear and apparel, falls into cash cow category in BCG matrix. This means that the product are regarded a mature market, high market share with low or stable growth. The cash cow product is very important in a way that it provides huge cash flow to generate income to the company so it’s essential to budget for its continued success. And with constantly put care into this product line, Nike might have push it to become star again and enjoy high market share in a fast-growing industry.
5 Focusing on footwear sales for kid and elder to reach new target 4.64Nike is known for its famous footwear product line but mostly the target is on teenagers and now it has already gained certain amount of that market share. So Nike should consider experimenting and researching on new target group which are kids and elders. The trend has also shown the fast growing number on this segment. With all data gather then, Nikecould produce the product with features that meet with their customers’ need, such as color, style, function, and etc.
6 After sales service division 4.48To provide more alternatives for the customers who bought the products or have problems with the product to be able to fixthem. Although this might not cause an immediate shift in sales growth but it would create customer loyalty which is more important nowadays as it is a long term relationship with the brand. Customer would be more satisfy if we provide them with after sale service as well and they might come back to Nike repeatedly.
7 Discounting price for the new shoes by redeeming the old one 3.02We create the promotion “Getting discount from the old shoes” which is about swap the old shoes to get discount 50% of the new one.Due to consumer behavior is quite low in this sector which causes of low in net profit margin when compared to the last year.For this reason,we create this promotion in order to convince current and new consumers to purchase the products and stimulate circulation .we expected that sales will increase by 5% of the shoes.
8 Doing more CSR project to help reduce advertising cost and improve brand image
1.64
Brand image of Nike isn’t necessary the best, so contributing more for social responsibility would improve company’s brand image. And at the same time, would be a kind of promoting the company itself with less cost because then, Nike wouldn’t have to spend a lot more for hiring top athletes to promote the products. This would help Nike reduce one of its cost concern.

Recommendation

Projected Income Statement
Five Year GPM, OPM, and NOPM History
YearSales
RevenueGross Profit GPM
Operating Expenses
Percentage of Operating Expenses
Net Operating
Profit NOPM2009 19176.1 8604.39 44.87% 6745.9 35.18% 1858.8 9.69%2008 18627 8387.4 45.03% 5953.7 31.96% 2433.7 13.07%2007 16325.9 7160.5 43.86% 5028.7 30.80% 2131.8 13.06%2006 14954.9 6587 44.05% 4477.8 29.94% 2109.2 14.10%2005 13739.7 6115.4 44.51% 4221.7 30.73% 1893.7 13.78%5-year Average 44.46% 31.72% 12.74%
With current strategies of Nike, we find five-year average gross profit margin,
operating profit margin, and net operating profit margin which equal to 44.46%, 31.72%, and
12.74%, respectively. We use these numbers in order to project Income Statement in the next
ten years.
As we shown in part of Value of the Firm Analysis, the excess return period of Nike
is estimated to be seven years, with only one year transition period. The growth rate in excess
return period of Nike is found from the average of historical growth, sustainable growth,
multiple regression growth and also adjusted with qualitative adjustment, which equal to
11.42%, while the growth of transition period is 7.32% which come from the average
between growth during excess return period and long term inflation rate. So, the expected
revenues will be as follows:
Year Revenues % change in
revenue2009 19,176,100,000.002010 21,366,010,620.00 11.42%2011 23,806,009,032.80 11.42%2012 26,524,655,264.35 11.42%2013 29,553,770,895.54 11.42%2014 32,928,811,531.81 11.42%2015 36,689,281,808.74 11.42%2016 40,879,197,791.30 11.42%2017 43,871,555,069.62 7.32%2018 45,284,219,142.87 3.22%2019 46,742,370,999.27 3.22%

After we get the expect sale revenue of the firm, next we projected the income
statement of firm. First we projected the firm income statement in case if the firm maintains
its strategy. We use 5-year average gross profit margin and 5-year average operating expense
margin together with the sale revenue that we already had projected. We will get the gross
profit, operating expense then we can later calculate the EBIT and so on to get Net Income
and EPS. Therefore, expected income statements in the next ten years are as follows:
Year revenue GPM Gross Profit
Operating Expenses %
Operating Expenses
Operating Profit
2010 21,366,010,620.00 44.46% 9,499,328,321.65 31.42% 6,713,200,536.802,786,127,784.8
5
2011 23,806,009,032.80 44.46% 10,584,151,615.98 31.42% 7,479,848,038.113,104,303,577.8
8
2012 26,524,655,264.35 44.46% 11,792,861,730.53 31.42% 8,334,046,684.063,458,815,046.4
7
2013 29,553,770,895.54 44.46% 13,139,606,540.16 31.42% 9,285,794,815.383,853,811,724.7
8
2014 32,928,811,531.81 44.46% 14,640,149,607.04 31.42% 10,346,232,583.294,293,917,023.7
5
2015 36,689,281,808.74 44.46% 16,312,054,692.17 31.42% 11,527,772,344.314,784,282,347.8
6
2016 40,879,197,791.30 44.46% 18,174,891,338.01 31.42% 12,844,243,946.035,330,647,391.9
9
2017 43,871,555,069.62 44.46% 19,505,293,383.95 31.42% 13,784,442,602.885,720,850,781.0
8
2018 45,284,219,142.87 44.46% 20,133,363,830.92 31.42% 14,228,301,654.695,905,062,176.2
3
2019 46,742,370,999.27 44.46% 20,781,658,146.27 31.42% 14,686,452,967.976,095,205,178.3
0
YearInterest
Expenses EBT Tax Net IncomeNumber of
Shares EPS
2010 22,400,000.00 2,763,727,784.85 690,931,946.21 2,072,795,838.64 968700000 2.14
2011 22,400,000.00 3,081,903,577.88 770,475,894.47 2,311,427,683.41 968700000 2.39
2012 22,400,000.00 3,436,415,046.47 859,103,761.62 2,577,311,284.85 968700000 2.66
2013 22,400,000.00 3,831,411,724.78 957,852,931.19 2,873,558,793.58 968700000 2.97
2014 22,400,000.00 4,271,517,023.75 1,067,879,255.94 3,203,637,767.81 968700000 3.31
2015 22,400,000.00 4,761,882,347.86 1,190,470,586.97 3,571,411,760.89 968700000 3.69
2016 22,400,000.00 5,308,247,391.99 1,327,061,848.00 3,981,185,543.99 968700000 4.11
2017 22,400,000.00 5,698,450,781.08 1,424,612,695.27 4,273,838,085.81 968700000 4.412018 22,400,000.00 5,882,662,176.23 1,470,665,544.06 4,411,996,632.17 968700000 4.552019 22,400,000.00 6,072,805,178.30 1,518,201,294.58 4,554,603,883.73 968700000 4.70

Year 2010 2011 2012 2013 2014
Revenue21366010620.
00 23806009032.80 26524655264.35 29553770895.5432928811531.8
1Cost of Goods Sold
11866682298.35 13221857416.82 14731793533.82 16414164355.38
18288661924.77
Gross Profit9499328321.6
5 10584151615.98 11792861730.53 13139606540.1614640149607.0
4Operating Expenses
6713200536.80 7479848038.11 8334046684.06 9285794815.38
10346232583.29
EBIT2786127784.8
5 3104303577.88 3458815046.47 3853811724.78 4293917023.75Interest Expenses 22400000.00 22400000.00 22400000.00 22400000.00 22400000.00
EBT2763727784.8
5 3081903577.88 3436415046.47 3831411724.78 4271517023.75Tax 690931946.21 770475894.47 859103761.62 957852931.19 1067879255.94
Net Income2072795838.6
4 2311427683.41 2577311284.85 2873558793.58 3203637767.81Number of Shares 968700000.00 968700000.00 968700000.00 968700000.00 968700000.00EPS 2.14 2.39 2.66 2.97 3.31
Year 2015 2016 2017 2018 2019Revenue 36689281808.74 40879197791.30 43871555069.62 45284219142.87 46742370999.27Cost of Goods Sold 20377227116.58 22704306453.29 24366261685.67 25150855311.95 25960712852.99Gross Profit 16312054692.17 18174891338.01 19505293383.95 20133363830.92 20781658146.27Operating Expenses 11527772344.31 12844243946.03 13784442602.88 14228301654.69 14686452967.97EBIT 4784282347.86 5330647391.99 5720850781.08 5905062176.23 6095205178.30Interest Expenses 22400000.00 22400000.00 22400000.00 22400000.00 22400000.00EBT 4761882347.86 5308247391.99 5698450781.08 5882662176.23 6072805178.30Tax 1190470586.97 1327061848.00 1424612695.27 1470665544.06 1518201294.58Net Income 3571411760.89 3981185543.99 4273838085.81 4411996632.17 4554603883.73

Number of Shares 968700000.00 968700000.00 968700000.00 968700000.00 968700000.00EPS 3.69 4.11 4.41 4.55 4.70

The above table show projected income statement in the next ten years if Nike maintains its strategies. Next, we project income statement if Nike follows our suggested strategies. Therefore, there are some accounts that will be affected due to our strategies. The projected income statement based on our strategies has assumptions as follows:
- For the first recommended strategy, which we suggest Nike to expand the retail store
abroad, we suggest to finance this project by using retained earning as the major
source of fund, 80% as it is the cheapest one, and finance another 20% by borrowing
from local banks in that country to avoid currency risk. Moreover, the reason why we
use retained earning more than debt due to the economic uncertainty during this time
which may create high risk to the company if we use debt to finance the project. As a
result, average rate of borrowing of 7% with total amount of 200 million dollars.
- Operating Expenses increase 4% of salesdue to the higher expenses from research and
development expenses in order to follow the second, third and fifth recommended
strategies during the first three years and drop to 2% after that.
- S&A expense increase 1% of sale in year 2011 after Nike's Application on smart phone
and gadgets can operate in 2011.
- Marketing plan to increase sales in footwear and apparel causes advertising expenses
increase 1% of sales.
- After sales service division will be completely operate in 2012, which causes S&A
expense increase 2% of sale every year
- Although CSR project can decrease advertising expenses, costs due to CSR project
will increase operating expenses 1% of sales every year.
- All strategies will make sale and cost increase as follows:
Revenue Increase
R&D Expenses Increase
SG&A Expenses Increase
Total Operating Expenses Interest Expenses
2010 21.42% 4.00% 3.00% 34.72% 14,000,000.002011 21.42% 4.00% 4.00% 35.72% 14,000,000.002012 26.42% 4.00% 5.00% 36.72% 14,000,000.002013 31.42% 2.00% 5.00% 36.72% 14,000,000.002014 31.42% 2.00% 3.00% 34.72% 14,000,000.002015 31.42% 2.00% 3.00% 34.72% 14,000,000.002016 26.42% 2.00% 3.00% 34.72% 14,000,000.002017 21.42% 2.00% 3.00% 34.72% 14,000,000.002018 21.42% 2.00% 3.00% 34.72% 14,000,000.002019 21.42% 2.00% 3.00% 34.72% 14,000,000.00

Therefore, we can use this table as a benchmark in order to project the income
statement if Nike follows our recommended strategies. The projected income statement in the
next ten year will be as follows:
Year Revenue Cost of Goods Sold Gross Profit2010 23,283,620,620.00 12,931,114,309.42 10,352,506,310.582011 28,270,972,156.80 15,700,958,994.49 12,570,013,162.312012 35,740,163,000.63 19,849,152,360.84 15,891,010,639.792013 46,969,722,215.43 26,085,756,032.62 20,883,966,182.812014 61,727,608,935.52 34,281,900,578.06 27,445,708,357.452015 81,122,423,663.06 45,053,273,739.69 36,069,149,923.372016 102,554,967,994.84 56,956,348,661.72 45,598,619,333.122017 124,522,242,139.33 69,156,398,545.06 55,365,843,594.282018 151,194,906,405.58 83,969,699,113.41 67,225,207,292.172019 183,580,855,357.65 101,956,008,663.50 81,624,846,694.15
Year R&D expenses SG&A Expenses EBITInterest
Expenses2010 931,344,824.80 8,084,073,079.26 1,337,088,406.52 14,000,000.00
2011 1,130,838,886.27 10,098,391,254.41 1,340,783,021.63 14,000,000.00
2012 1,429,606,520.03 13,123,787,853.83 1,337,616,265.93 14,000,000.00
2013 939,394,444.31 17,247,281,997.51 2,697,289,741.00 14,000,000.00
2014 1,234,552,178.71 21,431,825,822.41 4,779,330,356.33 14,000,000.00
2015 1,622,448,473.26 28,165,705,495.81 6,280,995,954.29 14,000,000.00
2016 2,051,099,359.90 35,607,084,887.81 7,940,435,085.42 14,000,000.00
2017 2,490,444,842.79 43,234,122,470.78 9,641,276,280.71 14,000,000.00
2018 3,023,898,128.11 52,494,871,504.02 11,706,437,660.04 14,000,000.00
2019 3,671,617,107.15 63,739,272,980.18 14,213,956,606.82 14,000,000.00
Year EBT Tax Net Income# of
Shares EPS2010 1,323,088,406.52 330,772,101.63 992,316,304.89
968700000 1.02
2011 1,326,783,021.63 331,695,755.41 995,087,266.22
968700000 1.03

2012 1,323,616,265.93 330,904,066.48 992,712,199.45
968700000 1.02
2013 2,683,289,741.00 670,822,435.25 2,012,467,305.75
968700000 2.08
2014 4,765,330,356.33 1,191,332,589.08 3,573,997,767.25
968700000 3.69
2015 6,266,995,954.29 1,566,748,988.57 4,700,246,965.72
968700000 4.85
2016 7,926,435,085.42 1,981,608,771.35 5,944,826,314.06
968700000 6.14
2017 9,627,276,280.71 2,406,819,070.18 7,220,457,210.53
968700000 7.45
2018 11,692,437,660.04 2,923,109,415.01 8,769,328,245.03
968700000 9.05
2019 14,199,956,606.82 3,549,989,151.71 10,649,967,455.12
968700000 10.99

Year 2010 2011 2012 2013 2014
Revenue23283620620.0
028270972156.8
035740163000.
6346969722215.4
361727608935.5
2Cost of Goods Sold
12931114309.42
15700958994.49
19849152360.84
26085756032.62
34281900578.06
Gross Profit10352506310.5
812570013162.3
115891010639.
7920883966182.8
127445708357.4
5
R&D expenses 931344824.80 1130838886.271429606520.0
3 939394444.31 1234552178.71
SG&A Expenses 8084073079.2610098391254.4
113123787853.
8317247281997.5
121431825822.4
1
EBIT 1337088406.52 1340783021.631337616265.9
3 2697289741.00 4779330356.33Interest Expenses 14000000.00 14000000.00 14000000.00 14000000.00 14000000.00
EBT 1323088406.52 1326783021.631323616265.9
3 2683289741.00 4765330356.33Tax 330772101.63 331695755.41 330904066.48 670822435.25 1191332589.08Net Income 992316304.89 995087266.22 992712199.45 2012467305.75 3573997767.25# of Shares 968700000.00 968700000.00 968700000.00 968700000.00 968700000.00EPS 1.02 1.03 1.02 2.08 3.69
Year 2015 2016 2017 2018 2019
Revenue81122423663.
06102554967994.8
4124522242139.
33151194906405.
58183580855357.6
5Cost of Goods Sold
45053273739.69 56956348661.72
69156398545.06
83969699113.41
101956008663.50
Gross Profit36069149923.
37 45598619333.1255365843594.2
867225207292.1
7 81624846694.15
R&D expenses1622448473.2
6 2051099359.90 2490444842.79 3023898128.11 3671617107.15
SG&A Expenses28165705495.
81 35607084887.8143234122470.7
852494871504.0
2 63739272980.18

EBIT6280995954.2
9 7940435085.42 9641276280.7111706437660.0
4 14213956606.82Interest Expenses 14000000.00 14000000.00 14000000.00 14000000.00 14000000.00
EBT6266995954.2
9 7926435085.42 9627276280.7111692437660.0
4 14199956606.82
Tax1566748988.5
7 1981608771.35 2406819070.18 2923109415.01 3549989151.71
Net Income4700246965.7
2 5944826314.06 7220457210.53 8769328245.03 10649967455.12# of Shares 968700000.00 968700000.00 968700000.00 968700000.00 968700000.00EPS 4.85 6.14 7.45 9.05 10.99

During the first four year both EBIT and EPS of Nike with our strategies will be lower than
EPS of the current strategies due to the higher operating expenses, which mainly come from
R&D and advertising expenses. However, when the time passes, you can see that EPS with
our strategies has increase rapidly due to the increase of royalty customer, resulting high
growth rate of revenue and lower in operating expenses, resulting from more efficiency in
doing business and lower advertising since the products can penetrate the market already.
2008 2010 2012 2014 2016 2018 20200.00
2.00
4.00
6.00
8.00
10.00
12.00
EPS(Strategies)EPS
2008 2010 2012 2014 2016 2018 20200.00
2000000000.00
4000000000.00
6000000000.00
8000000000.00
10000000000.00
12000000000.00
14000000000.00
16000000000.00
EBIT(Strategies)EBIT
Next, we will capture the cost and benefit from using debt as our source of fund to
finance the expansion of Nike. Since the company finances by borrowing, resulting in
increasing in interest expenses, the degree of financial leverage of Nike will be higher as you
can see from the below table.
You can see that during the time that EBIT with our strategies lower than EBIT with
current strategies which is the first four year, the percentage decrease in EPS drop more than
the percentage decrease in EBIT, while when EBIT with our strategies higher than EBIT with
current strategies which is after the first four year, the percentage increase in EPS increase
more than the percentage decrease in EBIT. This is due to the effect of DFL.
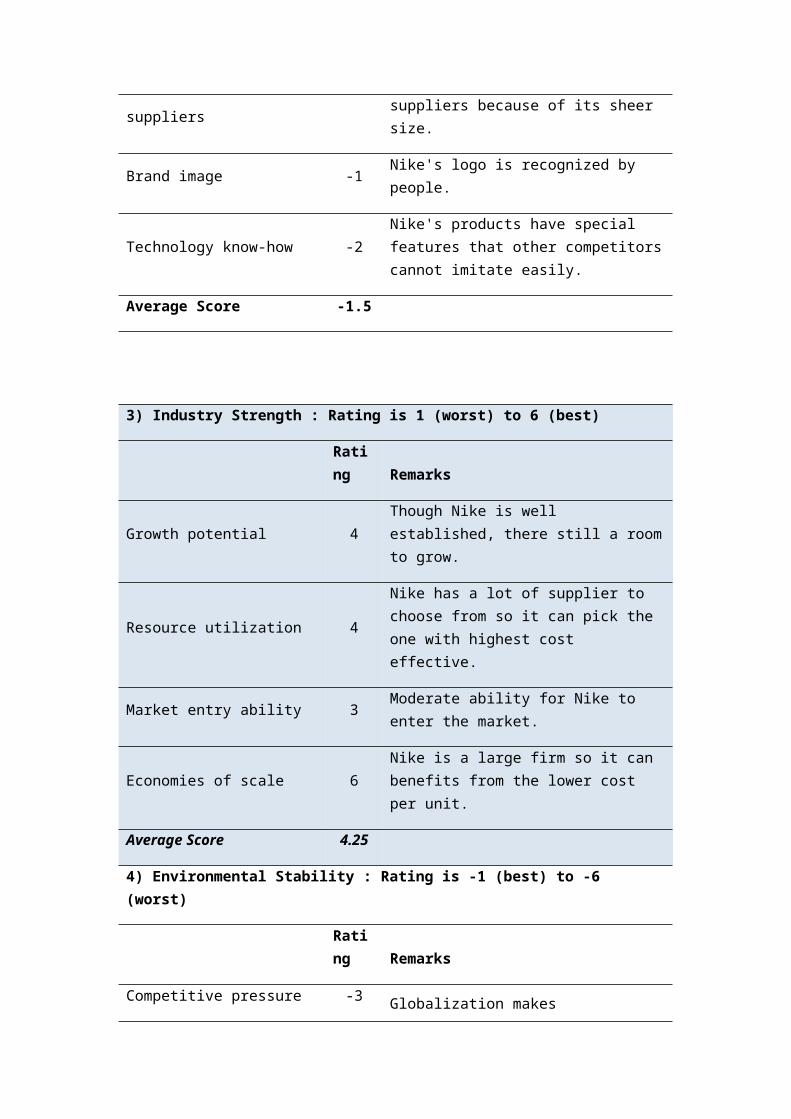
Year 2010 2011 2012 2013 2014 2015 2016 2017 2018 2019DFL(Strategies)
1.0106
1.0106
1.0106
1.0059
1.0053
1.0047
1.0042
1.0039
1.0038
1.0037
DFL1.008
21.007
31.006
61.005
21.002
91.002
21.001
81.001
51.001
21.001
0
Projected Balance Sheet
Next step, we are going to do the projected balance sheet, we need to forecast the data
following the historical liabilities and equity from last 3-year.
For 3-year historical Asset we use 2007-2009 to find the average percentage cash of
asset, marketable securities, and inventories and so on as shown in the table below. We used
each asset amount divided by total asset and then we averaged all 3-year to get the forecast
balance sheet in year 2010. The result is shown in the last column.
Three Year Historical Asset
Year 2009 2008 2007 3-year average
%cash17.29
%17.15
%17.37
% 17.27%
%Marketable sec. 8.79% 5.16% 9.27% 7.74%
%Acct. Rec.21.77
%22.47
%23.34
% 22.52%
%Inventories17.79
%19.60
%19.85
% 19.08%
%Other CA 7.83% 6.67% 5.73% 6.75%
%Intangibles 4.99% 9.58% 5.06% 6.54%
%Net Prop&Equip14.78
%15.20
%15.70
% 15.23%
%Deferred Charges 6.77% 4.18% 3.68% 4.88%
And then do the same similar method with the liabilities and equities .Using historical
data from last 3 years which are 2007-2009. And use it to find out 3-year average historical

liabilities and equities. By using amount of each liability or equity divided by total liabilities
and equities. The result is show in the table below.
Three Year Historical Asset
Year 2009 2008 2007 3-year average
%Note Payable 2.59% 1.43% 0.94% 1.65%
%Account Payable 7.79%10.35
% 9.73% 9.29%
%Current Portion of LT debt 0.24% 0.05% 0.29% 0.19%
%Accrued Expenses 13.46%14.16
% 12.19% 13.27%
%Inc. Taxes Payable 0.65% 0.71% 1.02% 0.79%
%Deferred Charges Taxes Inc. 6.35% 6.87% 6.26% 6.49%
%Capital Surplus 21.67%20.07
% 15.75% 19.17%
%Retained Earnings 41.14%40.77
% 45.71% 42.54%
%Other Liabilities 2.77% 2.02% 1.66% 2.15%
After we get all of average historical data, we can use that to do projected balance
sheet. We started with find the total asset in year 2010 by using the total asset in 2009 and use
growth rate at 10.40% and then we get other total asset in each year. Then use each 3-year
average asset multiple with total asset in each year.
Average Growth Rate of Total Asset
Year 2009 2008 2007 2006
Total Asset 13249.6 12442.7 10688.3 9869.6
Growth Rate 6.48% 16.41% 8.30%
Average Growth Rate 10.40%

As the company needs to spend $1,000 million to expand more retail shop in foreign
country. Therefore, we recommend Nike to use retain earning for $800 million by spending
own cash $500 million in year 2010, $300 million in year 2011. Another $200 million, we
suggest Nike to borrow from local bank because Nike could avoid the currency risk. We also
suggest Nike to borrow $100 million for each year which will do to add up in LT-investment
in year 2010 and 2011 but after the branches has opened this amount of debt will go to add up
with net property plant and equipment. For liabilities debt will be in long term debt.

The balance sheet after applied with the strategies is show below:

Projected Financial Ratios
2019 2018 2017 2016 2015 2014 2013 2012 2011 2010Liquidity RatioCurrent Ratio 2.91 2.91 2.91 2.91 2.91 2.91 2.91 2.91 2.84 2.78Quick Ratio 2.15 2.15 2.15 2.15 2.15 2.15 2.15 2.15 2.08 2.02Days Payable 11.85 13.03 14.33 15.76 18.05 21.49 25.58 30.45 34.87 38.36Asset Management RatioTotal Asset Turnover Ratio 5.15 4.68 4.26 3.87 3.38 2.84 2.39 2.00 1.75 1.59Inventory Turnover Ratio 15.00 13.64 12.40 11.27 9.84 8.27 6.95 5.84 5.10 4.63Financial Structure RatioDebt Ratio 35.46% 35.46% 35.46% 35.46% 35.46% 35.46% 35.46% 35.46% 36.08% 36.14%Debt/Equity Ratio 55.52% 55.52% 55.52% 55.52% 55.52% 55.52% 55.51% 55.51% 56.48% 56.58%Profitability RatioGross Profit Margin 44.46% 44.46% 44.46% 44.46% 44.46% 44.46% 44.46% 44.46% 44.46% 44.46%Operating Profit Margin 7.74% 7.74% 7.74% 7.74% 7.74% 7.74% 5.74% 3.74% 4.74% 5.74%Net Profit Margin 5.80% 5.80% 5.80% 5.80% 5.79% 5.79% 4.28% 2.78% 3.52% 4.26%ROA 29.89% 27.17% 24.70% 22.45% 19.60% 16.45% 10.23% 5.57% 6.16% 6.78%ROE 46.80% 42.54% 38.67% 35.15% 30.68% 25.75% 16.01% 8.72% 9.65% 10.62%
Financial Leverage 1.55 1.55 1.55 1.55 1.55 1.55 1.55 1.55 1.56 1.57
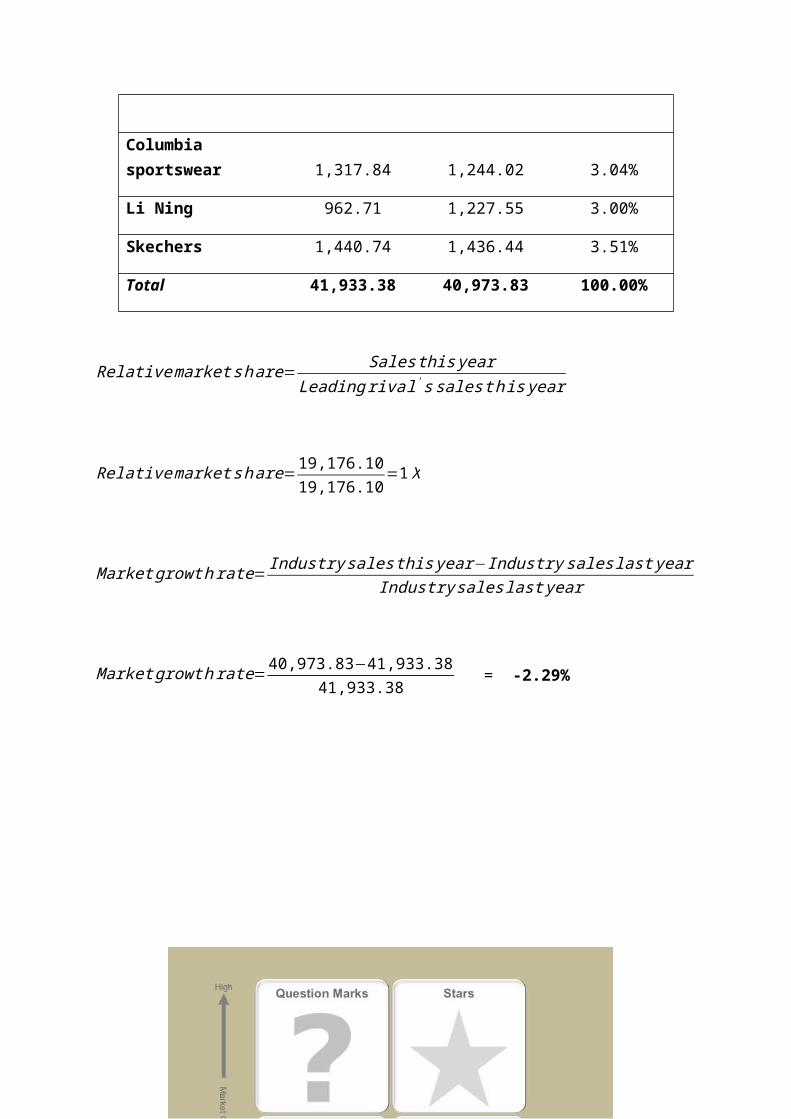
The above table illustrates the summary of key financial ratios after applying new
strategy of Nike, Inc. You can see that liquidity ratio of the company is quite good as you can
see from the higher current ratio and quick ratio, comparing from year 2010 to 2012.
However, there is one ratio, Days Payable decreased every year from 2010 to 2019.
Therefore, Nike has good ability to pay account payable.
For the asset management aspect, Nike’s ability to manage overall its assets is better
every year. Surprisingly, when we focus on just the part of inventory management, the
company can manage it better because the ratio increases every year. On the other hand, the
financial structure of the company remained quite constant over the forecast years as you can
see from stable debt ratio and debt to equity ratio.
In addition, it is obviously seen that all of the profitability ratios of Nike are quite
stable over the forecast period, especially ROE and ROA which sharply increased from year
2012 to 2019. For financial leverage, it is quite stable over the forecast period too.
Du Pont Analysis (Trend Analysis)
2014 2013 2012 2011 2010Net Profit Margin 5.79% 4.28% 2.78% 3.52% 4.26%Total Asset Turnover Ratio 2.84 2.39 2.00 1.75 1.59Financial Leverage 1.55 1.55 1.55 1.56 1.57ROE 25.49% 15.84% 8.63% 9.64% 10.62%
2019 2018 2017 2016 2015Net Profit Margin 5.80% 5.80% 5.80% 5.80% 5.79%Total Asset Turnover Ratio 5.15 4.68 4.26 3.87 3.38Financial Leverage 1.55 1.55 1.55 1.55 1.55ROE 46.31% 42.10% 38.27% 34.78% 30.36%
In order to see which factor causes ROE become lower, we decompose the ROE into
three dimensions: profitability management, efficiency management, and financial leverage.
Not surprisingly, form year 2010 to 2012 Nike will have high investment cost of expanding
its business. After that, net profit will increase to 5.80% in year 2015. Also the total asset
turnover ratio increase every year which means that Nike will have high ability to use its
asset to generate sales. Therefore, the main factor of increasing ROE is net profit margin and
total asset turnover ratio.
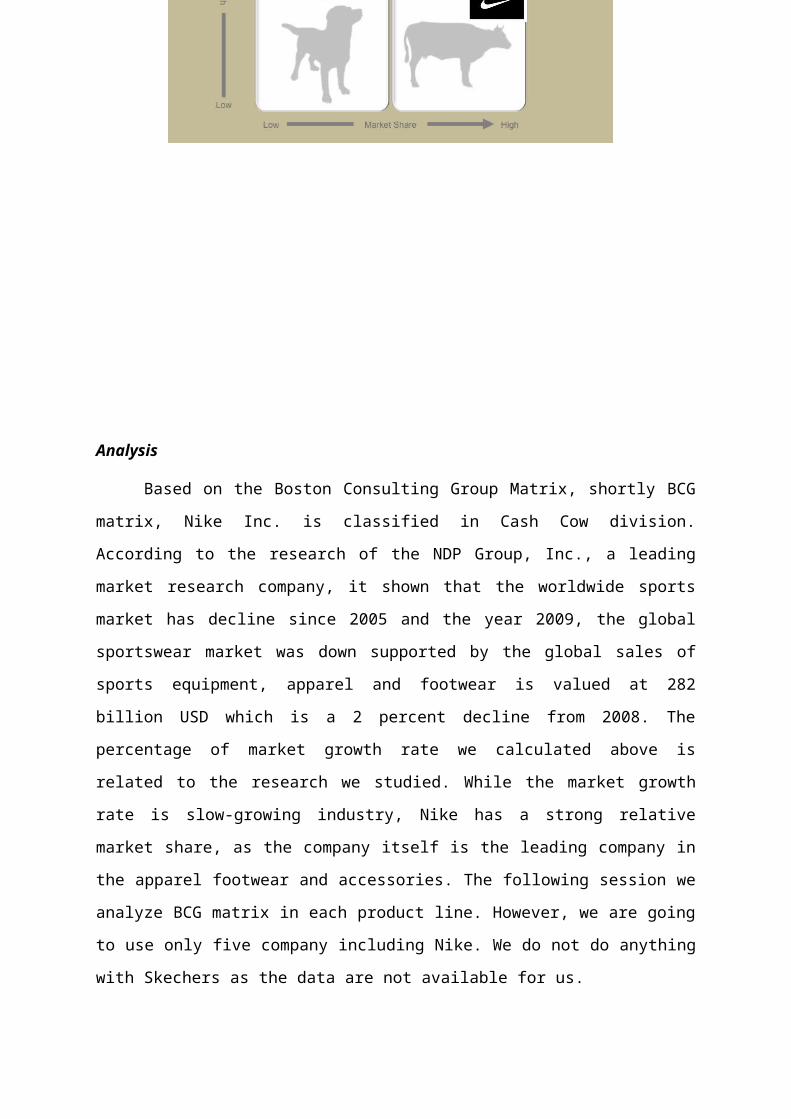
Value of the Firm Analysis (After following our strategies)
Growth from historical growth rate = 8.36%
Growth from sustainable growth rate = 18.67%
Growth from multiple regression = 8.64%
Growth from our qualitative adjustment = 10%
Average growth = 8.36 %+18.67 %+8.64 %+10 %
4 = 11.42%
Estimating Revenue from Our Strategies
Year Revenue2010 23,283,620,620.002011 28,270,972,156.802012 35,740,163,000.632013 46,969,722,215.432014 61,727,608,935.522015 81,122,423,663.062016 102,554,967,994.842017 124,522,242,139.332018 151,194,906,405.582019 183,580,855,357.65
Estimating Cost of Equity: from CAPM formula
Rf (US 10-years Government Bond) = 3.8368%
Beta of Nike = 0.881
Market Return = 9.81%
Cost of Equity=Rf +β∗( Rm−Rf )Cost of Equity = 3.8368% + 0.881*(9.81% - 3.8368%)
= 9.10%

Net Income FCFE Cost of Equity PV of FCFE
2010 992,316,304.89 553,690,897.98 507,507,697.502011 995,087,266.22 143,378,694.34 9.10% 143,378,694.342012 992,712,199.45 277,221,001.20 9.10% 277,221,001.202013 2,012,467,305.75 1,436,333,682.41 9.10% 1,436,333,682.412014 3,573,997,767.25 2,937,957,182.40 9.10% 2,937,957,182.402015 4,700,246,965.72 3,998,070,232.44 9.10% 3,998,070,232.442016 5,944,826,314.06 5,169,636,528.21 9.10% 5,169,636,528.212017 7,220,457,210.53 6,364,662,400.47 9.10% 6,364,662,400.472018 8,769,328,245.03 7,824,547,018.17 9.10% 7,824,547,018.17
Terminal CF 64,010,985,339.48PV of Terminal CF 29,230,197,993.99PV of FCFE 57,889,512,435.34Number of shares outstanding 968,700,000Intrinsic Value 59.76
Current Strategies Recommended Strategies30.87 59.76
As you can see from the valuation of two strategies, you can see that if Nike follows
our recommended strategies, the intrinsic value of Nike increase sharply from 30.87 to 59.76.
This indicates that our recommended strategies can follow the company goal which
maximizes shareholders’ wealth.

Strategic Result
Vision: NIKE, Inc. is the world’s leading innovator in athletic footwear, apparel, equipment and accessories.
Goal: Increase sales 20%
Corporate Strategy: Growth: Horizontal Integration
Business Strategy: Customer focus
Financial Perspective Achieve high revenue and maximize shareholders' wealth
Customer Perspective Satisfied new market sectors while keeping in touch with current customers
Internal Business Perspective
New innovative products
Learning & Growth Perspective
Develop new product line offered to untouched market.

Mission : Bringing inspiration and innovation to all.
Vision : NIKE, Inc. is the world’s leading innovator in athletic footwear, apparel, equipment and
accessories.
Theme: Operating
Efficiency
Objective Measures Targets Initiative
Financial • Max holders’
wealth
• Increase Sale
• Net Profit
• Total Revenue
• 20% sales
growth per year
• Optimize
Profitability
• Attract new
market.
Customer • Satisfactory
• More
Customers
• No. of
customer who
comply with the
strategy
• 30% of current
customer use the
promotion
• Market share
increases 15%
• Brand
awareness
Internal • More product
line
• New branches
• No. of
successful
branches abroad
• No. of new
market sector
• 80% of new
braches success
• Inventory
turnover
increases 10%
• Advertisement
and CSR
program.
• Top athletes
brand
embrassader
Learning •Diversificatio
n
• Sales revenue •Yr 1 21.42% • In-dept
research in each
local area
Excessively in R&D
Profitability
Increase sales
Satisfactory
More Customers
New branches
More Products
Low financial risk
Loyal customer

Conclusion
As you can see from the SWOT Analysis, both strength and opportunity are
overweight, weaknesses and threat which indicate that Nike can be considered as a good
company which a excess return period equal to 7-year. For value of the firm analysis, Nike
has good reputation and has the highest market shared. Moreover, Nike can reach the cost
effective strategy by outsourcing factory. However, there are some weaknesses such as
Nike’s revenue is heavily depended on footwear market which in the context of economic
situation in the country.
For external factors, Nike has a chance to enhance revenue during The FIFA World
Cup 2010. From the research throughout the world, they said that people are more concern
about their health and they shift their preference from the street wear market to the sport wear
market. On the other hand, there are severe impacts from other competitors. For example Li-
Ning expanded its market share to other countries in order to acquire more market share.
From our analysis, most of the models are consistent. GE model and BCG matrix
suggest that Nike should expand its business by internal or external expansions by using
excess cash from current business, therefore the strategies that we recommend Nike are about
how to expand its business to other sectors such as aging population. Moreover, we also
focus in the aspects of advertisement and research development in order to improve and
promote our product.
When we compared current strategy and our recommendation, it illustrates that by
following our strategy can maximize the shareholder’s wealth more than the current strategy
as you can see from the income statement and balance sheet of Nike. In addition you can see
from the increase of intrinsic value between strategy and our recommendation that increase
from $30.87 to $59.76.
Related Documents

![Food security and nutrition: building a global narrative ... · EXECUTIVE SUMMARY EXECUTIVE SUMMARY EXECUTIVE SUMMARY EXECUTIVE SUMMAR Y [ 2 ] This document contains the Summary and](https://static.cupdf.com/doc/110x72/5ff5433612d22125fb06e6b5/food-security-and-nutrition-building-a-global-narrative-executive-summary-executive.jpg)