Pharmacodynamic Differentiation of Lorazepam Sleepiness and Dizziness Using an Ordered Categorical Measure Mohamed A. Kamal 1,2 , David E. Smith 1 , Jack Cook 3 , Douglas Feltner 3 , Allen Moton 3 , and Daniele Ouellet 3,4 1,2 New address: Hoffmann-La Roche Inc, Modeling and Simulation 340 Kingsland St.Nutley, NJ 07110-119 1 Upjohn Center for Clinical Pharmacology, 1150 W. Medical Center Drive, The University of Michigan, Ann Arbor, Michigan 48109 3 Pfizer, Inc, Clinical Pharmacology, 50 Pequot Ave, New London, CT 06329 3,4 New address: Glaxo SmithKline, Clinical Pharmacology/Modeling and Simulation, Five Moore Drive, Research Triangle Park, NC 27709 Abstract Categorical measures of lorazepam sleepiness and dizziness were modeled to identify differences in pharmacodynamic (PD) parameters between these adverse events (AEs). Differences in data- derived PD parameters were compared to relative incidence rates in the drug label (15.7% and 6.9%, respectively). Healthy volunteers (n=20) received single oral doses of 2 mg lorazepam or placebo in a randomized, double-blind, cross-over fashion. A 7-point categorical scale measuring the intensity of AEs was serially administered over 24 hr. The maximum score (MaxS), and area under the effect curve (AUEC) were determined by noncompartmental methods and compared using a paired t-test. Individual scores were modeled using a logistic function implemented in NONMEM. AUEC and MaxS for sleepiness were significantly higher than dizziness (20.35 vs. 9.76, p<0.01) and (2.35 vs.1.45, P<0.01). Model slope estimates were similar for sleepiness and dizziness (0.21 vs. 0.19 logits×ml/ng), but baseline logits were significantly higher for sleepiness (−2.81 vs. −4.34 logits). Data-derived PD parameters were in concordance with label incidence rates. The higher intensity of sleepiness may be directly related to baseline (no dug present) while the increase in intensity due to drug was relatively similar for both AEs. Keywords lorazepam; sleepiness; dizziness; adverse events; ordered categorical; pharmacodynamics INTRODUCTION Ordered categorical scales have been used in a variety of clinical settings to measure subjective effects and feelings which are clinically relevant yet difficult to measure using objective tests. A good example is pain where several analgesic trials used various categorical scales. 1,2 Such scales have been reported to display high validity and reproducibility 2,3 during repeated assessments and are usually quick and easy to administer. 1 Correspondence to: Mohamed A. Kamal (Telephone: 650-855-6245; Fax: 650-855-5061; [email protected]). NIH Public Access Author Manuscript J Pharm Sci. Author manuscript; available in PMC 2010 August 10. Published in final edited form as: J Pharm Sci. 2010 August ; 99(8): 3628–3641. doi:10.1002/jps.22093. NIH-PA Author Manuscript NIH-PA Author Manuscript NIH-PA Author Manuscript

Welcome message from author
This document is posted to help you gain knowledge. Please leave a comment to let me know what you think about it! Share it to your friends and learn new things together.
Transcript
Pharmacodynamic Differentiation of Lorazepam Sleepiness andDizziness Using an Ordered Categorical Measure
Mohamed A. Kamal1,2, David E. Smith1, Jack Cook3, Douglas Feltner3, Allen Moton3, andDaniele Ouellet3,41,2New address: Hoffmann-La Roche Inc, Modeling and Simulation 340 Kingsland St.Nutley, NJ07110-1191Upjohn Center for Clinical Pharmacology, 1150 W. Medical Center Drive, The University ofMichigan, Ann Arbor, Michigan 481093Pfizer, Inc, Clinical Pharmacology, 50 Pequot Ave, New London, CT 063293,4New address: Glaxo SmithKline, Clinical Pharmacology/Modeling and Simulation, Five MooreDrive, Research Triangle Park, NC 27709
AbstractCategorical measures of lorazepam sleepiness and dizziness were modeled to identify differencesin pharmacodynamic (PD) parameters between these adverse events (AEs). Differences in data-derived PD parameters were compared to relative incidence rates in the drug label (15.7% and6.9%, respectively). Healthy volunteers (n=20) received single oral doses of 2 mg lorazepam orplacebo in a randomized, double-blind, cross-over fashion. A 7-point categorical scale measuringthe intensity of AEs was serially administered over 24 hr. The maximum score (MaxS), and areaunder the effect curve (AUEC) were determined by noncompartmental methods and comparedusing a paired t-test. Individual scores were modeled using a logistic function implemented inNONMEM. AUEC and MaxS for sleepiness were significantly higher than dizziness (20.35 vs.9.76, p<0.01) and (2.35 vs.1.45, P<0.01). Model slope estimates were similar for sleepiness anddizziness (0.21 vs. 0.19 logits×ml/ng), but baseline logits were significantly higher for sleepiness(−2.81 vs. −4.34 logits). Data-derived PD parameters were in concordance with label incidencerates. The higher intensity of sleepiness may be directly related to baseline (no dug present) whilethe increase in intensity due to drug was relatively similar for both AEs.
Keywordslorazepam; sleepiness; dizziness; adverse events; ordered categorical; pharmacodynamics
INTRODUCTIONOrdered categorical scales have been used in a variety of clinical settings to measuresubjective effects and feelings which are clinically relevant yet difficult to measure usingobjective tests. A good example is pain where several analgesic trials used variouscategorical scales.1,2 Such scales have been reported to display high validity andreproducibility2,3 during repeated assessments and are usually quick and easy to administer.1
Correspondence to: Mohamed A. Kamal (Telephone: 650-855-6245; Fax: 650-855-5061; [email protected]).
NIH Public AccessAuthor ManuscriptJ Pharm Sci. Author manuscript; available in PMC 2010 August 10.
Published in final edited form as:J Pharm Sci. 2010 August ; 99(8): 3628–3641. doi:10.1002/jps.22093.
NIH
-PA Author Manuscript
NIH
-PA Author Manuscript
NIH
-PA Author Manuscript
Pharmacokinetic-pharmacodynamic (PK/PD) modeling of categorical responses may alsoprovide insight into the PD of adverse events (AEs). The feasibility of using differentsubjective scales as biomarkers of AEs was investigated in a small clinical pharmacologystudy.4 As part of that study, seven-point ordered categorical scales measuring differenttypes of subjective response (e.g. sleepiness, dizziness, etc) were administered serially aftersingle dose administration to measure intensity of drug effects over 24 hours. Inspection ofthe effect-time profiles of the more common drug effects showed differential profiles for thedifferent CNS agents, the onset and offset of response as well as the relationship to plasmaconcentrations.
The current analysis focuses on the categorical measures of two adverse effects (AEs) of oneof the representative CNS drugs studied,4 namely lorazepam sleepiness and dizziness, withan aim to identify differences in relevant pharmacodynamic parameters using a PK/PDmodeling approach. To date, no pharmacodynamic data, whether being categorical orcontinuous, have been published contrasting lorazepam induced sleepiness and dizziness inthe context of population modeling. Their incidence rates in the drug label offer a uniquebenchmark for comparison. Thus, any differences found in PD measures between sleepinessand dizziness in the current analysis will be compared to differences in incidence rates in thedrug label.5
From the spectrum of CNS effects measured in the larger study,4 lorazepam sleepiness anddizziness were selected as the endpoints of interest because: 1) these effects showed arelatively high scale signal amplitude and highest statistical significance in the time-averaged-change- from -baseline differences with placebo, 2) sleepiness is a more commonAE of lorazepam than dizziness according to incidence rates in the label,5 and 3) theirpharmacology is thought to be conferred by benzodiazepine receptor activity in distinctlydifferent areas of the CNS.6, 7 It must be noted that modeling categorical data can not beperformed using conventional nonlinear regression because it has a polynomial distributionwhich violates the assumption of homogeneity of variance.8 Therefore, the probabilities ofreporting the effect categories as a function of time are typically modeled using logisticregression. The current study employs a logistic function9,10 to model sleepiness anddizziness categorical scores and assesses model performance using previously publishedpharmacometric methodology.11,12
METHODSData Collection
Twenty healthy volunteers were randomized in a double blind, single dose, 5-way crossoverdesign.4 All subjects gave written informed consent to participate in the study. The studywas conducted at the Clinical Pharmacology Unit of Pfizer (Ann Arbor, MI) in accordancewith the principles of the Declaration of Helsinki. The study protocol was approved andperformed in compliance with the Institutional Review Board/Independent EthicsCommittee (IRB/IEC) and International Committee on Harmonization (ICH) Good ClinicalPractice guidelines. Each subject received an oral dose of either lorazepam 2 mg, as one offour CNS drugs, or placebo. All study drugs were commonly used marketed compoundswithin their respective therapeutic indications and were selected to produce different AEprofiles which could potentially be measurable after single dose administration. Eachregimen was separated by a one week washout period for a total trial period of fiveconsecutive weeks. Based on the half-life of each study drug, this washout period wasdeemed adequate to ensure lack of any period effect on baseline PD measures. Bloodsamples were drawn before dosing and at 0.5, 1, 2, 3, 4, 6, 8, 10, 12, 24, 48, and 72 hr afterthe morning dose.
Kamal et al. Page 2
J Pharm Sci. Author manuscript; available in PMC 2010 August 10.
NIH
-PA Author Manuscript
NIH
-PA Author Manuscript
NIH
-PA Author Manuscript

Prior to each blood collection during the first 24 hr, a 70 item questionnaire wasadministered. Items on the questionnaire covered various complaints, symptoms, or feelingsthe subject experienced. For each statement the subject was to answer how strongly he orshe felt the complaint, symptom, or feeling on a seven-point ordered categorical scale. Theseven effect categories were 0=none, 1=minimum, 2=mild, 3=moderate, 4=significant,5=severe, 6=extreme.
Analytical AssayPlasma levels of lorazepam were determined using liquid chromatography tandem massspectrometry (LC/MS/MS) at PPD Development (Richmond, VA). Briefly, 0.1 mL ofhuman plasma containing sodium heparin was extracted by a liquid-liquid extraction usingmethyl t-butyl ether. The organic extract was dried and reconstituted in 0.2 mL of formicacid/methanol/5 mM ammonium formate (0.1:50:50, v/v/v), and an aliquot was injected intothe LC/MS/MS system. The compounds were separated by reverse phase on a C18 column(2.0 mm × 50 mm, 5 µm) by gradient elution using a binary mobile phase consisting offormic acid/methanol/water (0.1:10:90, v/v/v) and 0.1% formic acid in methanol (v/v). Theanalytes were ionized in the mass spectrometer in a Turbo IonSpray source with positive ionatmospheric pressure electrospray ionization and detected with multiple-reaction monitoringmodes. The nominal ion transitions monitored were m/z = 321 > 275 for lorazepam and m/z327 > 281 for the internal standard (lorazepam-d4). These transition ions were selectedbased on predominant fragmentation pathways of lorazepam and internal standard and theirintensity, as observed in their product ion mass spectra. The lorazepam standard curve waslinear over the range of 0.5 ng/mL (the lower limit of quantitation) to 50 ng/mL when 0.1mL plasma was used for the analysis (r2 > 0.998). The intra- and inter-assay variations wereless than 15% for the spiked standard curve and quality control samples. The variations forthe quality control samples during the long-term study were <12%.
Data AnalysesPharmacokinetics—A non-compartmental analysis13 was performed using WinNonLinversion 5.2 (Pharsight Inc, Mountain View, CA) on lorazepam plasma concentration-timeprofiles to determine maximal concentration (Cmax), time to maximal concentration (Tmax),area under the curve from time zero to infinity (AUC0-∞) and the terminal half-life (t1/2).Compartmental population analyses were conducted in NONMEM V14 using the first orderconditional estimation method with interaction. The general model building strategy is basedon modification of different approaches discussed by Beal and Sheiner,14 Mandema et al,15and Ette and Ludden.16 During model building, the goodness of fit of different models to thedata was evaluated using the following criteria: change in the minimum objective function(MOF), visual inspection of concordance and residual plots, precision of the parameterestimates, and decreases in both inter-individual and residual variability. A decrease in theMOF of at least 3.8 upon addition of a parameter was considered statistically significant.This corresponds to a nominal p value of <0.05 and one degree of freedom in the chi squaredistribution of the difference of MOF between hierarchical models.
The initial PK model was a one-compartment model defined in terms of the followingstructural parameters: oral clearance (CL/F), volume of distribution (V1/F), and first-orderrate constant for absorption (ka). Other models tested include a term for lag time inabsorption (tlag) and/or 2-compartments. Inter-subject variability on mean PK parameterswas modeled using an exponential error term and was estimated sequentially on structuralparameters such as oral clearance (CL/F), volume of distribution in the central andperipheral compartments (V1/F, V2/F), and on the first order absorption rate constant (Ka).Various models of residual variability were tested including additive, proportional andcombined additive/proportional error models. During model building, the off-diagonal
Kamal et al. Page 3
J Pharm Sci. Author manuscript; available in PMC 2010 August 10.
NIH
-PA Author Manuscript
NIH
-PA Author Manuscript
NIH
-PA Author Manuscript
elements of the variance-covariance matrix were fixed to 0, i.e., it was assumed that therewas no correlation between PK parameters. In the final step, the correlation between allparameters was estimated in NONMEM.
Parameter estimates of CL/F and t1/2 were compared to the non-compartmental results toensure that model was adequate. Confidence intervals around parameter estimates weregenerated using nonparametric bootstrap procedure (n=1000 runs) as described by Ette et al11.
Pharmacodynamics—In order to produce a typical value versus time curve forsleepiness and dizziness categorical scores, the expected value at each time point wascalculated. The expected value or average score of the categorical measure of sleepiness anddizziness at time t can be defined by the following equation:
(1)
where X is the discrete random variable denoting the categorical measure of sleepiness ordizziness, xt is the categorical sleepiness or dizziness score at time t with a set of possiblecategorical values m ranging from 0–6, and P(x) is the probability (obtained as a frequency)of reporting a categorical score x at time t. To examine whether or not there were differencesin sleepiness and dizziness intensities, a noncompartmental analysis of the time course ofaverage sleepiness and dizziness scores was conducted. Effect intensity endpointsdetermined were maximum score (MaxS) and area under the effect curve (AUEC) over theentire dosing interval (24 hr). A paired t-test was used to determine whether differences inMaxS and AUEC between sleepiness and dizziness were statistically signficant.
Population modeling of the time course of sleepiness and dizziness scores was implementedin NONMEM14 using a logistic function9,10 with the second order Laplacian method ofestimation.14 Since the intensity of pharmacodynamic effect was self-rated on the 7-pointcategorical scale (0–6), the logistic function was used to model the probability (P) ofobserving scores P≥m (m = 0 to 6) as a function of baseline effect, drug concentrations, andplacebo effect. The logistic function used was:
(2)
where g{P(Yt ≥ mη)} is the function describing the probability of being greater than or equal
to a particular effect category, m; is the sum of baseline parameters (β1, β2, β3,… βm)describing the baseline probability of experiencing a particular effect category; ‘drug’ and‘placebo’ are model components describing drug and placebo effects; and η is a subjectspecific random effect parameter quantifying inter-individual variability in responseassumed to be normally distributed with a mean of 0 and variance ω2. The logit transformfunction was used to convert the function g{P(Yt ≥ mη)}, which is in logits, into aprobability.
(3)
Kamal et al. Page 4
J Pharm Sci. Author manuscript; available in PMC 2010 August 10.
NIH
-PA Author Manuscript
NIH
-PA Author Manuscript
NIH
-PA Author Manuscript
Initial inspection of sleepiness data showed the highest reported effect category as 5(severe). As such, the probabilities modeled over time were (P≥1, P≥2, P≥3, P≥4, P≥5). Bydefinition, P≥0 =1, and this is not modeled. For the dizziness data, the highest reportedcategory was three, and the probabilities modeled over time were (P≥1, P≥2, P≥3). Modelbuilding was conducted by adding the model components in equation (2) sequentially andobserving the change in the MOF. Modeling was initialized on all data (placebo, baseline,and drug) with incorporation of the baseline model first followed by the drug model andthen the placebo model.
First, baseline probabilities for each effect category were modeled as constants as describedby Sheiner.9 From equation (2), β1 is the Y intercept (in logits) describing the baseline forreporting an effect category of at least minimum intensity (1 or more), β2 is the interceptadded to β1 to determine the baseline logit contribution for reporting an effect category of atleast mild (2 or more), and so forth.
The drug component was added by beginning with a simple linear slope function asdescribed below:
(4)
Where E is the drug effect, S is the slope describing the relationship between drug effect inthe logistic domain and drug concentrations C. Originally C was tested as concentration inthe central compartment determined by posthoc individual PK parameter estimates. Additionof an effect compartment,17 where C in equation (4) now represents concentration in theeffect compartment, was tested to account for any delay in effect with respect to peakplasma concentrations. This required addition of an extra parameter keo, the first order rateconstant describing lag in effect in the biophase17 compared to central compartmentconcentrations. A Hill function without and with a sigmoidicity constant were also tested.Change in the MOF and inspection of the correlation matrix of estimates to ensure modelstability was used to select final models.
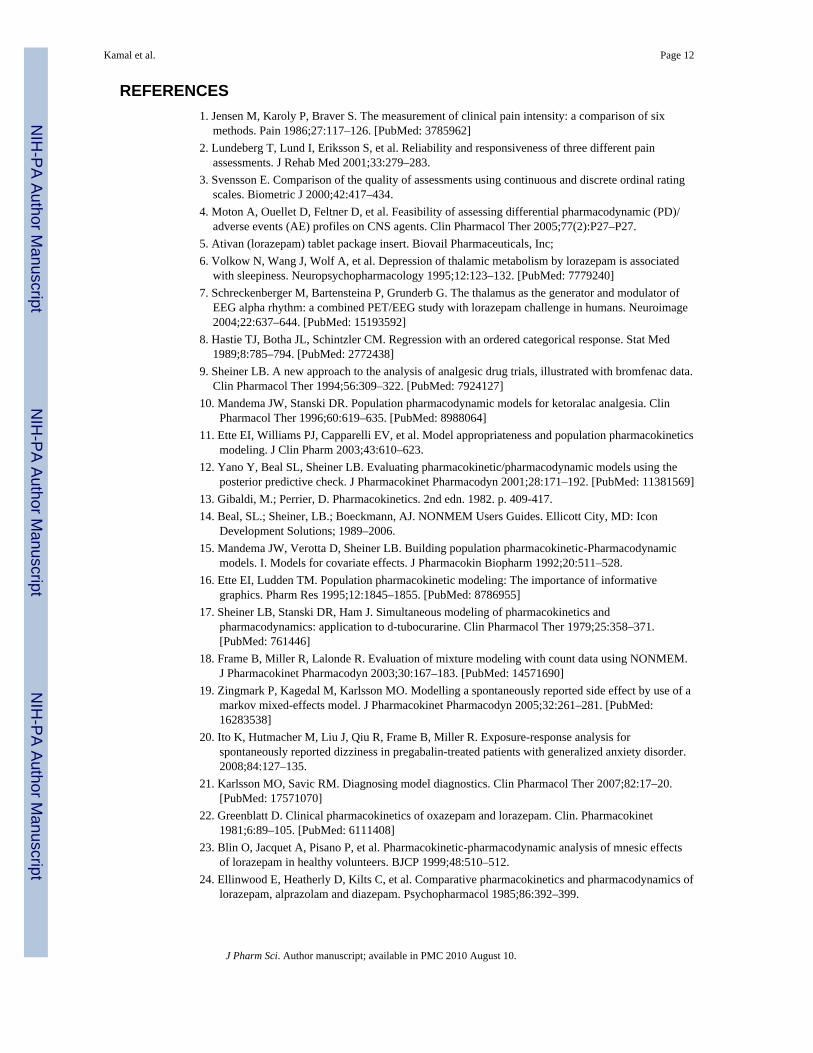
For the placebo component of equation (2), several models were tested including a constantmodeled as a theta14 parameter in logits and a Bateman-like function. Incorporation of theplacebo component in this manner resulted in the covariance step being aborted. However,inspection of the individual placebo profiles revealed some subjects as non-responders andothers as mild to moderate responders as shown in Figure 1. As such a mixture model18 onplacebo response was tested. A mixture model assumes the population is composed of twoor more subpopulations, each having a distinct population mean and random effects.Therefore, if the subject belonged to subpopulation 1 of non-responders, the placeboresponse was set to zero. If the subject belonged to subpopulation 2, the placebo responsewas modeled using a Bateman-like function, with a theta parameter in logits describing theamplitude of placebo effect, and first order rate constants describing the onset and offset ofplacebo effect.
Assessment of PK/PD Model Performance—Nonparametric bootstrapping11 andsimulation based on bootstrap estimates were performed using SPLUS VI software(Insightful Corporation, Seattle, Washington). One thousand bootstrap runs were conductedto determine confidence intervals of parameter estimates. This analysis was repeated usingsuccessful bootstrap runs only. Simulations were then performed using five-hundred sets ofbootstrap estimates to generate five hundred sets of data as described by Ette et al.11 Usingthis simulated data, cumulative probability plots of reporting at least an effect intensity m( P≥m ) as a function of time were constructed to show the performance of the model across
Kamal et al. Page 5
J Pharm Sci. Author manuscript; available in PMC 2010 August 10.
NIH
-PA Author Manuscript
NIH
-PA Author Manuscript
NIH
-PA Author Manuscript
effect categories. Ninety percent prediction intervals of the time course of categorical scoreswere also constructed to visually depict the degree of uncertainty in the models due torandom effects and parameter estimate uncertainty. In addition, posterior distributions ofrelevant PD endpoints were constructed and overlaid on the observed mean values asdescribed by Yano et al.12 The PD endpoints selected were those determined in the PDnoncompartmental analysis (i.e., MaxS and AUEC), as well as the proportion of subjectsreporting an AE of at least mild and moderate intensity.
The current logistic model assumes independence of two consecutive categoricalobservations measured as a function of time. To test that this assumption is reasonable, theposterior distribution of the number of different transitions19,20 from the logistic model weregenerated for both lorazepam sleepiness and dizziness and overlaid on the observed meanvalue.
Comparison of PD Parameters and Label Incidence—The relative ratio of labelincidence of lorazepam sleepiness and dizziness was compared to the relative ratio ofvarious data-derived PD parameters including MaxS, AUEC, and the maximum probabilityof reporting at least a particular effect category m (P≥1, P≥2, P≥3). The relative ratio ofmodel-derived PD parameters such as slope was also compared to the ratio of labelincidence of sleepiness and dizziness.
RESULTSPharmacokinetics
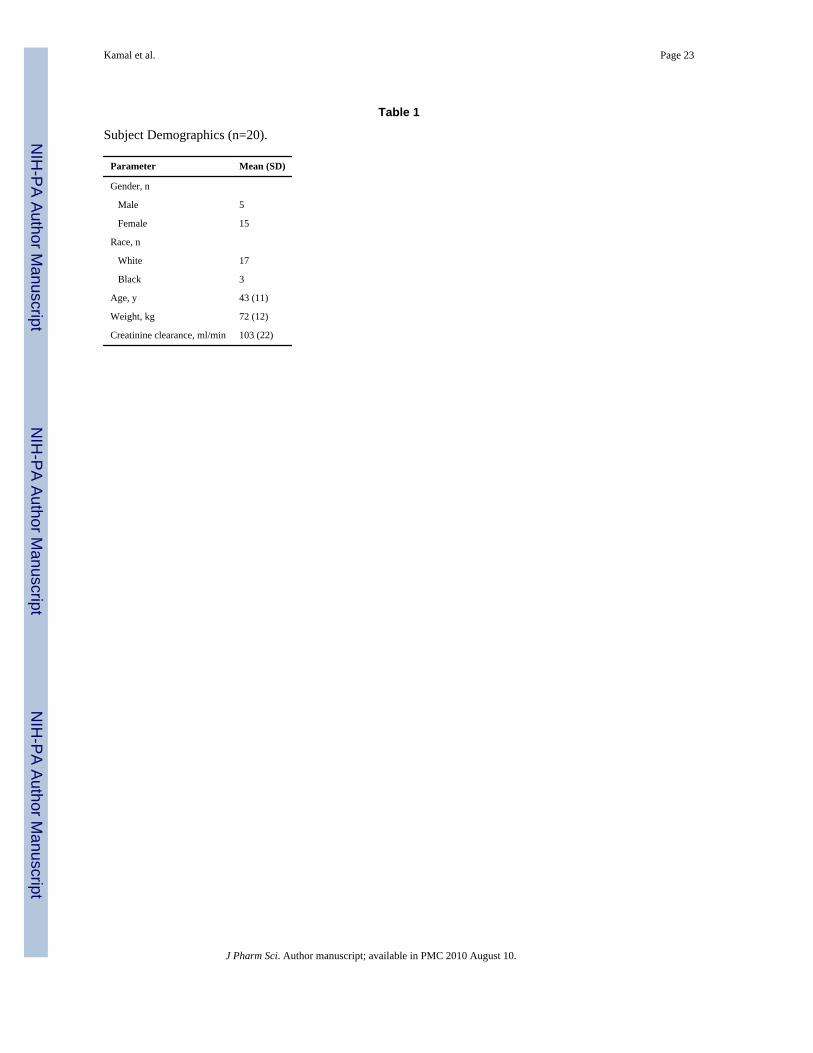
Table 1 shows the demographic information of the twenty study subjects. The time course ofobserved mean ± SD, mean predicted, and individual plasma concentrations after single oraldose administration of lorazepam 2 mg are shown in Figure 2. A noncompartmental analysisyielded mean (CV%) estimates for Cmax of 26.8 ng/ml (22.9), Tmax of 1.7 hr (40.8), t1/2 of16.8 hrs (21.3) and a total systemic exposure or AUC0-∞ of 551 ng*hr/ml (31.0). Significantdecreases in the MOF, residual and inter-individual variability, and inspection ofconcordance and residual plots indicated that a two-compartment model with first orderabsorption adequately described the time course of plasma concentrations of 2 mg orallorazepam.
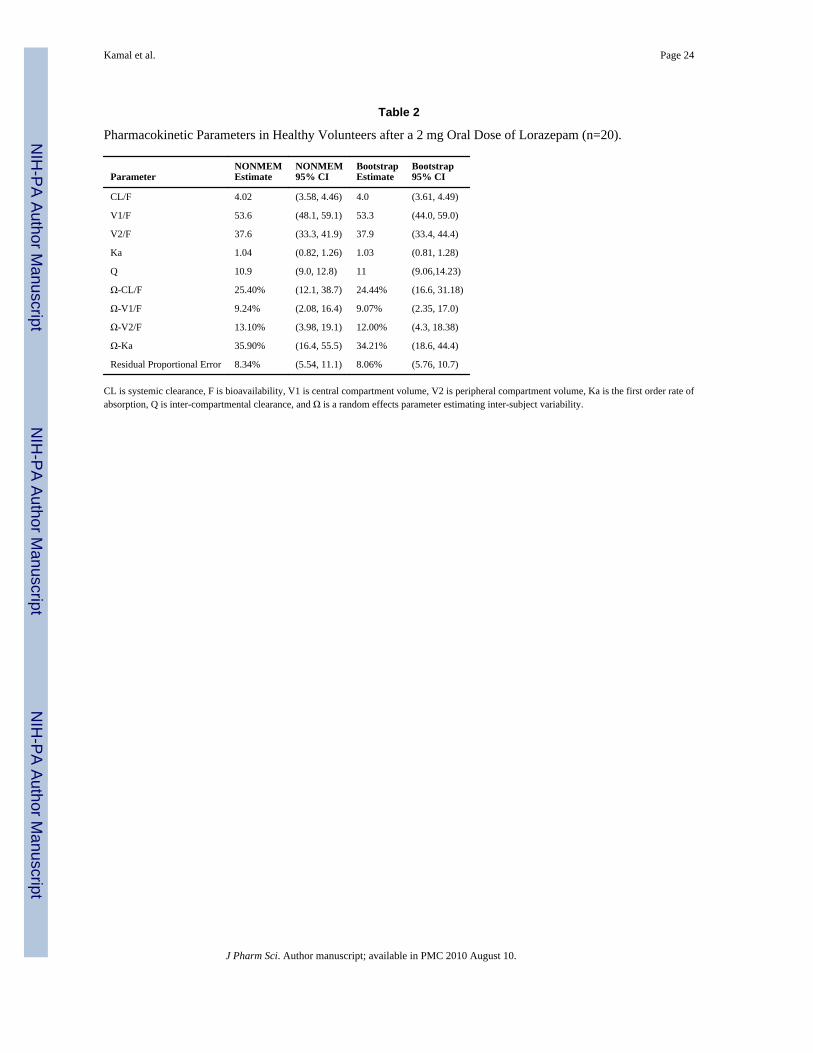
Table 2 shows the final pharmacokinetic population parameter estimates. The populationmean parameter estimates were in good agreement with parameters derived using non-compartmental analysis for both CL/F (3.63 vs. 4.02 L/hr) and the derived half-life (16.7 vs.16.8 hrs). Epsilon shrinkage21 was 45%. Results of the non-parametric bootstrap analysisare included in Table 2. The model was robust with 87% of the runs minimizingsuccessfully. The parameter estimates and confidence intervals obtained from the bootstrapprocedure which included all runs (even those which failed) were generally comparable tothe estimates derived from NONMEM. Similar bootstrap estimates and confidence intervalswere obtained using only successful runs.
PharmacodynamicsNoncompartmental analyses conducted on the effect-time profiles of sleepiness anddizziness scores showed significant differences between these AEs in the maximum score(MaxS) and area under the effect curve (AUEC) endpoints. The MaxS of lorazepamsleepiness (±SE) was significantly higher then dizziness (2.35 ± 0.26 vs. 1.45 ± 0.22,p<0.01), as was the AUEC (20.35 ± 3.58 vs. 9.76 ± 2.45, p<0.01). The time to reach MaxSfor lorazepam sleepiness scores was delayed (3.98 hr, Figure 3) compared to time ofmaximal lorazepam concentrations (1.71 hr, Figure 2). This observation justified addition of
Kamal et al. Page 6
J Pharm Sci. Author manuscript; available in PMC 2010 August 10.
NIH
-PA Author Manuscript
NIH
-PA Author Manuscript
NIH
-PA Author Manuscript
the effect compartment17 to describe drug effect in the lorazepam sleepiness model. Incontrast, the dizziness effect peaked (2.55 hr, Figure3) at a time similar to that observed forpeak plasma drug concentrations.
Population PD model-building was initialized by addition of baseline logit intercepts foreach effect category. As indicated in equation (2), these are added sequentially from i=1 tom in order to quantify the probability of experiencing a score category m or more in theabsence of drug or placebo. Table 3 shows the final PD model estimates. As shown, β1(which reperesents the probability in logits of reporting a score of 1 or more at baseline) wassignificantly higher for sleepiness (−2.81) than dizziness (−4.34) as indicated by the 95%confidence intervals.β4 and β5 were included in the sleepiness model as they resulted insignificant decreases in the MOF. Addition of the drug component of the model as a slope asdescribed in equation (4) resulted in a decrease in point reduction in the MOF of 216 and174 points for sleepiness and dizziness models, respectively, indicating a significant drugeffect. As shown in Table 3, slope estimates of sleepiness (0.21 logits/ml*ng) and dizziness(0.19) were not significantly different on inspection of the 95% confidence intervals.Addition of an effect compartment as described in equation (5) was significant for sleepinessbut not dizziness, and the final estimate of keo, the first order rate constant describing lag ineffect in the biophase compared to central compartment concentrations, was 2.44 hr−1.
Placebo effect was modeled as a mixture of non-responders and responders in the finalmodel, where the responder component was described using a Bateman-like function asshown in Figure 1. Modeling the placebo effect as a mixture, remedied the initial problemencountered with abortion of the covariance step and resulted in stabilization of the finalmodel as indicated by the correlation matrix of estimates being devoid of high correlations(>0.8) among parameters. PLAC describes the amplitude of response and, as indicated inTable 3, was similar for sleepiness (3.6 logits) and dizziness (4.3 logits) as was k1, the first-order rate constant describing onset of placebo effect. When k2, the first-order rate constantdescribing offset of placebo effect, was modeled for sleepiness placebo, it resulted in over-parameterization as determined by inspection of the correlation matrix of estimates.However, given that the individual responder profiles showed a Bateman pattern of effectand not exponential decay, k2 was modeled as a fraction of k1 and the constant used todetermine this fraction was determined using a sensitivity analysis. The majority of subjectswere non-responders to placebo effect as indicated by P(1), the subpopulation proportionthat was non-responder to placebo, and this estimate was similar between sleepiness (63%)and dizziness (71%). The inter-individual random effects parameter Ω1 was significantlyhigher for sleepiness effect (3.31 logits) compared to dizziness (0.32 logits).
As shown in Table 3, mean population parameter estimates obtained from the bootstrapprocedure were generally comparable to the estimates from the final model. The NONMEMconfidence intervals were also generally comparable to the bootstrap intervals for mostparameters, with the exception of β5, keo, PLAC, and P(1) of the sleepiness model; andPLAC, k1, and P(1), of the dizziness model, reflecting their asymmetric distribution. Thesuccess rate of bootstrap runs was 80% for the lorazepam sleepiness model and 83% for thedizziness model.
Figure 3 shows the observed (points) and overlaid mean simulated scores (lines) and 90%shaded prediction intervals (PIs) obtained from five hundred sets of bootstrap parameterestimates. The mean simulations adequately describe the time course of sleepiness anddizziness scores with the prediction intervals (shaded region) capturing the data and meansimulations. The one exception, however, is a data point of placebo sleepiness (at 6 hr)which is not captured by the model and lies slightly outside of the shaded interval. The
Kamal et al. Page 7
J Pharm Sci. Author manuscript; available in PMC 2010 August 10.
NIH
-PA Author Manuscript
NIH
-PA Author Manuscript
NIH
-PA Author Manuscript

shaded PI for lorazepam sleepiness is wider then that of lorazepam dizziness indicating thegreater model uncertainty of sleepiness.
Figure 4 shows the observed and simulated cumulative probabilities of reporting asleepiness and dizziness effect greater than or equal to a particular effect category over time(P>=m). The simulations describe the data adequately. As shown, the cumulativeprobabilities decrease with increasing effect category (m). Moreover, peak probabilities ofreporting at least an effect category m at time of maximal effect are higher for lorazepamsleepiness (P≥1=1, P≥2=0.45, P≥3=0.25, P≥4=0.1, P≥5=0.05) then for lorazepam dizziness(P≥1=0.7, P≥2=0.3, P≥3=0. 15) as shown in Figure 4.
Figure 5 shows histograms of the simulated distribution of MaxS, AUEC, and the number ofsubjects reporting an AE of at least mild and moderate severity obtained from 500 sets ofbootstrap parameter estimates, overlaid on the observed mean of these PD endpoints(represented by the vertical black bar). The panels indicate that that proposed modelssimulate posterior distributions of these parameters which are centered close to the observedmeans.
Figures 6a and 6b show the posterior distributions of the number of different categoricaltransitions for lorazepam sleepiness and dizziness, respectively, overlaid on the observedmean. The panels indicate that the observed population mean lies within the posteriordistributions of the transitions counts for all simulated transitions. The posterior distributionscapture the observed mean adequately overall with the exception of few transitions which lieat the tail of the posterior distribution (transition 1 to 1 in Figures 6a and the transitions 1 to0, 2 to 2, 3 to 1, and 3 to 0 in 6b).
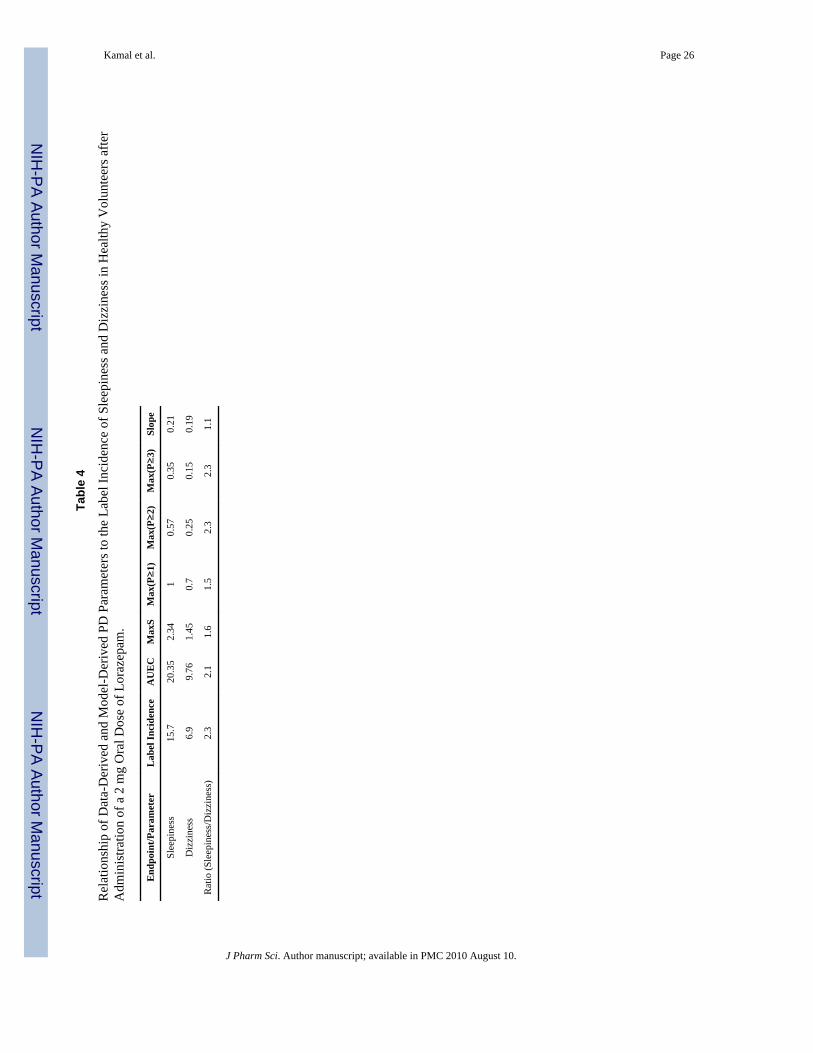
Finally, Table 4 relates the various data-derived PD parameters, and the model-derived PDparameter, slope, to the incidence rates of the adverse events in the more general population,as reported in the drug label.5 The ratio of the sleepiness/dizziness endpoints was calculatedacross these parameters. As shown by the relative ratios, Max (P≥2), Max (P≥3) and AUEC,show the greatest concordance to label incidence, followed by MaxS and Max (P≥1).However, the ratio of sleepiness to dizziness slope parameters was very close to 1 indicatingthat drug effect may not explain the differences between sleepiness and dizziness acrossthese PD parameters.
DISCUSSIONThe current PK/PD analysis of a 7-point ordered categorical measure aims to differentiatethe pharmacodynamics of two of the most common AEs of lorazepam, sleepiness anddizziness. The 2 mg dose of drug selected in this study is within the range of recommendeddaily doses of lorazepam for maintenance treatment of generalized anxiety disorder. Studiesmodeling the intensity of drug AEs over time are relatively uncommon,19,20 and no studieshave formally applied population PK/PD analyses in differentiation of AEs.
PK estimates obtained from the noncompartmental and compartmental analysis of theconcentration-time profiles are consistent with previous reports22 and showed thatlorazepam is rapidly absorbed (Ka=1.04 h−1), has peak plasma concentrations occurring atabout 2 hours post dose and that it has relatively moderate steady state volume ofdistribution (90 L), low systemic clearance (4 L/h), and moderate terminal half-life (16.7 hr).
The noncompartmental analysis of the effect-time profiles of sleepiness and dizziness scoresindicated that the MaxS of sleepiness was significantly higher than dizziness (2.35 vs. 1.45,p<0.01) as was the AUEC (20.35 vs. 9.76, p<0.01). As shown in Table 4, the ratios ofsleepiness/dizziness of these PD parameters are in concordance to the ratio of label
Kamal et al. Page 8
J Pharm Sci. Author manuscript; available in PMC 2010 August 10.
NIH
-PA Author Manuscript
NIH
-PA Author Manuscript
NIH
-PA Author Manuscript
incidence, with AUEC showing stronger concordance. While sleepiness and dizziness arethe most commonly reported AEs of lorazepam according to the drug label,5 these effectsshow minimal to moderate amplitude on the categorical scale as shown in Figure 3. Thisobservation may underscore the sensitivity of the seven-point categorical scale in discerningsmall differences between relatively mild to moderate AEs over time.
Differences in reporting various categories of effect intensity between these AEs are seen inthe cumulative effect probability plots in Figure 4. Maximum probabilities of reporting atleast a minimal effect, Max (P≥1), are higher for lorazepam sleepiness (P=1) than dizziness(P=0.7). Likewise, maximum probabilities of reporting at least mild and moderate intensity,Max(P≥2) and Max(P≥3), are higher for lorazepam induced sleepiness (P≥2=0.45,P≥3=0.25) than for dizziness (P≥2=0.3, P≥3=0.15). Since these represent the cumulativeprobabilities (which is a frequency) of reporting an effect of given intensity in a conceptualpopulation, their relationship to label incidence is more direct than MaxS and AUEC whichreflect effect intensity rather than effect frequency. As shown in Table 4, the sleepiness/dizziness ratio across these PD parameters are also in concordance to the ratio of labelincidence with Max (P≥2) and Max (P≥3) showing the highest concordance followed byMax (P≥1). The stronger concordance of Max (P≥2) and Max (P≥3) to label incidenceseems to suggest that the frequency of reporting categorical effects of higher intensity maybe better related to incidence in the more general population.
The lack of significant difference between the model estimate of slope for sleepiness (0.21)and dizziness (0.19) at the 95% confidence level suggests that the drug does not contributeto the observed differences in intensity of these AEs. β1, the baseline intercept parameter ofeffect category 1 (likelihood of having a response of at least minimum intensity), is the onlyparameter that is significantly different between these AEs at the 95% confidence level. Thedifference between this estimate for sleepiness and dizziness is 1.5 logits. As shown inFigure 7, which shows the relationship between the probability and logistic domains, themajority of the probability domain (0.1 ≤y≤ 0.9) occurs in the logit range −3≤x≤3, and 0logits corresponds to the inflection point at y=0.5. In this range, 1.5 logits corresponds to aprobability of 0.82. Since 0 logits corresponds to P=0.5, the difference P=0.82–0.5=0.32corresponds to the greater likelihood of reporting sleepiness than dizziness due to thebaseline difference. From Figure 4, the difference in observed cumulative effect (P≥1) atTmax between sleepiness and dizziness is 1-0.7=0.3 equivalent to the value determinedabove. Since (P≥1) is the cumulative effect across all effect categories, differences in thisendpoint between sleepiness and dizziness at Tmax closely resembles differences in MaxScore.
It is unclear from a physiological standpoint why the difference in baseline effect existsbetween sleepiness and dizziness, but one possible explanation may be the time of day inwhich the data was collected. Given that the scale was first applied in the morning, somesubjects may have experienced a residual sleepiness in the morning that was reported atbaseline. Another explanation may be that subjects may have a greater tendency to report asleepiness effect than dizziness even in the absence of any drug. However, no placeboresponse rates of these effects are reported in the lorazepam label to confirm this. Placebodata in the current study, as shown in Figure 3, show a slightly greater sleepiness response atearlier time points (at 0.5 hrs post dose administration), suggesting that differences inreporting sleepiness and dizziness in the absence of drug may be related to time of day.
The PK/PD temporal patterns of sleepiness and dizziness are shown in Figure 8, depictingthe counterclockwise hysteresis for lorazepam sleepiness and the closed hysteresis loop fordizziness. The same PK-PD temporal relationships of these AEs were recorded on theVisual Analog Scale 2, 3 administered in the same study4 as shown in Figure 8 further
Kamal et al. Page 9
J Pharm Sci. Author manuscript; available in PMC 2010 August 10.
NIH
-PA Author Manuscript
NIH
-PA Author Manuscript
NIH
-PA Author Manuscript

corroborating this finding. Other studies have shown the counterclockwise hysteresis patternwith amnesic,23 psychomotor,24,25 and cognitive24,25 effects after administration of 2 mgoral lorazepam in healthy adults. These studies estimated greater delays with slightly lowerkeo values (keo=1.3–1.7 h−1) compared to the current study (2.4 h−1). However, althoughcorrelated to the sedative effect of lorazepam,26 these amnesic and psychomotor effects aredifferent from sleepiness. On the other hand, in the current study, dizziness showed no suchsignificant delay and the time to MaxS was close to the Tmax of lorazepam concentrations.While this temporal difference between AEs is unclear, one pharmacologic explanation maybe distributional, i.e. lorazepam induced sleepiness may require traversing of the blood brainbarrier while dizziness may not. In fact, if indeed the subjects were reporting vertigo asdizziness,27 this would require binding to the GABA receptors in the vestibular system ofthe inner ear which does not require traversing the blood brain barrier. However, thedistributional delay is less likely given the high log P of lorazepam. Moreover, GABAreceptor inhibition of the vestibular axis by lorazepam would actually be therapeutic tovertigo,28 suggesting that the biophase of lorazepam dizziness is most likely the brain itselfand not the inner ear. Another explanation is that these AEs may originate from distinctanatomical locations in the brain. It is known that lorazepam induced sleepiness is the resultof binding to and inhibition of benzodiazepine receptors of GABA complexes in thethalamus and sensory cortex of the brain.6,7 The receptor binding causes downstreaminhibition of glucose metabolism,6,7 which might account for the delayed sensation ofsleepiness recorded by the scale. On the other hand, lorazepam induced dizziness isconferred by benzodiazepine action in receptors of the cerebellum (responsible formaintenance of balance) and these receptors may have a different subunit composition,29
altering rates of downstream signaling. If such a pharmacologic scenario is indeed valid, thisdelay may be described using a transduction model.30
The performance of the final population models was assessed by a number of diagnosticsincluding the mean simulations in Figure 3 which adequately capture the time course of drugand placebo scores, and the simulations in Figure 4 which capture the observed cumulativeprobabilities. As a further check to ensure the models simulate realistic data, posteriorpredictive checks (PPCs)12 in Figure 5 were performed and show that the simulateddistributions of MaxS and AUEC were centered close to the observed mean. These PDparameters were selected based on them being clinically relevant, data-derived parameterswhich could be determined using the profile of an individual subject. These parameterscondense the PD profiles to a single metric (either AUEC or MaxS) that capture evaluationof peak response and extent of response similar to a PK analysis. Use of analogous metrics(AUC and Cmax) for the PPC is recommended for PK models as discussed by Yano et al.12
Two other PPC metrics were analyzed: proportion of subjects reporting a categorical effectof at least mild and moderate intensity. As shown in Figure 5, the simulated distributions ofthese metrics were centered close to the observed mean as well. The 90% PIs in Figure 3show the model uncertainty conferred by both random effects and uncertainty in estimatingthe parameter estimates. Typically, the 90% as opposed to 95% PI is assessed, because someconfidence to detect a type I error is compromised to compensate for the increaseduncertainty incurred by random effects. As shown in Figure 3, the PI of lorazepamsleepiness is wider then dizziness indicating greater model uncertainty. This may be theresult of the greater random effects as shown in Table 3 (Ω is higher for sleepiness). Sinceoverlaying PIs of these effects shows separation beyond 2 hours, one can make theconclusion that, given uncertainty in the model estimates and random effects, the models candetect a difference between the time course (at Tmax and beyond) of these effects at the90% confidence level.
The current logistic or proportional odds model assumes independence of neighboringconsecutive categorical observations as a function of time. The Markov or transition
Kamal et al. Page 10
J Pharm Sci. Author manuscript; available in PMC 2010 August 10.
NIH
-PA Author Manuscript
NIH
-PA Author Manuscript
NIH
-PA Author Manuscript
model19,20 which determines the conditional probability of reporting an observation at time tgiven the previous observation, and therefore assumes dependence between theseobservations, would be a valid model to test since data were collected frequently andlongitudinally over time. The PPC analysis of the number of different categorical transitionsfor both lorazepam sleepiness and dizziness simulated form the logistic models, show thatthe observed population mean lies within the posterior distributions for the number of thedifferent transitions. The posterior distributions capture the observed mean adequatelyoverall with the exception of few transitions which lie at the tail of the posterior distributionas shown in Figure 6a (lorazepam sleepiness) and 6b (lorazepam dizziness). As an additionalcheck, the individual simulations (not shown) were explored in relation to the observedindividual data. Random individual simulations from random trials were inspected visuallyagainst the observed individual data to evaluate the individual pattern. One might expect theindividual simulated score from a logistic model to go back and forth between the differenttransitions while the observation typically only goes up or down once as the intensityprogresses. From inspection of the individual simulations against observed data, transitionsbetween scores were noted in the observations as well and the individual simulations werefound to mimic the individual patterns adequately.
Finally, certain study caveats should be acknowledged. First, the current study differentiatestwo AEs of a single drug. It would also be of interest to differentiate the same AE between 2drugs in a similar therapeutic class, however the drugs included in the larger study4 were ofdifferent therapeutic classifications. Second, the low incidence of other AEs observed in thisstudy precluded application of this modeling approach to other AEs (of lower intensity).4Nevertheless, the model proposed, may serve as platform to determine the minimalquantifiable categorical signal, given a particular study design and power, by conducting asensitivity analysis31 on model parameters. Third, only a single therapeutic dose wasinvestigated. Use of higher doses would better elucidate the maximal categorical responsefor such AEs. This information would have allowed determination of maximal capacity(Emax) of the system and sensitivity (EC50) of AEs, enhancing the interpretability of thecurrent analysis. Such an analysis may be feasible in ascending dose studies of compoundsunder development. Fourth, the study was conducted on healthy volunteers as opposed topatients with anxiety. Extrapolation of adverse event endpoints from healthy volunteers topatients may not be straightforward, as the tolerance of these different populations to AEsmay be quite different. This has been seen in certain CNS indications such as schizophreniawhere patients have shown higher tolerance to AEs of antipsychotic medications.32 Despitethe limitations of the study, we believe the current analysis has demonstrated the feasibilityof differentiating certain AEs using the pharmacometric approach described and mayprovide a framework for future studies with a similar aim.
CONCLUSIONLorazepam sleepiness and dizziness have shown distinct temporal PK/PD patterns and wererecorded with significantly different intensity on the 7-point categorical scale. Differences inthe PD endpoints described may be due to differences in baseline parameters. Thedifferences between data-derived PD measures of sleepiness and dizziness were consistentwith differences in incidence rates reported in the drug label.
AcknowledgmentsThe authors thank Bill Frame for helpful discussions regarding the pharmacometric analysis. This work wassupported by Pfizer Inc. MAK was supported by the Pharmacological Sciences Training Program of the NationalInstitutes of Health Grant number GM007767. Responsibility for opinions, conclusions, and interpretation of thedata lies with the authors.
Kamal et al. Page 11
J Pharm Sci. Author manuscript; available in PMC 2010 August 10.
NIH
-PA Author Manuscript
NIH
-PA Author Manuscript
NIH
-PA Author Manuscript
REFERENCES1. Jensen M, Karoly P, Braver S. The measurement of clinical pain intensity: a comparison of six
methods. Pain 1986;27:117–126. [PubMed: 3785962]2. Lundeberg T, Lund I, Eriksson S, et al. Reliability and responsiveness of three different pain
assessments. J Rehab Med 2001;33:279–283.3. Svensson E. Comparison of the quality of assessments using continuous and discrete ordinal rating
scales. Biometric J 2000;42:417–434.4. Moton A, Ouellet D, Feltner D, et al. Feasibility of assessing differential pharmacodynamic (PD)/
adverse events (AE) profiles on CNS agents. Clin Pharmacol Ther 2005;77(2):P27–P27.5. Ativan (lorazepam) tablet package insert. Biovail Pharmaceuticals, Inc;6. Volkow N, Wang J, Wolf A, et al. Depression of thalamic metabolism by lorazepam is associated
with sleepiness. Neuropsychopharmacology 1995;12:123–132. [PubMed: 7779240]7. Schreckenberger M, Bartensteina P, Grunderb G. The thalamus as the generator and modulator of
EEG alpha rhythm: a combined PET/EEG study with lorazepam challenge in humans. Neuroimage2004;22:637–644. [PubMed: 15193592]
8. Hastie TJ, Botha JL, Schintzler CM. Regression with an ordered categorical response. Stat Med1989;8:785–794. [PubMed: 2772438]
9. Sheiner LB. A new approach to the analysis of analgesic drug trials, illustrated with bromfenac data.Clin Pharmacol Ther 1994;56:309–322. [PubMed: 7924127]
10. Mandema JW, Stanski DR. Population pharmacodynamic models for ketoralac analgesia. ClinPharmacol Ther 1996;60:619–635. [PubMed: 8988064]
11. Ette EI, Williams PJ, Capparelli EV, et al. Model appropriateness and population pharmacokineticsmodeling. J Clin Pharm 2003;43:610–623.
12. Yano Y, Beal SL, Sheiner LB. Evaluating pharmacokinetic/pharmacodynamic models using theposterior predictive check. J Pharmacokinet Pharmacodyn 2001;28:171–192. [PubMed: 11381569]
13. Gibaldi, M.; Perrier, D. Pharmacokinetics. 2nd edn. 1982. p. 409-417.14. Beal, SL.; Sheiner, LB.; Boeckmann, AJ. NONMEM Users Guides. Ellicott City, MD: Icon
Development Solutions; 1989–2006.15. Mandema JW, Verotta D, Sheiner LB. Building population pharmacokinetic-Pharmacodynamic
models. I. Models for covariate effects. J Pharmacokin Biopharm 1992;20:511–528.16. Ette EI, Ludden TM. Population pharmacokinetic modeling: The importance of informative
graphics. Pharm Res 1995;12:1845–1855. [PubMed: 8786955]17. Sheiner LB, Stanski DR, Ham J. Simultaneous modeling of pharmacokinetics and
pharmacodynamics: application to d-tubocurarine. Clin Pharmacol Ther 1979;25:358–371.[PubMed: 761446]
18. Frame B, Miller R, Lalonde R. Evaluation of mixture modeling with count data using NONMEM.J Pharmacokinet Pharmacodyn 2003;30:167–183. [PubMed: 14571690]
19. Zingmark P, Kagedal M, Karlsson MO. Modelling a spontaneously reported side effect by use of amarkov mixed-effects model. J Pharmacokinet Pharmacodyn 2005;32:261–281. [PubMed:16283538]
20. Ito K, Hutmacher M, Liu J, Qiu R, Frame B, Miller R. Exposure-response analysis forspontaneously reported dizziness in pregabalin-treated patients with generalized anxiety disorder.2008;84:127–135.
21. Karlsson MO, Savic RM. Diagnosing model diagnostics. Clin Pharmacol Ther 2007;82:17–20.[PubMed: 17571070]
22. Greenblatt D. Clinical pharmacokinetics of oxazepam and lorazepam. Clin. Pharmacokinet1981;6:89–105. [PubMed: 6111408]
23. Blin O, Jacquet A, Pisano P, et al. Pharmacokinetic-pharmacodynamic analysis of mnesic effectsof lorazepam in healthy volunteers. BJCP 1999;48:510–512.
24. Ellinwood E, Heatherly D, Kilts C, et al. Comparative pharmacokinetics and pharmacodynamics oflorazepam, alprazolam and diazepam. Psychopharmacol 1985;86:392–399.
Kamal et al. Page 12
J Pharm Sci. Author manuscript; available in PMC 2010 August 10.
NIH
-PA Author Manuscript
NIH
-PA Author Manuscript
NIH
-PA Author Manuscript

25. Gupta K, Ellinwood H, Heatherly G. Simultaneous modeling of the pharmacokinetic andpharmacodynamic properties of benzodiazepines. I: Lorazepam. J Pharmacokinet Biopharm1990;18:98–102.
26. Huron C, Giersch A, Danion J. Lorazepam, sedation, and conscious recollection: a dose-responsestudy with healthy volunteers. Inter Clin Pschopharmacol 2002;17:19–26.
27. Dieterich M. Dizziness. The Neurologist 2004;10:154–164. [PubMed: 15140275]28. Hain T, Uddin M. Pharmacologic treatment of vertigo. CNS Drugs 2003;17:85–100. [PubMed:
12521357]29. Lüddens H, Korpi ER, Seeburg PH. GABAA/benzodiazepine receptor heterogeneity:
Neurophysiological implications. Neuropharm 1995;34:245–254.30. Mager D, Jusko WJ. Pharmacodynamic modeling of time-dependent transduction systems. Clin
Pharmacol Ther 2001;70:210–216. [PubMed: 11557908]31. Girard P. Clinical Trial Simulation: A tool for understanding study failures and preventing them.
BCPT 2005;96:228–234.32. Cutler NR. Pharmacokinetic studies of antipsychotics in healthy volunteers versus patients. J Clin
Psych 2001;62 Supp 5:10–13.
Kamal et al. Page 13
J Pharm Sci. Author manuscript; available in PMC 2010 August 10.
NIH
-PA Author Manuscript
NIH
-PA Author Manuscript
NIH
-PA Author Manuscript
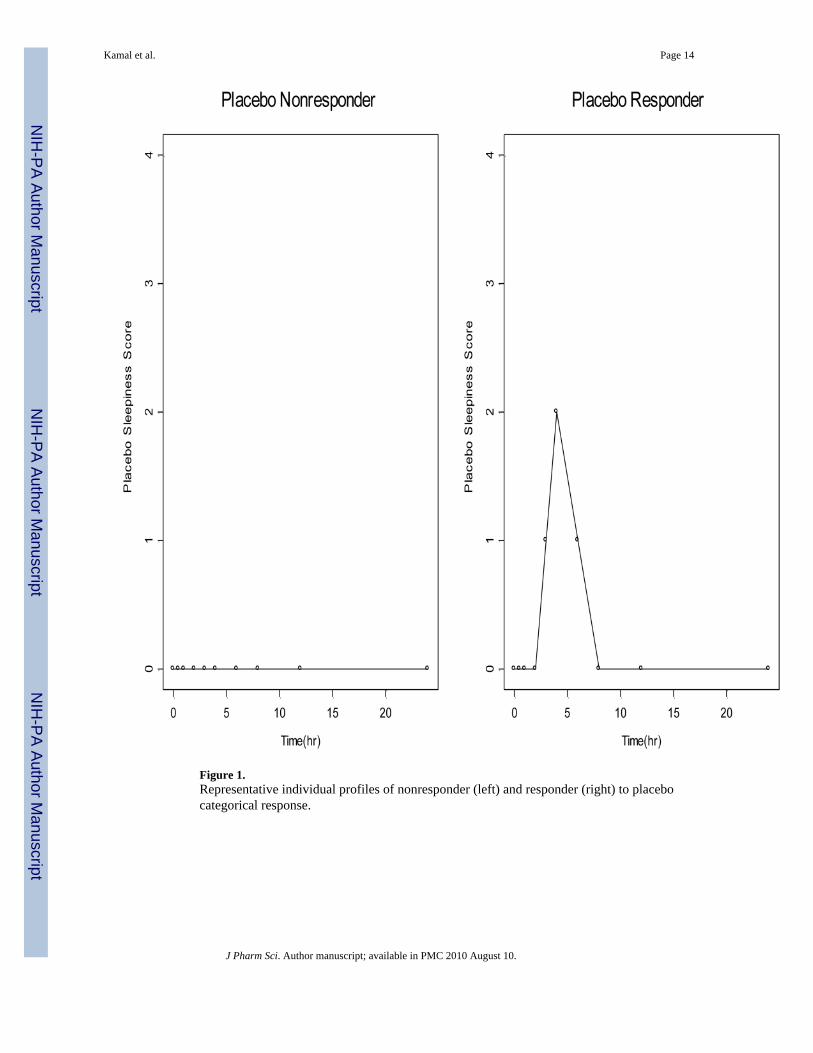
Figure 1.Representative individual profiles of nonresponder (left) and responder (right) to placebocategorical response.
Kamal et al. Page 14
J Pharm Sci. Author manuscript; available in PMC 2010 August 10.
NIH
-PA Author Manuscript
NIH
-PA Author Manuscript
NIH
-PA Author Manuscript

Figure 2.Observed individual, Observed mean ± SD, and predicted mean plasma concentrationsversus time. Error bars represent one standard deviation above and below the observed meandata.
Kamal et al. Page 15
J Pharm Sci. Author manuscript; available in PMC 2010 August 10.
NIH
-PA Author Manuscript
NIH
-PA Author Manuscript
NIH
-PA Author Manuscript
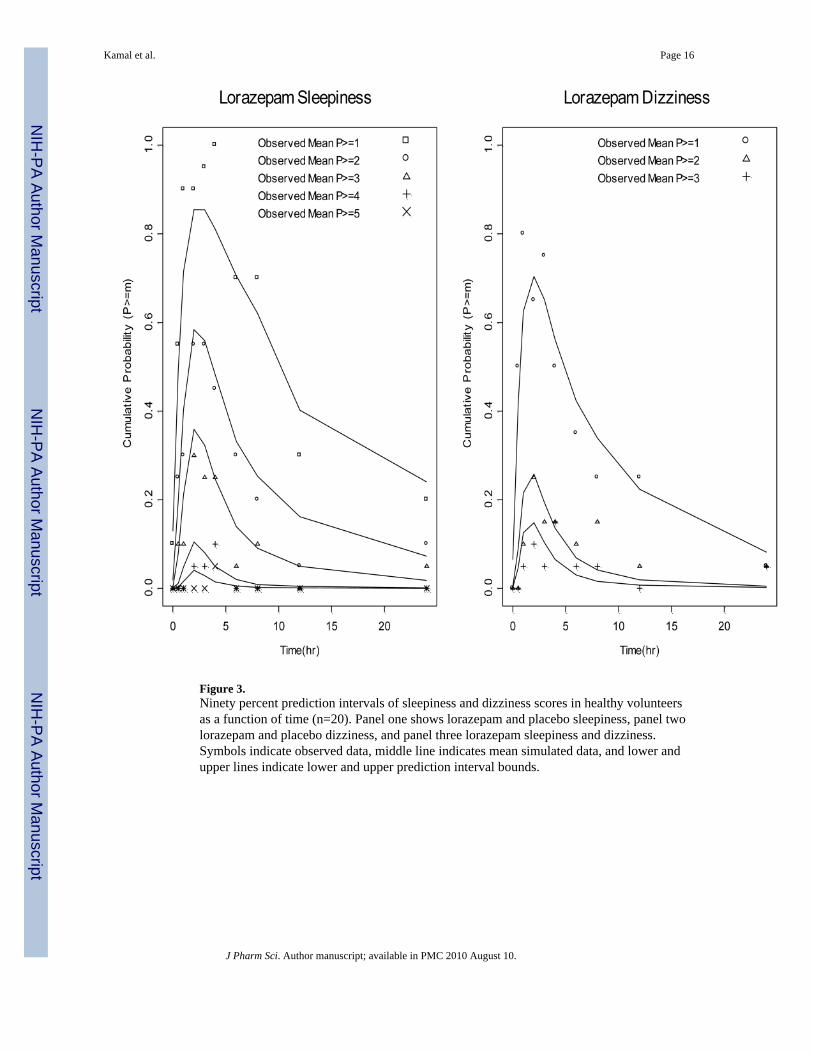
Figure 3.Ninety percent prediction intervals of sleepiness and dizziness scores in healthy volunteersas a function of time (n=20). Panel one shows lorazepam and placebo sleepiness, panel twolorazepam and placebo dizziness, and panel three lorazepam sleepiness and dizziness.Symbols indicate observed data, middle line indicates mean simulated data, and lower andupper lines indicate lower and upper prediction interval bounds.
Kamal et al. Page 16
J Pharm Sci. Author manuscript; available in PMC 2010 August 10.
NIH
-PA Author Manuscript
NIH
-PA Author Manuscript
NIH
-PA Author Manuscript
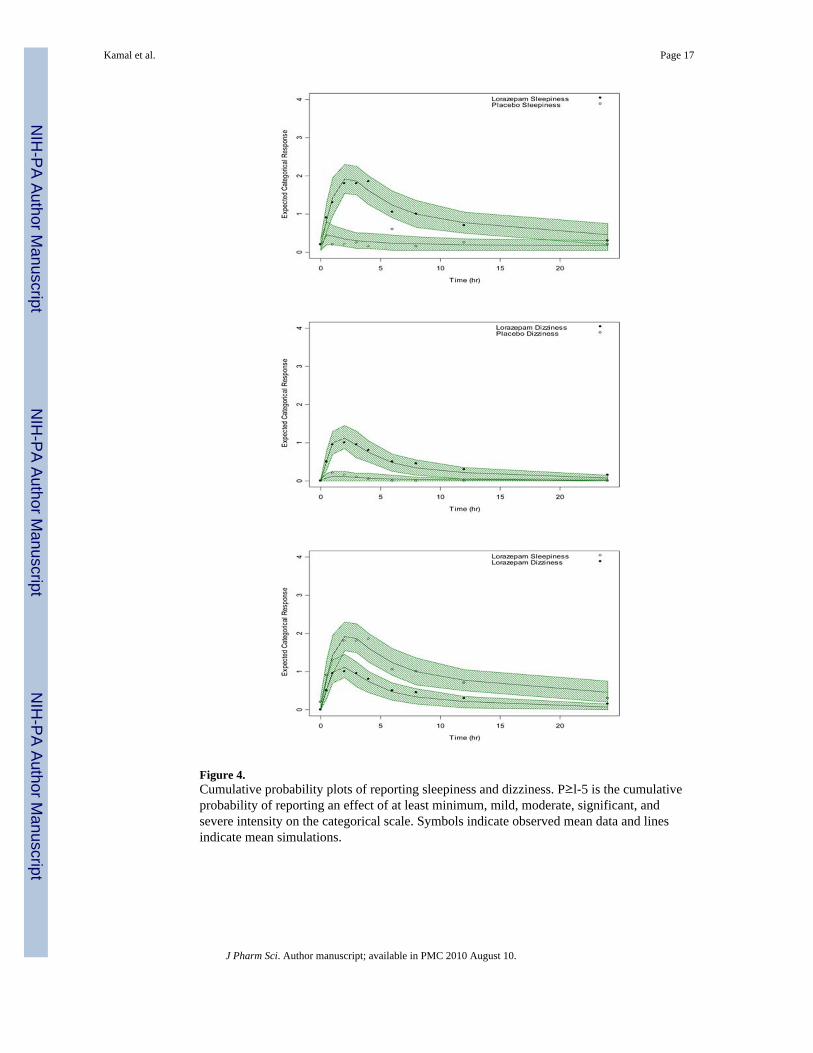
Figure 4.Cumulative probability plots of reporting sleepiness and dizziness. P≥l-5 is the cumulativeprobability of reporting an effect of at least minimum, mild, moderate, significant, andsevere intensity on the categorical scale. Symbols indicate observed mean data and linesindicate mean simulations.
Kamal et al. Page 17
J Pharm Sci. Author manuscript; available in PMC 2010 August 10.
NIH
-PA Author Manuscript
NIH
-PA Author Manuscript
NIH
-PA Author Manuscript

Figure 5.Posterior distributions of MaxS, AUEC, and the proportion reporting an AE of at least mildand moderate intensity for lorazepam sleepiness and dizziness in healthy volunteers after a 2mg oral dose of lorazepam (n=20). The vertical line in each plot indicates the mean observedvalue. MaxS is the maximum reported categorical score, AUEC is the area under the effectcurve from 0h–24h.
Kamal et al. Page 18
J Pharm Sci. Author manuscript; available in PMC 2010 August 10.
NIH
-PA Author Manuscript
NIH
-PA Author Manuscript
NIH
-PA Author Manuscript

Kamal et al. Page 19
J Pharm Sci. Author manuscript; available in PMC 2010 August 10.
NIH
-PA Author Manuscript
NIH
-PA Author Manuscript
NIH
-PA Author Manuscript
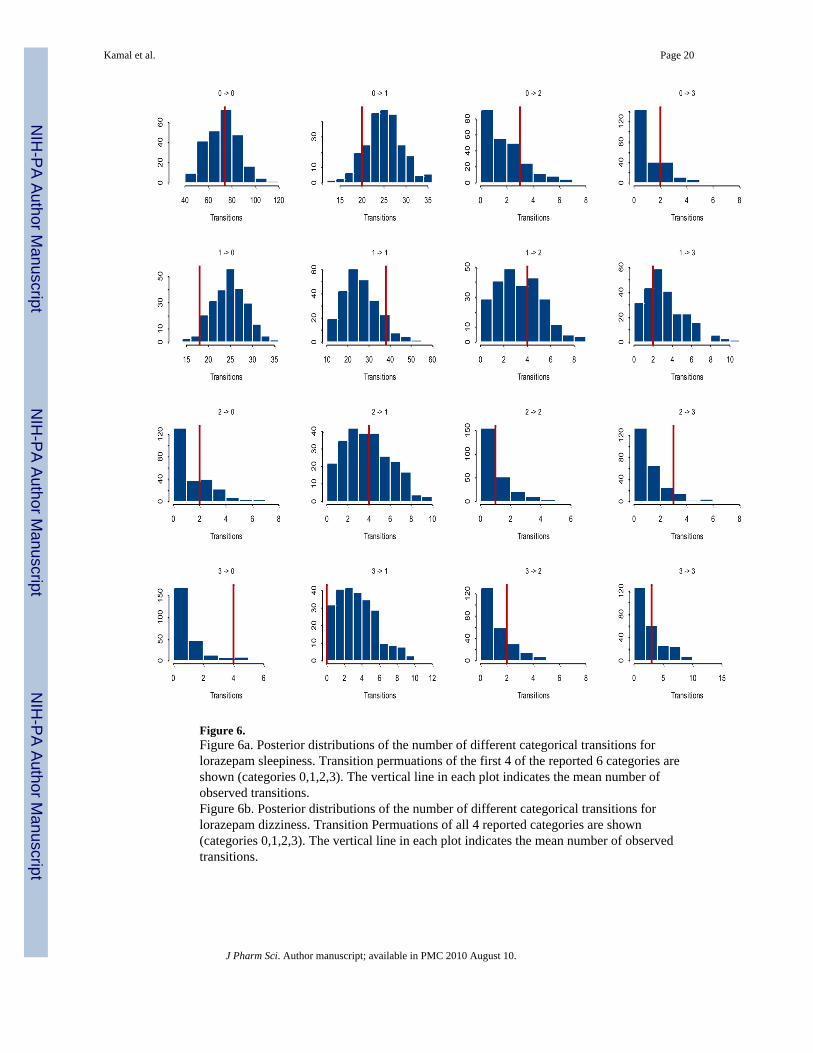
Figure 6.Figure 6a. Posterior distributions of the number of different categorical transitions forlorazepam sleepiness. Transition permuations of the first 4 of the reported 6 categories areshown (categories 0,1,2,3). The vertical line in each plot indicates the mean number ofobserved transitions.Figure 6b. Posterior distributions of the number of different categorical transitions forlorazepam dizziness. Transition Permuations of all 4 reported categories are shown(categories 0,1,2,3). The vertical line in each plot indicates the mean number of observedtransitions.
Kamal et al. Page 20
J Pharm Sci. Author manuscript; available in PMC 2010 August 10.
NIH
-PA Author Manuscript
NIH
-PA Author Manuscript
NIH
-PA Author Manuscript

Figure 7.Relationship between the probability and logistic domains.
Kamal et al. Page 21
J Pharm Sci. Author manuscript; available in PMC 2010 August 10.
NIH
-PA Author Manuscript
NIH
-PA Author Manuscript
NIH
-PA Author Manuscript

Figure 8.Upper panel: Sleepiness and dizziness scores recorded on the 7-point categorical scaleversus lorazepam concentrations. Lower panel: Sleepiness and dizziness scores recorded onthe Visual Analog Scale (VAS) versus lorazepam concentrations.
Kamal et al. Page 22
J Pharm Sci. Author manuscript; available in PMC 2010 August 10.
NIH
-PA Author Manuscript
NIH
-PA Author Manuscript
NIH
-PA Author Manuscript
NIH
-PA Author Manuscript
NIH
-PA Author Manuscript
NIH
-PA Author Manuscript
Kamal et al. Page 23
Table 1
Subject Demographics (n=20).
Parameter Mean (SD)
Gender, n
Male 5
Female 15
Race, n
White 17
Black 3
Age, y 43 (11)
Weight, kg 72 (12)
Creatinine clearance, ml/min 103 (22)
J Pharm Sci. Author manuscript; available in PMC 2010 August 10.
NIH
-PA Author Manuscript
NIH
-PA Author Manuscript
NIH
-PA Author Manuscript
Kamal et al. Page 24
Table 2
Pharmacokinetic Parameters in Healthy Volunteers after a 2 mg Oral Dose of Lorazepam (n=20).
ParameterNONMEMEstimate
NONMEM95% CI
BootstrapEstimate
Bootstrap95% CI
CL/F 4.02 (3.58, 4.46) 4.0 (3.61, 4.49)
V1/F 53.6 (48.1, 59.1) 53.3 (44.0, 59.0)
V2/F 37.6 (33.3, 41.9) 37.9 (33.4, 44.4)
Ka 1.04 (0.82, 1.26) 1.03 (0.81, 1.28)
Q 10.9 (9.0, 12.8) 11 (9.06,14.23)
Ω-CL/F 25.40% (12.1, 38.7) 24.44% (16.6, 31.18)
Ω-V1/F 9.24% (2.08, 16.4) 9.07% (2.35, 17.0)
Ω-V2/F 13.10% (3.98, 19.1) 12.00% (4.3, 18.38)
Ω-Ka 35.90% (16.4, 55.5) 34.21% (18.6, 44.4)
Residual Proportional Error 8.34% (5.54, 11.1) 8.06% (5.76, 10.7)
CL is systemic clearance, F is bioavailability, V1 is central compartment volume, V2 is peripheral compartment volume, Ka is the first order rate ofabsorption, Q is inter-compartmental clearance, and Ω is a random effects parameter estimating inter-subject variability.
J Pharm Sci. Author manuscript; available in PMC 2010 August 10.

NIH
-PA Author Manuscript
NIH
-PA Author Manuscript
NIH
-PA Author Manuscript
Kamal et al. Page 25
Tabl
e 3
Phar
mac
odyn
amic
Par
amet
ers i
n H
ealth
y V
olun
teer
s afte
r a 2
mg
Ora
l Dos
e of
Lor
azep
am o
r Pla
cebo
(n=2
0).
Lor
azep
amSl
eepi
ness
Lor
azep
amD
izzi
ness
Mod
el P
aram
eter
Non
mem
Est
imat
eN
onm
em C
IB
oots
trap
Est
imat
eB
oots
trap
CI
Non
mem
Est
imat
eN
onm
em C
IB
oots
trap
Est
imat
eB
oots
trap
CI
Base
line
Effe
ct
β1 (l
ogits
)−2.81
(−4.
0, −
1.62
)−2.83
(−4.
5, −
1.71
)−4.34
(−5.
18, −
3.5)
−4.51
(−6.
40, −
3.70
)
β2 (l
ogits
)−2.57
(−3.
27, −
1.87
)−2.58
(−3.
37, −
1.94
)−3.17
(−4.
51, −
1.83
)−3.34
(−5.
49, −
2.26
)
β3 (l
ogits
)−1.79
(−2.
37, −
1.21
)−1.84
(−2.
5, −
1.29
)−1.08
(−1.
68, −
0.48
)−1.08
(−2.
43, −
0.57
)
β4 (l
ogits
)−2.81
(−4.
02, −
1.59
)−2.86
(−4.
43, −
1.86
)N
AN
AN
AN
A
β5 (l
ogits
)−1.55
(−3.
44, 0
.34)
−1.6
(−64
.47,
−6.
1E-1
0)N
AN
AN
AN
A
Dru
g Ef
fect
SLO
PE (l
ogits
x m
l/ng)
0.21
(0.1
7, 0
.25)
0.21
(0.1
7, 0
.27)
0.19
(0.1
5, 0
.23)
0.19
(0.1
5, 0
.25)
keo
(h−
1 )2.
44(0
.40,
4.4
8)2.
59(1
.28,
16.
1)N
AN
AN
AN
A
Plac
ebo
Effe
ct
PLA
C (l
ogits
)3.
6(1
.74,
5.4
6)4.
00(1
.78,
8.1
7)4.
30(1
.65,
6.9
5)5.
53(3
.09,
13.
01)
k1 (h
−1 )
0.18
8(0
.02,
0.3
6)0.
175
(0.0
7, 0
.43)
0.11
(0.0
7, 0
.29)
0.16
(0.0
3, 1
.19)
k2 (h
−1 )
NA
NA
NA
NA
2.13
(0.1
7, 4
.09)
1.93
(0.3
7, 3
.68)
P(1)
62.8
0%(3
9.60
, 96.
00)
64.6
0%(1
4.6,
94.
9)71
.00%
(43.
00, 9
9.00
)64
.80%
(16.
36, 8
9.39
)
Rand
om E
ffect
s
Ω1
3.31
(0.3
3, 6
.29)
3.12
(0.6
0, 7
.00)
0.32
(−0.
62, 1
.25)
0.34
(0.0
1, 2
.91)
β1- β
5 ar
e in
terc
ept l
ogis
tic p
aram
eter
s des
crib
ing
the
base
line,
PLA
C is
am
plitu
de o
f pla
cebo
eff
ect,
k1 a
nd k
2 ar
e th
e fir
st o
rder
rate
s of o
nset
and
off
set o
f pla
cebo
resp
onse
, P(1
) is p
erce
ntag
e of
non
-re
spon
ders
to p
lace
bo, S
LOPE
des
crib
es th
e re
latio
nshi
p be
twee
n dr
ug e
ffec
t and
con
cent
ratio
ns, k
eo is
the
first
ord
er ra
te c
onst
ant d
escr
ibin
g la
g in
the
effe
ct c
ompa
rtmen
t com
pare
d to
lora
zepa
mco
ncen
tratio
ns in
the
cent
ral c
ompa
rtmen
t, Ω
1 is
a ra
ndom
eff
ects
par
amet
er d
escr
ibin
g in
ter-
subj
ect v
aria
bilit
y.
J Pharm Sci. Author manuscript; available in PMC 2010 August 10.
NIH
-PA Author Manuscript
NIH
-PA Author Manuscript
NIH
-PA Author Manuscript
Kamal et al. Page 26
Tabl
e 4
Rel
atio
nshi
p of
Dat
a-D
eriv
ed a
nd M
odel
-Der
ived
PD
Par
amet
ers t
o th
e La
bel I
ncid
ence
of S
leep
ines
s and
Diz
zine
ss in
Hea
lthy
Vol
unte
ers a
fter
Adm
inis
tratio
n of
a 2
mg
Ora
l Dos
e of
Lor
azep
am.
End
poin
t/Par
amet
erL
abel
Inci
denc
eA
UE
CM
axS
Max
(P≥
1)M
ax(P≥
2)M
ax(P≥
3)Sl
ope
Slee
pine
ss15
.720
.35
2.34
10.
570.
350.
21
Diz
zine
ss6.
99.
761.
450.
70.
250.
150.
19
Rat
io (S
leep
ines
s/D
izzi
ness
)2.
32.
11.
61.
52.
32.
31.
1
J Pharm Sci. Author manuscript; available in PMC 2010 August 10.
Related Documents


