A Multi-Center Study of [−2]Pro-Prostate-Specific Antigen (PSA) in Combination with PSA and Free PSA for Prostate Cancer Detection in the 2.0 to 10.0 ng/mL PSA Range William J. Catalona, MD, Alan W. Partin, MD, PhD, Martin G. Sanda, MD, John T. Wei, MD, MS, George G. Klee, MD, PhD, Chris H. Bangma, MD, PhD, Kevin M. Slawin, MD, Leonard S. Marks, MD, Stacy Loeb, MD, Dennis L. Broyles, MSHS, Sanghyuk S. Shin, MSc, Amabelle B. Cruz, MSHA, Daniel W. Chan, PhD, Lori J. Sokoll, PhD, William L. Roberts, MD, PhD, Ron H.N. van Schaik, PhD, and Isaac A. Mizrahi, PhD Department of Urology (Dr. Catalona), Northwestern University Feinberg School of Medicine Chicago, Illinois; Department of Urology (Drs Partin and Loeb) and Pathology (Drs Chan and Sokoll), Johns Hopkins University School of Medicine (Drs Partin, Loeb, Chan, and Sokoll), Baltimore, Maryland; Division of Urology, Beth Israel Deaconess Medical Center, Harvard Medical School (Dr Sanda), Boston, Massachusetts; Department of Urology, University of Michigan School of Medicine (Dr Wei), Ann Arbor, Michigan; Department of Pathology, Mayo Clinic (Dr Klee), Rochester, Minnesota; Department of Urology (Dr Bangma) and Clinical Chemistry (Dr van Schaik), Erasmus University Medical Center, Rotterdam, the Netherlands; Vanguard Urologic Institute and Texas Prostate Center (Dr Slawin), Houston, Texas; Department of Urology, University of California Los Angeles (Dr Marks), Los Angeles, California; Beckman Corresponding Author: William J. Catalona, MD, Northwestern University Feinberg School of Medicine, 675 North St Clair St, Chicago, IL 60611 ([email protected]). Presented at the Annual Meeting of the American Urological Association, San Francisco, California, June 2, 2010 * Not intended as off-label promotion of any Beckman Coulter, Inc. product. Author Contributions: Mizrahi, Broyles, Shin and Cruz had full access to all of the data in the study and take responsibility for the integrity of the data and the accuracy of the data analysis. Study concept and design: Catalona, Mizrahi, Broyles, Shin. Acquisition of the data: Catalona, Partin, Sanda, Wei, Klee, Bangma, Slawin, Marks, Broyles, Chan, Sokoll, Roberts, van Schaik, Mizrahi. Analysis and interpretation of the data: Catalona, Partin, Sanda, Klee, Slawin, Marks, Chan, Sokoll, Roberts, van Schaik, Wei, Bangma, Broyles, Shin, Cruz, Loeb, Mizrahi. An independent statistical analysis was performed by Edward F. Vonesh, PhD of the Department of Preventive Medicine, Northwestern University. Drafting of the manuscript: Catalona, Mizrahi, Broyles, Loeb. Critical revision of the manuscript for important intellectual content: Catalona, Mizrahi, Broyles, Partin, Sanda, Wei, Loeb, Bangma, van Schaik, Vonesh. Statistical analysis: Shin. Obtained funding: Catalona, Partin, Sanda, Wei, Klee, Bangma, Slawin, Marks, Chan, Sokoll, Roberts, van Schaik. Administrative, technical, or material support: Broyles, Mizrahi. Study supervision: Mizrahi and Broyles. Financial Disclosures: Neither Dr Klee nor The Mayo Clinic have received royalties of greater than the federal threshold for significant financial interest from Beckman Coulter for the licensing of a technology unrelated to this research. Dr Wei receives research grant support from Sanofi Aventis and Beckman Coulter Incorporated and is on the advisory board of Envisioneering, Inc; Dr Catalona receives research support from Beckman Coulter Incorporated, deCODE Genetics, Inc, and OHMX. Additional Contributions: We thank Alain Artus PhD, Jessica Banks, Willeke Bolle, Jerardina Bueti, Janna Chamberlin, Phillip Cooper, Claude Darte PhD, Renu Dua, Willard Dunn, Debra Elliott, Bianca Gago, MD, Marcia Goodmanson, Robin Gurganus RN, Donghui Kan MS, Joep Kurstjens, Maureen Lemens RN, Lisa Ledebuhr, Lori Lofaro, Kathleen Loveland, Jiuliu Lu, Malu Macairan MD, Leslie Mangold MS, Patricia Nunnelly, Daniel O’Brien, Kellie Paich, Mindy Rawlins, Simpa Salami MD MPH, Javed Siddiqui MS, Edward F. Vonesh PhD, Mark Wildhagen PhD, and Sara Wyness for their assistance. NIH Public Access Author Manuscript J Urol. Author manuscript; available in PMC 2011 July 21. Published in final edited form as: J Urol. 2011 May ; 185(5): 1650–1655. doi:10.1016/j.juro.2010.12.032. NIH-PA Author Manuscript NIH-PA Author Manuscript NIH-PA Author Manuscript

Welcome message from author
This document is posted to help you gain knowledge. Please leave a comment to let me know what you think about it! Share it to your friends and learn new things together.
Transcript
A Multi-Center Study of [−2]Pro-Prostate-Specific Antigen (PSA)in Combination with PSA and Free PSA for Prostate CancerDetection in the 2.0 to 10.0 ng/mL PSA Range
William J. Catalona, MD, Alan W. Partin, MD, PhD, Martin G. Sanda, MD, John T. Wei, MD,MS, George G. Klee, MD, PhD, Chris H. Bangma, MD, PhD, Kevin M. Slawin, MD, Leonard S.Marks, MD, Stacy Loeb, MD, Dennis L. Broyles, MSHS, Sanghyuk S. Shin, MSc, AmabelleB. Cruz, MSHA, Daniel W. Chan, PhD, Lori J. Sokoll, PhD, William L. Roberts, MD, PhD,Ron H.N. van Schaik, PhD, and Isaac A. Mizrahi, PhDDepartment of Urology (Dr. Catalona), Northwestern University Feinberg School of MedicineChicago, Illinois; Department of Urology (Drs Partin and Loeb) and Pathology (Drs Chan andSokoll), Johns Hopkins University School of Medicine (Drs Partin, Loeb, Chan, and Sokoll),Baltimore, Maryland; Division of Urology, Beth Israel Deaconess Medical Center, HarvardMedical School (Dr Sanda), Boston, Massachusetts; Department of Urology, University ofMichigan School of Medicine (Dr Wei), Ann Arbor, Michigan; Department of Pathology, MayoClinic (Dr Klee), Rochester, Minnesota; Department of Urology (Dr Bangma) and ClinicalChemistry (Dr van Schaik), Erasmus University Medical Center, Rotterdam, the Netherlands;Vanguard Urologic Institute and Texas Prostate Center (Dr Slawin), Houston, Texas; Departmentof Urology, University of California Los Angeles (Dr Marks), Los Angeles, California; Beckman
Corresponding Author: William J. Catalona, MD, Northwestern University Feinberg School of Medicine, 675 North St Clair St,Chicago, IL 60611 ([email protected]).Presented at the Annual Meeting of the American Urological Association, San Francisco, California, June 2, 2010*Not intended as off-label promotion of any Beckman Coulter, Inc. product.Author Contributions:Mizrahi, Broyles, Shin and Cruz had full access to all of the data in the study and take responsibility for the integrity of the data andthe accuracy of the data analysis.Study concept and design: Catalona, Mizrahi, Broyles, Shin.Acquisition of the data: Catalona, Partin, Sanda, Wei, Klee, Bangma, Slawin, Marks, Broyles, Chan, Sokoll, Roberts, van Schaik,Mizrahi.Analysis and interpretation of the data: Catalona, Partin, Sanda, Klee, Slawin, Marks, Chan, Sokoll, Roberts, van Schaik, Wei,Bangma, Broyles, Shin, Cruz, Loeb, Mizrahi. An independent statistical analysis was performed by Edward F. Vonesh, PhD ofthe Department of Preventive Medicine, Northwestern University.Drafting of the manuscript: Catalona, Mizrahi, Broyles, Loeb.Critical revision of the manuscript for important intellectual content: Catalona, Mizrahi, Broyles, Partin, Sanda, Wei, Loeb, Bangma,van Schaik, Vonesh.Statistical analysis: Shin. Obtained funding: Catalona, Partin, Sanda, Wei, Klee, Bangma, Slawin, Marks, Chan, Sokoll, Roberts, vanSchaik.Administrative, technical, or material support: Broyles, Mizrahi.Study supervision: Mizrahi and Broyles.Financial Disclosures:Neither Dr Klee nor The Mayo Clinic have received royalties of greater than the federal threshold for significant financial interestfrom Beckman Coulter for the licensing of a technology unrelated to this research. Dr Wei receives research grant support from SanofiAventis and Beckman Coulter Incorporated and is on the advisory board of Envisioneering, Inc; Dr Catalona receives research supportfrom Beckman Coulter Incorporated, deCODE Genetics, Inc, and OHMX.Additional Contributions:We thank Alain Artus PhD, Jessica Banks, Willeke Bolle, Jerardina Bueti, Janna Chamberlin, Phillip Cooper, Claude Darte PhD,Renu Dua, Willard Dunn, Debra Elliott, Bianca Gago, MD, Marcia Goodmanson, Robin Gurganus RN, Donghui Kan MS, JoepKurstjens, Maureen Lemens RN, Lisa Ledebuhr, Lori Lofaro, Kathleen Loveland, Jiuliu Lu, Malu Macairan MD, Leslie Mangold MS,Patricia Nunnelly, Daniel O’Brien, Kellie Paich, Mindy Rawlins, Simpa Salami MD MPH, Javed Siddiqui MS, Edward F. VoneshPhD, Mark Wildhagen PhD, and Sara Wyness for their assistance.
NIH Public AccessAuthor ManuscriptJ Urol. Author manuscript; available in PMC 2011 July 21.
Published in final edited form as:J Urol. 2011 May ; 185(5): 1650–1655. doi:10.1016/j.juro.2010.12.032.
NIH
-PA Author Manuscript
NIH
-PA Author Manuscript
NIH
-PA Author Manuscript

Coulter Incorporated (Dr Mizrahi, Mr Broyles, Mr Shin and Ms Cruz) Carlsbad, California; ARUPLaboratories, Department of Pathology, University of Utah (Dr Roberts), Salt Lake City, Utah.
AbstractPurpose—PSA and free PSA (fPSA) have limited specificity for detecting clinically significant,curable prostate cancer (PCa), leading to unnecessary biopsies and detection and treatment ofsome indolent tumors. [−2]proPSA (p2PSA) may improve specificity for detecting clinicallysignificant PCa. Our objective was to evaluate p2PSA, fPSA, and PSA in a mathematical formula(prostate health index [phi] = [−2]proPSA / fPSA) × PSA1/2) to enhance specificity for detectingoverall and high-grade PCa.
Materials and Methods—We enrolled 892 men in a prospective multi-institutional trial withno history of PCa, normal rectal examination, a PSA of 2–10 ng/mL, and ≥6- core prostate biopsy.We examined the relationship of serum PSA, %fPSA and phi with biopsy results. The primaryendpoints were the specificity and AUC using phi to detect overall and Gleason ≥7 prostate canceron biopsy compared with %fPSA.
Results—For the 2–10 ng/mL PSA range, at 80–95% sensitivity, the specificity and AUC(0.703) of phi exceeded those of PSA and %fPSA. Increasing phi was associated with a 4.7-foldincreased risk of PCa and 1.61-fold increased risk of Gleason ≥7 disease on biopsy. The AUC forphi (0.724) exceeded that of %fPSA (0.670) in discriminating between PCa with Gleason ≥ 4+3vs. lower grade disease or negative biopsies. Phi results were not associated with age and prostatevolume.
Conclusions—Phi may be useful in PCa screening to reduce unnecessary biopsies in men age≥50 years with PSA 2–10 ng/mL and negative DRE, with minimal loss in sensitivity.
INTRODUCTIONPSA testing was approved by the FDA using a 4.0 ng/mL cutoff for recommending prostatebiopsy. Lower cutoffs further enhance early prostate cancer (PCa) detection,1 since PSAcorrelates with the risk of overall and high-grade PCa at PSA concentrations <4 ng/mL.2However, PSA testing may be confounded by benign conditions.
The low specificity at PSA <10.0 ng/mL has created a diagnostic gray zone in which PCa isfound on biopsy in ~25% of patients. This is important, since most PCa is curable at PSA<10.0 ng/mL; whereas, PSA >10 ng/mL often portends advanced disease.3
PSA in serum is either complexed with proteins or in an unbound form called free PSA(fPSA).4 At PSA levels of 4.0–10.0 ng/mL, the ratio of fPSA to PSA (%fPSA) significantlyimproves discrimination between PCa and benign conditions.5
Different regions of the prostate contain varying proportions of fPSA isoforms, includingproPSA that is associated with PCa. [−2]proPSA (p2PSA) is the primary form in PCatissue.6–8 At PSA of 2.0–10.0 ng/mL, p2PSA further improves specificity for PCa detectionrelative to %fPSA.9–13
The utility of p2PSA at PSA <4.0 ng/mL and its relationship to PCa aggressiveness arerelevant to the PCa screening debate, including concerns about overdiagnosis andovertreatment.13–19 Preliminary evidence suggests that a higher percentage of p2PSA maybe associated with more aggressive PCa.10, 12, 13, 19
Catalona et al. Page 2
J Urol. Author manuscript; available in PMC 2011 July 21.
NIH
-PA Author Manuscript
NIH
-PA Author Manuscript
NIH
-PA Author Manuscript

Selecting thresholds for clinical use of p2PSA has received limited study. We evaluated therelationship of p2PSA** combined with fPSA and PSA in a mathematical formula calledProstate Health Index (phi) with prostate cancer detection and tumor features.
METHODSStudy Design
We conducted a multi-center, double-blind, case-control clinical trial to validate phi in the2.0–10.0 ng/mL PSA range. This formula was developed from an independent dataset,20 andis calculated as (p2PSA pg/mL / fPSA ng/mL) × (PSA ng/mL) ½. Intuitively, higher [−2]proPSA and PSA with a lower fPSA has greater likelihood of PCa. The study protocol wasapproved by the IRB of each participating institution, and all participants provided informedconsent.
Study populationWe evaluated 1372 men from October 2003 through June 2009 from 8 medical centers. Thestudy cohort included men age ≥50 years of all ethnic backgrounds who met the followingcriteria: (1) no history of PCa, (2) non-suspicious digital rectal examination (DRE) findings,(3) pre-study PSA of 1.5–11.0 ng/mL (all PSA concentrations were re-tested in the AccessHybritech assay, and only those 2–10 ng/mL were included), (4) ≥6 core biopsy within 6months of blood draw, and (5) a histologic diagnosis from prostate biopsy.
Exclusion criteria were: (1) treatment with medications that alter PSA levels or interventionssuch as transurethral resection of the prostate prior to blood draw, (2) acute prostatitis orurinary infection at blood draw, (3) a final Access Hybritech PSA value outside the 2.0–10.0ng/mL range, (4) no blood draw or biopsy at the appropriate time interval, or (5) priorandrogen-replacement therapy.
Seven men were excluded due to unevaluable tests from hemolyzed or lipemic samples orp2PSA duplicate results with >15% coefficient of variation at p2PSA concentrations ≤ 20pg/mL, for which samples could not be retested. Finally, one site enrolled only men aged55–75 years (our study enrolled men aged ≥ 50 years), and our study-specific samplestorage limit (≤ 5 years) further limited the evaluable population to men aged 62–74.Because the age distribution from this site may not be representative of the targetpopulation, we performed separate analyses excluding and including these men.
The final study population of 892 men included: (1) 121 (13.6%) prospectively enrolled, (2)743 (83.3%) prospectively enrolled under separate protocols, and (3) 28 (3.1%)retrospective samples. The study population included 706 (79.2%) initial biopsies, 159(17.8%) repeat biopsies, and 27 (3%) with unknown history of prior biopsy. Each institutionenrolled an approximately equal number of men with or without PCa, for a total of 430(48.2%) men with PCa and 462 (51.8%) without. Participants and investigators were blindedto p2PSA results, and testing sites were blinded to individual clinical information.
Test MethodsAccess Hybritech p2PSA, PSA, and fPSA assays were measured on the Beckman CoulterAccess 2 Immunoassay Analyzer***. Serum samples were collected and processed within 8hours, then stored frozen at ≤−70°C prior to testing (≤5 years from the date of blood draw),conditions that allowed accurate measurement of phi.21 Samples were tested at one of 3
**Pending FDA approval.***All trademarks are the property of their respective owners.
Catalona et al. Page 3
J Urol. Author manuscript; available in PMC 2011 July 21.
NIH
-PA Author Manuscript
NIH
-PA Author Manuscript
NIH
-PA Author Manuscript

laboratories. PSA and fPSA assays were run using one-sample replicate. The p2PSA assaywas run in duplicate (first replicate used for data analysis, consistent with the proposedproduct labeling) according to the testing protocol. Evaluation of the first replicate comparedto the mean of duplicates using Passing-Bablock regression analyses showed no difference(Spearman R=0.9985). The p2PSA assay is a two-site immunoenzymatic sandwich assayusing specific monoclonal antibodies and 6 calibrators from 0- 5000 pg/mL.
Statistical MethodsThe minimum sample size was estimated as 295 patients without cancer to detect a 10%difference in specificity between phi and % fPSA at α = 0.05 and β = 0.10. In addition, aminimum sample size of 350 cancer patients was determined to accurately estimatesensitivity at 95% with a 95% confidence interval of ± <3%. The target sample size was thenincreased to 400 participants in each group.
The primary null hypothesis was that phi has no greater specificity than %fPSA at 95%sensitivity. This hypothesis was tested using bootstrap-based receiver operatingcharacteristic (ROC) analysis.22 Briefly, 1000 datasets of benign and PCa patients weregenerated to repetitively sample the study population.23–25 Differences in the specificitybetween phi and %fPSA at 95% sensitivity were calculated for the 1000 pairs of replicatedatasets. The standard error of the difference in specificities was then estimated withadjustment for correlation between the results of the two tests. Finally, the bootstrap-estimated standard error was used to evaluate whether the difference in specificities is >0assuming normal distribution of the differences. A one-sided statistical test was performedfor this analysis. This method was also used to compare the specificities of phi and %fPSAat 90%, 85%, and 80% sensitivities.
The secondary null hypothesis was that the area under the ROC curve (AUC) for phi equalsthat of %fPSA. This hypothesis was tested by evaluating whether the difference between theestimated AUCs for the two tests equals 0 using empirical methods.26, 27 The standard errorof the difference was calculated accounting for the correlation in AUCs as appropriate forcomparison of paired data. The difference between the two estimated AUCs has been shownto have a Chi-square distribution with one degree of freedom. The AUCs for phi and %fPSAwere also estimated for each prostate volume tertile to determine whether the observed trendin AUCs differed by prostate volume.
The validity of pooling data across sites was evaluated by fitting a logistic regression modelwith cancer status as the dependent variable, with phi (dichotomized at the estimated cutofffor 95% sensitivity) and site as independent predictors including interaction terms for siteand phi. A statistically significant parameter estimates for this interaction terms wasconsidered evidence of heterogeneity in phi performance by site.
Comparisons between participant subgroups were performed using the Wilcoxon Rank-Sumtest for continuous variables and the χ2 test for categorical variables. Two-sided statisticaltests were used on all analyses except as noted above, and statistical significance wasdefined as p<0.05. All analyses were performed using SAS version 9.2 (SAS Institute, Cary,North Carolina).
Individual Patient Risk AssessmentA 25% PCa detection rate has been previously reported in men with PSA of 2.0–10.0 ng/mL.3 For this study, cancer patients were over-sampled by design, resulting in 48.2% ofstudy participants with PCa. Since the proportion of PCa was determined by design, directcalculation of PCa probability would result in inflated estimates for detecting PCa.Therefore, to obtain more accurate risk estimates for PCa, we adjusted the proportion of PCa
Catalona et al. Page 4
J Urol. Author manuscript; available in PMC 2011 July 21.
NIH
-PA Author Manuscript
NIH
-PA Author Manuscript
NIH
-PA Author Manuscript

to 25% by repetitively sampling the study population 1000 times with each replicate datasetconsisting of 462 (75%) benign and 154 (25%) cancer participants.23–25 The meanprobability of cancer in the bootstrapped datasets for each phi range was used as the pointestimate, and bootstrap-estimated standard errors were used to calculate 95% confidenceintervals. Likewise, relative risk estimates were calculated for each replicate dataset bydividing the probability of PCa in each phi range to that of phi 0–24.9. The mean relativerisk and bootstrap-estimated standard errors were used to calculate the risk estimate and95% confidence intervals. In addition, age-stratified probability estimates for PCa werecalculated to determine whether observed trends persist in all age groups.
Association of phi with Gleason ScoreAmong participants with PCa, the probability of a Gleason score ≥7 was calculated directlyfrom the proportion of participants in each phi range with Gleason score ≥7. Risk ratioswere estimated by dividing the probability of Gleason score ≥7 in each phi range to that ofphi 0–24.9. Confidence intervals were calculated using the normal approximation of thebinomial distribution. The Cochrane-Armitage test for trend was used to determine whetherincreasing phi ranges corresponds to increasing probability of PCa with Gleason score ≥7.ROC analysis was used to evaluate the clinical utility of phi in detecting PCa with Gleasonscores 4+3 or higher.
RESULTSParticipants
Table 1 shows the demographics and results for each assay. Both phi and p2PSA weresignificantly higher in PCa than controls; whereas, fPSA and %fPSA were lower in PCathan controls. Total PSA and age were comparable between groups.
Of the participants, 89.8% had ≥12-core biopsy, and 98% had ≥10 cores. Overall, 30.6%,49.9%, and 19.6% of participants were aged 50–59, 60–69 and 70–84 years, respectively.Mean age and PSA were similar across the 7 clinical sites. In addition, none of theinteraction terms in the statistical model for evaluating heterogeneity by site was significant,supporting data pooling across sites. There were no significant differences in age (P=0.123),PSA (P=0.106), p2PSA (P=0.088), %fPSA (P=0.125), or phi (P=0.848) between Caucasiansand African-Americans.
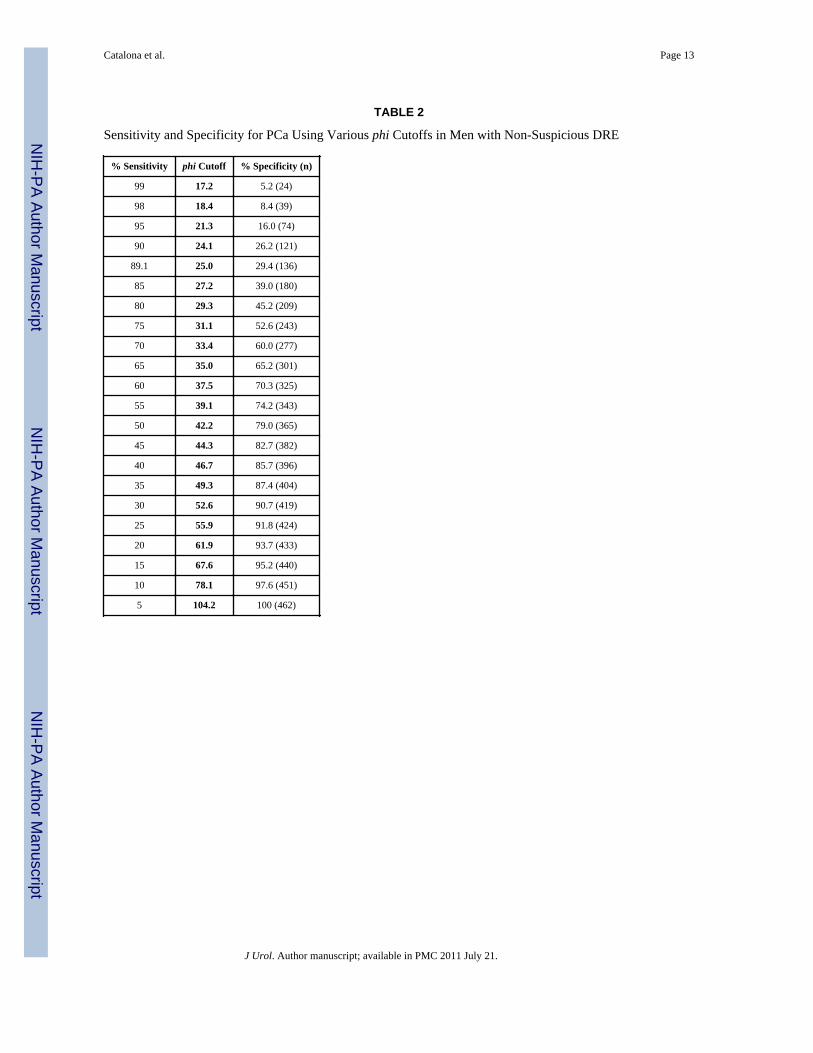
Receiver Operating Characteristic (ROC) ResultsFigure 1 shows the sensitivity and specificity for all observed PSA, fPSA, p2PSA, %fPSA,and phi cutoffs in the 2.0–10.0 ng/mL PSA range. At a given sensitivity, phi demonstratedgreater specificity than the other analytes (Table 2). At 95% sensitivity, the specificity of phiwas 16.0% compared to 8.4% for %fPSA (P=0.015), 7.6% for p2PSA, 6.5% for PSA, and3.5% for fPSA, rejecting the primary null hypothesis. Moreover, at lower sensitivities (90%,85%, and 80%) for PCa detection, the specificity of phi was significantly greater than%fPSA (i.e., unnecessary biopsies possibly avoided: 26% vs. 18%, P= 0.036; 39% vs. 28%,P= 0.006; 45% vs. 37%, P= 0.031, respectively).
The AUC for PCa detection was significantly greater for phi (AUC=0.703) than for %fPSA(0.648, P=0.004), fPSA (0.615), p2PSA (0.557), or PSA (0.525), rejecting the secondarynull hypothesis.
Individual Patient Risk AssessmentHigher phi values were associated with an increased risk of PCa detection based upon theadjusted 25% proportion of PCa cases (Table 3). Of the study population, 25%, 33%, 30%,
Catalona et al. Page 5
J Urol. Author manuscript; available in PMC 2011 July 21.
NIH
-PA Author Manuscript
NIH
-PA Author Manuscript
NIH
-PA Author Manuscript
and 13% had phi values of 0–24.9, 25.0–34.9, 35.0–54.9, and ≥ 55.0, respectively.Compared to phi < 25.0, the relative risk of PCa detection on biopsy was 1.6-, 3.0-, and 4.7-fold higher at phi values of 25.0–34.9, 35.0–54.9, and ≥ 55.0, respectively. Overall, a phi≥55.0 was associated with a 52.1% probability of PCa.
Age and Probability of PCaHigher phi values were also associated with higher bootstrapped risk estimates of PCawithin each age group. The probability (and relative risk [RR]) of PCa ranged from 10.9%(phi 0–24.9) to 53.4% (phi ≥ 55) (RR 4.9) for the 50–59 age group, 12.5% (phi 0–24.9) to54.5% (phi ≥ 55) (RR 4.4) for the 60–69 age group, and 5.8% (phi 0–24.9) to 44.8% (phi ≥55) (RR 7.7) for the > 70 age group.
Association of phi with Gleason ScorePhi also had a significant relationship with biopsy Gleason score (r=0.138, P=0.004).Among participants with PCa, biopsy Gleason score was <7 in 290 (67.6%) and ≥7 in 139(32.4%) Compared to phi < 25.0, the relative risk of Gleason ≥ 7 PCa increased to 1.08 forphi values from 25.0–34.9, 1.15 for phi values from 35.0–54.9, and 1.61 for phi ≥ 55.0. Thecorresponding proportion of cancers with a Gleason score ≥ 7 increased from 26.2% to28.2%, 30.1%, and 42.1% at phi values of 0–24.9, 25.0–34.9, 35.0–54.9, and ≥ 55.0,respectively (Cochran-Armitage test for trend, P=0.013) (Table 4). The AUC for phi (0.724)exceeded that of %fPSA (0.670) in discriminating between Gleason ≥ 4+3 vs. lowerGleason grade PCa or negative biopsies.
Relationship of TRUS volume and phiThe AUCs for phi exceeded those of %fPSA in all three prostate volume tertiles (≤38, 39–53, and ≥54cc): 1st tertile: AUC 0.693 for phi vs. 0.614 for %fPSA; 2nd tertile: 0.707 vs.0.593; 3rd tertile: 0.642 vs. 0.559.
Evaluation of Excluded ParticipantsAUCs for phi with and without the excluded site were 0.696 and 0.703, respectively.Similarly, AUCs for %fPSA were 0.634 and 0.648, respectively.
COMMENTProstate biopsy is routinely recommended for suspicious DRE results regardless of PSA.3Biopsy is also recommended using PSA thresholds ranging from 2.5 to 4.0 ng/mL.1, 2, 15
However, this has led to unnecessary biopsies and possible over-detection of somecancers.15–17 To elucidate whether phi PSA-isoform measurement can improve PCa earlydetection, we examined a large, prospective cohort to predict biopsy findings in patientswith moderate PSA elevations (2.0–10.0 ng/mL) and benign DRE findings. Such men are athigher risk of PCa (25% cancer detection rate compared with 4% in the general malepopulation aged ≥50 years).3 Our bootstrapped population was designed to mirror this 25%incidence of PCa on biopsy.
Prostate biopsy may be associated with discomfort, anxiety, and financial costs. Minorcomplications occur frequently, and major complications are possible, underscoring the needfor more specific markers to reduce unnecessary biopsies. We sought to determine the utilityof p2PSA and phi for this clinical goal.
Precursor forms of PSA have been shown to improve the accuracy of PSA for detectingPCa.5, 6, 9–12, 28, 29 Specifically, preliminary reports suggest that p2PSA may be useful atPSA concentrations from 2.0–10.0 ng/mL.6, 9–12, 28, 29 Some, but not all, studies have
Catalona et al. Page 6
J Urol. Author manuscript; available in PMC 2011 July 21.
NIH
-PA Author Manuscript
NIH
-PA Author Manuscript
NIH
-PA Author Manuscript
suggested an association between proPSA and PCa aggressiveness.10, 12, 20 Thus, p2PSAand phi are being investigated in active surveillance programs to help overtreatment ofinsignificant PCa.19, 30
Catalona et al. previously reported in the PSA range of 2.0–10.0 ng/mL, the proPSA-to-fPSA ratio (%proPSA) yielded a higher specificity than %fPSA.9 Results from a separatemulti-site study also supported the role of p2PSA, in combination with PSA and fPSA, inreducing unnecessary biopsies.12, 13
In the current study, the specificity for phi was higher than %fPSA at all pre-specifiedsensitivities, and PCa risk increased directly with increasing phi values. This suggests a rolefor phi as a patient monitoring tool, since increasing phi values reflect PCa risk.19 Forexample, at 95% sensitivity, the specificity of phi was 16.0% compared to 8.4% for %fPSA.Moreover, at lower sensitivities (90%, 85%, and 80%) for PCa detection that might bepreferred to reduce the detection of possibly “insignificant” tumors, phi had a significantlygreater specificity than %fPSA. These results were consistent across age groups, PSAconcentrations, and ethnic groups, suggesting that they are representative of the intended-usepopulation.
For individual risk assessment, the probability of PCa varied considerably based upon phivalues. For example, a man with a phi ≥ 55 (13% of the study population) had a > 52%probability of PCa and 4.7-fold increased relative risk of positive biopsy. In contrast, atapproximately 90% sensitivity, a patient with a phi < 25 had an 11% probability of PCa.
For the PCa group, higher phi values were also significantly associated with a higherpercentage of biopsy Gleason grade ≥ 7, ranging from 26% to 42% for phi concentrations <25 and ≥ 55, respectively. For the entire study population, the AUC for phi (0.724) exceededthat of %fPSA (0.670) in discriminating Gleason ≥ 4+3 PCa vs. lower Gleason grade PCa ornegative biopsies. Using a phi cutoff of 21.3 (95% sensitivity), 25% of missed cancers wereGleason score ≥7; therefore, careful surveillance is necessary. The AUCs for phi alsoexceeded those of %fPSA in all three prostate volume tertiles, suggesting that phi providesbetter discrimination of PCa from benign disease than %fPSA across the spectrum ofprostate volumes. Because phi did not differ by age and race these results suggest that phimay be applicable to a broad spectrum of men as an adjunct to predict clinically-significantPCa.
The large number of subjects in the present validation study provides confidence in the phicutoffs determined. Phi is highly effective when used in patients with moderately elevatedPSA concentrations who may be most likely to benefit from early diagnosis and curativePCa treatment. A physician might recommend biopsy for a patient with a phi ≥ 55.0 (risk =52.1%) and surveillance for some men with a phi <25.0 (risk = 11.0%). For patientsreluctant to undergo prostatic biopsy, a high phi might increase compliance with theappropriate follow-up.
We conclude that the phi measurement ([−2]proPSA / fPSA) × PSA1/2) may be useful toreduce unnecessary biopsies with improved specificity at various sensitivities for PCadetection in men age ≥50 years with PSA concentrations from 2.0–10.0 ng/mL, and negativeDRE findings.****
****Our results apply to the Access Hybritech p2PSA, PSA and fPSA assays on the Beckman Coulter Access Immunoassay Systems,as studies have shown that results differ when assays from different manufacturers or standardization are used.31
Catalona et al. Page 7
J Urol. Author manuscript; available in PMC 2011 July 21.
NIH
-PA Author Manuscript
NIH
-PA Author Manuscript
NIH
-PA Author Manuscript
AcknowledgmentsFunding/Support:
This work was funded by Beckman Coulter Incorporated, Carlsbad, California; and supported in part by theNational Institutes of Health/National Cancer Institute (NIH/NCI) Johns Hopkins Prostate SPORE Grant#P50CA58236, the Early Detection Research Network NIH/NCI Grant #U01-CA86323, and NIH/NCI U01CA86323 to Dr Partin; NIH/NCI U24 CA115102 to Dr Chan; NIH/NCI U01CA113913 to Dr Sanda; the UrologicalResearch Foundation, Northwestern-University of Chicago Prostate SPORE grant (NIH/NCI P50 CA90386-05S2),the Robert H. Lurie Comprehensive Cancer Center grant (NIH/NCI P30 CA60553), and Beckman CoulterIncorporated to Dr Catalona; the Mayo Clinic Prostate SPORE grant NIH/NCI CA091956 to Dr Klee.
Role of the Sponsor:
Funding for the study was provided by Beckman Coulter, Inc., which contributed to the design, collection andanalysis of the study data. Beckman Coulter authors and the clinical investigators jointly developed the manuscriptcontent.
REFERENCES1. Krumholtz JS, Carvalhal GF, Ramos CG, et al. Prostate-specific antigen cutoff of 2.6 ng/mL for
prostate cancer screening is associated with favorable pathologic tumor features. Urology. 2002;60:469. [PubMed: 12350486]
2. Thompson IM, Pauler DK, Goodman PJ, et al. Prevalence of prostate cancer among men with aprostate-specific antigen level < or =4.0 ng per milliliter. N Engl J Med. 2004; 350:2239. [PubMed:15163773]
3. Catalona WJ, Richie JP, Ahmann FR, et al. Comparison of digital rectal examination and serumprostate specific antigen in the early detection of prostate cancer: results of a multicenter clinicaltrial of 6,630 men. J Urol. 1994; 151:1283. [PubMed: 7512659]
4. Lilja H, Christensson A, Dahlen U, et al. Prostate-specific antigen in serum occurs predominantly incomplex with alpha 1-antichymotrypsin. Clin Chem. 1991; 37:1618. [PubMed: 1716536]
5. Catalona WJ, Partin AW, Slawin KM, et al. Use of the percentage of free prostate-specific antigento enhance differentiation of prostate cancer from benign prostatic disease: a prospectivemulticenter clinical trial. Jama. 1998; 279:1542. [PubMed: 9605898]
6. Mikolajczyk SD, Catalona WJ, Evans CL, et al. Proenzyme forms of prostate-specific antigen inserum improve the detection of prostate cancer. Clin Chem. 2004; 50:1017. [PubMed: 15054080]
7. Mikolajczyk SD, Grauer LS, Millar LS, et al. A precursor form of PSA (pPSA) is a component ofthe free PSA in prostate cancer serum. Urology. 1997; 50:710. [PubMed: 9372880]
8. Chan TY, Mikolajczyk SD, Lecksell K, et al. Immunohistochemical staining of prostate cancer withmonoclonal antibodies to the precursor of prostate-specific antigen. Urology. 2003; 62:177.[PubMed: 12837462]
9. Catalona WJ, Bartsch G, Rittenhouse HG, et al. Serum pro prostate specific antigen improves cancerdetection compared to free and complexed prostate specific antigen in men with prostate specificantigen 2 to 4 ng/ml. J Urol. 2003; 170:2181. [PubMed: 14634374]
10. Catalona WJ, Bartsch G, Rittenhouse HG, et al. Serum pro-prostate specific antigen preferentiallydetects aggressive prostate cancers in men with 2 to 4 ng/ml prostate specific antigen. J Urol.2004; 171:2239. [PubMed: 15126794]
11. Sokoll LJ, Chan DW, Mikolajczyk SD, et al. Proenzyme psa for the early detection of prostatecancer in the 2.5–4.0 ng/ml total psa range: preliminary analysis. Urology. 2003; 61:274.[PubMed: 12597929]
12. Sokoll LJ, Wang Y, Feng Z, et al. [−2]proenzyme prostate specific antigen for prostate cancerdetection: a national cancer institute early detection research network validation study. J Urol.2008; 180:539. [PubMed: 18550118]
13. Sokoll LJ, Sanda MG, Feng Z, et al. A prospective, multicenter, National Cancer Institute EarlyDetection Research Network study of [−2]proPSA: improving prostate cancer detection andcorrelating with cancer aggressiveness. Cancer Epidemiol Biomarkers Prev. 19:1193. [PubMed:20447916]
Catalona et al. Page 8
J Urol. Author manuscript; available in PMC 2011 July 21.
NIH
-PA Author Manuscript
NIH
-PA Author Manuscript
NIH
-PA Author Manuscript

14. Jemal A, Thun MJ, Ries LA, et al. Annual report to the nation on the status of cancer, 1975–2005,featuring trends in lung cancer, tobacco use, and tobacco control. J Natl Cancer Inst. 2008;100:1672. [PubMed: 19033571]
15. Schroder FH, Hugosson J, Roobol MJ, et al. Screening and prostate-cancer mortality in arandomized European study. N Engl J Med. 2009; 360:1320. [PubMed: 19297566]
16. Andriole GL, Grubb RL 3rd, Buys SS, et al. Mortality results from a randomized prostate-cancerscreening trial. N Engl J Med. 2009; 360:1310. [PubMed: 19297565]
17. Welch HG, Albertsen PC. Prostate Cancer Diagnosis and Treatment After the Introduction ofProstate-Specific Antigen Screening: 1986–2005. J Natl Cancer Inst. 2009
18. Hugosson J, Carlsson S, Aus G, et al. Mortality results from the Goteborg randomised population-based prostate-cancer screening trial. Lancet Oncol. 2010; 11:725. [PubMed: 20598634]
19. Makarov DV, Isharwal S, Sokoll LJ, et al. Pro-prostate-specific antigen measurements in serumand tissue are associated with treatment necessity among men enrolled in expectant managementfor prostate cancer. Clin Cancer Res. 2009; 15:7316. [PubMed: 19934305]
20. Jansen FH, van Schaik RH, Kurstjens J, et al. Prostate-Specific Antigen (PSA) Isoform p2PSA inCombination with Total PSA and Free PSA Improves Diagnostic Accuracy in Prostate CancerDetection. Eur Urol. 2010; 50:921. [PubMed: 20189711]
21. Semjonow A, Kopke T, Eltze E, et al. Pre-analytical in-vitro stability of [−2]proPSA in blood andserum. Clin Biochem. 43:926. [PubMed: 20450900]
22. Qin G, Hsu YS, Zhou XH. New confidence intervals for the difference between two sensitivities ata fixed level of specificity. Stat Med. 2006; 25:3487. [PubMed: 16345124]
23. Hosmer, DW.; Lemeshow, S. Applied Logistic Regression. New York, NY: John Wiley & SonsInc.; 1989.
24. Efron, B. The Jackknife, the Bootstrap, and Other Resampling Plans. Philadelphia, PA: Society forIndustrial and Applied Mathematics; 1982.
25. Efron B. Better bootstrap confidence intervals. J Am Stat Assoc:. 1993; 17126. Pepe, MS. The Statistical Evaluation of Medical Tests for Classification and Prediction. New
York, NY: Oxford University Press; 2003.27. DeLong ER, DeLong DM, Clarke-Pearson DL. Comparing the areas under two or more correlated
receiver operating characteristic curves: a nonparametric approach. Biometrics. 1988; 44:837.[PubMed: 3203132]
28. de Vries SH, Raaijmakers R, Blijenberg BG, et al. Additional use of [−2] precursor prostate-specific antigen and "benign" PSA at diagnosis in screen-detected prostate cancer. Urology. 2005;65:926. [PubMed: 15882725]
29. Naya Y, Fritsche HA, Bhadkamkar VA, et al. Evaluation of precursor prostate-specific antigenisoform ratios in the detection of prostate cancer. Urol Oncol. 2005; 23:16. [PubMed: 15885578]
30. Isharwal S, Makarov DV, Sokoll LJ, et al. Prostate Health Index and diagnostic biopsy tissue DNAcontent combination improves accuracy to predict the need for prostate cancer treatment amongmen enrolled in a proactive surveillance program. Cancer Epidemiol Biomarkers Prev. 2010 inpress.
31. Loeb S, Chan DW, Sokoll L, et al. Prostate specific antigen assay standardization bias could affectclinical decision making. J Urol. 2008; 180:1959. [PubMed: 18801532]
Catalona et al. Page 9
J Urol. Author manuscript; available in PMC 2011 July 21.
NIH
-PA Author Manuscript
NIH
-PA Author Manuscript
NIH
-PA Author Manuscript

Figure 1.PSA, fPSA, [−2]proPSA, %fPSA, and Phi ROC Curves in the 2–10 ng/mL PSA RangeSensitivity × 1-Specificity for Sequential Cutpoints
Catalona et al. Page 10
J Urol. Author manuscript; available in PMC 2011 July 21.
NIH
-PA Author Manuscript
NIH
-PA Author Manuscript
NIH
-PA Author Manuscript

NIH
-PA Author Manuscript
NIH
-PA Author Manuscript
NIH
-PA Author Manuscript
Catalona et al. Page 11
TAB
LE 1
Clin
ical
Cha
ract
eris
tics o
f the
Stu
dy P
opul
atio
n
Cha
ract
eris
ticB
enig
nN
=462
Can
cer
N=4
30p-
valu
eT
otal
N=8
92
Age
Med
ian
63.0
63.0
63.0
Mea
n ±
SD62
.6 ±
7.0
63.0
± 7
.162
.8 (7
.0)
Ran
ge50
– 8
450
– 8
450
– 8
4
0.47
7
Rac
e, n
(%)
Cau
casi
an36
1 (7
8.1)
365
(84.
9)72
6 (8
1.4)
Afr
ican
-Am
eric
an24
(5.2
)22
(5.1
)46
(5.2
)
Oth
er22
(4.8
)9
(2.1
)31
(3.5
)
Unk
now
n55
(11.
9)34
(7.9
)89
(10.
0)
0.02
5
Eth
nici
ty, n
(%)
His
pani
c14
(3.0
)6
(1.4
)20
(2.2
)
Not
His
pani
c18
7 (4
0.5)
153
(35.
6)34
0 (3
8.1)
Unk
now
n26
1 (5
6.5)
271
(63.
0)53
2 (5
9.6)
0.05
9
Pros
tate
Vol
ume
Med
ian
51.0
40.0
45.0
Mea
n ±
SD55
.1 ±
23.
244
.3 ±
19.
450
.1 ±
22.
2
Ran
ge16
– 2
0914
– 1
2014
– 2
09
<0.0
01
Prio
r B
iops
y, n
(%)
No
prio
r bi
opsy
345
(74.
7)36
1 (8
4.0)
706
(79.
2)
Prio
r bi
opsy
105
(22.
7)54
(12.
6)15
9 (1
7.8)
Unk
now
n12
(2.6
)15
(3.5
)27
(3.0
)
<0.0
01
Gle
ason
Sco
re, n
(%)
5N
ot A
pplic
able
1 (0
.2)
1 (0
.2)
628
9 (6
7.2)
289
(67.
2)
711
9 (2
7.7)
119
(27.
7)
89
(2.0
)9
(2.0
)
911
(2.6
)11
(2.6
)
J Urol. Author manuscript; available in PMC 2011 July 21.

NIH
-PA Author Manuscript
NIH
-PA Author Manuscript
NIH
-PA Author Manuscript
Catalona et al. Page 12
Cha
ract
eris
ticB
enig
nN
=462
Can
cer
N=4
30p-
valu
eT
otal
N=8
92
Unk
now
n1
(0.2
)1
(0.2
)
Not
App
licab
le
PSA
(ng/
mL
)M
edia
n5.
15.
35.
1
Mea
n ±
SD5.
3 ±
1.9
5.4
± 1.
95.
4 ±
1.9
Ran
ge2.
0 –
10.0
2.0
– 9.
82.
0 –
10.0
0.19
9
fPSA
(ng/
mL
)M
edia
n1.
00.
70.
9
Mea
n ±
SD1.
0 ±
0.5
0.9
± 0.
51.
0 ±
0.5
Ran
ge0.
1 –
4.3
0.2
– 3.
90.
1 –
4.3
<0.0
01
[−2]
proP
SA (p
g/m
L)
Med
ian
12.9
14.1
13.3
Mea
n ±
SD14
.4 ±
7.1
16.8
± 1
1.1
15.5
± 9
.3
Ran
ge2.
9 –
43.5
2.9
– 93
.52.
9 –
93.5
0.00
3
%fP
SAM
edia
n18
.815
.117
.0
Mea
n ±
SD20
.0 ±
8.0
16.4
± 7
.618
.3 ±
8.0
Ran
ge3.
1 –
53.2
3.7
– 51
.13.
1 –
53.2
<0.0
01
phi
Med
ian
30.3
42.2
34.7
Mea
n ±
SD33
.9 ±
15.
049
.2 ±
31.
341
.3 ±
25.
5
Ran
ge13
.7 –
98.
210
.2 –
325
.810
.2 –
325
.8
<0.0
01
J Urol. Author manuscript; available in PMC 2011 July 21.
NIH
-PA Author Manuscript
NIH
-PA Author Manuscript
NIH
-PA Author Manuscript
Catalona et al. Page 13
TABLE 2
Sensitivity and Specificity for PCa Using Various phi Cutoffs in Men with Non-Suspicious DRE
% Sensitivity phi Cutoff % Specificity (n)
99 17.2 5.2 (24)
98 18.4 8.4 (39)
95 21.3 16.0 (74)
90 24.1 26.2 (121)
89.1 25.0 29.4 (136)
85 27.2 39.0 (180)
80 29.3 45.2 (209)
75 31.1 52.6 (243)
70 33.4 60.0 (277)
65 35.0 65.2 (301)
60 37.5 70.3 (325)
55 39.1 74.2 (343)
50 42.2 79.0 (365)
45 44.3 82.7 (382)
40 46.7 85.7 (396)
35 49.3 87.4 (404)
30 52.6 90.7 (419)
25 55.9 91.8 (424)
20 61.9 93.7 (433)
15 67.6 95.2 (440)
10 78.1 97.6 (451)
5 104.2 100 (462)
J Urol. Author manuscript; available in PMC 2011 July 21.

NIH
-PA Author Manuscript
NIH
-PA Author Manuscript
NIH
-PA Author Manuscript
Catalona et al. Page 14
TABLE 3
Risk Assessment Probability of PCa using phi
phiRange
Probability of Cancer(95% Confidence Interval)
Relative Risk(95% Confidence Interval)
Percent ofpatients inphi range
0–24.9 11.0% (6.5% – 15.8%) 1.0 24.9%
25.0–34.9 18.1% (13.7% – 22.6%) 1.6 (1.0 – 3.1) 32.8%
35.0–54.9 32.7% (27.3% – 38.0%) 3.0 (1.9 – 5.3) 29.5%
55.0+ 52.1% (42.0% – 62.1%) 4.7 (3.0 – 8.3) 12.8%
J Urol. Author manuscript; available in PMC 2011 July 21.

NIH
-PA Author Manuscript
NIH
-PA Author Manuscript
NIH
-PA Author Manuscript
Catalona et al. Page 15
TABLE 4
Relationship of phi with Biopsy Gleason Score
Gleason Score on Biopsy
phi Range Less than 7n (%)
≥7n (%)
Risk Ratio(95% CI)
0–24.9 34 (73.9) 12 (26.1) 1.0
25.0–34.9 74 (71.8) 29 (28.2) 1.08 (0.61, 1.92)
35.0–54.9 116 (69.9) 50 (30.1) 1.15 (0.67, 1.98)
55.0+ 66 (57.9) 48 (42.1) 1.61 (0.95, 2.75)
Note: One participant excluded with missing Gleason score.Cochran-Armitage test for trend, p=0.01
J Urol. Author manuscript; available in PMC 2011 July 21.
Related Documents