FINAL REPORT Nighttime Construction: Evaluation of Worker Safety Issues Project VD-H2, FY 00/01 Report No. ITRC FR 00/01-1 Prepared by Principal Investigator David Arditi Co-Principal Investigator Jonathan Shi and Research Assistants Mehmet Ayrancioglu Dong- Eun Lee Department of Civil and Architectural Engineering Illinois Institute of Technology Chicago, Illinois February 2003 Illinois Transportation Research Center Illinois Department of Transportation

Welcome message from author
This document is posted to help you gain knowledge. Please leave a comment to let me know what you think about it! Share it to your friends and learn new things together.
Transcript

FINAL REPORT
Nighttime Construction: Evaluation ofWorker Safety Issues
Project VD-H2, FY 00/01
Report No. ITRC FR 00/01-1
Prepared by
Principal Investigator David Arditi
Co-Principal InvestigatorJonathan Shi
andResearch AssistantsMehmet Ayrancioglu
Dong-Eun Lee
Department of Civil and Architectural EngineeringIllinois Institute of Technology
Chicago, Illinois
February 2003
Illinois Transportation Research CenterIllinois Department of Transportation

ILLINOIS TRANSPORTATION RESEARCH CENTER
This research project was sponsored by the State of Illinois, acting by and through its Department ofTransportation, according to the terms of the Memorandum of Understanding established with the IllinoisTransportation Research Center. The Illinois Transportation Research Center is a joint Public-Private-University cooperative transportation research unit underwritten by the Illinois Department ofTransportation. The purpose of the Center is the conduct of research in all modes of transportation toprovide the knowledge and technology base to improve the capacity to meet the present and futuremobility needs of individuals, industry and commerce of the State of Illinois.
Research reports are published throughout the year as research projects are completed. The contents ofthese reports reflect the views of the authors who are responsible for the facts and the accuracy of the datapresented herein. The contents do not necessarily reflect the official views or policies of the IllinoisTransportation Research Center or the Illinois Department of Transportation. This report does notconstitute a standard, specification, or regulation.
Neither the United States Government nor the State of Illinois endorses products or manufacturers. Tradeor manufacturers’ names appear in the reports solely because they are considered essential to the object ofthe reports.
Illinois Transportation Research Center Members
Bradley UniversityDePaul University
Eastern Illinois UniversityIllinois Department of Transportation
Illinois Institute of TechnologyLewis University
Northern Illinois UniversityNorthwestern University
Southern Illinois University CarbondaleSouthern Illinois University Edwardsville
University of Illinois at ChicagoUniversity of Illinois at Urbana-Champaign
Western Illinois University
Reports may be obtained by writing to the administrative offices of the Illinois Transportation ResearchCenter at Southern Illinois University Edwardsville, Campus Box 1803, Edwardsville, IL 62026-1803(telephone 618-650-2972), or you may contact the Engineer of Physical Research, Illinois Department ofTransportation, at 217-782-6732.

Technical Report Documentation Page1. Report No.
ITRC FR 00/01-1
2. Government Accession No. 3. Recipient’s Catalog No.
5. Report DateFebruary 2003
4. Title and Subtitle
Nighttime Construction: Evaluation of Worker Safety Issues 6. Performing Organization Code
8. Performing Organization Report No.7. Author(s)
Principal Investigator: David ArditiCo-Principal Investigator: Jonathan ShiResearch Assistants: Mehmet Ayrancioglu and Dong-Eun Lee 10. Work Unit No. (TRAIS)
12. Contract or Grant No.
VD-H2, FY 00/01
9. Performing Organization Name and Address
Illinois Institute of TechnologyDepartment of Civil and Architectural Engineering3201 S. Dearborn StreetChicago, IL 60616 13. Type of Report and Period Covered
Final ReportAugust 2001 through February 200311. Sponsoring Agency Name and Address
Illinois Transportation Research CenterSouthern Illinois University EdwardsvilleEngineering Building, Room 3026
Edwardsville, IL 62026-1803
14. Sponsoring Agency Code
15. Supplementary Notes
16. Abstract
The objective of this research study was to identify and measure the effects of nighttime construction conditions on worker safetyand to investigate the performance of different high-visibility garments worn by construction personnel on highway projects underdifferent lighting and weather conditions. After a comprehensive review of the literature, an analysis of Illinois accident recordswas conducted to identify the type, frequency, severity, and share of accidents caused by worker visibility problems in constructionwork zones. Three surveys were administrated to IDOT operations personnel, resident engineers, and contractors involved innighttime construction to identify safety concerns on the part of these participants and to compare the results. The questionnaireinvestigated issues associated with the risk of workers being involved in accidents with the driving public and with equipmentoperating in the work zone, the efficiency of high-visibility garments, the effects of visibility problems on various critical factors,sources of high-visibility garments, fabric/material preferences, local practices, and high-visibility garment selection criteria. Acomprehensive list of manufacturers and distributors of high-visibility garments was compiled. A survey was administered toDOTs other than IDOT that make use of high-visibility garments in nighttime construction. Based on the findings of the surveys, aset of six high-visibility garments was selected for testing. The findings of a series of tests run on these six vests conducted underdifferent work, lighting, and weather conditions, indicated that the safety vest recently adopted for use by IDOT performs best.
17. Key Words
Nighttime construction, worker safety, safety garments,Accident prevention
18. Distribution Statement
No restrictions. This document is available to the public through the National Technical Information Service (NTIS), Springfield, Virginia 22161.
19. Security Classification (of this report)
Unclassified
20. Security Classification (of this page)
Unclassified
21. No. of Pages
260
22. Price
From DOT 1700.7 (8-72) Reproduction of completed page authorized

i
TABLE OF CONTENTS
Executive Summary iii Acknowledgment vi 1 Introduction 1 1.1 Research Background 1 1.2 Objectives and Scope 4 1.3 Organization of the Report 4 2 Literature Survey 6
2.1 Introduction 6 2.2 Previous Research 11
2.2.1 Worker Visibility Issues 12 2.2.2 The Implications on Project Performance Factors 13 2.2.3 Work Zone Safety Garment Studies 18
2.2.4 Illumination 24 3 Analysis of Fatal Accidents in Work Zones in Illinois 26
3.1 Introduction 26 3.2 Methodology 27
3.2.1 Data Source 27 3.2.2 Conversion of the Raw Data into a Database 27 3.2.3 Creating Accident Database Containing Construction
Work Zone Related Accidents in Illinois 31 3.3 Data Mining and Analysis 35 3.3.1 Light Conditions 37 3.3.2 Light and Weather Conditions 41
3.4 Conclusion 49 4 Methodology of the Study 50 4.1 General Approach to the Problem 50 4.2 DOT Survey Instrument 52 4.3 Site Tests 54 4.3.1 Site Operations 54 4.3.2 Office Operations 58 4.4 Site Survey Instrument 63 4.5 Evaluation of the Findings 64
ii
5 Evaluation of Safety Garment Surveys Administered to DOTs 68 5.1 Survey administered to Illinois personnel 68 5.2 Survey administered to DOTs of other states 86 5.3 Consolidated survey results 103 5.4 Conclusion 122
6 Findings and Discussion of Site Tests 125 6.1 Site Tests 125 6.1.1 Descriptive Statistics 127 6.1.2 Normalization of Luminance Values 127 6.1.3 Comparison of Vest Positions in Site Tests 128 6.1.4 Comparison of Vests’ Front Faces vs. Sides 130 6.1.5 Ranking of the Vests 130 6.2 Site Survey 135 6.3 Final Ranking 142 7 Conclusion 143 7.1 Summary and Conclusion 143 7.2 Recommendations for Future Research 145 References 146 Bibliography 146 Additional Bibliography 151 Appendices Appendix A List of Safety Garment Manufacturers and Distributors 155 Appendix B Pictures of Vests Tested 159 Appendix C IDOT Survey Instrument 163 Appendix D Other DOTs Survey Instrument 173 Appendix E Photographs from Field Tests 183 Appendix F Site Survey Instrument 190 Appendix G Mean Values for Front Faces and Sides on Four Test Sites 194 Appendix H Normalized Mean Values for Front Faces and Sides 203 Appendix I Comparison of Vest Positions in Site Tests 212 Appendix J Comparison of Vests’ Front Faces vs. Sides 237 Appendix K Significance Tests of Rankings 242

iii
Nighttime Construction: Evaluation of Worker Safety Issues
EXECUTIVE SUMMARY
Many state agencies including IDOT are shifting towards nighttime construction.
Nighttime construction mitigates the impact of construction operations on the traveling
public, shortens the duration of construction operations and reduces interruptions to
construction activities. But nighttime construction operations may be more hazardous for
both drivers and construction personnel because of visibility problems at nighttime.
In this research study, the effects of nighttime construction conditions on worker
safety were investigated by studying the statistics provided by the National Highway Traffic
Safety Administration’s Fatality Analysis Reporting System (FARS) and by seeking the
experiences of DOT personnel across the nation; the types of high-visibility garments used
by construction workers and IDOT personnel on Illinois highway projects as well as those
used in other states were surveyed; and finally, the performance of six high-visibility vests
were investigated not in a laboratory setting but on actual construction/maintenance sites that
involved different lighting, traffic, and weather conditions. Potential users’ perceptions
concerning the performance of these six safety vests were also collected by mean of a
questionnaire survey.
The study shows that safety does not seem to be any more of a problem in nighttime
than in daytime works. Most nighttime accidents involve workers struck by through traffic
inside the work area as well as workers struck by construction equipment inside the work
area. The main reason for nighttime accidents is perceived to be the condition of vehicle

iv
operators with poor lighting condition being the second most common reason. It appears that
investigating visibility issues associated with safety garments at nighttime is justified.
IDOT operations personnel, resident engineers, and contractors involved in nighttime
construction operations in Illinois within the past five years were surveyed. An additional
survey was conducted of transportation personnel in the other 49 DOTs in the nation using
the same survey instrument. Finally, a list of manufacturers and distributors of safety vests
in the U.S. was compiled. Based on the information collected, the following commonly used
six safety vests were picked for field testing:
IODT Standard Vest IDOT LED Vest Head Lite Roadstar 200 Vest Iron Horse Texas Style Vest Chami Design Washington Style Vest Safetyline Minnesota Style Vest
A field evaluation was conducted to measure the performance of the safety garments
selected. A test setup was devised and a procedure called LUMINA was developed to
electronically analyze the data collected and to produce an example movie of the tests. The
field evaluation included different lighting, weather and location conditions. A survey of
potential users of high visibility safety garments was also conducted to investigate (a) 360°
visibility, (b) conspicuity against the background, (c) the brightness of the retro-reflective
material, (d) the configuration of the vests (pockets, zipper, etc.), and (e) the overall
perceived effectiveness.
Consolidated results obtained from the field tests that measured mean luminance
values of the front faces and sides of the six safety vests and the perception of potential users
of these vests indicated that the “Head Lite Roadstar 200” vest and the “Safetyline Minnesota
Style” vest are significantly superior to the other four vests. It appears therefore that IDOT’s

v
decision to make the “Head Lite Roadstar 200” vest mandatory in future highway
construction/maintenance works performed in Illinois is justified particularly since the
information obtained in the surveys indicated that Illinois respondents are less satisfied with
the nighttime performance of the safety garments currently in use on their work areas than
respondents from other DOTs.

vi
Nighttime Construction: Evaluation of Worker Safety Issues
ACKNOWLEGMENT
The research team gratefully acknowledges the valuable input of the project
Technical Review Panel (TRP) all through the research. The project TRP was chaired by
James A. Schoenherr (IDOT Bureau of Operations) and was composed of Roger L. Driskell
(IDOT Bureau of Design and Environment), Dennis A. Huckaba (IDOT Bureau of
Operations), Randy J. Jackson (IDOT Bureau of Construction), Kevin McLaury (Federal
Highway Administration), and Mike Staggs (Federal Highway Administration). The help
received from David Lippert (IDOT) in distributing the questionnaires to departments of
transportation of other states than Illinois was very much appreciated. The contribution to
the success of the research of the many respondents to the many surveys conducted through
this research was significant. They included IDOT operations personnel, IDOT resident
engineers, contractors involved in nighttime construction, transportation personnel in other
states, and the graduate students in the Construction Engineering and Management Program
at IIT. Last but not least, the research team thanks Professors Steven Hanna and Dianne Kay
(SIUE) for their continuous support, patience and understanding relative to project
accounting and finances.

1
Nighttime Construction: Evaluation of Worker Safety Issues
1. INTRODUCTION
1.1 Research Background
Increased traffic volumes especially in urban areas are approaching the design
capacity of many facilities. Heavy traffic and congestion last all day long. Any repair,
maintenance, renovation or rehabilitation work conducted during the day on these roadways
disrupts traffic and adds to congestions and delays. That is why planning construction and
maintenance work at nighttime appears to be an attractive solution since traffic flow at night
is minimal. Many State Agencies including IDOT are shifting towards nighttime
construction. For example, Florida Department of Transportation (FDOT) has determined
that nighttime work is one major solution to the problem of traffic congestion associated with
highway maintenance (Layfield 1988).
In addition to the advantage of mitigating the impact of construction operations on the
traveling public, nighttime construction has been observed to provide other obvious
advantages, such as shortening the duration of construction operations and reduced
interruptions to construction activities. However, nighttime construction has also
disadvantages compared to daytime construction. One major disadvantage is that nighttime
construction operations may be more hazardous for both drivers and construction personnel
because of visibility problems at nighttime. Furthermore, statistics show that a higher
percentage of nighttime drivers are impaired by drugs, alcohol, fatigue, or age-related vision

2
impairments. Also, nighttime workers operate in an environment that may affect safety due
to lighting and human factors.
The research on nighttime construction is very limited. Only few studies provide a
comprehensive approach and valuable information (Ellis and Kumar 1993). It is generally
expected that nighttime construction would cost more than daytime construction due to
lighting cost, extra compensation for workers, and higher cost for materials. But Ellis and
Kumar’s (1993) studies conclude that total project cost is less for work conducted at night as
compared with work conducted during the day, but there is no significant difference between
the productivity values for daytime and nighttime projects. The main reason for the
discrepancy may be due to the limited availability of accurate information for nighttime
construction. When those studies were conducted, nighttime construction was still under
experimentation.
Highway work zone safety has been a high-priority issue for traffic engineering
professionals and has been widely studied (Wang et al. 1996, Ha and Nemeth 1995). Studies
show that crash rates in work zones are higher than those on comparable highway sections
without work zones (Pal and Sinha 1996). As nighttime construction is getting more popular
in many states, more data are becoming available to support this type of study. Research is
needed to identify and measure the effects of nighttime construction conditions on worker
visibility. Research is also needed to investigate new/innovative technologies such as high-
visibility garments and to evaluate the performance of these technologies under a variety of
typical lighting and weather conditions for typical nighttime construction operations.
While the main problem in daytime is one of conspicuity, at night luminance becomes
very important as color becomes of less importance (unless standardized to have recognition

3
meaning). Most aspects of visibility depend on providing more luminance contrast to the
observer than otherwise available. An effective means for increasing the detectability of a
construction worker at night is some form of retroreflector that has the following
characteristics: (a) is sufficiently bright as positioned on the worker to provide conspicuity or
noticeability at distances of interest, (b) provides this conspicuity from all directions whether
the worker is in motion or not (360o protection), (c) furnishes recognition clues that the
object sighted is a human being, that is a construction worker and not an inanimate object or
vehicle, (d) reveals the motion of the construction worker as much as possible but is not
totally dependent on its effect, and (e) if the high visibility materials are properly selected
and located on the construction worker, it is not always necessary to use large areas of
retroreflectivity to meet these requirements (ASTM F 923-00). This study will concentrate
on measuring the luminance of high-visibility vests used in nighttime construction.
It should be noted that a comprehens ive study has not yet been conducted in Illinois
to compare high-visibility garments being marketed by various manufacturers and being used
by various state agencies. Construction operations are severely affected by weather and
lighting conditions as well as local practices such as experience and culture of contractors
and transportation agencies. In conclusion, a comprehensive study that evaluates safety
issues in nighttime construction operations is needed in Illinois to provide IDOT with
appropriate information for making decisions conducive to better visibility of workers in
nighttime construction and therefore to fewer accidents.

4
1.2 Objectives and Scope
The objectives of this research study are:
• To measure the effects of nighttime vs. daytime construction on worker
safety.
• To survey the types of high-visibility garments used by construction workers
and IDOT personnel on Illinois highway projects as well as those used in
other states.
• To investigate the performance of different high-visibility garments worn by
construction workers on highway projects under different lighting and weather
conditions.
1.3 Organization of the Report
This research is presented in seven chapters. An introduction to the subject of worker
safety in nighttime construction, and the objectives and scope of the research are presented in
Chapter 1.
Chapter 2 covers a comprehensive review of the literature on work zone safety
garments. The implications of good safety measures on project performance factors are also
examined in this chapter.
The analysis of fatal accidents in work zones in Illinois is presented in Chapter 3.
Here, a comparison of daytime vs. nighttime accidents is conducted using d-statistical data
provided by FARS.
Chapter 4 describes the methodology used in the study.

5
Chapter 5 includes the evaluation of the safety garment surveys administered to IDOT
operation personnel, resident engineers, contractors and to departments of transportation in
states other than Illinois.
Chapter 6 reports the findings of the site measurements and of the questionnaire
surveys. In this chapter, descriptive statistics and comparison tests of the data obtained from
field measurements and site questionnaires are presented and discussed. Chapter 7 provides
the conclusion of this research.

6
Nighttime Construction: Evaluation of Worker Safety Issues
2. LITERATURE SURVEY
2.1 Introduction
Highway and street construction and/or maintenance workers are exposed to the risk
of fatality or serious non-fatal injury. More than 100 workers are killed and over 20,000 are
injured in highway and street construction sites every year (Pratt et al. 2001). Construction
worker safety issues in nighttime construction need to be considered in the context of the
visibility of safety clothing and the work zone safety conditions (Birch 1998). The best way
to improve safety is to identify potential dangerous situations and to take preventive action to
avoid the occurrences. It is feasible to eliminate the hazards that can cause accidents in
nighttime construction operations.
High-visibility safety garments serve an important role in the protection of
construction workers and personnel who operate on highway construction sites. Many
accidents are attributed to inadequate visibility and detectability of the highway construction
worker at night.
The results of an investigation about fatal accidents in highway work zones in Illinois
are reported in Chapter 3. The Illinois accident records indicate that a total of 406 fatalities
occurred in highway construction work zones in the period of 1996-2000, 207 of which
happened at nighttime (http://www.fars.nhtsa.dot.gov). By using data mining techniques,
patterns have been found in the fatalities data when these data are ana lyzed with respect to
type of fatality (workers or other victims), visibility dependent factors such as light and

7
weather conditions. Lighting is of course a crucial factor and is only indirectly incorporated
into this research since lighting is not the main focus of this research.
The Manual of Uniform Traffic Control Devices (MUTCD 2000) regulates the color
of a safety garment: "For daytime work, the flagger's vest, shirt, or jacket shall be orange,
yellow, strong yellow green or fluorescent versions of these colors." The MUTCD
recommends a minimum sight distance for workers active in nighttime operations. The 2000
revision of the Manual covers high-visibility clothing in its Chapters 6D and 6E and states
that workers exposed to traffic should be attired in bright, highly visible clothing similar to
that of flaggers.
The British standard BS EN 471 (1994) establishes minimum areas of high-visibility
material for three levels of performance: 0.8 m2, 0.5 m2, and 0.14 m2 for Class 3, Class 2, and
Class 1 respectively. Class 3 would be used for work-zone applications. The standard states
"Class 3 garments offer greater conspicuity against most urban and rural backgrounds than
Class 2 garments which in turn are significantly superior to Class 1 garments." BS EN 471
(1994) also includes specifications for the following three colors: fluorescent yellow,
fluorescent orange-red, and fluorescent red.
While the fourth standard AS/NZS 1906.4 (1997) out of AS/NZS 1906 series
published by Australian and New Zealand agencies covers high-visibility materials to be
used in the manufacture of safety garments, it does not specify a standard for high-visibility
garments themselves. The standard for high visibility garments (AS/NZS 4602 (1999) was
issued most likely based on the British Standard BS EN 471 (1994) Specification for High-
Visibility Warning Clothing, which regulates the detailed standard for high-visibility
garments. High Performance Textiles (Nov 1997) reports that an establishment at Bradford,

8
UK is equipped to undertake tests in accordance with European standards such as BS EN
ISO 105, AATCC, DIN and others to assess the conformance of high visibility clothing with
BS EN 471.
Military Specification Safety Clothing, High Visibility (MIL-S-43753C 1998)
classifies and specifies safety ensembles according to types and styles to provide high
visibility to military police required to work in areas traversed by vehicles in both day and
night conditions. It is different from other specifications in that it specifies the types and
styles of the ensemble in great detail, while other standards generally don’t specify this kind
of detail. While the requirements in the military standards are not much different from BS
EN 471 (1994), it is noteworthy that they encourage extensive quality assurance procedures,
a feature that may be of value for safety garments used in construction work zones. For
example, the separation of a piece and/or appendages of a garment is considered to be a
serious flaw especially when it happens on a construction site because of the difficulty
repairing and/or replacing the damaged garment on site.
ANSI/ISEA 107-1999 issued in June 1999 by the International Safety Equipment
Association provides guidelines for high-visibility and reflective apparel including
recommendations for the design, performance and use of vests, jackets, jumpsuits, trousers
and harnesses. The safety garments are categorized into three classes I, II, III depending on
the type of construction operation, the wearers that are involved, and the degree of exposure
to traffic on a highway. A good interpretation of the classes is presented in an article by
Bradley (2001) and on the 3M website
(http://www.international.3m.com/intl/CA/english/centres/safety/personal-
safety/standards.html).

9
The informative Appendix B (Conspicuity Classes Guideline) of the American
National Standard for High-Visibility Safety Apparel (ANSI/ISEA 107-1999) states that
several factors affect the conspicuity of safety garments, including (1) the speed of vehicle
and moving equipment, (2) the level of complexity and/or confusion of background, (3) the
level of separation of worker from work zone, (4) the level of attention scattering and/or
diverting, (5) the level of inclement weather condition, and (6) the nearness of work to
traffic. Furthermore, depending on the intermittence or continuous exposure to attention, a
different Class needs to be applied in behalf of the worker. The standard indicates that
different classes of safety garment need to be used based on the types of highway
maintenance or construction operation. The standard also addresses indirectly the
importance of the level of attention that a vehicle operator needs to pay based on the
distribution of workers in the work zone. The one thing the standard does not consider is the
side view of the garment while the front and rear visual requirements are specified. Because
the number of night projects has increased, the new ANSI/ISEA-107 standard (1999) has
supported work zone safety to encourage the usage of brighter and more visible safety
garments. Though there is no requirement for incorporating light emitting devices, long-
lasting message boards, and handheld flashers to create high-visibility, it is known that those
devices increase detectability in nighttime work zones. Though the standard could drive up
the costs for manufacturers and consumers, public benefit and improved worker safety are
expected. Although the guidelines stated in ANSI/ISEA 107-1999 are not mandatory, it is in
the worker’s interest to follow them by taking into consideration the information presented in
its Appendix B.

10
Several DOTs had developed their own standards before the ANSI/ISEA-107
standard was issued in 1999 because there was no standard that could bring consistency.
Though the ANSI/ISEA standard is a good thing because standardization is helpful to
manufacturers that are involved in mass production, reasonable localization need to be
possible to meet a specific need in different states. It should be noted that a standard could
not specify all the application details, since each construction location has its own operation
environment such as background, lighting, and location setting. As a result, localizing the
information provided by a standard need to be allowed. Furthermore, it should not be
ignored that worker safety can be ensured not only by emphasizing the need to wear high-
visibility clothing but also by incorporating high-visibility devices. Indeed, the brighter and
more visible the work equipment and devices, the more attention is drawn to the workers.
When reflective materials cannot provide sufficient illumination of the work zone, high-
visibility equipment such as traffic batons and handheld flashers need to be incorporated.
The Standard Guide to Properties of High Visibility Materials Used to Improve
Individual Safety (ASTM Designation F 923-00) was issued by the American Society for
Testing and Materials (ASTM) as a standard guideline for high-visibility clothing for
nighttime and daytime. The guide provides general principles for the enhancement of anyone
exposed to motor vehicles, including construction workers’ and airport workers’ visibility
both at night and during the day. The guide covers not only the physical principles but also
variables involved in the performance and selection of high visibility materials. Even though
the guide examines the principles, it does not set minimum standards for the properties of
high visibility materials. It describes the relation of successive aspects of visibility to
corresponding responses of the observer on perception. The four elements of visual

11
perception, which consist of detectability, conspicuity, reorganization, and localizability, are
explained in distinct sequential phases that correspond to visibility information from the
roadway.
National Institute for Occupational Safety and Health (NIOSH) presents a guideline
including high-visibility apparel and illumination of the work zone. An extensive analysis is
conducted of worker fatalities and injuries in highway work zones by comparing the accident
rates between inside and outside work zones based on data obtained from the Bureau of
Labor Statistics for the years 1992 to 1998 (Pratt et al. 2001). The study makes
recommendations to reduce accidents in construction work zones, including the use of high-
visibility garments and proper illumination among many others.
2.2 Previous Research
Retro-reflective materials are known to perform well when used in making worker
safety garments for use in nighttime operations. There are however different colors and/or
shapes that may perform better in different circumstances such as background contrast, and
location settings.
Though MIL-S-43753C (1998) allows mesh type vests to be worn by military
personnel, there are managerial difficulties associated with the use of mesh type vests in
construction operations since it is not easy to control what the workers wear under the vest
(Safety Vest Task Force 1999). Though safety devices such as barrels, cones, and barricades
surrounding the work zone can augment worker safety, they were not considered in this
research. Since workers such as flaggers that operate at the edge of the work zone are solely

12
dependent on safety clothing for their personal safety, the flagger who is to be supplied with
the most visible safety clothing was identified for testing in this research.
2.2.1 Worker Visibility Issues
The ASTM Standard Guide to Properties of High Visibility Materials Used to
Improve Individual Safety (ASTM Designation F 923-00) provides extensive information
about both daytime and nighttime visibility issues. While in daytime, with high light levels,
the moment at which an object can be detected on the road relies on visual acuity, that is, on
the ability of human vision to resolve small details, at nighttime, luminance contrast becomes
more important. Therefore, visibility at nighttime depends on providing more efficient
luminance contrast to the observer.
The main problem in daytime visibility is conspicuity caused by abundant distracting
details, visual clutter, glare, and camouflage effects. The ASTM standard states that the
problems of recognition and localization are alleviated in daytime due to the human ability of
form recognition with a relatively slight variation in size (Section 12 in ASTM Standard).
Conspicuity is best improved by providing high color or luminance contrast. Object
shape or outline contrast and highlighted motion promote conspicuity as well. High
brightness alone helps only against certain dark backgrounds and may camouflage a person
against light backgrounds. Also, according to the ASTM standard, bright-saturated colors
not normally found in the environment such as vivid blues and greens tend to stand out even
if not fluorescent, because they are not generally common in the daytime environment.
Therefore, there seem to be many issues left to explore concerning background settings. On
the other hand, a study conducted by Washington State DOT (Safety Vest Task Force 1999)

13
reports that lime-green vests tend to fade rapidly to a soft gray white color, although it gives
a very high initial visibility.
At nighttime, to increase the detectability of an object, some form of retro-reflective
material should have the following characteristics: (1) It should be sufficiently bright as
positioned on the worker to provide conspicuity or noticeability at distances of interest. (2) It
should provide this conspicuity from all directions whether the construction worker is in
motion or not (360-degree protection). The Michigan Manual of Uniform Traffic Control
Devices (revised 2001) issued by the Michigan State Advisory Committee has a full section
about 360-degree protection. (3) It should furnish recognition cues that the object sighted is
a human being, that is, a construction worker and not an inanimate road object or vehicle. (4)
It should reveal the motion of the human being as much as possible but is not totally
dependent on it for its effect. Finally, (5) If the high visibility materials are properly selected
and located on the individual, it is not always necessary to use large areas of retro-reflectivity
to meet these requirements (ASTM, Designation F 923-00 2001).
2.2.2 The implication on project performance factors
The common problems encountered during night operation are identified in Hancher
and Taylor’s (2001) studies as safety, quality, and lighting as the top three.
Hinze and Carlisle’s (1990) research reveals the important variables in nighttime
construction and the issues involved in nighttime road rehabilitation or maintenance
operations. Limited or restricted visibility is addressed as an obvious drawback of nighttime
construction. The visibility problems complicate traffic control, safety and work quality.
Shepard and Cotrell (1985) investigate nighttime construction and maintenance operation

14
practices and point out the benefits and safety issues associated with nighttime operations.
The report concludes that the keystone for success in nighttime operations is special care for
worker and driver safety.
• Accidents
Based on a nationwide statistical analysis, AASHTO (1998) indicates that work zone
fatalities occur in every functional highway classification. It also reports that reliable and
accurate work zone crash data are not presently available due to the lack of uniform reporting
procedures and addresses the necessity to facilitate uniform reporting of work zone crashes.
Awareness about worker safety in nighttime construction has been a major concern
because nighttime construction is being conducted more and more in many states in recent
years (Report 98–S-50, NY 1999) even though it is believed that nighttime construction
creates hazardous work conditions.
Though a number of references are indirectly dealing with worker safety issues in
nighttime construction, only a few studies provide valuable information directly about
worker safety issues in nighttime construction.
Birch (1998) discloses that accidents at nighttime were more severe than accidents in
daytime. This was attributed to the increased number of impaired drivers and speeding
drivers at night.
The Experience Modification Rates (EMR) and the OSHA recorded incidence rates
that are used as measures of safety, use accidents and injuries as a basis for determining
safety (Levitt and Samelson 1993). These rates give an indication of safety in general, rather
than of safety in nighttime construction and/or the performance of safety garments and vests.

15
Concerns about reduced visibility, increased traffic speeds, and the higher frequency
of drunk or sleepy drivers after dark limit the use of the nighttime construction alternative.
Limited data are available comparing safety and accident characteristics of nighttime and
daytime highway construction activities (Birch 1998).
The biennial audit report of the state of New York DOT (Report 98–S-50, NY 1999)
regarding the nighttime construction program in New York states that one of the factors to be
considered in deciding to undertake nighttime construction is the safety of both the traveling
public and the workers involved in nighttime construction, though there is not a significant
increase in accidents in nighttime operation, presumably based on the available data.
While it is difficult to assess the relative safety of nighttime construction for workers
and the traveling public in relation to daytime construction, accident rates can be a valid
indicator for assessing work-zone safety only by determining the number of accidents per
total cars passing through the work zone, per person-day worked (daytime vs. nighttime) or
per construction day/construction night.
Also, a comparison of nighttime and daytime construction activities may not be valid
because these operations take place in totally different settings. To conform to the objective
of managing traffic during highway construction, which is to provide a high level of safety
for workers and the public, a system to report and monitor the number and types of accidents
occurring in work zones is required. The biennial audit report of the state of New York DOT
(Report 98–S-50, NY 1999) addresses the necessity to develop performance indicators, such
as accident rates for vehicles and workers, to help evaluate the comparative safety of daytime
and nighttime work zones. In the annual work-zone safety inspection, standard rating sheets

16
and quality scoring goals to assess the degree to which the project meets the required safety
standards are implemented so as to force the contractors to put the work zone safety in place.
A study was conducted by as part of this research (reported in a later section) of fatal
accidents that occurred in Illinois highway work zones and it was found that there is no
indication that nighttime construction was more hazardous than daytime construction in the
study period of 1996-2001. The inclusion of the weather parameter into the study did not
change this conclusion. However, one should not interpret this information further in the
absence information about traffic volume, and number and size of projects carried out in
daytime vs. nighttime.
• Productivity
Several research studies report that the advantages and disadvantages of nighttime
construction are controversial in terms of the fact that improved productivity is expected by
reduced traffic volumes (less congestion, less interference), safer working conditions
(reduced exposure to the traveling public), cooler working conditions versus high daytime
temperatures during the summer months, and quicker material delivery cycles (no machinery
idle time), while inadequate lighting and poor visibility reduce night productivity specifically
when the traffic-control devices and lighting equipment are down. While the drawbacks are
associated with a limited number of workers and a lack of machine service and truck
availability, productivity tends to increase if enough workers and machines are available.
Nevertheless, a productivity loss is perceived in performing nighttime construction. This can
increase the costs of the work and the risk of the workforce relative to safety when adequate
lighting and visibility are not ensured (Hancher and Taylor 2001, Birch 1998, Abd Elrahman

17
and Perry 1994).
• Cost
Regarding the economic outcome of the nighttime construction alternative, Abd
Elrahman and Perry (1985) and Hinze and Carlisle (1990) state that the economic parameter
associated with roadwork can roughly be categorized into construction costs, user costs,
accident costs and maintenance costs. Related with the accident cost, Abd Elrahman and
Perry (1985) include poor visibility, inadequate lighting, and inadequate traffic control
devices to the factors affecting nighttime accident rates. While subjectively arguing that
nighttime accidents are less frequent but more severe than daytime accidents, the researchers
claim that data are limited comparing the cost of night and daytime accidents in work zones.
Hinze and Carlisle (1990) contend that it is not straightforward or appropriate to assign
accident costs to any entity, nor is it simple to predict what these costs will be whereas Ellis
and Kumar’s (1993) study shows that total program cost is less for night work even though
the results do not confirm a significant difference between the productivity values for
nighttime and daytime projects. Possibly accidents occurring in the construction work zone
will be greater in number or severity for night work because of poor visibility. On the other
hand, the reduction in traffic at night might result in a safer work area for motorists and
workers. The issue is controversial.
The governing factors that govern the nighttime vs. daytime operation are stated as
congestion and safety, since cost is directly affected by congestion level and safety.
Nighttime construction is more costly, primarily due to the added costs required for lighting.
The intensity and number of lights necessary far exceeds the amount of lighting needed for

18
daytime construction. If a construction firm has had experience in performing nighttime
construction, their equipment might be modified with lighting features, eliminating the need
for that expense. There is little in the available literature regarding cost efficient, safe, and
effective means of equipping paving machinery with special lighting. As far as safety is
concerned, it is generally agreed that reduced speeds through the construction work zone and
a well- lighted site can improve the safety of workers and drivers. The point of contention
among the respondents and the literature is how to get drivers to slow down (Hinze and
Carlisle 1990).
• Project duration and quality of project
The implications of a nighttime schedule are reviewed by Hinze and Carlisle (1990)
as they relate to traffic, cost, safety, lighting, quality, noise, worker morale, productivity,
material delivery and public awareness under different conditions of decision-making, traffic
control, quality, cost, and innovations. The report states that traffic control, safety, and
community impacts are the most important performance concerns. Both State highway
agencies and contractors state that adequate lighting is an important aspect of safety in
nighttime construction projects in addition to assuring work quality (Hinze and Carlisle
1990).
2.2.3 Work Zone Safety Garment Studies
As more nighttime operation is being undertaken, new needs have evolved relative to
safety including providing higher visibility and conspicuity of workers operating in a work
zone. Furthermore, the more operations need to be carried out in less than optimum weather
19
conditions, the more highway worker visibility issues become important. High visibility
garments have been studied in nighttime construction and maintenance operations.
Anders (2000) performed a field experiment to evaluate the influence of color and
size on the conspicuity of signs, not safety garments. Sign color combination, age, and
visibility condition were considered as independent variables. The research evaluated the
visual performance of retro-reflective objects (signs) of various color combinations. Though
the research was conducted to evaluate fluorescent sign color combinations, not safety
garments, it still gives an idea of the factors affecting the issues of visibility and conspicuity
in general.
A number of studies directly dealing with safety garments have also been conducted.
Michon et al.’s (1969) field experiment evaluated the influence of color and size on the
conspicuity of safety clothing on a 12-km track in a diverse background setting, color
combination, and complexity. Sixteen colored cardboard rectangles (white, yellow,
fluorescent yellow, fluorescent orange) were placed at different positions along the track.
Subjects were required to blow their horn when they detected the "safety garment" along the
track. The rectangles were presented to the subjects at distances of either 100 or 200 m.
Overall, Michon et al. (1969) found that fluorescent orange resulted in the lowest reaction
times followed by yellow, fluorescent yellow, and white. They found that an area of about
1,200 cm2 is a sufficient amount of fluorescent material, which is roughly equivalent to a 30-
cm-wide band around the upper part of the body.
Janson and Smith (1973; 1976) conducted two research studies sponsored by the
Michigan State Highway Commission, which dealt with safety vests. These studies evaluate
different safety vests using retro-reflective patterns for nighttime.

20
Brackett and Stuart’s (1982) and Brackett et al.’s (1985) studies conducted under the
sponsorship of the Texas Transportation Institute also deal with safety vests. These studies
as well as the one conducted by Turner et al. (1997) deal with the effectiveness of high-
visibility garments in daytime construction.
In 1990, Lesley (1995) conducted a survey dealing with the color of safety vests in
the State of Minnesota under the sponsorship of MNDOT. The results of the survey were as
follows: fluorescent yellow, 5,796; fluorescent green, 2,706; fluorescent orange, 2,23 1;
fluorescent pink, 2,017. Of 119 voters who described themselves as color blind, 115 selected
the fluorescent yellow.
Although Isler et al.’s (1997) research is conducted in the forestry industry, it is
noteworthy in that safety garment research should consider background setting.
A MNDOT’s study recommends the use of lime-yellow reflective material to enhance
safety. Also, the report suggests making the worker more identifiable as a person, to "outline
the body as completely as possible with the brightest material available.” The report states
that since motion is a factor in visibility, retroreflective, and fluorescent applications should
first be made on or near the hands and feet where motion is maximized. Gloves and boots
should be treated with reflective material, as should cuffs and sleeves. New specifications
have been built on this initial study. MNDOT has conducted research with colors and found
neon yellow was the most visible to the human eye. In 1996 new specs were written
approving neon yellow garments with orange for contrast, with workers required to wear
only a vest daytime, but both pants and tops at night. All nighttime workers are to wear
neon, but for daytime wears, workers can choose to wear the standard orange or the neon
yellow. Also, a baseball style cap or summer wear, and either a baseball cap or stocking cap

21
for winter, which has reflectivity as well as color, are other new safety garments. Initially
MNDOT worked together with safety garment maker HeadLites and 3M, which makes the
Scotchlite Reflective material used on the safety garments. The retro-reflective material
produced by 3M enhances nighttime visibility to 1,000 ft. The retro-reflectivity of the 3M
materials provides increased visibility during bad weather and in low-light conditions,
according to the manufacturer. The measurement of brightness, interpretation of ANSI/ISEA
Standards 107-1999, retro-reflective versus fluorescent, and performance in rain are
presented in the website
(http://international.3m.com/intl/CA/english/centres/safety/personal_safety/bsbse3.pdf).
With increasing work being done at night, the special hazards nighttime crews face
come into play. The MNDOT has taken a policy for designing a better performance safety
vest. MNDOT has adopted a policy under the name of “high visibility reflective clothing
required for night work” out of their research to develop safety apparels
(http://ops.fhwa.dot.gov/wz/wzguidbk/documents/hp-mn11.htm). MNDOT requires full-
length-high-visibility reflective clothing (tops and bottoms) be worn by all workers during
night work. While MNDOT began doing more nighttime construction and maintenance due
to increased traffic congestion during the day, MNDOT requires them to wear full- length
high visibility reflective clothing to increase the safety for workers at nighttime by making
the workers more visible to the motorists. The benefit expected from the policy is to make
motorists see the reflecting object is a human; they then generally tend to be more cautious
and slow down. The location and type(s) of projects where the policy is most applicable and
effective is for all nighttime construction and maintenance work
(http://www.headlitescorp.com/Page10.html).

22
Iowa DOT adapted a practice and/or policy under the name of high visibility worker
apparel to improve safety in work zones by making workers more visible in various lighting
and working conditions (http://ops.fhwa.dot.gov/wz/wzguidbk/documents/hp- ia1.htm). Iowa
DOT conducted a pilot study and tested a set of safety clothing that were worn by some of
the department's maintenance and construction workers to improve safety in work zones
(http://www.dot.state.ia.us/morgue/06239704.htm). The safety garments included a safety
vest, jacket, hat for daytime activities and high visibility pants were added for nighttime
operation. The reflective trim on the garments was designed to enhance daytime and
nighttime visibility. It made the worker visible under daytime conditions and attract attention
in poor visibility periods at dawn and dusk. The Iowa DOT has begun issuing employees a
new style fluorescent yellow-green and orange safety vest including pants and caps of the
same color and design. For uniformity, Iowa DOT has adapted those styles of apparels
developed by MNDOT. Other DOTs are following Minnesota's lead. Iowa DOT is
incorporating safety garments into their specifications.
Ca/DOT regulates high-visibility clothing for flaggers who are supposed to be nearest
the edge of a work zone to control traffic. The regulation concerns not only daytime and
nighttime condition but also color contrast in snow and fog conditions. It is remarkable that
color contrast with background is considered in this implementation. The implementation of
advanced warning is regulated in the section regarding work zone layout and flagger station
(http://www.dot.ca.gov/hq/traffops/signtech/signdel/flagging/flagging.htm).
WSDOT (Washington DOT) adopted a bill titled New Emergency Rules for Flaggers
to improve the safety of highway flaggers. It states that the permanent rules must take effect
no later than March 1, 2001. The new requirements have been written as "performance-

23
based" rules which means that the updated rules state the requirements and let the employer
decide how best to accomplish the protection. Regardless of how and what is specified in the
law, employers must achieve the intended performance. It is the responsibility of the
employer, contractor and/or project owner to ensure that flaggers have adequate warning of
objects approaching from behind the flagger
(www.wsdot.wa.gov/fossc/cons/contaa/bulletin/wkzonebulaug.pdf). WSDOT sponsored a
research study by launching a Safety Vest Task Force (1999) formed by members that
constitute some 103 years of total field experience with safety vests. The report discusses
some issues regarding fading, 360 degree reflectivity and contrasting, web-type vests, and the
lack of contrast in certain situations while lime-green color as well as red-orange are both
considered to have high visibility. The task force measured the performance of 100 sets of
vests in terms of visibility, colors, reflectivity, wearability, durability, comfort, and resistance
to fading. Visibility and reflectivity were evaluated with a rating scale format. The test of
the vest was conducted at 1,000 feet under 6 conditions, namely (1) daytime and vest is dry,
(2) daytime and vest is wet, (3) dusk and vest is dry, (4) dusk and vest is wet, (5) dark and
vest is dry, (6) dark and vest is wet. The lighting conditions, i.e., night, dusk/dawn, and day
used in the experimentation meet technically the requirements of recent standards developed
by the American Society for Testing and Materials (ASTM)
(http://www.headlitescorp.com/Page14.html).
MDOT (Michigan DOT) issued the new version of the Michigan Manual of Uniform
Traffic Control Devices - Part 6, Construction and Maintenance in January 2001. This
manual regulates worker safety considerations, high-visibility clothing for flaggers, and high-
level warning devices in Sections 6D-2, 6E-3, 6F-4, respectively. In addition, the manual

24
designates three different fluorescent colors or combinations of them and retro-reflective
materials for safety garments; it also regulates in section 6E-1 the design of the garment so
that the safety garment can be seen through the full range (360 degrees) of body motion.
2.2.4 Illumination
Lighting is a crucial element of any night project since it affects quality, productivity,
and safety directly. Adequate lighting not only may make construction operations as good as
by day but also affects visibility positively (Abd Elrahman and Perry 1985). Ellis and
Herbsman’s (1996) illumination guidelines for nighttime construction and maintenance in
highways can be used for testing the performance of safety garments. The research provides
preliminary illumination guidelines for nighttime construction and maintenance in highways.
The guidelines identify the types of light sources and the minimum and maximum levels of
illumination required depending on the type of nighttime operation. The guidelines address
visibility requirements, lighting equipment, lighting configuration and arrangement, lighting
system design, system operation and maintenance, and economic considerations.
The most common nighttime construction operations are identified by by Ellis and
Herbsman (1996) and the common nighttime maintenance activities are categorized as
sweeping and cleanup, concrete pavement repair, bridge deck rehabilitation and maintenance,
resurfacing, milling and surface removal, lighting system repair, traffic signal maintenance,
marking and stripe painting, surface treatment, and barrier walls.
For effective highway construction lighting design, three illumination categories are
proposed as Categories I, II, and III that require average illumination levels of 54, 108, and
215 lux (5, 10, and 20 foot-candles), respectively (Ellis and Amos 1995). Category I is
25
recommended for general illumination in the work zone and areas where crew movement
takes place. Category II is recommended for illumination on and around construction
equipment. Category III is recommended for tasks that require increased attention. The
research presents the correlations among the category rank, the minimum luminance level,
area of illumination, size of visual task, accuracy, and contrast required for caution and
attention. It then concludes that highway maintenance operations need to get special
attention in behalf of nighttime worker safety because of the fact that those operations that
belong to category III including crack filling, pothole filling, signalization or similar work
require extreme caution and attention. The more worker segregations are performed in the
work zone, the higher level of illumination and awareness is required.
26
Nighttime Construction: Evaluation of Worker Safety Issues
3. ANALYSIS OF FATAL ACCIDENTS IN WORK ZONES IN ILLINOIS
3.1 Introduction
The first study addressing differences between daytime and nighttime construction
was conducted in Colorado back in 1986 (Price 1986). Comparing the quality and cost of
daytime and nighttime projects, Price (1986) concludes that the material delivery was more
efficient due to less traffic but temperature extremes could have an adverse effect on crew
and equipment performance. Hinze and Carlisle (1990) examined the factors related to
nighttime construction. Ellis and Kumar (1993) investigated differences in cost and
productivity between daytime and nighttime construction in Florida. They found that there is
no significant difference in productivity, but that nighttime projects cost less. Researchers
have also noticed the potential adverse effect of nighttime construction on quality (Price
1986, Hinze and Carlisle 1990). Dunston et al (2000) presented the weekend closure strategy
and its implementation in an actual project in Washington State. Their findings include
improved quality and productivity over nighttime construction. Ellis and Amos (1996)
developed work zone lighting standards for nighttime highway work. Many articles were
found on work zone safety issues. Wang et al (1996) investigated highway work zone
crashes by using the electronic data obtained from the multistate Highway Safety Information
System (HSIS). Pal and Sinha (1996) studied various lane closure strategies. Shibuya et al
(1996) presented traffic control measures at flagger-operated work zones on two-lane roads.
However, there has been no specific research comparing the effect of daytime and nighttime
construction on work zone safety.

27
3.2 Methodology
3.2.1 Data Source
The raw data of fatal accidents has been downloaded as a fat file from the FTP site in
Web-Based Encyclopedia of Fatality Analysis Reporting System (FARS) that is serviced by
the National Highway Traffic Safety Administration (NHTSA: http://www-
fars.nhtsa.dot.gov). FARS is a collection of files documenting all qualifying fatal crashes
since 1975 that occurred within the 50 states, the District of Columbia, and Puerto Rico. The
reference provided by FARS has been used in conducting accident research on highway
construction sites at nighttime.
3.2.2 Conversion of the Raw Data into a Database
Since the web application serviced by NHTSA does not allow complex queries for
the retrieval and analysis fatal crash information under specific conditions such as fatal
accidents that are construction work zone related and that occur at nighttime, the fat file had
to be downloaded in its original format with file_Name.dbf (Accbac__.dbf, Accident__.dbf,
Perbac__.dbf, Person__.dbf, and Vehicle__.dbf) and converted into a database file
(Accident.mdb) as presented in Figure 3.1. The instructions of the USERGUIDE.asc file in
the FARS-DOC directory of the FTP site (ftp://www.nhtsa.dot.gov/FARS) were carefully
followed in transferring the raw data to a new database file.

28
Figure 3.1 The tables in the Accident Database (Accident.mdb)
The accident database Accident.mdb was designed in such a way as to include the
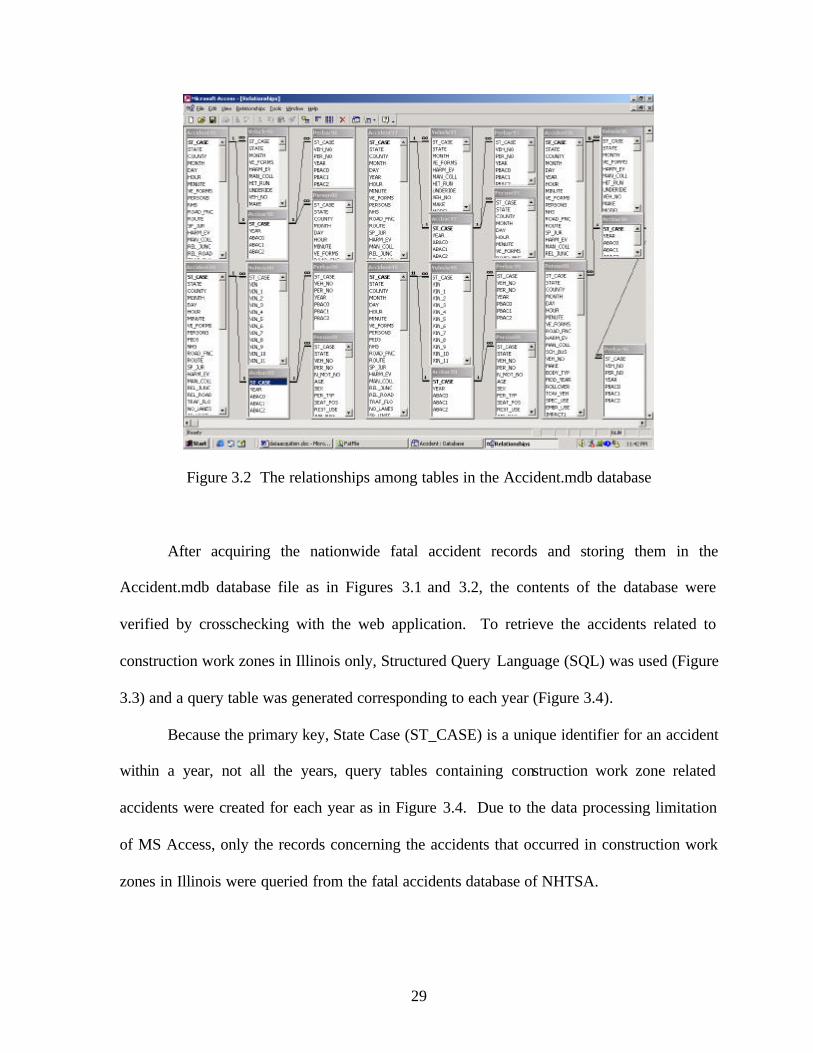
proper relationships among tables, as displayed in Figure 3.2. All the entities and
relationships were identified and designed based on the description of the variables in the
USERGUIDE.asc file. The primary key was identified as the State Case (ST_CASE: which
can be found in A-36, V-58, P-59 in the USERGUIDE), which is a variable in each Accident,
Vehicle, and Person record. It is a combination of the GSA state code and an assigned
consecutive number. It is a unique identifier for a crash within the year. It is used as the key,
when any two of these files, from the same year, are merged. This variable is stored as a
numeric variable of six characters, where the first two characters represent the state code, and
the next four characters are the case number, with leading zeros if necessary. The referential
integrity of the database was verified by eliminating anomalies.
29
Figure 3.2 The relationships among tables in the Accident.mdb database
After acquiring the nationwide fatal accident records and storing them in the
Accident.mdb database file as in Figures 3.1 and 3.2, the contents of the database were
verified by crosschecking with the web application. To retrieve the accidents related to
construction work zones in Illinois only, Structured Query Language (SQL) was used (Figure
3.3) and a query table was generated corresponding to each year (Figure 3.4).
Because the primary key, State Case (ST_CASE) is a unique identifier for an accident
within a year, not all the years, query tables containing construction work zone related
accidents were created for each year as in Figure 3.4. Due to the data processing limitation
of MS Access, only the records concerning the accidents that occurred in construction work
zones in Illinois were queried from the fatal accidents database of NHTSA.

30
Figure 3.3 A SQL program for querying construction work zone accidents in a year
Figure 3.4 Query tables retaining construction work zone related accidents

31
3.2.3 Creating Accidents Database containing construction work zone related
accidents in Illinois.
To augment the efficiency of data analysis, all the query tables in Figure 3.4 were
joined together using the primary key State Case (ST_CASE) and Year. As a result, a new
table was created, which contains the raw data regarding only accidents that occurred in
construction work zones in Illinois (Figure 3.5). The total number of accidents in the 5-year
period 1996-2000 is 132. Exactly the same result could be obtained from the web application
of NHTSA. All the subsequent data analysis was based on this table.
Figure 3.5 Accidents table containing construction work zone related accidents in Illinois

32
To identify the type, frequency, severity, and share of accidents involving
construction workers in a construction work zone in Illinois, an SQL program was designed
and a query table was generated corresponding to each condition such as in Figure 3.6. All
the variables presented in Table 3.1 were identified and the variables affecting the conditions
were used in the queries presented in Figures 3.7, 3.8, and 3.9.
Figure 3.6 Query tables

33
Table 3.1 Description of variables used in the ConstWorkZoneAccident table
Variable Description of variables
ST_CASE (1980 and later)
• This variable is in each Accident, Vehicle and Person record. It is a combination of the GSA state code and an assigned consecutive number. It is a unique identifier for the Crash within the year. It is used as the key, when any two of these files from the same year, are merged. This variable is stored as a numeric variable of six characters; the first two characters are the state code, and the next four characters are case number, with leading zeros if necessary.
YEAR (1975 and later)
• The year in which the crash took place.
STATE
• GSA state codes except for 43, Puerto Rico - This is the state in which the crash occurred. The state in which the vehicle(s) is (are) registered, REG_STAT, is found in the vehicle file, the coding is the same.
17 Illinois
C_M_ZONE (1982 and later)
• The variable identifies crashes that occurred in a construction or maintenance zone. Use of the codes does not imply that the crash was caused by the construction or maintenance activity or zone.
0. None 1. Construction 2. Maintenance 3. Utility 4. Work Zone, Type Unknown
LGT_COND
1 Daylight 2 Dark 3 Dark but lighted 4 Dawn 5 Dusk 9 Unknown
WEATHER (1982 and later)
1 No Adverse Atmospheric Conditions 2 Rain 3 Sleet 4 Snow 5 Fog 6 Rain and Fog 7 Sleet and Fog 8 Other: Smog, Smoke, Blowing Sand or Dust 9 Unknown
PERSONS • The number of persons involved in the crash except for uninjured bus and
train passengers. A form describing all other persons involved in a crash, will be filed, i.e., this variable is a count of the persons in the crash.
PEDS (1991 and later)
• Number of non-motorists, i.e., any person(s) who is (are) not an occupant of a motor vehicle in transport.

34
Figure 3.7 SQL program for querying accident information by light conditions
Figure 3.8 SQL program for querying accident information by light and weather conditions

35
Figure 3.9 SQL program for querying accident information by light conditions
3.3 Data Mining and Analysis
By executing the queries, the number of fatal accidents, the number of persons killed, and the
number of workers killed were calculated and are presented in Table 3.2 and plotted in
Figure 3.10. The data show that there has been a drastic increase in the number of fatal
accidents and in the number of fatalities in construction zones in the state of Illinois in the
year 2000 while there had been a decreasing trend in the years 1996 through 1999. The main
reasons contributing to the sudden change in the decreasing trend is not known. The reasons
could include more construction work and/or maintenance, improved accident reporting
system, increased traffic volumes, or deterioration of safety procedures in highway
construction sites in the year 2000.

36
Table 3.2 Number of fatal accidents, persons killed, and workers killed in construction work zones in Illinois
Numbers by Year Years
Fatal Accidents Persons Killed Workers Killed 1996 26 74 11 1997 31 99 7 1998 18 74 3 1999 15 39 2 2000 42 120 11
Five-Year Totals 132 406 34
2631
18 15
42
74
99
74
39
120
117
3 211
0
20
40
60
80
100
120
140
1996 1997 1998 1999 2000
Fatal Accidents Persons Killed Workers Killed
Figure 3.10 Number of fatal accidents, persons killed, and workers killed in construction work zones in Illinois

37
3.3.1 Light Conditions
FARS classifies light conditions at the time of the accident in six groups, namely (1)
Day, (2) Dark, (3) Dark but lighted, (4) Dawn, (5) Dusk, and (9) Unknown (see Table 3.1).
Classification (9) Unknown was not reported in any accident that occurred in the five-year
study period of 1996-2000; that is why (9) Unknown has not been considered in the analyses.
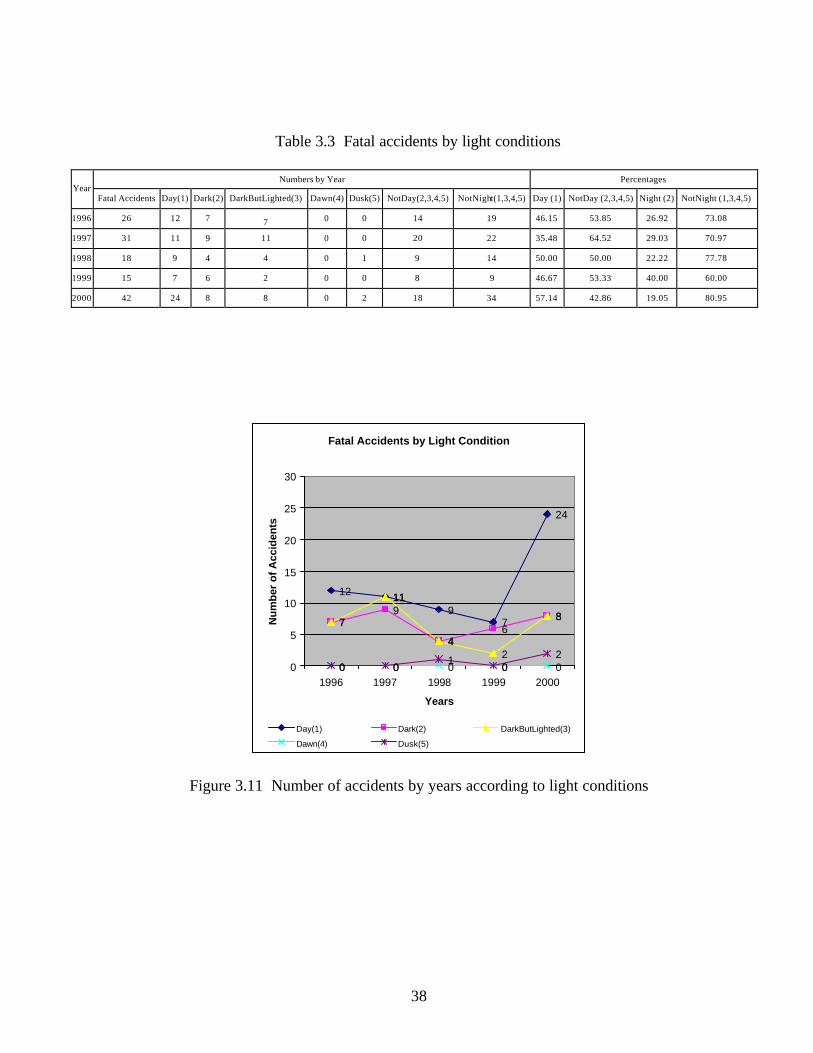
The numbers of fatal accidents in highway work zones in Illinois are presented by light
conditions in Table 3.3 and Figure 3.11. The drastic increase in daytime accidents in the year
2000 is also visible in Table 3.3 and Figure 3.11, irrespective of light conditions.
Two analyses were conducted using these classifications. One analysis involved a
comparison of accidents that occurred during the day (including only Classification 1) with
accidents that occurred at any other time (including Classifications 2, 3, 4, and 5). These two
groups were called Day and NotDay, respectively. The other analysis involved a comparison
of accidents that occurred at night (including only Classification 2) with accidents that
occurred at any other time (including Classifications 1, 3, 4, and 5). These two groups were
called Night and NotNight, respectively. The outcomes of these two analyses are reported in
Figures 3.12 and 3.13. In both analyses, it is possible to observe that work zones are
becoming safer at nighttime compared to daytime.
When the numbers of fatalities are analyzed in terms of persons killed (including
workers, other pedestrians, drivers, operators, etc.) and workers killed (excluding any other
persons), the same observation that work zones are becoming safer at nighttime compared to
daytime, can be made. Indeed, Table 3.4 and Figure 3.14 show the number of persons killed
in highway work zone accidents in Illinois arranged by light conditions.
38
Table 3.3 Fatal accidents by light conditions
Numbers by Year Percentages Year
Fatal Accidents Day(1) Dark(2) DarkButLighted(3) Dawn(4) Dusk(5) NotDay(2,3,4,5) NotNight(1,3,4,5) Day (1) NotDay (2,3,4,5) Night (2) NotNight (1,3,4,5)
1996 26 12 7 7 0 0 14 19 46.15 53.85 26.92 73.08
1997 31 11 9 11 0 0 20 22 35.48 64.52 29.03 70.97
1998 18 9 4 4 0 1 9 14 50.00 50.00 22.22 77.78
1999 15 7 6 2 0 0 8 9 46.67 53.33 40.00 60.00
2000 42 24 8 8 0 2 18 34 57.14 42.86 19.05 80.95
Fatal Accidents by Light Condition
12 119
7
24
79
46
87
11
42
8
0 0 0 0 00 01
02
0
5
10
15
20
25
30
1996 1997 1998 1999 2000
Years
Nu
mb
er o
f A
ccid
ents
Day(1) Dark(2) DarkButLighted(3)
Dawn(4) Dusk(5)
Figure 3.11 Number of accidents by years according to light conditions

39
Relative Fatialities (in Percentage) Day (1) vs NotDay (2,3,4,5)
46.15
35.48
50.0046.67
57.1453.85
64.52
50.0053.33
42.86
0.00
10.00
20.00
30.00
40.00
50.00
60.00
70.00
1996 1997 1998 1999 2000
Years
Per
cent
age
Day (1) NotDay (2,3,4,5)
Figure 3.12 Relative fatalities in percentage of accidents (Day (1) vs. NotDay (2,3,4,5))
Relative Fatialities (in Percentage) Night (2) vs NotNight (1,3,4,5)
26.92 29.0322.22
40.00
19.05
73.08 70.9777.78
60.00
80.95
0.00
10.00
20.00
30.00
40.00
50.00
60.00
70.00
80.00
90.00
1996 1997 1998 1999 2000
years
Per
cent
age
Night (2) NotNight (1,3,4,5)
Figure 3.13 Relative fatalities in percentage of accidents (Night (2) vs. NotNight (1,3,4,5))

40
Table 3.4 Fatalities (in number of persons killed) by light conditions
Fatialities (in number of persons Killed) by Light Condition
3733 36
23
70
11
40
23
12
2526 26
13
4
17
0 0 0 0 00 0 2 0
8
0
10
20
30
40
50
60
70
80
1996 1997 1998 1999 2000
Years
Nu
mb
er o
f P
erso
ns
Day(1) Dark(2) DarkButLighted(3)
Dawn(4) Dusk(5)
Figure 3.14 Number of persons killed by years according to light conditions
Numbers by Year Percentages Year
Persons KilledDay(1) Dark(2)DarkButLighted(3)Dawn(4)Dusk(5)NotDay(2,3,4,5) NotNight(1,3,4,5)Day (1) NotDay (2,3,4,5)Night (2) NotNight (1,3,4,5)
1996 74 37 11 26 0 0 37 63 50.00 50.00 14.86 85.14
1997 99 33 40 26 0 0 66 59 33.33 66.67 40.40 59.60
1998 74 36 23 13 0 2 38 51 48.65 51.35 31.08 68.92
1999 39 23 12 4 0 0 16 27 58.97 41.03 30.77 69.23
2000 120 70 25 17 0 8 50 95 58.33 41.67 20.83 79.17

41
Figures 3.15 and 3.16 look at the differences between Day and NotDay, and between
Night and NotNight, respectively. On the other hand, Table 3.5 and Figure 3.17 show the
number of workers killed in highway work zone accidents in Illinois presented by light
conditions. Figures 3.18 and 3.19 look at the differences between Day and NotDay, and
between Night and NotNight, respectively. The trend in all cases is clear.
3.3.2 Light and Weather Conditions
FARS classifies weather conditions at the time of the accident in nine groups, namely
(1) No adverse atmospheric conditions, (2) Rain, (3) Sleet, (4) Snow, (5) Fog, (6) Rain and
fog, (7) Sleet and fog, (8) Other: smog, smoke, blowing sand or dust, and (9) Unknown.
Classification (9) Unknown was not reported in any accident that occurred in the five-year
study period of 1996-2000; that is why (9) Unknown has not been considered in the analyses.
The FARS weather classifications were used to create two groups: Dry (including
only Classification 1) and Wet (including all other classifications). The effects of dry or wet
conditions on work zone accidents were then analyzed by taking into consideration the two
sets of light conditions generated in the previous section (i.e., Day vs. NotDay, and Night vs.
NotNight). Accident data are reported by dry and wet conditions for Day vs. NotDay
conditions in Table 3.6 and Figures 3.20, 3.21, and 3.22; accident data are also reported by
dry and wet conditions for Night vs. NotNight conditions in Table 3.7 and Figures 3.23, 3.24,
and 3.25. In all tables and figures, it is observed that the number of fatal accidents, the
number of persons killed in these accidents, and the number of workers killed in these
accidents are getting larger over the years under dry daytime conditions.

42
Figure 3.15 Relative fatalities (in percentage of persons killed) (Day (1) vs. NotDay (2,3,4,5))
Relative Fatialities (in Percentage) Night (2) vs NotNight (1,3,4,5)
14.86
40.40
31.08 30.77
20.83
85.14
59.60
68.92 69.23
79.17
0.00
10.00
20.00
30.00
40.00
50.00
60.00
70.00
80.00
90.00
1996 1997 1998 1999 2000
Years
Per
cent
age
Night (2) NotNight (1,3,4,5)
Figure 3.16 Relative fatalities (in percentage of persons killed) (Night (2) vs. NotNight (1,3,4,5))
Relative Fatialities (in Percentage) Day (1) vs NotDay (2,3,4,5)
50.00
33.33
48.65
58.97 58.33
50.00
66.67
51.35
41.03 41.67
0.00
10.00
20.00
30.00
40.00
50.00
60.00
70.00
1996 1997 1998 1999 2000
Years
Per
cent
age
Day (1) NotDay (2,3,4,5)

43
Table 3.5 Fatalities (in number of workers killed) by light conditions
Numbers by Year Percentages Year
Workers KilledDay(1)Dark(2)DarkButLighted(3)Dawn(4)Dusk(5)NotDay(2,3,4,5)NotNight(1,3,4,5)Day (1)NotDay (2,3,4,5)Night (2)NotNight (1,3,4,5)
1996 11 3 0 8 0 0 8 11 27.27 72.73 0.00 100.00
1997 7 1 1 5 0 0 6 6 14.29 85.71 14.29 85.71
1998 3 2 0 1 0 0 1 3 66.67 33.33 0.00 100.00
1999 2 2 0 0 0 0 0 2 100.00 0.00 0.00 100.00
2000 11 9 1 1 0 0 2 10 81.82 18.18 9.09 90.91
Fatialities (in number of workers Killed) by Light Condition
3
1
2 2
9
0
1
0 0
1
8
5
1
0
1
0 0 0 0 00 0 0 0 00
1
2
3
4
5
6
7
8
9
10
1996 1997 1998 1999 2000
Years
Nu
mb
er o
f Wo
rker
s
Day(1) Dark(2) DarkButLighted(3)
Dawn(4) Dusk(5)
Figure 3.17 Number of workers killed by years according to light conditions

44
Relative Fatialities (in Percentage) Day (1) vs NotDay (2,3,4,5)
27.27
14.29
66.67
100.00
81.8272.73
85.71
33.33
0.00
18.18
0.00
20.00
40.00
60.00
80.00
100.00
120.00
1996 1997 1998 1999 2000
Years
Per
cent
age
Day (1) NotDay (2,3,4,5)
Figure 3.18 Relative fatalities (in percentage of workers killed) (Day (1) vs. NotDay (2,3,4,5))
Relative Fatialities (in Percentage) Night (2) vs NotNight (1,3,4,5)
0.00
14.29
0.00 0.009.09
100.00
85.71
100.00 100.0090.91
0.00
20.00
40.00
60.00
80.00
100.00
120.00
1996 1997 1998 1999 2000
Years
Per
cent
age
Night (2) NotNight (1,3,4,5)
Figure 3.19 Relative fatalities (in percentage of workers killed) (Night (2) vs. NotNight (1,3,4,5))

45
Table 3.6 Analysis by light and weather conditions
Day (1) NotDay (2,3,4,5)
Dry Wet Dry Wet Total
Yea
r
Num
ber o
f Acc
iden
ts
(Day
:Dry
)
Num
ber o
f Per
sons
K
illed
(Day
:Dry
)
Num
ber o
f Wor
kers
K
illed
(Day
:Dry
)
Num
ber o
f Acc
iden
ts
(Day
:Wet
)
Num
ber o
f Per
sons
K
illed
(Day
:Wet
)
Num
ber o
f Wor
kers
K
illed
(Day
:Wet
)
Num
ber o
f Acc
iden
ts
(Not
Day
:Dry
)
Num
ber o
f Per
sons
K
illed
(Not
Day
:Dry
)
Num
ber o
f Wor
kers
K
illed
(Not
Day
:Dry
)
Num
ber o
f Acc
iden
ts
(Not
Day
:Wet
)
Num
ber o
f Per
sons
K
illed
(Not
Day
:Wet
)
Num
ber o
f Wor
kers
K
illed
(Not
Day
:Wet
)
Acc
iden
t
Pers
ons
Wor
ker
1996 10 31 3 2 6 0 13 35 7 1 2 1 26 74 11
1997 9 24 1 2 9 0 18 60 5 2 6 1 31 99 7
1998 9 36 2 0 0 0 8 35 1 1 3 0 18 74 3
1999 7 23 2 0 0 0 7 15 0 1 1 0 15 39 2
2000 22 60 9 2 10 0 17 44 2 1 6 0 42 120 11
Number of Accidents by Light (Day (1) or NotDay (2,3,4,5)) and Weather (Dry or Wet) Condition
109 9
7
22
2 20 0
2
13
18
87
17
12
1 1 10
5
10
15
20
25
1996 1997 1998 1999 2000
Years
Nu
mb
er o
f A
ccid
ents
Number of Accidents (Day:Dry)Number of Accidents (Day:Wet)Number of Accidents (NotDay:Dry)Number of Accidents (NotDay:Wet)
Figure 3.20 Number of accidents by light (Day (1) or NotDay (2,3,4,5)) and weather (Dry or Wet) conditions

46
Fatialities (in Number of Persons Killed) by Light (Day (1) or NotDay (2,3,4,5)) and Weather (Dry or
Wet) Condition
3124
36
23
60
6 90 0
10
35
60
35
15
44
2 6 3 1 60
10203040506070
1996 1997 1998 1999 2000
Years
Nu
mb
er o
f P
erso
ns
Kill
ed
Number of Persons Killed (Day:Dry)
Number of Persons Killed (Day:Wet)
Number of Persons Killed (NotDay:Dry)
Number of Persons Killed (NotDay:Wet)
Figure 3.21 Fatalities (in number of persons killed) by light (Day (1) or NotDay (2,3,4,5)) and weather (Dry or Wet) conditions
Fatialities (in Number of Workers Killed) by Light (Day (1) or NotDay (2,3,4,5)) and Weather (Dry or
Wet) Condition
3
12 2
9
0 0 0 0 0
7
5
10
21 1
0 0 00
2
4
6
8
10
1996 1997 1998 1999 2000
Years
Nu
mb
er o
f W
ork
ers
Kill
ed
Number of Workers Killed (Day:Dry)
Number of Workers Killed (Day:Wet)
Number of Workers Killed (NotDay:Dry)
Number of Workers Killed (NotDay:Wet)
Figure 3.22 Fatalities (in number of workers killed) by light (Day (1) or NotDay (2,3,4,5)) and weather (Dry or Wet) conditions

47
Table 3.7 Number of accidents by light (Night (2) or NotNight (1,3,4,5)) and weather (Dry or Wet) conditions
NotNight (1,3,4,5) Night (2)
Dry Wet Dry Wet Total
Yea
r
Num
ber o
f Acc
iden
ts
(Not
Nig
ht:D
ry)
Num
ber o
f Per
sons
K
illed
(Not
Nig
ht:D
ry)
Num
ber o
f Wor
kers
K
illed
(Not
Nig
ht:D
ry)
Num
ber o
f Acc
iden
ts
(Not
Nig
ht:W
et)
Num
ber o
f Per
sons
K
illed
(Not
Nig
ht:W
et)
Num
ber o
f Wor
kers
K
illed
(Not
Nig
ht:W
et)
Num
ber o
f Acc
iden
ts
(Nig
ht:D
ry)
Num
ber o
f Per
sons
K
illed
(Nig
ht:D
ry)
Num
ber o
f Wor
kers
K
illed
(Nig
ht:D
ry)
Num
ber o
f Acc
iden
ts
(Nig
ht:W
et)
Num
ber o
f Per
sons
K
illed
(Nig
ht:W
et)
Num
ber o
f Wor
kers
K
illed
(Nig
ht:W
et)
Acc
iden
ts
Pers
ons
Wor
kers
1996 16 55 10 3 8 1 7 11 0 0 0 0 26 74 11
1997 19 48 5 3 11 1 8 36 1 1 4 0 31 99 7
1998 13 48 3 1 3 0 4 23 0 0 0 0 18 74 3
1999 9 27 2 0 0 0 5 11 0 1 1 0 15 39 2
2000 32 85 10 2 10 0 7 19 1 1 6 0 42 120 11
Number of Accidents by Light (Night (2) or NotNight (1,3,4,5)) and Weather (Dry or Wet) Condition
1619
13
9
32
3 31 0
2
7 8
4 57
0 1 0 1 10
5
10
15
20
25
30
35
1996 1997 1998 1999 2000
Years
Nu
mb
er o
s A
ccid
ents
Number of Accidents (NotNight:Dry)Number of Accidents (NotNight:Wet)Number of Accidents (Night:Dry)Number of Accidents (Night:Wet)
Figure 3.23 Number of accidents by light (Night (2) or NotNight (1,3,4,5)) and weather (Dry or Wet) conditions

48
Fatialities (in Number of Persons Killed) by Light (Night (2) or NotNight (1,3,4,5)) and Weather (Dry or
Wet) Condition
5548 48
27
85
8 113 0
1011
36
2311
19
0 4 0 16
0102030405060708090
1996 1997 1998 1999 2000
Years
Nu
mb
er o
f P
erso
ns
Kill
ed
Number of Persons Killed (NotNight:Dry)Number of Persons Killed (NotNight:Wet)Number of Persons Killed (Night:Dry)Number of Persons Killed (Night:Wet)
Figure 3.24 Fatalities (in number of persons killed) by light (Night (2) or NotNight (1,3,4,5)) and weather (Dry or Wet) conditions
Fatialities (in Number of Workers Killed) by Light (Night (2) or NotNight (1,3,4,5)) and Weather (Dry or
Wet) Condition
10
5
32
10
1 10 0 00
10 0
10 0 0 0 00
2
4
6
8
10
12
1996 1997 1998 1999 2000
Years
Nu
mb
er o
f W
ork
ers
Kill
ed
Number of Workers Killed (NotNight:Dry)Number of Workers Killed (NotNight:Wet)Number of Workers Killed (Night:Dry)Number of Workers Killed (Night:Wet)
Figure 3.25 Fatalities (in number of workers killed) by light (Night (2) or NotNight (1,3,4,5)) and weather (Dry or Wet) conditions

49
3.4 Conclusion
According to data on fatal accidents in highway work zones in the State of Illinois in
the five-year study period of 1996-2001, there is no indication that nighttime construction is
more hazardous than daytime construction. The inclusion of a weather parameter into the
analysis does not change this finding. However, one should not interpret this information
further in the absence of information about traffic volume, and number and size of projects
carried out in daytime vs. nighttime.

50
Nighttime Construction: Evaluation of Worker Safety Issues
4. METHODOLOGY OF THE STUDY
4.1 General Approach to the Problem
This section describes the research team’s plan of action and methodology. The
following activities were conducted with the approval of the TRP:
• A comprehensive review of the literature on work zone safety garments and worker
visibility issues in daytime and nighttime construction operations including new and
innovative technologies was conducted. The literature survey involved the review of
archived publications, internal reports and websites. The review included new and
innovative technologies associated with worker visibility issues, and high visibility
work zone safety garments used in the U.S. and other countries (Britain, Australia,
and New Zealand) and by other professions such as the military. This deliverable
was submitted to the TRP in January 2002.
• The records of construction work zone accidents (daytime and nighttime) in Illinois
over the 5-year period 1996-2001 involving construction workers were extracted from
the FRS and examined to determine the potential influence of worker visibility as a
cause of work zone accidents. This deliverable was submitted to the TRP in January
2002.
• A survey was conducted of IDOT operation personnel, resident engineers, and
contractors involved in nighttime construction operations in Illinois within the past
five years to determine safety concerns. The survey investigated (a) the type,
severity, and frequency of nighttime accidents involving workers in work areas, (b)
51
the performance of existing safety garments, and (c) safety garment design factors
and features. The survey tool was approved by the project TRP. This deliverable
was submitted to the TRP in July 2002.
• A survey of other DOTs was conducted regarding the type of safety garments used in
nighttime construction operations including information on the materials used to
construct the garments and the source of such garments. Like in the preceding bullet
point, the survey also investigated (a) the type, severity, and frequency of nighttime
accidents involving workers in work areas, (b) the performance of existing safety
garments, and (c) safety garment design factors and features. The survey tool was
approved by the project TRP. This deliverable was submitted to the TRP in July
2002.
• A comprehensive list of the manufacturers and distributors of high-visibility garments
was compiled to account for the many safety garments currently on the marketplace.
Information collected in the surveys mentioned in the preceding two bullet points was
used as well as a thorough internet survey to identify and locate these companies. A
list of the companies is given in Appendix A.
• Based on the findings of the surveys mentioned in the preceding three bullet points,
nine safety vests were identified as being used by different states. Three of these
vests were eliminated because they were exact replicas of some of the other vests
even though they were marketed under different names. The remaining six safety
vests were picked for testing, after consultation with the project TRP. It should be
noted that three of these six vests are currently being used by IDOT. The six safety
vests tested include:

52
IODT Standard Vest IDOT LED Vest Head Lite Roadstar 200 Vest Iron Horse Texas Style Vest Chami Design Washington Style Vest Safetyline Minnesota Style Vest
The pictures of these vests are presented in Appendix B.
• A field evaluation was conducted to measure the performance of the safety garments
selected. A test setup was devised and a procedure called LUMINA was developed
to electronically analyze the data collected and to produce an example movie of the
tests. The field evaluation included different lighting, weather and location
conditions. A total of four tests were consulted with the approval of the project TRP.
Videotapes of these tests were made.
• A survey of potential users of high visibility safety garments was conducted to
investigate (a) 360° visibility, (b) conspicuity against the background, (c) the
brightness of the retro-reflective material, (d) the configuration of the vests (pockets,
zipper, etc.), and (e) the overall perceived effectiveness. The survey tool was
approved by the project TRP.
4.2 DOT Survey Instrument
A questionnaire survey was administered to IDOT operations personnel, resident
engineers, and contractors involved in nighttime construction. A copy of the survey
instrument is presented in Appendix C. The questionnaire involved three parts:
PART I Type, severity, and frequency of nighttime accidents involving workers in work areas
PART II Evaluation of existing safety garments PART III Safety garment design factors and features

53
The first part involved questions about the observations and experiences of the
respondents concerning nighttime accidents. The second part investigated the performance
of existing safety vests that are currently being used in IDOT nighttime projects. The third
sought information concerning the features and the design factors of safety vests. The terms
encountered in the questions were defined in two tables placed in the questionnaire. Specific
questions were formulated for the questionnaire based on the information obtained from the
literature review described in Chapter 2.
A similar questionnaire survey was administered to the departments of transportation
other than Illinois’. The contents of this questionnaire are basically the same as the IDOT
questionnaire except that some of the wording (IDOT was replaced by DOT) was different.
A copy of the survey instrument is presented in Appendix D.
Both questionnaires were extensively reviewed and revised by the project TRP. The
names and email addresses of IDOT operations personnel, resident engineers and contractors
involved in nighttime construction/maintenance in each district were provided by the TRP.
Contacts with these contact persons in each district led to a pool of prospective respondents.
The survey administered to other states’ DOTs was conducted with the help of
IDOT’s David Lippert who has access to a network of individuals in each state who can
forward the request to the right person in their organization.
The help received from IDOT in identifying potential respondents to our surveys was
invaluable.

54
4.3 Site Tests
LUMINA is a system composed of hardware and software that was developed to
conduct this study. LUMINA was used (a) to perform field experiments that involved
recording on video the performance of various safety vests under different site conditions;
and (b) to conduct office operations that involved converting the video movie into snapshots,
calculating the average luminance of the vests tested, and indexing them. The features of
LUMINA are described in the following sections.
4.3.1 Site Operations
A video camera recorder, Sony CCD-TR700, which was provided by the
Transportation Engineering Laboratory at Illinois Institute of Technology, was used to record
the movies at construction sites. The camcorder is capable of using Hi8 video technology,
recording the movies in NTSC (National Television System Committee) format. Hi8 videos
are recorded in a slightly different fashion than its lower resolution counterpart, 8mm. The
luminance portion of the video signal is allocated a substantially wider bandwidth on the
frequency spectrum. An Hi8 video signal has a resolution of approximately 400 lines, while
an 8mm video signal has approximately 220 lines of resolution. With the current technology,
a common 8mm camcorder tape has a video recording time of 120 min in Hi8 format. The
existing camera and the Hi8 format were selected for use in the recording phase.
A total of six, half round, injection molded men’s display forms (mannequins) were
procured for use in experiments conducted in the field (Figure 4.1). Black colored
mannequins were chosen to avoid reflections from mannequins. The black color does not
reflect any light.

55
Three stands were fabricated to hang the mannequins with vests on them. These
stands were constructed in the workshop of the department. Two mannequins were hung
back to back on each stand to get a torso that appears to be as similar to a man’s torso as
possible. Using the three stands and six mannequins, three man’s torsos were formed. A
photometer was placed right above the mannequins on the center stand. The photometer
recorded the light condition on the site and automatically calculated the average light during
a shift.
Figure 4.1 Mannequin used in fie ld tests
The setup of the field tests was developed after conducting an experiment in the
university’s parking lot. The field tests were conducted as described below:
1. The setup of the camera and the mannequins at a construction site can be seen in
Figure 4.2. The stands on which the mannequins are hung were placed such as the
fronts of the vests were perpendicular to incoming traffic. The stands were placed
next to each other at the edge of the closed work zone (on the traffic side) to be as
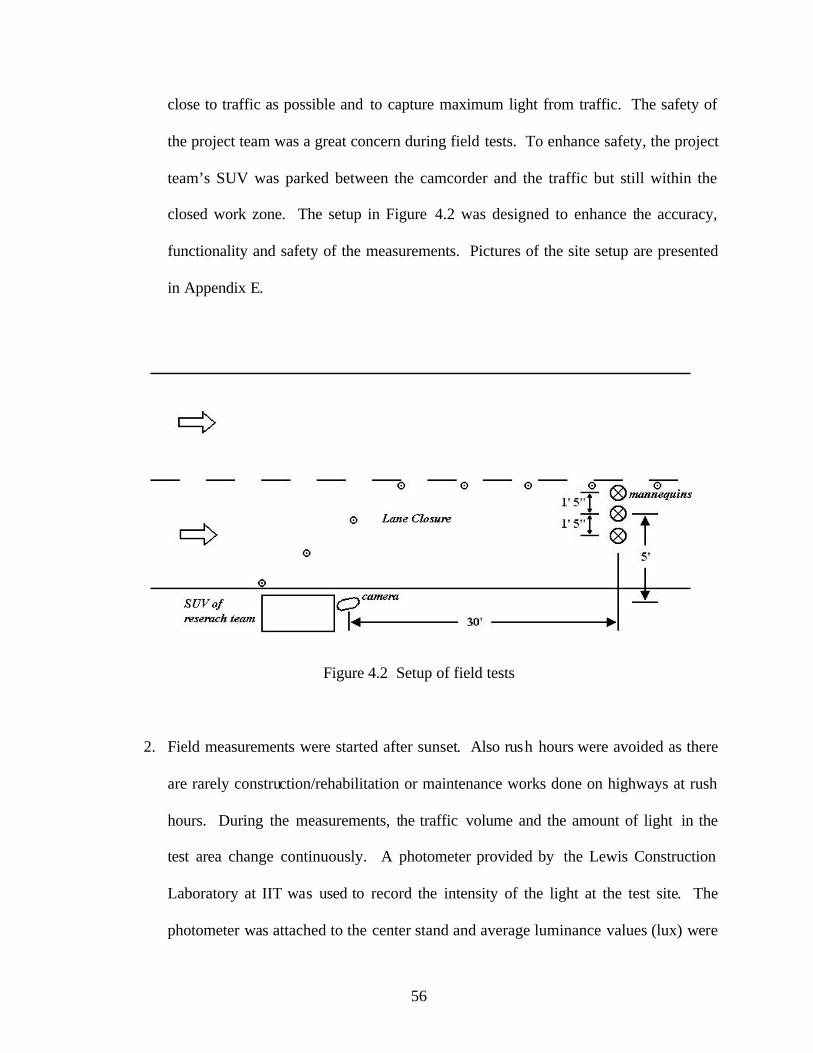
56
close to traffic as possible and to capture maximum light from traffic. The safety of
the project team was a great concern during field tests. To enhance safety, the project
team’s SUV was parked between the camcorder and the traffic but still within the
closed work zone. The setup in Figure 4.2 was designed to enhance the accuracy,
functionality and safety of the measurements. Pictures of the site setup are presented
in Appendix E.
Figure 4.2 Setup of field tests
2. Field measurements were started after sunset. Also rush hours were avoided as there
are rarely construction/rehabilitation or maintenance works done on highways at rush
hours. During the measurements, the traffic volume and the amount of light in the
test area change continuously. A photometer provided by the Lewis Construction
Laboratory at IIT was used to record the intensity of the light at the test site. The
photometer was attached to the center stand and average luminance values (lux) were

57
recorded for each shift. The average luminance values were used to normalize the
light reflected by the safety vests.
3. After a set of three vest (2 sets of 3 vests each were tested) was put on the
mannequins, the camera and the photometer were turned on simultaneously. The
camera and the photometer were tuned off after 10 minutes of recording.
4. The location of the vests vis-à-vis the border of the work zone (and therefore their
proximity to traffic) is expected to influence the results. To evaluate the impact of
placing the vests in different locations, it was decided to switch the location of the
vests periodically. After a recording time of 10 minutes, the average luminance value
was recorded and the places of the vests were switched while the photometer was
reset. This way, every vest was recorded for 10 minutes in each one of the three
locations (stand closest to cones, center stand, and stand farthest from the open lane).
5. After performing Step 4 for all three combinations, the second set of three vests was
tested. Step 4 was also repeated three times for the second set of three vests.
6. After completion of Step 5, the recording of the front of the vests was completed.
According to the findings of the survey administered to IDOT operations personnel,
resident engineers, contractors and to departments of transportation of other states
than Illinois (See Chapter 5), 360° visibility was considered as the most important
safety garment design factor. Therefore all four faces (front, back, left and right) of
the vests should be tested. The left and right faces are exactly the same; whereas the
front and back faces are very similar. So recording the front and one side of the vests
was considered to be adequate for the purpose of the research.
7. Steps 4 and 5 were repeated for the sides of vests.

58
4.3.2 Office operations
Hardware
The movies on the videocassettes were digitalized using a frame grabber program
called AIGOTCHA, a hardware device coupled with its own software developed by AI Tech.
The National Standard Television Committee has established 30 frames per second
(fps) as the standard frame rate in the USA. If a movie made with a frame rate of 30 fps, all
the details of the filmed operation can easily be observed during playback. There are two
major problems associated with this frame rate; it takes equal time to play back the movie as
recording it, and it occupies a huge amount of space on an electronic storage device such as a
hard disk. The time- lapse technique reduces the frame rate when recording, but uses 30 fps
when playing back; this way, it is possible to see the movie in much less time than the time
spent filming the real event. Thus, if a six hour long event is recorded at a rate of 5 fps, it is
possible to play back the movie in one hour at the standard frame rate of 30 fps; the
shortening in the view time is obtained at the expense of missing some of the detail in the
filmed operation. But the storage space for the time-lapse film is much less than a film shot
at a rate of 30 fps. AIGOTCHA is capable of capturing frames from a movie at a rate of 1
frame per 2 seconds. It means, a six hour long event that is recorded at a rate of 1 frame per
2 seconds can be played back in 6 minutes at the standard frame rate of 30 fps. The frame
grabber AIGOTCHA can capture frame sizes of 180×120, 360×240, 512×384, 720×480,…,
1600×1200. The 512×384 pixel was selected for the size of the frames because a 512×384
frame includes enough detail and occupies less space in hard drive than larger sizes do.
The frames output by AIGOTCHA are in BMP, Windows bitmap format. The size of
each file varies from 500 to 600 Kb, which occupies considerable space on the hard disc and
59
slows down the computer. So the frames are compressed to another Windows compatible
image file. Several different compressing engines are available on the market. The JPEG
system has been used in this research. This system has been chosen because the Windows
system has a class to compress pictures using it. The JPEG class allows the user to determine
the rate of quality compression desirable. Experiments have been conducted during this
research varying the quality-compression rate between 80% and 100%. The results achieved
from the frames which were compressed with a quality of 80% and 100% were exactly same.
So all the frames in BMP format were compressed into JPEG files with a quality-
compression rate of 80%. The size of each file was this way reduced to 22 to 26 Kb.
Software
After getting the frames, the smallest rectangle into which a vest can fit was
determined. The rectangle should be selected in a manner that maximum vest area is
included with minimum background. The coordinates of the two diagonal corners of the
rectangles and the size of the rectangles are recorded as seen in Figure 4.3. The picture and
values illustrated in Figure 4.3 were obtained from the field test performed as a trial at the
university’s parking lot. The coordinates and the size of the rectangles were kept constant for
each shift of three vests. Neither the position of the mannequins nor of the vests were
changed during this part of the test. Once the vests were switched, the coordinates and sizes
of the rectangles were reset.
In the trial shift presented in Figure 4.3, a rectangle having dimensions of 106×168
was placed on both of the vests. The coordinates were determined so that each vest appeared
in the center of the rectangle.

60
Figure 4.3 Capturing vest data
These rectangles are cropped out of the pictures using IrfanView 3.75. IrfanView is
an image viewer and editor software that can be downloaded from
http://download.com.com/3000-2192-10132330.html?tag=lst-0-1. After entering the
coordinates of the rectangles and the destination folders for the cropped pictures, IrfanView
saves the cropped images in files with the same name as the original files.
A program was then written in Microsoft Visual Basic 6.0 to calculate the average
RGB (red, green, blue) and luminance values of the vests in the frames. The flowchart of the
program is presented in Figure 4.4. The program was run for each vest. The data were
collected in an Access file for evaluation.

61
RGB (Red, Green, and Blue) refers to a system for representing the colors to be used
on a computer display or television. Red, green, and blue can be combined in various
proportions to obtain any color in the visible spectrum. In the most common model used in
imaging programs and also in the model covered in this research, the values of the R, G and
B range from 0 to 255 as integers (256 unique levels for each color component).
In the luminance calculations, the NTSC (National Television System Committee)
model is used. This system makes use of certain limitations in the ability of the human eye
and brain to register what they are actually seeing, and so the performance of the eye under
various conditions is described. In the NTSC system, the first step is to convert RGB to a
color space that is based on human perception. This system also has three qualities: Y,
luminance, is the brightness axis; I, intermodulation, is the orange-blue axis; and Q,
quadrature, is the purple-green axis. In the NTSC system the main signal, termed Y, carries
the monochrome or luminance information and is formed by adding fractions of the R (red),
G (green) and B (blue) values together so that these values contribute to the brightness of a
pixel. For the NTSC primaries, the Y-luminance component is formulated as follows:
Y = (0.299 × R) + (0.587 × G) + (0.114 × B)
In this research, this formula was used to calculate the luminance values.

62
Figure 4.4 Flowchart of program

63
4.4 Site Survey Instrument
According to the original proposal, a questionnaire had to be administered to workers
who would be asked to wear the test vests for a period of time. These workers would be
asked to rate the vests’ design factors and features. However, because of the nature of
highway construction, there is always a risk of accident. If an accident occurs during the
testing of the vests, it can be attributed to the lower visibility of the vest being tested. In the
absence of insurance coverage against such a liability, the TRP agreed with the research team
to cancel this part of the project. Instead, it was decided to exhibit the vests at the
university’s parking lot at night and ask graduate students currently enrolled in the
Construction Engineering and Management Program to rate the vests. These graduate
students were civil engineers and architects mostly with some site experience.
A questionnaire survey (Appendix F) was administered to two different batches of
graduate students, each batch on a different night. On both nights, the six vests were placed
in the parking lot and the students were asked to evaluate the vests using five criteria:
• 360° visibility • Conspicuity against background • Brightness of the retro-reflective material • Configuration of the vests (pockets, zipper, etc.) • Overall perceived effectiveness
. A scale of 1-5 was used to evaluate the data collected:
1 - Not acceptable 2 - Needs improvement 3 - OK 4 - Very good 5 - Excellent
64
4.5 Evaluation of the Findings
The evaluation of the data collected in the filed tests and the site survey is described
in detail in the flowchart presented in Figure 4.5.
Once the data were collected, luminance values were calculated using the relationship
in the preceding section. Tables were prepared which include the descriptive statistics of the
original luminance values for both front faces and sides of vests (one for each) at each
construction site. These tables include mean, sample size, standard deviation, minimum and
maximum original luminance values of the each vest at three positions (left, middle and
right) plus the consolidated (total) values.
The original luminance values were measured under the light conditions prevailing in
the construction site where tests were conducted. The photometer which was attached to the
center stand, recorded the average intensity of light at the test site. The lighting in the test
site comes first from the light sources in the construction site and second from passing cars.
So the mean luminance values of the vests were normalized using the photometer readings
only for large photometer readings because at small light intensities such as 1, 2, and 3 lux,
rounding off (the photometer calculated the average luminance intensity with no digits after
the decimal point) resulted in inaccurate and unreliable values. The mean luminance values
of the vests were normalized using average traffic volume whenever photometer readings
were not discriminating enough.

65
Figure 4.5 Flowchart of the data evaluation process
66
After forming the descriptive statistics tables of original luminance values for the
vests, normalized mean luminance values were calculated make the data comparable and
reliable. Tables were generated that listed the original and normalized mean luminance
values, along with sample size (number of frames), standard deviation, minimum and
maximum values. Normalization tables also included average traffic volumes or average
photometer readings, depending on which one was used for normalization.
The vests were recorded for 10 minutes at each of the three positions (stand closest to
cones, center stand, and stand farthest from cones) assuming that the vests closest to the open
lane get more light from passing traffic and therefore reflect more light that vests located
away from the open lane. The next step involved examining the significance of the
difference between the three positions. Tamhane’s T2 test, a pair wise multiple mean
comparison test based on the t-test, was run for the front faces of each vest at each site. The
test indicated whether the differences between luminance values are significant at 5%. The
purpose of this test was to see if recording the vests in each of the three positions was
justified or not.
The vests were tested for the light they reflected from their front face and from their
side as the design of the front face is quite different from the side. Considering the fact that a
construction worker may face the incoming traffic or may stand sideways, it was decided to
conduct two sets of tests, one with the vests facing the incoming traffic and one with the
vests standing sideways. An independent sample t-test was run for each vest at each
construction site to test the whether the luminance values of the front and side of the vests are
significant at 5%.
67
Tamhane’s T2 test and the independent sample t-test were run using SPSS, a
statistical software package.
Once the mean luminance values were normalized for front faces and sides of vests at
each test location, the vests were ranked in order of preference. At this point, Tamhane’s T2
test was run to compare normalized mean luminance of the six vests at each site. The test
was run to compare front faces and sides of the vests. Based on the significance of the
differences, a new ranking was obtained. Then the ranking were consolidated to get a final
ranking for the field tests.
A table of descriptive statistics was also prepared to present the findings of the
questionnaire survey administered to graduate students. “Overall perceived effectiveness”
was taken into consideration as the governing criterion. Tamhane’s T2 test was run to
compare the mean scores assigned by the respondents to the vests and a corresponding
ranking was obtained.
The rankings obtained from field tests and the site survey were consolidated into a
final ranking of the vests.
68
Nighttime Construction: Evaluation of Worker Safety Issues
5. EVALUATION OF SAFETY GARMENT SURVEYS ADMINISTERED TO DOTs
5.1 Evaluation of Safety Garment Surveys Administered to IDOT Operations
Personnel, Resident Engineers, and Contractors Involved in Nighttime Construction
Operations in Illinois within the Past 5 Years
A questionnaire survey was administered to IDOT operation personnel, resident
engineers, and contractors involved in nighttime construction. The idea was to identify the
safety concerns of these different groups of respondents. The questionnaire was approved by
the project TRP and sent to 20 IDOT resident engineers, 10 IDOT operational personnel and
14 IDOT contractors whose names and email addresses were provided by the project TRP for
all districts in IDOT. 45% (9) of resident engineers, 20% (2) of operational personnel and
29% (4) of contractors responded. The total respond rate was 34% (15). The number of
respondents from each group was not enough to make a comparison of the findings. So the
findings are merged and evaluated for Illinois nighttime construction operations. The
questionnaire involves three parts:
I. Type, severity, and frequency of nighttime accidents involving workers in work areas
II. Evaluation of existing safety garments
III. Safety garment design factors and features
The first part investigates the observations and experiences of the respondents
concerning nighttime accidents. In the second part, respondents evaluate the performance of
existing safety vests that are currently being used in IDOT nighttime projects. Finally, in the

69
third and last part, the features and the design factors of safety vests are investigated. The
terms encountered in the questions are defined in Tables 1 and 2 in questionnaire.
The questionnaire is designed to include specific questions that are formulated based
on the information obtained from the literature review described in Deliverable 1. After a
brainstorming session with the project TRP, the questionnaire was modified and the final
version was used in the survey.
The findings of the survey administered to Illinois respondents can be reported as
follows:
I. Type, severity, and frequency of nighttime accidents involving workers in work
areas
• Do you think safety is more of a problem during nighttime or during daytime on
Illinois highway construction/rehabilitation/maintenance work areas?
Nighttime20%
Daytime26%
No difference27%
No idea20%
Depends on type of work
7%
Notes:
1) 47% (7) of the Illinois participants did not encounter any nighttime accidents in work
areas in the last 5 years.
2) 7% (1) of the Illinois participants know that some accidents occurred in their sites but
do not know enough information about these accidents.
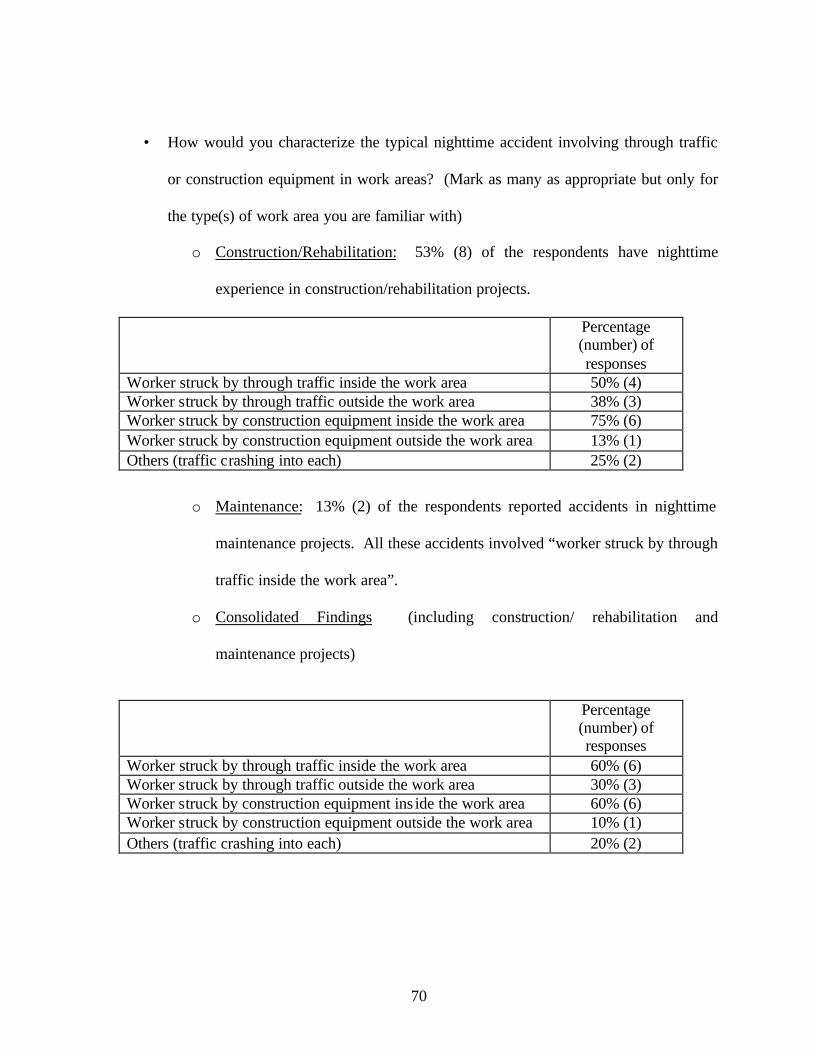
70
• How would you characterize the typical nighttime accident involving through traffic
or construction equipment in work areas? (Mark as many as appropriate but only for
the type(s) of work area you are familiar with)
o Construction/Rehabilitation: 53% (8) of the respondents have nighttime
experience in construction/rehabilitation projects.
Percentage (number) of responses
Worker struck by through traffic inside the work area 50% (4) Worker struck by through traffic outside the work area 38% (3) Worker struck by construction equipment inside the work area 75% (6) Worker struck by construction equipment outside the work area 13% (1) Others (traffic crashing into each) 25% (2)
o Maintenance: 13% (2) of the respondents reported accidents in nighttime
maintenance projects. All these accidents involved “worker struck by through
traffic inside the work area”.
o Consolidated Findings (including construction/ rehabilitation and
maintenance projects)
Percentage (number) of responses
Worker struck by through traffic inside the work area 60% (6) Worker struck by through traffic outside the work area 30% (3) Worker struck by construction equipment ins ide the work area 60% (6) Worker struck by construction equipment outside the work area 10% (1) Others (traffic crashing into each) 20% (2)
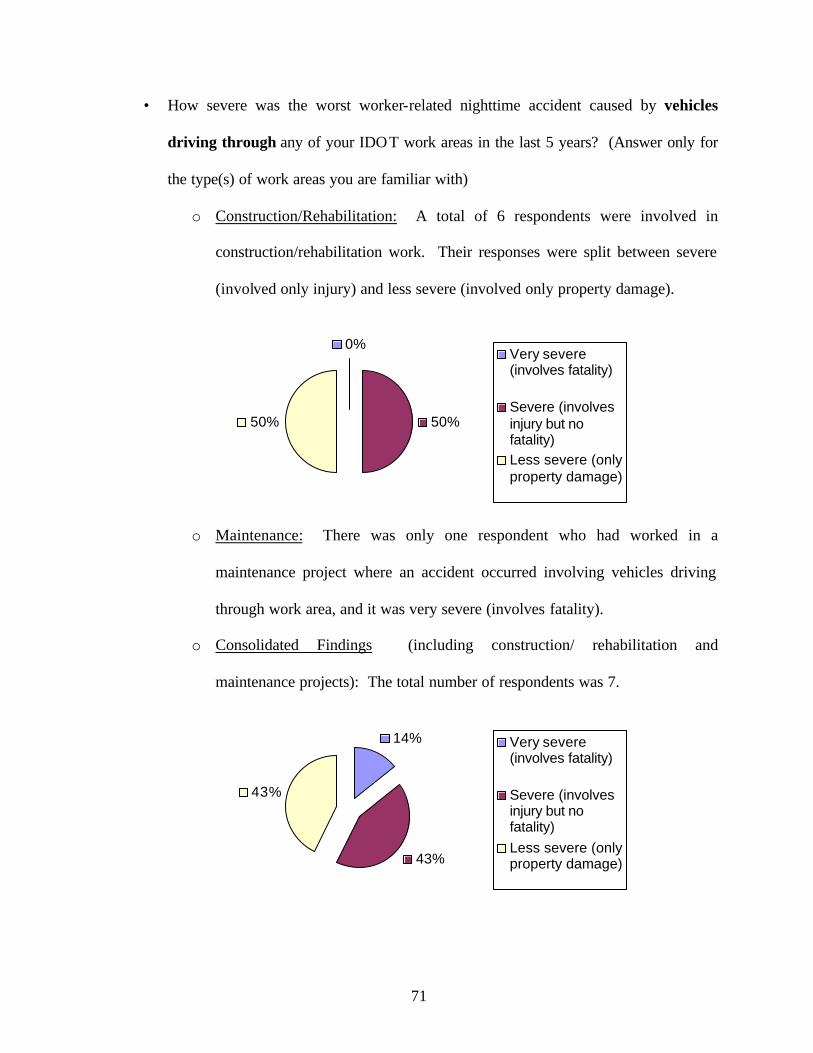
71
• How severe was the worst worker-related nighttime accident caused by vehicles
driving through any of your IDOT work areas in the last 5 years? (Answer only for
the type(s) of work areas you are familiar with)
o Construction/Rehabilitation: A total of 6 respondents were involved in
construction/rehabilitation work. Their responses were split between severe
(involved only injury) and less severe (involved only property damage).
0%
50%50%
Very severe(involves fatality)
Severe (involvesinjury but nofatality)Less severe (onlyproperty damage)
o Maintenance: There was only one respondent who had worked in a
maintenance project where an accident occurred involving vehicles driving
through work area, and it was very severe (involves fatality).
o Consolidated Findings (including construction/ rehabilitation and
maintenance projects): The total number of respondents was 7.
14%
43%
43%
Very severe(involves fatality)
Severe (involvesinjury but nofatality)Less severe (onlyproperty damage)

72
• How severe was the worst worker-related nighttime accident caused by construction
equipment operating on any of your IDOT work areas in the last 5 years? (Answer
only for the type(s) of work area you are familiar with)
o Construction/Rehabilitation: Only 6 respondents answered this question.
17%
33%
50%
Very severe(involves fatality)
Severe (involvesinjury but nofatality)Less severe (onlyproperty damage)
o Maintenance: There was no respondent involved in a maintenance project
where an accident caused by construction equipment operating in the work
area.
o Consolidated Findings (including construction/ rehabilitation and maintenance
projects): Since no respondent reported this type of accident in a maintenance
project, the values for construction/rehabilitation projects represent the entire
population.
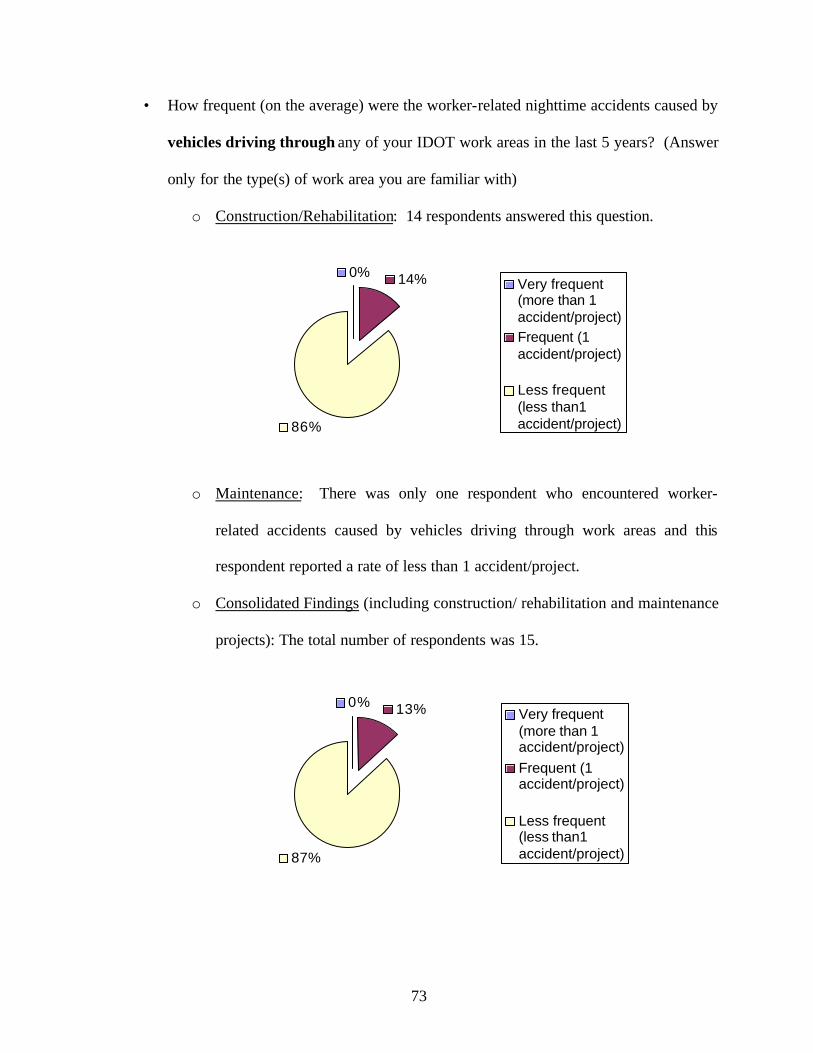
73
• How frequent (on the average) were the worker-related nighttime accidents caused by
vehicles driving through any of your IDOT work areas in the last 5 years? (Answer
only for the type(s) of work area you are familiar with)
o Construction/Rehabilitation: 14 respondents answered this question.
0% 14%
86%
Very frequent(more than 1accident/project)Frequent (1accident/project)
Less frequent(less than1accident/project)
o Maintenance: There was only one respondent who encountered worker-
related accidents caused by vehicles driving through work areas and this
respondent reported a rate of less than 1 accident/project.
o Consolidated Findings (including construction/ rehabilitation and maintenance
projects): The total number of respondents was 15.
0% 13%
87%
Very frequent(more than 1accident/project)Frequent (1accident/project)
Less frequent(less than1accident/project)

74
• How frequent (on the average) were the worker-related nighttime accidents caused by
construction equipment operating on your IDOT work areas in the last 5 years?
(Answer only for the type(s) of work area you are familiar with)
o Construction/Rehabilitation: 14 respondents answered this question.
7%0%
93%
Very frequent(more than 1accident/project)Frequent (1accident/project)
Less frequent(less than1accident/project)
o Maintenance: There was only one respondent who encountered worker-
related accidents caused by construction equipment operating on work areas in
the last five years and this respondent reported a rate of less than 1
accident/project.
o Consolidated Findings (including construction/ rehabilitation and maintenance
projects): The total number of respondents was15.
7%0%
93%
Very frequent(more than 1accident/project)Frequent (1accident/project)
Less frequent(less than1accident/project)
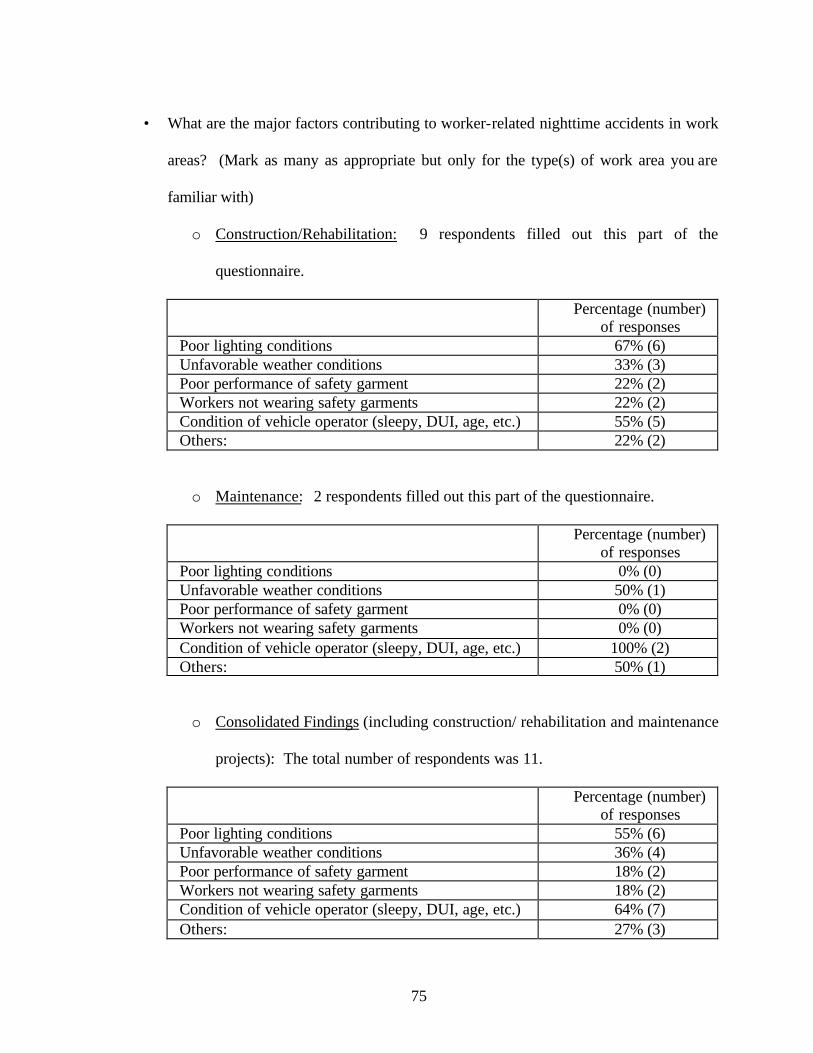
75
• What are the major factors contributing to worker-related nighttime accidents in work
areas? (Mark as many as appropriate but only for the type(s) of work area you are
familiar with)
o Construction/Rehabilitation: 9 respondents filled out this part of the
questionnaire.
Percentage (number) of responses
Poor lighting conditions 67% (6) Unfavorable weather conditions 33% (3) Poor performance of safety garment 22% (2) Workers not wearing safety garments 22% (2) Condition of vehicle operator (sleepy, DUI, age, etc.) 55% (5) Others: 22% (2)
o Maintenance: 2 respondents filled out this part of the questionnaire.
Percentage (number) of responses
Poor lighting conditions 0% (0) Unfavorable weather conditions 50% (1) Poor performance of safety garment 0% (0) Workers not wearing safety garments 0% (0) Condition of vehicle operator (sleepy, DUI, age, etc.) 100% (2) Others: 50% (1)
o Consolidated Findings (including construction/ rehabilitation and maintenance
projects): The total number of respondents was 11.
Percentage (number) of responses
Poor lighting conditions 55% (6) Unfavorable weather conditions 36% (4) Poor performance of safety garment 18% (2) Workers not wearing safety garments 18% (2) Condition of vehicle operator (sleepy, DUI, age, etc.) 64% (7) Others: 27% (3)
76
II. Evaluation of existing safety garments
• Describe the safety garments that are currently being used at nighttime on your
highway work areas:
Manufacturer: ………………. ……… Model: …………………………. Color of vest: .………………..……… Description: …………………… Color of retro-reflective material: ………………………………………….
From which source are you providing safety garments for your site?
Please specify (__________________________________________)
This part of the survey was prepared to find out the type and origin of the safety vests used in
Illinois. The answers to this question are presented in the following table.

77
Respondent Organization Position Manufacturer
Respondent 1 IDOT/ Dist. 8 Resident Engineer Warning Lights (supplier)
Respondent 2 IDOT/ Dist. 2 Resident Engineer IDOT (supplier)
Respondent 3 IDOT/ Dist. 6 CE IV Dist. 6 Admin Office (supplier)
Respondent 4 IDOT/ Dist. 5 Resident Engineer IDOT (supplier)
Respondent 5 Gallagher Asphalt General Constructor Coordinator Main Store Room
Respondent 6 IDOT/ Dist. 8 Resident Engineer Construction Office
Respondent 7 Rockford Const. Operations Manager Ahop/Pants Department
Respondent 8 IDOT/ Dist. 8 Resident Engineer District Safety Bureau (supplier)
Respondent 9 IDOT/ Dist. 8 CE III IDOT (supplier)
Notes:
1) 40% of the respondents did not mention the name of the supplier of their existing vests. 2) 60% of the respondents mentioned the color of the vests and reflective materials. According to those who responded, 89% are
using orange vests, 11% green vests, 89% vests with green reflective material, 11% vests with red reflective material. 3) One respondent (7%) stated that they are using different vests for different kind of jobs. 4) Respondents’ names are on file.

78
• How would you characterize the nighttime performance of the safety garments
currently in use on your work areas? (Refer to Table 1 for definitions)
Table 1. Performance factors of safety garments (Modified from ASTM; Designation: F923-
00, 3M)
Factors Definitions
Visibility Transmission of light waves from workers’ garments to the eye of the driver of through traffic or equipment operators.
Conspicuity The characteristics that a worker’s garment will come to the attention of a driver or operator by means of sharp contrast with the background.
Reflectivity The measure of brightness of retro-reflective material used in workers’ garments making the garments more visible at nighttime.
Wearability The qualities of the garments that provide good fit, up-to-date look, likable colors and shapes, and weather protection.
Durability The ability of garments to retain their original characteristics after many wears and washes.
Comfort Garments’ features that prevent the worker from perspiring, being cold or hot, getting wet, or limiting their movements.
Configuration The exterior and interior design of safety garments such as size, number and function of pockets, use of buttons/zippers/Velcro.
Perceived effectiveness
The worker’s confidence that the garment he/she is wearing is visible to drivers and operators and that he/she can move around with no fear of being struck by a vehicle.

79
The following bar-chart represents the distribution of the answers.
0% 20% 40% 60% 80% 100%
Perc.effectiveness
Configuration
Comfort
Durability
Wearability
Reflectivity
Conspicuity
Visibility
Reflectivity
Conspicuity
Visibility
Reflectivity
Conspicuity
Visibility
Reflectivity
Conspicuity
Visibility
Wet
Dry
Rur
al A
rea
Urb
an A
rea
Oth
ers
Wea
ther
Bac
kgro
und
Excellent
Very good
OK
Needs improvement
Not acceptable
A scale (0-4) is used to evaluate the data obtained in the Part 2 (evaluation of existing safety
garments) and Part 3 (safety garment design factors and features).
0- Not very important, negatively impacted or not acceptable 1- Somewhat important or needs improvement 2- Important, not changed or OK 3- Very important or very good 4- Extremely important, positively impacted or excellent

80
The average ratings of the performance characteristics are calculated in the following table:
Exce
llent
(4)
Ver
y go
od (3
)
OK
(2)
Nee
ds
impr
ovem
ent (
1)
Not
acc
epta
ble
(0)
Tota
l Ran
king
Num
ber o
f R
espo
nden
ts
Ave
rage
Rat
ing
Visibility 1 8 2 2 0 34 13 2.62 Conspicuity 1 8 1 3 0 33 13 2.54
Urban Area
Reflectivity 1 8 2 2 0 34 13 2.62 Visibility 0 5 2 2 0 21 9 2.33 Conspicuity 0 5 1 2 0 19 8 2.38 B
ackg
roun
d
Rural Area
Reflectivity 0 5 1 2 0 19 8 2.38 Visibility 1 7 2 1 0 30 11 2.73 Conspicuity 1 8 1 3 0 33 13 2.54 Dry Reflectivity 1 8 1 3 0 33 13 2.54 Visibility 0 7 3 2 0 29 12 2.42 Conspicuity 0 7 4 2 0 31 13 2.39
Wea
ther
Wet Reflectivity 0 5 5 3 0 28 13 2.15 Wearability 1 4 5 2 0 28 12 2.33 Durability 0 7 3 2 0 29 12 2.42 Comfort 1 6 3 2 1 30 13 2.31 Configuration 0 7 4 2 0 31 13 2.39
Others
Perc.effectiveness 0 9 3 1 0 34 13 2.62

81
III. Safety garment design factors and features
• What is the importance of the following design factors in the use of retro-reflective
materials to enhance the nighttime visibility of your safety garments? (Refer to the
Table 2 for definitions)
Table 2. Design Factors that Enhance Nighttime Visibility (Modified from 3M)
Factors Definitions
Definability of the human form
The retro-reflective material on a garment being the only component visible to a driver at nighttime, it should make the driver recognize the object as a worker.
Location of retro-reflective materials on the garment
The appropriate location of the retro-reflective material on a safety garment should enhance its visibility by drawing the human eye to the moving object as the worker moves.
360° visibility The human form should be detected from all directions regardless of the human form, movement, location, and situation.
Amount of retro-reflective material
The amount of retro-reflective material applied should increase a worker’s visibility.
Brightness of the retro-reflective material The brightness of retro-reflective material should increase a worker’s visibility.
Acceptable loss of color and brightness after repeated wear and washing
The garment should be resistant to wear and washing such that the garment maintains its color and brightness longer.

82
0% 20% 40% 60% 80% 100%
Acceptable loss of color andbrightness after repeated wear and
washing
Brightness of the retro-reflectivematerial
Amount of retro-reflective material
360° visibility
Locations of retro-reflective materialson the garment
Definability of the human form
Extremely important
Very important
Important
Somewhat important
Not very important
The average ratings and the ranks of the design factors are calculated in the following table:
Extre
mel
y im
porta
nt (
4)
Ver
y im
porta
nt (
3)
Impo
rtan
t (2)
Som
ewha
t im
porta
nt (
1)
Not
ver
y im
porta
nt (
0)
Tota
l R
anki
ng
Num
ber o
f re
spon
dent
s
Ave
rage
R
atin
g
Ran
king
Definability of the human form 4 7 3 0 0 43 14 3.07 3
Locations of retro-reflective materials on the garment 3 8 1 2 0 40 14 2.86 5
360° visibility 7 7 0 0 0 49 14 3.50 1
Amount of retro-reflective material 2 10 2 0 0 42 14 3.00 4
Brightness of the retro-reflective material 3 10 1 0 0 44 14 3.14 2
Acceptable loss of color and brightness after repeated wear and washing
2 6 5 1 0 37 14 2.64 6

83
• How important do you consider the following features of safety garments used in
nighttime construction? (See Table 1 for definitions)
0% 20% 40% 60% 80% 100%
Confidence
Configuration
Comfort
Durability
Wearability
Reflectivity
Conspicuity
Visibility
Extremely important
Very important
Important
Somewhat important
Not very important
The average ratings and the ranks of the safety garment features are calculated in the
following table:
Safety garment features
Extre
mel
y im
porta
nt (
4)
Ver
y im
porta
nt
(3)
Impo
rtan
t (2)
Som
ewha
t im
porta
nt (
1)
Not
ver
y im
porta
nt (
0)
Tota
l Ran
king
Num
ber o
f re
spon
dent
s
Ave
rage
Rat
ing
Ran
king
Visibility 11 3 0 0 0 53 14 3.79 1 Conspicuity 7 6 0 0 0 46 13 3.54 3 Reflectivity 9 5 0 0 0 51 14 3.64 2 Wearability 5 5 2 2 0 41 14 2.93 6 Durability 2 5 6 1 0 36 14 2.57 8 Comfort 6 5 3 0 0 45 14 3.21 5 Configuration 3 6 3 2 0 38 14 2.71 7 Worker’s confidence 9 4 0 0 1 48 14 3.43 4

84
• What is the impact of extremely good nighttime visibility of workers on the
following project factors?
0% 10% 20% 30% 40% 50% 60% 70% 80% 90% 100%
Labor relations
Worker motivation
Worker job satisfaction
Circulation patterns in case of an emergency
Circulation patterns within the work area
Project duration
Site productivity
Project cost
Positively impacted
Very important
Not changed
Somewhat important
Negatively impacted
The average ratings and the ranks of the project factors are calculated in the following table:
Project Factors
Posi
tivel
y Im
pact
ed (4
)
.
(3)
Not
Cha
nged
(2
)
.(1)
Neg
ativ
ely
Impa
ct (
0)
Tota
l Ran
king
Num
ber o
f re
spon
dent
s
Ave
rage
Rat
ing
Ran
king
Project cost 2 5 5 1 0 34 13 2.62 6 Site productivity 2 4 8 0 0 36 14 2.57 7 Project duration 2 3 9 0 0 35 14 2.50 8 Circulation patterns within the work area
2 5 7 0 0 37 14 2.64 4
Circulation patterns in case of an emergency
3 3 8 0 0 37 14 2.64 4
Worker job satisfaction 4 6 4 0 0 42 14 3.00 1
Worker motivation 3 7 4 0 0 41 14 2.93 3 Labor relations 4 6 4 0 0 42 14 3.00 1
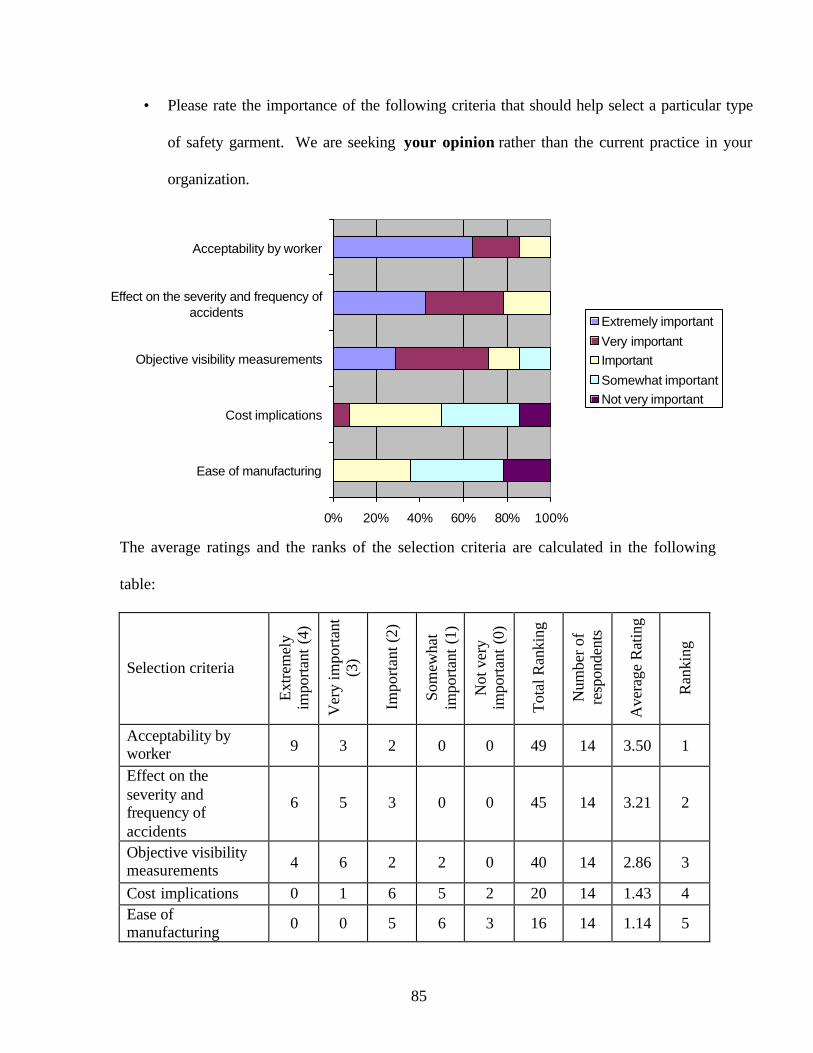
85
• Please rate the importance of the following criteria that should help select a particular type
of safety garment. We are seeking your opinion rather than the current practice in your
organization.
0% 20% 40% 60% 80% 100%
Ease of manufacturing
Cost implications
Objective visibility measurements
Effect on the severity and frequency ofaccidents
Acceptability by worker
Extremely important
Very importantImportant
Somewhat importantNot very important
The average ratings and the ranks of the selection criteria are calculated in the following
table:
Selection criteria
Extre
mel
y im
porta
nt (
4)
Ver
y im
porta
nt
(3)
Impo
rtan
t (2)
Som
ewha
t im
porta
nt (
1)
Not
ver
y im
porta
nt (
0)
Tota
l Ran
king
Num
ber o
f re
spon
dent
s
Ave
rage
Rat
ing
Ran
king
Acceptability by worker 9 3 2 0 0 49 14 3.50 1
Effect on the severity and frequency of accidents
6 5 3 0 0 45 14 3.21 2
Objective visibility measurements 4 6 2 2 0 40 14 2.86 3
Cost implications 0 1 6 5 2 20 14 1.43 4 Ease of manufacturing 0 0 5 6 3 16 14 1.14 5

86
5.2 Evaluation of Safety Garment Surveys Administered to Departments of
Transportation of Other States Than Illinois Involved in Nighttime Construction
Operations Within the Past 5 Years
The same questionnaire approved by the project TRP and used in the survey of
Illinois personnel was also administered to the departments of transportation of the 49 states
other than Illinois. A response rate of 22% (11 DOTs) was achieved. The low rate of
response is attributed to some states not having nighttime highway construction. The
findings of the survey are presented in the following sections:
I. Type, severity, and frequency of nighttime accidents involving workers in work
areas
• Do you think safety is more of a problem during nighttime or during daytime on
highway construction/rehabilitation/maintenance work areas?
Nighttime46%
Daytime18%
No difference27%
No idea9%
Depends on type of work0%
Notes:
1) 82% (9) of the respondents encountered at least one nighttime accident in their
projects.

87
2) More respondents from other states (46%) are concerned about nighttime accidents
than Illinois respondents (20%).
3) 9% (1) of the participants did not have enough information about the accidents that
occurred in their sites.
• How would you characterize the typical nighttime accident involving through traffic
or construction equipment in work areas? (Mark as many as appropriate but only for
the type(s) of work area you are familiar with)
o Construction/Rehabilitation:
Percentage (number) of responses
Worker struck by through traffic inside the work area 30% (3) Worker struck by through traffic outside the work area 40% (4) Worker struck by construction equipment ins ide the work area 50% (5) Worker struck by construction equipment outside the work area 0% (0) Others (traffic crashing into each) 20% (2)
o Maintenance: Only 55% (6) of the respondents had been involved in
maintenance projects, and of these 33% (2) encountered nighttime accidents.
Percentage (number) of responses
Worker struck by through traffic inside the work area 40% (2) Worker struck by through traffic outside the work area 20% (1) Worker struck by construction equipment inside the work area 0% (0) Worker struck by construction equipment outside the work area 0% (0) Others (traffic crashing into each) 40% (2)

88
o Consolidated Findings (including construction/ rehabilitation and maintenance
projects):
Percentage (number) of responses
Worker struck by through traffic inside the work area 33% (5) Worker struck by through traffic outside the work area 33% (5) Worker struck by construction equipment inside the work area 33% (5) Worker struck by construction equipment outside the work area 0% (0) Others (traffic crashing into each) 27% (4)
Note: The dominant nighttime accident types are similar in Illinois and other states.
• How severe was the worst worker-related nighttime accident caused by vehicles
driving through any of your DOT work areas in the last 5 years? (Answer only for
the type(s) of work areas you are familiar with)
o Construction/Rehabilitation: 8 respondents answered this question.
37%
38%
25%
Very severe (involves fatality)
Severe (involves injury but nofatality)Less severe (only propertydamage)

89
o Maintenance: 2 respondents answered this question.
50%50%
0%
Very severe (involvesfatality)
Severe (involves injurybut no fatality)
Less severe (onlyproperty damage)
o Consolidated Findings (including construction/ rehabilitation and maintenance
projects): The total number of respondents was 10.
40%
40%
20%
Very severe (involves fatality)
Severe (involves injury but nofatality)Less severe (only propertydamage)
Note: Nighttime accidents caused by vehicles driving through work zones in other
states are more severe than similar accidents in Illinois.
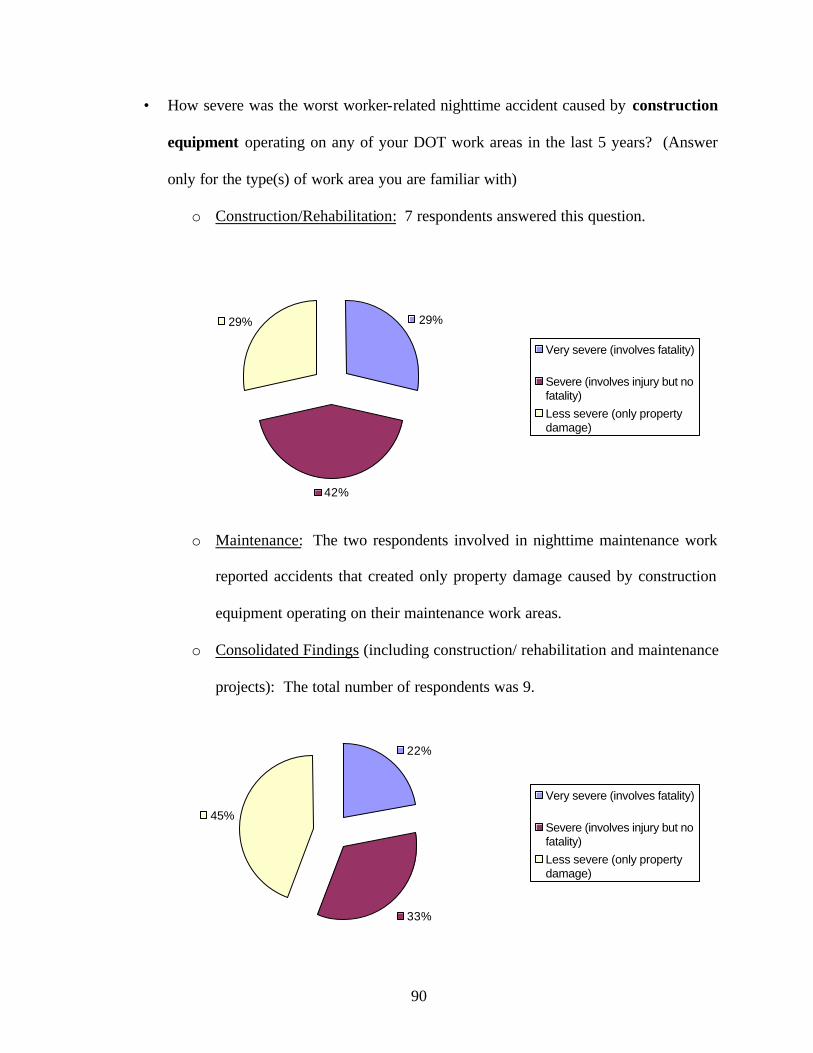
90
• How severe was the worst worker-related nighttime accident caused by construction
equipment operating on any of your DOT work areas in the last 5 years? (Answer
only for the type(s) of work area you are familiar with)
o Construction/Rehabilitation: 7 respondents answered this question.
29%
42%
29%
Very severe (involves fatality)
Severe (involves injury but nofatality)Less severe (only propertydamage)
o Maintenance: The two respondents involved in nighttime maintenance work
reported accidents that created only property damage caused by construction
equipment operating on their maintenance work areas.
o Consolidated Findings (including construction/ rehabilitation and maintenance
projects): The total number of respondents was 9.
22%
33%
45%
Very severe (involves fatality)
Severe (involves injury but nofatality)Less severe (only propertydamage)

91
• How frequent (on the average) were the worker-related nighttime accidents caused by
vehicles driving through any of your DOT work areas in the last 5 years? (Answer
only for the type(s) of work area you are familiar with)
o Construction/Rehabilitation: 10 respondents answered this question.
10%
20%
70%
Very frequent (more than 1accident/project)Frequent (1accident/project)Less frequent (less than1accident/project)
o Maintenance: All six respondents encountered worker-related nighttime
accidents that were caused by vehicles driving through maintenance work
areas in the last 5 years, at a rate of less than 1 accident/project.
o Consolidated Findings (including construction/ rehabilitation and maintenance
projects): The total number of respondents was 16.
6%
13%
81%
Very frequent (more than 1accident/project)Frequent (1accident/project)Less frequent (less than1accident/project)
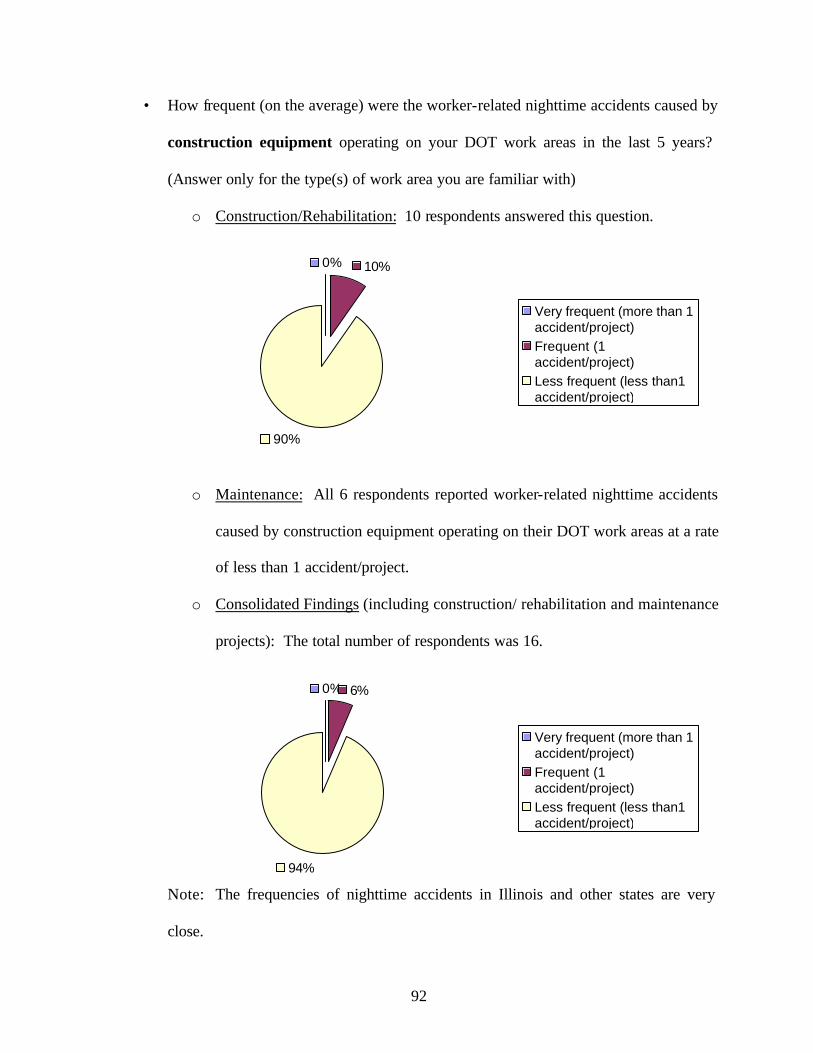
92
• How frequent (on the average) were the worker-related nighttime accidents caused by
construction equipment operating on your DOT work areas in the last 5 years?
(Answer only for the type(s) of work area you are familiar with)
o Construction/Rehabilitation: 10 respondents answered this question.
0% 10%
90%
Very frequent (more than 1accident/project)Frequent (1accident/project)Less frequent (less than1accident/project)
o Maintenance: All 6 respondents reported worker-related nighttime accidents
caused by construction equipment operating on their DOT work areas at a rate
of less than 1 accident/project.
o Consolidated Findings (including construction/ rehabilitation and maintenance
projects): The total number of respondents was 16.
0% 6%
94%
Very frequent (more than 1accident/project)Frequent (1accident/project)Less frequent (less than1accident/project)
Note: The frequencies of nighttime accidents in Illinois and other states are very
close.

93
• What are the major factors contributing to worker-related nighttime accidents in work
areas? (Mark as many as appropriate but only for the type(s) of work area you are
familiar with)
o Construction/Rehabilitation: 11 respondents answered this question.
Percentage (number) of responses
Poor lighting conditions 36% (4) Unfavorable weather conditions 9% (1) Poor performance of safety garment 0% (0) Workers not wearing safety garments 18% (2) Condition of vehicle operator (sleepy, DUI, age, etc.) 73% (8) Others: 36% (4)
o Maintenance: 6 respondents answered this question.
Percentage (number) of responses
Poor lighting conditions 33% (2) Unfavorable weather conditions 0% (0) Poor performance of safety garment 0% (0) Workers not wearing safety garments 0% (0) Condition of vehicle operator (sleepy, DUI, age, etc.) 50% (3) Others: 33% (2)
o Consolidated Findings (including construction/ rehabilitation and maintenance
projects): The total number of respondents was 17.
Percentage (number) of responses
Poor lighting conditions 35% (6) Unfavorable weather conditions 6% (1) Poor performance of safety garment 0% (0) Workers not wearing safety garments 12% (2) Condition of vehicle operator (sleepy, DUI, age, etc.) 65% (11) Others: 35% (6)

94
II. Evaluation of existing safety garments
• Describe the safety garments that are currently being used at nighttime on your
highway work areas:
Manufacturer: ………………. ……… Model: …………………………. Color of vest: .………………..……… Description: …………………… Color of retro-reflective material: ………………………………………….
From which source are you providing safety garments for your site?
Please specify (__________________________________________)
This part of the survey was prepared to find out the type and origin of the safety vests used
nationwide. The answers to this question are presented in the following table:

95
Respondent Organization Position Manufacturer
Respondent A Iowa DOT Traffic Safety/Automation Eng. Head Lites Corporation
Respondent B Michigan DOT Construction Staff Eng. Head Lites Corporation
Respondent C SC DOT Employee Safety Coordinator MTS Safety Products
Respondent D Idaho DOT Assistant State Traffic Eng. NorthWest Safety
Respondent E Maryland DOT Kishigo
Respondent F Wisconsin DOT Traffic Operations Eng. Head Lites Corporation
Respondent G Washington DOT Safety and Health Administrator Chami Design
Respondent H Arkansas DOT Staff Construction Engineer Iron Horse
Respondent I Oregon DOT Safety Program Coordinator Columbia George Center
Notes:
1) 82% of respondents mentioned the manufacturer of their existing vests. 2) All respondents mentioned the color of the vests and reflective material. 70% and 30% are using orange and green vests,
respectively. 70% are using vests with white/silver reflective material, 30% vests with yellow reflective material. 3) Respondents’ names are on file.

96
• How would you characterize the nighttime performance of the safety garments
currently in use on your work areas? ( The terms are referred to Table 1)
Table 1. Performance factors of safety garments (Modified from ASTM; Designation: F923-
00, 3M)
Factors Definitions
Visibility Transmission of light waves from workers’ garments to the eye of the driver of through traffic or equipment operators.
Conspicuity The characteristics that a worker’s garment will come to the attention of a driver or operator by means of sharp contrast with the background.
Reflectivity The measure of brightness of retro-reflective material used in workers’ garments making the garments more visible at nighttime.
Wearability The qualities of the garments that provide good fit, up-to-date look, likable colors and shapes, and weather protection.
Durability The ability of garments to retain their original characteristics after many wears and washes.
Comfort Garments’ features that prevent the worker from perspiring, being cold or hot, getting wet, or limiting their movements.
Configuration The exterior and interior design of safety garments such as size, number and function of pockets, use of buttons/zippers/Velcro.
Perceived effectiveness
The worker’s confidence that the garment he/she is wearing is visible to drivers and operators and that he/she can move around with no fear of being struck by a vehicle.
A scale (0-4) is used to evaluate the data obtained in the Part 2 (evaluation of existing safety garments) and Part 3 (safety garment design factors and features).
0- Not very important, negatively impacted or not acceptable 1- Somewhat important or needs improvement 2- Important, not changed or OK 3- Very important or very good 4- Extremely important, positively impacted or excellent

97
The following bar-chart represents the distribution of the answers to this question:
0% 10% 20% 30% 40% 50% 60% 70% 80% 90% 100%
Perc.effectiveness
ConfigurationComfort
DurabilityWearability
ReflectivityConspicuity
VisibilityReflectivity
Conspicuity
VisibilityReflectivity
ConspicuityVisibility
ReflectivityConspicuity
VisibilityW
etD
ryR
ural
Are
aU
rban
Are
a
Oth
ers
Wea
ther
Bac
kgro
und
Excellent
Very good
OK
Needs improvement
Not acceptable
The average ratings of the performance characteristics are calculated in the following table:
Exce
llent
(4)
Ver
y go
od (3
)
OK
(2)
Nee
ds
impr
ovem
ent (
1)
Not
acc
epta
ble
(0)
Tota
l Ran
king
Num
ber o
f R
espo
nden
ts
Ave
rage
Rat
ing
Visibility 6 3 1 0 0 35 10 3.50 Conspicuity 5 4 1 3 0 37 13 2.85 Urban
Area Reflectivity 6 4 0 0 0 36 10 3.60 Visibility 5 3 2 0 0 33 10 3.30 Conspicuity 4 4 2 0 0 32 10 3.20 B
ackg
roun
d
Rural Area
Reflectivity 5 5 0 0 0 35 10 3.50 Visibility 5 3 2 0 0 33 10 3.30 Conspicuity 5 4 1 0 0 34 10 3.40 Dry Reflectivity 6 3 1 0 0 35 10 3.50 Visibility 3 6 1 0 0 32 10 3.20 Conspicuity 1 7 2 0 0 29 10 2.90
Wea
ther
Wet Reflectivity 2 5 3 0 0 29 10 2.90 Wearability 2 5 3 0 0 29 10 2.90 Durability 2 2 3 3 0 23 10 2.30 Comfort 1 4 4 1 0 25 10 2.50 Configuration 3 5 2 0 0 31 10 3.10
Others
Perc.effectiveness 4 3 3 0 0 31 10 3.10

98
III. Safety garment design factors and features
• What is the importance of the following design factors in the use of retro-reflective
materials to enhance the nighttime visibility of your safety garments? (Refer to Table
2 for definitions)
Table 2. Design Factors that Enhance Nighttime Visibility (Modified from 3M)
Factors Definitions
Definability of the human form
The retro-reflective material on a garment being the only component visible to a driver at nighttime, it should make the driver recognize the object as a worker.
Location of retro-reflective materials on the garment
The appropriate location of the retro-reflective material on a safety garment should enhance its visibility by drawing the human eye to the moving object as the worker moves.
360° visibility The human form should be detected from all directions regardless of the human form, movement, location, and situation.
Amount of retro-reflective material
The amount of retro-reflective material applied should increase a worker’s visibility.
Brightness of the retro-reflective material
The brightness of retro-reflective material should increase a worker’s visibility.
Acceptable loss of color and brightness after repeated wear and washing
The garment should be resistant to wear and washing such that the garment maintains its color and brightness longer.

99
0% 20% 40% 60% 80% 100%
Acceptable loss of color and brightness afterrepeated wear and washing
Brightness of the retro-reflective material
Amount of retro-reflective material
360° visibility
Locations of retro-reflective materials on thegarment
Definability of the human form
Extremely important
Very important
Important
Somewhat important
Not very important
The average ratings and the ranks of the design factors are calculated in the following table:
Extre
mel
y im
porta
nt (
4)
Ver
y im
porta
nt (
3)
Impo
rtan
t (2)
Som
ewha
t im
porta
nt (
1)
Not
ver
y im
porta
nt (
0)
Tota
l R
anki
ng
Num
ber o
f re
spon
dent
s
Ave
rage
R
atin
g
Ran
king
Definability of the human form 5 5 0 1 0 36 11 3.27 3
Locations of retro-reflective materials on the garment 5 4 2 0 0 36 11 3.27 3
360° visibility 8 3 0 0 0 41 11 3.73 1
Amount of retro-reflective material 6 1 3 0 0 33 10 3.30 2
Brightness of the retro-reflective material 5 4 2 0 0 36 11 3.27 3
Acceptable loss of color and brightness after repeated wear and washing
3 2 3 3 0 27 11 2.45 6

100
• How important do you consider the following features of safety garments used in nighttime
construction? (See Table 1 for definitions)
0% 20% 40% 60% 80% 100%
Confidence
Configuration
Comfort
Durability
Wearability
Reflectivity
Conspicuity
Visibility
Extremely important
Very important
Important
Somewhat important
Not very important
The average ratings and the ranks of the safety garment features are calculated in the
following table:
Safety garment features
Extre
mel
y im
porta
nt (
4)
Ver
y im
porta
nt
(3)
Impo
rtant
(2)
Som
ewha
t im
porta
nt (
1)
Not
ver
y im
porta
nt (
0)
Tota
l Ran
king
Num
ber o
f re
spon
dent
s
Ave
rage
Rat
ing
Ran
king
Visibility 10 1 0 0 0 43 11 3.91 1 Conspicuity 7 3 1 0 0 39 11 3.55 3 Reflectivity 9 2 0 0 0 42 11 3.82 2
Wearability 3 6 1 1 0 33 11 3.00 5
Durability 1 6 2 2 0 28 11 2.55 8
Comfort 1 8 2 0 0 32 11 2.91 6
Configuration 2 6 1 2 0 30 11 2.73 7 Worker’s confidence
7 3 0 1 0 38 11 3.45 4

101
• What is the impact of extremely good nighttime visibility of workers on the following
project factors?
0% 20% 40% 60% 80% 100%
Labor relations
Worker motivation
Worker job satisfaction
Circulation patterns in case of an emergency
Circulation patterns within the work area
Project duration
Site productivity
Project cost
Positively impacted
Very important
Not changed
Somewhat important
Negatively impacted
The average ratings and the ranks of the project factors are calculated in the following table:
Project Factors
Posi
tivel
y Im
pact
ed (4
)
.
(3)
Not
Cha
nged
(2
)
.(1)
Neg
ativ
ely
Impa
ct (
0)
Tota
l R
anki
ng
Num
ber o
f re
spon
dent
s
Ave
rage
R
atin
g
Ran
king
Project cost 0 4 7 0 0 26 11 2.36 8 Site productivity 1 5 5 0 0 29 11 2.64 4 Project duration 0 5 6 0 0 27 11 2.45 7 Circulation patterns within the work area
0 6 5 0 0 28 11 2.55 6
Circulation patterns in case of an emergency
1 5 4 0 0 27 10 2.70 3
Worker job satisfaction 3 6 2 0 0 34 11 3.09 1
Worker motivation 3 6 2 0 0 34 11 3.09 1 Labor relations 1 5 5 0 0 29 11 2.64 4

102
• Please rate the importance of the following criteria that should help select a particular
type of safety garment. We are seeking your opinion rather than the current practice
in your organization.
0% 20% 40% 60% 80% 100%
Ease of manufacturing
Cost implications
Objective visibility measurements
Effect on the severity and frequency ofaccidents
Acceptability by worker
Extremely important
Very importantImportant
Somewhat importantNot very important
The average ratings and the ranks of the selection criteria are calculated in the following table:
Selection criteria
Extre
mel
y im
porta
nt (
4)
Ver
y im
porta
nt
(3)
Impo
rtan
t (2)
Som
ewha
t im
port
ant (
1)
Not
ver
y im
porta
nt (
0)
Tota
l Ran
king
Num
ber o
f re
spon
dent
s
Ave
rage
Rat
ing
Ran
king
Acceptability by worker 4 6 1 0 0 36 11 3.27 2
Effect on the severity and frequency of accidents
6 4 1 0 0 38 11 3.45 1
Objective visibility measurements 3 5 2 1 0 32 11 2.91 3
Cost implications 0 2 4 3 2 17 11 1.55 4 Ease of manufacturing 0 2 3 2 4 14 11 1.27 5
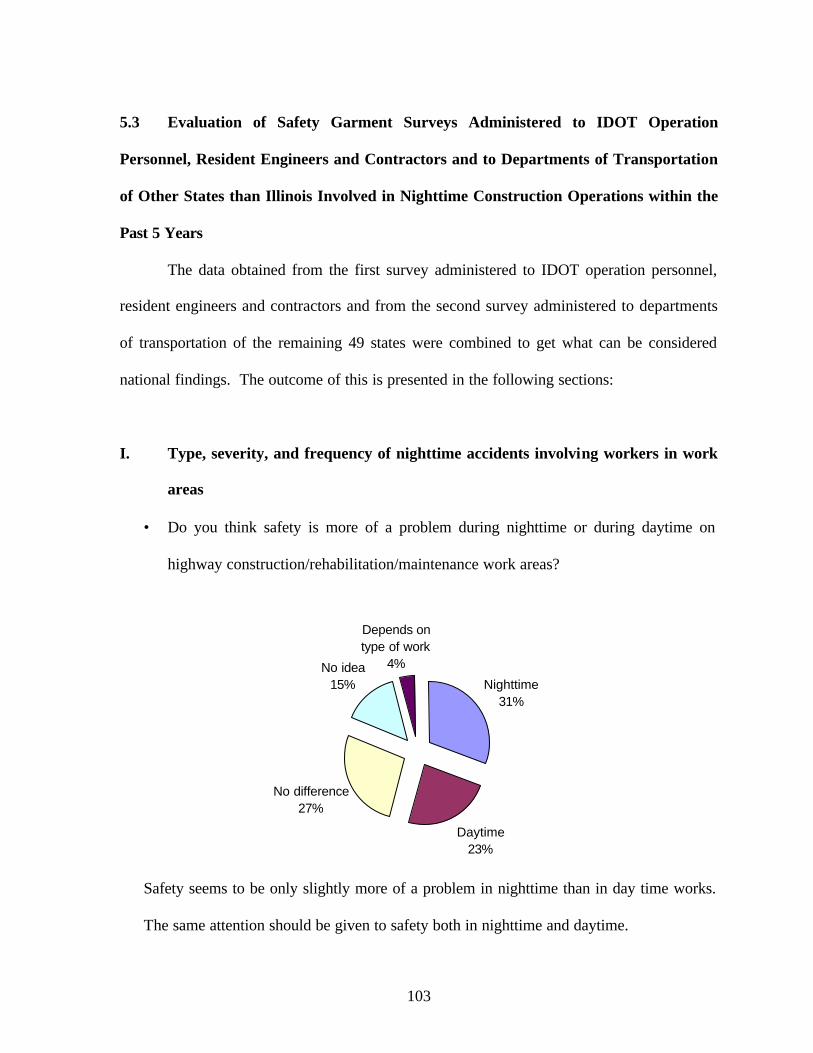
103
5.3 Evaluation of Safety Garment Surveys Administered to IDOT Operation
Personnel, Resident Engineers and Contractors and to Departments of Transportation
of Other States than Illinois Involved in Nighttime Construction Operations within the
Past 5 Years
The data obtained from the first survey administered to IDOT operation personnel,
resident engineers and contractors and from the second survey administered to departments
of transportation of the remaining 49 states were combined to get what can be considered
national findings. The outcome of this is presented in the following sections:
I. Type, severity, and frequency of nighttime accidents involving workers in work
areas
• Do you think safety is more of a problem during nighttime or during daytime on
highway construction/rehabilitation/maintenance work areas?
Nighttime31%
Daytime23%
No difference27%
No idea15%
Depends on type of work
4%
Safety seems to be only slightly more of a problem in nighttime than in day time works.
The same attention should be given to safety both in nighttime and daytime.

104
Notes:
1) 65% (17) of respondents encountered at least one nighttime accident in work
areas in the last 5 years.
2) 8% (2) of participants did not have enough information about the nighttime
accidents in their sites.
• How would you characterize the typical nighttime accident involving through traffic
or construction equipment in work areas? (Mark as many as appropriate but only for
the type(s) of work area you are familiar with)
o Construction/Rehabilitation:
Percentage
(number) of responses
Worker struck by through traffic inside the work area 39% (7) Worker struck by through traffic outside the work area 38% (7) Worker struck by construction equipment inside the work area 31% (11) Worker struck by construction equipment outside the work area 6% (1) Others (TCDs struck) 22% (4)
o Maintenance:
Percentage (number) of responses
Worker struck by through traffic inside the work area 57% (4) Worker struck by through traffic outside the work area 14% (1) Worker struck by construction equipment inside the work area 0% (0) Worker struck by construction equipment outside the work area 0% (0) Others (TCDs struck) 29% (2)
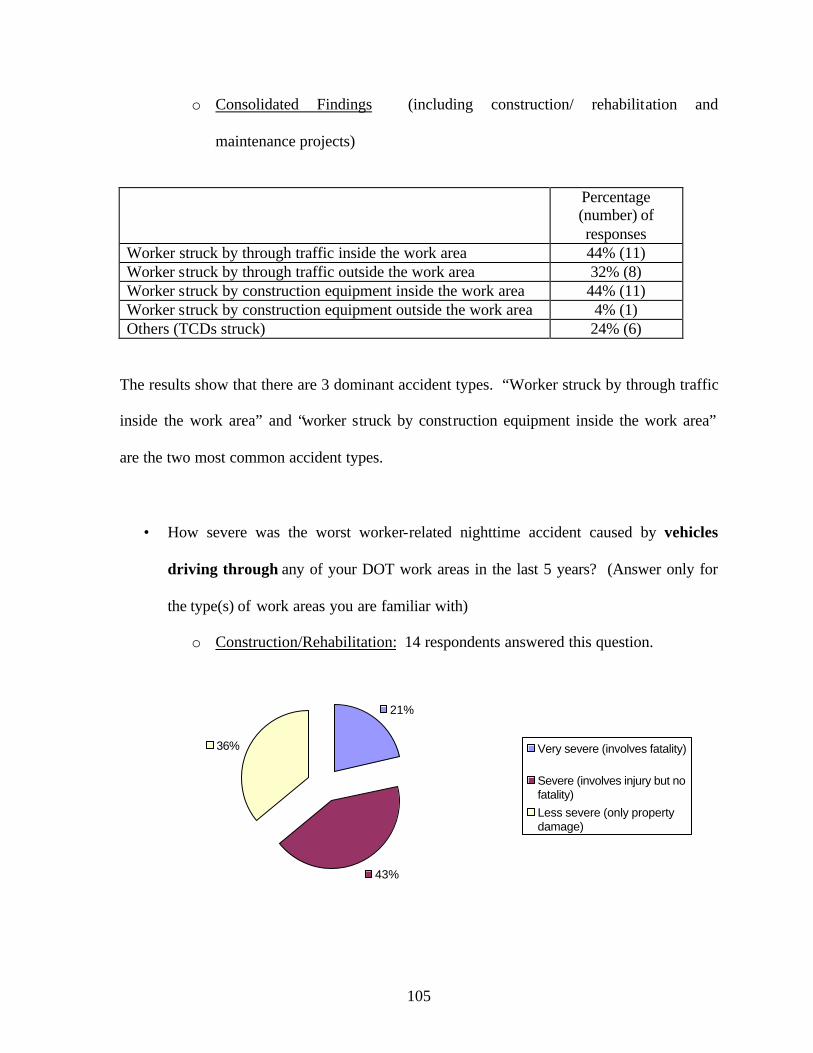
105
o Consolidated Findings (including construction/ rehabilitation and
maintenance projects)
Percentage
(number) of responses
Worker struck by through traffic inside the work area 44% (11) Worker struck by through traffic outside the work area 32% (8) Worker struck by construction equipment inside the work area 44% (11) Worker struck by construction equipment outside the work area 4% (1) Others (TCDs struck) 24% (6)
The results show that there are 3 dominant accident types. “Worker struck by through traffic
inside the work area” and “worker struck by construction equipment inside the work area”
are the two most common accident types.
• How severe was the worst worker-related nighttime accident caused by vehicles
driving through any of your DOT work areas in the last 5 years? (Answer only for
the type(s) of work areas you are familiar with)
o Construction/Rehabilitation: 14 respondents answered this question.
21%
43%
36% Very severe (involves fatality)
Severe (involves injury but nofatality)Less severe (only propertydamage)

106
o Maintenance: Only 3 of the respondents have reported this kind of accident.
In maintenance projects, accidents are more severe.
67%
33%
0%
Very severe (involves fatality)
Severe (involves injury but nofatality)Less severe (only propertydamage)
o Consolidated Findings (including construction/ rehabilitation and maintenance
projects): The total number of respondents was 17.
29%
42%
29%
Very severe (involves fatality)
Severe (involves injury but nofatality)Less severe (only propertydamage)
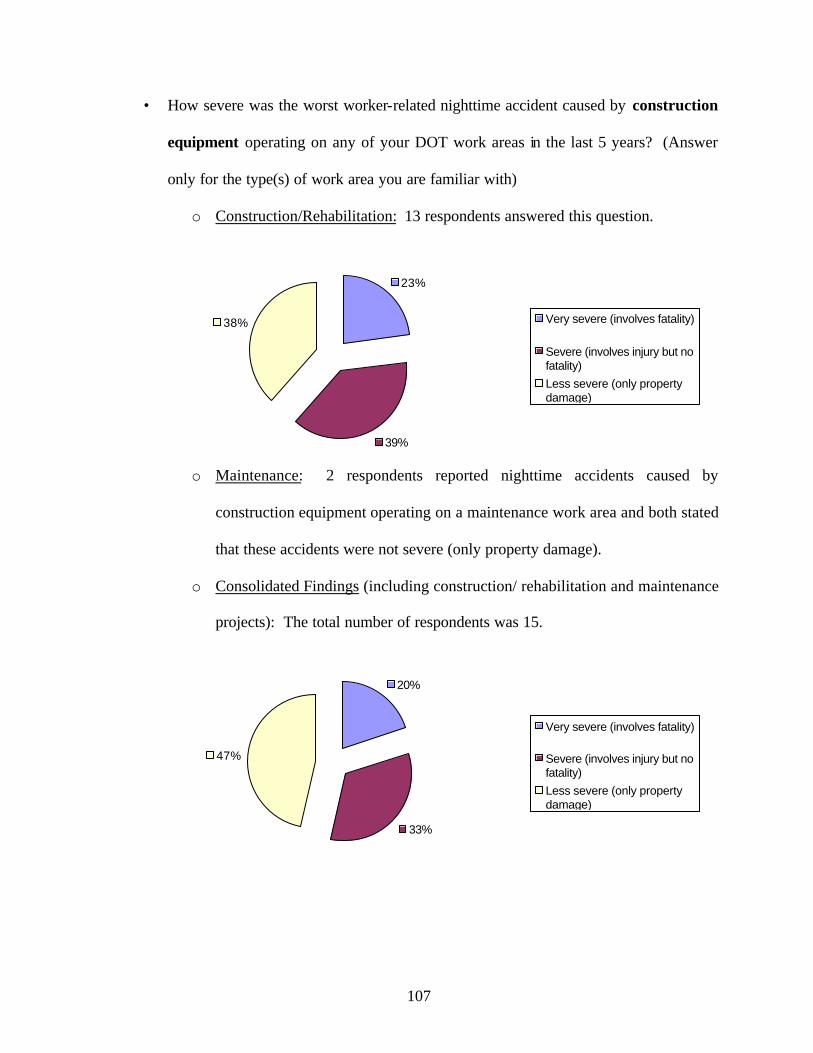
107
• How severe was the worst worker-related nighttime accident caused by construction
equipment operating on any of your DOT work areas in the last 5 years? (Answer
only for the type(s) of work area you are familiar with)
o Construction/Rehabilitation: 13 respondents answered this question.
23%
39%
38% Very severe (involves fatality)
Severe (involves injury but nofatality)Less severe (only propertydamage)
o Maintenance: 2 respondents reported nighttime accidents caused by
construction equipment operating on a maintenance work area and both stated
that these accidents were not severe (only property damage).
o Consolidated Findings (including construction/ rehabilitation and maintenance
projects): The total number of respondents was 15.
20%
33%
47%
Very severe (involves fatality)
Severe (involves injury but nofatality)Less severe (only propertydamage)

108
• How frequent (on the average) were the worker-related nighttime accidents caused by
vehicles driving through any of your DOT work areas in the last 5 years? (Answer
only for the type(s) of work area you are familiar with)
o Construction/Rehabilitation: 24 respondents answered this question.
4%
17%
79%
Very frequent (more than 1accident/project)Frequent (1 accident/project)
Less frequent (less than1accident/project)
o Maintenance: All 7 respondents who answered this question reported that
worker-related nighttime accidents caused by vehicles driving through work
areas occurred at a rate of 1 accident/project.
o Consolidated Findings (including construction/ rehabilitation and maintenance
projects): The total number of respondents was 26.
3%13%
84%
Very frequent (more than 1accident/project)Frequent (1 accident/project)
Less frequent (less than1accident/project)
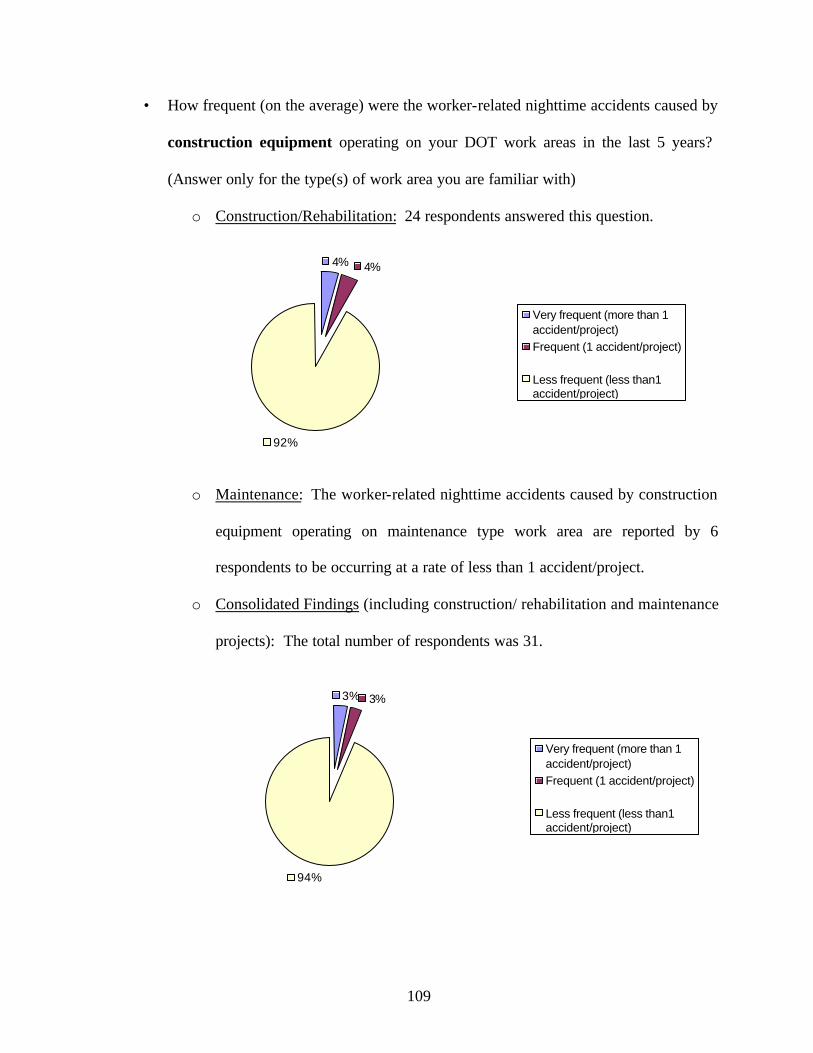
109
• How frequent (on the average) were the worker-related nighttime accidents caused by
construction equipment operating on your DOT work areas in the last 5 years?
(Answer only for the type(s) of work area you are familiar with)
o Construction/Rehabilitation: 24 respondents answered this question.
4% 4%
92%
Very frequent (more than 1accident/project)Frequent (1 accident/project)
Less frequent (less than1accident/project)
o Maintenance: The worker-related nighttime accidents caused by construction
equipment operating on maintenance type work area are reported by 6
respondents to be occurring at a rate of less than 1 accident/project.
o Consolidated Findings (including construction/ rehabilitation and maintenance
projects): The total number of respondents was 31.
3% 3%
94%
Very frequent (more than 1accident/project)Frequent (1 accident/project)
Less frequent (less than1accident/project)

110
• What are the major factors contributing to worker-related nighttime accidents in work
areas? (Mark as many as appropriate but only for the type(s) of work area you are
familiar with)
o Construction/Rehabilitation:
Percentage (number) of responses
Poor lighting conditions 50% (10) Unfavorable weather conditions 20% (4) Poor performance of safety garment 10% (2) Workers not wearing safety garments 20% (4) Condition of vehicle operator (sleepy, DUI, age, etc.) 65% (13) Others: 30% (6)
o Maintenance: Percentage (number)
of responses Poor lighting conditions 25% (2) Unfavorable weather conditions 13% (1) Poor performance of safety garment 0% (0) Workers not wearing safety garments 0% (0) Condition of vehicle operator (sleepy, DUI, age, etc.) 63% (5) Others: 38% (3)
o Consolidated Findings (including construction/ rehabilitation and
maintenance projects)
Percentage (number) of responses
Poor lighting conditions 43% (12) Unfavorable weather conditions 18% (5) Poor performance of safety garment 7% (2) Workers not wearing safety garments 14% (4) Condition of vehicle operator (sleepy, DUI, age, etc.) 64% (18) Others: 32% (9)

111
The accidents caused by vehicles driving through the work area are more severe and frequent
than the accidents caused by the construction equipment operating in the work area. The
main reason is condition of vehicle operators. Poor lighting condition is the second most
common reason for those accidents.
II. Evaluation of existing safety garments
• Describe the safety garments that are currently being used at nighttime on your
highway work areas:
Manufacturer: ………………. ……… Model: …………………………. Color of vest: .………………..……… Description: …………………… Color of retro-reflective material: ………………………………………….
This part of the survey was prepared to find out the type and origin of the safety vests used.
The answers to this question are presented in the following table.

112
Respondent Organization Position Manufacturer
Respondent 1 Illinois DOT/Dist. 8 Resident Engineer Warning Lights (supplier)
Respondent 2 Illinois DOT/Dist. 2 Resident Engineer IDOT (supplier)
Respondent 3 Illinois DOT/ Dist. 6 CE IV Dist. 6 Admin Office (supplier)
Respondent 4 Illinois DOT/ Dist. 5 Resident Engineer IDOT (supplier)
Respondent 5 Gallagher Asphalt General Constructor Coordinator Main Store Room
Respondent 6 Illinois DOT/ Dist. 8 Resident Engineer Construction Office
Respondent 7 Rockford Const. Operations Manager Ahop/Pants Department
Respondent 8 Illinois DOT/ Dist. 8 Resident Engineer District Safety Bureau (supplier)
Respondent 9 Illinois DOT/ Dist. 8 CE III IDOT (supplier)
Respondent A Iowa DOT Traffic Safety/Automation Eng. Head Lites Corporation
Respondent B Michigan DOT Construction Staff Eng. Head Lites Corporation
Respondent C SC DOT Employee Safety Coordinator MTS Safety Products
Respondent D Idaho DOT Assistant State Traffic Eng. NorthWest Safety
Respondent E Maryland DOT Kishigo
Respondent F Wisconsin DOT Traffic Operations Eng. Head Lites Corporation
Respondent G Washington DOT Safety and Health Administrator Chami Design
Respondent H Arkansas DOT Staff Construction Engineer Iron Horse
Respondent I Oregon DOT Safety Program Coordinator Columbia George Center

113
Note: 73% of the respondents mentioned the color of the vests and reflective materials. Of these respondents, 79% were using orange vests, 21% green vests, 58% vest with green retro-reflective material, 37% vests with silver retro-reflective material and 5% vests with red retro-reflective material. DOT’s other than IDOT prefer mostly silver retro-reflective material but Illinois respondents prefer green. Respondents’ names are on file.
• How would you characterize the nighttime performance of the safety garments
currently in use on your work areas? (Refer to Table 1 for definitions)
Table 1. Performance factors of safety garments (Modified from ASTM; Designation: F923-00, 3M)
Factors Definitions
Visibility Transmission of light waves from workers’ garments to the eye of the driver of through traffic or equipment operators.
Conspicuity The characteristics that a worker’s garment will come to the attention of a driver or operator by means of sharp contrast with the background.
Reflectivity The measure of brightness of retro-reflective material used in workers’ garments making the garments more visible at nighttime.
Wearability The qualities of the garments that provide good fit, up-to-date look, likable colors and shapes, and weather protection.
Durability The ability of garments to retain their original characteristics after many wears and washes.
Comfort Garments’ features that prevent the worker from perspiring, being cold or hot, getting wet, or limiting their movements.
Configuration The exterior and interior design of safety garments such as size, number and function of pockets, use of buttons/zippers/Velcro.
Perceived effectiveness
The worker’s confidence that the garment he/she is wearing is visible to drivers and operators and that he/she can move around with no fear of being struck by a vehicle.

114
The following bar-chart represents the distribution of the answers to this question:
0% 20% 40% 60% 80% 100%
Perc.effectiveness
ConfigurationComfort
DurabilityWearability
ReflectivityConspicuity
VisibilityReflectivity
Conspicuity
VisibilityReflectivity
ConspicuityVisibility
ReflectivityConspicuity
Visibility
Wet
Dry
Rur
alA
rea
Urb
anA
rea
Oth
ers
Wea
ther
Bac
kgro
und
Excellent
Very good
OK
Needs improvement
Not acceptable
A scale (0-4) is used to evaluate the data obtained in the Part 2 (evaluation of existing safety
garments) and Part 3 (safety garment design factors and features).
1- Not very important, negatively impacted or not acceptable 2- Somewhat important or needs improvement 3- Important, not changed or OK 4- Very important or very good 5- Extremely important, positively impacted or excellent
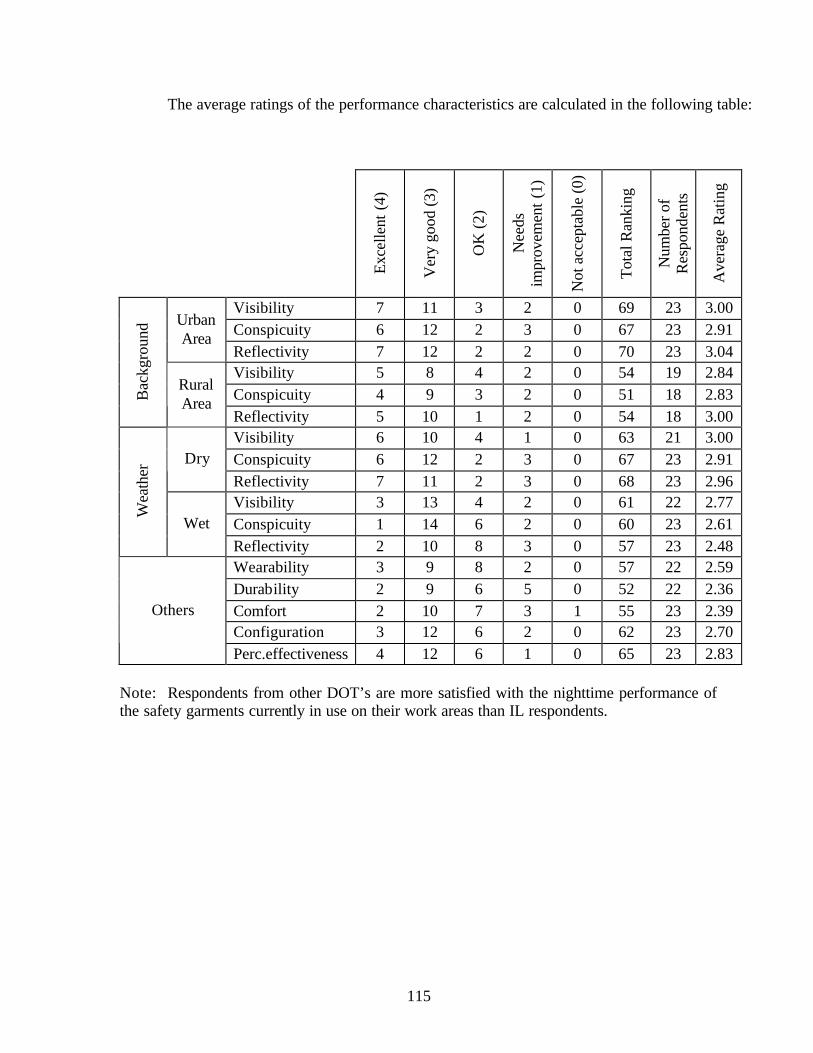
115
The average ratings of the performance characteristics are calculated in the following table:
Exce
llent
(4)
Ver
y go
od (3
)
OK
(2)
Nee
ds
impr
ovem
ent (
1)
Not
acc
epta
ble
(0)
Tota
l Ran
king
Num
ber o
f R
espo
nden
ts
Ave
rage
Rat
ing
Visibility 7 11 3 2 0 69 23 3.00 Conspicuity 6 12 2 3 0 67 23 2.91
Urban Area
Reflectivity 7 12 2 2 0 70 23 3.04 Visibility 5 8 4 2 0 54 19 2.84 Conspicuity 4 9 3 2 0 51 18 2.83 B
ackg
roun
d
Rural Area
Reflectivity 5 10 1 2 0 54 18 3.00 Visibility 6 10 4 1 0 63 21 3.00 Conspicuity 6 12 2 3 0 67 23 2.91 Dry Reflectivity 7 11 2 3 0 68 23 2.96 Visibility 3 13 4 2 0 61 22 2.77 Conspicuity 1 14 6 2 0 60 23 2.61
Wea
ther
Wet Reflectivity 2 10 8 3 0 57 23 2.48 Wearability 3 9 8 2 0 57 22 2.59 Durability 2 9 6 5 0 52 22 2.36 Comfort 2 10 7 3 1 55 23 2.39 Configuration 3 12 6 2 0 62 23 2.70
Others
Perc.effectiveness 4 12 6 1 0 65 23 2.83 Note: Respondents from other DOT’s are more satisfied with the nighttime performance of the safety garments currently in use on their work areas than IL respondents.

116
III. Safety garment design factors and features
• What is the importance of the following design factors in the use of retro-reflective
materials to enhance the nighttime visibility of your safety garments? (Refer to the
Table 2 for definitions)
Table 2. Design Factors that Enhance Nighttime Visibility (Modified from 3M)
Factors Definitions
Definability of the human form
The retro-reflective material on a garment being the only component visible to a driver at nighttime, it should make the driver recognize the object as a worker.
Location of retro-reflective materials on the garment
The appropriate location of the retro-reflective material on a safety garment should enhance its visibility by drawing the human eye to the moving object as the worker moves.
360° visibility The human form should be detected from all directions regardless of the human form, movement, location, and situation.
Amount of retro-reflective material
The amount of retro-reflective material applied should increase a worker’s visibility.
Brightness of the retro-reflective material The brightness of retro-reflective material should increase a worker’s visibility.
Acceptable loss of color and brightness after repeated wear and washing
The garment should be resistant to wear and washing such that the garment maintains its color and brightness longer.

117
0% 20% 40% 60% 80% 100%
Acceptable loss of color and brightness afterrepeated wear and washing
Brightness of the retro-reflective material
Amount of retro-reflective material
360° visibility
Locations of retro-reflective materials on thegarment
Definability of the human form
Extremely important
Very important
Important
Somewhat important
Not very important
The average ratings and the ranks of the design factors are calculated in the following table:
Extre
mel
y im
porta
nt (
4)
Ver
y im
porta
nt (
3)
Impo
rtan
t (2)
Som
ewha
t im
porta
nt (
1)
Not
ver
y im
porta
nt (
0)
Tota
l R
anki
ng
Num
ber o
f re
spon
dent
s
Ave
rage
R
atin
g
Ran
king
Definability of the human form 9 12 3 1 0 79 25 3.16 3
Locations of retro-reflective materials on the garment 8 12 3 2 0 76 25 3.04 5
360° visibility 15 10 0 0 0 90 25 3.60 1
Amount of retro-reflective material 8 11 5 0 0 75 24 3.13 4
Brightness of the retro-reflective material 8 14 3 0 0 80 25 3.20 2
Acceptable loss of color and brightness after repeated wear and washing
5 8 8 4 0 64 25 2.56 6

118
Notes:
(1) The respondents are mostly concerned with 360° visibility of the safety vests. In
ANSI/ISED 107-1999 standard (American National Standard for High-Visibility Safety
Apparel), it is stated that:
(2) “Class 1, 2 or 3 garments such as vests, waistcoats, jackets, ponchos, coveralls, and bib
overalls shall meet the requirements for the respective Class of high-visibility safety clothing,
and shall have contiguous areas of retroreflective material encircling the torso, placed in such
a manner to provide 360° visibility of the wearer.”
(3) So ANSI makes 360° visibility a must for safety apparel. ANSI-107 also includes a table,
which shows the minimum area of the retroreflective material and its performance. In the
Appendix B of ANSI-107 there are some suggested garment designs.
• How important do you consider the following features of safety garments used in
nighttime construction? (See Table 1 for definitions)
0% 20% 40% 60% 80% 100%
Confidence
Configuration
Comfort
Durability
Wearability
Reflectivity
Conspicuity
Visibility
Extremely important
Very important
Important
Somewhat important
Not very important
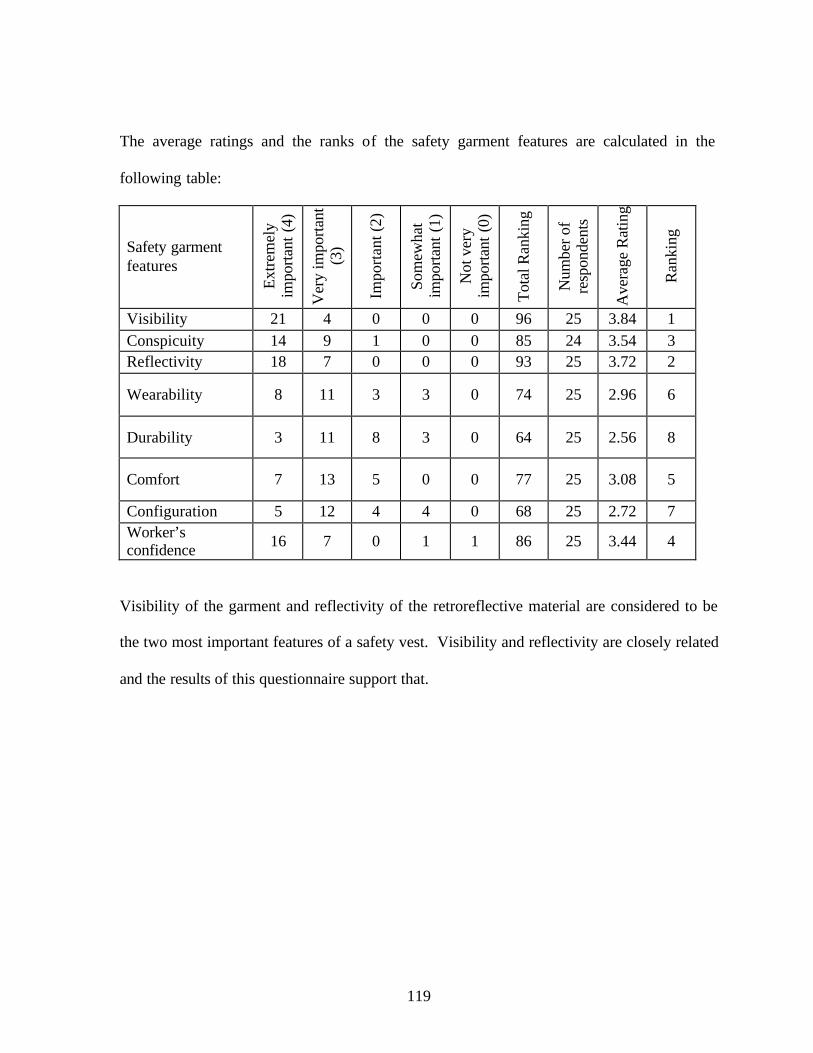
119
The average ratings and the ranks of the safety garment features are calculated in the
following table:
Safety garment features
Extre
mel
y im
porta
nt (
4)
Ver
y im
porta
nt
(3)
Impo
rtan
t (2)
Som
ewha
t im
porta
nt (
1)
Not
ver
y im
porta
nt (
0)
Tota
l Ran
king
Num
ber o
f re
spon
dent
s
Ave
rage
Rat
ing
Ran
king
Visibility 21 4 0 0 0 96 25 3.84 1 Conspicuity 14 9 1 0 0 85 24 3.54 3 Reflectivity 18 7 0 0 0 93 25 3.72 2
Wearability 8 11 3 3 0 74 25 2.96 6
Durability 3 11 8 3 0 64 25 2.56 8
Comfort 7 13 5 0 0 77 25 3.08 5
Configuration 5 12 4 4 0 68 25 2.72 7 Worker’s confidence 16 7 0 1 1 86 25 3.44 4
Visibility of the garment and reflectivity of the retroreflective material are considered to be
the two most important features of a safety vest. Visibility and reflectivity are closely related
and the results of this questionnaire support that.
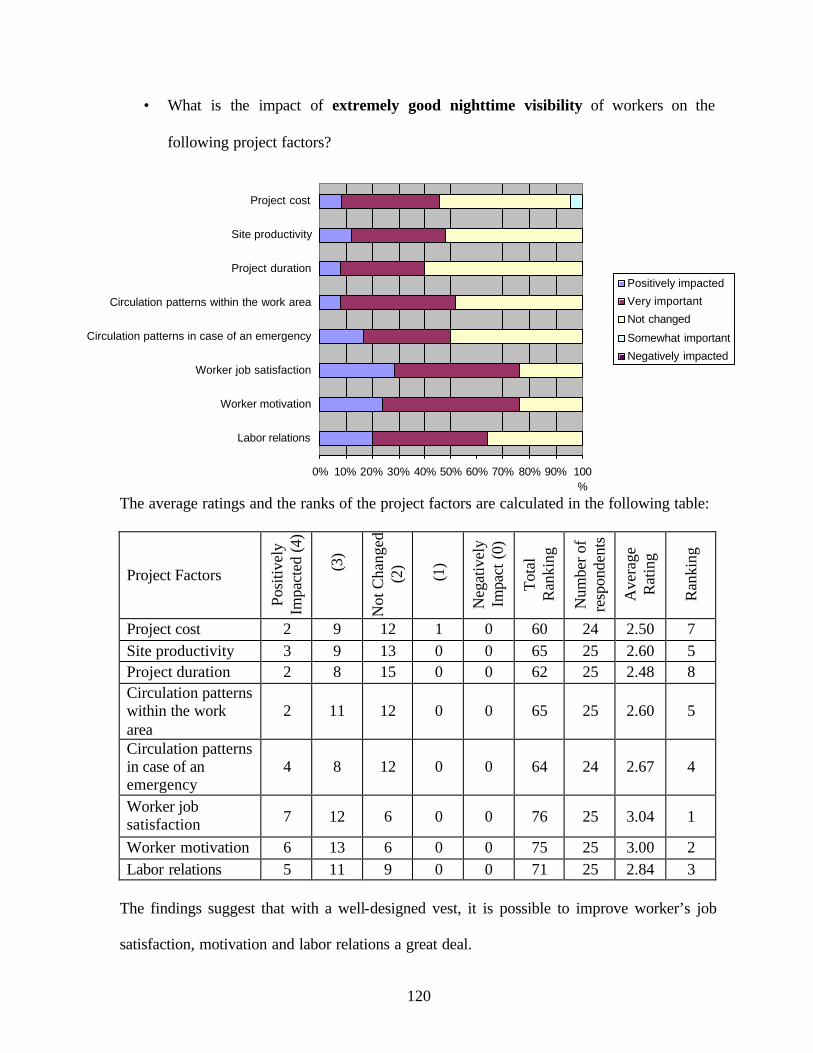
120
• What is the impact of extremely good nighttime visibility of workers on the
following project factors?
0% 10% 20% 30% 40% 50% 60% 70% 80% 90% 100%
Labor relations
Worker motivation
Worker job satisfaction
Circulation patterns in case of an emergency
Circulation patterns within the work area
Project duration
Site productivity
Project cost
Positively impacted
Very important
Not changed
Somewhat important
Negatively impacted
The average ratings and the ranks of the project factors are calculated in the following table:
Project Factors
Posi
tivel
y Im
pact
ed (4
)
.
(3)
Not
Cha
nged
(2
)
.(1)
Neg
ativ
ely
Impa
ct (
0)
Tota
l R
anki
ng
Num
ber o
f re
spon
dent
s
Ave
rage
R
atin
g
Ran
king
Project cost 2 9 12 1 0 60 24 2.50 7 Site productivity 3 9 13 0 0 65 25 2.60 5 Project duration 2 8 15 0 0 62 25 2.48 8 Circulation patterns within the work area
2 11 12 0 0 65 25 2.60 5
Circulation patterns in case of an emergency
4 8 12 0 0 64 24 2.67 4
Worker job satisfaction 7 12 6 0 0 76 25 3.04 1
Worker motivation 6 13 6 0 0 75 25 3.00 2 Labor relations 5 11 9 0 0 71 25 2.84 3
The findings suggest that with a well-designed vest, it is possible to improve worker’s job
satisfaction, motivation and labor relations a great deal.

121
• Please rate the importance of the following criteria that should help select a particular
type of safety garment. We are seeking your opinion rather than the current practice
in your organization.
0% 20% 40% 60% 80% 100%
Ease of manufacturing
Cost implications
Objective visibility measurements
Effect on the severity and frequency ofaccidents
Acceptability by worker
Extremely importantVery importantImportant
Somewhat importantNot very important

122
The average ratings and the ranks of selection criteria are calculated in the following table:
Selection criteria
Extre
mel
y im
porta
nt (
4)
Ver
y im
porta
nt
(3)
Impo
rtan
t (2)
Som
ewha
t im
porta
nt (
1)
Not
ver
y im
porta
nt (
0)
Tota
l Ran
king
Num
ber o
f re
spon
dent
s
Ave
rage
Rat
ing
Ran
king
Acceptability by worker 13 9 3 0 0 85 25 3.40 1
Effect on the severity and frequency of accidents
12 9 4 0 0 83 25 3.32 2
Objective visibility measurements 7 11 4 3 0 72 25 2.88 3
Cost implications 0 3 10 8 4 37 25 1.48 4 Ease of manufacturing 0 2 8 8 7 30 25 1.20 5
“Acceptability by workers” and “effect on the severity and frequency of accidents” are the
most important two criteria the respondents identified for safety garments. The vest should
make the worker feel safe and decrease the frequency and severity of the accidents.
5.4 Conclusion
The findings of the surveys administered to IDOT operation personnel, resident
engineers and contractors and to departments of transportation of other states than Illinois
involved in nighttime construction operations within the past 5 years can be summarized in
the following short statements:
• Safety does not seem to be any more of a problem in nighttime than in daytime
works. The same attention should be given to safety both in nighttime and daytime
works.

123
• The results show that there are 3 dominant accident types. “Worker struck by
through traffic inside the work area” and “Worker struck by construction equipment
inside the work area” are the two most common accident types. The dominant
nighttime accident types are similar in Illinois and other states.
• The accidents caused by vehicles driving through the work area are more severe and
frequent than the accidents caused by construction equipment operating in the work
area.
• The main reason for nighttime accidents is the condition of vehicle operators. Poor
lighting condition is the second most common reason for these accidents.
• The respondents are mostly concerned with 360° visibility of the safety vests. It is no
surprise that ANSI standards make 360° visibility a requirement for safety apparel.
• Visibility of the garment and reflectivity of the retro-reflective material are
considered to be the two most important features of a safety vest. Visibility and
reflectivity are closely related and the results of this survey support that.
• The findings suggest that with a well-designed vest, it is possible to improve workers’
job satisfaction, motivation and labor relations a great deal.
• “Acceptability by workers” and “effect on the severity and frequency of accidents”
are the most important two criteria the respondents identified for safety garments.
The vest should make the worker feel safe and decrease the frequency and severity of
the accidents.
• Last but not least, the data obtained from Illinois respondents and other DOT
agencies, are to a great extent, similar. The only difference appears to be in the
respondents’ opinions concerning the nighttime performance of currently used safety

124
vests. Respondents from other DOTs are more satisfied with the nighttime
performance of the safety garments currently in use on their work areas than IL
respondents.
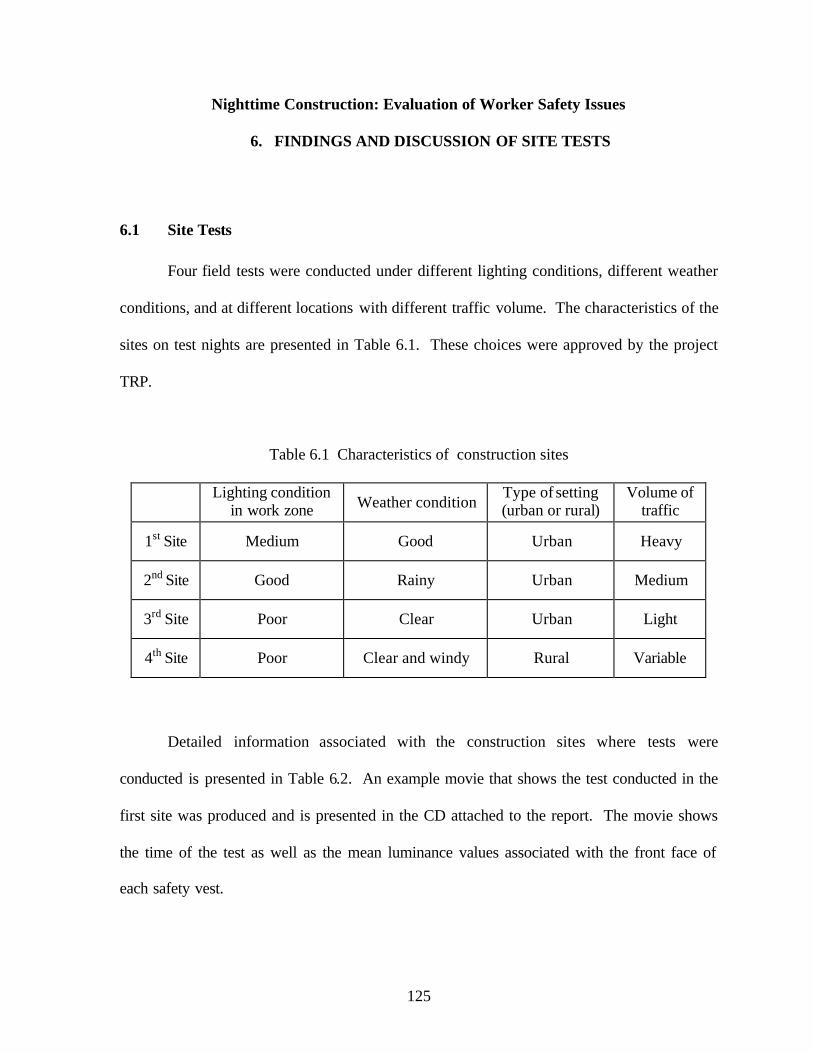
125
Nighttime Construction: Evaluation of Worker Safety Issues
6. FINDINGS AND DISCUSSION OF SITE TESTS
6.1 Site Tests
Four field tests were conducted under different lighting conditions, different weather
conditions, and at different locations with different traffic volume. The characteristics of the
sites on test nights are presented in Table 6.1. These choices were approved by the project
TRP.
Table 6.1 Characteristics of construction sites
Lighting condition
in work zone Weather condition Type of setting (urban or rural)
Volume of traffic
1st Site Medium Good Urban Heavy
2nd Site Good Rainy Urban Medium
3rd Site Poor Clear Urban Light
4th Site Poor Clear and windy Rural Variable
Detailed information associated with the construction sites where tests were
conducted is presented in Table 6.2. An example movie that shows the test conducted in the
first site was produced and is presented in the CD attached to the report. The movie shows
the time of the test as well as the mean luminance values associated with the front face of
each safety vest.
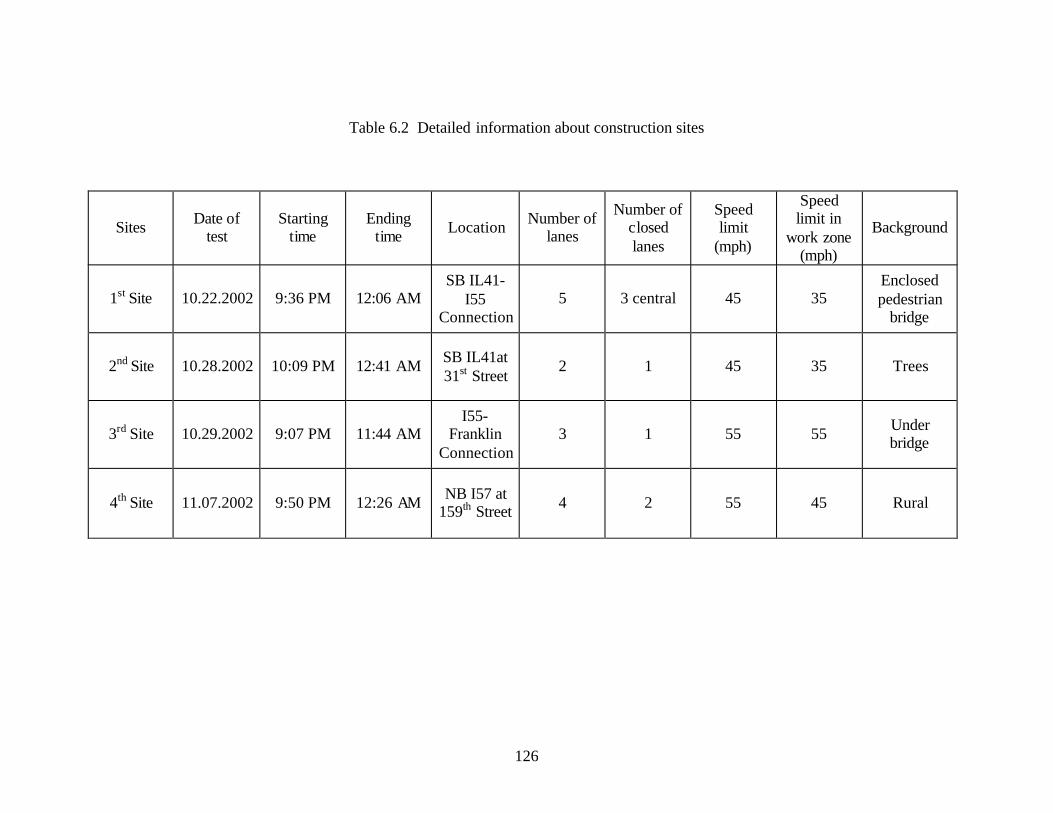
126
Table 6.2 Detailed information about construction sites
Sites Date of test
Starting time
Ending time Location Number of
lanes
Number of closed lanes
Speed limit
(mph)
Speed limit in
work zone (mph)
Background
1st Site 10.22.2002 9:36 PM 12:06 AM SB IL41-
I55 Connection
5 3 central 45 35 Enclosed pedestrian
bridge
2nd Site 10.28.2002 10:09 PM 12:41 AM SB IL41at 31st Street
2 1 45 35 Trees
3rd Site 10.29.2002 9:07 PM 11:44 AM I55-
Franklin Connection
3 1 55 55 Under bridge
4th Site 11.07.2002 9:50 PM 12:26 AM NB I57 at 159th Street 4 2 55 45 Rural

127
6.1.1 Descriptive Statistics
The mean luminance values were calculated using the method explained in
Chapter 4. Descriptive statistics are run for both front faces and sides of the six vests
tested on each of the four construction sites. The results are tabulated in Appendix G.
6.1.2 Normalization of Luminance Values
After running the descriptive statistics of the data collected, the next step is to
normalize the mean luminance values of the vests in order to eliminate the effect of
different traffic volumes (and therefore the effect of different lighting conditions)
recorded during each shift of the tests.
The photometer which was attached to the center stand, recorded the average
intensity of light at the test site. There are two sources of light at the test site. First is
lighting at the construction site and the second is light generated by passing cars. The
photometer calculated the average light intensity at each shift of 10 minutes. So the mean
luminance values of the vests were normalized using the photometer readings whenever
they were reliable. The photometer used in field tests, calculates mean light intensity in
integers, without any decimals. So, when working with very small light intensities,
rounding off resulted in inaccurate and unreliable values. For example, the photometer
readings on the third and fourth sites varied between 1-2 and 1-3, respectively. So the
mean luminance values of the vests obtained at these two sites were normalized using the
average traffic volume, a more reliable measure than using average photometer readings.
There was no such problem in the first and the second sites where average photometer
readings ranged between 16-17 and 48-50, respectively. The mean luminance values

128
obtained at these sites were normalized using average photometer readings for each shift.
The normalized mean luminance values are tabulated in Appendix H.
6.1.3 Comparison of Vest Positions in Site Tests
This section is included in the report to show that recording every vest at three
positions (stand closest to cones separating the work zone from open lanes, center stand,
and stand farthest from the open lane) is reasonable. A statistical analysis was run to see
if there is any statistically significant difference between the normalized mean luminance
values obtained in these three positions. The normalized values obtained in the first test
site for the front face of the IDOT Standard Vest are presented in Table 6.3.
Table 6.3 Descriptive statistics for position comparison
Vest Position Mean luminance
N Std. Deviation
Minimum Maximum
Left 96.319 266 2.989 91.34 109.11
Middle 93.585 251 4.051 78.03 102.11
Right 88.524 262 4.649 73.78 100.73
IDOT Standard
Vest Total 92.816 779 5.114 73.78 109.11
It can be observed in Table 6.3 that the standard deviation and the variance of the
means calculated at each of the three positions are different from each other. So
Tamhane’s T2 test, one of the multiple comparison tests which do not assume equal
variance, was used. Dunnett’s T3 test, the Games-Howell pair wise comparison test and
Dunnett’s C test are other multiple comparison tests which do not assume equal variance
but Tamhane’s T2 test was used in this study because it is a conservative pair wise
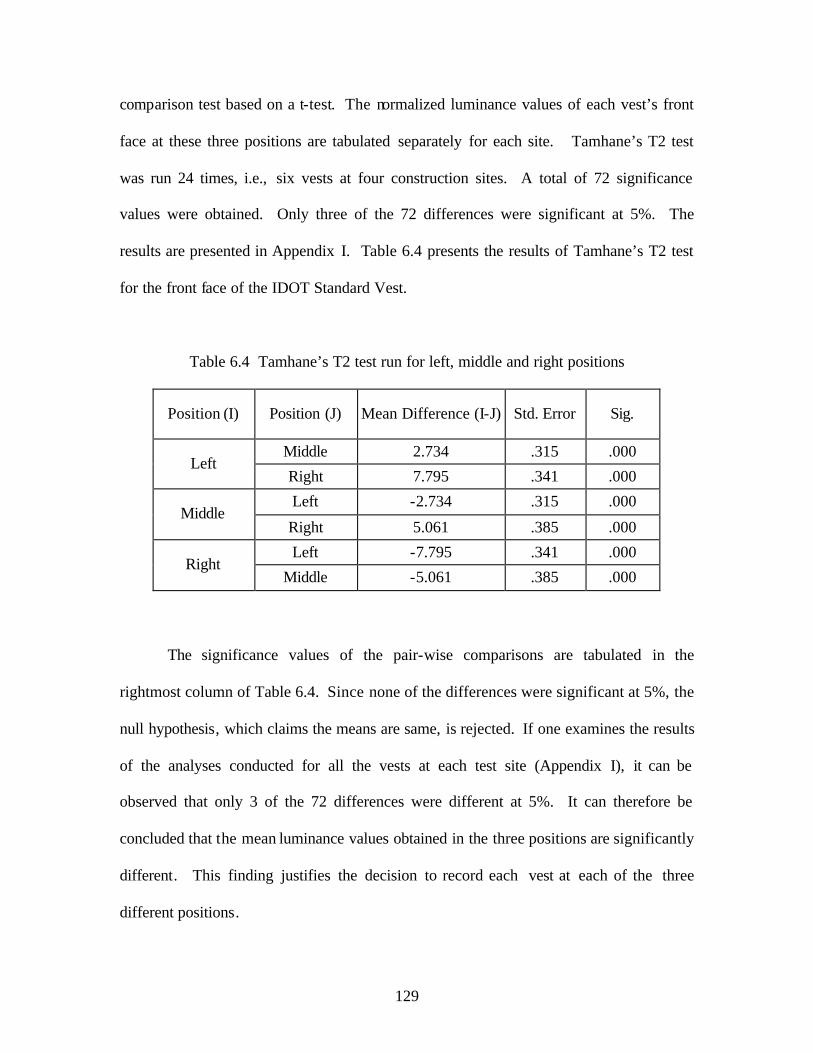
129
comparison test based on a t-test. The normalized luminance values of each vest’s front
face at these three positions are tabulated separately for each site. Tamhane’s T2 test
was run 24 times, i.e., six vests at four construction sites. A total of 72 significance
values were obtained. Only three of the 72 differences were significant at 5%. The
results are presented in Appendix I. Table 6.4 presents the results of Tamhane’s T2 test
for the front face of the IDOT Standard Vest.
Table 6.4 Tamhane’s T2 test run for left, middle and right positions
Position (I) Position (J) Mean Difference (I-J) Std. Error Sig.
Middle 2.734 .315 .000 Left
Right 7.795 .341 .000
Left -2.734 .315 .000 Middle
Right 5.061 .385 .000
Left -7.795 .341 .000 Right
Middle -5.061 .385 .000
The significance values of the pair-wise comparisons are tabulated in the
rightmost column of Table 6.4. Since none of the differences were significant at 5%, the
null hypothesis, which claims the means are same, is rejected. If one examines the results
of the analyses conducted for all the vests at each test site (Appendix I), it can be
observed that only 3 of the 72 differences were different at 5%. It can therefore be
concluded that the mean luminance values obtained in the three positions are significantly
different. This finding justifies the decision to record each vest at each of the three
different positions.

130
6.1.4 Comparison of Vests’ Front Faces vs. Sides
According to findings of the survey administered to IDOT operation personnel,
resident engineers, contractors and to departments of transportation of other states than
Illinois (See Chapter 5), 360° visibility is the most important safety garment design
factor. So the sides of the vests were recorded in addition to the front faces of the vests.
In this section, the differences between the luminance values of the front faces and the
luminance values of the sides of the vests are examined to find out whether these
differences are statistically significant or not. Descriptive statistics are presented in
tables in Appendix J. T-tests for independent samples were run to determine significance
of the differences between the mean luminance values for front faces and sides of vests.
The t-test was run 24 times and 24 significance values were obtained. Only 2 of
the 24 differences were found to be significant at 5%. In other words, with a significance
level of 5%, 22 out of 24 comparisons confirm that vests’ front faces and sides have
different mean luminance values, which in turns points to different visibilities. The
research team’s decision to record both front faces and sides of vests is therefore
justified.
6.1.5 Ranking of the Vests
Normalized luminance values of the front faces and of the sides of the six vests
tested are presented in Tables 6.5 and 6.6. The vests are ranked according to their
normalized mean luminance values.
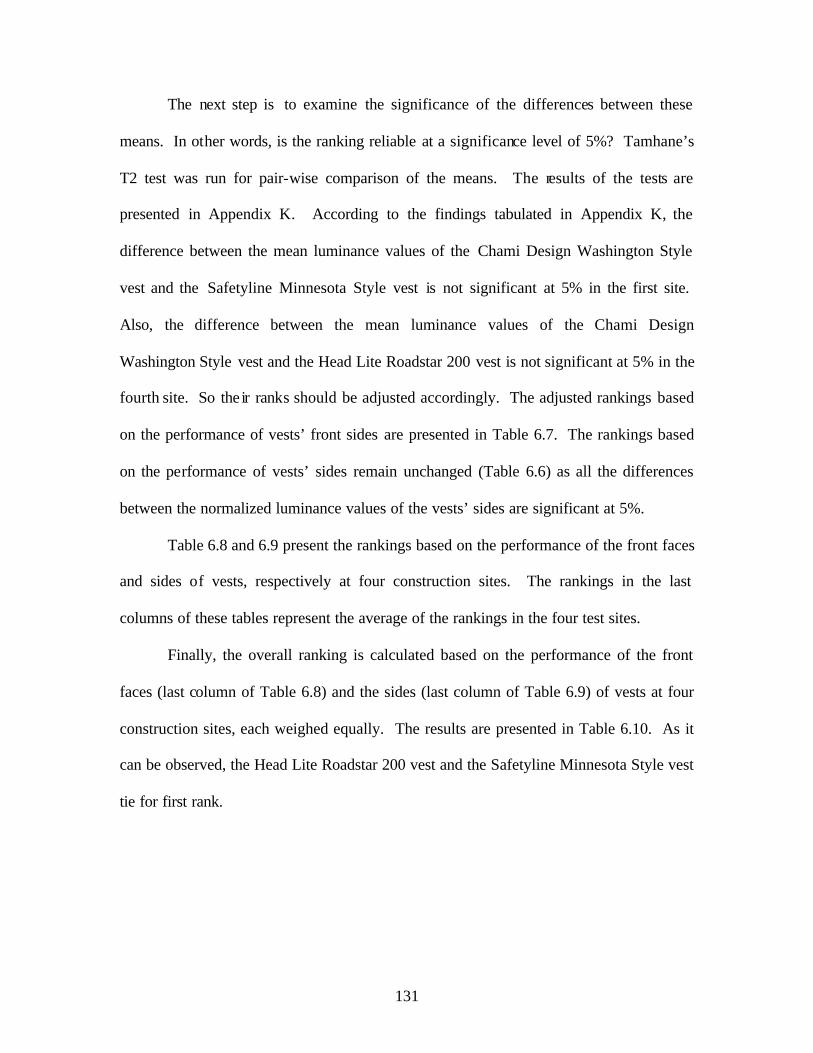
131
The next step is to examine the significance of the differences between these
means. In other words, is the ranking reliable at a significance level of 5%? Tamhane’s
T2 test was run for pair-wise comparison of the means. The results of the tests are
presented in Appendix K. According to the findings tabulated in Appendix K, the
difference between the mean luminance values of the Chami Design Washington Style
vest and the Safetyline Minnesota Style vest is not significant at 5% in the first site.
Also, the difference between the mean luminance values of the Chami Design
Washington Style vest and the Head Lite Roadstar 200 vest is not significant at 5% in the
fourth site. So the ir ranks should be adjusted accordingly. The adjusted rankings based
on the performance of vests’ front sides are presented in Table 6.7. The rankings based
on the performance of vests’ sides remain unchanged (Table 6.6) as all the differences
between the normalized luminance values of the vests’ sides are significant at 5%.
Table 6.8 and 6.9 present the rankings based on the performance of the front faces
and sides of vests, respectively at four construction sites. The rankings in the last
columns of these tables represent the average of the rankings in the four test sites.
Finally, the overall ranking is calculated based on the performance of the front
faces (last column of Table 6.8) and the sides (last column of Table 6.9) of vests at four
construction sites, each weighed equally. The results are presented in Table 6.10. As it
can be observed, the Head Lite Roadstar 200 vest and the Safetyline Minnesota Style vest
tie for first rank.

132
Table 6.5 Normalized mean luminance values and corresponding rankings based on the performance of vests’ front faces
Site 1 Site 2 Site 3 Site 4
Vests Normalized mean
luminance Rank
Normalized mean
luminance Rank
Normalized mean
luminance Rank
Normalized mean
luminance Rank
IDOT Standard Vest 92.816 6 99.061 6 50.660 3 44.012 5
IDOT LED Vest 99.975 5 105.718 5 40.529 6 39.827 6
Head Lite Roadstar 200 138.525 1 174.557 3 63.216 1 50.763 2
Iron Horse Texas Style 105.151 4 137.506 4 44.480 5 48.699 4
Chami Design Washington Style
127.156 2 177.067 2 61.154 2 50.750 3
Safetyline Minnesota Style 127.155 3 181.060 1 48.023 4 59.903 1
Table 6.6 Normalized mean luminance values and corresponding rankings based on the performance of vests’ sides
Site 1 Site 2 Site 3 Site 4
Vests Normalized mean
luminance Rank
Normalized mean
luminance Rank
Normalized mean
luminance Rank
Normalized mean
luminance Rank
IDOT Standard Vest 85.980 5 85.012 5 52.532 6 48.944 5
IDOT LED Vest 82.913 6 78.169 6 59.481 5 42.144 6
Head Lite Roadstar 200
116.101 2 145.464 2 59.738 4 54.746 3
Iron Horse Texas Style 98.224 4 100.882 4 68.761 2 53.097 4
Chami Design Washington Style 115.142 3 129.915 3 60.392 3 55.884 2
Safetyline Minnesota Style
123.640 1 165.301 1 78.422 1 60.461 1

133
Table 6.7 Adjusted rankings based on the performance of vests’ front faces
Vests Site 1 Rank
Site 2 Rank
Site 3 Rank
Site 4 Rank
IDOT Standard Vest 6 6 3 5
IDOT LED Vest 5 5 6 6
Head Lite Roadstar 200 1 3 1 2.5
Iron Horse Texas Style 4 4 5 4
Chami Design Washington Style
2.5 2 2 2.5
Safetyline Minnesota Style 2.5 1 4 1
Table 6.8 Ranking based on the performance of vests’ front faces
Vests Site 1 Rank
Site 2 Rank
Site 3 Rank
Site 4 Rank Total Ranking
IDOT Standard Vest 6 6 3 5 20 5
IDOT LED Vest 5 5 6 6 22 6
Head Lite Roadstar 200 1 3 1 2.5 7.5 1
Iron Horse Texas Style 4 4 5 4 17 4
Chami Design Washington Style 2.5 2 2 2.5 9 3
Safetyline Minnesota Style 2.5 1 4 1 8.5 2
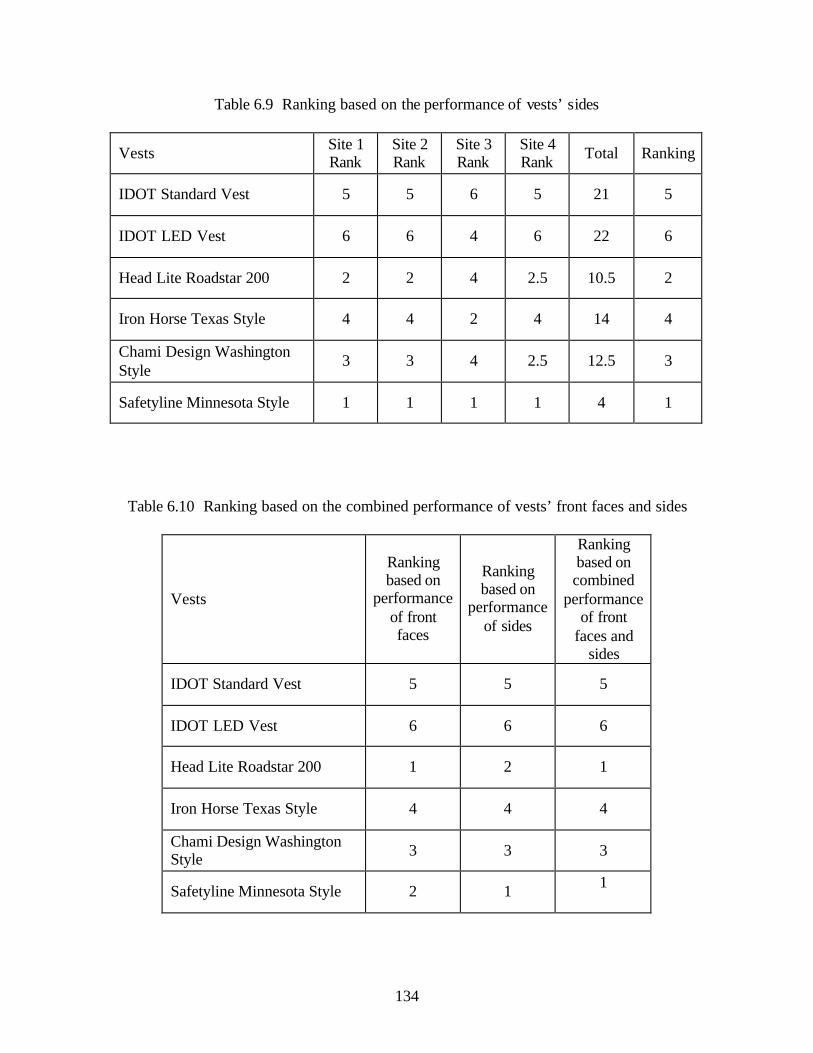
134
Table 6.9 Ranking based on the performance of vests’ sides
Vests Site 1 Rank
Site 2 Rank
Site 3 Rank
Site 4 Rank Total Ranking
IDOT Standard Vest 5 5 6 5 21 5
IDOT LED Vest 6 6 4 6 22 6
Head Lite Roadstar 200 2 2 4 2.5 10.5 2
Iron Horse Texas Style 4 4 2 4 14 4
Chami Design Washington Style
3 3 4 2.5 12.5 3
Safetyline Minnesota Style 1 1 1 1 4 1
Table 6.10 Ranking based on the combined performance of vests’ front faces and sides
Vests
Ranking based on
performance of front faces
Ranking based on
performance of sides
Ranking based on combined
performance of front
faces and sides
IDOT Standard Vest 5 5 5
IDOT LED Vest 6 6 6
Head Lite Roadstar 200 1 2 1
Iron Horse Texas Style 4 4 4
Chami Design Washington Style 3 3 3
Safetyline Minnesota Style 2 1 1

135
6.2 Site Survey
On the first night, 34 students answered the questionnaire (Appendix F) and the
photometer reading was 14 lux. The questionnaire was approved by the project TRP.
The data presented in Table 6.11 were collected on the first night. On the second night,
17 graduate students evaluated the six vests while the photometer reading was 5 lux. The
data presented in Table 6.12 represent the findings of the second night of the survey. The
responses obtained on the first and second nights are consolidated and presented in Table
6.13.
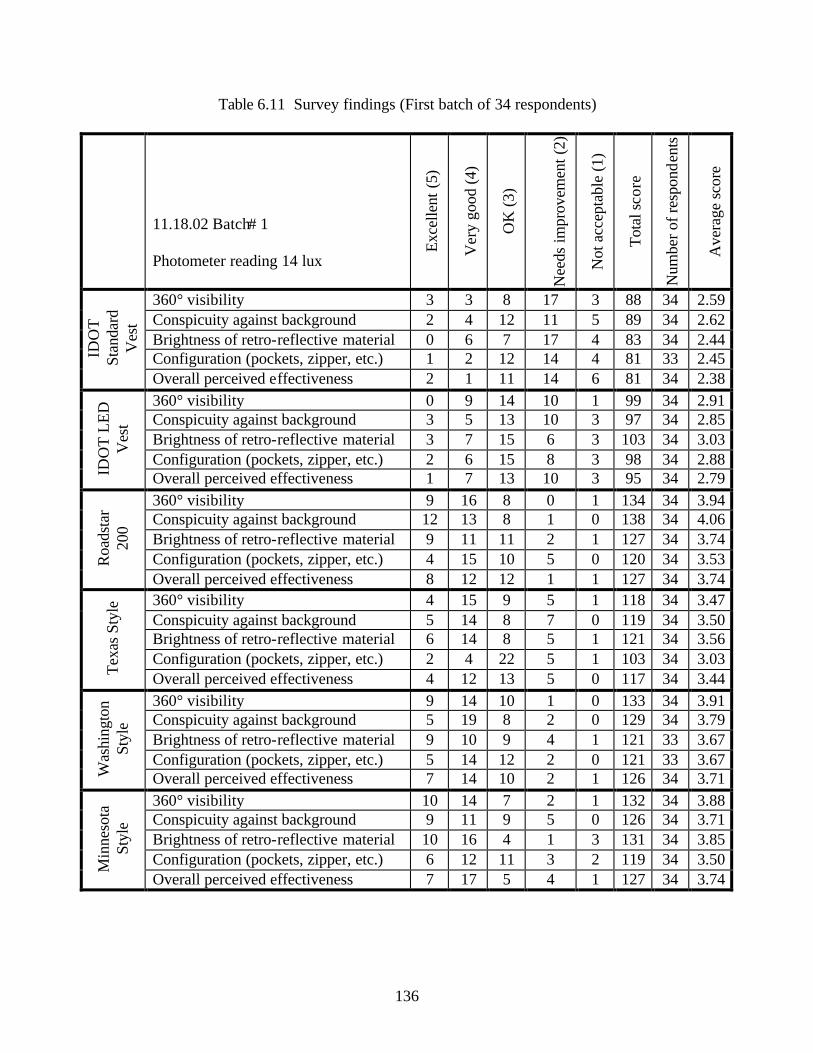
136
Table 6.11 Survey findings (First batch of 34 respondents)
11.18.02 Batch# 1 Photometer reading 14 lux
Exce
llent
(5)
Ver
y go
od (4
)
OK
(3)
Nee
ds im
prov
emen
t (2)
Not
acc
epta
ble
(1)
Tota
l sco
re
Num
ber o
f res
pond
ents
Ave
rage
sco
re
360° visibility 3 3 8 17 3 88 34 2.59 Conspicuity against background 2 4 12 11 5 89 34 2.62 Brightness of retro-reflective material 0 6 7 17 4 83 34 2.44 Configuration (pockets, zipper, etc.) 1 2 12 14 4 81 33 2.45 ID
OT
St
anda
rd
Ves
t
Overall perceived effectiveness 2 1 11 14 6 81 34 2.38 360° visibility 0 9 14 10 1 99 34 2.91 Conspicuity against background 3 5 13 10 3 97 34 2.85 Brightness of retro-reflective material 3 7 15 6 3 103 34 3.03 Configuration (pockets, zipper, etc.) 2 6 15 8 3 98 34 2.88
IDO
T L
ED
V
est
Overall perceived effectiveness 1 7 13 10 3 95 34 2.79 360° visibility 9 16 8 0 1 134 34 3.94 Conspicuity against background 12 13 8 1 0 138 34 4.06 Brightness of retro-reflective material 9 11 11 2 1 127 34 3.74 Configuration (pockets, zipper, etc.) 4 15 10 5 0 120 34 3.53 R
oads
tar
200
Overall perceived effectiveness 8 12 12 1 1 127 34 3.74 360° visibility 4 15 9 5 1 118 34 3.47 Conspicuity against background 5 14 8 7 0 119 34 3.50 Brightness of retro-reflective material 6 14 8 5 1 121 34 3.56 Configuration (pockets, zipper, etc.) 2 4 22 5 1 103 34 3.03
Texa
s St
yle
Overall perceived effectiveness 4 12 13 5 0 117 34 3.44 360° visibility 9 14 10 1 0 133 34 3.91 Conspicuity against background 5 19 8 2 0 129 34 3.79 Brightness of retro-reflective material 9 10 9 4 1 121 33 3.67 Configuration (pockets, zipper, etc.) 5 14 12 2 0 121 33 3.67
Was
hing
ton
Styl
e
Overall perceived effectiveness 7 14 10 2 1 126 34 3.71 360° visibility 10 14 7 2 1 132 34 3.88 Conspicuity against background 9 11 9 5 0 126 34 3.71 Brightness of retro-reflective material 10 16 4 1 3 131 34 3.85 Configuration (pockets, zipper, etc.) 6 12 11 3 2 119 34 3.50 M
inne
sota
St
yle
Overall perceived effectiveness 7 17 5 4 1 127 34 3.74

137
Table 6.12 Survey findings (Second batch of 17 respondents)
11.20.02 Batch# 2 Photometer reading 5 lux
Exce
llent
(5)
Ver
y go
od (4
)
OK
(3)
Nee
ds im
prov
emen
t (2)
Not
acc
epta
ble
(1)
Tot
al s
core
Num
ber o
f res
pond
ents
Ave
rage
sco
re
360° visibility 3 2 6 5 1 52 17 3.06 Conspicuity against background 0 3 7 6 1 46 17 2.71 Brightness of retro-reflective material 0 7 4 3 3 49 17 2.88 Configuration (pockets, zipper, etc.) 0 3 8 3 2 44 16 2.75 ID
OT
St
anda
rd
Ves
t
Overall perceived effectiveness 0 3 7 4 2 43 16 2.69 360° visibility 0 6 8 3 0 54 17 3.18 Conspicuity against background 0 1 11 5 0 47 17 2.76 Brightness of retro-reflective material 0 7 5 5 0 53 17 3.12 Configuration (pockets, zipper, etc.) 1 2 9 4 1 49 17 2.88
IDO
T L
ED
V
est
Overall perceived effectiveness 1 3 5 6 2 46 17 2.71 360° visibility 11 4 2 0 0 77 17 4.53 Conspicuity against background 9 7 1 0 0 76 17 4.47 Brightness of retro-reflective material 7 7 2 0 0 69 16 4.31 Configuration (pockets, zipper, etc.) 5 8 3 1 0 68 17 4.00 R
oads
tar
200
Overall perceived effectiveness 6 8 2 1 0 70 17 4.12 360° visibility 0 3 7 5 1 44 16 2.75 Conspicuity against background 1 3 6 7 0 49 17 2.88 Brightness of retro-reflective material 1 3 5 7 1 47 17 2.76 Configuration (pockets, zipper, etc.) 0 2 4 9 1 39 16 2.44
Texa
s St
yle
Overall perceived effectiveness 0 2 5 7 3 40 17 2.35 360° visibility 2 11 3 0 0 63 16 3.94 Conspicuity against background 2 11 3 1 0 65 17 3.82 Brightness of retro-reflective material 4 7 3 0 0 57 14 4.07 Configuration (pockets, zipper, etc.) 6 5 4 2 0 66 17 3.88
Was
hing
ton
Styl
e
Overall perceived effectiveness 4 10 2 1 0 68 17 4.00 360° visibility 5 7 4 1 0 67 17 3.94 Conspicuity against background 8 4 1 2 1 64 16 4.00 Brightness of retro-reflective material 7 6 1 1 2 66 17 3.88 Configuration (pockets, zipper, etc.) 5 6 3 3 0 64 17 3.76 M
inne
sota
St
yle
Overall perceived effectiveness 9 1 3 2 2 64 17 3.76

138
Table 6.13 Survey findings (Consolidated results of all 51 respondents)
CONSOLIDATED RESULTS
Exce
llent
(5)
Ver
y go
od (4
)
OK
(3)
Nee
ds im
prov
emen
t (2)
Not
acc
epta
ble
(1)
Tot
al s
core
Num
ber o
f res
pond
ents
Ave
rage
sco
re
360° visibility 6 5 14 22 4 140 51 2.75 Conspicuity against background 2 7 19 17 6 135 51 2.65 Brightness of retro-reflective material 0 13 11 20 7 132 51 2.59 Configuration (pockets, zipper, etc.) 1 5 20 17 6 125 49 2.55 ID
OT
St
anda
rd
Ves
t
Overall perceived effectiveness 2 4 18 18 8 124 50 2.48 360° visibility 0 15 22 13 1 153 51 3.00 Conspicuity against background 3 6 24 15 3 144 51 2.82 Brightness of retro-reflective material 3 14 20 11 3 156 51 3.06 Configuration (pockets, zipper, etc.) 3 8 24 12 4 147 51 2.88 ID
OT
LE
D
Ves
t
Overall perceived effectiveness 2 10 18 16 5 141 51 2.76 360° visibility 20 20 10 0 1 211 51 4.14 Conspicuity against background 21 20 9 1 0 214 51 4.20 Brightness of retro-reflective material 16 18 13 2 1 196 50 3.92 Configuration (pockets, zipper, etc.) 9 23 13 6 0 188 51 3.69
Roa
dsta
r 200
Overall perceived effectiveness 14 20 14 2 1 197 51 3.86 360° visibility 4 18 16 10 2 162 50 3.24 Conspicuity against background 6 17 14 14 0 168 51 3.29 Brightness of retro-reflective material 7 17 13 12 2 168 51 3.29 Configuration (pockets, zipper, etc.) 2 6 26 14 2 142 50 2.84 Te
xas
Styl
e
Overall perceived effectiveness 4 14 18 12 3 157 51 3.08 360° visibility 11 25 13 1 0 196 50 3.92 Conspicuity against background 7 30 11 3 0 194 51 3.80 Brightness of retro-reflective material 13 17 12 4 1 178 47 3.79 Configuration (pockets, zipper, etc.) 11 19 16 4 0 187 50 3.74
Was
hing
ton
Styl
e
Overall perceived effectiveness 11 24 12 3 1 194 51 3.80 360° visibility 15 21 11 3 1 199 51 3.90 Conspicuity against background 17 15 10 7 1 190 50 3.80 Brightness of retro-reflective material 17 22 5 2 5 197 51 3.86 Configuration (pockets, zipper, etc.) 11 18 14 6 2 183 51 3.59 Min
neso
ta
Styl
e
Overall perceived effectiveness 16 18 8 6 3 191 51 3.75

139
The Head Lite Roadstar 200 vest got the highest scores in four of the five criteria
including 360° visibility, conspicuity against background, brightness of retro-reflective
material and overall perceived effectiveness. The Chami Design Washington Style vest
led only in one criterion, configuration. The matrix in Table 6.14 shows the rankings of
the vests in all five categories. The results obtained from the survey indicate that
respondents prefer mostly the Head Lite Roadstar 200 vest among the six vests tested.
Table 6.14 Rankings in the Site Survey
IDO
T S
tand
ard
Ves
t
IDO
T L
ED
V
est
Roa
dsta
r 200
Texa
s St
yle
Was
hing
ton
Styl
e
Min
neso
ta
Styl
e
360° visibility 6 5 1 4 2 3 Conspicuity against background 6 5 1 4 2 2 Brightness of retro-reflective material 6 5 1 4 3 2 Configuration (pockets, zipper, etc.) 6 4 2 5 1 3 Overall perceived effectiveness 6 5 1 4 2 3
The responses for the “overall perceived effectiveness” criterion in the site
questionnaire administered to graduate students processed with SPSS. The results of the
descriptive statistics and Tamhane’s T2 tests are presented in Tables 6.15 and 6.16,
respectively.

140
The following ranking is achieved based on the results of the site survey if
significance level is set as 5%:
2- Head Lite Roadstar 200 vest
2- Chami Design Washington Style vest
2- Safetyline Minnesota Style vest
5- Iron Horse Texas Style vest
5- IDOT LED vest
5- IDOT Standard vest
Table 6.15 Descriptive statistics of “overall perceived effectiveness” criterion in site questionnaire
Vests Mean N Std. Deviation
Minimum Maximum
IDOT Standard Vest 2.48 50 .995 1.00 5.00
IDOT LED Vest 2.76 51 1.012 1.00 5.00
Head Lite Roadstar 200 3.86 51 .939 1.00 5.00
Iron Horse Texas Style 3.08 51 1.036 1.00 5.00
Chami Design Washington Style 3.80 51 .917 1.00 5.00
Safetyline Minnesota Style 3.75 51 1.197 1.00 5.00

141
Table 6.16 Tamhane’s T2 test of “Overall Perceived Effectiveness” criterion in site questionnaire
(I) Vest (J) Vest Mean
Difference (I-J)
Std. Error Sig.
IDOT LED Vest -.285 .200 .923 Head Lite Roadstar 200 -1.383 .193 .000 Iron Horse Texas Style -.598 .202 .056
Chami Design Washington Style -1.324 .190 .000
IDOT Standard Vest
Safetyline Minnesota Style -1.265 .219 .000 IDOT Standard Vest .285 .200 .923
Head Lite Roadstar 200 -1.098 .193 .000 Iron Horse Texas Style -.314 .203 .865
Chami Design Washington Style -1.039 .191 .000
IDOT LED Vest
Safetyline Minnesota Style -.980 .220 .000 IDOT Standard Vest 1.383 .193 .000
IDOT LED Vest 1.098 .193 .000 Iron Horse Texas Style .784 .196 .002
Chami Design Washington Style .059 .184 1.000
Head Lite Roadstar 200
Safetyline Minnesota Style .118 .213 1.000 IDOT Standard Vest .598 .202 .056
IDOT LED Vest .314 .203 .865 Head Lite Roadstar 200 -.784 .196 .002
Chami Design Washington Style -.725 .194 .005
Iron Horse Texas Style
Safetyline Minnesota Style -.667 .222 .049 IDOT Standard Vest 1.324 .190 .000
IDOT LED Vest 1.039 .191 .000 Head Lite Roadstar 200 -.059 .184 1.000 Iron Horse Texas Style .725 .194 .005
Chami Design Washington
Style Safetyline Minnesota Style .059 .211 1.000
IDOT Standard Vest 1.265 .219 .000 IDOT LED Vest .980 .220 .000
Head Lite Roadstar 200 -.118 .213 1.000 Iron Horse Texas Style .667 .222 .049
Safetyline Minnesota
Style Chami Design Washington Style -.059 .211 1.000

142
6.3 Final Ranking
Finally the rankings obtained from site tests and the site survey were combined
and the following final ranking is obtained:
1- Head Lite Roadstar 200 vest
1- Safetyline Minnesota Style vest
3- Chami Design Washington Style vest
4- Iron Horse Texas Style vest
5- IDOT Standard vest
6- IDOT LED vest
143
Nighttime Construction: Evaluation of Worker Safety Issues
7. CONCLUSION
7.1 Summary and Conclusion
Many state agencies including IDOT are shifting towards nighttime construction.
Nighttime construction mitigates the impact of construction operations on the traveling
public, shortens the duration of construction operations and reduces interruptions to
construction activities. But nighttime construction operations may be more hazardous for
both drivers and construction personnel because of visibility problems at nighttime.
In this research study, the effects of nighttime construction conditions on worker
safety were investigated by studying the statistics provided by the National Highway Traffic
Safety Administration’s Fatality Analysis Reporting System (FARS) and by seeking the
experiences of DOT personnel across the nation; the types of high-visibility garments used
by construction workers and IDOT personnel on Illinois highway projects as well as those
used in other states were surveyed; and finally, the performance of six high-visibility vests
were investigated not in a laboratory setting but on actual construction/maintenance sites that
involved different lighting, traffic, and weather conditions. Potential users’ perceptions
concerning the performance of these six safety vests were also collected by mean of a
questionnaire survey. The study shows the following:
• According to data on fatal accidents in highway work zones in the State of Illinois in
the five-year study period of 1996-2001, safety does not seem to be any more of a

144
problem in nighttime than in daytime works. The inclusion of a weather parameter
into the analysis does not change this finding. The same attention should therefore be
given to safety both in nighttime and daytime works. This finding is supported by the
responses obtained in a survey of IDOT operations personnel, resident engineers and
contractors and by personnel in departments of transportation in other states.
• According to the findings of surveys administered to IDOT operations personnel,
resident engineers and contractors and to departments of transportation of other states
than Illinois involved in nighttime construction operations within the past 5 years,
“worker struck by through traffic inside the work area” and “worker struck by
construction equipment inside the work area” are the two most common accident
types. The main reason for nighttime accidents is perceived to be the condition of
vehicle operators with poor lighting condition being the second most common reason.
It appears that investigating visibility issues associated with safety garments at
nighttime is justified.
• Consolidated results obtained from the field tests that measured mean luminance
values of the front faces and sides of six commonly used safety vests and the
perception of potential users of these vests indicated that the Head Lite Roadstar 200
vest and the Safetyline Minnesota Style vest are significantly superior to the other
four vests. It is not surprising that these two safety vests tied for first rank as the
fabric of the vests and the amount of retroreflective material on each vest are nearly
the same. There are two minor differences between the Head Lite Roadstar 200 and

145
Safetyline Minnesota Style vests: their configuration (zipper and pockets) is different;
and the sides of the Safetyline Minnesota Style vest is made of solid fabric, whereas
the sides of the Head Lite Roadstar 200 vest is mesh fabric.
• The information obtained in the surveys of Illinois respondents (operations personnel,
resident engineers, and contractors) and other DOT agencies, are to a great extent,
similar. The only difference appears to be in the respondents’ opinions concerning
the nighttime performance of currently used safety vests. Illinois respondents are less
satisfied with the nighttime performance of the safety garments currently in use on
their work areas than respondents from other DOTs. It appears therefore that IDOT’s
decision to change the specifications and make the Head Lite Roadstar 200 vest
mandatory in highway construction/maintenance works performed in Illinois is
justified.
7.2 Recommendations for Future Research
The results of the surveys administered to IDOT operations personnel, resident
engineers and contractors and to departments of transportation of other states than Illinois,
show that construction equipment inside the work area cause as many accidents as through
traffic. Research should be conducted to investigate this type of accident in the work areas.
It should also be noted that the six safety vests were tested in only four work areas
that had different traffic volume, setting (urban vs. rural), weather (clear and rainy), and
lighting conditions. A more rigorous statistical analysis should be possible if the number of
test sites were increased.

146
Nighttime Construction: Evaluation of Worker Safety Issues
REFERENCES
Bibliography
3M ® (2000). Retrieved Sep 31, 2001 from 3M Transportation Safety Product Center
Database on the World Wide Web: http://www.mmm.com/tcm/wn/story7.html.
AASHTO (1998). “AASHTO strategic highway safety plan: a compressive plan to
substantially reduce vehicle-related fatalities and injuries on the nation’s highways.”
American Association of State Highway and Transportation Officials, Washington D.C.
Part 4, pp. 51-52.
Abd Elrahman, O. and Perry, R. J. (December 1994). “Nighttime construction operations”
Engineering Research and Development Bureau, New York State Department of
Transportation, Albany, NY.
Anders, R. L. (August 2000). “On-Road Investigation of Fluorescent Sign Colors to
Improve Conspicuity.” Virginia Polytechnic and State Institute, Blacksburg, VA.
ANSI/ISEA 107-1999. (June 1999). “American National Standard for High-Visibility
Safety Apparel.” International Safety Equipment Association, Arlington, VA.
AS/NZS 1906.4:1997. (1997). “Australian/New Zealand Standard: Retroreflective materials
and devices for road traffic control purposes.- Part 4: High-Visibility materials for safety
garments.” Jointly published by Standards Australia, Homebush, Australia; and
Standards New Zealand, Welling, New Zealand.

147
AS/NZS 4602:1999. (1999). “Australian/New Zealand Standard: High-Visibility safety
garments.” Jointly published by Standards Australia, Homebush, Aus tralia; and
Standards New Zealand, Welling, New Zealand.
ASTM, Designation: F 923-00. (February 2001). “Standard Guide to Properties of High
Visibility Materials Used to Improve Individual Safety”
Birch, S. E. (December 1998). “The Effects of Nighttime Work on Highway Construction
Site Safety in Arizona.” Arizona State University, AZ.
Brackett, Q. and Stuart, M. (October 1982). “High Visibility Garments for Use in Work
Zones.” Research Report 262-4. Texas Transportation Institute, TX.
Brackett, Q., Stuart, M., Carnahan, T. and Stealy, S. (October 1985). “High Visibility
Garments for Use in Work Zones.” Research Report 330-1. Texas Transportation
Institute, TX.
Bradley, J. C. (2001). “Columns – Workplace Solutions – Can you clarify the conspicuity?”
Safety & Health, 163(1), 66.
BS EN 471. (1994). "Specification for High-Visibility Warning Clothing.” British
Standards Institute, London, UK.
Ellis, R. D, Jr. and Herbsman, Z. (1996). “Illumination Guideline for Nighttime Highway
Work” NCHRP Report 5-13, Transportation Research Board, National Research
Council, Washington, DC.
Ellis, R. D. Jr. and Amos, S. J. (1995). “Development of Work Zone Lighting Standards for
Nighttime Highway Work.” Transportation Research Record, 1529, 35-42.
Ellis, R. D. Jr. and Kumar, A. (1993). “Influence of Nighttime Operations on Construction
Cost and Productivity.” Transportation Research Record, 1389, 31-37.

148
Ha, T. J. and Z. A. Nemeth (1995). “Detailed study of accident experience in construction
and maintenance zones.” Transportation Research Record, 1509. National Research
Council. 38-45.
Hancher, D. E. and Taylor, T. R. B. (2001). “Nighttime Construction Issues.”
Transportation Research Board (TRB) 80th Annual Meeting, 7-11.
Anonymous. (November 1997). “Assessing the visibility of clothing.” High Performance
Textiles, Lausanne, Switzerland, 163, 6.
Hinze J. W. and Carlisle, D. (February 1990). “An Evaluation of the important Variables in
Nighttime Construction.” Transportation Northwest, Dept. of Civil Engineering,
University of Washington, Seattle, WA.
http://international.3m.com/intl/CA/english/centres/safety/personal_safety/. Retrieved
September 31, 2001 from Personal Safety Products site of 3M Safety and Security
System Division, Issue 3, Winter 2000.
http://ops.fhwa.dot.gov/wz/wzguidbk/Documents/hp- ia1.htm. Retrieved September 31, 2001
from FHWA Database, Barb Mallon, Safety Coordinator, Iowa DOT, Tel: 515- 239-
1594.
http://ops.fhwa.dot.gov/wz/wzguidbk/Documents/hp-mn11.htm. Retrieved September 31,
2001 from FHWA Database, Bill Servatius, MN/DOT Construction Programs
Coordinator, Tel: 651- 296-2721.
http://www.dot.ca.gov/hq/traffops/signtech/signdel/flagging/flagging.htm. Retrieved
September 31, 2001 from Ca/DOT Website, “Flagging Instruction Handbook.” April,
1999.

149
http://www.dot.state.ia.us/morgue/06239704.htm. Retrieved September 31, 2001 from Iowa
DOT Database, Contact: Fred Walker, Tel: 515-239-1646. “DOT testing new safety
clothing for road workers - The bright way to save lives.” June 23, 1997.
http://www.headlitescorp.com/Page10.html. Retrieved August 30, 2001 from HeadLights
Corporation website. “Reflective Material; How much is Enough?”
http://www-fars.nhtsa.dot.gov/. Retrieved October 10, 2001 from VDOT Database,
“Fatality Analysis Reporting Syatem (FARS) Web-Based Encyclopedia”.
Isler, R., Kirk, P., Bradford S. J. and Parker, R. J. (1997). “Testing the relative conspicuity
of Safety garments for New Zealand forestry workers.” Applied Ergonomics, 28(5-6),
323.
Janson, M. H. and Smith, G. M. (1976). “Reflectorized Flagman Vests.” Research Report
R- 1021. Michigan Department of State Highways and Transportation, Lansing, MI.
Janson, M. H. and Smith, G. M. (July 1973). “Reflectorization of Fluorescent Flagman
Vests.” Research Report R-873. Michigan Department of State Highways and
Transportation, Lansing, MI.
Layfield, R. G. (1988). “Nightwork comparison.” Memorandum/report by resident
engineer. Florida Department of Transportation, Tallahassee, FL.
Lesley, G. (April 1995). “Enhancing the Daytime Conspicuity of Pedestrians Through the
Usage of Fluorescent Materials.” Color Research and Applications, 20(2), 117-123.
Levitt, R. E. and Samelson, N. M. (1993). “Construction Safety Management”. Second
edition, Wiley, New York, NY.

150
Michigan Manual of Uniform Traffic Control Devices. (1994, revised in 2001). Part 6 –
Construction and Maintenance. Michigan State Advisory Committee, Michigan
Department of Transportation, Lansing, MI.
Michon, J. A., Eernst, J. T. and Koutstaal. G. A. (1969). “Safety Clothing for Human Traffic
Obstacles.” Ergonomics, 12(1), 61-70.
MIL-S-43753C. (August 1998). “MIL-S-43753C: Military Specification Safety Clothing,
High Visibility.” U.S Army Natick Research, Development and Engineering Center,
Natick, MA.
MUTCD 2000 - Manual of Uniform Traffic Control Devices. (1993, revised in 2000).
Millennium edition, Part 6 – Work Zones, Chapter 6D – Pedestrian and Worker Safety.
FHWA, U.S. DOT, Washington, DC.
Pal, R. and Sinha, K. C. (1996). “Evaluation of Crossover and Partial Lane Closure
Strategies for Interstate Work Zones in Indiana.” Transportation Research Record, TRB,
1529, 10-18.
Pratt, S. G., Fosbroke D. E. and Marsh, S. M. (April 2001). “Building Safer Highway Work
Zones: Measures to Prevent Worker Injuries From Vehicles and Equipment.”
Department of Health and Human Services, Center for Disease Control and Prevention,
National Institute for Occupational Safety and Health, Cincinnati, OH
(http://www.cdc.gov/niosh/pdfs/01-128.pdf).
Report 98–S-50. (April 26, 1999). “Department of Transportation, Nighttime construction
program.” State of New York, Office of the State Comptroller - Division of
Management Audit and State Financial Service, Albany, NY.
http://nysosc3.osc.state.ny.us/audits/allaudits/093099/98s50.htm

151
http://nysosc3.osc.state.ny.us/audits/audits/9899/98s50.pdf
“Safety Vest Task Force.” (December 1999). Washington State Department of
Transportation, Seattle, WA.
Shepard, F. D. and Cottrell, B. H., Jr. (1985). “Benefits and Safety Impact of Night Work
Zone Activities.” Virginia Highway and Transportation Research Council, Springfield,
VA .
Turner, J. D., Simmons, C. J. and Graham, J. R. “High-Visibility Clothing for Daytime Use
in Work Zones.” Transportation Research Record, TRB, 1585, 1-8.
www.wsdot.wa.gov/fossc/cons/contaa/bulletin/wkzonebulaug.pdf. Retrieved October 30,
2001 from WsDOT Database, “New emergency rules for flaggers.”
Wang, J., Hughes, W. E., Council, F. M. and Paniati, J. F. (1996). “Investigation of Highway
Work Zone Crashes: What We Know and What We Don’t Know.” Transportation
Research Record, TRB, 1529, 54-62.
Additional Bibliography
A Policy on Geometric Design of Highways and Streets. (1984). AASHTO, American
Association of State Highway and Transportation Officials
Arens, J. B., Saremi, A. R. and Simmons, C. J. (1991). “Color Recognition of
Retroreflective Traffic Signs Under Various Lighting Conditions.” Public Roads, 55(1),
1-7.
Burns, D. M. and Johnson, N. L. (1997). "Characterizing the visual performance of
fluorescent retro-reflective signing materials using the fluorescent luminance factor." In
152
Proceedings of the 8th Congress of the International Colors Association, Vol. 1, pp. 359-
362, Kyoto, Japan.
Burns D. M. and Johnson, N. L. (1999). “Methodology of fluorescent retroreflective
materials and its relationship to their daytime visibility.” Analytica Chimica Acta,
380(2), 211.
Cole, B. and Hughes, P. (1984). “A field trial of attention and search conspicuity.” Human
Factors, 26(3), 299-313.
Cornsweet, T. N. (1974). “Visual Perception.” Academic Press, Inc., New York, NY.
Crant, P. S. and Townsend, G. B. (1961). “Colour Television” Iliffe Books LTD, London,
UK
Freund, J. E., Livermore, P. E. and Miller, I. (1962). “Manual of Experimental Statistics”
Prentice-Hall Inc., Englewood Cliffs, NJ
Hanson, D. R. and Dickson, A. D. (1963). “Significant Visual Properties of Some
Fluorescent Pigments.” Highway Research Record, 49, HRB, National Research
Council, Washington, DC.
Jacobs, G. F., Hedblom, T. P., Bradshaw, T. I., Hodson, N. A. and Austin, R. L.
“Detectability of Pavement Markings Under Stationary and Dynamic Conditions as a
Function of Retroreflective Brightness.” Transportation Research Record, TRB, 1495,
68-76.
Jenkins, S. E. and Cole, B. L. (1986). “Daytime conspicuity of road traffic control devices.”
Transportation Research Record, TRB, 1093, 74-80.

153
Jenssen, G. D. and Brekke, B. (1997). “A comprehensive evaluation of fluorescent
retroreflective traffic control devices based on human factors and traffic engineering
data.” 7th International Vision in Vehicles Conference, Marseilles, France
Jenssen, G. D. and Brekke, B. (1998). “A Study of the Visibility and Effectiveness of
Fluorescent Retroreflective Traffic Control Signing in Work Zone Applications.” (Report
No. VTI konferens 9A part 6). Swedish National Road and Transport Research Institute,
S-581 95 Linkoping, Sweden
Johnson, N. L. and Leone F. C. (1964). “Statistical and Experimental Design in Engineering
and the Physical Sciences” John Wiley & Sons Inc., New York
Maxwell, A. E. (1961). “Analysing Qualitative Data” John Wiley & Sons Inc, New York
Mortimer, R. G. and Fell, J. C. (1989). “Older drivers: their night fatal crash involvement
and risk.” Accident Analysis and Prevention, 21(3), 273-282, National Research
Council, Transportation Research Board.
Nam, D., Lee, J., Dunston, P. and Mannering, F. Paper No. 99-0072.,“Analysis of the
Impacts of Freeway Reconstruction Closures in Urban Area.” Transportation Research
Record, TRB, 1654, 161-170.
Olson, P. L. and Bernstein, A. (1979). “The nighttime legibility of highway signs as a
function of their luminance characteristics.” Human Factors, 21(2), 145-160.
Olzak, Owsley, C. E. and Sloan, M. E. (1987). “Contrast sensitivity, acuity, and the
perception of "real-world" targets.” British Journal of Ophthalmology, 71, 791-796.
Price, D. A. (1986). Report No.CDH-DTP-R-86-6, “Nighttime Paving.” Colorado
Department of Highways, Denver, CO.
Senter, R. J. (1969). “Analysis of Data” Scott, Foresman and Company, Glenview, IL

154
Shibuya, S., Nakatsuji, T., Fujiwara, T. and Matsuyama, E. “Traffic Control at Flagger-
Operated Work Zones on Two-Lane Roads.” Transportation Research Record, TRB,
1529, 3-9.
Smith, H. J. (1980). “Daylight Fluorescent Color - The Color That Shouts.” Transportation
Research Circular 229, TRB, National Research Council, Washington, D.C., 15-16.
Spiegel, M. R. (1961). “Scahum’s Outline of Theory and Problems of Statistics” McGraw-
Hill Inc., New York
Sullivan, E. C. (1989). “Accident rates during nighttime construction.” Research Report
UCB-ITS-RR-89-11, Institute of Transportation Studies, University of California at
Berkeley, CA.
Ullman, G. L. “Queuing and Natural Diversion at Short term Freeway Work Zone lane
Closures.” Transportation Research Record, TRB, 1529, 19-26.
Zwahlen, H. T. and Schnell, T. (1997). “Visual detection and recognition of fluorescent
color targets versus non-fluorescent color targets as a function of peripheral viewing
angle and target size.” Transportation Research Record, TRB, 1605, 28-40.
Zwahlen, H. T., Li, Q. and Yu, J. “Luminance Measurements of Retroreflective Warnign
Signs at Night Using the CalCalc System.” Transportation Research Record, TRB, 1316,
31-38.
Zwahlen, H. T. and Vel, U. D. (1994). “Conspicuity in Terms of Peripheral Visual
Detection and Recognition of Fluorescent Color Targets Versus Nonfluorescent Color
Targets Against Different Backgrounds in Daytime.” Transportation Research Record,
TRB, 1456, 125-138.

155
APPENDIX A
LIST OF SAFETY GARMENT MANUFACTURERS AND DISTRIBUTORS

156
MANUFACTURERS AND DISTRIBUTORS OF SAFETY GARMENTS
Name of The Company
Web Address E-mail Telephone Contact Person
Location of the headquarter
Brenton Safety Inc.
www.brentonsafety.com [email protected] 800-733-4333
Maria F. Smith
San Francisco, CA
Carolina Safety Sports
www.cssport.com [email protected] 336-474-8000 Philip Young North
Carolina Columbia Gorge Center
www.cgc-direct.com [email protected] 866-424-2669
Sam Windsheimer OR
CTC Accessories Inc.
www.ctcaccessories.com [email protected] 360-802-4738 Brad Golphenee
WA
Doublet Manufacturing Inc.
www.doublet.com [email protected] 800-624-4198 Micheal Medici
San Francisco, CA
Conney Safety Products
www.conney.com [email protected] 888-356-9100 Tom Vaughan Madison, WI
Estex Manufacturing Co. Inc.
www.estexmfg.com [email protected] 770-964-3322 Brent Wilkes Georgia
Harris Industries Inc.
www.harrisind.com [email protected] 714-898-8048 Bob Saylor CA
Harris Manufacturing
www.harrismanufacturingco.com [email protected] 609-393-3717 David Harris NJ
Head Lites Corp.
www.headlitescorp.com 800-777-5630 David Saatzer MN
I. Spiewak & Sons Inc.
www.spiewak.com [email protected] 800-223-6850 Sol Jacobs New York, NY
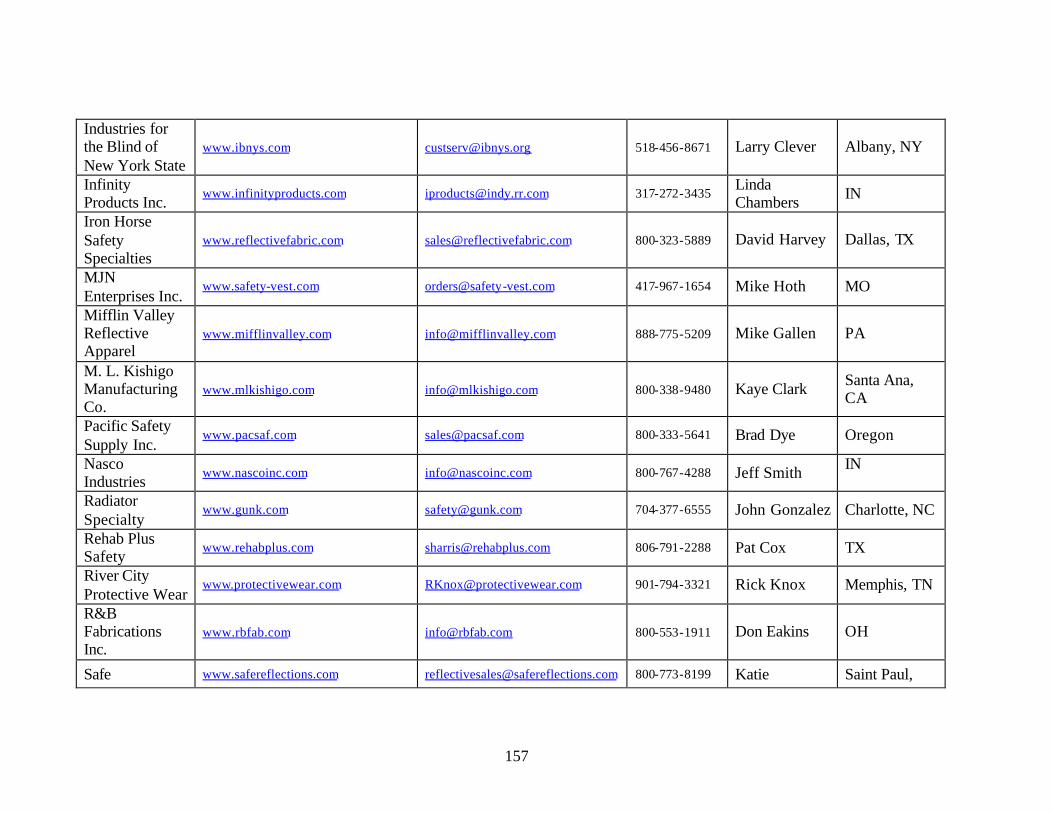
157
Industries for the Blind of New York State
www.ibnys.com [email protected] 518-456-8671 Larry Clever Albany, NY
Infinity Products Inc.
www.infinityproducts.com [email protected] 317-272-3435 Linda Chambers IN
Iron Horse Safety Specialties
www.reflectivefabric.com [email protected] 800-323-5889 David Harvey Dallas, TX
MJN Enterprises Inc.
www.safety-vest.com [email protected] 417-967-1654 Mike Hoth MO
Mifflin Valley Reflective Apparel
www.mifflinvalley.com [email protected] 888-775-5209 Mike Gallen PA
M. L. Kishigo Manufacturing Co.
www.mlkishigo.com [email protected] 800-338-9480 Kaye Clark Santa Ana, CA
Pacific Safety Supply Inc.
www.pacsaf.com [email protected] 800-333-5641 Brad Dye Oregon
Nasco Industries
www.nascoinc.com [email protected] 800-767-4288 Jeff Smith IN
Radiator Specialty
www.gunk.com [email protected] 704-377-6555 John Gonzalez Charlotte, NC
Rehab Plus Safety
www.rehabplus.com [email protected] 806-791-2288 Pat Cox TX
River City Protective Wear
www.protectivewear.com [email protected] 901-794-3321 Rick Knox Memphis, TN
R&B Fabrications Inc.
www.rbfab.com [email protected] 800-553-1911 Don Eakins OH
Safe www.safereflections.com [email protected] 800-773-8199 Katie Saint Paul,

158
Reflections Inc. Mahoney MN
American All Safe
www.americanallsafe.com [email protected] 800-231-1332 Sharon Whitfield
NY
Serving & Materials
www.servmat.com [email protected] 800-216-2969 Jackie Reed MO
TTB Products Inc.
www.ttbproducts.com [email protected] 888-970-7192 Bob Wielenga CA
Vantech Safety Line
www.safetyline.co m [email protected] 800-872-3359 Liz Vega CA
Vogue Safety Flag
www.safetyflag.com [email protected] 800-556-7584 Norm Benson Rhode Island
ERB Industries Inc.
www.e-erb.com [email protected] 800-800-6522 GA
La Crosse Rainfair Safety Products
www.lacrosserainfair.com [email protected] 800-557-7246 Julianne Hlavka WI
Seton Identification and Safety Experts
www.seton.com [email protected] 800-571-2596 CT
Direct Safety www.directsafety.com [email protected] 800-528-7405 Tom Reine Arizona
Dritex www.dritex.com [email protected] 847-437-2141 IL

159
APPENDIX B
PICTURES OF VESTS TESTED

160
PICTURES OF THE VESTS USED IN FIELD TESTS IODT Standard Vest
IDOT LED Vest

161
Head Lite Roadstar 200 Vest
Iron Horse Texas Style Vest

162
Chami Design Washington Style Vest
Safetyline Minnesota Style Vest

163
APPENDIX C
IDOT SURVEY INSTRUMENT

164
Worker Safety Issues in Nighttime Highway Construction in Illinois
Questionnaire Survey Name: …………………………………….. Position: …………………………………… Organization: ……………………………… I. Type, severity, and frequency of nighttime accidents involving workers in work areas Do you think safety is more of a problem during nighttime or during daytime on Illinois highway construction/rehabilitation/maintenance work areas?
Nighttime Daytime No difference
How would you characterize the typical nighttime accident involving through traffic or construction equipment in work areas? (Mark as many as appropriate but only for the type(s) of work area you are familiar with)
Type of work area
Type of nighttime accident in work areas
Con
stru
ctio
n/
Reh
abili
tatio
n
Mai
nten
ance
Worker struck by through traffic inside the work area
Worker struck by through traffic outside the work area
Worker struck by construction equipment inside the work area
Worker struck by construction equipment outside the work area
Others (Specify the type _______________________________ )
DEPARTMENT OF CIVIL AND ARCHITECTURAL ENGINEERING
CONSTRUCTION ENGINEERING AND MANAGEMENT PROGRAM

165
How severe was the worst worker-related nighttime accident caused by vehicles driving through any of your IDOT work areas in the last 5 years? (Answer only for the type(s) of work areas you are familiar with)
Type of highway work area
Ver
y se
vere
(in
volv
es fa
talit
y)
Seve
re (i
nvol
ves
inju
ry b
ut n
o fa
talit
y)
Less
sev
ere
(onl
y pr
oper
ty d
amag
e)
Construction/ Rehabilitation
Maintenance
How severe was the worst worker-related nighttime accident caused by construction equipment operating on any of your IDOT work areas in the last 5 years? (Answer only for the type(s) of work area you are familiar with)
Type of highway work area
Ver
y se
vere
(in
volv
es fa
talit
y)
Seve
re (i
nvol
ves
inju
ry b
ut n
o fa
talit
y)
Not
sev
ere
(onl
y pr
oper
ty d
amag
e)
Construction/ Rehabilitation
Maintenance

166
How frequent (on the average) were the worker-related nighttime accidents caused by vehicles driving through any of your IDOT work areas in the last 5 years? (Answer only for the type(s) of work area you are familiar with)
Type of highway work area
Ver
y fr
eque
nt
(mor
e th
an 1
ac
cide
nt/p
roje
ct)
Freq
uent
(1
acci
dent
/pro
ject
)
Less
freq
uent
(le
ss th
an1
acci
dent
/pro
ject
)
Construction/ Rehabilitation
Maintenance
How frequent (on the average) were the worker-related nighttime accidents caused by construction equipment operating on your IDOT work areas in the last 5 years? (Answer only for the type(s) of work area you are familiar with)
Type of highway work area
Ver
y fr
eque
nt (m
ore
than
1 a
ccid
ent/p
roje
ct)
Freq
uent
(1
acci
dent
/pro
ject
)
Not
freq
uent
(le
ss
than
1 ac
cide
nt/p
roje
ct)
Construction/ Rehabilitation
Maintenance

167
What are the major factors contributing to worker-related nighttime accidents in work areas? (Mark as many as appropriate but only for the type(s) of work area you are familiar with)
Type of work area
Factors contributing to nighttime accidents in work areas
Con
stru
ctio
n/
Reh
abili
tatio
n
Mai
nten
ance
Poor lighting conditions
Unfavorable weather conditions
Poor performance of safety garment
Workers not wearing safety garments
Condition of vehicle operator (sleepy, DUI, age, etc.)
Others (Specify:_______________________________ )

168
II. Evaluation of existing safety garments Describe the safety garments that are currently being used at nighttime on your highway work areas:
Manufacturer: ………………. ……… Model: …………………………. Color of vest: .………………..……… Description: …………………… Color of retro-reflective material: ………………………………………….
From which source are you providing safety garments for your site? Please specify (__________________________________________)
How would you characterize the nighttime performance of the safety garments currently in use on your work areas? (Refer to Table 1 for definitions)
Condition Performance Factors
Exce
llent
Ver
y go
od
OK
Nee
ds
impr
ovem
ent
Not
ac
cept
able
Visibility 5 4 3 2 1 Conspicuity 5 4 3 2 1 Urban
Area Reflectivity 5 4 3 2 1 Visibility 5 4 3 2 1 Conspicuity 5 4 3 2 1 B
ackg
roun
d
Rural Area
Reflectivity 5 4 3 2 1 Visibility 5 4 3 2 1 Conspicuity 5 4 3 2 1 Dry Reflectivity 5 4 3 2 1 Visibility 5 4 3 2 1 Conspicuity 5 4 3 2 1
Wea
ther
Wet Reflectivity 5 4 3 2 1 Wearability 5 4 3 2 1 Durability 5 4 3 2 1 Comfort 5 4 3 2 1 Configuration 5 4 3 2 1
Others
Perceived effectiveness 5 4 3 2 1

169
Table 1. Performance factors of safety garments (Modified from ASTM; Designation: F923-00, 3M)
Factors Definitions
Visibility Transmission of light waves from workers’ garments to the eye of the driver of through traffic or equipment operators.
Conspicuity The characteristics that a worker’s garment will come to the attention of a driver or operator by means of sharp contrast with the background.
Reflectivity The measure of brightness of retro-reflective material used in workers’ garments making the garments more visible at nighttime.
Wearability The qualities of the garments that provide good fit, up-to-date look, likable colors and shapes, and weather protection.
Durability The ability of garments to retain their original characteristics after many wears and washes.
Comfort Garments’ features that prevent the worker from perspiring, being cold or hot, getting wet, or limiting their movements.
Configuration The exterior and interior design of safety garments such as size, number and function of pockets, use of buttons/zippers/Velcro.
Perceived effectiveness
The worker’s confidence that the garment he/she is wearing is visible to drivers and operators and that he/she can move around with no fear of being struck by a vehicle.

170
III. Safety garment design factors and features
What is the importance of the following design factors in the use of retro-reflective materials to enhance the nighttime visibility of your safety garments? (Refer to Table 2 for definitions).
Table 2. Design Factors that Enhance Nighttime Visibility (Modified from 3M)
Factors Definitions
Definability of the human form
The retro-reflective material on a garment being the only component visible to a driver at nighttime, it should make the driver recognize the object as a worker.
Location of retro-reflective materials on the garment
The appropriate location of the retro-reflective material on a safety garment should enhance its visibility by drawing the human eye to the moving object as the worker moves.
360° visibility The human form should be detected from all directions regardless of the human form, movement, location, and situation.
Amount of retro-reflective material
The amount of retro-reflective material applied should increase a worker’s visibility.
Brightness of the retro-reflective material
The brightness of retro-reflective material should increase a worker’s visibility.
Acceptable loss of color and brightness after repeated wear and washing
The garment should be resistant to wear and washing such that the garment maintains its color and brightness longer.
Design Factors
Extre
mel
y im
porta
nt
Ver
y im
porta
nt
Impo
rtant
Som
ewha
t im
porta
nt
Not
ver
y im
porta
nt
Definability of the human form 5 4 3 2 1
Locations of retro-reflective materials on the garment 5 4 3 2 1
360° visibility 5 4 3 2 1
Amount of retro-reflective material 5 4 3 2 1
Brightness of the retro-reflective material 5 4 3 2 1 Acceptable loss of color and brightness after repeated wear and washing 5 4 3 2 1
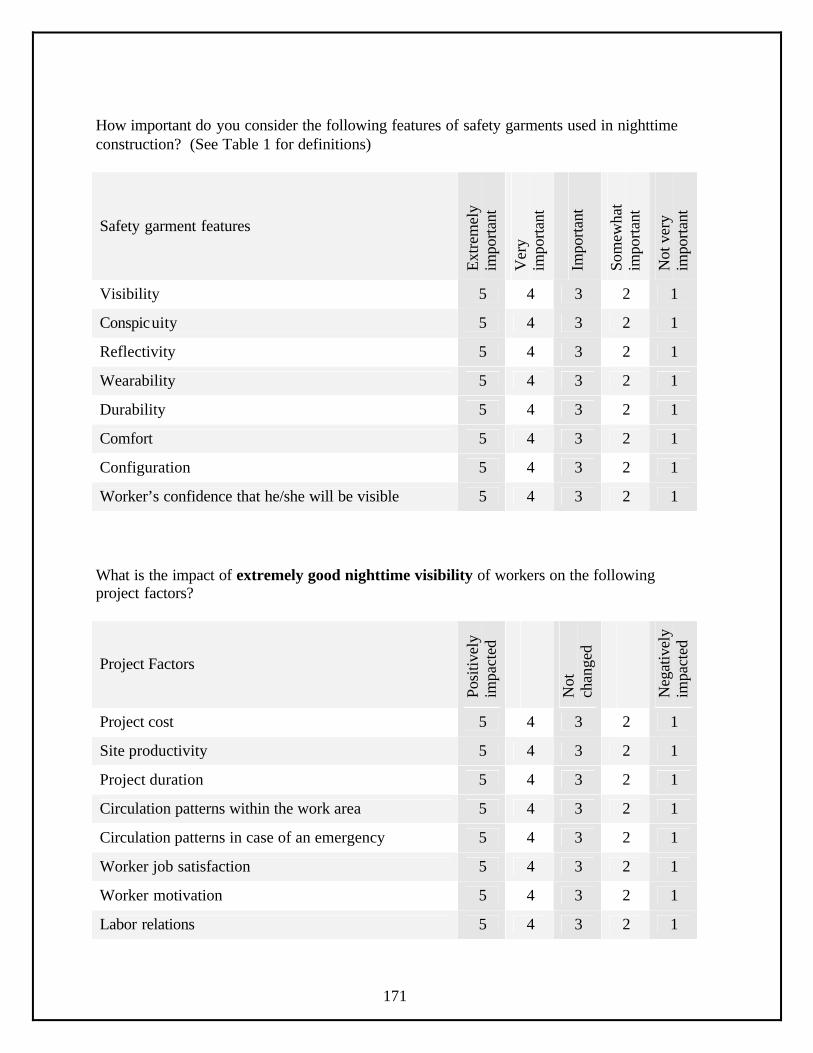
171
How important do you consider the following features of safety garments used in nighttime construction? (See Table 1 for definitions)
What is the impact of extremely good nighttime visibility of workers on the following project factors?
Safety garment features
Extre
mel
y im
porta
nt
Ver
y im
porta
nt
Impo
rtant
Som
ewha
t im
porta
nt
Not
ver
y im
porta
nt
Visibility 5 4 3 2 1
Conspicuity 5 4 3 2 1
Reflectivity 5 4 3 2 1
Wearability 5 4 3 2 1
Durability 5 4 3 2 1
Comfort 5 4 3 2 1
Configuration 5 4 3 2 1
Worker’s confidence that he/she will be visible 5 4 3 2 1
Project Factors
Posi
tivel
y im
pact
ed
Not
ch
ange
d
Neg
ativ
ely
impa
cted
Project cost 5 4 3 2 1
Site productivity 5 4 3 2 1
Project duration 5 4 3 2 1
Circulation patterns within the work area 5 4 3 2 1
Circulation patterns in case of an emergency 5 4 3 2 1
Worker job satisfaction 5 4 3 2 1
Worker motivation 5 4 3 2 1
Labor relations 5 4 3 2 1

172
Please rate the importance of the following criteria that should help select a particular type of safety garment. We are seeking your opinion rather than the current practice in your organization.
** Thanks for your time and effort in filling out this questionnaire**
Please return by email [email protected]
You can also return it by regular mail
Professor David Arditi Illinois Institute of Technology
Department of Civil and Architectural Engineering 3201 South Dearborn Street
Chicago, IL 60616
Or by fax (312) 567-3519
Selection criteria
Extre
mel
y im
porta
nt
Ver
y im
porta
nt
Impo
rtant
Som
ewha
t im
porta
nt
Not
ver
y im
porta
nt
Acceptability by worker 5 4 3 2 1
Effect on the severity and frequency of accidents 5 4 3 2 1
Objective visibility measurements 5 4 3 2 1
Cost implications 5 4 3 2 1
Ease of manufacturing 5 4 3 2 1

173
APPENDX D
OTHER DOTs SURVEY INSTRUMENT

174
Worker Safety Issues in Nighttime Highway Construction
Questionnaire Survey Name: …………………………………….. Position: …………………………………… Organization: ……………………………… I. Type, severity, and frequency of nighttime accidents involving workers in work areas Do you think safety is more of a problem during nighttime or during daytime on highway construction/rehabilitation/maintenance work areas?
Nighttime Daytime No difference
How would you characterize the typical nighttime accident involving through traffic or construction equipment in work areas? (Mark as many as appropriate but only for the type(s) of work area you are familiar with)
Type of work area
Type of nighttime accident in work areas
Con
stru
ctio
n/
Reh
abili
tatio
n
Mai
nten
ance
Worker struck by through traffic inside the work area
Worker struck by through traffic outside the work area
Worker struck by construction equipment inside the work area
Worker struck by construction equipment outside the work area
Others (Specify the type _______________________________ )
DEPARTMENT OF CIVIL AND ARCHITECTURAL ENGINEERING
CONSTRUCTION ENGINEERING AND MANAGEMENT PROGRAM

175
How severe was the worst worker-related nighttime accident caused by vehicles driving through any of your DOT work areas in the last 5 years? (Answer only for the type(s) of work areas you are familiar with)
Type of highway work area
Ver
y se
vere
(in
volv
es fa
talit
y)
Seve
re (i
nvol
ves
inju
ry b
ut n
o fa
talit
y)
Less
sev
ere
(onl
y pr
oper
ty d
amag
e)
Construction/ Rehabilitation
Maintenance
How severe was the worst worker-related nighttime accident caused by construction equipment operating on any of your DOT work areas in the last 5 years? (Answer only for the type(s) of work area you are familiar with)
Type of highway work area
Ver
y se
vere
(in
volv
es fa
talit
y)
Seve
re (i
nvol
ves
inju
ry b
ut n
o fa
talit
y)
Not
sev
ere
(onl
y pr
oper
ty d
amag
e)
Construction/ Rehabilitation
Maintenance

176
How frequent (on the average) were the worker-related nighttime accidents caused by vehicles driving through any of your DOT work areas in the last 5 years? (Answer only for the type(s) of work area you are familiar with)
Type of highway work area
Ver
y fr
eque
nt
(mor
e th
an 1
ac
cide
nt/p
roje
ct)
Freq
uent
(1
acci
dent
/pro
ject
)
Less
freq
uent
(le
ss th
an1
acci
dent
/pro
ject
)
Construction/ Rehabilitation
Maintenance
How frequent (on the average) were the worker-related nighttime accidents caused by construction equipment operating on your DOT work areas in the last 5 years? (Answer only for the type(s) of work area you are familiar with)
Type of highway work area
Ver
y fr
eque
nt (m
ore
than
1 a
ccid
ent/p
roje
ct)
Freq
uent
(1
acci
dent
/pro
ject
)
Not
freq
uent
(les
s th
an1
acci
dent
/pro
ject
)
Construction/ Rehabilitation
Maintenance

177
What are the major factors contributing to worker-related nighttime accidents in work areas? (Mark as many as appropriate but only for the type(s) of work area you are familiar with)
Type of work area
Factors contributing to nighttime accidents in work areas
Con
stru
ctio
n/
Reh
abili
tatio
n
Mai
nten
ance
Poor lighting conditions
Unfavorable weather conditions
Poor performance of safety garment
Workers not wearing safety garments
Condition of vehicle operator (sleepy, DUI, age, etc.)
Others (Specify:_______________________________ )
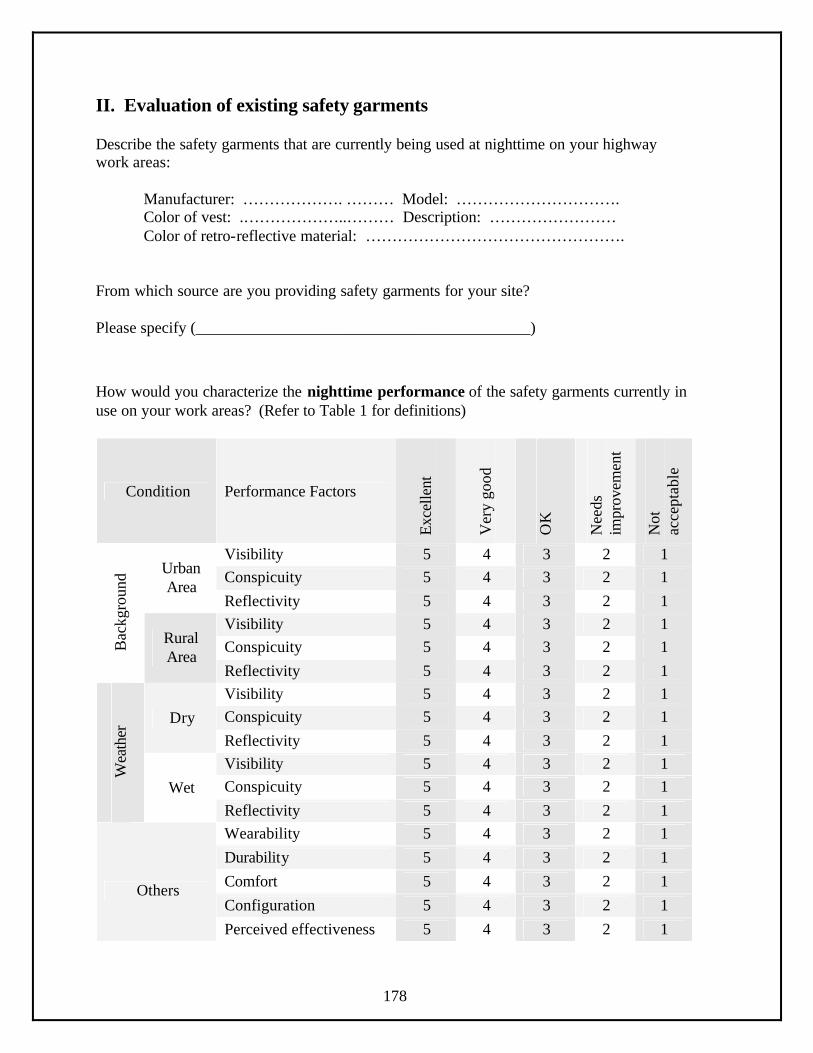
178
II. Evaluation of existing safety garments Describe the safety garments that are currently being used at nighttime on your highway work areas:
Manufacturer: ………………. ……… Model: …………………………. Color of vest: .………………..……… Description: …………………… Color of retro-reflective material: ………………………………………….
From which source are you providing safety garments for your site? Please specify (__________________________________________)
How would you characterize the nighttime performance of the safety garments currently in use on your work areas? (Refer to Table 1 for definitions)
Condition Performance Factors
Exce
llent
Ver
y go
od
OK
Nee
ds
impr
ovem
ent
Not
ac
cept
able
Visibility 5 4 3 2 1 Conspicuity 5 4 3 2 1 Urban
Area Reflectivity 5 4 3 2 1 Visibility 5 4 3 2 1 Conspicuity 5 4 3 2 1 B
ackg
roun
d
Rural Area
Reflectivity 5 4 3 2 1 Visibility 5 4 3 2 1 Conspicuity 5 4 3 2 1 Dry Reflectivity 5 4 3 2 1 Visibility 5 4 3 2 1 Conspicuity 5 4 3 2 1
Wea
ther
Wet Reflectivity 5 4 3 2 1 Wearability 5 4 3 2 1 Durability 5 4 3 2 1 Comfort 5 4 3 2 1 Configuration 5 4 3 2 1
Others
Perceived effectiveness 5 4 3 2 1

179
Table 1. Performance factors of safety garments (Modified from ASTM; Designation: F923-00, 3M)
Factors Definitions
Visibility Transmission of light waves from workers’ garments to the eye of the driver of through traffic or equipment operators.
Conspicuity The characteristics that a worker’s garment will come to the attention of a driver or operator by means of sharp contrast with the background.
Reflectivity The measure of brightness of retro-reflective material used in workers’ garments making the garments more visible at nighttime.
Wearability The qualities of the garments that provide good fit, up-to-date look, likable colors and shapes, and weather protection.
Durability The ability of garments to retain their original characteristics after many wears and washes.
Comfort Garments’ features that prevent the worker from perspiring, being cold or hot, getting wet, or limiting their movements.
Configuration The exterior and interior design of safety garments such as size, number and function of pockets, use of buttons/zippers/Velcro.
Perceived effectiveness
The worker’s confidence that the garment he/she is wearing is visible to drivers and operators and that he/she can move around with no fear of being struck by a vehicle.

180
III. Safety garment design factors and features
What is the importance of the following design factors in the use of retro-reflective materials to enhance the nighttime visibility of your safety garments? (Refer to Table 2 for definitions).
Table 2. Design Factors that Enhance Nighttime Visibility (Modified from 3M)
Factors Definitions
Definability of the human form
The retro-reflective material on a garment being the only component visible to a driver at nighttime, it should make the driver recognize the object as a worker.
Location of retro-reflective materials on the garment
The appropriate location of the retro-reflective material on a safety garment should enhance its visibility by drawing the human eye to the moving object as the worker moves.
360° visibility The human form should be detected from all directions regardless of the human form, movement, location, and situation.
Amount of retro-reflective material
The amount of retro-reflective material applied should increase a worker’s visibility.
Brightness of the retro-reflective material
The brightness of retro-reflective material should increase a worker’s visibility.
Acceptable loss of color and brightness after repeated wear and washing
The garment should be resistant to wear and washing such that the garment maintains its color and brightness longer.
Design Factors
Extre
mel
y im
porta
nt
Ver
y im
porta
nt
Impo
rtant
Som
ewha
t im
porta
nt
Not
ver
y im
porta
nt
Definability of the human form 5 4 3 2 1
Locations of retro-reflective materials on the garment 5 4 3 2 1
360° visibility 5 4 3 2 1
Amount of retro-reflective material 5 4 3 2 1
Brightness of the retro-reflective material 5 4 3 2 1 Acceptable loss of color and brightness after repeated wear and washing 5 4 3 2 1

181
How important do you consider the following features of safety garments used in nighttime construction? (See Table 1 for definitions)
What is the impact of extremely good nighttime visibility of workers on the following project factors?
Safety garment features
Extre
mel
y im
porta
nt
Ver
y im
port
ant
Impo
rtant
Som
ewha
t im
porta
nt
Not
ver
y im
porta
nt
Visibility 5 4 3 2 1
Conspicuity 5 4 3 2 1
Reflectivity 5 4 3 2 1
Wearability 5 4 3 2 1
Durability 5 4 3 2 1
Comfort 5 4 3 2 1
Configuration 5 4 3 2 1
Worker’s confidence that he/she will be visible 5 4 3 2 1
Project Factors
Posi
tivel
y im
pact
ed
Not
ch
ange
d
Neg
ativ
ely
impa
cted
Project cost 5 4 3 2 1
Site productivity 5 4 3 2 1
Project duration 5 4 3 2 1
Circulation patterns within the work area 5 4 3 2 1
Circulation patterns in case of an emergency 5 4 3 2 1
Worker job satisfaction 5 4 3 2 1
Worker motivation 5 4 3 2 1
Labor relations 5 4 3 2 1

182
Please rate the importance of the following criteria that should help select a particular type of safety garment. We are seeking your opinion rather than the current practice in your organization.
** Thanks for your time and effort in filling out this questionnaire**
Please return by email [email protected]
You can also return it by regular mail
Professor David Arditi Illinois Institute of Technology
Department of Civil and Architectural Engineering 3201 South Dearborn Street
Chicago, IL 60616
Or by fax (312) 567-3519
Selection criteria
Extre
mel
y im
porta
nt
Ver
y im
porta
nt
Impo
rtant
Som
ewha
t im
porta
nt
Not
ver
y im
porta
nt
Acceptability by worker 5 4 3 2 1
Effect on the severity and frequency of accidents 5 4 3 2 1
Objective visibility measurements 5 4 3 2 1
Cost implications 5 4 3 2 1
Ease of manufacturing 5 4 3 2 1

183
APPENDIX E
PHOTOGRAPHS FROM FIELD TESTS

184
PHOTOGRAPHS FROM FIELD TESTS
Site 1

185

186
Site 2

187

188
Site 3

189

190
APPENDIX F
SITE SURVEY INSTRUMENT

191
Please rate the safety garments’ design factors and features.
Vest no Design Factors & features
Exce
llent
Ver
y go
od
OK
Nee
ds
impr
ovem
ent
Not
ac
cept
able
360° visibility
Conspicuity against background
Brightness of retro-reflective material
Configuration (Pockets, zipper, etc.)
I
Overall perceived effectiveness
360° visibility
Conspicuity against background
Brightness of retro-reflective material
Configuration (Pockets, zipper, etc.)
II
Overall perceived effectiveness
360° visibility
Conspicuity against background
Brightness of retro-reflective material
Configuration (Pockets, zipper, etc.)
III
Overall perceived effectiveness

192
Vest no Design Factors & features
Exce
llent
Ver
y go
od
OK
Nee
ds
impr
ovem
ent
Not
ac
cept
able
360° visibility
Conspicuity against background
Brightness of retro-reflective material
Configuration (Pockets, zipper, etc.)
IV
Overall perceived effectiveness
360° visibility
Conspicuity against background
Brightness of retro-reflective material
Configuration (Pockets, zipper, etc.)
V
Overall perceived effectiveness
360° visibility
Conspicuity against background
Brightness of retro-reflective material
Configuration (Pockets, zipper, etc.)
VI
Overall perceived effectiveness

193
Factors Definition
Visibility Transmission of light waves from workers’ garments to the eye of the driver of through traffic or equipment operators.
360° visibility The human form should be detected from all directions regardless of the human form, movement, location and situation.
Conspicuity against background
The characteristics that a worker’s garment will come to the attention of a driver or operator by means of sharp contrast with the background.
Brightness of retro-reflective material
Brightness of retro-reflective material should increase a worker’s visibility.
Configuration The exterior and interior design of safety garments such as size, number and function of pockets, use of buttons/zippers/Velcro.
Overall perceived effectiveness
The worker’s confidence that the garment he/she is wearing is visible to drivers and operators and that he/she can move around with no fear of being struck by a vehicle.

194
APPENDIX G
DESCRIPTIVE STATISTICS
MEAN VALUES FOR FRONT FACES AND SIDES ON FOUR TEST SITES

195
Front Faces / First Site
Vest Settlement Mean N Std. Deviation Minimum Maximum
Left 90.653 266 2.813 85.97 102.69
Middle 88.080 251 3.813 73.44 96.10
Right 83.317 262 4.376 69.44 94.80 IDO
T
Stan
dard
V
est
Total 87.357 779 4.814 69.44 102.69
Left 92.680 251 4.572 77.52 104.35
Middle 98.742 262 4.819 84.47 113.73
Right 90.850 266 3.796 84.56 116.89
IDO
T L
ED
V
est
Total 94.094 779 5.562 77.52 116.89
Left 130.152 262 6.483 114.61 151.08
Middle 137.246 266 5.991 128.43 163.42
Right 123.331 251 6.311 106.65 141.41
Hea
d Li
te
Roa
dsta
r 200
Total 130.377 779 8.443 106.65 163.42
Left 105.538 252 6.809 85.99 123.28
Middle 107.195 255 5.663 87.46 124.16
Right 96.599 246 7.261 82.39 123.92
Iron
Hor
se
Texa
s St
yle
Total 103.179 753 8.061 82.39 124.16
Left 126.122 246 7.682 111.53 155.71
Middle 125.225 252 6.279 107.33 143.61
Right 122.459 255 5.427 104.75 138.02 Cha
mi
Des
ign
Was
hing
ton
Styl
e
Total 124.581 753 6.692 104.75 155.71
Left 127.923 255 7.020 108.14 151.87
Middle 127.145 246 8.773 110.91 163.39
Right 118.631 252 6.957 99.59 139.65
Safe
tylin
e M
inne
sota
St
yle
Total 124.559 753 8.699 99.59 163.39
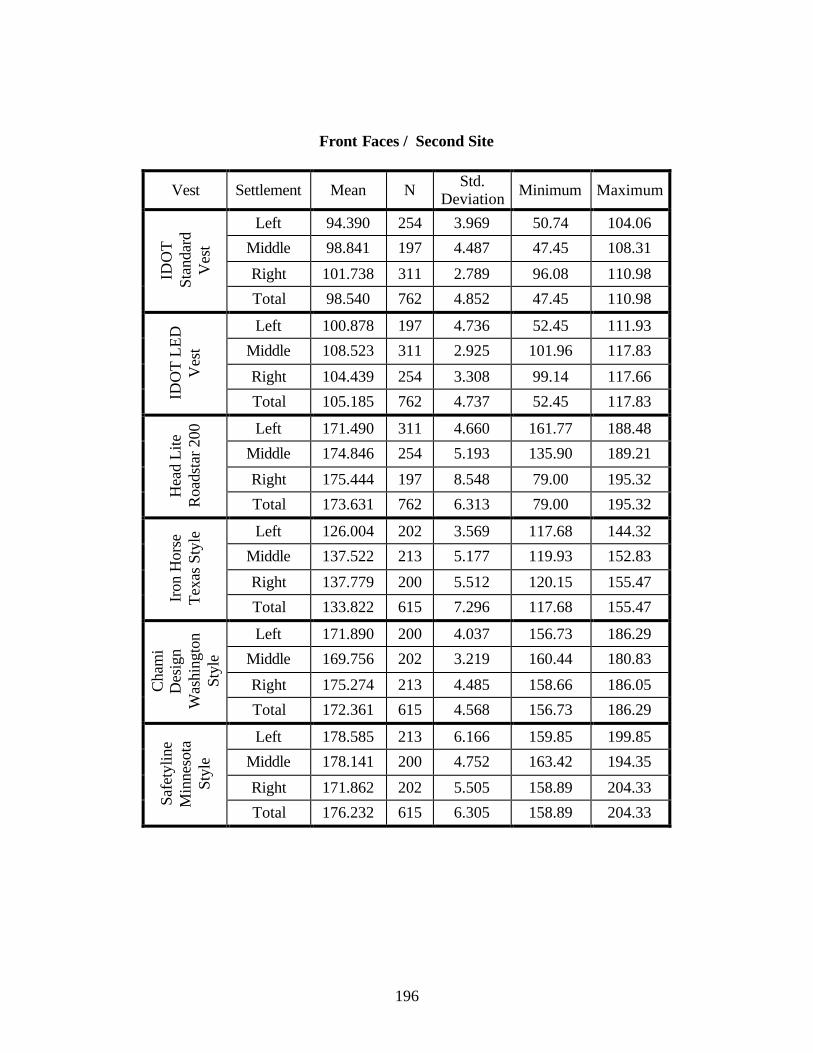
196
Front Faces / Second Site
Vest Settlement Mean N Std. Deviation Minimum Maximum
Left 94.390 254 3.969 50.74 104.06
Middle 98.841 197 4.487 47.45 108.31
Right 101.738 311 2.789 96.08 110.98 IDO
T
Stan
dard
V
est
Total 98.540 762 4.852 47.45 110.98
Left 100.878 197 4.736 52.45 111.93
Middle 108.523 311 2.925 101.96 117.83
Right 104.439 254 3.308 99.14 117.66
IDO
T L
ED
V
est
Total 105.185 762 4.737 52.45 117.83
Left 171.490 311 4.660 161.77 188.48
Middle 174.846 254 5.193 135.90 189.21
Right 175.444 197 8.548 79.00 195.32
Hea
d Li
te
Roa
dsta
r 200
Total 173.631 762 6.313 79.00 195.32
Left 126.004 202 3.569 117.68 144.32
Middle 137.522 213 5.177 119.93 152.83
Right 137.779 200 5.512 120.15 155.47
Iron
Hor
se
Texa
s St
yle
Total 133.822 615 7.296 117.68 155.47
Left 171.890 200 4.037 156.73 186.29
Middle 169.756 202 3.219 160.44 180.83
Right 175.274 213 4.485 158.66 186.05 Cha
mi
Des
ign
Was
hing
ton
Styl
e
Total 172.361 615 4.568 156.73 186.29
Left 178.585 213 6.166 159.85 199.85
Middle 178.141 200 4.752 163.42 194.35
Right 171.862 202 5.505 158.89 204.33
Safe
tylin
e M
inne
sota
St
yle
Total 176.232 615 6.305 158.89 204.33

197
Front Faces / Third Site
Vest Settlement Mean N Std. Deviation Minimum Maximum
Left 49.456 272 4.294 29.08 68.95
Middle 32.101 264 6.253 26.48 51.56
Right 30.555 277 4.567 26.78 54.74 IDO
T
Stan
dard
V
est
Total 37.380 813 9.985 26.48 68.95
Left 32.517 262 4.851 27.78 51.63
Middle 41.361 275 6.832 27.97 57.28
Right 31.378 258 5.892 23.90 50.63
IDO
T L
ED
V
est
Total 35.207 795 7.440 23.90 57.28
Left 44.281 264 8.502 34.93 83.05
Middle 38.677 277 6.950 32.04 76.45
Right 56.669 272 6.388 32.15 97.10
Hea
d Li
te
Roa
dsta
r 200
Total 46.516 813 10.515 32.04 97.10
Left 37.002 258 6.019 29.97 55.63
Middle 34.401 262 4.964 29.08 54.44
Right 43.578 275 7.183 29.08 65.10
Iron
Hor
se
Texa
s St
yle
Total 38.419 795 7.268 29.08 65.10
Left 40.188 277 7.037 33.64 79.70
Middle 55.902 272 6.654 29.97 98.29
Right 38.796 264 7.691 30.33 71.48 Cha
mi
Des
ign
Was
hing
ton
Styl
e
Total 44.993 813 10.535 29.97 98.29
Left 47.892 275 8.026 32.15 75.32
Middle 38.624 258 7.456 29.85 62.18
Right 37.890 262 6.507 29.97 61.81
Safe
tylin
e M
inne
sota
St
yle
Total 41.588 795 8.676 29.85 75.32

198
Front Faces / Fourth Site
Vest Settlement Mean N Std. Deviation Minimum Maximum
Left 36.455 302 7.039 30.08 73.24
Middle 31.379 270 2.960 27.90 47.20
Right 28.256 279 2.627 25.42 42.20 IDO
T
Stan
dard
V
est
Total 32.156 851 5.859 25.42 73.24
Left 34.777 285 3.772 29.20 56.37
Middle 32.172 274 3.398 27.20 53.74
Right 46.045 270 4.043 37.20 62.11
IDO
T L
ED
V
est
Total 37.586 829 7.053 27.20 62.11
Left 62.669 270 6.897 49.75 90.62
Middle 43.363 285 6.443 34.45 86.05
Right 38.105 274 4.843 31.38 62.11
Hea
d Li
te
Roa
dsta
r 200
Total 47.913 829 12.140 31.38 90.62
Left 38.328 270 4.606 32.97 60.51
Middle 33.417 279 3.340 28.78 47.97
Right 35.225 302 8.716 27.90 86.38
Iron
Hor
se
Texa
s St
yle
Total 35.617 851 6.422 27.90 86.38
Left 44.331 274 5.037 37.53 70.93
Middle 58.653 270 6.488 46.76 86.07
Right 40.789 285 10.925 30.98 87.61 Cha
mi
Des
ign
Was
hing
ton
Styl
e
Total 47.778 829 11.058 30.98 87.61
Left 42.703 279 4.893 36.34 63.85
Middle 48.245 302 14.734 34.34 129.31
Right 37.897 270 6.413 30.68 72.21
Safe
tylin
e M
inne
sota
St
yle
Total 43.145 851 10.760 30.68 129.31
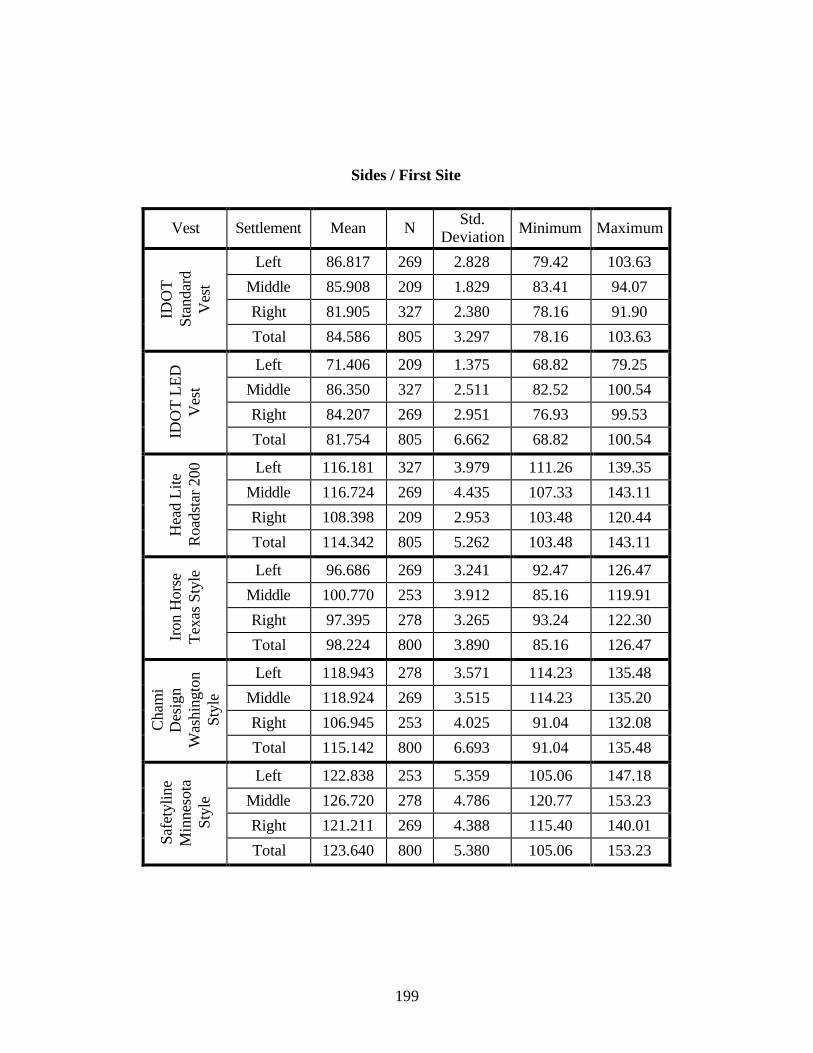
199
Sides / First Site
Vest Settlement Mean N Std. Deviation Minimum Maximum
Left 86.817 269 2.828 79.42 103.63
Middle 85.908 209 1.829 83.41 94.07
Right 81.905 327 2.380 78.16 91.90 IDO
T
Stan
dard
V
est
Total 84.586 805 3.297 78.16 103.63
Left 71.406 209 1.375 68.82 79.25
Middle 86.350 327 2.511 82.52 100.54
Right 84.207 269 2.951 76.93 99.53
IDO
T L
ED
V
est
Total 81.754 805 6.662 68.82 100.54
Left 116.181 327 3.979 111.26 139.35
Middle 116.724 269 4.435 107.33 143.11
Right 108.398 209 2.953 103.48 120.44
Hea
d Li
te
Roa
dsta
r 200
Total 114.342 805 5.262 103.48 143.11
Left 96.686 269 3.241 92.47 126.47
Middle 100.770 253 3.912 85.16 119.91
Right 97.395 278 3.265 93.24 122.30
Iron
Hor
se
Texa
s St
yle
Total 98.224 800 3.890 85.16 126.47
Left 118.943 278 3.571 114.23 135.48
Middle 118.924 269 3.515 114.23 135.20
Right 106.945 253 4.025 91.04 132.08 Cha
mi
Des
ign
Was
hing
ton
Styl
e
Total 115.142 800 6.693 91.04 135.48
Left 122.838 253 5.359 105.06 147.18
Middle 126.720 278 4.786 120.77 153.23
Right 121.211 269 4.388 115.40 140.01
Safe
tylin
e M
inne
sota
St
yle
Total 123.640 800 5.380 105.06 153.23
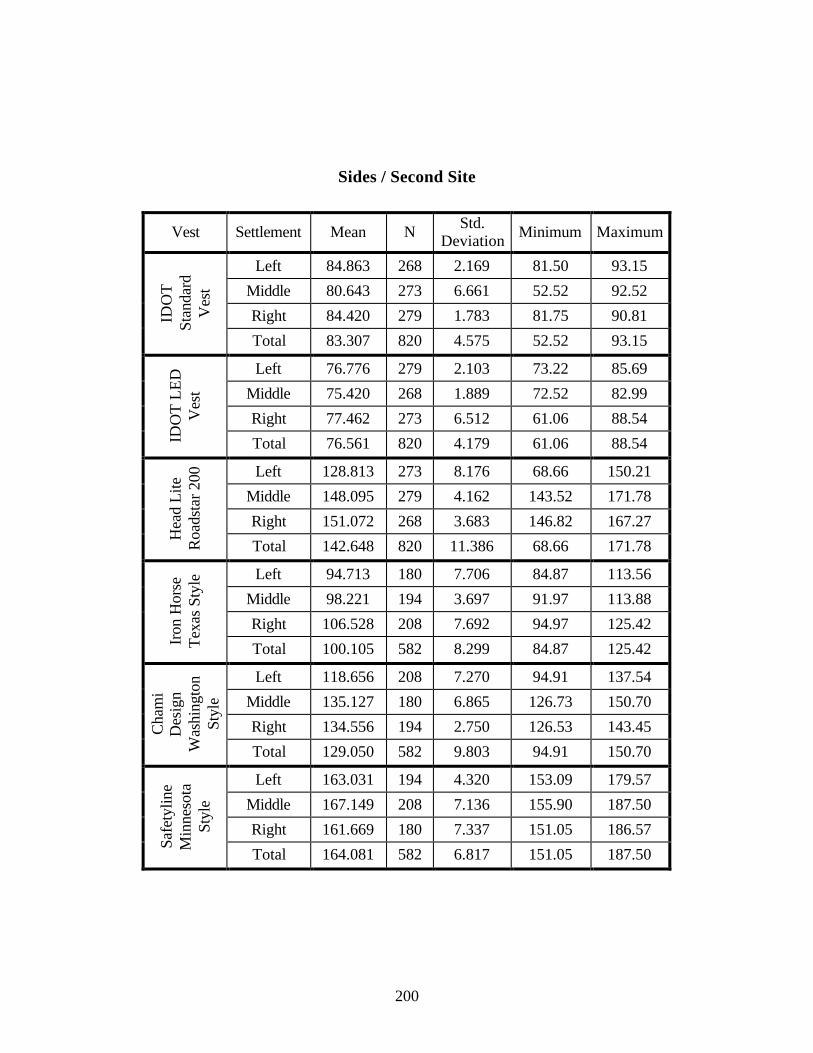
200
Sides / Second Site
Vest Settlement Mean N Std. Deviation Minimum Maximum
Left 84.863 268 2.169 81.50 93.15
Middle 80.643 273 6.661 52.52 92.52
Right 84.420 279 1.783 81.75 90.81 IDO
T
Stan
dard
V
est
Total 83.307 820 4.575 52.52 93.15
Left 76.776 279 2.103 73.22 85.69
Middle 75.420 268 1.889 72.52 82.99
Right 77.462 273 6.512 61.06 88.54
IDO
T L
ED
V
est
Total 76.561 820 4.179 61.06 88.54
Left 128.813 273 8.176 68.66 150.21
Middle 148.095 279 4.162 143.52 171.78
Right 151.072 268 3.683 146.82 167.27
Hea
d Li
te
Roa
dsta
r 200
Total 142.648 820 11.386 68.66 171.78
Left 94.713 180 7.706 84.87 113.56
Middle 98.221 194 3.697 91.97 113.88
Right 106.528 208 7.692 94.97 125.42
Iron
Hor
se
Texa
s St
yle
Total 100.105 582 8.299 84.87 125.42
Left 118.656 208 7.270 94.91 137.54
Middle 135.127 180 6.865 126.73 150.70
Right 134.556 194 2.750 126.53 143.45 Cha
mi
Des
ign
Was
hing
ton
Styl
e
Total 129.050 582 9.803 94.91 150.70
Left 163.031 194 4.320 153.09 179.57
Middle 167.149 208 7.136 155.90 187.50
Right 161.669 180 7.337 151.05 186.57
Safe
tylin
e M
inne
sota
St
yle
Total 164.081 582 6.817 151.05 187.50

201
Sides / Third Site
Vest Settlement Mean N Std. Deviation Minimum Maximum
Left 45.448 266 1.857 25.60 51.56
Middle 46.720 249 1.879 44.30 55.63
Right 44.816 277 1.353 42.71 53.26 IDO
T
Stan
dard
V
est
Total 45.627 792 1.876 25.60 55.63
Left 25.715 147 .986 22.89 31.07
Middle 36.472 138 3.073 23.19 41.07
Right 29.123 241 7.055 22.11 39.89
IDO
T L
ED
V
est
Total 30.099 526 6.479 22.11 41.07
Left 53.612 249 4.762 49.15 79.14
Middle 52.126 277 3.527 48.74 83.80
Right 49.650 266 3.024 28.97 60.93
Hea
d Li
te
Roa
dsta
r 200
Total 51.761 792 4.140 28.97 83.80
Left 42.202 138 3.687 27.78 53.03
Middle 34.996 241 7.566 27.26 49.73
Right 27.215 147 1.507 23.96 33.37
Iron
Hor
se
Texa
s St
yle
Total 34.712 526 7.802 23.96 53.03
Left 53.280 277 4.295 49.74 94.13
Middle 51.663 266 3.485 31.04 63.78
Right 51.645 249 3.954 46.97 68.25 Cha
mi
Des
ign
Was
hing
ton
Styl
e
Total 52.223 792 4.001 31.04 94.13
Left 41.265 241 8.349 32.15 77.44
Middle 33.473 147 3.118 29.15 50.07
Right 43.042 138 4.128 28.44 53.63
Safe
tylin
e M
inne
sota
St
yle
Total 39.554 526 7.342 28.44 77.44

202
Sides / Fourth Site
Vest Settlement Mean N Std. Deviation Minimum Maximum
Left 49.404 276 2.477 45.48 63.51
Middle 46.931 273 1.317 44.01 51.56
Right 46.082 271 1.566 42.71 55.63 IDO
T
Stan
dard
V
est
Total 47.483 820 2.332 42.71 63.51
Left 30.775 265 3.763 25.71 45.37
Middle 25.063 262 1.332 22.83 33.26
Right 23.418 261 1.089 21.23 27.60
IDO
T L
ED
V
est
Total 26.439 788 3.965 21.23 45.37
Left 36.475 262 3.410 31.74 53.00
Middle 33.457 261 2.871 28.56 44.52
Right 33.579 265 4.646 27.08 55.88
Hea
d Li
te
Roa
dsta
r 200
Total 34.501 788 3.970 27.08 55.88
Left 54.770 273 2.781 49.37 65.33
Middle 52.172 271 3.394 46.48 78.44
Right 48.052 276 1.997 44.60 58.26
Iron
Hor
se
Texa
s St
yle
Total 51.650 820 3.925 44.60 78.44
Left 36.120 261 2.501 32.57 43.89
Middle 37.462 265 6.156 29.68 80.41
Right 32.048 262 3.531 28.27 70.20 Cha
mi
Des
ign
Was
hing
ton
Styl
e
Total 35.218 788 4.922 28.27 80.41
Left 65.639 271 5.963 54.64 97.61
Middle 54.450 276 4.121 48.56 76.31
Right 56.405 273 4.989 46.67 74.95
Safe
tylin
e M
inne
sota
St
yle
Total 58.799 820 7.033 46.67 97.61

203
APPENDIX H
DESCRIPTIVE STATISTICS
NORMALIZED MEAN VALUES FOR FRONT FACES AND SIDES ON FOUR
TEST SITES

204
Front Faces / First Site
Normalized Luminance Values Vest Position
Mean photometer
reading
Original mean
luminance (1) Mean(2) N(3) Std.
Deviation Min Max
Left 16 90.653 96.319 266 2.989 91.34 109.11
Middle 16 88.080 93.585 251 4.051 78.03 102.11
Right 16 83.317 88.524 262 4.649 73.78 100.73 IDO
T
Stan
dard
V
est
Weighted Total (4) 87.357 92.816 779 5.114 73.78 109.11
Left 16 92.680 98.473 251 4.857 82.37 110.87
Middle 16 98.742 104.913 262 5.120 89.75 120.84
Right 16 90.850 96.528 266 4.033 89.85 124.20
IDO
T L
ED
V
est
Weighted Total (4) 94.094 99.975 779 5.909 82.37 124.20
Left 16 130.152 138.287 262 6.888 121.77 160.52
Middle 16 137.246 145.824 266 6.366 136.46 173.63
Right 16 123.331 131.039 251 6.705 113.32 150.25
Hea
d Li
te
Roa
dsta
r 200
Weighted Total (4) 130.377 138.525 779 8.971 113.32 173.63
Left 17 105.538 105.538 252 6.809 85.99 123.28
Middle 17 107.195 107.195 255 5.663 87.46 124.16
Right 16 96.599 102.636 246 7.714 87.54 131.67
Iron
Hor
se
Texa
s St
yle
Weighted Total (4) 103.179 105.151 753 7.017 85.99 131.67
Left 16 126.122 134.004 246 8.162 118.50 165.44
Middle 17 125.225 125.225 252 6.279 107.33 143.61
Right 17 122.459 122.459 255 5.427 104.75 138.02 Cha
mi
Des
ign
Was
hing
ton
Styl
e
Weighted Total (4) 124.581 127.156 753 8.300 104.75 165.44
Left 17 127.923 127.923 255 7.020 108.14 151.87
Middle 16 127.145 135.092 246 9.321 117.84 173.60
Right 17 118.631 118.631 252 6.957 99.59 139.65
Safe
tylin
e M
inne
sota
St
yle
Weighted Total (4) 124.559 127.155 753 10.308 99.59 173.60
(1) The original means are obtained from descriptive statistics tables in Appendix E (2) Normalized Mean = (Original mean) × (Max pho tometer reading) / (Photometer reading) (3) N = Number of data frames (4) Weighted Total = Weighted average of three positions (left, middle and right) using N

205
Front Faces / Second Site
Normalized Luminance Values Vest Position
Average photometer
reading
Original mean
luminance (1) Mean(2) N(3) Std.
Deviation Min Max
Left 50 94.390 94.390 254 3.969 50.74 104.06
Middle 49 98.841 100.858 197 4.579 48.42 110.52
Right 50 101.738 101.738 311 2.789 96.08 110.98 IDO
T
Stan
dard
V
est
Weighted Total (4) 98.540 99.061 762 4.985 48.42 110.98
Left 49 100.878 102.937 197 4.832 53.52 114.21
Middle 50 108.523 108.523 311 2.925 101.96 117.83
Right 50 104.439 104.439 254 3.308 99.14 117.66
IDO
T L
ED
V
est
Weighted Total (4) 105.185 105.718 762 4.348 53.52 117.83
Left 50 171.490 171.490 311 4.660 161.77 188.48
Middle 50 174.846 174.846 254 5.193 135.90 189.21
Right 49 175.444 179.025 197 8.723 80.61 199.31
Hea
d Li
te
Roa
dsta
r 200
Weighted Total (4) 173.631 174.557 762 6.816 80.61 199.31
Left 49 126.004 128.575 202 3.642 120.08 147.27
Middle 49 137.522 140.329 213 5.283 122.38 155.95
Right 48 137.779 143.519 200 5.742 125.16 161.95
Iron
Hor
se
Tex
as S
tyle
Weighted Total (4) 133.822 137.506 615 8.090 120.08 161.95
Left 48 171.890 179.052 200 4.205 163.26 194.05
Middle 49 169.756 173.221 202 3.285 163.71 184.52
Right 49 175.274 178.851 213 4.576 161.90 189.85 Cha
mi
Des
ign
Was
hing
ton
Styl
e
Weighted Total (4) 172.361 177.067 615 4.873 161.90 194.05
Left 49 178.585 182.230 213 6.292 163.11 203.93
Middle 48 178.141 185.563 200 4.950 170.23 202.45
Right 49 171.862 175.369 202 5.617 162.13 208.50
Safe
tylin
e M
inne
sota
St
yle
Weighted Total (4) 176.232 181.060 615 7.048 162.13 208.50
(1) The original means are obtained from descriptive statistics tables in Appendix E (2) Normalized Mean = (Original mean) × (Max photometer reading) / (Photometer reading) (3) N = Number of data frames (4) Weighted Total = Weighted average of three positions (left, middle and right) using N

206
Front Faces / Third Site
Normalized Luminance Values Vest Position
Average traffic
volume (veh/min)
Original Mean
Luminance (1) Mean(2) N(3) Std.
Deviation Min Max
Left 12.36 49.456 63.620 272 5.523 37.41 88.70
Middle 11.47 32.101 44.499 264 8.668 36.71 71.47
Right 11.09 30.555 43.808 277 6.548 38.40 78.48 IDO
T
Stan
dard
V
est
Weighted Total (4) 37.380 50.660 813 11.564 36.71 88.70
Left 13.63 32.517 37.933 262 5.659 32.41 60.23
Middle 15.90 41.361 41.361 275 6.832 27.97 57.28
Right 11.80 31.378 42.280 258 7.939 32.20 68.22
IDO
T L
ED
V
est
Weighted Total (4) 35.207 40.529 795 7.106 27.97 68.22
Left 11.47 44.281 61.383 264 11.786 48.42 115.13
Middle 11.09 38.677 55.453 277 9.965 45.94 109.61
Right 12.36 56.669 72.900 272 8.217 41.36 124.91
Hea
d Li
te
Roa
dsta
r 200
Weighted Total (4) 46.516 63.216 813 12.423 41.36 124.91
Left 11.80 37.002 49.858 258 8.110 40.38 74.96
Middle 13.63 34.401 40.130 262 5.791 33.92 63.51
Right 15.90 43.578 43.578 275 7.183 29.08 65.10
Iron
Hor
se
Texa
s St
yle
Weighted Total (4) 38.419 44.480 795 8.127 29.08 74.96
Left 11.09 40.188 57.618 277 10.089 48.23 114.27
Middle 12.36 55.902 71.913 272 8.560 38.55 126.44
Right 11.47 38.796 53.780 264 10.661 42.04 99.09 Cha
mi
Des
ign
Was
hing
ton
Styl
e
Weighted Total (4) 44.993 61.154 813 12.513 38.55 126.44
Left 15.90 47.892 47.892 275 8.026 32.15 75.32
Middle 11.80 38.624 52.044 258 10.047 40.22 83.78
Right 13.63 37.890 44.200 262 7.591 34.96 72.10
Safe
tylin
e M
inne
sota
St
yle
Weighted Total (4) 41.588 48.023 795 9.161 32.15 83.78
(1) The original means are obtained from descriptive statistics tables in Appendix E (2) Normalized Mean = (Original mean) × (Max traffic volume) / (Traffic volume) (3) N = Number of data frames (4) Weighted Total = Weighted average of three positions (le ft, middle and right) using N

207
Front Faces / Fourth Site
Normalized Luminance Values Vest Position
Average traffic
volume (veh/min)
Original mean
luminance (1) Mean(2) N(3) Std.
Deviation Min Max
Left 21.06 36.455 49.195 302 9.499 40.59 98.84
Middle 25.78 31.379 34.592 270 3.263 30.76 52.03
Right 16.90 28.256 47.517 279 4.418 42.75 70.97 IDO
T
Stan
dard
V
est
Weighted Total (4) 32.156 44.012 851 9.136 30.76 98.84
Left 28.42 34.777 34.777 285 3.772 29.20 56.37
Middle 25.69 32.172 35.591 274 3.759 30.09 59.45
Right 26.46 46.045 49.455 270 4.343 39.96 66.71
IDO
T L
ED
V
est
Weighted Total (4) 37.586 39.827 829 7.785 29.20 66.71
Left 26.46 62.669 67.311 270 7.407 53.44 97.33
Middle 28.42 43.363 43.363 285 6.443 34.45 86.05
Right 25.69 38.105 42.154 274 5.358 34.71 68.71
Hea
d Li
te
Roa
dsta
r 200
Weighted Total (4) 47.913 50.763 829 13.198 34.45 97.33
Left 25.78 38.328 42.252 270 5.078 36.35 66.71
Middle 16.90 33.417 56.195 279 5.617 48.40 80.67
Right 21.06 35.225 47.536 302 11.762 37.65 116.57
Iron
Hor
se
Texa
s St
yle
Weighted Total (4) 35.617 48.699 851 9.980 36.35 116.57
Left 25.69 44.331 49.042 274 5.572 41.52 78.47
Middle 26.46 58.653 62.998 270 6.969 50.22 92.45
Right 28.42 40.789 40.789 285 10.925 30.98 87.61 Cha
mi
Des
ign
Was
hing
ton
Styl
e
Weighted Total (4) 47.778 50.750 829 12.288 30.98 92.45
Left 16.90 42.703 71.812 279 8.228 61.11 107.37
Middle 21.06 48.245 65.106 302 19.884 46.34 174.50
Right 25.78 37.897 41.777 270 7.070 33.82 79.60
Safe
tylin
e M
inne
sota
St
yle
Weighted Total (4) 43.145 59.903 851 18.398 33.82 174.50
(1) The original means are obtained from descriptive statistics tables in Appendix E (2) Normalized Mean = (Original mean) × (Max traffic volume) / (Traffic volume) (3) N = Number of data frames (4) Weighted Total = Weighted average of three positions (left, middle and right) using N

208
Sides / First Site
Normalized Luminance Values Vest Position
Average photometer
reading
Original mean
luminance (1) Mean(2) N(3) Std.
Deviation Min Max
Left 17 86.817 86.817 269 2.828 79.42 103.63
Middle 16 85.908 91.277 209 1.943 88.62 99.95
Right 17 81.905 81.905 327 2.380 78.16 91.90 IDO
T
Stan
dard
V
est
Weighted Tota17l (4) 84.586 85.980 805 4.497 78.16 103.63
Left 16 71.406 75.869 209 1.461 73.12 84.20
Middle 17 86.350 86.350 327 2.511 82.52 100.54
Right 17 84.207 84.207 269 2.951 76.93 99.53
IDO
T L
ED
V
est
Weighted Total (4) 81.754 82.913 805 4.927 73.12 100.54
Left 17 116.181 116.181 327 3.979 111.26 139.35
Middle 17 116.724 116.724 269 4.435 107.33 143.11
Right 16 108.398 115.172 209 3.137 109.95 127.97
Hea
d Li
te
Roa
dsta
r 200
Weighted Total (4) 114.342 116.101 805 3.985 107.33 143.11
Left 17 96.686 96.686 269 3.241 92.47 126.47
Middle 17 100.770 100.770 253 3.912 85.16 119.91
Right 17 97.395 97.395 278 3.265 93.24 122.30
Iron
Hor
se
Texa
s St
yle
Weighted Total (4) 98.224 98.224 800 3.890 85.16 126.47
Left 17 118.943 118.943 278 3.571 114.23 135.48
Middle 17 118.924 118.924 269 3.515 114.23 135.20
Right 17 106.945 106.945 253 4.025 91.04 132.08 Cha
mi
Des
ign
Was
hing
ton
Styl
e
Weighted Total (4) 115.142 115.142 800 6.693 91.04 135.48
Left 17 122.838 122.838 253 5.359 105.06 147.18
Middle 17 126.720 126.720 278 4.786 120.77 153.23
Right 17 121.211 121.211 269 4.388 115.40 140.01
Safe
tylin
e M
inne
sota
St
yle
Weighted Total (4) 123.640 123.640 800 5.380 105.06 153.23
(1) The original means are obtained from descriptive statistics tables in Appendix E (2) Normalized Mean = (Original mean) × (Max photometer reading) / (Photometer reading) (3) N = Number of data frames (4) Weighted Total = Weighted average of three positions (left, middle and right) using N

209
Sides / Second Site
Normalized Luminance Values Vest Position
Average photometer
reading
Original mean
luminance (1) Mean(2) N(3) Std.
Deviation Min Max
Left 50 84.863 84.863 268 2.169 81.50 93.15
Middle 48 80.643 84.003 273 6.938 54.71 96.38
Right 49 84.420 86.143 279 1.819 83.42 92.66 IDO
T
Stan
dard
V
est
Weighted Total (4) 83.307 85.012 820 4.408 54.71 96.38
Left 49 76.776 78.343 279 2.145 74.71 87.44
Middle 50 75.420 75.420 268 1.889 72.52 82.99
Right 48 77.462 80.690 273 6.783 63.60 92.23
IDO
T L
ED
V
est
Weighted Total (4) 76.561 78.169 820 4.755 63.60 92.23
Left 48 128.813 134.180 273 8.517 71.52 156.47
Middle 49 148.095 151.117 279 4.247 146.45 175.29
Right 50 151.072 151.072 268 3.683 146.82 167.27
Hea
d Li
te
Roa
dsta
r 200
Weighted Total (4) 142.648 145.464 820 9.913 71.52 175.29
Left 50 94.713 94.713 180 7.706 84.87 113.56
Middle 50 98.221 98.221 194 3.697 91.97 113.88
Right 49 106.528 108.702 208 7.849 96.91 127.98
Iron
Hor
se
Texa
s St
yle
Weighted Total (4) 100.105 100.882 582 8.990 84.87 127.98
Left 49 118.656 121.077 208 7.418 96.85 140.35
Middle 50 135.127 135.127 180 6.865 126.73 150.70
Right 50 134.556 134.556 194 2.750 126.53 143.45 Cha
mi
Des
ign
Was
hing
ton
Styl
e
Weighted Total (4) 129.050 129.915 582 8.956 96.85 150.70
Left 50 163.031 163.031 194 4.320 153.09 179.57
Middle 49 167.149 170.560 208 7.281 159.08 191.33
Right 50 161.669 161.669 180 7.337 151.05 186.57
Safe
tylin
e M
inne
sota
St
yle
Weighted Total (4) 164.081 165.301 582 7.575 151.05 191.33
(1) The original means are obtained from descriptive statistics tables in Appendix E (2) Normalized Mean = (Original mean) × (Max photometer reading) / (Photometer reading) (3) N = Number of data frames (4) Weighted Total = Weighted average of three positions (left, middle and right) using N

210
Sides / Third Site
Normalized Luminance Values Vest Position
Average traffic
volume (veh/min)
Original mean
luminance (1) Mean(2) N(3) Std.
Deviation Min Max
Left 11.10 45.448 47.741 266 1.951 26.89 54.16
Middle 11.66 46.720 46.720 249 1.879 44.30 55.63
Right 8.38 44.816 62.357 277 1.882 59.43 74.11 IDO
T
Stan
dard
V
est
Weighted Total (4) 45.627 52.532 792 7.468 26.89 74.11
Left 6.32 25.715 47.443 147 1.820 42.23 57.32
Middle 6.10 36.472 69.715 138 5.874 44.33 78.50
Right 5.57 29.123 60.965 241 14.769 46.28 83.50
IDO
T L
ED
V
est
Weighted Total (4) 30.099 59.481 526 13.370 42.23 83.50
Left 11.66 53.612 53.612 249 4.762 49.15 79.14
Middle 8.38 52.126 72.529 277 4.907 67.82 116.60
Right 11.10 49.650 52.154 266 3.177 30.43 64.00
Hea
d Li
te
Roa
dsta
r 200
Weighted Total (4) 51.761 59.738 792 10.360 30.43 116.60
Left 6.10 42.202 80.668 138 7.047 53.10 101.37
Middle 5.57 34.996 73.258 241 15.839 57.06 104.10
Right 6.32 27.215 50.209 147 2.781 44.20 61.57
Iron
Hor
se
Texa
s St
yle
Weighted Total (4) 34.712 68.761 526 16.514 44.20 104.10
Left 8.38 53.280 74.135 277 5.975 69.21 130.97
Middle 11.10 51.663 54.269 266 3.661 32.61 67.00
Right 11.66 51.645 51.645 249 3.954 46.97 68.25 Cha
mi
Des
ign
Was
hing
ton
Styl
e
Weighted Total (4) 52.223 60.392 792 11.166 32.61 130.97
Left 5.57 41.265 86.383 241 17.478 67.30 162.11
Middle 6.32 33.473 61.756 147 5.752 53.78 92.38
Right 6.10 43.042 82.274 138 7.890 54.36 102.51
Safe
tylin
e M
inne
sota
St
yle
Weighted Total (4) 39.554 78.422 526 16.609 53.78 162.11
(1) The original means are obtained from descriptive statistics tables in Appendix E (2) Normalized Mean = (Original mean) × (Max traffic volume) / (Traffic volume) (3) N = Number of data frames (4) Weighted Total = Weighted average of three positions (left, middle and right) using N

211
Sides / Fourth Site
Normalized Luminance Values Vest Position
Average traffic
volume (veh/min)
Original mean
luminance (1) Mean(2) N(3) Std.
Deviation Min Max
Left 17.77 49.404 53.269 276 2.671 49.04 68.48
Middle 19.16 46.931 46.931 273 1.317 44.01 51.56
Right 18.96 46.082 46.568 271 1.582 43.16 56.22 IDO
T
Stan
dard
V
est
Weighted Total (3) 47.483 48.944 820 3.649 43.16 68.48
Left 11.50 30.775 51.273 265 6.270 42.84 75.59
Middle 11.98 25.063 40.084 262 2.130 36.51 53.19
Right 12.84 23.418 34.944 261 1.625 31.68 41.19
IDO
T L
ED
V
est
Weighted Total (3) 26.439 42.144 788 7.889 31.68 75.59
Left 11.98 36.475 58.336 262 5.453 50.76 84.76
Middle 12.84 33.457 49.925 261 4.283 42.62 66.43
Right 11.50 33.579 55.945 265 7.740 45.12 93.10
Hea
d Li
te
Roa
dsta
r 200
Weighted Total (3) 34.501 54.746 788 6.964 42.62 93.10
Left 19.16 54.770 54.770 273 2.781 49.37 65.33
Middle 18.96 52.172 52.723 271 3.430 46.97 79.27
Right 17.77 48.052 51.811 276 2.153 48.09 62.82
Iron
Hor
se
Texa
s St
yle
Weighted Total (3) 51.650 53.097 820 3.089 46.97 79.27
Left 12.84 36.120 53.898 261 3.732 48.60 65.49
Middle 11.50 37.462 62.415 265 10.256 49.45 133.97
Right 11.98 32.048 51.256 262 5.647 45.21 112.27 Cha
mi
Des
ign
Was
hing
ton
Styl
e
Weighted Total (3) 35.218 55.884 788 8.559 45.21 133.97
Left 18.96 65.639 66.332 271 6.026 55.22 98.64
Middle 17.77 54.450 58.709 276 4.444 52.36 82.28
Right 19.16 56.405 56.405 273 4.989 46.67 74.95
Safe
tylin
e M
inne
sota
St
yle
Weighted Total (3) 58.799 60.461 820 6.693 46.67 98.64
(1) The original means are obtained from descriptive statistics tables in Appendix E (2) Normalized Mean = (Original mean) × (Max traffic volume) / (Traffic volume) (3) N = Number of data frames (4) Weighted Total = Weighted average of three positions (left, middle and right) using N

212
APPENDIX I
DESCRIPTIVE STATISTICS
COMPARISON OF VEST POSITIONS IN SITE TESTS

213
Front Face of IDOT Standard Vest / First Site
Descriptive Statistics
Vest Position Normalized
mean luminance
N Std.
Deviation Minimum Maximum
Left 96.319 266 2.989 91.34 109.11
Middle 93.585 251 4.051 78.03 102.11
Right 88.524 262 4.649 73.78 100.73
IDOT Standard
Vest Total 92.816 779 5.114 73.78 109.11
Tamhane’s T2 Test Results
Position (I) Position (J) Mean Difference (I-J) Std. Error Sig.
Middle 2.734 .315 .000 Left
Right 7.795 .341 .000
Left -2.734 .315 .000 Middle
Right 5.061 .385 .000
Left -7.795 .341 .000 Right
Middle -5.061 .385 .000

214
Front Face of IDOT LED Vest / First Site
Descriptive Statistics
Vest Position Normalized
mean luminance
N Std.
Deviation Minimum Maximum
Left 98.473 251 4.857 82.37 110.87
Middle 104.913 262 5.120 89.75 120.84
Right 96.528 266 4.033 89.85 124.20 IDOT LED
Vest
Total 99.975 779 5.909 82.37 124.20
Tamhane’s T2 Test Results
Position (I) Position (J) Mean Difference (I-J) Std. Error Sig.
Middle -6.441 .441 .000 Left
Right 1.945 .394 .000
Left 6.441 .441 .000 Middle
Right 8.385 .401 .000
Left -1.945 .394 .000 Right
Middle -8.385 .401 .000

215
Front Face of Head Lite Roadstar 200 Vest / First Site
Descriptive Statistics
Vest Position Mean N Std. Deviation Minimum Maximum
Left 138.287 262 6.888 121.77 160.52
Middle 145.824 266 6.366 136.46 173.63
Right 131.039 251 6.705 113.32 150.25
Head Lite Roadstar
200 Total 138.525 779 8.971 113.32 173.63
Tamhane’s T2 Test Results
Position (I) Position (J) Mean Difference (I-J) Std. Error Sig.
Middle -7.537 .577 .000 Left
Right 7.248 .600 .000
Left 7.537 .577 .000 Middle
Right 14.785 .576 .000
Left -7.248 .600 .000 Right
Middle -14.785 .576 .000

216
Front Face of Iron Horse Texas Style Vest / First Site
Descriptive Statistics
Vest Position Mean N Std. Deviation Minimum Maximum
Left 105.538 252 6.809 85.99 123.28
Middle 107.195 255 5.663 87.46 124.16
Right 102.636 246 7.714 87.54 131.67 Iron Horse Texas Style
Total 105.151 753 7.017 85.99 131.67
Tamhane’s T2 Test Results
Position (I) Position (J) Mean Difference (I-J) Std. Error Sig.
Middle -1.657 .557 .009 Left
Right 2.902 .653 .000
Left 1.657 .557 .009 Middle
Right 4.559 .606 .000
Left -2.902 .653 .000 Right
Middle -4.559 .606 .000

217
Front Face of Chami Design Washington Style Vest / First Site
Descriptive Statistics
Vest Position Mean N Std. Deviation Minimum Maximum
Left 134.004 246 8.162 118.50 165.44
Middle 125.225 252 6.279 107.33 143.61
Right 122.459 255 5.427 104.75 138.02
Chami Design
Washington Style
Total 127.156 753 8.300 104.75 165.44
Tamhane’s T2 Test Results
(I) (J) Mean Difference (I-J) Std. Error Sig.
Middle 8.780 .654 .000 Left
Right 11.546 .622 .000
Left -8.780 .654 .000 Middle
Right 2.766 .521 .000
Left -11.546 .622 .000 Right
Middle -2.766 .521 .000

218
Front Face of Safetyline Minnesota Style Vest / First Site
Descriptive Statistics
Vest Mean N Std. Deviation Minimum Maximum
Left 127.923 255 7.020 108.14 151.87
Middle 135.092 246 9.321 117.84 173.60
Right 118.631 252 6.957 99.59 139.65
Safetyline Minnesota
Style Total 127.155 753 10.308 99.59 173.60
Tamhane’s T2 Test Results
(I) (J) Mean Difference (I-J) Std. Error Sig.
Middle -7.169 .739 .000 Left
Right 9.292 .621 .000
Left 7.169 .739 .000 Middle
Right 16.461 .738 .000
Left -9.292 .621 .000 Right
Middle -16.461 .738 .000

219
Front Face of IDOT Standard Vest / Second Site
Descriptive Statistics
Vest Mean N Std. Deviation Minimum Maximum
Left 94.390 254 3.969 50.74 104.06
Middle 100.858 197 4.579 48.42 110.52
Right 101.738 311 2.789 96.08 110.98
IDOT Standard
Vest Total 99.061 762 4.985 48.42 110.98
Tamhane’s T2 Test Results
(I) (J) Mean Difference (I-J) Std. Error Sig.
Middle -6.468 .410 .000 Left
Right -7.348 .295 .000
Left 6.468 .410 .000 Middle
Right -.880 .363 .047
Left 7.348 .295 .000 Right
Middle .880 .363 .047

220
Front Face of IDOT LED Vest / Second Site
Descriptive Statistics
Vest Mean N Std. Deviation Minimum Maximum
Left 102.937 197 4.832 53.52 114.21
Middle 108.523 311 2.925 101.96 117.83
Right 104.439 254 3.308 99.14 117.66 IDOT LED
Vest
Total 105.718 762 4.348 53.52 117.83
Tamhane’s T2 Test Results
(I) (J) Mean Difference (I-J) Std. Error Sig.
Middle -5.586 .382 .000 Left
Right -1.502 .402 .001
Left 5.586 .382 .000 Middle
Right 4.084 .266 .000
Left 1.502 .402 .001 Right
Middle -4.084 .266 .000

221
Front Face of Head Lite Roadstar 200Vest / Second Site
Descriptive Statistics
Vest Mean N Std. Deviation Minimum Maximum
Left 171.490 311 4.660 161.77 188.48
Middle 174.846 254 5.193 135.90 189.21
Right 179.025 197 8.723 80.61 199.31
Head Lite Roadstar
200 Total 174.557 762 6.816 80.61 199.31
Tamhane’s T2 Test Results
(I) (J) Mean Difference (I-J) Std. Error Sig.
Middle -3.357 .420 .000 Left
Right -7.535 .675 .000
Left 3.357 .420 .000 Middle
Right -4.178 .702 .000
Left 7.535 .675 .000 Right
Middle 4.178 .702 .000

222
Front Face of Iron Horse Texas Style Vest / Second Site
Descriptive Statistics
Vest Mean N Std. Deviation Minimum Maximum
Left 128.575 202 3.642 120.08 147.27
Middle 140.329 213 5.283 122.38 155.95
Right 143.519 200 5.742 125.16 161.95 Iron Horse Texas Style
Total 137.506 615 8.090 120.08 161.95
Tamhane’s T2 Test Results
(I) (J) Mean Difference (I-J) Std. Error Sig.
Middle -11.754 .444 .000 Left
Right -14.944 .480 .000
Left 11.754 .444 .000 Middle
Right -3.190 .544 .000
Left 14.944 .480 .000 Right
Middle 3.190 .544 .000

223
Front Face of Chami Design Washington Style Vest / Second Site
Descriptive Statistics
Vest Mean N Std. Deviation Minimum Maximum
Left 179.052 200 4.205 163.26 194.05
Middle 173.221 202 3.285 163.71 184.52
Right 178.851 213 4.576 161.90 189.85
Chami Design
Washington Style
Total 177.067 615 4.873 161.90 194.05
Tamhane’s T2 Test Results
(I) (J) Mean Difference (I-J) Std. Error Sig.
Middle 5.831 .377 .000 Left
Right .201 .432 .954
Left -5.831 .377 .000 Middle
Right -5.630 .390 .000
Left -.201 .432 .954 Right
Middle 5.630 .390 .000
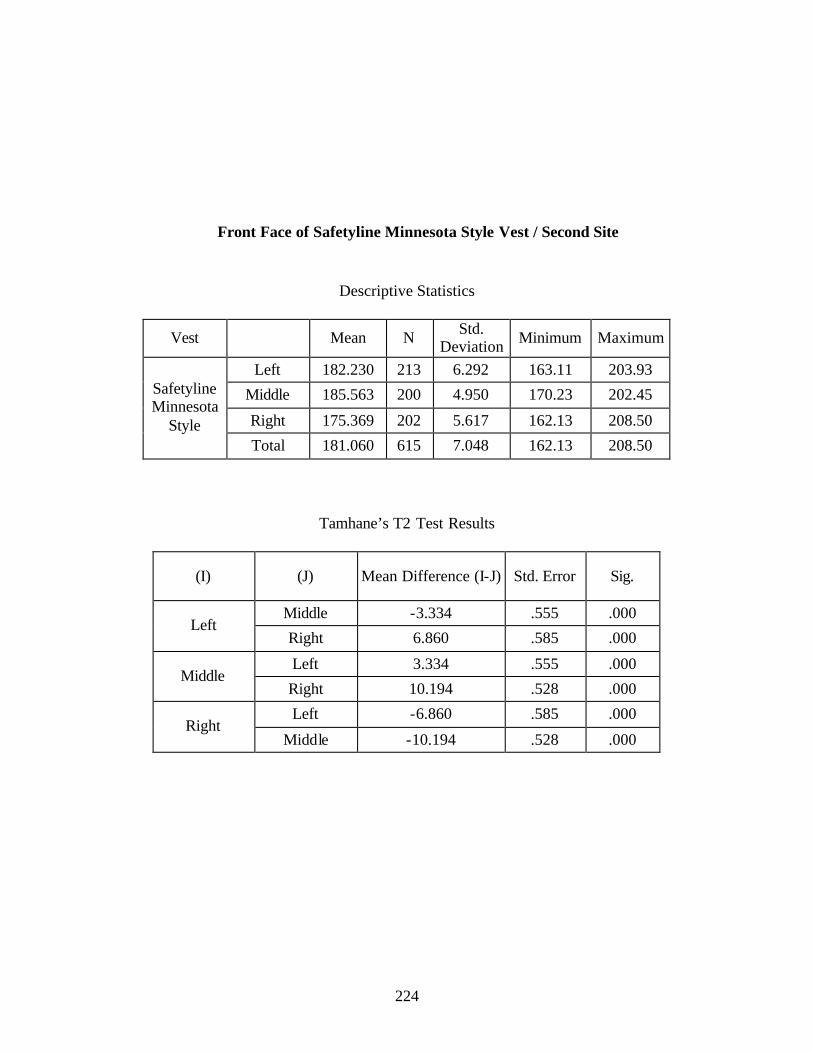
224
Front Face of Safetyline Minnesota Style Vest / Second Site
Descriptive Statistics
Vest Mean N Std. Deviation Minimum Maximum
Left 182.230 213 6.292 163.11 203.93
Middle 185.563 200 4.950 170.23 202.45
Right 175.369 202 5.617 162.13 208.50
Safetyline Minnesota
Style Total 181.060 615 7.048 162.13 208.50
Tamhane’s T2 Test Results
(I) (J) Mean Difference (I-J) Std. Error Sig.
Middle -3.334 .555 .000 Left
Right 6.860 .585 .000
Left 3.334 .555 .000 Middle
Right 10.194 .528 .000
Left -6.860 .585 .000 Right
Middle -10.194 .528 .000

225
Front Face of IDOT Standard Vest / Third Site
Descriptive Statistics
Vest Mean N Std. Deviation Minimum Maximum
Left 63.620 272 5.523 37.41 88.70
Middle 44.499 264 8.668 36.71 71.47
Right 43.808 277 6.548 38.40 78.48
IDOT Standard
Vest Total 50.660 813 11.564 36.71 88.70
Tamhane’s T2 Test Results
(I) (J) Mean Difference (I-J) Std. Error Sig.
Middle 19.121 .630 .000 Left
Right 19.812 .517 .000
Left -19.121 .630 .000 Middle
Right .691 .663 .654
Left -19.812 .517 .000 Right
Middle -.691 .663 .654
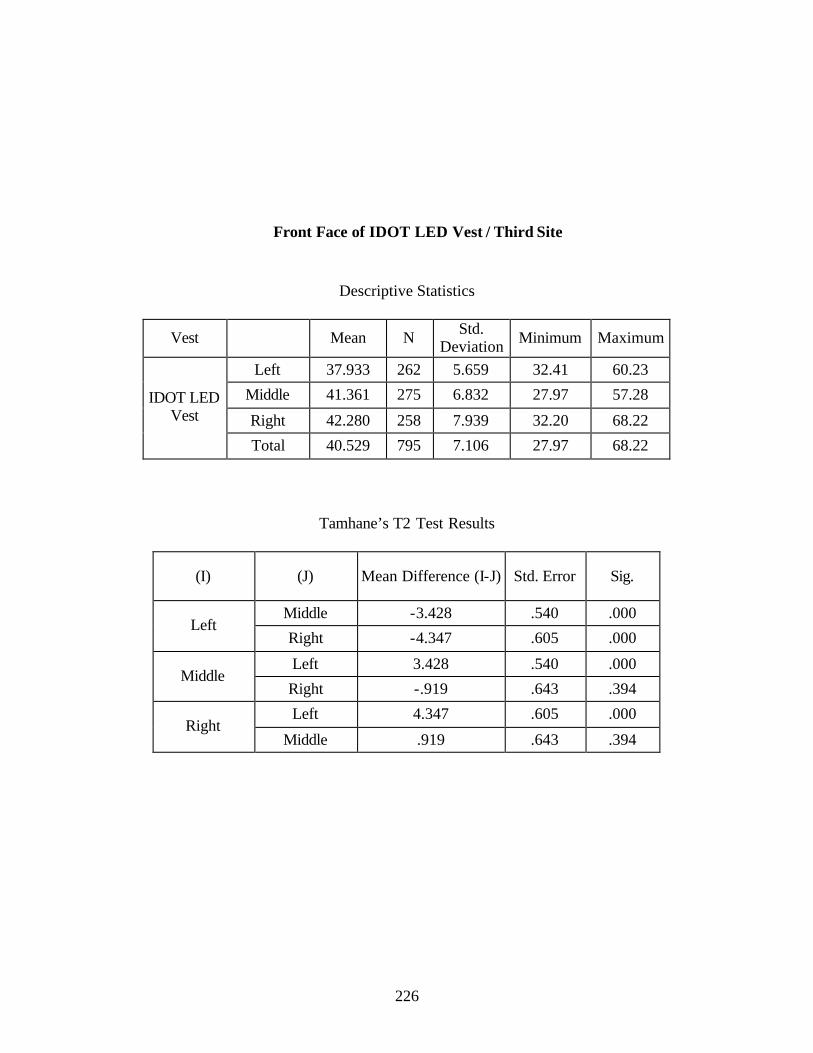
226
Front Face of IDOT LED Vest / Third Site
Descriptive Statistics
Vest Mean N Std. Deviation Minimum Maximum
Left 37.933 262 5.659 32.41 60.23
Middle 41.361 275 6.832 27.97 57.28
Right 42.280 258 7.939 32.20 68.22 IDOT LED
Vest
Total 40.529 795 7.106 27.97 68.22
Tamhane’s T2 Test Results
(I) (J) Mean Difference (I-J) Std. Error Sig.
Middle -3.428 .540 .000 Left
Right -4.347 .605 .000
Left 3.428 .540 .000 Middle
Right -.919 .643 .394
Left 4.347 .605 .000 Right
Middle .919 .643 .394

227
Front Face of Head Lite Roadstar 200 Vest / Third Site
Descriptive Statistics
Vest Mean N Std. Deviation Minimum Maximum
Left 61.383 264 11.786 48.42 115.13
Middle 55.453 277 9.965 45.94 109.61
Right 72.900 272 8.217 41.36 124.91
Head Lite Roadstar
200 Total 63.216 813 12.423 41.36 124.91
Tamhane’s T2 Test Results
(I) (J) Mean Difference (I-J) Std. Error Sig.
Middle 5.931 .941 .000 Left
Right -11.517 .880 .000
Left -5.931 .941 .000 Middle
Right -17.447 .779 .000
Left 11.517 .880 .000 Right
Middle 17.447 .779 .000
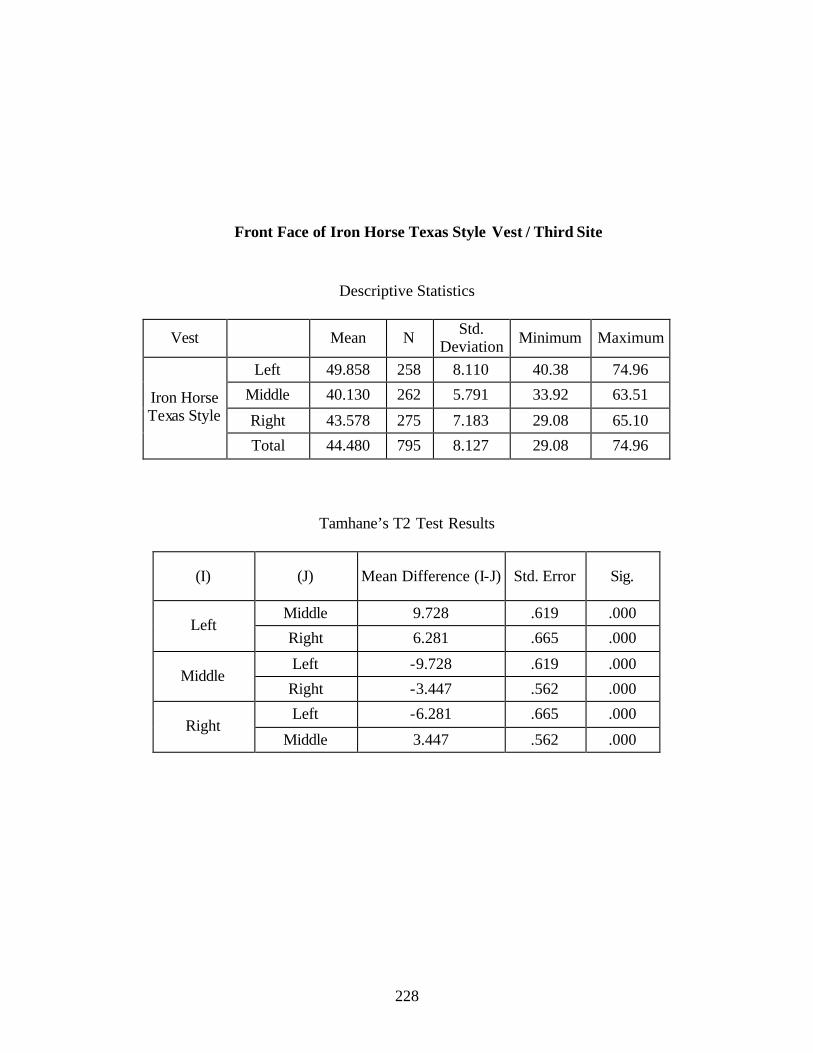
228
Front Face of Iron Horse Texas Style Vest / Third Site
Descriptive Statistics
Vest Mean N Std. Deviation Minimum Maximum
Left 49.858 258 8.110 40.38 74.96
Middle 40.130 262 5.791 33.92 63.51
Right 43.578 275 7.183 29.08 65.10 Iron Horse Texas Style
Total 44.480 795 8.127 29.08 74.96
Tamhane’s T2 Test Results
(I) (J) Mean Difference (I-J) Std. Error Sig.
Middle 9.728 .619 .000 Left
Right 6.281 .665 .000
Left -9.728 .619 .000 Middle
Right -3.447 .562 .000
Left -6.281 .665 .000 Right
Middle 3.447 .562 .000

229
Front Face of Chami Design Washington Style Vest / Third Site
Descriptive Statistics
Vest Mean N Std. Deviation Minimum Maximum
Left 57.618 277 10.089 48.23 114.27
Middle 71.913 272 8.560 38.55 126.44
Right 53.780 264 10.661 42.04 99.09
Chami Design
Washington Style
Total 61.154 813 12.513 38.55 126.44
Tamhane’s T2 Test Results
(I) (J) Mean Difference (I-J) Std. Error Sig.
Middle -14.295 .798 .000 Left
Right 3.838 .893 .000
Left 14.295 .798 .000 Middle
Right 18.133 .837 .000
Left -3.838 .893 .000 Right
Middle -18.133 .837 .000

230
Front Face of Safetyline Minnesota Style Vest / Third Site
Descriptive Statistics
Vest Mean N Std. Deviation Minimum Maximum
Left 47.892 275 8.026 32.15 75.32
Middle 52.044 258 10.047 40.22 83.78
Right 44.200 262 7.591 34.96 72.10
Safetyline Minnesota
Style Total 48.023 795 9.161 32.15 83.78
Tamhane’s T2 Test Results
(I) (J) Mean Difference (I-J) Std. Error Sig.
Middle -4.152 .791 .000 Left
Right 3.692 .674 .000
Left 4.152 .791 .000 Middle
Right 7.845 .782 .000
Left -3.692 .674 .000 Right
Middle -7.845 .782 .000

231
Front Face of IDOT Standard Vest / Fourth Site
Descriptive Statistics
Vest Mean N Std. Deviation Minimum Maximum
Left 49.195 302 9.499 40.59 98.84
Middle 34.592 270 3.263 30.76 52.03
Right 47.517 279 4.418 42.75 70.97
IDOT Standard
Vest Total 44.012 851 9.136 30.76 98.84
Tamhane’s T2 Test Results
(I) (J) Mean Difference (I-J) Std. Error Sig.
Middle 14.603 .582 .000 Left
Right 1.678 .607 .018
Left -14.603 .582 .000 Middle
Right -12.925 .331 .000
Left -1.678 .607 .018 Right
Middle 12.925 .331 .000

232
Front Face of IDOT LED Vest / Fourth Site
Descriptive Statistics
Vest Mean N Std. Deviation Minimum Maximum
Left 34.777 285 3.772 29.20 56.37
Middle 35.591 274 3.759 30.09 59.45
Right 49.455 270 4.343 39.96 66.71 IDOT LED
Vest
Total 39.827 829 7.785 29.20 66.71
Tamhane’s T2 Test Results
(I) (J) Mean Difference (I-J) Std. Error Sig.
Middle -.814 .319 .032 Left
Right -14.678 .346 .000
Left .814 .319 .032 Middle
Right -13.864 .348 .000
Left 14.678 .346 .000 Right
Middle 13.864 .348 .000

233
Front Face of Head Lite Roadstar 200 Vest / Fourth Site
Descriptive Statistics
Vest Mean N Std. Deviation Minimum Maximum
Left 67.311 270 7.407 53.44 97.33
Middle 43.363 285 6.443 34.45 86.05
Right 42.154 274 5.358 34.71 68.71
Head Lite Roadstar
200 Total 50.763 829 13.198 34.45 97.33
Tamhane’s T2 Test Results
(I) (J) Mean Difference (I-J) Std. Error Sig.
Middle 23.948 .591 .000 Left
Right 25.157 .555 .000
Left -23.948 .591 .000 Middle
Right 1.209 .500 .047
Left -25.157 .555 .000 Right
Middle -1.209 .500 .047

234
Front Face of Iron Horse Texas Style Vest / Fourth Site
Descriptive Statistics
Vest Mean N Std. Deviation Minimum Maximum
Left 42.252 270 5.078 36.35 66.71
Middle 56.195 279 5.617 48.40 80.67
Right 47.536 302 11.762 37.65 116.57 Iron Horse Texas Style
Total 48.699 851 9.980 36.35 116.57
Tamhane’s T2 Test Results
(I) (J) Mean Difference (I-J) Std. Error Sig.
Middle -13.943 .457 .000 Left
Right -5.283 .744 .000
Left 13.943 .457 .000 Middle
Right 8.660 .756 .000
Left 5.283 .744 .000 Right
Middle -8.660 .756 .000

235
Front Face of Chami Design Washington Style Vest / Fourth Site
Descriptive Statistics
Vest Mean N Std. Deviation Minimum Maximum
Left 49.042 274 5.572 41.52 78.47
Middle 62.998 270 6.969 50.22 92.45
Right 40.789 285 10.925 30.98 87.61
Chami Design
Washington Style
Total 50.750 829 12.288 30.98 92.45
Tamhane’s T2 Test Results
(I) (J) Mean Difference (I-J) Std. Error Sig.
Middle -13.955 .541 .000 Left
Right 8.254 .729 .000
Left 13.955 .541 .000 Middle
Right 22.209 .774 .000
Left -8.254 .729 .000 Right
Middle -22.209 .774 .000

236
Front Face of Safetyline Minnesota Style Vest / Fourth Site
Descriptive Statistics
Vest Mean N Std. Deviation Minimum Maximum
Left 71.812 279 8.228 61.11 107.37
Middle 65.106 302 19.884 46.34 174.50
Right 41.777 270 7.070 33.82 79.60
Safetyline Minnesota
Style Total 59.903 851 18.398 33.82 174.50
Tamhane’s T2 Test Results
(I) (J) Mean Difference (I-J) Std. Error Sig.
Middle 6.706 1.246 .000 Left
Right 30.034 .654 .000
Left -6.706 1.246 .000 Middle
Right 23.329 1.222 .000
Left -30.034 .654 .000 Right
Middle -23.329 1.222 .000

237
APPENDIX J
DESCRIPTIVE STATISTICS
COMPARISON OF VESTS’ FRONT FACES VS. SIDES

238
First Site Descriptive Statistics
Vest Normalized
mean luminance
N Std. Deviation
Minimum Maximum
Front 92.817 779 5.114 73.78 109.11 IDOT Standard Vest Side 85.980 805 4.497 78.16 103.63
Front 99.975 779 5.909 82.37 124.20 IDOT LED Vest Side 82.913 805 4.927 73.12 100.54
Front 138.525 779 8.971 113.32 173.63 Head Lite Roadstar 200 Side 116.101 805 3.985 107.33 143.11
Front 105.151 753 7.017 85.99 131.67 Iron Horse Texas Style Side 98.224 800 3.890 85.16 126.47
Front 127.156 753 8.300 104.75 165.44 Chami Design Washington
Style Side 115.142 800 6.693 91.04 135.48
Front 127.155 753 10.308 99.59 173.60 Safetyline Minnesota
Style Side 123.640 800 5.380 105.06 153.23
Results of t-Tests
Vest t df Sig. (2-tailed)
Mean Difference
Std. Error Difference
IDOT Standard Vest 28.219 1542.258 .000 6.837 .242
IDOT LED Vest 62.310 1513.873 .000 17.062 .274
Head Lite Roadstar 200 63.930 1065.811 .000 22.424 .351
Iron Horse Texas Style 23.857 1158.792 .000 6.927 .290
Chami Design Washington Style
31.284 1444.844 .000 12.014 .384
Safetyline Minnesota Style 8.347 1117.938 .000 3.515 .421

239
Second Site Descriptive Statistics
Vest Normalized
mean luminance
N Std. Deviation
Minimum Maximum
Front 99.061 762 4.985 48.42 110.98 IDOT Standard Vest Side 85.012 820 4.408 54.71 96.38
Front 105.718 762 4.348 53.52 117.83 IDOT LED Vest Side 78.169 820 4.755 63.60 92.23
Front 174.557 762 6.816 80.61 199.31 Head Lite Roadstar 200 Side 145.464 820 9.913 71.52 175.29
Front 137.506 615 8.090 120.08 161.95 Iron Horse Texas Style Side 100.882 582 8.990 84.87 127.98
Front 177.067 615 4.873 161.90 194.05 Chami Design Washington
Style Side 129.915 582 8.956 96.85 150.70
Front 181.060 615 7.048 162.13 208.50 Safetyline Minnesota
Style Side 165.301 582 7.575 151.05 191.33
Results of t-Tests
Vest t df Sig. (2-tailed)
Mean Difference
Std. Error Difference
IDOT Standard Vest 59.207 1521.941 .000 14.049 .2373
IDOT LED Vest 120.372 1579.588 .000 27.549 .229
Head Lite Roadstar 200 68.423 1458.129 .000 29.093 .425
Iron Horse Texas Style 73.948 1165.171 .000 36.624 .495
Chami Design Washington Style
112.254 886.355 .000 47.152 .420
Safetyline Minnesota Style 37.211 1176.021 .000 15.760 .424

240
Third Site Descriptive Statistics
Vest Normalized
mean luminance
N Std. Deviation
Minimum Maximum
Front 50.660 813 11.564 36.71 88.70 IDOT Standard Vest Side 52.532 792 7.468 26.89 74.11
Front 40.529 795 7.106 27.97 68.22 IDOT LED Vest Side 59.481 526 13.370 42.23 83.50
Front 63.216 813 12.423 41.36 124.91 Head Lite Roadstar 200 Side 59.738 792 10.360 30.43 116.60
Front 44.480 795 8.127 29.08 74.96 Iron Horse Texas Style Side 68.761 526 16.514 44.20 104.10
Front 61.154 813 12.513 38.55 126.44 Chami Design Washington
Style Side 60.392 792 11.166 32.61 130.97
Front 48.023 795 9.161 32.15 83.78 Safetyline Minnesota
Style Side 78.422 526 16.609 53.78 162.11
Results of t-Tests
Vest t df Sig. (2-tailed)
Mean Difference
Std. Error Difference
IDOT Standard Vest -3.861 1393.896 .000 -1.871 .485
IDOT LED Vest -29.841 722.911 .000 -18.952 .635
Head Lite Roadstar 200 6.096 1565.938 .000 3.477 .570
Iron Horse Texas Style -31.307 694.930 .000 -24.281 .776
Chami Design Washington Style
1.288 1590.841 .198 .762 .592
Safetyline Minnesota Style -38.300 737.870 .000 -30.400 .794

241
Fourth Site Descriptive Statistics
Vest Normalized
mean luminance
N Std. Deviation
Minimum Maximum
Front 44.012 851 9.136 30.76 98.84 IDOT Standard Vest Side 48.944 820 3.649 43.16 68.48
Front 39.827 829 7.785 29.20 66.71 IDOT LED Vest Side 42.144 788 7.889 31.68 75.59
Front 50.763 829 13.198 34.45 97.33 Head Lite Roadstar 200 Side 54.746 788 6.964 42.62 93.10
Front 48.699 851 9.980 36.35 116.57 Iron Horse Texas Style Side 53.097 820 3.089 46.97 79.27
Front 50.750 829 12.288 30.98 92.45 Chami Design Washington
Style Side 55.884 788 8.559 45.21 133.97
Front 59.903 851 18.398 33.82 174.50 Safetyline Minnesota
Style Side 60.461 820 6.693 46.67 98.64
Results of t-Tests
Vest t df Sig. (2-tailed)
Mean Difference
Std. Error Difference
IDOT Standard Vest -14.587 1122.857 .000 -4.932 .338
IDOT LED Vest -5.943 1608.419 .000 -2.318 .390
Head Lite Roadstar 200 -7.641 1269.516 .000 -3.983 .521
Iron Horse Texas Style -12.263 1016.971 .000 -4.399 .359
Chami Design Washington Style
-9.788 1482.627 .000 -5.134 .525
Safetyline Minnesota Style -.830 1078.387 .407 -.558 .673

242
APPENDIX K
SIGNIFICANCE TESTS OF RANKINGS
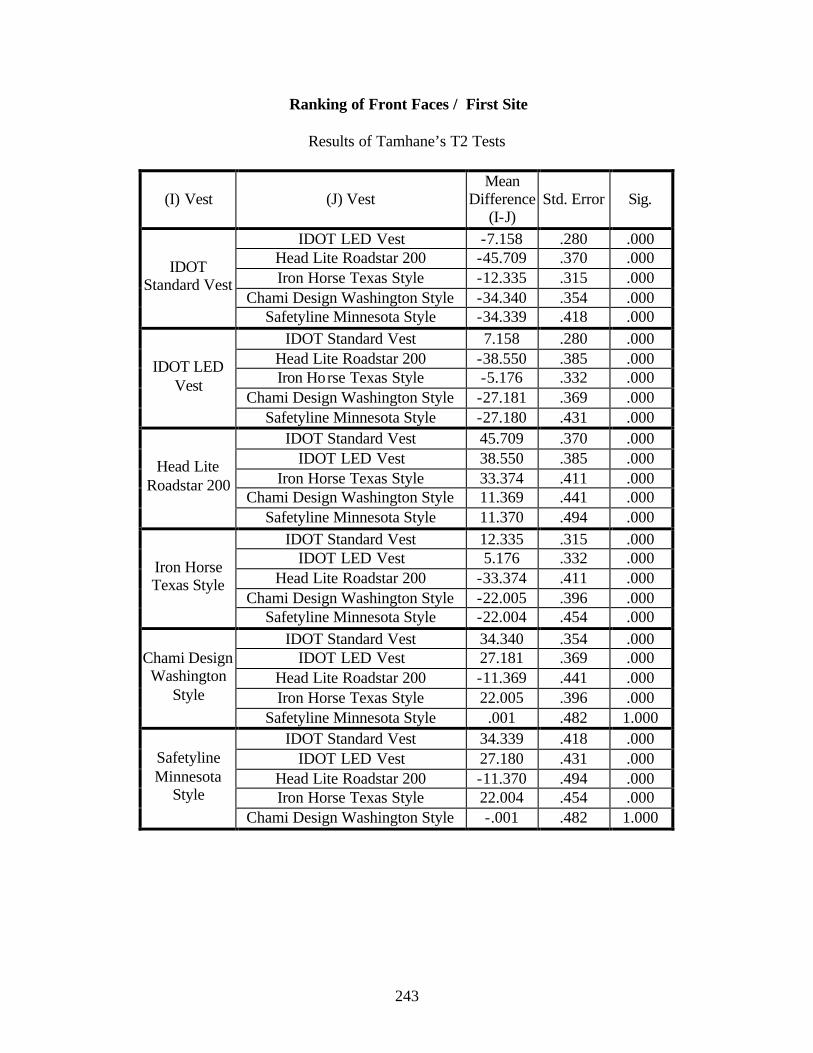
243
Ranking of Front Faces / First Site
Results of Tamhane’s T2 Tests
(I) Vest (J) Vest Mean
Difference (I-J)
Std. Error Sig.
IDOT LED Vest -7.158 .280 .000 Head Lite Roadstar 200 -45.709 .370 .000 Iron Horse Texas Style -12.335 .315 .000
Chami Design Washington Style -34.340 .354 .000
IDOT Standard Vest
Safetyline Minnesota Style -34.339 .418 .000 IDOT Standard Vest 7.158 .280 .000
Head Lite Roadstar 200 -38.550 .385 .000 Iron Horse Texas Style -5.176 .332 .000
Chami Design Washington Style -27.181 .369 .000
IDOT LED Vest
Safetyline Minnesota Style -27.180 .431 .000 IDOT Standard Vest 45.709 .370 .000
IDOT LED Vest 38.550 .385 .000 Iron Horse Texas Style 33.374 .411 .000
Chami Design Washington Style 11.369 .441 .000
Head Lite Roadstar 200
Safetyline Minnesota Style 11.370 .494 .000 IDOT Standard Vest 12.335 .315 .000
IDOT LED Vest 5.176 .332 .000 Head Lite Roadstar 200 -33.374 .411 .000
Chami Design Washington Style -22.005 .396 .000
Iron Horse Texas Style
Safetyline Minnesota Style -22.004 .454 .000 IDOT Standard Vest 34.340 .354 .000
IDOT LED Vest 27.181 .369 .000 Head Lite Roadstar 200 -11.369 .441 .000 Iron Horse Texas Style 22.005 .396 .000
Chami Design Washington
Style Safetyline Minnesota Style .001 .482 1.000
IDOT Standard Vest 34.339 .418 .000 IDOT LED Vest 27.180 .431 .000
Head Lite Roadstar 200 -11.370 .494 .000 Iron Horse Texas Style 22.004 .454 .000
Safetyline Minnesota
Style Chami Design Washington Style -.001 .482 1.000

244
Ranking of Front Faces / Second Site
Results of Tamhane’s T2 Tests
(I) Vest (J) Vest Mean
Difference (I-J)
Std. Error Sig.
IDOT LED Vest -6.656 .240 .000 Head Lite Roadstar 200 -75.495 .306 .000 Iron Horse Texas Style -38.445 .373 .000
Chami Design Washington Style -78.006 .267 .000
IDOT Standard Vest
Safetyline Minnesota Style -81.999 .337 .000 IDOT Standard Vest 6.656 .240 .000
Head Lite Roadstar 200 -68.839 .293 .000 Iron Horse Texas Style -31.788 .362 .000
Chami Design Washington Style -71.349 .252 .000
IDOT LED Vest
Safetyline Minnesota Style -75.343 .325 .000 IDOT Standard Vest 75.495 .306 .000
IDOT LED Vest 68.839 .293 .000 Iron Horse Texas Style 37.051 .409 .000
Chami Design Washington Style -2.510 .316 .000
Head Lite Roadstar 200
Safetyline Minnesota Style -6.504 .376 .000 IDOT Standard Vest 38.445 .373 .000
IDOT LED Vest 31.788 .362 .000 Head Lite Roadstar 200 -37.051 .409 .000
Chami Design Washington Style -39.561 .381 .000
Iron Horse Texas Style
Safetyline Minnesota Style -43.554 .433 .000 IDOT Standard Vest 78.006 .267 .000
IDOT LED Vest 71.349 .252 .000 Head Lite Roadstar 200 2.510 .316 .000 Iron Horse Texas Style 39.561 .381 .000
Chami Design Washington
Style Safetyline Minnesota Style -3.993 .346 .000
IDOT Standard Vest 81.999 .337 .000 IDOT LED Vest 75.343 .325 .000
Head Lite Roadstar 200 6.504 .376 .000 Iron Horse Texas Style 43.554 .433 .000
Safetyline Minnesota
Style Chami Design Washington Style 3.993 .346 .000

245
Ranking of Front Faces / Third Site
Results of Tamhane’s T2 Tests
(I) Vest (J) Vest Mean
Difference (I-J)
Std. Error Sig.
IDOT LED Vest 10.131 .477 .000 Head Lite Roadstar 200 -12.555 .595 .000 Iron Horse Texas Style 6.181 .498 .000
Chami Design Washington Style -10.494 .598 .000
IDOT Standard Vest
Safetyline Minnesota Style 2.638 .520 .000 IDOT Standard Vest -10.131 .477 .000
Head Lite Roadstar 200 -22.686 .503 .000 Iron Horse Texas Style -3.950 .383 .000
Chami Design Washington Style -20.625 .506 .000
IDOT LED Vest
Safetyline Minnesota Style -7.493 .411 .000 IDOT Standard Vest 12.555 .595 .000
IDOT LED Vest 22.686 .503 .000 Iron Horse Texas Style 18.736 .522 .000
Chami Design Washington Style 2.061 .618 .013
Head Lite Roadstar 200
Safetyline Minnesota Style 15.193 .544 .000 IDOT Standard Vest -6.181 .498 .000
IDOT LED Vest 3.950 .383 .000 Head Lite Roadstar 200 -18.736 .522 .000
Chami Design Washington Style -16.675 .525 .000
Iron Horse Texas Style
Safetyline Minnesota Style -3.543 .434 .000 IDOT Standard Vest 10.494 .598 .000
IDOT LED Vest 20.625 .506 .000 Head Lite Roadstar 200 -2.061 .618 .013 Iron Horse Texas Style 16.675 .525 .000
Chami Design Washington
Style Safetyline Minnesota Style 13.132 .546 .000
IDOT Standard Vest -2.638 .520 .000 IDOT LED Vest 7.493 .411 .000
Head Lite Roadstar 200 -15.193 .544 .000 Iron Horse Texas Style 3.543 .434 .000
Safetyline Minnesota
Style Chami Design Washington Style -13.132 .546 .000
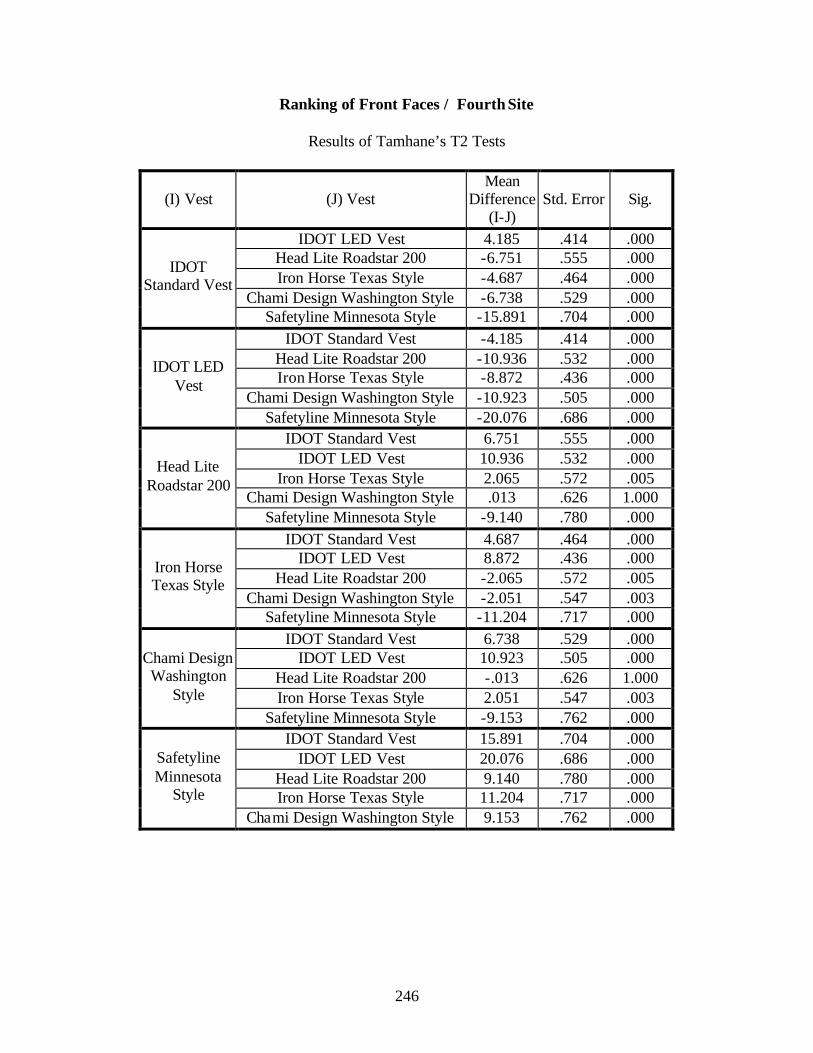
246
Ranking of Front Faces / Fourth Site
Results of Tamhane’s T2 Tests
(I) Vest (J) Vest Mean
Difference (I-J)
Std. Error Sig.
IDOT LED Vest 4.185 .414 .000 Head Lite Roadstar 200 -6.751 .555 .000 Iron Horse Texas Style -4.687 .464 .000
Chami Design Washington Style -6.738 .529 .000
IDOT Standard Vest
Safetyline Minnesota Style -15.891 .704 .000 IDOT Standard Vest -4.185 .414 .000
Head Lite Roadstar 200 -10.936 .532 .000 Iron Horse Texas Style -8.872 .436 .000
Chami Design Washington Style -10.923 .505 .000
IDOT LED Vest
Safetyline Minnesota Style -20.076 .686 .000 IDOT Standard Vest 6.751 .555 .000
IDOT LED Vest 10.936 .532 .000 Iron Horse Texas Style 2.065 .572 .005
Chami Design Washington Style .013 .626 1.000
Head Lite Roadstar 200
Safetyline Minnesota Style -9.140 .780 .000 IDOT Standard Vest 4.687 .464 .000
IDOT LED Vest 8.872 .436 .000 Head Lite Roadstar 200 -2.065 .572 .005
Chami Design Washington Style -2.051 .547 .003
Iron Horse Texas Style
Safetyline Minnesota Style -11.204 .717 .000 IDOT Standard Vest 6.738 .529 .000
IDOT LED Vest 10.923 .505 .000 Head Lite Roadstar 200 -.013 .626 1.000 Iron Horse Texas Style 2.051 .547 .003
Chami Design Washington
Style Safetyline Minnesota Style -9.153 .762 .000
IDOT Standard Vest 15.891 .704 .000 IDOT LED Vest 20.076 .686 .000
Head Lite Roadstar 200 9.140 .780 .000 Iron Horse Texas Style 11.204 .717 .000
Safetyline Minnesota
Style Chami Design Washington Style 9.153 .762 .000

247
Ranking of Sides / First Site
Results of Tamhane’s T2 Tests
(I) Vest (J) Vest Mean
Difference (I-J)
Std. Error Sig.
IDOT LED Vest 3.067 .235 .000 Head Lite Roadstar 200 -30.121 .212 .000 Iron Horse Texas Style -12.244 .210 .000
Chami Design Washington Style -29.163 .285 .000
IDOT Standard Vest
Safetyline Minnesota Style -37.661 .248 .000 IDOT Standard Vest -3.067 .235 .000
Head Lite Roadstar 200 -33.188 .223 .000 Iron Horse Texas Style -15.311 .222 .000
Chami Design Washington Style -32.230 .294 .000
IDOT LED Vest
Safetyline Minnesota Style -40.728 .258 .000 IDOT Standard Vest 30.121 .212 .000
IDOT LED Vest 33.188 .223 .000 Iron Horse Texas Style 17.877 .197 .000
Chami Design Washington Style .958 .275 .008
Head Lite Roadstar 200
Safetyline Minnesota Style -7.540 .236 .000 IDOT Standard Vest 12.244 .210 .000
IDOT LED Vest 15.311 .222 .000 Head Lite Roadstar 200 -17.877 .197 .000
Chami Design Washington Style -16.918 .274 .000
Iron Horse Texas Style
Safetyline Minnesota Style -25.416 .235 .000 IDOT Standard Vest 29.163 .285 .000
IDOT LED Vest 32.230 .294 .000 Head Lite Roadstar 200 -.958 .275 .008 Iron Horse Texas Style 16.918 .274 .000
Chami Design Washington
Style Safetyline Minnesota Style -8.498 .304 .000
IDOT Standard Vest 37.661 .248 .000 IDOT LED Vest 40.728 .258 .000
Head Lite Roadstar 200 7.540 .236 .000 Iron Horse Texas Style 25.416 .235 .000
Safetyline Minnesota
Style Chami Design Washington Style 8.498 .304 .000

248
Ranking of Sides / Second Site
Results of Tamhane’s T2 Tests
(I) Vest (J) Vest Mean
Difference (I-J)
Std. Error Sig.
IDOT LED Vest 6.843 .226 .000 Head Lite Roadstar 200 -60.452 .379 .000 Iron Horse Texas Style -15.870 .403 .000
Chami Design Washington Style -44.903 .402 .000
IDOT Standard Vest
Safetyline Minnesota Style -80.289 .350 .000 IDOT Standard Vest -6.843 .226 .000
Head Lite Roadstar 200 -67.295 .384 .000 Iron Horse Texas Style -22.713 .408 .000
Chami Design Washington Style -51.746 .407 .000
IDOT LED Vest
Safetyline Minnesota Style -87.132 .355 .000 IDOT Standard Vest 60.452 .379 .000
IDOT LED Vest 67.295 .384 .000 Iron Horse Texas Style 44.582 .509 .000
Chami Design Washington Style 15.548 .508 .000
Head Lite Roadstar 200
Safetyline Minnesota Style -19.837 .467 .000 IDOT Standard Vest 15.870 .403 .000
IDOT LED Vest 22.713 .408 .000 Head Lite Roadstar 200 -44.582 .509 .000
Chami Design Washington Style -29.034 .526 .000
Iron Horse Texas Style
Safetyline Minnesota Style -64.419 .487 .000 IDOT Standard Vest 44.903 .402 .000
IDOT LED Vest 51.746 .407 .000 Head Lite Roadstar 200 -15.548 .508 .000 Iron Horse Texas Style 29.034 .526 .000
Chami Design Washington
Style Safetyline Minnesota Style -35.385 .486 .000
IDOT Standard Vest 80.289 .350 .000 IDOT LED Vest 87.132 .355 .000
Head Lite Roadstar 200 19.837 .467 .000 Iron Horse Texas Style 64.419 .487 .000
Safetyline Minnesota
Style Chami Design Washington Style 35.385 .486 .000

249
Ranking of Sides / Third Site
Results of Tamhane’s T2 Tests
(I) Vest (J) Vest Mean
Difference (I-J)
Std. Error Sig.
IDOT LED Vest -6.950 .641 .000 Head Lite Roadstar 200 -7.207 .454 .000 Iron Horse Texas Style -16.229 .767 .000
Chami Design Washington Style -7.860 .477 .000
IDOT Standard Vest
Safetyline Minnesota Style -25.891 .771 .000 IDOT Standard Vest 6.950 .641 .000
Head Lite Roadstar 200 -.257 .689 1.000 Iron Horse Texas Style -9.279 .926 .000
Chami Design Washington Style -.911 .705 .963
IDOT LED Vest
Safetyline Minnesota Style -18.941 .930 .000 IDOT Standard Vest 7.207 .454 .000
IDOT LED Vest .257 .689 1.000 Iron Horse Texas Style -9.022 .809 .000
Chami Design Washington Style -.654 .541 .979
Head Lite Roadstar 200
Safetyline Minnesota Style -18.684 .812 .000 IDOT Standard Vest 16.229 .767 .000
IDOT LED Vest 9.279 .926 .000 Head Lite Roadstar 200 9.022 .809 .000
Chami Design Washington Style 8.369 .822 .000
Iron Horse Texas Style
Safetyline Minnesota Style -9.662 1.021 .000 IDOT Standard Vest 7.860 .477 .000
IDOT LED Vest .911 .705 .963 Head Lite Roadstar 200 .654 .541 .979 Iron Horse Texas Style -8.369 .822 .000
Chami Design Washington
Style Safetyline Minnesota Style -18.030 .826 .000
IDOT Standard Vest 25.891 .771 .000 IDOT LED Vest 18.941 .930 .000
Head Lite Roadstar 200 18.684 .812 .000 Iron Horse Texas Style 9.662 1.021 .000
Safetyline Minnesota
Style Chami Design Washington Style 18.030 .826 .000

250
Ranking of Sides / Fourth Site
Results of Tamhane’s T2 Tests
(I) Vest (J) Vest Mean
Difference (I-J)
Std. Error Sig.
IDOT LED Vest 6.800 .309 .000 Head Lite Roadstar 200 -5.802 .279 .000 Iron Horse Texas Style -4.153 .167 .000
Chami Design Washington Style -6.940 .330 .000
IDOT Standard Vest
Safetyline Minnesota Style -11.517 .266 .000 IDOT Standard Vest -6.800 .309 .000
Head Lite Roadstar 200 -12.602 .375 .000 Iron Horse Texas Style -10.953 .301 .000
Chami Design Washington Style -13.740 .415 .000
IDOT LED Vest
Safetyline Minnesota Style -18.317 .366 .000 IDOT Standard Vest 5.802 .279 .000
IDOT LED Vest 12.602 .375 .000 Iron Horse Texas Style 1.649 .271 .000
Chami Design Washington Style -1.138 .393 .056
Head Lite Roadstar 200
Safetyline Minnesota Style -5.715 .341 .000 IDOT Standard Vest 4.153 .167 .000
IDOT LED Vest 10.953 .301 .000 Head Lite Roadstar 200 -1.649 .271 .000
Chami Design Washington Style -2.787 .323 .000
Iron Horse Texas Style
Safetyline Minnesota Style -7.364 .257 .000 IDOT Standard Vest 6.940 .330 .000
IDOT LED Vest 13.740 .415 .000 Head Lite Roadstar 200 1.138 .393 .056 Iron Horse Texas Style 2.787 .323 .000
Chami Design Washington
Style Safetyline Minnesota Style -4.577 .384 .000
IDOT Standard Vest 11.517 .266 .000 IDOT LED Vest 18.317 .366 .000
Head Lite Roadstar 200 5.715 .341 .000 Iron Horse Texas Style 7.364 .257 .000
Safetyline Minnesota
Style Chami Design Washington Style 4.577 .384 .000
Related Documents