Nigerian Manufacturing Sector SUMMARY REPORT: 2010-2012 NATIONAL BUREAU OF STATISTICS 14 TH OCTOBER 2014

Welcome message from author
This document is posted to help you gain knowledge. Please leave a comment to let me know what you think about it! Share it to your friends and learn new things together.
Transcript

Nigerian Manufacturing Sector
SUMMARY REPORT: 2010-2012
NATIONAL BUREAU OF STATISTICS 14TH OCTOBER 2014
Table of Contents
SECTION ONE: Manufacturing in Nigeria .................................................................................. 3
History of the Nigerian Manufacturing Sector ..................................................................................... 4
Manufacturing in the Nigerian Economy Today .................................................................................. 6
SECTION TWO: The Formal Manufacturing Sector Post Rebasing ........................................... 7
Overview ................................................................................................ Error! Bookmark not defined.
Total Formal Sector Output ............................................................................................................... 8
Dominant Manufacturing Activities .................................................................................................... 9 Food, Beverages and Tobacco ................................................................................................................. 9 Textiles, Apparel and Footwear .............................................................................................................. 11 Other Manufacturing .............................................................................................................................. 12
Employment .................................................................................................................................... 13
Employee Compensation ................................................................................................................. 15
Inventory and Depreciation .............................................................................................................. 16
Intermediate Inputs .......................................................................................................................... 17
Taxes and Subsidies ......................................................................................................................... 18
SECTION THREE: Manufacturing Sub-Sectors ........................................................................ 20
Employment .................................................................................................................................... 20
Employee Compensation ................................................................................................................. 22
Inventory ......................................................................................................................................... 23 Raw Materials ......................................................................................................................................... 23 Raw Materials Imported ......................................................................................................................... 24 Raw Materials Locally Sourced ............................................................................................................... 25
Intermediate Inputs .......................................................................................................................... 26
Introduction
The Manufacturing sector report is structured as follows. Section one looks at the manufacturing sector
in Nigeria at a macro level, briefly outlining its history and contribution to GDP today. Section two
presents the formal manufacturing sector data, which is comprised of 11 of the 13 different economic
activities covered in the manufacturing sector as classified in Nigeria’s National accounts. The third and
final sector looks at the composition of the formal manufacturing sector at the activity level. Findings
can be summarized as follows:
- Sector Dominated by Food, Beverages and Tobacco
- The manufacture of Sugar and Bread products generate the greatest value of output
- Wages and Salary is the greatest form of employee compensation
- Generator fuel is the highest of all intermediate inputs in the manufacturing sector, and is
steadily rising in all years of observations
- Taxes on Production are high and rising, whilst Subsidies on Production are falling in the period
of review
- A greater portion of raw materials are sourced domestically, although the portion being imported
is rising over the period
- Chemical and Pharmaceutical companies have the greatest value of raw materials in all years
observed
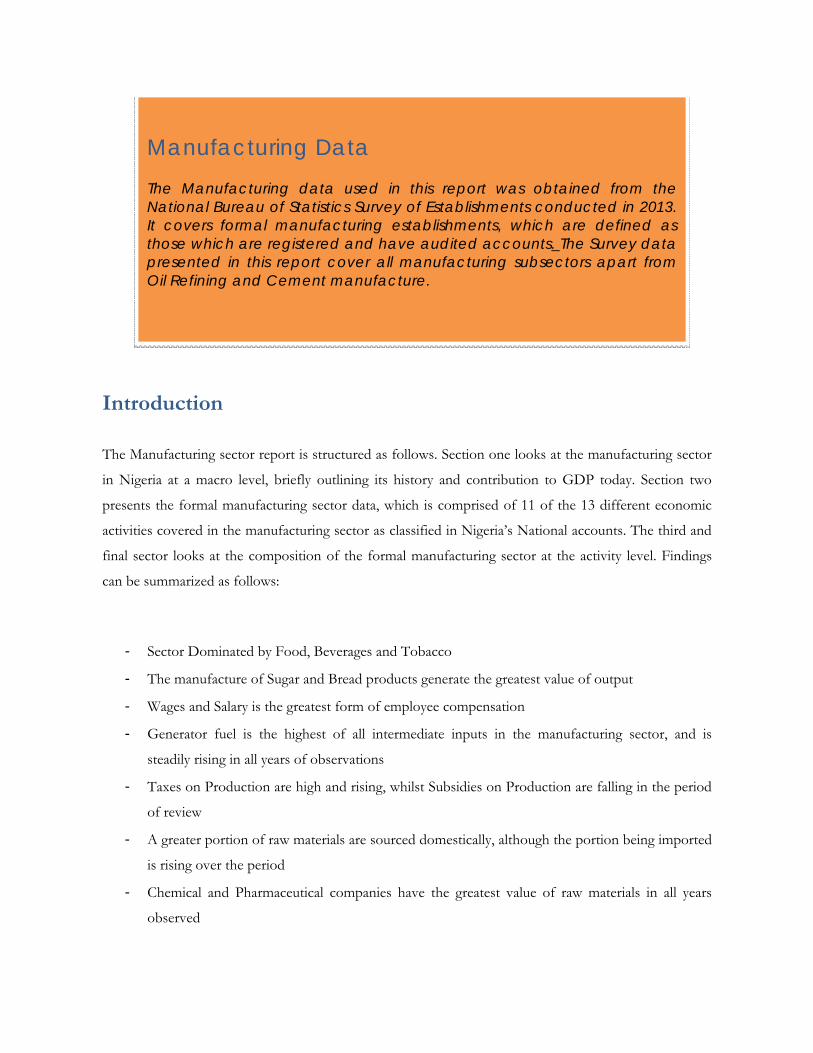
Manufacturing Data The Manufacturing data used in this report was obtained from the National Bureau of Statistics Survey of Establishments conducted in 2013. It covers formal manufacturing establishments, which are defined as those which are registered and have audited accounts. The Survey data presented in this report cover all manufacturing subsectors apart from Oil Refining and Cement manufacture.

The manufacturing sector has shown strong growth in recent years. Nonetheless, the sector faces on-
going challenges, including an inadequate electricity supply, poor infrastructure and plant maintenance,
and heavy dependency on agricultural inputs, which themselves are vulnerable to shocks. Its strengths
are nonetheless abundant; semi-skilled yet low paid workforce, the availability of domestically sourced
inputs and most importantly, a huge domestic demand for consumer products. It therefore displays great
potential for future expansion.
SECTION ONE: Manufacturing in Nigeria
History of the Nigerian Manufacturing Sector
Since a peak of 7.83% in 1982, the contribution of manufacturing as a share of total economic output in
Nigeria generally declined. Many factors have contributed to the variation in sector share through time,
many of which show both the vulnerability of manufacturing to global economic pressures, as well as
the impacts that policy changes can have in reshaping the sector.
Prior to the oil boom of the 1970’s, manufacturing contributed approximately 10% to Nigeria’s
economic output. Thereafter, increased revenues from oil caused the sector’s relative Gross Domestic
Product (GDP) share to decline; growth persisted albeit at a slower rate. The recession caused by the fall
in oil prices in the early 1980’s triggered policy attention to turn back to the manufacturing sector, with
steel production gaining prime focus. Prior to this, the Nigerian Enterprises Promotion Decrees of 1972
and 1977 had switched the majority firm ownership from foreign to Nigerian, restricting foreign capital
inflows. The lack of affordability of imported goods, combined with the absence of foreign capital and
technology, encouraged domestic production of basic commodities such as soap and salt.
Alongside, price manipulation through export and import subsidies encouraged the importation of
intermediary inputs and thus the expansion of assembly based industry. A brief spike in manufacturing
output was observed in the early 1980’s (See Fig 1) so that it contributed to 7.83% of total economic
output. However, the price manipulation discouraged domestic manufacture of inputs, as well as the
investment in the infrastructure and human capital required to do so in the future and this share soon
began to decline.
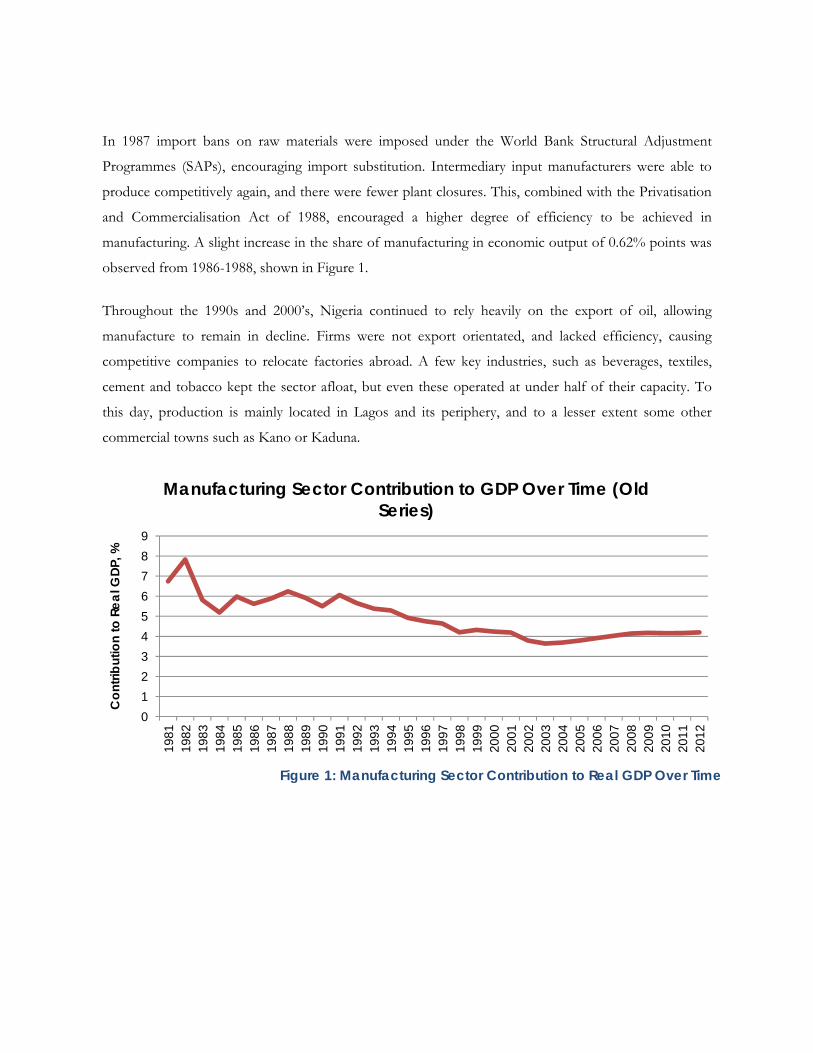
In 1987 import bans on raw materials were imposed under the World Bank Structural Adjustment
Programmes (SAPs), encouraging import substitution. Intermediary input manufacturers were able to
produce competitively again, and there were fewer plant closures. This, combined with the Privatisation
and Commercialisation Act of 1988, encouraged a higher degree of efficiency to be achieved in
manufacturing. A slight increase in the share of manufacturing in economic output of 0.62% points was
observed from 1986-1988, shown in Figure 1.
Throughout the 1990s and 2000’s, Nigeria continued to rely heavily on the export of oil, allowing
manufacture to remain in decline. Firms were not export orientated, and lacked efficiency, causing
competitive companies to relocate factories abroad. A few key industries, such as beverages, textiles,
cement and tobacco kept the sector afloat, but even these operated at under half of their capacity. To
this day, production is mainly located in Lagos and its periphery, and to a lesser extent some other
commercial towns such as Kano or Kaduna.
0123456789
1981
1982
1983
1984
1985
1986
1987
1988
1989
1990
1991
1992
1993
1994
1995
1996
1997
1998
1999
2000
2001
2002
2003
2004
2005
2006
2007
2008
2009
2010
2011
2012
Con
tribu
tion
to R
eal G
DP, %
Manufacturing Sector Contribution to GDP Over Time (Old Series)
Figure 1: Manufacturing Sector Contribution to Real GDP Over Time
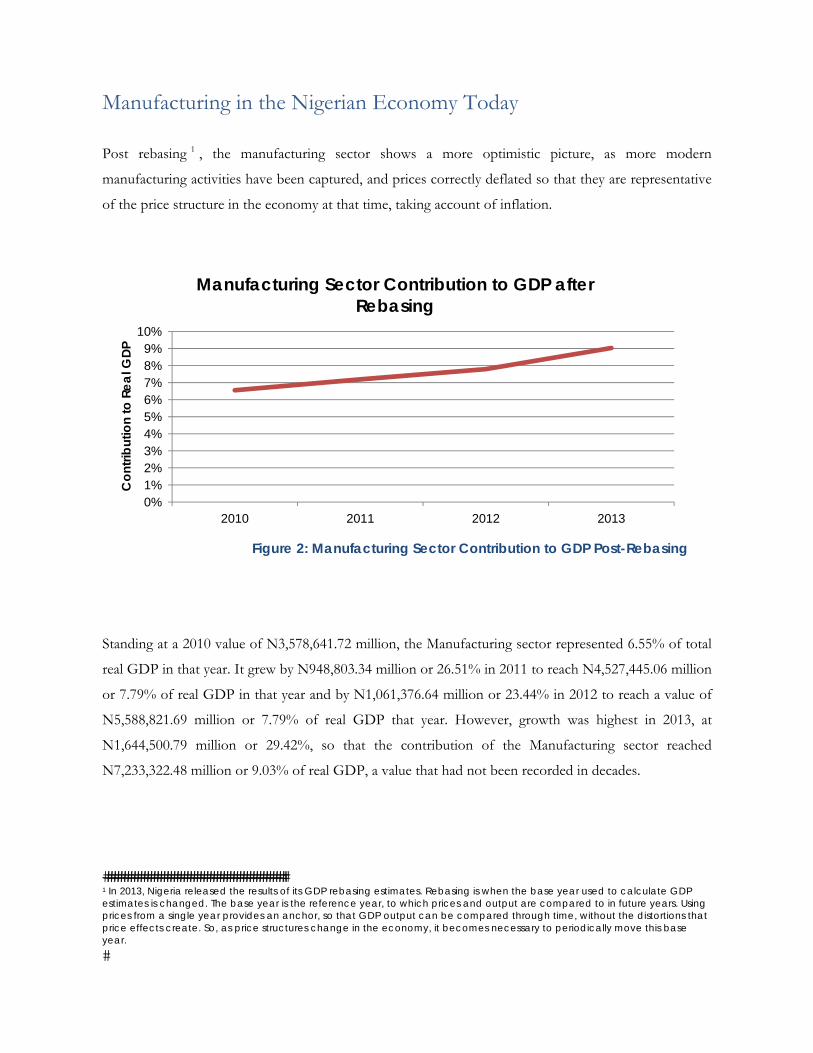
Manufacturing in the Nigerian Economy Today
Post rebasing 1 , the manufacturing sector shows a more optimistic picture, as more modern
manufacturing activities have been captured, and prices correctly deflated so that they are representative
of the price structure in the economy at that time, taking account of inflation.
Standing at a 2010 value of N3,578,641.72 million, the Manufacturing sector represented 6.55% of total
real GDP in that year. It grew by N948,803.34 million or 26.51% in 2011 to reach N4,527,445.06 million
or 7.79% of real GDP in that year and by N1,061,376.64 million or 23.44% in 2012 to reach a value of
N5,588,821.69 million or 7.79% of real GDP that year. However, growth was highest in 2013, at
N1,644,500.79 million or 29.42%, so that the contribution of the Manufacturing sector reached
N7,233,322.48 million or 9.03% of real GDP, a value that had not been recorded in decades.
��������������������������������������������������������1 In 2013, Nigeria released the results of its GDP rebasing estimates. Rebasing is when the base year used to calculate GDP estimates is changed. The base year is the reference year, to which prices and output are compared to in future years. Using prices from a single year provides an anchor, so that GDP output can be compared through time, without the distortions that price effects create. So, as price structures change in the economy, it becomes necessary to periodically move this base year. �
0%1%2%3%4%5%6%7%8%9%
10%
2010 2011 2012 2013
Con
tribu
tion
to R
eal G
DP
Manufacturing Sector Contribution to GDP after Rebasing
Figure 2: Manufacturing Sector Contribution to GDP Post-Rebasing
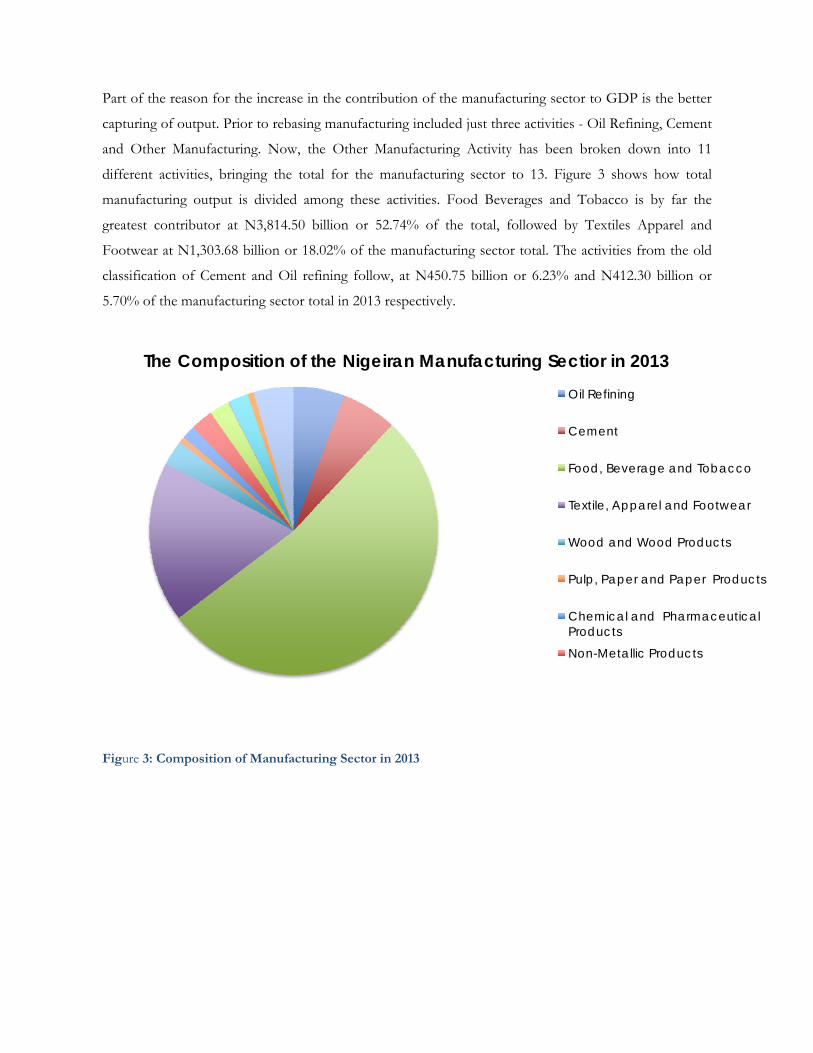
Part of the reason for the increase in the contribution of the manufacturing sector to GDP is the better
capturing of output. Prior to rebasing manufacturing included just three activities - Oil Refining, Cement
and Other Manufacturing. Now, the Other Manufacturing Activity has been broken down into 11
different activities, bringing the total for the manufacturing sector to 13. Figure 3 shows how total
manufacturing output is divided among these activities. Food Beverages and Tobacco is by far the
greatest contributor at N3,814.50 billion or 52.74% of the total, followed by Textiles Apparel and
Footwear at N1,303.68 billion or 18.02% of the manufacturing sector total. The activities from the old
classification of Cement and Oil refining follow, at N450.75 billion or 6.23% and N412.30 billion or
5.70% of the manufacturing sector total in 2013 respectively.
Figure 3: Composition of Manufacturing Sector in 2013
The Composition of the Nigeiran Manufacturing Sectior in 2013
Oil Refining
Cement
Food, Beverage and Tobacco
Textile, Apparel and Footwear
Wood and Wood Products
Pulp, Paper and Paper Products
Chemical and Pharmaceutical Products
Non-Metallic Products
SECTION TWO: The Formal Manufacturing Sector Post
Rebasing
Total Formal Sector Output
Total manufacturing output in the formal sector in Nigeria was N6,845,678.59 million in 2010. It
increased over the following two years, by N1,326,277.80 million or 19.37% in 2011 to reach
N8,171,906.39 million and by N1,652,610.80 million or 20.22% in 2012 to reach a total of
N9,824,517.19 million.
In all three years, the formal manufacturing sector was dominated by output from the Food Beverages
and Tobacco Activity, with N4,930,494.55 million or 72.02% of output contributed in 2010. Despite the
activity’s growth of N488,855.06 million or 9.91% in 2011 and N712,759.35 million or 13.15% in 2012,
this total output share declined to 66.32% and 62.42% in 2011 and 2012 respectively.
The second largest contributor to manufacturing output was the Textile, Apparel and Footwear Activity,
which at N792,693.12 million in 2010, represented 11.58% of total output. With growth of N398,019.65
million or 50.21% in 2011, the total output of N1,190,712.77 million represented 14.57% of total output.
This share increased further in 2012, with output of N1,652,840.71 million representing 16.82% of the
total, due to output growth of N462,127.94 million or 38.81%.
Other Manufacturing and Non-Metallic Products were the third an fourth greatest contributors to
manufacturing output, representing N392,317.00 million or 11.58% of the total and N187,709.52 million
or 5.73% of the total in 2010. However, whilst non-metallic products’ share remained relatively constant
over the period, that held by Other Manufacturing increased. The year 2011 saw a rise of N183,354.36
million or 46.74%, increasing its share to 7.04% of the total for the sector. From this total value of
N575,671.36 million, it increased by a further N210,716.46 million or 36.60% , reaching N786,387.82
million or 8.00% of the total.
Basic Metals, Iron and Steel exhibited the fastest rate of growth over the period, increasing by
N77,227.64 million or 77.03% in 2011, from the N100,262.47 million recorded in 2010 to N177,490.11
million in 2011.
No activities recorded negative output growth between 2010 and 2012. Although the lowest growth rate
of 9.91% was recorded for the Food, Beverages and Tobacco Activity in 2011, absolute output still
increased by an impressive N488,855.06 million.
Dominant Manufacturing Activities
Food, Beverages and Tobacco
The Food, Beverages and Tobacco Activity had the largest output of all those in the Manufacturing
Sector, with the greatest number of classes of goods captured. Of those product classes, the greatest
contributor in all three years of review is Sugar, which had an output of N1,940,413.34 million,
N2,438,316.12 million and N2,710,304.15 million in years 2010, 2011 and 2012 respectively, constituting
39.36%, 44.99% and 44.20% of the Food, Beverages and Tobacco total in each year. To put this in
perspective, the product alone contributed 28.35%, 29.84% and 27.59% to the total output for the
manufacturing sector as a whole in the respective years of 2010, 2011 and 2012. Growth of sugar output
was higher than the sector average in 2011, increasing by N497,902.73 million or 25.66%, driving the
majority of growth in the sector in that year. With growth of N271,968.03 million or 11.15%, the sheer
size of sugar output meant that it largely contributed to the growth seen the following year also.
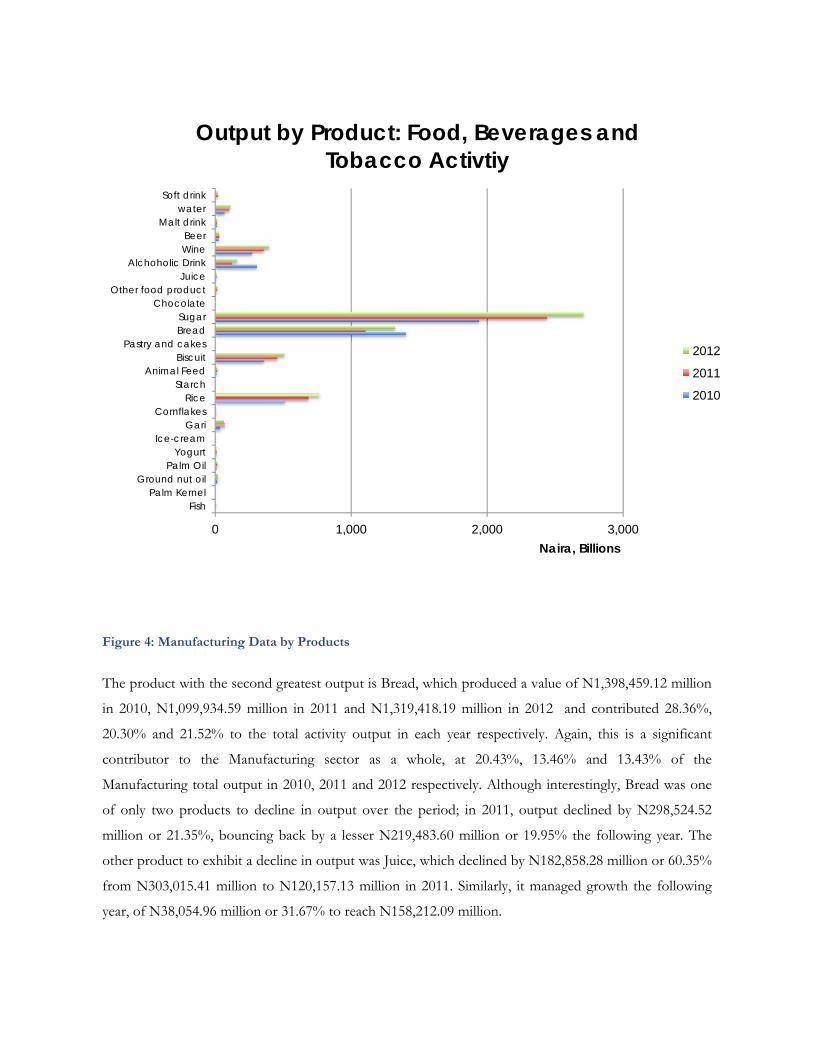
Figure 4: Manufacturing Data by Products
The product with the second greatest output is Bread, which produced a value of N1,398,459.12 million
in 2010, N1,099,934.59 million in 2011 and N1,319,418.19 million in 2012 and contributed 28.36%,
20.30% and 21.52% to the total activity output in each year respectively. Again, this is a significant
contributor to the Manufacturing sector as a whole, at 20.43%, 13.46% and 13.43% of the
Manufacturing total output in 2010, 2011 and 2012 respectively. Although interestingly, Bread was one
of only two products to decline in output over the period; in 2011, output declined by N298,524.52
million or 21.35%, bouncing back by a lesser N219,483.60 million or 19.95% the following year. The
other product to exhibit a decline in output was Juice, which declined by N182,858.28 million or 60.35%
from N303,015.41 million to N120,157.13 million in 2011. Similarly, it managed growth the following
year, of N38,054.96 million or 31.67% to reach N158,212.09 million.
0 1,000 2,000 3,000
FishPalm Kernel
Ground nut oilPalm Oil
YogurtIce-cream
GariCornflakes
RiceStarch
Animal FeedBiscuit
Pastry and cakesBreadSugar
ChocolateOther food product
JuiceAlchoholic Drink
WineBeer
Malt drinkwater
Soft drink
Naira, Billions
Output by Product: Food, Beverages and Tobacco Activtiy
2012
2011
2010
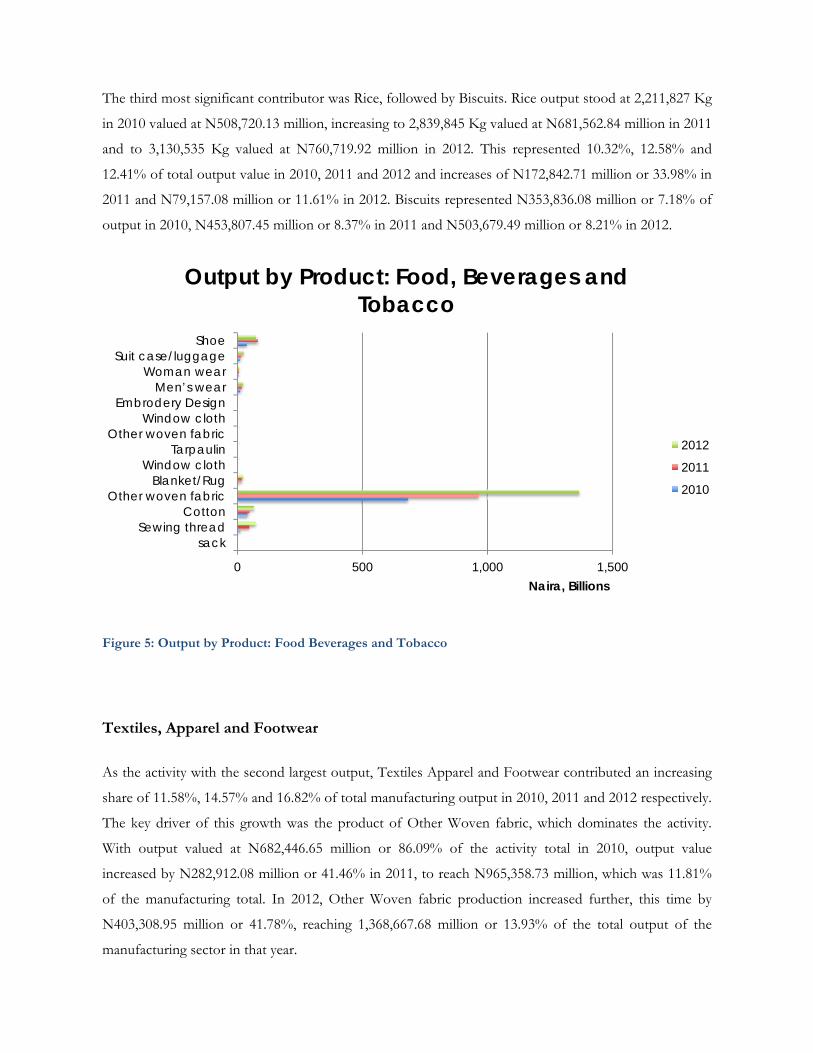
The third most significant contributor was Rice, followed by Biscuits. Rice output stood at 2,211,827 Kg
in 2010 valued at N508,720.13 million, increasing to 2,839,845 Kg valued at N681,562.84 million in 2011
and to 3,130,535 Kg valued at N760,719.92 million in 2012. This represented 10.32%, 12.58% and
12.41% of total output value in 2010, 2011 and 2012 and increases of N172,842.71 million or 33.98% in
2011 and N79,157.08 million or 11.61% in 2012. Biscuits represented N353,836.08 million or 7.18% of
output in 2010, N453,807.45 million or 8.37% in 2011 and N503,679.49 million or 8.21% in 2012.
Figure 5: Output by Product: Food Beverages and Tobacco
Textiles, Apparel and Footwear
As the activity with the second largest output, Textiles Apparel and Footwear contributed an increasing
share of 11.58%, 14.57% and 16.82% of total manufacturing output in 2010, 2011 and 2012 respectively.
The key driver of this growth was the product of Other Woven fabric, which dominates the activity.
With output valued at N682,446.65 million or 86.09% of the activity total in 2010, output value
increased by N282,912.08 million or 41.46% in 2011, to reach N965,358.73 million, which was 11.81%
of the manufacturing total. In 2012, Other Woven fabric production increased further, this time by
N403,308.95 million or 41.78%, reaching 1,368,667.68 million or 13.93% of the total output of the
manufacturing sector in that year.
0 500 1,000 1,500
sackSewing thread
CottonOther woven fabric
Blanket/RugWindow cloth
TarpaulinOther woven fabric
Window clothEmbrodery Design
Men’s wearWoman wear
Suit case/luggageShoe
Naira, Billions
Output by Product: Food, Beverages and Tobacco
2012
2011
2010

The second greatest contributor after this was Leather Shoes, which had a more mixed growth story.
Contributing N36,845.81 million or 4.65% of the activity total in 2010, it grew by an impressive
N44,391.23 million or 120.48% in 2011, with the value of N81,237.04 million expanding its share of the
activity total to 6.82%. However, in 2012 output declined by N7,189.70 million or 8.85% to N74,047.34
million or 4.48% of the activity total.
Other Manufacturing
Other Manufacturing includes activities that have not elsewhere been classified in the Manufacturing
Sector. Examples of products that are captured here are Office Furniture, Cupboard/wardrobes,
Furniture/Doors/Windows, Mattresses and Brio/Pens.
At a value of N392,317.00 million in 2010, N575,671.36 million in 2011 and N786,387.82 in 2012, Other
Manufacturing was the third largest of all activities in the manufacturing sector in all years of review,
contributing an increasing share of 5.73%, 7.04% and 8.00% to the total respectively. The fastest
growing, and one of the main contributors to growth, is the manufacture of Mattresses, which from the
N196,158.50 million or 22.80% of the total recorded in 2010, grew by N71,836.94 million or 80.32%.
The following year, it grew by a further N54,009.24 million or 33.49%, reaching N215,287.80 million or
27.38% of the total. This was not the only class of products that experienced high growth over the
period; in 2012 all products grew at a rate of over 30%. The lowest was even Mattresses at 33.49%,
whilst the highest growth was recorded for Cupboard/Wardrobe manufacture, which increased by
42.75% or N179,98 million from N421.04 million in 2011 to N601.02 million in 2012.

Figure 6: Output by Product: Other Manufacturing Activity
Employment
The number of those engaged in employment in the Manufacturing Sector in 2010 totaled 2,880,973,
increasing by 148,912 persons or 5.17% to 3,029,884 in 2011. In 2012 however, there was a marginal
decline in employment in the manufacturing sector, by 48,803 persons or 1.61%. to reach a total of
2,368,514 employed in that year.
In 2010, 82.23% or 2,368,970 of those engaged in the manufacturing sector were paid employees. This
portion increased in the following year, by 7.86% or 186,214 employees, meaning that all of the increase
in engagement in the sector in 2011 was from new paid employees. From the 2,555,184 paid employees
recorded in the manufacturing sector in 2011, there was a decrease of 7.31% or 186,870 employees to
2,368,514.
050
100150200250300350400450
Nai
ra, B
illio
nsOutput by Product: Other Manufacturing
Activity
2010
2011
2012

Figure 7: Employment in the Manufacturing
The majority of those employed in the manufacturing sector are Nigerian males, making up 78.62%
(2,264,916 employees) of those engaged and a slightly larger portion of 81.14% (1,922,223 employees) of
those paid in 2010. Nigerian females make up 546,805 or 18.98% of those engaged, yet 391,362 or
16.52% of those employed in the same year. The remaining 2.41% is dominated by non-Nigerian males,
which make up 57,570 or 2.00% of those employed in 2010, whilst non-Nigerian females take the
remaining, 11,681 or 0.41% of those engaged. For non-Nigerian males, the same portion of 2.00% are
paid employees, making up 47,342 employees, whilst non-Nigerian females have a lower portion paid, at
8,043 or 0.34% of the total in 2010.
In 2011, there were increases in both engaged and employed persons in the manufacturing sector across
all genders and nationalities. In absolute terms, the largest was for Nigerian males, which increased by
4.98% or 112,785 persons engaged and 9.01% or 172,097 persons employed to reach 2,377,701 and
2,095,320 employees respectively. Non-Nigerians had the greatest percentage increases, with females
engaged increasing by 9.75% or 1,139 persons, to reach 12,820 in total in 2011. Non-Nigerian paid
employment had the greatest increase of the paid employees, with 11.04% or 5,227 employees in 2011,
reaching 52,568 employed.
0
500
1,000
1,500
2,000
2,500
3,000
3,500
Engaged Paid Engaged Paid Engaged Paid
2010 2011 2012
Empl
oyee
s, Th
ousa
nds
Employment in the Manufacturing Sector
Non-Nigerian Female
Non-Nigerian Male
Nigerian Female
Nigerian Male

For Nigerian males, the increase in engagement in employment in the manufacturing sector continued to
increase in 2012, albeit by a marginal 0.16% or 3,733 persons, reaching 2,381,435 engaged. However, the
number paid for their employment did not manage to maintain positive growth; it declined by 6.56% or
137,455 employees in 2012. Negative growth was even greater for Nigerian females. For those engaged
in the manufacturing sector there was a 62,217 person or 10.79% decline fro 576,868 to 512,642
persons. For those paid, the decline was by 14.59% or 58,123 employees from 398,458 in 2011 to 340,
335 in 2012. For those in paid manufacturing employment, the only increase in employment was for
non-Nigerian males, which increased by 9,197 employees or 17.49% in 2012, to reach 61,765 paid
employees.
Employee Compensation
Total employee compensation, in the form of wages and salary, Other benefits, Social security
contributions and Directors’ fees/allowances, summed to N1,198,253.65 million in 2010. By 2011, it had
increased by N298,378.68 million or 24.90% to N1,496,632.33 million. The increase was even greater in
2012, with a further 25.55% rise, of N380,721.91 million to N1,877,354.24 million.
Employee compensation in 2010 was mostly made up of Wages and Salary, which constituted
N646,189.77 million or 53.93% of the total paid to employees. This was followed by Other benefits,
which constituted N485,225.07 million or 40.49% of total employee compensation. The remainder is
made up of social security contributions, which contributes N22,270.69 million or 1.86% and Directors’
fees/allowances, of N44,496.73 million or 3.71%.
Over the following two year period, there is a steady increase in the portion of compensation paid
directly as Wages and Salary and a steady decline in the portion paid as Other benefits.
In 2011 Wages and salary increased by 33.23% or N215,293.15 million to N861,482.92 million to make
up 57.56% of the total, whilst Other benefits, which may include a company car, mobile phone or even
Employee Compensation
WAGES/SALARY ONLYOTHER BENEFITSSOCIAL SECURITY CONTRIBUTIONSDIRECTOR'S FEE/ALLOWANCE
2010
bonuses, increased by a lesser N44,249.72 or 9.12% to N529,474.79, causing a decline of in its share of
the total by 5.12% points to 35.38%. Wages and Salary continued to increase in 2012, by N239,357.94
million or 27.78% to N1,100,840.86 million, or a 58.64% share of the total. Other benefits also increased
substantially, by N85,430.45 million or 16.13% to N614, 905.24 million, although its share of the total
still declined to 32.75%.
Both social security contributions and Directors’ fees and allowances increased substantially over the
period. Most notable was the Directors’ fees and allowances, increasing from the N44,496.73 million in
2010, by 73.97% or N32,914.34 million to 77,411.12 million in 2011 and a further 51.76% or
N40,064.38 million to 117.475.50 million in 2012. Over the period its share of the total therefore
increased by 2.54% points, from 3.71% in 2010 to 6.26% in 2012.
Inventory and Depreciation
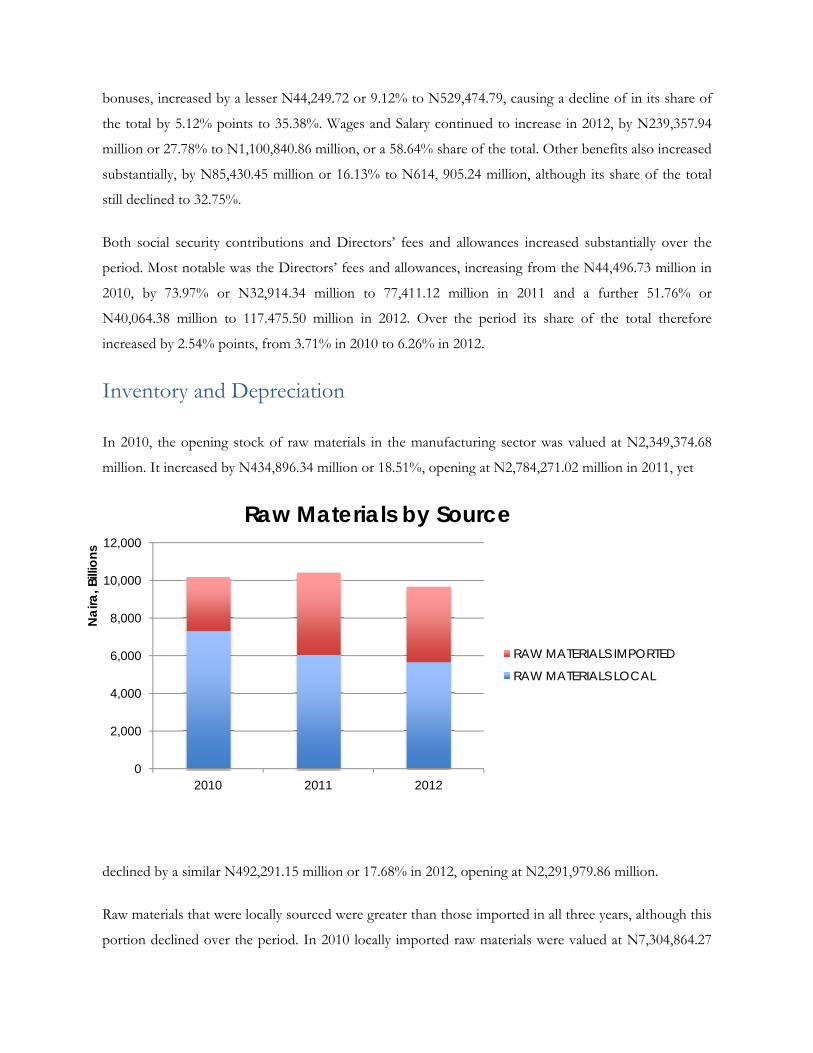
In 2010, the opening stock of raw materials in the manufacturing sector was valued at N2,349,374.68
million. It increased by N434,896.34 million or 18.51%, opening at N2,784,271.02 million in 2011, yet
declined by a similar N492,291.15 million or 17.68% in 2012, opening at N2,291,979.86 million.
Raw materials that were locally sourced were greater than those imported in all three years, although this
portion declined over the period. In 2010 locally imported raw materials were valued at N7,304,864.27
0
2,000
4,000
6,000
8,000
10,000
12,000
2010 2011 2012
Nai
ra, B
illio
ns
Raw Materials by Source
RAW MATERIALS IMPORTED
RAW MATERIALS LOCAL

million, that is 71.70% of the total. Their value declined by N1,261,182.74 million or 17.26% in 2011,
whilst the value of imported raw materials increased by N1,476,946.94 million or 51.22% from
N2,883,805.34 million to N4,360,752.28 million. The share of domestically sourced raw materials
subsequently declined to 58.09%. In 2012 both domestic and locally sourced raw materials used
declined, by N422,813.79 or 7.00% and N333,410.69 million or 7.65% respectively.
For opening stocks of finished goods, there was a steadier decline. Valued at N2,333,732.34 million in
2010, it declined by N488,327.64 million or 20.92% in 2011 and by N123,147.95 million or 6.67% in
2012, reaching a value of N2,291,979.86 million.
Depreciation increased steadily over the period. From the N699,135.17 million recorded in 2010, it
increased by N192,595.28 million or 27.55% in 2011 to N891,730.45 million and then by a further
N22,583.20 million or 2.53% to N914,313.65 million in 2012.
Intermediate Inputs
Intermediate inputs are the goods and services that are consumed or used up in the manufacturing
process, examples of which are outlined in Figure 10. The total amount spent on intermediate inputs in
the manufacturing sector totaled N4,043,539.22 million in 2010. This increased by N376,940.34 million
9.32% to N4,420,479.56 million in 2011 and by an even greater N780,765.14 million or 17.66% in 2012
to reach N5,201,244.69 spent on intermediate inputs.
0 500 1,000 1,500
PHCN BILLSGENERATOR (FUEL)
OTHER ALTERNATIVE SOURCESREPLACEMENT OF MINOR SPARE PARTS …
WATER BILLSMINOR REGULAR REPAIRS AND …
MEDICAL EXPENSE TO STAFF AT WORKSTAFF PER DIEM/TRAVELLING ALLOWANCE
SPECIALISED CLOTHING USED MAINLY AT …RENTS ON MACHINERY AND BUILDING …
TELEPHONE, POSTAGE BILLS AND …WASTE DISPOSAL BILLS
OTHER OPERATING COST
Naira, Billions
Composition of Intermediate Inputs
2012
2011
2010
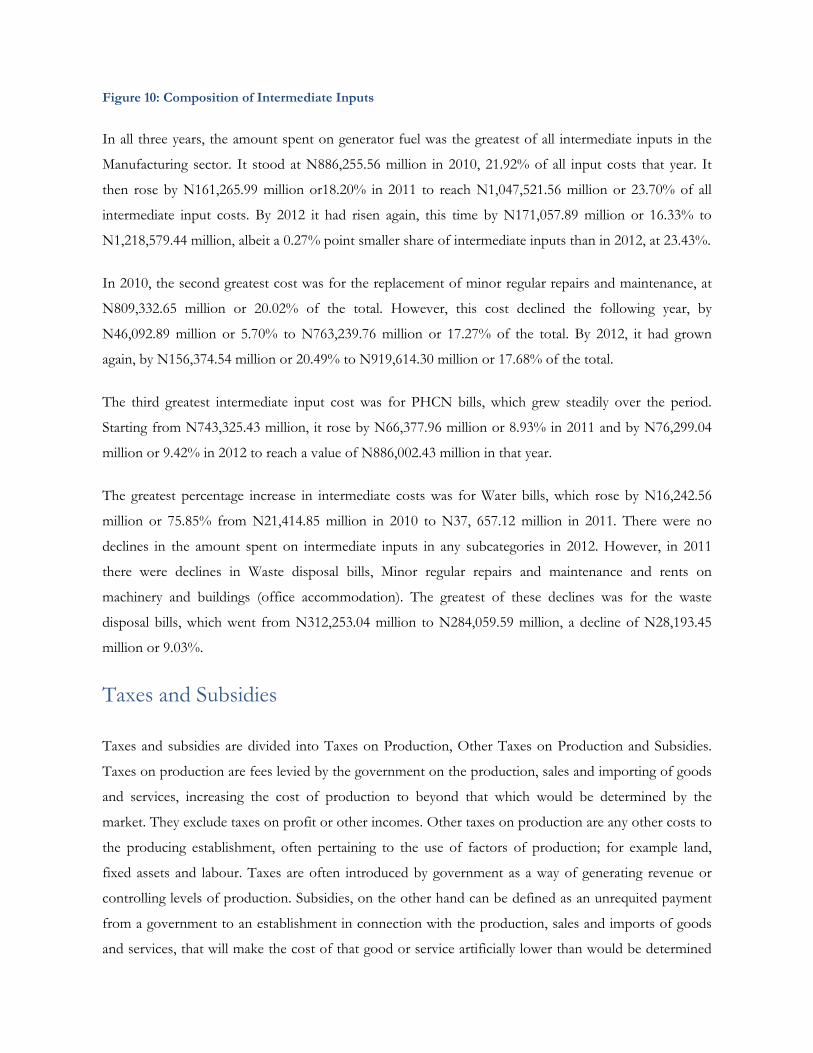
Figure 10: Composition of Intermediate Inputs
In all three years, the amount spent on generator fuel was the greatest of all intermediate inputs in the
Manufacturing sector. It stood at N886,255.56 million in 2010, 21.92% of all input costs that year. It
then rose by N161,265.99 million or18.20% in 2011 to reach N1,047,521.56 million or 23.70% of all
intermediate input costs. By 2012 it had risen again, this time by N171,057.89 million or 16.33% to
N1,218,579.44 million, albeit a 0.27% point smaller share of intermediate inputs than in 2012, at 23.43%.
In 2010, the second greatest cost was for the replacement of minor regular repairs and maintenance, at
N809,332.65 million or 20.02% of the total. However, this cost declined the following year, by
N46,092.89 million or 5.70% to N763,239.76 million or 17.27% of the total. By 2012, it had grown
again, by N156,374.54 million or 20.49% to N919,614.30 million or 17.68% of the total.
The third greatest intermediate input cost was for PHCN bills, which grew steadily over the period.
Starting from N743,325.43 million, it rose by N66,377.96 million or 8.93% in 2011 and by N76,299.04
million or 9.42% in 2012 to reach a value of N886,002.43 million in that year.
The greatest percentage increase in intermediate costs was for Water bills, which rose by N16,242.56
million or 75.85% from N21,414.85 million in 2010 to N37, 657.12 million in 2011. There were no
declines in the amount spent on intermediate inputs in any subcategories in 2012. However, in 2011
there were declines in Waste disposal bills, Minor regular repairs and maintenance and rents on
machinery and buildings (office accommodation). The greatest of these declines was for the waste
disposal bills, which went from N312,253.04 million to N284,059.59 million, a decline of N28,193.45
million or 9.03%.
Taxes and Subsidies
Taxes and subsidies are divided into Taxes on Production, Other Taxes on Production and Subsidies.
Taxes on production are fees levied by the government on the production, sales and importing of goods
and services, increasing the cost of production to beyond that which would be determined by the
market. They exclude taxes on profit or other incomes. Other taxes on production are any other costs to
the producing establishment, often pertaining to the use of factors of production; for example land,
fixed assets and labour. Taxes are often introduced by government as a way of generating revenue or
controlling levels of production. Subsidies, on the other hand can be defined as an unrequited payment
from a government to an establishment in connection with the production, sales and imports of goods
and services, that will make the cost of that good or service artificially lower than would be determined
by the market. The converse to taxation, subsidization is introduced to encourage production of a good
or service, for intended economic or social benefit.
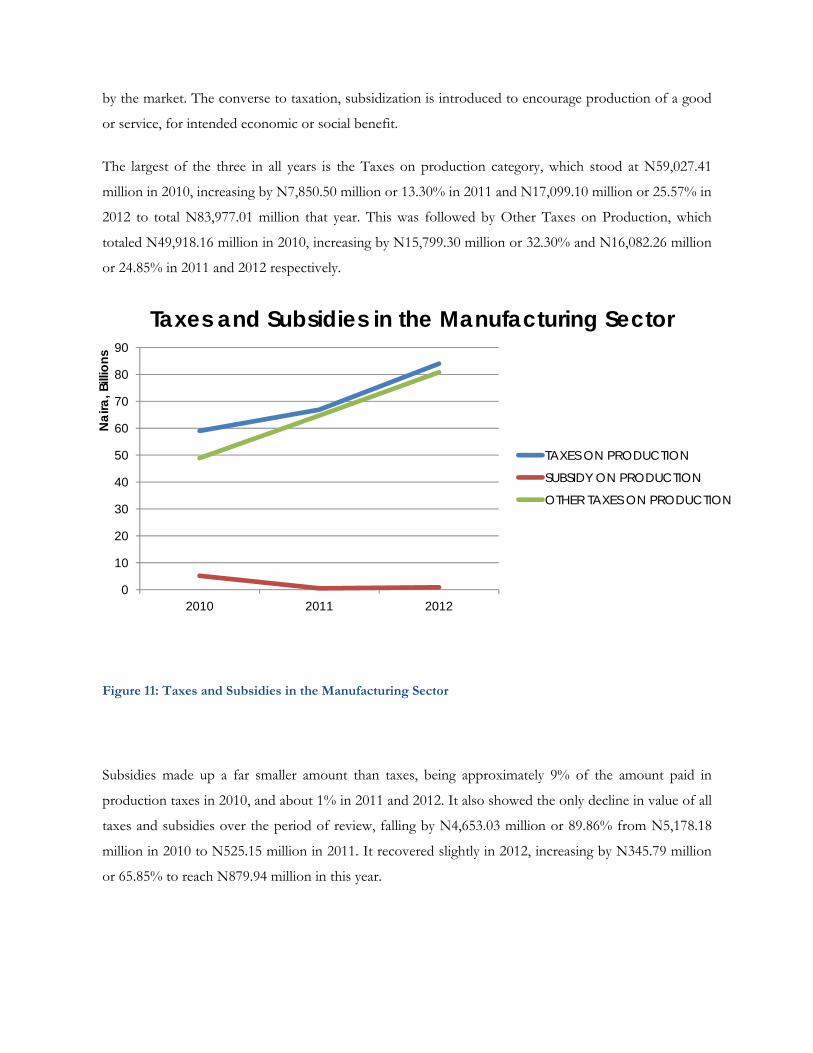
The largest of the three in all years is the Taxes on production category, which stood at N59,027.41
million in 2010, increasing by N7,850.50 million or 13.30% in 2011 and N17,099.10 million or 25.57% in
2012 to total N83,977.01 million that year. This was followed by Other Taxes on Production, which
totaled N49,918.16 million in 2010, increasing by N15,799.30 million or 32.30% and N16,082.26 million
or 24.85% in 2011 and 2012 respectively.
Figure 11: Taxes and Subsidies in the Manufacturing Sector
Subsidies made up a far smaller amount than taxes, being approximately 9% of the amount paid in
production taxes in 2010, and about 1% in 2011 and 2012. It also showed the only decline in value of all
taxes and subsidies over the period of review, falling by N4,653.03 million or 89.86% from N5,178.18
million in 2010 to N525.15 million in 2011. It recovered slightly in 2012, increasing by N345.79 million
or 65.85% to reach N879.94 million in this year.
0
10
20
30
40
50
60
70
80
90
2010 2011 2012
Nai
ra, B
illio
ns
Taxes and Subsidies in the Manufacturing Sector
TAXES ON PRODUCTION
SUBSIDY ON PRODUCTION
OTHER TAXES ON PRODUCTION
SECTION THREE: Manufacturing Sub-Sectors
Employment
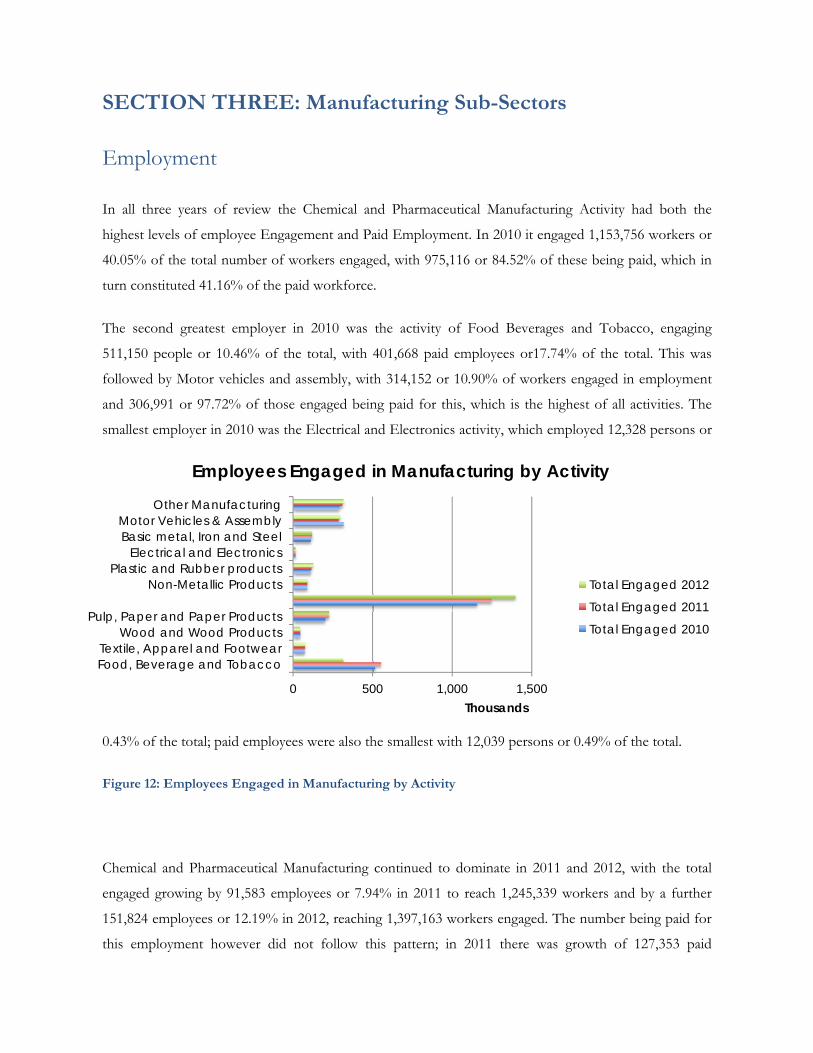
In all three years of review the Chemical and Pharmaceutical Manufacturing Activity had both the
highest levels of employee Engagement and Paid Employment. In 2010 it engaged 1,153,756 workers or
40.05% of the total number of workers engaged, with 975,116 or 84.52% of these being paid, which in
turn constituted 41.16% of the paid workforce.
The second greatest employer in 2010 was the activity of Food Beverages and Tobacco, engaging
511,150 people or 10.46% of the total, with 401,668 paid employees or17.74% of the total. This was
followed by Motor vehicles and assembly, with 314,152 or 10.90% of workers engaged in employment
and 306,991 or 97.72% of those engaged being paid for this, which is the highest of all activities. The
smallest employer in 2010 was the Electrical and Electronics activity, which employed 12,328 persons or
0.43% of the total; paid employees were also the smallest with 12,039 persons or 0.49% of the total.
Figure 12: Employees Engaged in Manufacturing by Activity
Chemical and Pharmaceutical Manufacturing continued to dominate in 2011 and 2012, with the total
engaged growing by 91,583 employees or 7.94% in 2011 to reach 1,245,339 workers and by a further
151,824 employees or 12.19% in 2012, reaching 1,397,163 workers engaged. The number being paid for
this employment however did not follow this pattern; in 2011 there was growth of 127,353 paid
0 500 1,000 1,500
Food, Beverage and TobaccoTextile, Apparel and Footwear
Wood and Wood ProductsPulp, Paper and Paper Products
Non-Metallic ProductsPlastic and Rubber products
Electrical and ElectronicsBasic metal, Iron and SteelMotor Vehicles & Assembly
Other Manufacturing
Thousands
Employees Engaged in Manufacturing by Activity
Total Engaged 2012
Total Engaged 2011
Total Engaged 2010

employees or 13.06% and in 2012, there was a much slower growth in paid employees of 35,260 or
3.20%, showing that there was an increase in unpaid employment.
The other dominant sector of Food, Beverages and Tobacco showed a mixed employment growth story
over the period. The total engaged increased by 38,117 employees or 7.46% in 2011, raising its portion
of the total engaged to 18.13%. Yet, it decreased by 237,375 employees or 43.22% the following year so
that its share of the total declined starkly, to 10.46%, moving it to the joint second greatest contributor
to worker engagement alongside Other Manufacturing. Similarly, workers being paid increased by 54,838
employees or 13.65% in 2011 and decreased by 251,382 employees or 55.07% in 2012. This had a
marked effect on the portion of the total paid, which dropped 19.96% of the total in 2010, to 17.87% in
2011, to just 8.66% in 2012.
Figure 13: Paid Employees in the Manufacturing Sector by Activity
Motor Vehicles and Assembly did not maintain its share as the third largest in terms of worker
engagement, yet it did so in terms of workers paid. In fact, it is the only activity within the top three to
have a larger portion of paid workers than engaged. In 2011, workers engaged in the activity decreased
by 33,243 employees or 10.58%, so that the sector then contributed 9.27% of the 2011 total, increasing
by 8,932 employees or 3.54% in 2012 , to total 290,849 workers or 9.76% of the total, pushing it to the
0 200 400 600 800 1,000 1,200
Food, Beverage and Tobacco
Textile, Apparel and Footwear
Wood and Wood Products
Pulp, Paper and Paper Products
Chemical and Pharmaceutical Products
Non-Metallic Products
Plastic and Rubber products
Electrical and Electronics
Basic metal, Iron and Steel
Motor Vehicles & Assembly
Other Manufacturing
Thousands
Paid Employees in the Manufacturing Sector by Activity
Total Paid 2012
Total Paid 2011
Total Paid 2010
fourth largest employer. For those paid there was a similar decline in paid employment by 33,310
workers or 10.85% in 2011 and increasing by 8,932 employees or 3.26% in 2012. Totaling 282,614 paid
employees it was the second largest employer of paid workers in 2012, contributing 11.93% of the total.
In turn, Motor Vehicles and Assembly had the highest portion of engaged employees being paid in all
three years, peaking at 97.72% in 2010.
Employee Compensation
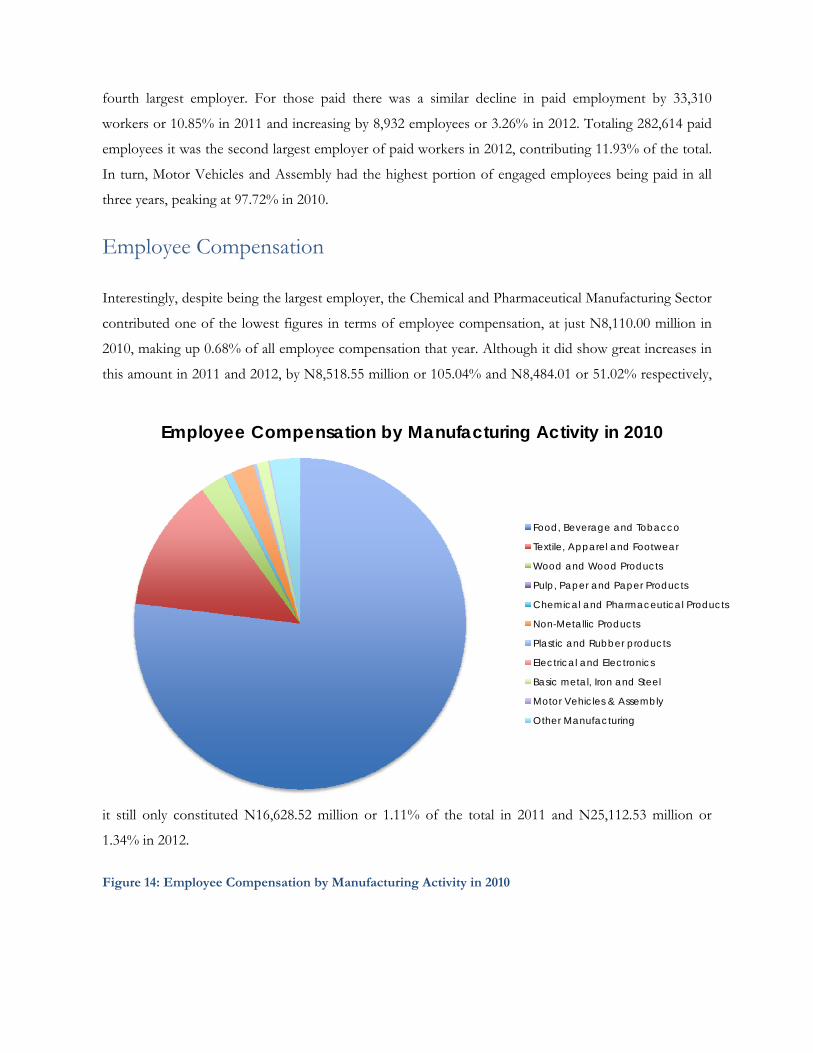
Interestingly, despite being the largest employer, the Chemical and Pharmaceutical Manufacturing Sector
contributed one of the lowest figures in terms of employee compensation, at just N8,110.00 million in
2010, making up 0.68% of all employee compensation that year. Although it did show great increases in
this amount in 2011 and 2012, by N8,518.55 million or 105.04% and N8,484.01 or 51.02% respectively,
it still only constituted N16,628.52 million or 1.11% of the total in 2011 and N25,112.53 million or
1.34% in 2012.
Figure 14: Employee Compensation by Manufacturing Activity in 2010
Employee Compensation by Manufacturing Activity in 2010
Food, Beverage and Tobacco
Textile, Apparel and Footwear
Wood and Wood Products
Pulp, Paper and Paper Products
Chemical and Pharmaceutical Products
Non-Metallic Products
Plastic and Rubber products
Electrical and Electronics
Basic metal, Iron and Steel
Motor Vehicles & Assembly
Other Manufacturing

Food Beverages and Tobacco, however, as the second largest employer, had by far the largest amounts
of employee compensation, with N922,030.78 million or 76.95% of the total in 2010. This increased by
N122,661.62 or 13.30% in 2011, to reach N1,044,692.40 million, despite declining to 69.80% of the total
compensated to employees in the manufacturing sector that year. A similar story is told in 2012, with
another N201,203.35 million or 19.26% increase in compensation, yet a decline in share to 66.36%, with
a total of N1,245,895.75 million.
Textile, Apparel and Footwear had the second greatest figure for employee compensation, with
N155,632.70 million in 2010, or 12.99% of the total. This is interesting, as it employed just 1.55% of the
paid workforce in that year. The figure even increased greatly in 2011 and 2012, by N102,676.82 million
or 65.97% in 2011 and N142,144.12 million or 55.03% in 2012, so that it totaled N400,453.70 million in
2012, 21.33% of the total. The third greatest contributor to employee compensation was Other
Manufacturing, which constituted a much lesser N35,369.07 million or 2.95% to the total in 2010. This
increased greatly the following year, by N26,917.89 million or 76.11%, increasing its share of the total to
4.16%. However, in 2010 employee compensation in the Other Manufacturing sector declined by
N9,971.83 million or 16.01% to N52,315.14 million or 2.79% of the total; the third largest contributor to
employee compensation that year became Non-metallic products at N53,434.15 million or 2.85% of the
total.
Inventory
Raw Materials
The activity with the greatest portion of locally sourced raw materials in 2010 was Basic Metals, Iron and
Steel, constituting N2,559.74 million 95.78% of the total. This was followed by Chemical and
Pharmaceutical, for which locally sourced raw materials constituted N4,989,033.56 million or 79.61% of
the total. For imported raw materials, Food, Beverages and Tobacco had the largest share, with
N677,711.78 million or 72.29% of raw materials used that year. This was by far the highest, with other
activities not importing up to half of their raw materials; plastic and rubber products imported
N25,734.03 million or 46.89% of their raw materials.
Over the period, the portion of locally sourced raw materials generally declines, except in the case of
Basic Metals, Iron and Steel, in which it continued to constitute over 95% of the total. For Chemical and
Pharmaceutical activities, the portion declined to 66.83% in 2011 and 56.49% in 2012. On the imports
side, the portion of raw materials imported in the Food, Beverages and Tobacco activity declined, to
68.94% in 2011 and 60.35% in 2012. Plastic and Rubber Products however, showed a marginal decline
in the portion of imported goods to 46.24% in 2011 and an increase in 2012 to 55.67%, so that it
became an industry relying more on imported goods than local.
Raw Materials Imported
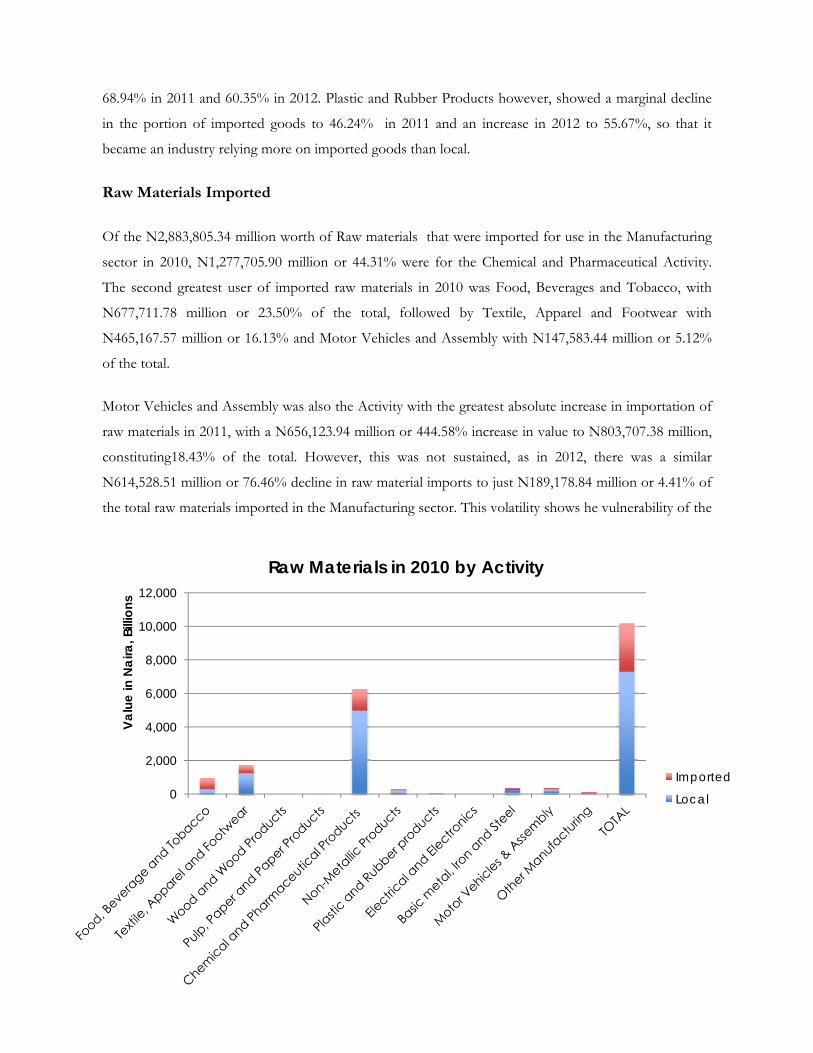
Of the N2,883,805.34 million worth of Raw materials that were imported for use in the Manufacturing
sector in 2010, N1,277,705.90 million or 44.31% were for the Chemical and Pharmaceutical Activity.
The second greatest user of imported raw materials in 2010 was Food, Beverages and Tobacco, with
N677,711.78 million or 23.50% of the total, followed by Textile, Apparel and Footwear with
N465,167.57 million or 16.13% and Motor Vehicles and Assembly with N147,583.44 million or 5.12%
of the total.
Motor Vehicles and Assembly was also the Activity with the greatest absolute increase in importation of
raw materials in 2011, with a N656,123.94 million or 444.58% increase in value to N803,707.38 million,
constituting18.43% of the total. However, this was not sustained, as in 2012, there was a similar
N614,528.51 million or 76.46% decline in raw material imports to just N189,178.84 million or 4.41% of
the total raw materials imported in the Manufacturing sector. This volatility shows he vulnerability of the
0
2,000
4,000
6,000
8,000
10,000
12,000
Valu
e in
Nai
ra, B
illio
ns
Raw Materials in 2010 by Activity
Imported
Local
sector to changes in policy.
Despite 2011 growth in the sectors of Food Beverages and Tobacco, Textile, Apparel and Footwear and
Chemical and Pharmaceutical companies, the increase from Motor vehicles and assembly meant that
their shares of the total imported raw materials declined by 2.54% points, 2.72% points and 11.55%
points respectively represent respective shares of 20.96%, 13.41% and 32.76%.
Raw Materials Locally Sourced
Locally sourced Raw Materials in 2010 were also dominated by the Chemical and Pharmaceutical
industry, representing N4,989,033.59 million or 66.30% of the N7,304,864.27 million total for that year.
This was followed by the Textile, Apparel and Footwear Activity, which sourced N1,273,831.63 million
of local raw materials in 2010, 16.13% of the total. The third greatest contributor was Food, Beverages
and Tobacco, although this only contributed N259,802.20 million or 3.56% of the total.
The N1,261,182.74 million or 17.26% decrease in locally sourced raw materials observed in 2011 was
mainly driven by the N2,111,327.69 million or 42.32% decline in the Chemical and Pharmaceutical
activity, whose share declined by 20.68% points to 47.62% of the total. Other areas however saw
increases, such as the Other Manufacturing Activity, which increased local raw material use by
NN414,105.28 million or 467.83%, which increased its share of the total from 1.21% to 8.32%. Other
increases were observed in Food, Beverages and Tobacco and Non-Metallic Products, which increased
by N152,029.99 million or 58.52% and N192,650.44 million or 86.43% respectively.
The year 2012 saw further declines in locally sourced raw materials, of N422,813.79 million or 7.00%.
Again, this was mainly driven by the Chemical and Pharmaceutical activity, which saw a year on year
decline of N849,107.51 million or 29.51%, reducing its portion of the total raw materials locally sourced
to 36.09%. Nonetheless, declines were also seen in Wood and Wood Products, and Pulp, Paper and
Paper Products, which declined by N2,916.49 million or 54.48% to N2,437.10 million and N4,138.00
million or 19.67% to N16,895.35 million respectively. The greatest increase in locally sourced raw
materials in 2010 was in Food, Beverages and Tobacco, which increased by N193,812.86 million or
47.06%.

Intermediate Inputs
The greatest intermediate costs of all of the activities in the formal manufacturing sector is incurred by
the Food, Beverages and Tobacco activity, with N2,982,266.50 million or 73.75% of the total
intermediate inputs in 2010. This increased by N63,268.64 million or 2.12% in 2011 and N415,016.51
million in 2012, albeit at a slower rate than other sectors, so that its share declined to 68.90% and
66.53% in each year respectively.
Within this sector, the main contributor to this value is Minor Regular Repairs and Maintenance, which
made up N719,856.71 million or 24.14% of the total in 2010, followed by PHCN bills, costing
N603,587.14 million or 20.24% of the total and Generator Fuel, costing N510,627.34 million or 17.12%
of the total. The value of Minor Regular Repairs and Maintenance declined by N72,644.4 million or
10.09% in 2011, only to increase by NN102,492.23 million or 15.84% the following year.
The activity with the second greatest value of intermediate inputs in Textile, Apparel and Footwear,
which stood at N485,309.15 million in 2010. It also had the largest increase in absolute value in the two
consecutive years following, at N175,070.52 million or 36.07% in 2011 and N186,107.18 million or
28.18% in 2012. There were increases in in almost all subcategories over this period. However, the main
driver of this growth is the cost of Waste Disposal Bills, which at N129,903.01 million or 26.77% of the
total in 2010, grew by N35,647.30 million or 20.26% in 2011 and by N60,101.79 or 32.29%.

Figure 16: Intermediate Inputs for Food Beverages and Tobacco
Only one activity exhibited a decline in the value of intermediate inputs over the period of review. In
2011, Electrical and Electronics declined by N1,190.95 million or 19.18% from N6,209.36 million to
N5,018.41 million. Nonetheless, the intermediate input costs grew again in 2012 by N1,235.84 million or
24.63%. In both of these instances, the driver of the change was the component of intermediate
consumption that came from alternative sources of energy, which constituted N3,207.65 million or
51.66% of the intermediate input total in 2010, N2,407.85 million or 47.98% of the total in 2011 and
N3,048.75 million or 48.75% of the total in 2012. In 2011, it declined by N799.80 million or 24.93%,
whilst in 2012 it increased by a similar N640.90 million or 67.16%.
0 400 800
PHCN BILLS
GENERATOR (FUEL)
OTHER ALTERNATIVE SOURCES
REPLACEMENT OF MINOR SPARE PARTS USED
WATER BILLS
MINOR REGULAR REPAIRS AND MAINTENANCE
MEDICAL EXPENSE TO STAFF AT WORK
STAFF PER DIEM/TRAVELLING ALLOWANCE
SPECIALISED CLOTHING USED MAINLY AT WORK BY STAFF
RENTS ON MACHINERY AND BUILDING (OFFICE …
TELEPHONE, POSTAGE BILLS AND STATIONERIES
WASTE DISPOSAL BILLS
OTHER OPERATING COST
Naira, Billions
Intermediate Inputs for Food Beverages and Tobacco Activity
2012
2011
2010

Figure 17: Intermediate Inputs in the Rubber and Rubber Products Activity
The highest growth in intermediate inputs over the period came from Rubber and Rubber Products,
which increased by N51,664.97 million or 52.78% in 2012. This was driven by increases in the
intermediate inputs associated with power; PHCN bills increased by N2,548.29 million or 36.23% in
2011 and N6,407.30 million or 66.87% in 2012; generator fuel increased by N3,672.16 million or
21.61% in 2011 and by N9,098.73 million or 44.04% in 2012 and other alternative sources increased by
N4,072.41 million or 11.07% in 2011 and by N14,790.22 million or 36.19% in 2012.
0 20 40 60
PHCN BILLSGENERATOR (FUEL)
OTHER ALTERNATIVE SOURCESREPLACEMENT OF MINOR SPARE PARTS USED
WATER BILLSMINOR REGULAR REPAIRS AND MAINTENANCE
MEDICAL EXPENSE TO STAFF AT WORKSTAFF PER DIEM/TRAVELLING ALLOWANCE
SPECIALISED CLOTHING USED MAINLY AT WORK BY …RENTS ON MACHINERY AND BUILDING (OFFICE …TELEPHONE, POSTAGE BILLS AND STATIONERIES
WASTE DISPOSAL BILLSOTHER OPERATING COST
Naira, Billions
Intermediate Inputs in the Rubber and Rubber Products Activity
2012
2011
2010
APPENDIX I
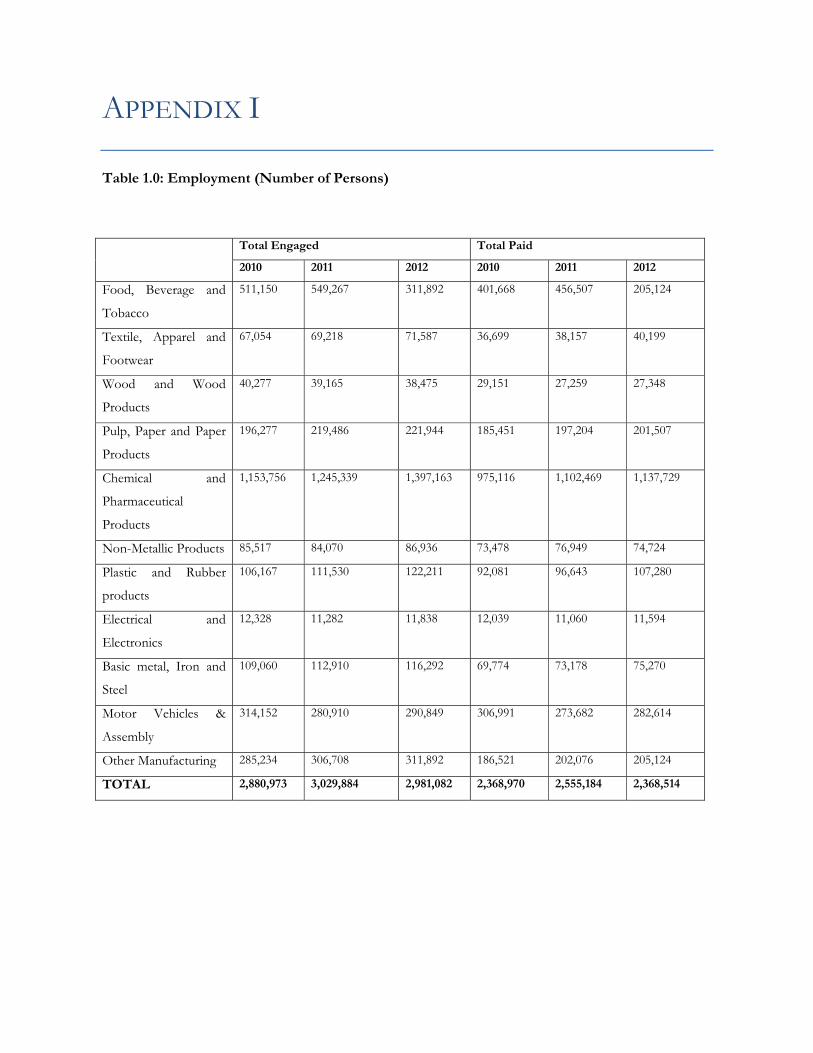
Table 1.0: Employment (Number of Persons)
Total Engaged Total Paid
2010 2011 2012 2010 2011 2012
Food, Beverage and
Tobacco
511,150 549,267 311,892 401,668 456,507 205,124
Textile, Apparel and
Footwear
67,054 69,218 71,587 36,699 38,157 40,199
Wood and Wood
Products
40,277 39,165 38,475 29,151 27,259 27,348
Pulp, Paper and Paper
Products
196,277 219,486 221,944 185,451 197,204 201,507
Chemical and
Pharmaceutical
Products
1,153,756 1,245,339 1,397,163 975,116 1,102,469 1,137,729
Non-Metallic Products 85,517 84,070 86,936 73,478 76,949 74,724
Plastic and Rubber
products
106,167 111,530 122,211 92,081 96,643 107,280
Electrical and
Electronics
12,328 11,282 11,838 12,039 11,060 11,594
Basic metal, Iron and
Steel
109,060 112,910 116,292 69,774 73,178 75,270
Motor Vehicles &
Assembly
314,152 280,910 290,849 306,991 273,682 282,614
Other Manufacturing 285,234 306,708 311,892 186,521 202,076 205,124
TOTAL 2,880,973 3,029,884 2,981,082 2,368,970 2,555,184 2,368,514

Table 2.0: Employee Compensation (N’000)
2010 2011 2012
Food, Beverage and Tobacco 922,030,782 1,044,692,404 1,245,895,752
Textile, Apparel and Footwear 155,632,698 258,309,515 400,453,696
Wood and Wood Products 30,167,190 34,248,425 43,169,617
Pulp, Paper and Paper Products 913,090 1,141,460 1,257,740
Chemical and Pharmaceutical Products 8,109,965 16,628,518 25,112,531
Non-Metallic Products 27,147,878 39,826,219 53,434,148
Plastic and Rubber products 3,513,230 8,507,810 12,478,890
Electrical and Electronics 138,500 263,860 267,900
Basic metal, Iron and Steel 13,492,480 28,512,493 39,015,408
Motor Vehicles & Assembly 1,738,760 2,214,660 3,953,420
Other Manufacturing 35,369,072 62,286,962 52,315,137
TOTAL 1,198,253,645 1,496,632,326 1,877,354,239
Table 3.0: Raw Materials by Source (N’000)
2010 2011 2012
Food, Beverage and
Tobacco
RAW MATERIALS LOCAL 259,802,203 411,832,190 605,645,053
RAW MATERIALS IMPORTED 677,711,784 913,975,715 921,897,622
Textile, Apparel and
Footwear
RAW MATERIALS LOCAL 1,273,831,628 1,320,770,734 1,375,618,885
RAW MATERIALS IMPORTED 465,167,572 584,770,252 675,476,240
Wood and Wood Products
RAW MATERIALS LOCAL 5,292,239 5,353,583 2,437,096
RAW MATERIALS IMPORTED 3,950,482 4,271,179 2,085,614
Pulp, Paper and Paper
Products
RAW MATERIALS LOCAL 18,160,184 21,033,320 16,895,354
RAW MATERIALS IMPORTED 8,033,320 9,895,354 10,187,515
Chemical and
Pharmaceutical Products
RAW MATERIALS LOCAL 4,989,033,588 2,877,705,897 2,028,598,392
RAW MATERIALS IMPORTED 1,277,705,897 1,428,598,392 1,562,177,950
Non-Metallic Products
RAW MATERIALS LOCAL 222,890,255 415,540,691 446,270,242
RAW MATERIALS IMPORTED 73,033,580 161,611,586 167,883,143
Plastic and Rubber
products
RAW MATERIALS LOCAL 29,149,492 52,362,800 63,096,489
RAW MATERIALS IMPORTED 25,734,028 45,043,789 79,222,915
Electrical and Electronics
RAW MATERIALS LOCAL 2,559,738 2,790,098 2,860,610
RAW MATERIALS IMPORTED 112,881 124,817 139,867
Basic metal, Iron and Steel
RAW MATERIALS LOCAL 213,923,048 166,927,118 197,407,326
RAW MATERIALS IMPORTED 172,709,635 114,204,300 172,567,251
Motor Vehicles & RAW MATERIALS LOCAL 201,705,306 266,743,232 366,243,757
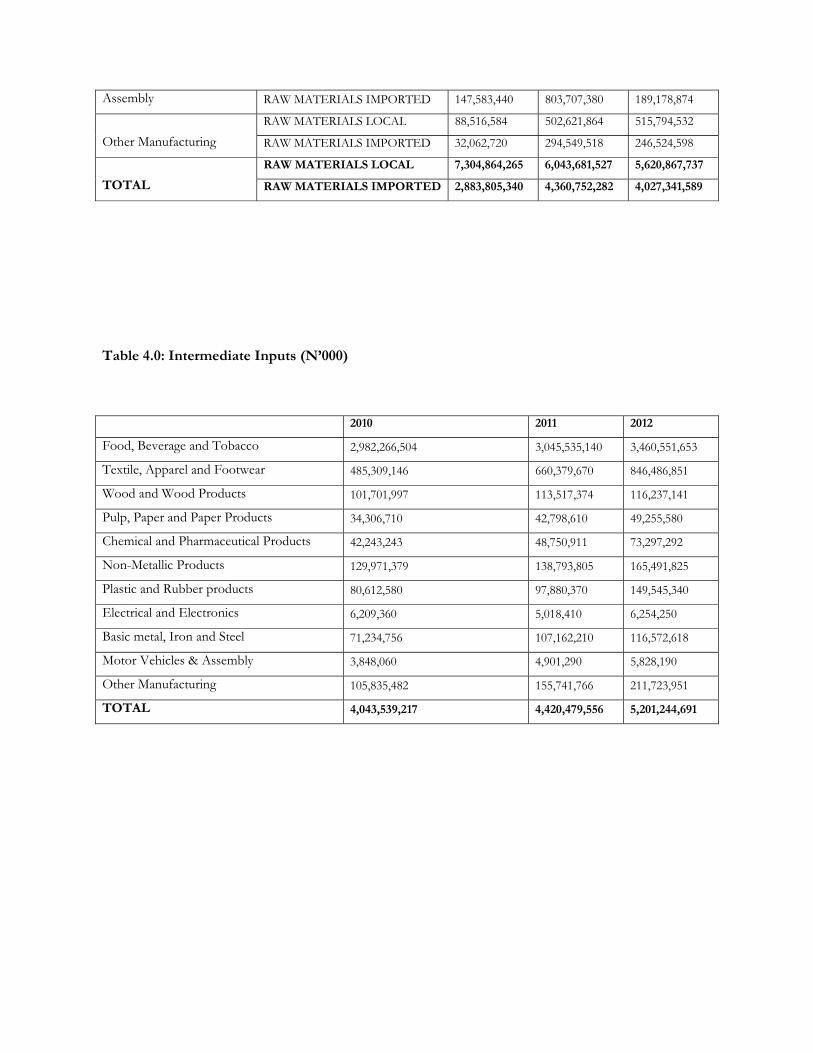
Assembly RAW MATERIALS IMPORTED 147,583,440 803,707,380 189,178,874
Other Manufacturing
RAW MATERIALS LOCAL 88,516,584 502,621,864 515,794,532
RAW MATERIALS IMPORTED 32,062,720 294,549,518 246,524,598
TOTAL
RAW MATERIALS LOCAL 7,304,864,265 6,043,681,527 5,620,867,737
RAW MATERIALS IMPORTED 2,883,805,340 4,360,752,282 4,027,341,589
Table 4.0: Intermediate Inputs (N’000)
2010 2011 2012
Food, Beverage and Tobacco 2,982,266,504 3,045,535,140 3,460,551,653
Textile, Apparel and Footwear 485,309,146 660,379,670 846,486,851
Wood and Wood Products 101,701,997 113,517,374 116,237,141
Pulp, Paper and Paper Products 34,306,710 42,798,610 49,255,580
Chemical and Pharmaceutical Products 42,243,243 48,750,911 73,297,292
Non-Metallic Products 129,971,379 138,793,805 165,491,825
Plastic and Rubber products 80,612,580 97,880,370 149,545,340
Electrical and Electronics 6,209,360 5,018,410 6,254,250
Basic metal, Iron and Steel 71,234,756 107,162,210 116,572,618
Motor Vehicles & Assembly 3,848,060 4,901,290 5,828,190
Other Manufacturing 105,835,482 155,741,766 211,723,951
TOTAL 4,043,539,217 4,420,479,556 5,201,244,691

Table 5.0: Output by Activity (N’000)
2010 2011 2012
Food, Beverage and Tobacco 4,930,494,522 5,419,349,578 6,132,108,930
Textile, Apparel and Footwear 792,693,123 1,190,712,770 1,652,840,709
Wood and Wood Products 174,066,772 192,748,497 218,565,281
Pulp, Paper and Paper Products 55,379,241 71,463,461 80,803,530
Chemical and Pharmaceutical Products 63,829,108 83,706,278 132,287,439
Non-Metallic Products 187,709,518 238,311,717 288,275,130
Plastic and Rubber products 114,472,120 179,875,350 269,813,580
Electrical and Electronics 8,715,910 9,793,610 11,102,510
Basic metal, Iron and Steel 100,262,473 177,490,114 207,328,869
Motor Vehicles & Assembly 25,738,800 32,783,650 45,003,390
Other Manufacturing 392,317,002 575,671,360 786,387,818
TOTAL 6,845,678,589 8,171,906,385 9,824,517,186
Table 6.0: Output by Product (N’000)
Prod. 2010 2011 2012
FOOD Fish 2,137,057 2,721,440 3,293,813
FOOD Palm Kernel 20,984 26,610 31,968
FOOD Ground nut oil 9,229,609 12,420,541 14,174,865
FOOD Palm Oil 6,512,150 9,420,450 12,875,180
FOOD Yogurt 4,632,662 5,982,002 7,734,299
FOOD Ice-cream 135,587 124,561 191,140
FOOD Gari 31,715,553 67,362,621 58,314,262
FOOD Cornflakes 2,445,209 3,206,036 3,571,317
FOOD Rice 508,720,126 681,562,841 760,719,922
FOOD Starch 348,951 420,262 809,129
FOOD Animal Feed 5,972,839 10,131,484 9,095,484
FOOD Biscuit 353,836,076 453,807,448 503,679,491
FOOD Pastry and cakes 68,489 98,657 124,652
FOOD Bread 1,398,459,117 1,099,934,593 1,319,418,189
FOOD Sugar 1,940,413,379 2,438,316,122 2,710,304,147
FOOD Chocolate 316,314 417,721 473,453
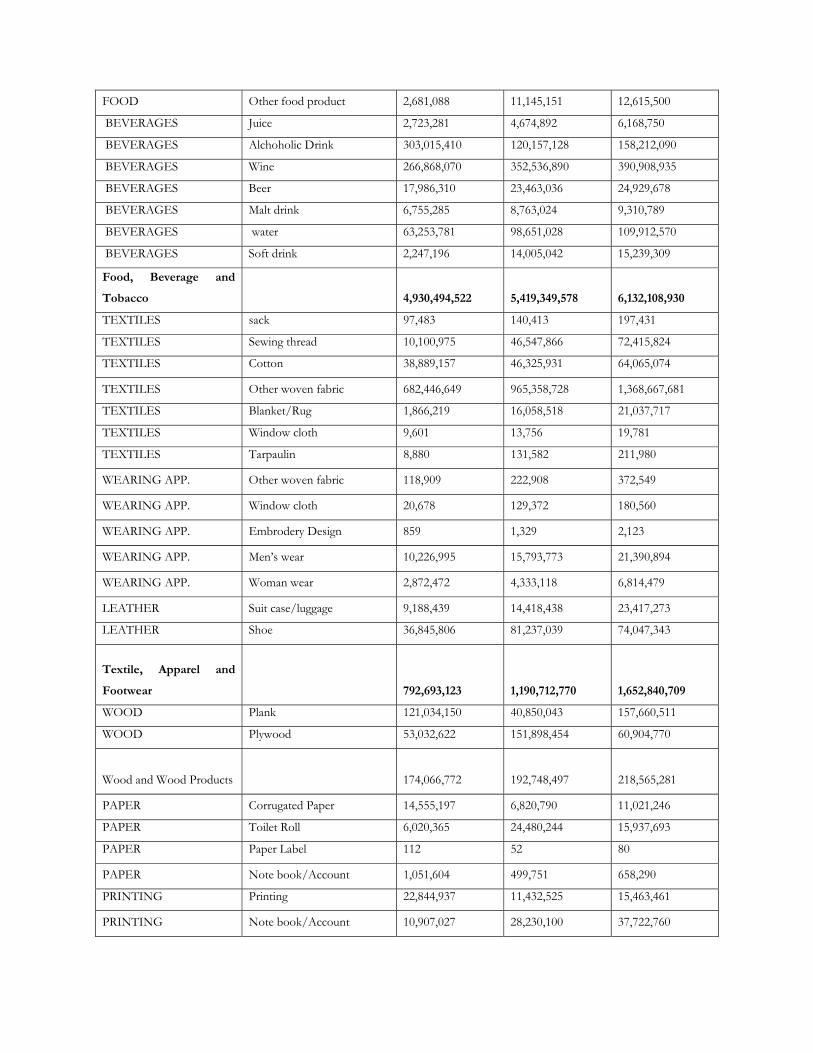
FOOD Other food product 2,681,088 11,145,151 12,615,500
BEVERAGES Juice 2,723,281 4,674,892 6,168,750
BEVERAGES Alchoholic Drink 303,015,410 120,157,128 158,212,090
BEVERAGES Wine 266,868,070 352,536,890 390,908,935
BEVERAGES Beer 17,986,310 23,463,036 24,929,678
BEVERAGES Malt drink 6,755,285 8,763,024 9,310,789
BEVERAGES water 63,253,781 98,651,028 109,912,570
BEVERAGES Soft drink 2,247,196 14,005,042 15,239,309
Food, Beverage and
Tobacco 4,930,494,522 5,419,349,578 6,132,108,930
TEXTILES sack 97,483 140,413 197,431
TEXTILES Sewing thread 10,100,975 46,547,866 72,415,824
TEXTILES Cotton 38,889,157 46,325,931 64,065,074
TEXTILES Other woven fabric 682,446,649 965,358,728 1,368,667,681
TEXTILES Blanket/Rug 1,866,219 16,058,518 21,037,717
TEXTILES Window cloth 9,601 13,756 19,781
TEXTILES Tarpaulin 8,880 131,582 211,980
WEARING APP. Other woven fabric 118,909 222,908 372,549
WEARING APP. Window cloth 20,678 129,372 180,560
WEARING APP. Embrodery Design 859 1,329 2,123
WEARING APP. Men’s wear 10,226,995 15,793,773 21,390,894
WEARING APP. Woman wear 2,872,472 4,333,118 6,814,479
LEATHER Suit case/luggage 9,188,439 14,418,438 23,417,273
LEATHER Shoe 36,845,806 81,237,039 74,047,343
Textile, Apparel and
Footwear 792,693,123 1,190,712,770 1,652,840,709
WOOD Plank 121,034,150 40,850,043 157,660,511
WOOD Plywood 53,032,622 151,898,454 60,904,770
Wood and Wood Products 174,066,772 192,748,497 218,565,281
PAPER Corrugated Paper 14,555,197 6,820,790 11,021,246
PAPER Toilet Roll 6,020,365 24,480,244 15,937,693
PAPER Paper Label 112 52 80
PAPER Note book/Account 1,051,604 499,751 658,290
PRINTING Printing 22,844,937 11,432,525 15,463,461
PRINTING Note book/Account 10,907,027 28,230,100 37,722,760
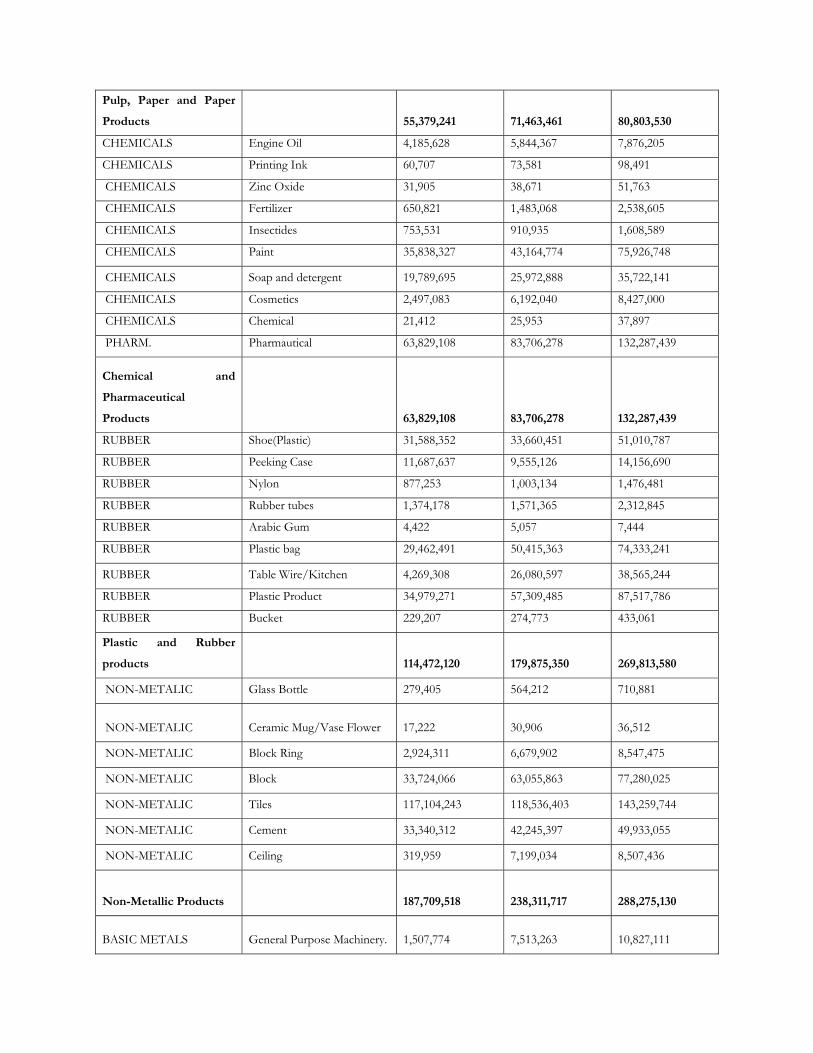
Pulp, Paper and Paper
Products 55,379,241 71,463,461 80,803,530
CHEMICALS Engine Oil 4,185,628 5,844,367 7,876,205
CHEMICALS Printing Ink 60,707 73,581 98,491
CHEMICALS Zinc Oxide 31,905 38,671 51,763
CHEMICALS Fertilizer 650,821 1,483,068 2,538,605
CHEMICALS Insectides 753,531 910,935 1,608,589
CHEMICALS Paint 35,838,327 43,164,774 75,926,748
CHEMICALS Soap and detergent 19,789,695 25,972,888 35,722,141
CHEMICALS Cosmetics 2,497,083 6,192,040 8,427,000
CHEMICALS Chemical 21,412 25,953 37,897
PHARM. Pharmautical 63,829,108 83,706,278 132,287,439
Chemical and
Pharmaceutical
Products 63,829,108 83,706,278 132,287,439
RUBBER Shoe(Plastic) 31,588,352 33,660,451 51,010,787
RUBBER Peeking Case 11,687,637 9,555,126 14,156,690
RUBBER Nylon 877,253 1,003,134 1,476,481
RUBBER Rubber tubes 1,374,178 1,571,365 2,312,845
RUBBER Arabic Gum 4,422 5,057 7,444
RUBBER Plastic bag 29,462,491 50,415,363 74,333,241
RUBBER Table Wire/Kitchen 4,269,308 26,080,597 38,565,244
RUBBER Plastic Product 34,979,271 57,309,485 87,517,786
RUBBER Bucket 229,207 274,773 433,061
Plastic and Rubber
products 114,472,120 179,875,350 269,813,580
NON-METALIC Glass Bottle 279,405 564,212 710,881
NON-METALIC Ceramic Mug/Vase Flower 17,222 30,906 36,512
NON-METALIC Block Ring 2,924,311 6,679,902 8,547,475
NON-METALIC Block 33,724,066 63,055,863 77,280,025
NON-METALIC Tiles 117,104,243 118,536,403 143,259,744
NON-METALIC Cement 33,340,312 42,245,397 49,933,055
NON-METALIC Ceiling 319,959 7,199,034 8,507,436
Non-Metallic Products 187,709,518 238,311,717 288,275,130
BASIC METALS General Purpose Machinery. 1,507,774 7,513,263 10,827,111

FABRICATED Necklace 72,195 108,716 122,561
FABRICATED Aluminum Roofing 51,061,214 86,541,958 98,776,470
FABRICATED Metal door 19,564,751 34,158,739 39,231,536
FABRICATED Tank 632,553 1,394,870 1,577,816
FABRICATED Razor 615 1,076 1,226
FABRICATED Hoes/Cutlass 416,731 2,069,339 2,396,193
FABRICATED Metal box 413,163 717,358 854,255
FABRICATED Domestic Metal product 4,287 7,440 8,823
FABRICATED Domestic Metal product 26,589,190 44,977,355 53,532,877
Basic metal, Iron and
Steel 100,262,473 177,490,114 207,328,869
ELECTRICAL Wire Nail 2,546,258 405,907 391,322
ELECTRICAL Electrical wire 6,169,652 9,387,703 10,711,188
Electrical and
Electronics 8,715,910 9,793,610 11,102,510
MACHINERY Presser 23,828 42,764 64,550
MACHINERY Milling Machine 20,535 233,158 375,988
MACHINERY Bicycle 311,274 404,654 638,192
MOTOR VEH. Motor vehicle 16,426,440 14,802,115 720,133
MOTOR VEH. Spare parts 15,390 16,975 44,576
MOTOR VEH. Vehicle body 1,820,480 5,232,720 13,067,719
MOTOR VEH. Motor Cycle 7,120,853 12,051,265 30,092,231
O/TRANS. Spare parts 25,738,800 32,783,650 45,003,390
Motor Vehicles &
Assembly 25,738,800 32,783,650 45,003,390
OTHER MAN. Office Furniture 2,651,204 4,763,450 6,465,493
OTHER MAN. Cupboard/wardrobe 366,192 421,041 601,020
OTHER MAN. Furniture door/Window 103,699,492 121,372,634 170,839,595
OTHER MAN. Mattress 89,441,613 161,278,556 215,287,801
OTHER MAN. Biro/pen/pencil 196,158,501 287,835,680 393,193,909
Office Stationary plus
furniture 198,809,705 292,599,130 399,659,402
Other Manufacturing 392,317,002 575,671,360 786,387,818
TOTAL 6,845,678,589 8,171,906,385 9,824,517,186
Related Documents


