WATER RESOURCES PROFILE SERIES The Water Resources Profile Series synthesizes information on water resources, water quality, the water-related dimen- sions of climate change, and water governance and provides an overview of the most critical water resources challenges and stress factors within USAID Water for the World Act High Priority Countries. The profile includes: a summary of avail- able surface and groundwater resources; analysis of surface and groundwater availability and quality challenges related to water and land use practices; discussion of climate change risks; and synthesis of governance issues affecting water resources management institutions and service providers. Nigeria Water Resources Profile Overview Nigeria has a large endowment of freshwater resources (286,200 MCM) and 23 percent of this supply originates outside the country. Renewable water supply (1,499 m 3 /capita) is just below the Falkenmark Water Stress i threshold of 1,500 m 3 /capita due to Nigeria’s large population (210 million), however, withdrawals are low relative to supply (9.67 percent) and well below the SDG 6.4.2 water stress threshold. ii Water stress is generally highest in the north whereas water is abundant in the south. Flooding is the most serious and frequent natural disaster and threatens communities, livelihoods, and infrastructure. Poor land use planning and inadequate storm water management elevates flood risks in cities, especially Lagos, which is worsened by rising sea levels. Climate change will increase flood risks nationwide, especially in southern Nigeria. Water stress in northern Nigeria is increasing from rising municipal and irrigation water demand and declining groundwater levels. The recession of Lake Chad beyond Nigeria’s borders, desertification, and more frequent and intense drought due to climate change have compounded water stress. Increasing competition over land and water resources between pastoralists and farmers is also contributing to regional instability and conflict. Oil extraction and processing has caused widespread contamination of surface and groundwater in the Niger Delta. Over the last 50 years, hundreds of oil spills have destroyed coastal wetlands and mangroves, degraded agricultural lands, and created widespread public health crises. i The Falkenmark Water Stress Index measures water scarcity as the amount of renewable freshwater that is available for each person each year. A country is said to be experiencing water stress when water availability is below 1,700 m 3 per person per year; below 1,000 m 3 is considered water scarcity; and below 500 m 3 is absolute or severe water scarcity. ii SDG 6.4.2 measures water stress as the percentage of freshwater withdrawals against total renewable freshwater resources. The water stress thresholds are: no stress <25%, low 25%-50%, medium 50%-75%, high 75%-100%, and critical >100%. The Niger River is the most prominent Basin in Nigeria. The five Hydrological Areas that comprise the lower Niger Basin drain almost two-thirds of the country and account for about 60 percent of total runoff. The Niger Delta is the third largest in the world and features extensive mangrove coverage and biodiversity. Comprehensive water quality studies are lacking, which leads to uncertainty regarding the extent and severity of contamination from municipalities, industry, and natural sources. Most industrial and municipal waste is not treated. Industrial hubs in cities like Lagos and Kano pollute surface and groundwater with heavy metals. Naturally-occurring fluoride contamination affects groundwater in central and northern Nigeria. Limited coordination, funding, and low technical capacity impede effective water resources management and planning. Poor management of transboundary basins, including the Niger and Lake Chad Basins, drive water stress, affect hydropower generation, and in some cases, increase flood risks.

Welcome message from author
This document is posted to help you gain knowledge. Please leave a comment to let me know what you think about it! Share it to your friends and learn new things together.
Transcript

WATER RESOURCES PROFILE SERIESThe Water Resources Profile Series synthesizes information on water resources, water quality, the water-related dimen-sions of climate change, and water governance and provides an overview of the most critical water resources challenges and stress factors within USAID Water for the World Act High Priority Countries. The profile includes: a summary of avail-able surface and groundwater resources; analysis of surface and groundwater availability and quality challenges related to water and land use practices; discussion of climate change risks; and synthesis of governance issues affecting water resources management institutions and service providers.
Nigeria Water Resources Profile Overview
Nigeria has a large endowment of freshwater resources (286,200 MCM) and 23 percent of this supply originates outside the country. Renewable water supply (1,499 m3/capita) is just below the Falkenmark Water Stressi
threshold of 1,500 m3/capita due to Nigeria’s large population (210 million), however, withdrawals are low relative to supply (9.67 percent) and well below the SDG 6.4.2 water stress threshold.ii Water stress is generally highest in the north whereas water is abundant in the south.
Flooding is the most serious and frequent natural disaster and threatens communities, livelihoods, and infrastructure. Poor land use planning and inadequate storm water management elevates flood risks in cities, especially Lagos, which is worsened by rising sea levels. Climate change will increase flood risks nationwide, especially in southern Nigeria.
Water stress in northern Nigeria is increasing from rising municipal and irrigation water demand and declining groundwater levels. The recession of Lake Chad beyond Nigeria’s borders, desertification, and more frequent and intense drought due to climate change have compounded water stress. Increasing competition over land and water resources between pastoralists and farmers is also contributing to regional instability and conflict.
Oil extraction and processing has caused widespread contamination of surface and groundwater in the Niger Delta. Over the last 50 years, hundreds of oil spills have destroyed coastal wetlands and mangroves, degraded agricultural lands, and created widespread public health crises.
iThe Falkenmark Water Stress Index measures water scarcity as the amount of renewable freshwater that is available for each person each year. A country is said to be experiencing water stress when water availability is below 1,700 m3 per person per year; below 1,000 m3 is considered water scarcity; and below 500 m3 is absolute or severe water scarcity. iiSDG 6.4.2 measures water stress as the percentage of freshwater withdrawals against total renewable freshwater resources. The water stress thresholds are: no stress <25%, low 25%-50%, medium 50%-75%, high 75%-100%, and critical >100%.
The Niger River is the most prominent Basin in Nigeria. The five Hydrological Areas that comprise the lower Niger Basin drain almost two-thirds of the country and account for about 60 percent of total runoff. The Niger Delta is the third largest in the world and features extensive mangrove coverage and biodiversity.
Comprehensive water quality studies are lacking, which leads to uncertainty regarding the extent and severity of contamination from municipalities, industry, and natural sources. Most industrial and municipal waste is not treated. Industrial hubs in cities like Lagos and Kano pollute surface and groundwater with heavy metals. Naturally-occurring fluoride contamination affects groundwater in central and northern Nigeria.
Limited coordination, funding, and low technical capacity impede effective water resources management and planning. Poor management of transboundary basins, including the Niger and Lake Chad Basins, drive water stress, affect hydropower generation, and in some cases, increase flood risks.
Water Resources Availability
2
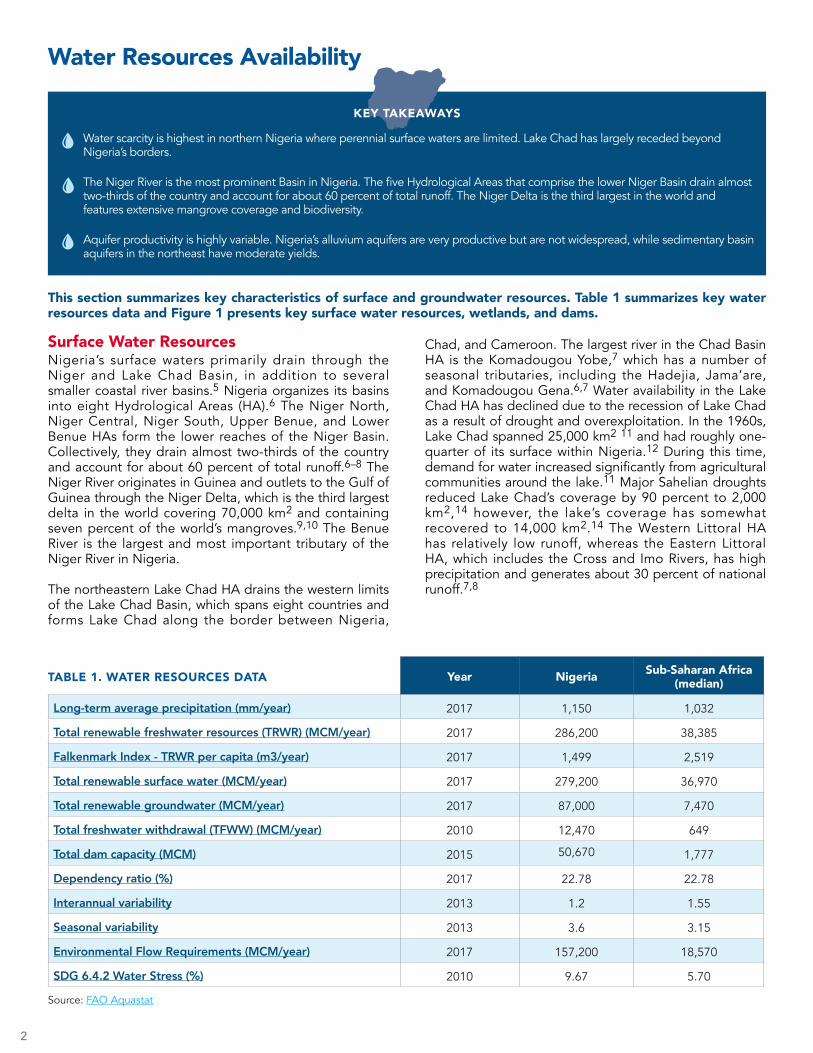
Year Nigeria Sub-Saharan Africa (median)
Long-term average precipitation (mm/year) 2017 1,150 1,032
Total renewable freshwater resources (TRWR) (MCM/year) 2017 286,200 38,385
Falkenmark Index - TRWR per capita (m3/year) 2017 1,499 2,519
Total renewable surface water (MCM/year) 2017 279,200 36,970
Total renewable groundwater (MCM/year) 2017 87,000 7,470
Total freshwater withdrawal (TFWW) (MCM/year) 2010 12,470 649
Total dam capacity (MCM) 2015 50,670 1,777
Dependency ratio (%) 2017 22.78 22.78
Interannual variability 2013 1.2 1.55
Seasonal variability 2013 3.6 3.15
Environmental Flow Requirements (MCM/year) 2017 157,200 18,570
SDG 6.4.2 Water Stress (%) 2010 9.67 5.70
TABLE 1. WATER RESOURCES DATA
Source: FAO Aquastat
This section summarizes key characteristics of surface and groundwater resources. Table 1 summarizes key water resources data and Figure 1 presents key surface water resources, wetlands, and dams.
Surface Water ResourcesNigeria’s surface waters primarily drain through the Niger and Lake Chad Basin, in addition to several smaller coastal river basins.5 Nigeria organizes its basins into eight Hydrological Areas (HA).6 The Niger North, Niger Central, Niger South, Upper Benue, and Lower Benue HAs form the lower reaches of the Niger Basin. Collectively, they drain almost two-thirds of the country and account for about 60 percent of total runoff.6–8 The Niger River originates in Guinea and outlets to the Gulf of Guinea through the Niger Delta, which is the third largest delta in the world covering 70,000 km2 and containing seven percent of the world’s mangroves.9,10 The Benue River is the largest and most important tributary of the Niger River in Nigeria.
The northeastern Lake Chad HA drains the western limits of the Lake Chad Basin, which spans eight countries and forms Lake Chad along the border between Nigeria,
KEY TAKEAWAYS
Water scarcity is highest in northern Nigeria where perennial surface waters are limited. Lake Chad has largely receded beyond Nigeria’s borders.
The Niger River is the most prominent Basin in Nigeria. The five Hydrological Areas that comprise the lower Niger Basin drain almost two-thirds of the country and account for about 60 percent of total runoff. The Niger Delta is the third largest in the world and features extensive mangrove coverage and biodiversity.
Aquifer productivity is highly variable. Nigeria’s alluvium aquifers are very productive but are not widespread, while sedimentary basin aquifers in the northeast have moderate yields.
Chad, and Cameroon. The largest river in the Chad Basin HA is the Komadougou Yobe,7 which has a number of seasonal tributaries, including the Hadejia, Jama’are, and Komadougou Gena.6,7 Water availability in the Lake Chad HA has declined due to the recession of Lake Chad as a result of drought and overexploitation. In the 1960s, Lake Chad spanned 25,000 km2 11 and had roughly one-quarter of its surface within Nigeria.12 During this time, demand for water increased significantly from agricultural communities around the lake.11 Major Sahelian droughts reduced Lake Chad’s coverage by 90 percent to 2,000 km2,14 however, the lake’s coverage has somewhat recovered to 14,000 km2.14 The Western Littoral HA has relatively low runoff, whereas the Eastern Littoral HA, which includes the Cross and Imo Rivers, has high precipitation and generates about 30 percent of national runoff.7,8

3
FIGURE 1: MAP OF WATER RESOURCES
Groundwater Resources Most of Nigeria’s groundwater exists in basement complexes or sedimentary basins.17,18 Al luvium aquifers are less common but are the most productive groundwater systems. Groundwater recharge rates are lowest in the northwest (estimates from 4-28mm/year) and highest in the southeast (estimates from 281-1,047mm/year).17 Basement complexes cover 60 percent of Nigeria7 and are located throughout the southwest, in the central region, and along the eastern border with Cameroon. Most of these groundwater systems have shallow depths to the water table (5-15m) and low to moderate well yields.18 Sedimentary aquifers underlay
most of the northeast and northwest, and along the upper reaches of the Niger and Benue Rivers. The best yielding aquifers are in the northwest, northeast, and in the central region. Aquifers in the northern sedimentary basin typically have both confined and unconfined layers. Unconfined aquifer depths range between 15-75m in the northwest and 30-100m in the northeast.18 Alluvium aquifers broadly follow the paths of the Niger and Benue Rivers in relatively narrow bands, and underlie most of the Niger Delta.17 In these aquifers, groundwater can be easily accessed at shallowest depths (0-10m) with high yields.18
4
Surface Water Outlook
This section describes key sources of demand and uses of surface water, and associated challenges stemming from water availability and water quality challenges.
Agriculture (44 percent), municipal/domestic (40 percent), and industry (16 percent) are the principal sources of demand for freshwater and approximately 41 percent of all freshwater abstractions are from surface water. Nigeria’s 2013 National Water Resources Master plan projects that total surface water demand will more than triple by 2030. The largest increases will be in the Upper Benue, Lake Chad, and Western Littoral HAs due to growing demand for irrigation.20
Municipal demand is concentrated in the Niger Central and Western Littoral HAs whereas agricultural demand is concentrated in the Lake Chad and Niger North HAs.20
Nigeria also has over 200 dams.5 The Kainji, Shiroro, and Jebba Dams in the Niger Basin account for 70 percent of Nigeria’s total dam storage capacity.19
Seasonal surface water availability and drought in northern Nigeria increase vulnerability to ecosystem degradation and regional instability. Around 70 percent of all livestock is in northeastern Nigeria. Major droughts in the 1970s killed 13 percent of the region’s livestock, and cut the agriculture sector’s contribution to the GDP by more than half.21–24 Key dams on the Hadejia and Komadugu-Yobe River have significantly reduced the coverage of key wetlands, especially Hadejia-Nguru wetlands and reduced Lake Chad’s coverage and surrounding pastures.12,25,26
Lake Chad has high inter-annual and inter-seasonal rainfall variability. As a shallow lake, its coverage fluctuates greatly with rainfall patterns, affecting the extent and viability of pastures, croplands, and fisheries.11,26 High poverty rates and unequal access to land and water resources amplify existing socio-economic tensions among ethnic and religious groups.24,30,31 Food and water insecurity in northern Nigeria have been important factors in helping Boko Haram recruit fighters27 while violent clashes between pastoralists and farmers are partly attributed to water scarcity and desertification.28,29
Lack of infrastructure and poor urban planning accentuate flood risks throughout Nigeria and especially in Lagos and coastal cities. Approximately 30 percent of Local Government Areas (LGAs) have medium to high flood risk. The highest risks are around the Niger Delta, along the Niger, Benue, and Cross Rivers, and in Lagos State.33 Poor urban planning and enforcement of existing zoning regulations has led to uncontrolled development in coastal zones and flood plains.4 Lagos City is one of the largest and fastest growing cities in the world, and over two-thirds of its population reside in low lying flood plains.34,35 Storm water infrastructure and drainage systems cover less than half of Lagos and most are not maintained. Further, many drainage systems are uncovered channels and are commonly used as dump sites for solid waste, which increases surface water contamination and health risks during floods.4
Untreated industrial and municipal effluent, as well as agricultural and municipal runoff contaminate surface waters and create risks to public health and ecosystems. Less than 10 percent of industrial effluent is treated. Contamination from heavy metal pollution, mostly lead and chromium, in addition to oil and grease, high turbidity, and high biological/chemical oxygen demand (BOD/COD) are widespread.8 High BOD/COD levels can kill aquatic species and disrupt ecosystems. Water quality risks from industry are especially high in the southwest near the Lagos38,39 and in the north near Kano.40 Apart from Abuja and Lagos, functional wastewater treatment plants are limited.37 Additionally, excess fertilizer use, poor land use planning, and dams are increasing eutrophication in rivers, lakes, and reservoirs, destroying ecosystems and inhibiting recreational use of surface waters.43,44 Algal blooms have been observed in Rumuji Lake in the Niger Delta region.45
KEY TAKEAWAYS
Water stress is highest in northeastern Nigeria and driven by growing surface water demand for irrigation and municipal use. Only 41 percent of freshwater abstractions are from surface water. Cropland expansion and key dams in the northeast reduce wetland and viable pasturage for herders, harm key ecosystems, and exacerbate regional security challenges from increased competition over water and land.
Southern Nigeria is vulnerable to flooding, especially in Lagos. Flood risks are compounded by poor urban planning and limited storm water management infrastructure.
Lack of industrial and municipal waste treatment has led to high concentrations of heavy metals and biological/chemical oxygen demand (BOD/COD), threatening public health and destroying ecosystems.
Oil spills have severely degraded the Niger Delta and threaten public health. Contaminants persist in the environment for decades and have decreased fishery production and aquatic biodiversity.
55
Oil spills and untreated effluent from oil refineries have severely degraded the Niger Delta. Nigeria is the 10th largest oil producer in the world46 due to the rich oil deposits in the Niger Delta.47 Oil spills have discharged an estimated 13 million barrels of crude oil into the environment30 and destroyed coastal wetlands and mangroves, degraded agricultural lands, and created widespread public health crises. Oil spills have contributed to high concentrations of heavy metals such as cadmium, chromium, and lead in numerous watercourses, particularly in Rivers and Delta States. Pollution from cadmium and lead is the most severe, with their maximum concentrations found over 100
times the WHO guideline values for drinking water.48,49
While environmental and social impact assessments are required in Nigeria, local compliance and enforcement of environmental regulations are often lacking.47 The impacts of these spills threaten public health and can devastate ecosystems and biodiversity. Fishery production and populations of key aquatic organisms are declining in the Niger Delta due to oil spillage.50,51
Despite cleanup efforts, contaminants from an oil spill from over 40 years ago have persisted in the Ogoniland area, demonstrating the long-term consequences that these events can have.52
Groundwater Outlook
This section describes key sources of demand and uses of groundwater, and associated challenges stemming from water availability and water quality challenges.
KEY TAKEAWAYS
Groundwater is the main source of drinking water for rural and urban populations and is the main source of irrigation demand through small-scale, traditional systems (fadama). Declining groundwater levels in the north and northeast from over-abstraction and lower recharge may inhibit water access for vulnerable populations.
Pollution is a major issue throughout Nigeria, but risks are highest along the coast due to oil spills and saline intrusion from over-pumping. Untreated industrial and municipal waste from large industrial centers such as Lagos and Kano cause high concentrations of toxic heavy metals.
Geogenic contaminants such as fluoride and some heavy metals present serious health risks, but comprehensive studies are needed to better understand their extent and severity.
More than half of all freshwater abstractions are from groundwater, mostly for irrigation and domestic use. Around three-quarters of all irrigation withdrawals are from groundwater through traditional, dry-season flood plain irrigation known as fadama.19 Groundwater is also the main domestic water source for approximately 60 percent of the population in rural and urban areas.53
However, data on groundwater use and sustainability is limited and requires more systematic monitoring.54
Groundwater levels in northern and northeastern Nigeria are declining from over-abstraction and insufficient recharge attributed to urbanization and wetland degradation from dams. Average water levels in shallow aquifers in the northeast have declined over 13 meters.55 Groundwater is generally available at lower depths, however, deeper wells are more expensive.17,24
Recharge rates have declined significantly as dams have reduced the extent of wet season inundation of flood plains.12 Research and systematic monitoring of groundwater levels throughout southern Nigeria is lacking, although there is some indication that over-pumping is contributing to subsidence (land sinking) in coastal cities such as Lagos.58,59 Additionally, groundwater demand is high in the northern Kano region, which is home to one-third of the total population.56
Despite above average precipitation in recent years, groundwater levels across the Kano metropolitan area
are declining, largely due to over-abstraction and urbanization which reduce recharge.60
High concentrations of fluoride and heavy metals from anthropogenic and geogenic sources threaten public health. Naturally high fluoride levels contribute to widespread fluorosis in some parts of Nigeria.54,61
Fluoride concentrations are higher in central and northern Nigeria, with one national survey showing that 30 percent of groundwater sources exceed the WHO guideline value for drinking water for fluoride.62 Heavy metals such as lead, cadmium, arsenic, and selenium have been detected in groundwater in the southwestern city of Ibadan, although contamination from antimony is highest and most widespread and likely derives from natural and anthropogenic sources.63,64 Similarly, lead pollution from industrial and municipal waste is widespread in shallow and deep wells in Lagos.65 Additionally, inadequate sanitation systems in many cities, including Lagos, have led to high concentrations of E. Coli and nitrates in shallow wells.66
Saltwater intrusion into aquifers along the southern coast has increased due to overexploitation of groundwater. Groundwater resources used for drinking supply in the coastal area of Lagos and in communities in Delta State and in Ondo State have been affected by saltwater intrusion.67,68 Groundwater monitoring wells
6
are lacking in Lagos, although some studies have found saline intrusion in wells as far as 3km inland.69 Rising sea levels from climate change and land subsidence in coastal cities will increase saline intrusion.
Oil spills in the Niger Delta degrade groundwater quality and pollute water points with carcinogenic hydrocarbons. Groundwater sampled in areas with a
history of oil spillage have shown high turbidity, low pH, and low dissolved oxygen at levels that may not be suitable for human consumption.71 In Ogoniland, one water quality study close to a oil pipeline found an 8 cm layer of refined oil floating on the groundwater table which serves community wells.52
Water Resources and Climate
This section covers climate variability and climate change, their impacts on water availability and water quality, and the risks they pose to local communities and their economies.
KEY TAKEAWAYS
Precipitation will increase in southern Nigeria and decrease in northern Nigeria. Rainfall intensity will increase nationwide, which will increase the impacts of flooding. Rising sea levels will also impact coastal cities, including Lagos.
Rainfall variability, droughts, and desertification are increasing, particularly in the northern Sahelian zone. This will increase competition over increasingly scarce water resources and could increase regional security challenges.
Average annual precipitation is 1,062 mm, with precipitation highest in the south and lowest in the north. Most of Nigeria experiences distinct wet and dry seasons,72 which causes high seasonal variability in water supply (see Table 1). The wet season is shorter (May-September) in the north compared to the south where it lasts at least 9 months (March-November).
Climate change has decreased total rainfall, especially in northern Nigeria. Increasing temperatures and evaporation will further deplete water availability. Climate change has caused average temperatures to increase by 0.8°C between 1960 and 2006, with a particularly steep increase since 1980,72 while annual precipitation has decreased.73–75 Between 1971 and 2012, heat waves have increased in the Guinea and Sahel regions.76 Dry seasons have become longer and wet season rainfall variability has increased.77,78 Droughts are also more frequent and affect larger areas,79 while extreme flooding has increased. In northern Nigeria, rainfall has declined by 25 percent in the past 30 years.80 Climate change is projected to further increase temperatures by 1.9-3.7°C, while total precipitation may increase slightly. Total water availability is projected to decrease due to increased evaporation.81 Sea levels may rise between 1.5-3 feet, potentially submerging more than 11,000 square miles, where many of the most densely populated cities and towns are located, including Lagos.30
Flooding is the most severe and common natural disaster, particularly in the south. More intense rainfall will worsen flooding. An estimated 20 percent of the population face flood risks.82 Flood risks are highest in riverine communities in the downstream reaches of the Niger, Benue, and Cross Rivers, and Lagos State.33 Lower basin states throughout southern Nigeria have experienced a 20 percent increase in recorded volumes of torrential rains in the past 40 years.83 This has accelerated gully erosion in the southeast where many river banks have collapsed.39 In 2012, widespread flooding affected almost every Nigerian state, damaging or destroying 600,000 houses, displacing over 2 million people, and causing almost USD $17 billion in losses to the economy.84,85
Increasing rainfall variability and evaporation increase drought risks and likelihood of desertification in the north. Climate change will continue to lower rainfall in northern Nigeria and increase the frequency of severe droughts.80,81 Desertification will worsen these risks. In addition to drought, desertification is driven by poor water resources management and land use changes, overgrazing, and deforestation. Between 50-75 percent of the land in the 11 northernmost states are impacted by desertification. Desertification is progressing southward at a rate of 0.6 kilometers per year,87 and has contributed to the loss of nearly half the vegetation in the northernmost states between 1984 and 2016.88 A growing number of sand dunes have threatened oases and buried water points,89
and significantly reduced wetland coverage.68

7
FIGURE 2: DROUGHT RISK FIGURE 3. RIVERINE FLOOD RISK
Water Policy and Governance
This section provides an overview of key policies, institutions, and management challenges. Key laws, policies, and plans are summarized in Table 2 and the roles and responsibilities of select transboundary, national, and sub-national water management entities are summarized in Table 3.
KEY TAKEAWAYS
Key water management entities do not align with hydrological boundaries and have limited coordination in basin planning and the design and operation of hydraulic infrastructure. Low technical capacity and funding also impede water management efforts.
Limited management of transboundary basins reduces water availability for hydropower generation and pastures for grazing in several basins.
Surface and groundwater quality monitoring are not comprehensive, inhibiting informed decision-making and basin management.
TABLE 2. KEY LAWS, POLICIES, AND PLANS
Name Year Purpose
National Water Resources Policy
2016 Originally drafted in 2004, the National Water Policy was approved in 2016. The policy establishes that all water is a national asset and defines planning and development through an integrated water resources management framework.
Water Resources Master Plan 2013 Assesses water resources supply and demand from2010 to 2030 and defines basin development priorities and risks.
Minerals and Mining Act 2007 Grants Ministry of Mines and Steel Development (MMSD) water use permitting rights when they concern mining exploration and operation.
The National Inland Waterways Authority (NIWA) Act
1997 Established NIWA and defines its responsibilities towards river navigability, riverbank stabilization, and dam development.
Water Resources Act 1993 Established the Federal Ministry of Water Resources as the lead institution in charge of water resources development, licensing, planning, and use.
River Basins Development Authority Act
1990 Established 12 River Basin Development Agencies (RBDA) that are responsible for developing surface and groundwater resources, prioritizing water use for domestic and agricultural purposes. The act was originally enacted in 1976 but has been revised several times.
8
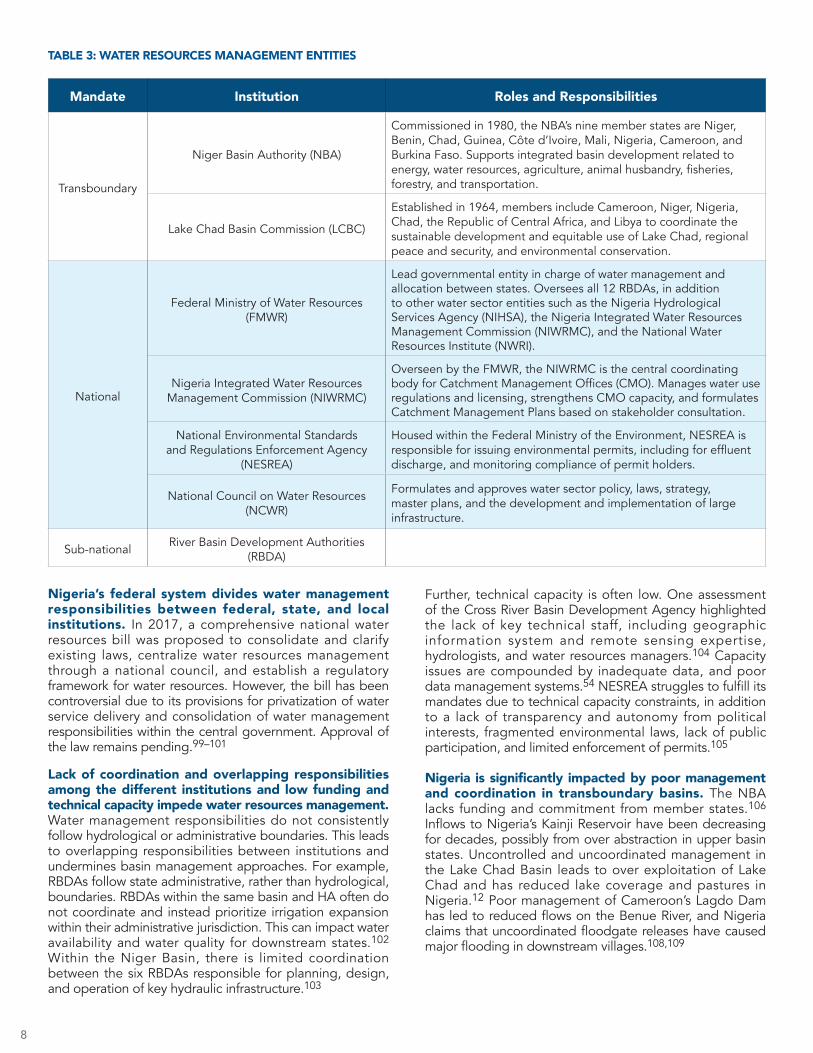
Mandate Institution Roles and Responsibilities
Transboundary
Niger Basin Authority (NBA)
Commissioned in 1980, the NBA’s nine member states are Niger, Benin, Chad, Guinea, Côte d’Ivoire, Mali, Nigeria, Cameroon, and Burkina Faso. Supports integrated basin development related to energy, water resources, agriculture, animal husbandry, fisheries, forestry, and transportation.
Lake Chad Basin Commission (LCBC)
Established in 1964, members include Cameroon, Niger, Nigeria, Chad, the Republic of Central Africa, and Libya to coordinate the sustainable development and equitable use of Lake Chad, regional peace and security, and environmental conservation.
National
Federal Ministry of Water Resources (FMWR)
Lead governmental entity in charge of water management and allocation between states. Oversees all 12 RBDAs, in addition to other water sector entities such as the Nigeria Hydrological Services Agency (NIHSA), the Nigeria Integrated Water Resources Management Commission (NIWRMC), and the National Water Resources Institute (NWRI).
Nigeria Integrated Water Resources Management Commission (NIWRMC)
Overseen by the FMWR, the NIWRMC is the central coordinating body for Catchment Management Offices (CMO). Manages water use regulations and licensing, strengthens CMO capacity, and formulates Catchment Management Plans based on stakeholder consultation.
National Environmental Standards and Regulations Enforcement Agency
(NESREA)
Housed within the Federal Ministry of the Environment, NESREA is responsible for issuing environmental permits, including for effluent discharge, and monitoring compliance of permit holders.
National Council on Water Resources (NCWR)
Formulates and approves water sector policy, laws, strategy, master plans, and the development and implementation of large infrastructure.
Sub-national River Basin Development Authorities (RBDA)
TABLE 3: WATER RESOURCES MANAGEMENT ENTITIES
Nigeria’s federal system divides water management responsibilities between federal, state, and local institutions. In 2017, a comprehensive national water resources bill was proposed to consolidate and clarify existing laws, centralize water resources management through a national council, and establish a regulatory framework for water resources. However, the bill has been controversial due to its provisions for privatization of water service delivery and consolidation of water management responsibilities within the central government. Approval of the law remains pending.99–101
Lack of coordination and overlapping responsibilities among the different institutions and low funding and technical capacity impede water resources management. Water management responsibilities do not consistently follow hydrological or administrative boundaries. This leads to overlapping responsibilities between institutions and undermines basin management approaches. For example, RBDAs follow state administrative, rather than hydrological, boundaries. RBDAs within the same basin and HA often do not coordinate and instead prioritize irrigation expansion within their administrative jurisdiction. This can impact water availability and water quality for downstream states.102
Within the Niger Basin, there is limited coordination between the six RBDAs responsible for planning, design, and operation of key hydraulic infrastructure.103
Further, technical capacity is often low. One assessment of the Cross River Basin Development Agency highlighted the lack of key technical staff, including geographic information system and remote sensing expertise, hydrologists, and water resources managers.104 Capacity issues are compounded by inadequate data, and poor data management systems.54 NESREA struggles to fulfill its mandates due to technical capacity constraints, in addition to a lack of transparency and autonomy from political interests, fragmented environmental laws, lack of public participation, and limited enforcement of permits.105
Nigeria is significantly impacted by poor management and coordination in transboundary basins. The NBA lacks funding and commitment from member states.106
Inflows to Nigeria’s Kainji Reservoir have been decreasing for decades, possibly from over abstraction in upper basin states. Uncontrolled and uncoordinated management in the Lake Chad Basin leads to over exploitation of Lake Chad and has reduced lake coverage and pastures in Nigeria.12 Poor management of Cameroon’s Lagdo Dam has led to reduced flows on the Benue River, and Nigeria claims that uncoordinated floodgate releases have caused major flooding in downstream villages.108,109
9
and the FMWR (through its Department of Water Quality Control and Sanitation) are responsible for monitoring drinking water quality, but they both lack funding and technical capacity, and there is a lack of coordination.110–112 Most surface and groundwater quality studies have been carried out by researchers at universities, research institutes, and government institutes.38
References (1) FAO. Aquastat Main Database http://www.fao.org/nr/water/aquastat/data/query/results.html (accessed 2020 -07 -08).(2) World Population Review. Africa Population 2021 https://worldpopulationreview.com/continents/africa-population (accessed 2021 -04 -26).(3) FAO; UN Water. Clean Water and Sanitation - Progress on Level of Water Stress; 2018.(4) Lucas, B. Urban Flood Risks, Impacts, and Management in Nigeria; Knowledge, evidence and learning for development, 2021.(5) Adelodun, B.; Choi, K.-S. A Review of the Evaluation of Irrigation Practice in Nigeria: Past, Present and Future Prospects. Afr. J. Agric. Res. 2018, 13 (40), 2087–2097.(6) Federal Ministry of Water Resources. National Water Resources Policy; 2016.(7) FAO. AQUASTAT Country Profile - Nigeria; Rome, Italy, 2016.(8) Idu, A. J. Threats to Water Resources Development in Nigeria. J. Geol. Geophys. 2015, 4 (3). https://doi.org/10.4172/2329-6755.1000205.(9) FAO. The State of the World’s Forests 2020. Forests, Biodiversity and People; Rome, 2020. https://doi.org/10.4060/ca8642en.(10) Lindén, O.; Pålsson, J. Oil Contamination in Ogoniland, Niger Delta. Ambio 2013, 42 (6), 685–701. https://doi.org/10.1007/s13280-013-0412-8.(11) Vivekananda, J.; Wall, M.; Sylvestre, F.; Nagarajan, C.; Brown, O. Shoring Up Stability: Addressing Climate and Fragility Risks in the Lake Chad Region; Berlin, 2019.(12) Joint Environmental Audit. Joint Environmental Audit on the Drying up of Lake Chad; 2015.(13) FAO. AQUASTAT - FAO’s Global Information System on Water and Agriculture http://www.fao.org/aquastat/en/databases/dams (accessed 2020 -08 -19).(14) Pham-Duc, B.; Sylvestre, F.; Papa, F.; Frappart, F.; Bouchez, C.; Cretaux, J.-F. The Lake Chad Hydrology under Current Climate Change. Sci. Rep. 2020, 10 (5498).(15) Usigbe, L. Drying Lake Chad Basin gives rise to crisis https://www.un.org/africarenewal/magazine/december-2019-march-2020/drying-lake-chad- basin-gives-rise-crisis (accessed 2021 -05 -04).(16) Ross, W. Lake Chad: Can the vanishing lake be saved? https://www.bbc.com/news/world-africa-43500314 (accessed 2021 -05 -04).(17) Adelana, S. M. A. Nigeria. In Groundwater Availability and Use in Subsaharan Africa: A Review of 15 Countries; Pavelic, P., Giordano, M., Keraita, B., Ramesh, V., Rao, T., Eds.; International Water Management Institute (IWMI): Colombo, Sri Lanka, 2012; p 274.(18) Earthwise. Hydrogeology of Nigeria http://earthwise.bgs.ac.uk/index.php/Hydrogeology_of_Nigeria#:~:text=Nigeria has the largest population and the largest economy in Africa.&text=Nigeria has extensive surface water,domestic%2C agricultural and industrial supplies. (accessed 2021 -04 -28).(19) FMWR; JICA. Volume 6 National Water Resources Master Plan 2013 Official Dissemination Version. In National Water Resources Master Plan 2013; 2014; Vol. 6.(20) Japan International Cooperation Agency (JICA). The Project for Review and Update of Nigeria National Water Resources Master Plan: Volume 4; 2014.(21) Eze, J. N. Drought Occurrences and Its Implications on the Households in Yobe State, Nigeria. Geoenvironmental Disasters 2018, 5 (18).(22) Hassan, A. G.; Fullen, M. A.; Oloke, D. Problems of Drought and Its Management in Yobe State, Nigeria. Weather and Climate Extremes 2019, 23. https://doi.org/10.1016/j.wace.2019.100192.(23) Federal Ministry of Environment. National Drought Plan; Government of Nigeria, 2018.(24) Adeyeye, P. Nigeria’s Poverty Crisis and the Nigerian Living Standards Survey https://www.dataphyte.com/development/nigerias-poverty- crisis-and- the-nigerian-living-standards-survey/#:~:text=The%20report%20also%20revealed%20that,the%20most%20poverty%20 headcount%20rate.&text=The%20average%20poverty%20headcount%20rate,South%20West%20(12.12%20percent). (accessed 2021 -07 -13).(25) World Wildlife Fund. Lake Chad Flooded Savanna. World Wildlife Fund. June 2020.(26) Pearce, F. When the Rivers Run Dry: The Global Water Crisis and How to Solve It; Granta Books: London, 2018.(27) Piesse, M. Boko Haram: Exacerbating and Benefiting From Food and Water Insecurity in the Lake Chad Basin; 2017.(28) Muhammed, I.; Ismaila, A. B.; Bibi, U. M. An Assessment of Farmer-Pastoralist Conflict in Nigeria Using GIS. Int. J. Eng. Sci. Invent. 2015, 4 (7), 23–33.(29) Audu, S. D. Freshwater Scarcity: A Threat to Peaceful Co-Existence between Farmers and Pastoralists in Northern Nigeria. Int. J. Dev. Sustain. 2014,3,242–251.(30) King, M. Water Stress, Instability, and Violent Extremism in Nigeria. In Water, Security, and U.S. Foreign Policy; Reed, D., Ed.; Routledge: New York, 2017.(31) Anderson, Z. K. Water Scarcity and Violent Conflict in Nigeria, Naval Postgraduate School, 2019.(32) International Crisis Group. Herders against Farmers: Nigeria’s Expanding Deadly Conflict; 2017.(33) Njoku, C.; Efiong, J.; Ayara, N.-A. N. A Geospatial Expose of Flood-Risk and Vulnerable Areas in Nigeria. Int. J. Appl. Geospatial Res. 2020, 11 (3), 1–24. http://dx.doi.org/10.4018/IJAGR.20200701.oa1.(34) Stark, J.; Terasawa, K. Climate Change and Conflict in West African Cities: A Policy Brief on Findings From Lagos, Nigeria and Accra, Ghana; USAID, 2013.(35) Raji, A.; Olufemi, A. P.; Shakirudeen, O. Multicriteria Flood Risk Analysis of Lower Ogun River Basin. Journal of Environment and Earth Science 2014, 4 (13).(36) Kanu, I.; Achi, O. Industrial Effluents and Their Impact on Water Quality of Receiving Rivers in Nigeria. J. Appl. Technol. Environ. Sanit. 2011, 1, 75–86.(37) Kayode, O. F.; Luethi, C.; Rene, E. R. Management Recommendations for Improving Decentralized Wastewater Treatment by the Food and Beverage Industries in Nigeria. Environments 2018, 5 (3). https://doi.org/10.3390/environments5030041.(38) Taiwo, A. M.; Olujimi, O. O.; Bamgbose, O.; Arowolo, T. A. Surface Water Quality Monitoring in Nigeria: Situational Analysis and Future Management Strategy. In Water Quality Monitoring and Assessment; Voudouris, K., Voutsa, D., Eds.; InTech: Rijeka, Croatia, 2012.
Water Quality MonitoringSeveral government agencies have distinct mandates for water quality monitoring, but surface and groundwater are not comprehensively or consistently monitored. CMOs are broadly responsible for monitoring water quality within their respective HAs and maintaining databases for all hydrological and hydrogeological information.92 The Federal Ministry of Health (FMoH)

(39) Lohdip, Y. N.; Gongden, J. J. Nigerian Water Bodies In Jeopardy: The Need For Sustainable Management And Security. In Water REsources Management VII; Brebbia, C. A., Ed.; WIT Press, 2013; p 171:11-22. https://doi.org/10.2495/WRM130021.(40) Wakawa, R.; Kagbu, J. Impact Assessment of Effluent Discharge on Physico-Chemical Parameters and Some Heavy Metal Concentrations in Surface Water of River Challawa Kano, Nigeria. Afr. J. Pure Appl. Chem. 2008, 2, 100–106.(41) Britannica. Kano. Nigeria https://www.britannica.com/place/Kano-Nigeria (accessed 2021 -05 -25).(42) Britannica. Lagos. Nigeria https://www.britannica.com/place/Lagos-Nigeria (accessed 2021 -05 -25).(43) Nweze, N. O.; Onyishi, U. E. Phycological Effects of Eutrophication with Fertilizers in Nike Lake, Nigeria. J. Water Resour. Prot. 2011, 3 (12), 856– 860. https://doi.org/10.4236/jwarp.2011.312095.(44) Erhunmwunse, N. O.; Dirisu, A. R.; Ogbeibu, A. E. Managing Eutrophication in Nigeria Inland Waters. J. Water Resour. Prot. 2013, No. 5, 743–746.(45) Megbo, B. C. Effects of Eutrophication on Fish Populations in the Vicinity of Rumuji Lake in the Niger Delta Region of Nigeria. Int. J. Sci. Eng. Res. 2010, 1 (1).(46) Nations Encyclopedia. Nigeria- Industry https://www.nationsencyclopedia.com/Africa/Nigeria-INDUSTRY.html#:~:text=Nigeria - Industry&text=Industry as a whole contributed,reserves of 22.5 billion barrels. (accessed 2021 -05 -17).(47) Imoobe, T.; Tanshi, I. Ecological Restoration of Oil Spill Sites in the Niger Delta, Nigeria. J. Sustain. Dev. Afr. 2009, 11 (2).(48) Nduka, J.; Orisakwe, O. Water-Quality Issues in the Niger Delta of Nigeria: A Look at Heavy Metal Levels and Some Physicochemical Properties. Environ. Sci. Pollut. Res. Int. 2011, 18, 237–246. https://doi.org/10.1007/s11356-010-0366-3.(49) WHO. Guidelines for Drinking-Water Quality: Fourth Edition Incorporating the First Addendum; WHO: Geneva, 2017.(50) Oguntade, O. R.; Oketoyi, O. T.; Ukenye, E. A.; Usman, B. A.; Adelke, M. T. Survey of the Present and Fast Disappearning Fish Species Along Two Rivers in the Niger Delta. J. Fish. Aquat. Sci. 2014, 9 (5), 352–358.(51) Osuagwu, E. S.; Olaifa, E. Effects of Oil Spills on Fish Production in the Niger Delta. PLoS One 2018. https://doi.org/10.1371/journal.pone.0205114.(52) UNEP. Environmental Assessment of Ogoniland; Nairobi, 2011.(53) Grönwall, J.; Mulenga, M.; Mcgranahan, G. Groundwater, Self-Supply and Poor Urban Dwellers A Review with Case Studies of Bangalore and Lusaka Human Settlements Working Paper Series Water and Sanitation -26; London, 2010.(54) Cobbing, J. Analysis of Groundwater Resource and Governance in Bangladesh, Ghana, India, Nepal and Nigeria; 2020.(55) Yusuf, A. K. Groundwater Resource Management Strategy in the Nigerian Sector of the Chad Basin. J. Nat. Sci. Res. 2015, 5 (14), 56–63.(56) Tukur, A. I.; Nabegu, A. B.; Umar, D. A.; Olofin, E. A.; Sulaiman, W. N. A. Groundwater Condition and Management in Kano Region, Northwestern Nigeria. Hydrology 2018, 5 (1).(57) Adamu, S.; Sadiq, H. M.; Kodomi, M. G.; Wulo, I. B. Groundwater Depletion in the Upper Aquifer of the Chad Formation, Chad Basin, North- Eastern Nigeria. Niger. J. Technol. 2020, 39 (2). http://dx.doi.org/10.4314/njt.v39i2.34.(58) Mahmud, M. U.; Yakubu, T. A.; Adewuyi, T. O.; Sousa, J. J.; Ruiz-Armenteros, M.; Bakon, M.; Lazecky, M.; Perissin, D. Subsidence Monitoring in the Coastal Region of Nigeria Using Multi Temporal Interferometric Synthetic Aperture Radar (MT-INSAR). In Proc. “Living Planet Symposium 2016”; Prague, 2016.(59) Novo, C. The weight of buildings contributes to the sinking of cities https://smartwatermagazine.com/news/smart-water-magazine/weight- buildings-contributes-sinking-cities (accessed 2021 -07 -13).(60) Abdulhamid, A.; Badamasi, M. M.; Mohammed, M. U. Dynamics of Rainfall Pattern and Groundwater Quantity in Kano Basement Complex: Evidence From Ground and Satellite Data. In Proceedings of the 1st International Conference on Drylands; 2014; pp 188–196.(61) Lar, U.; Dibal, H.; Krzysztof, S. Fluoride in Groundwater in Nigeria: Origin and Health Impact. Am. J. Environ. Prot. 2014, 3, 66–69. https://doi. org/10.11648/j.ajep.s.2014030602.19.(62) Malago, J. Fluoride Levels in Surface and Groundwater in Africa: A Review. Am. J. Water Sci. Eng. 2017, 3 (1). https://doi.org/10.11648/ j.ajwse.20170301.11.(63) Etim, E. U. Occurrence and Distribution of Arsenic, Antimony and Selenium in Shallow Groundwater Systems of Ibadan Metropolis, Southwestern Nigerian. J. Health Pollut. 2017, 7 (13), 32–41. https://doi.org/10.5696/2156-9614-7-13.32.(64) Ganiyu, S. A.; Oyadeyi, A. T.; Adeyemi, A. A. Assessment of Heavy Metals Contamination and Associated Risks in Shallow Groundwater Sources from Three Different Residential Areas within Ibadan Metropolis, Southwest Nigeria. Appl. Water Sci. 2021, 11 (81).(65) Yahaya, T. O.; Oladele, E. O.; Fatodu, I. A.; Abdulazeez, A.; Yeldu, Y. I. The Concentration and Health Risk Assessment of Heavy Metals and Microorganisms in the Groundwater of Lagos, Southwest Nigeria. J. Adv. Environ. Health Res. 2020, 8, 234–242. https://doi. org/10.22102/jaehr.245629.1183.(66) Healy, A.; Upton, K.; Capstick, S.; Bristow, G.; Tijani, M.; MacDonald, A.; Goni, I.; Bukar, Y.; Whitmarsh, L.; Theis, S. Domestic Groundwater Abstraction in Lagos, Nigeria: A Disjuncture in the Science-Policy-Practice Interface? Environmental Research Letters 2020, 15 (4).(67) Oteri, A. U.; Atolagbe, F. P. Saltwater Intrusion into Coastal Aquifers in Nigeria; Mérida, Yucatán, México, 2003.(68) Adepelumi, A. A.; Ako, B. D.; Ajayi, T. R.; Afolabi, O.; Omotoso, E. J. Delineation of Saltwater Intrusion into the Freshwater Aquifer of Lekki Peninsula, Lagos, Nigeria. Environ. Geol. 2009, 56 (5), 927–933. https://doi.org/10.1007/s00254-008-1194-3.(69) Aladejana, J. A.; Kalin, R. M.; Sentenac, P.; Hassan, I. Groundwater Quality Index as a Hydrochemical Tool for Monitoring Saltwater Intrusion into Coastal Freshwater Aquifer of Eastern Dahomey Basin, Southwestern Nigeria. Groundwater for Sustainable Development 2021, 13. https://doi.org/10.1016/j.gsd.2021.100568.(70) Ugwoha, E.; Omenogor, E. B. Effect of Oil Spillage on Groundwater Quality. J. Environ. Stud. 2017, 3 (1).(71) Nwachukwu, A. N.; Osuagwu, J. C. Effects of Oil Spillage on Groundwater Quality In Nigeria. Am. J. Eng. Res. 2014, 3 (6).(72) USAID. Climate Risk Profile: Nigeria, Fact Sheet; 2019.(73) Federal Ministry of Environment Special Climate Change Unit. National Adaptation Strategy and Plan of Action on Climate Change for Nigeria NASPA-CCN); 2011.(74) Butu, A. W.; Emeribe, C. N. Spatial Patterns of Climatic Variability and Water Budget over {Sudan} {Savannah} {Region} of {Nigeria}. Afr. J. Environ. Sci. Technol. 2019, 13 (21), 465–481. https://doi.org/10.5897/AJEST2019.2726.(75) World Bank Group. Nigeria. Historical https://climateknowledgeportal.worldbank.org/country/nigeria/climate-data-historical (accessed 2021 -07 -13).(76) Abatan, A. A.; Abiodun, B. J.; Lawal, K. A.; Gutowski, W. J. Trends in Extreme Temperature over Nigeria from Percentile-Based Threshold Indices. Int. J. Climatol. 2016, 36 (6), 2527–2540. https://doi.org/10.1002/joc.4510.(77) Enete, I. C. Impacts of Climate Change on Agricultural Production in Enugu State, Nigeria. In Journal of Earth Science & Climatic Change; OMICS International, 2014; Vol. 5, pp 1–3. https://doi.org/10.4172/2157-7617.1000234.(78) Elisha, I.; Sawa, B. A.; Lawrence, E. U. Evidence of Climate Change and Adaptation Strategies among Grain Farmers in Sokoto State, Nigeria. IOSR J. Environ. Sci. Toxicol. Food Technol. 2017, 11 (3), 1–7. http://dx.doi.org/10.9790/2402-1103020107.(79) Shiru, M. S.; Shahid, S.; Alias, N.; Chung, E.-S. Trend Analysis of Droughts during Crop Growing Seasons of Nigeria. Sustainability 2018, 10 (3), 871. https://doi.org/10.3390/su10030871.(80) Haider, H. Climate Change in Nigeria: Impacts and Responses; Knowledge, evidence and learning for development, 2019.(81) World Bank Group. Nigeria. Projections https://climateknowledgeportal.worldbank.org/country/nigeria/climate-data-projections (accessed 2021 -07 -13).
10

ABOUT THIS PROFILEThis profile was produced by USAID's Sustainable Water Partnership activity.
DISCLAIMERThe author’s views expressed in this publication do not necessarily reflect the views of the United States Agency for International Development or the United States Government
11
(82) Cirella, G.; Iyalomhe, F. O. Flooding Conceptual Review: Sustainability-Focalized Best Practices in Nigeria. Appl. Sci. 2018, 8 (9). https://www.mdpi. com/2076-3417/8/9/1558/htm#.(83) Federal Ministry of Environment. Third National Communication (TNC) of the Federal Republic of Nigeria under the United Nations Framework Convention on Climate Change (UNFCCC); 2020.(84) ReliefWeb. Nigeria: Floods - Jul 2012 https://reliefweb.int/disaster/fl-2012-000138-nga (accessed 2021 -04 -26).(85) Government of Nigeria. Nigeria. Post-Disaster Needs Assessment 2012 Floods; 2013.(86) Abaja, I. B.; Ati, O. F.; Iguisi, E. O.; Jidauna, G. . G. Droughts in the Sudano-Sahelian Ecological Zone of Nigeria: Implications for Agriculture and Water Resources Development. Glob. J. Hum. Soc. Sci. Geogr. Geo-Sci. Environ. 2013, 13 (2).(87) Snigdha, D. 35 per cent of Nigeria fast turning into desert, admits government https://www.downtoearth.org.in/news/35-per-cent-of-nigeria-fast- turning-into-desert-admits-government-45852 (accessed 2021 -04 -26).(88) Nwilo, P. C.; Olayinka, D. N.; Okolie, C. J.; Emmanuel, E. I.; Orji, M. J.; Daramola, O. E. Impacts of Land Cover Changes on Desertification in Northern Nigeria and Implications on the Lake Chad Basin. Journal of Arid Environments 2020, 181. https://doi.org/10.1016 /j.jaridenv.2020.104190.(89) Toye, O. Desertification Threatens Economy, Food Security http://www.ipsnews.net/2002/08/environment-nigeria-desertification-threatens- economy-food-security/ (accessed 2021 -04 -28).(90) Unah, L. Nigerian farmers can’t fight desertification alone https://www.preventionweb.net/news/view/55934 (accessed 2021 -07 -13).(91) World Bank. Project Performance Assessment Report: Nigeria - National Water Sector Reform Project; Washington, D.C., 2017.(92) Federal Ministry of Water Resources (FMWR). National Water Resources Policy; 2016.(93) Adefulu, A. Nigeria: An Overview Of The Nigerian Minerals And Mining Act 2007 https://www.mondaq.com/nigeria/mining/95916/an-overview-of- the-nigerian-minerals-and-mining-act-2007 (accessed 2021 -05 -19).(94) ECOLEX. National Inland Waterways Authority Act. https://www.ecolex.org/details/legislation/national-inland-waterways-authority-act-lex- faoc061961/#:~:text=This Act provides for the,relating to obstruction and pollution (accessed 2021 -05 -19).(95) International Waters Governance. Niger Basin. Legal Basis: http://www.internationalwatersgovernance.com/niger-basin.html#:~:text=The Niger Basin Authority (“NBA,Nigeria%2C Cameroon and Burkina Faso. (accessed 2021 -05 -21).(96) PreventionWeb. Lake Chad Basin Commission (LCBC) https://www.preventionweb.net/organizations/1264#:~:text=The mandate of the Commission,and security across the Basin. (accessed 2021 -05 -21).(97) National Environmental Standards and regulations Enforcement Agency (NESREA). National Environmental (Permitting and Licensing System) Regulations https://www.nesrea.gov.ng/publications-downloads/permits/. (accessed 2021 -05 -19).(98) Government of Nigeria. River Basins Development Authorities Act; 1987.(99) Corporate Accountability & Public Participation Africa. Plans to Reintroduce Water Bill Disrespectful to Nigerians Say Campaigners. 2021.(100) Doro, K. O.; Ehosioke, S.; Aizebeokhai, A. P. Sustainable Soil and Water Resources Management in Nigeria: The Need for a Data-Driven Policy Approach. Sustainability 2020, 12 (10).(101) Ogunmupe, B. Implications of Water Resources Bill 2020. The Guardian. 2020.(102) Irokalibe, I. J. G. Water Management in Federal and Federal- Type Countries: Nigerian Perspectives. In Expo Zaragoza 2008; 2008.(103) Gana, B. A.; Abdulkadir, I. F.; Musa, H.; Garba, T. A Conceptual Framework for Organization of River Basin Development and Management in Nigeria. Eur. J. Eng. Res. Sci. 2019, 4 (6).(104) Ngene, B. U.; Nwafor, C. O.; Bamigboye, G. O.; Ogbiye, A. S.; Ogundare, J. O.; Akpan, V. E. Integrated Water Resources Management in Nigeria: Implications for Sustainable National Development. IOP Conf. Ser. Mater. Sci. Eng. 2019, 640, 12101. https://doi.org/10.1088/1757- 899X/640/1/012101.(105) Stewart, N. A Roadmap for the Effective Enforcement of Environmental Laws in Nigeria. Natl. Environ. Law Rev. 2011, 2.(106) Golitzen, K. G.; Andersen, I.; Dione, O.; Jarosewich-Holder, M. The Niger River Basin: A Vision for Sustainable Management; World Bank Publications, The World Bank, 2005.(107) Adegbehin, A. B.; Yusuf, Y. O.; Iguisi, E. O.; Zubairu, I. Reservoir Inflow Pattern and Its Effects on Hydroelectric Power Generation at the Kainji Dam, Niger State, Nigeria. In Proceedings of the 3rd International Conference on Environmental and Economic Impact on Sustainable Development; WIT Transactions on Ecology and the Environment, 2016; Vol. 203. https://doi.org/10.2495/EID160211.(108) U.S. Group on Earth Observations. DFO Flood Event: 2019-Nigeria-4820 https://floodobservatory.colorado.edu/Events/4820/2019Nigeria4820. html (accessed 2021 -07 -14).(109) Ewepu, G. More flooding to hit Nigeria from Lagdo Dam in Cameroon — NIHSA More flooding to hit Nigeria from Lagdo Dam in Cameroon — NIHSA (accessed 2021 -07 -14).(110) World Bank. A Wake Up Call: Nigeria Water Supply, Sanitation, and Hygiene Poverty Diagnostic; Washington, DC, 2017.(111) American Chemical Society. White Paper on Proposed Capacity Development for Water Quality Assessment and Management in Nigeria; 2015.(112) Standards Organisation of Nigeria. Nigerian Standard for Drinking Water Quality; 2015.(113) WHO. Nigeria: Sanitation, Drinking-Water and Hygiene Status Overview; 2015.
Related Documents