1 2013 Shell Creek Watershed Research Group Advisors: Mark Seier, Kylie Sweeter, and Danielle Amen Researchers: Demi Edgell, Jacob Haase, John O’Brien, Billy O’Brien, Megan Nelson, Brooke Pieke, Brett Weinman, Alex Wiese, Mariely Estrada, Garrett Flamme, Parker Wallin, Sadie Wallin, Esmeralda Arreguin, Celine Dunlap, Destiny Johnson, Joe O’Brien, and Nolan Wondercheck

NG Shell Creek Data Powerpoint 2013
Jul 27, 2015
Welcome message from author
This document is posted to help you gain knowledge. Please leave a comment to let me know what you think about it! Share it to your friends and learn new things together.
Transcript

1
2013 Shell Creek Watershed Research Group
Advisors: Mark Seier, Kylie Sweeter, and Danielle Amen
Researchers: Demi Edgell, Jacob Haase, John O’Brien, Billy O’Brien, Megan Nelson, Brooke Pieke, Brett Weinman, Alex
Wiese, Mariely Estrada, Garrett Flamme, Parker Wallin, Sadie Wallin, Esmeralda Arreguin, Celine Dunlap, Destiny
Johnson, Joe O’Brien, and Nolan Wondercheck
2
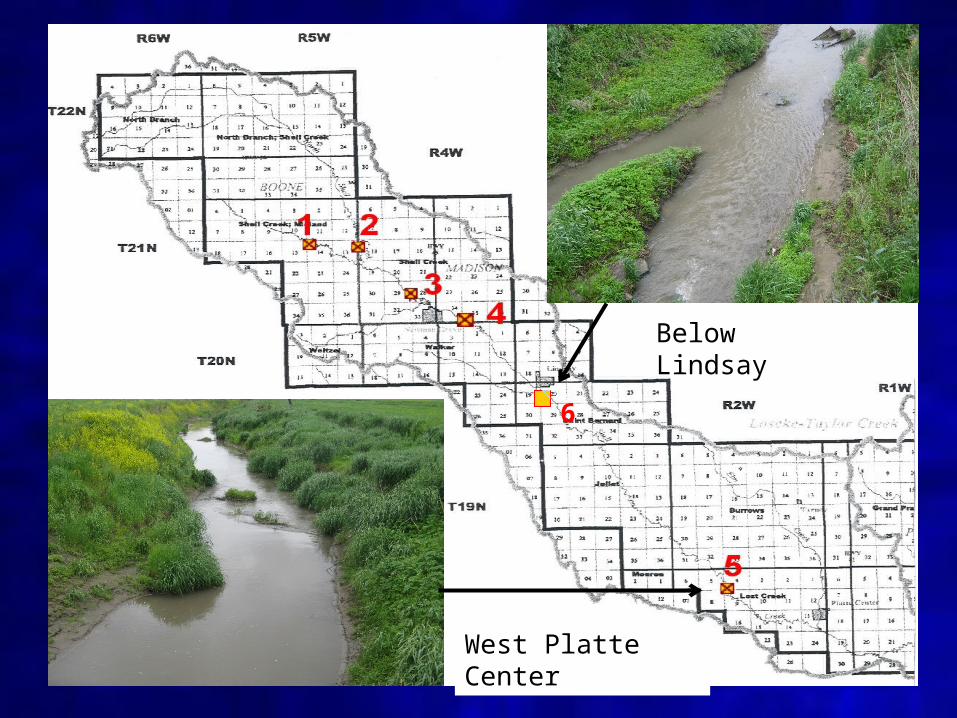
(with Township-Range Labels)
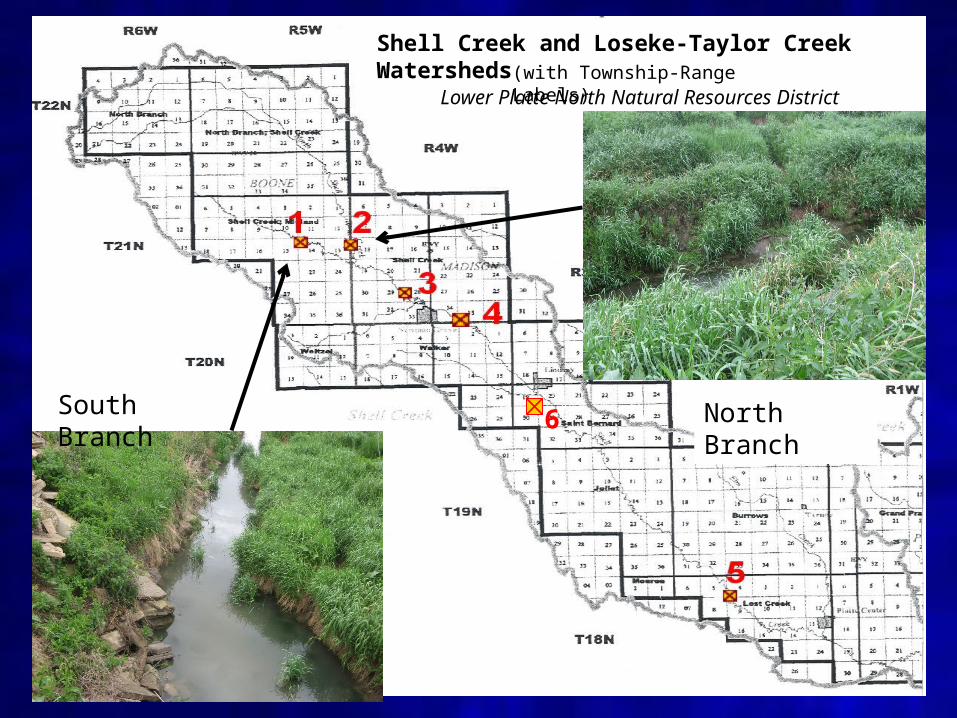
Shell Creek and Loseke-Taylor Creek Watersheds
Lower Platte North Natural Resources District
6South Branch
North Branch
3
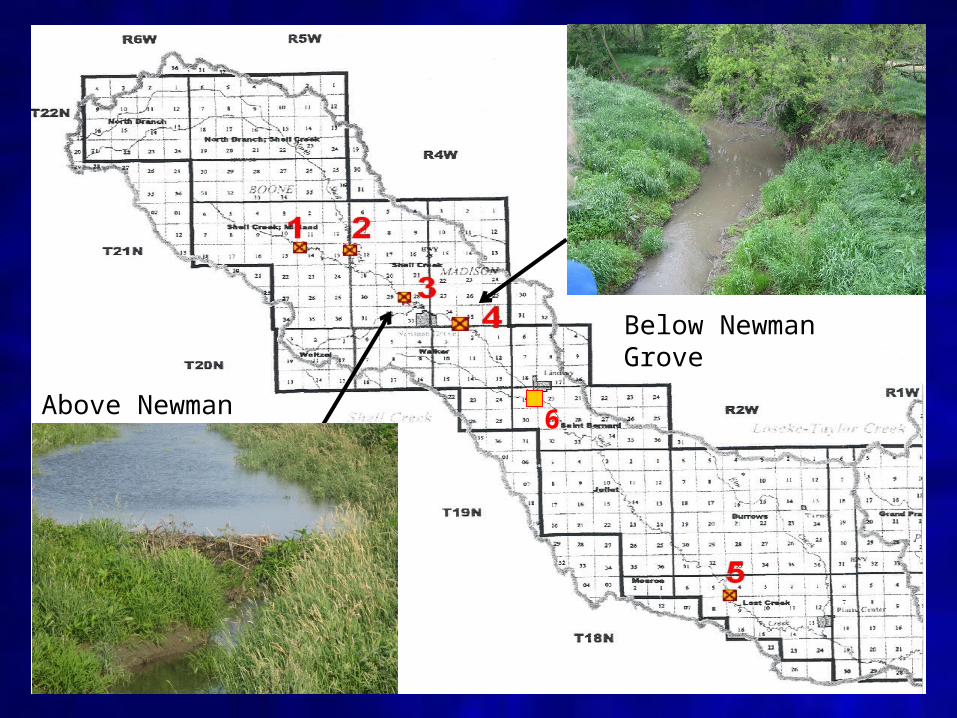
6Above Newman Grove
Below Newman Grove
4
6
Below Lindsay
West Platte Center
5
W.Q.I.
• The Water Quality Index was developed by the National Sanitation Foundation as a standard system to compare different bodies of water.
• To determine the WQI, a series of nine tests were performed. These tests were: dissolved oxygen, fecal coliform, pH, Biological Oxygen Demand (BOD), temperature, total phosphate, nitrates, turbidity, and total solids. We also did a water discharge test which we use to measure the flow of the creek in cubic feet per second.

6
• After the tests are completed, the WQI for each section of the creek can be computed.
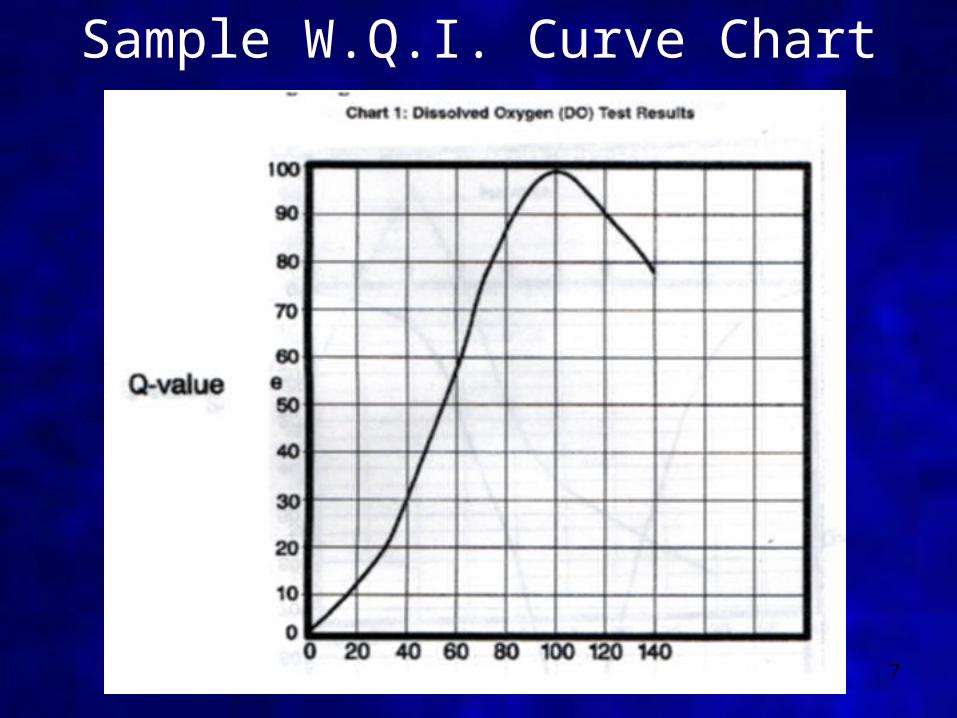
• To formulate the WQI, we first computed Q-values.
• We multiply this number by a weighting factor, which provides a measure of the relative importance of each test to overall water quality.
• The water quality index ranges from zero to 100.
- 0 - 25 is very bad - 25 - 50 is bad - 50 - 70 is medium - 70 - 90 is good- 90 - 100 is excellent
• The bio-indicator tests are not part of the W.Q.I., but do give us a water quality rating.
7
Sample W.Q.I. Curve Chart

8
Sample W.Q.I. Form
Test Results Q-valueWeighting
FactorT o t a l
DO % sat. 0.17 Fecal Coliform col/100 mL 0.16
pH units 0.11 BOD mg/L 0.11
Temperature change in C 0.1 Total Phosphate mg/L 0.1
Nitrates mg/L 0.1 Turbidity JTU 0.08
Total Solids mg/L 0.07
Overall Water Quality Index ___

9
May June July August0
0.5
1
1.5
2
2.5
3
3.5
2013 PrecipitationIn
ch
es
Date
10
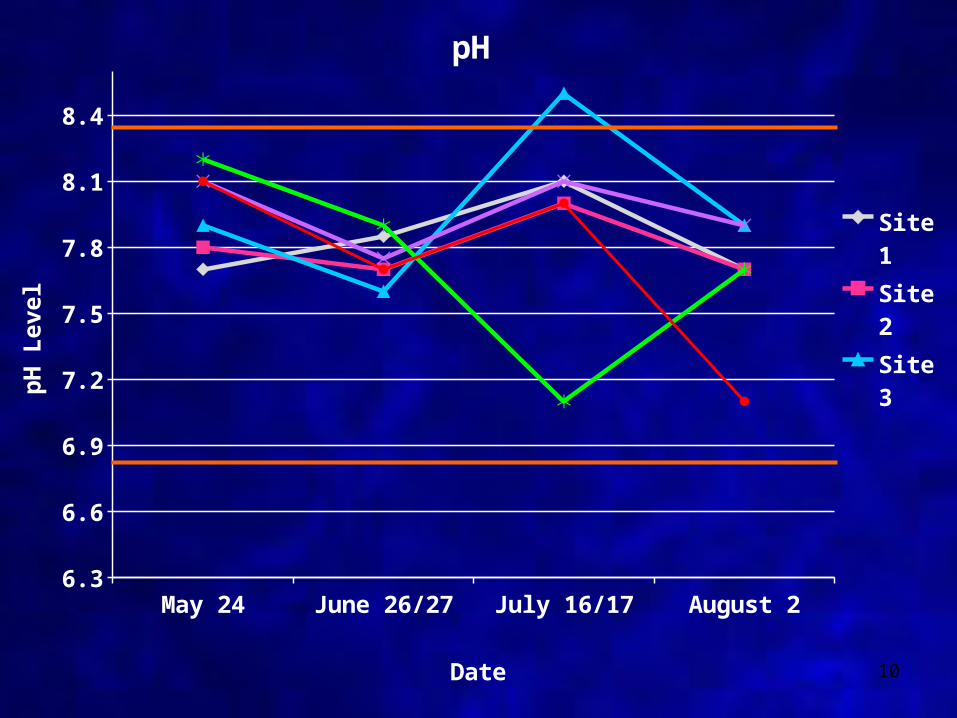
May 24 June 26/27 July 16/17 August 26.3
6.6
6.9
7.2
7.5
7.8
8.1
8.4
pH
Site 1
Site 2
Site 3
Date
pH
Level

11
May 24 June 26 July 16/17 August 2-3
-2.5
-2
-1.5
-1
-0.5
0
0.5
1
1.5
2
Change in Water Temperature
Site 1
Site 2
Site 3
Site 4
Site 6
Site 5
Date
Deg
rees C
elc
ius
The higher the change, the worse the water quality.
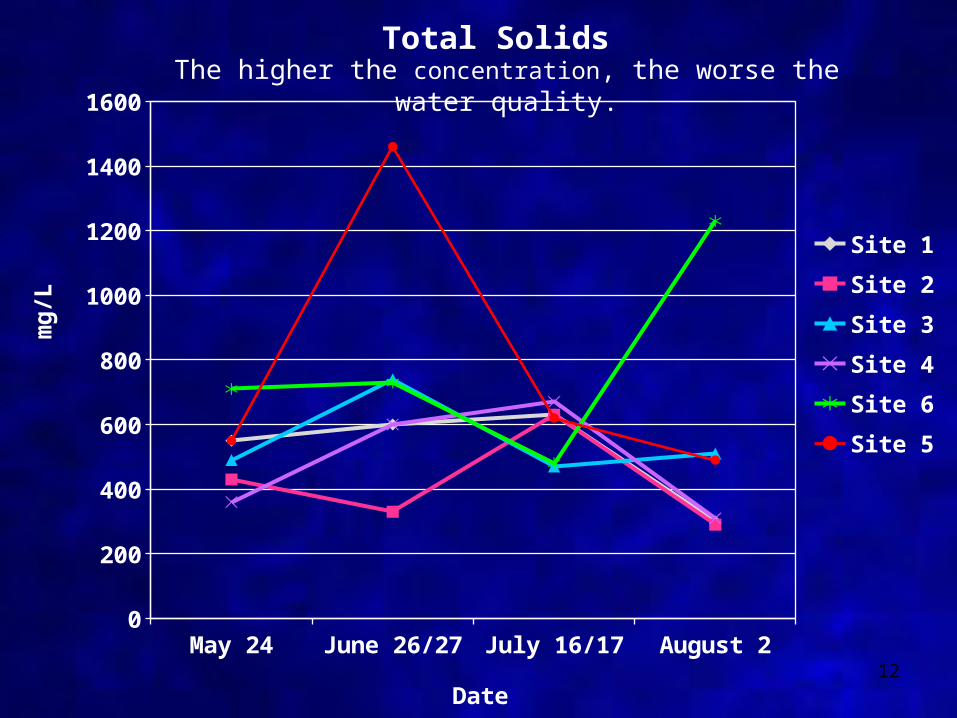
12May 24 June 26/27 July 16/17 August 2
0
200
400
600
800
1000
1200
1400
1600
Total Solids
Site 1
Site 2
Site 3
Site 4
Site 6
Site 5
Date
mg
/LThe higher the concentration, the worse the water
quality.

13
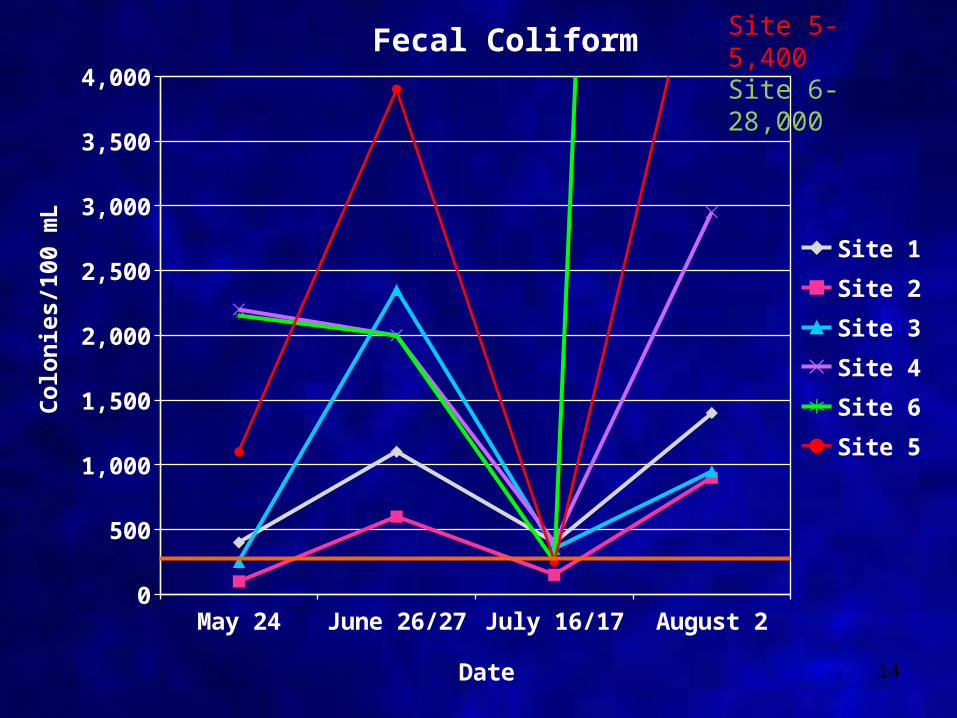
Fecal Coliform
14
May 24 June 26/27 July 16/17 August 20
500
1,000
1,500
2,000
2,500
3,000
3,500
4,000
Fecal Coliform
Site 1
Site 2
Site 3
Site 4
Site 6
Site 5
Date
Colo
nie
s/1
00
mL
Site 5- 5,400Site 6- 28,000

15
2003 2004 2005 2006 2007 2008 2009 2010 2011 2012 20130
200
400
600
800
1000
1200
1400
1600
1800Fecal Coliform
Site 1
Site 2
Site 3
Site 4
Site 6
Site 5
Date
Colo
nie
s/1
00
mL
In 2006 Site 1- 21,418Site 5- 17,800
In 2010Site 1- 11,387Site 3- 6,837Site 6- 2,313
In 2012 Site 6- 4,000
In 2013Site 4- 1,887.5Site 5- 8,100Site 6- 2,662.5

16May 22 June 26/27 July 16/17 August 2
0
1
2
3
4
5
6
7
8
9Flow
Site 1
Site 2
Site 3
Site 4
Site 6
Site 5
Date
Cu
bic
Feet
Per
Secon
d
17May 24 June 26/27 July 16/17 August 2
0
200
400
600
800
1000
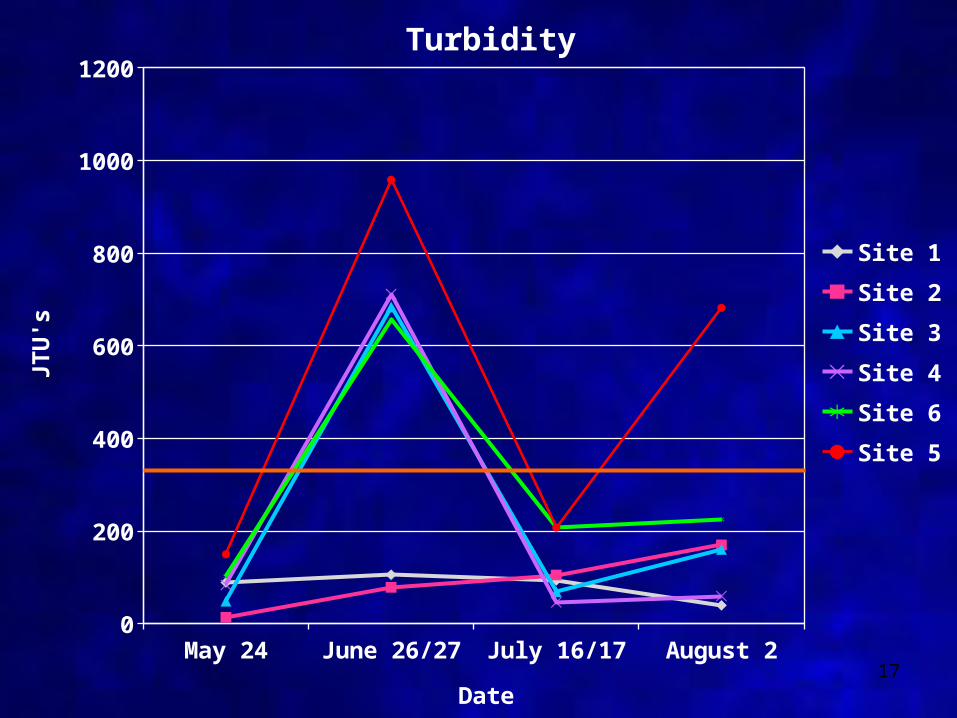
1200Turbidity
Site 1
Site 2
Site 3
Site 4
Site 6
Site 5
Date
JTU
's

18
May 24 June 26/27 July 16/17 August 20
10
20
30
40
50
60
70
80
90
100
Dissolved Oxygen
Site 1
Site 2
Site 3
Site 4
Site 6
Site 5
Date
% S
atu
rati
on

19May 24 June 26/27 July 16/17 August 2
0
0.5
1
1.5
2
2.5
3
3.5
4
4.5
5
5 Day Biological Oxygen Demand
Site 1
Site 2
Site 3
Site 4
Site 6
Site 5
Date
PP
M
The higher the change, the worse the water quality.
20
May 24 June 26/27 July 16/17 August 20
5
10
15
20
25
30
35
40
45
50
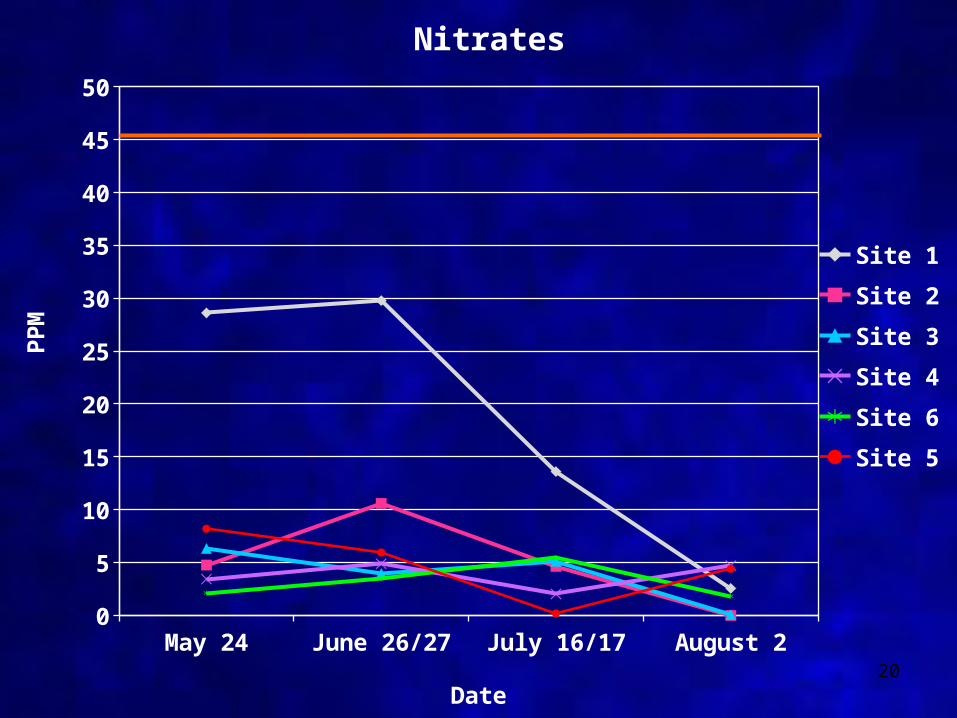
Nitrates
Site 1
Site 2
Site 3
Site 4
Site 6
Site 5
Date
PP
M

21
2002
2003
2004
2005
2006
2007
2008
2009
2010
2011
2012
2013
0
10
20
30
40
50
60
Nitrates
Site 1
Site 2
Site 3
Site 4
Site 6
Site 5
Date
PP
M

22
May 24 June 26/27 July 16/17 August 20
0.5
1
1.5
2
2.5
3
3.5Phosphates
Site 1
Site 2
Site 3
Site 4
Site 6
Site 5
Date
PP
M

23
Site 1 Site 2 Site 3 Site 4 Site 6 Site 530
35
40
45
50
55
60
65
70
WQI Averages by Site
2003 Averages 2004 Averages 2005 Averages 2006 Averages2007 Averages 2008 Averages 2009 Averages 2010 Average2011 Average 2012 Averages 2013 Average
WQ
I
Medium
Bad
Good

24
2003 2004 2005 2006 2007 2008 2009 2010 2011 2012 201335
40
45
50
55
60
65
70
Total WQI Averages by Year
WQI
WQ
I
Good
Bad
Medium

25Total Rainfall Inches
Discharge CFS Nitrates PPM pH 0
5
10
15
20
25
30
2003 - 2013 Chemical Test Average Comparisons
2003 Averages
2004 Averages
2005 Averages
2006 Averages
2007 Averages
2008 Averages
2009 Averages
2010 Averages
2011 Averages
2012 Averages
2013 Averages

26
Phosphates ppm B.O.D. ppm Change in Temp. Celcius
0
0.5
1
1.5
2
2.5
3
2003 - 2013 Chemical Test Average Compar-isons
2003 Averages
2004 Averages
2005 Averages
2006 Averages
2007 Averages
2008 Averages
2009 Averages
2010 Average
2011 Average
2012 Averages
2013 Averages
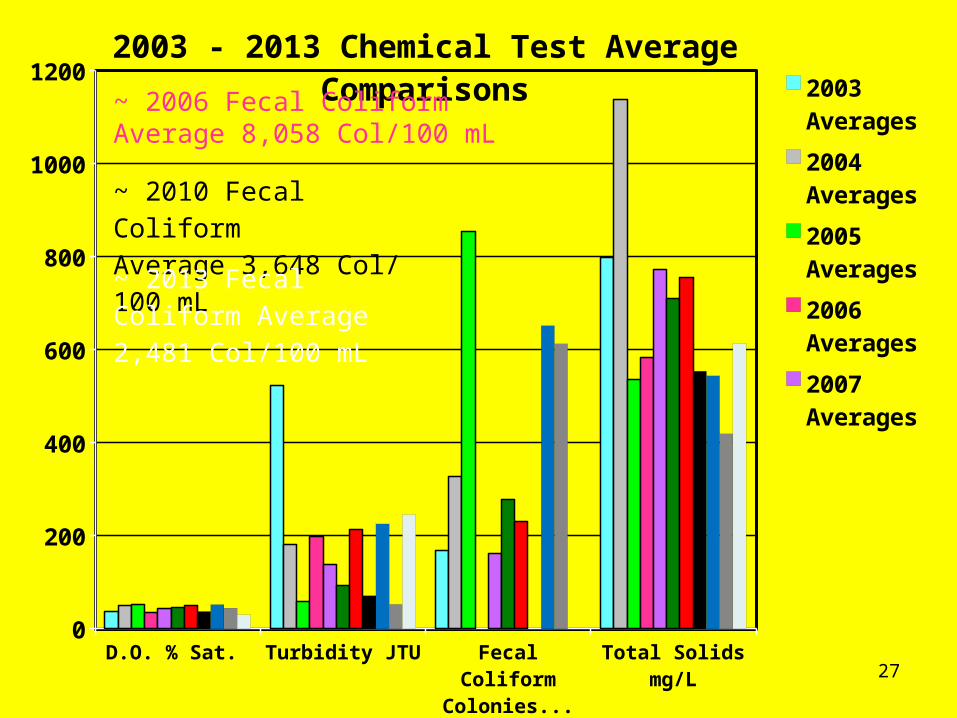
27D.O. % Sat. Turbidity JTU Fecal Coliform
Colonies/100 mL
Total Solids mg/L
0
200
400
600
800
1000
12002003 - 2013 Chemical Test Average Comparisons
2003 Averages
2004 Averages
2005 Averages
2006 Averages
2007 Averages
2008 Averages
2009 Averages
2010 Averages
2011 Averages
2012 Averages
2013 Averages
~ 2010 Fecal ColiformAverage 3,648 Col/100 mL
~ 2013 Fecal Coliform Av-erage 2,481 Col/100 mL
~ 2006 Fecal Coliform Average 8,058 Col/100 mL

Chemical Test Conclusions
• Nitrates have decreased or remained the same in the past year with the exception of Site 3
• Significant increase in fecal count in comparison to 2012 data
• Overall water quality decreased since 2012 testing
• Correlation between rainfall and WQI (2009 and 2013)
28

29
Macro Invertebrates
Tolerant
Somewhat SensitiveSensit
ive

30
Beaver-Shell Creek Comparison2013
pH Nitrates Phos-phates
B.O.D0
1
2
3
4
5
6
7
8
Beaver CreekShell Creek

31
Beaver-Shell Creek Comparison2013
Turbidity Fecal Col-iform
Total Solids
D.O. % Sat.
0
100
200
300
400
500
600
700
Beaver Creek
Shell Creek Fecal Coliform- 2,481.25

32
Beaver-Shell Creek WQI Comparison
Summer Average 08
Summer Average 09
Summer Average 10
Summer Average 11
Summer Average 12
Summer Average 13
May June July August0
10
20
30
40
50
60
70
Beaver Creek Average WQI
Shell Creek Average WQI
WQ
I
Good
Medium
Bad

33

34

35

36

37

38
Website
• Go to http://www.newman.esu8.org/ • Click the “Shell Creek Watershed”
icon on the right hand column• You can access our data and further
information concerning this project, including pictures

39
Thank You To:• Lower Platte North Natural
Resource District
• PrairieLand RC&D
• Natural Resource Conservation Service
• Nebraska Department of Environmental Quality
• Shell Creek Watershed
Improvement Group
• Chris Poole
• Area Land Owners
• United States Geographical Survey
• University of Nebraska Extension Service
• Newman Grove Public Schools
The End
Related Documents