National Fertilizer Development Centre (NFDC) Street No. 1, Sector H-8/1, Islamabad 1 KHARIF FERTILIZER SITUATION: MID SEPTEMBER 2009 AND OUTLOOK FOR RABI 2009-10 Executive Summary 1. CUMULATIVE OFFTAKE FOR KHARIF 2009 (APRIL-AUGUST) Cumulative Kharif 2009, (April-August) total nutrient offtake was 1,843 thousand tonnes, which showed an increase of 52.1 per cent over the same timeframe of Kharif 2008. Total nitrogen offtake went up by 30.3 per cent an d phosphate by 298.3 per cent. However, potash witnessed a downward trend. Urea offtake was about 2,646 thousand tonnes, which increased by 20.3 per cent, while DAP offtake was 718 thousand tonnes, which also went up by 471.4 per cent over Kharif 2008. 2. SUPPLY/DEMAND SITUATION DURING AUGUST, 2009 Total nutrient offtake during August, 2009 was about 449 thousand tonnes, which recorded an increase of 86.5 per cent over August 2008. Nitrogen offtake increased by 54.4 pe r cent and phosphate by 406.6 per cent. Potash offtake decreased by 54.8 percent. Urea offtake during August 2009 was 598 thousand tonnes, which went up by 42.2 per cent over August 2008. DAP offtake was about 205 thousand tonnes, as compared to 24 thousand tonnes of August 2008. 3. FERTILIZER PRODUCTION AND IMPORTED SUPPLIES Imported supplies during August were 334 thousand tonnes comprising 180 thousand tonnes of urea, 153 thousand tonnes of DAP and 1 thousand tonne of TSP. Production of all fertilizer products during August was about 603 thousand tonnes: Urea 453 thousand tonnes, DAP 59 thousand tonnes, CAN 36 thousand tonnes, NP 36 thousand tonnes and SSP 18 thousand tonnes. The production of NPK’s blends has been recorded only about one thousand tonnes. 4. PRICE TREND Domestic: Average prices of nitrogenous fertilizers like urea, CAN and AS decreased while that of phosphatic products increased with the highest increase recorded in price of DAP by 5.2 percent. Price of SOP also witnessed increase by 2 percent. International: Urea prices firmed up and were quoted at US $ 235-265/t fob bulks Yuzhny against 240-260/t of previous month. Arabian Gulf bagged urea reached a level of US$ 283- 290/t. DAP prices during August were in the range of US $ 305-325/t fob bulk in US Gulf and US $ 320-330/t fob in Jordan. MAP fob bulk prices were US $ 305-330/t, TSP US $ 230-235/t and SOP US$ 1130/t. 5. WEATHER SITUATION During the month of August 2009 seasonal low rainfall remained well marked over Baluchistan and adjoining Sindh. Monsoon currents were not very active consequently below normal precipitation reported in most parts of the country. Under the influence of monsoon systems, moderate to heavy rains/thunderstorm were reported from Azad Jammu Kashmir, northern areas, Balakot, Faisalabad, Kamra and Rawalpindi divisions. Monsoon incursions over Sindh and costal belt were also less frequent resulting into below than normal precipitations in this area, as well. Major Kharif crops in the field were cotton, rice, maize and groundnut which were in the reproductive stage of development. Weather induced problems were reported from different parts of the country during the month of August, 2009. The floods due to rains damaged the cotton, sugarcane and chilies crops in Punjab and some districts of NWFP. The Kharif crops were growing normally elsewhere in the country.

Welcome message from author
This document is posted to help you gain knowledge. Please leave a comment to let me know what you think about it! Share it to your friends and learn new things together.
Transcript

8/8/2019 NFDC Fertilizer Aug 2009
http://slidepdf.com/reader/full/nfdc-fertilizer-aug-2009 1/23
KHARIF FERTILIZER SITUATION: MID SEPTEMBER 2009 AND
OUTLOOK FOR RABI 2009-10
Executive Summary
1. CUMULATIVE OFFTAKE FOR KHARIF 2009 (APRIL-AUGUST)
Cumulative Kharif 2009, (April-August) total nutrient offtake was 1,843 thousand tonnes, whichshowed an increase of 52.1 per cent over the same timeframe of Kharif 2008. Total nitrogenofftake went up by 30.3 per cent and phosphate by 298.3 per cent. However, potash witnessed adownward trend. Urea offtake was about 2,646 thousand tonnes, which increased by 20.3 percent, while DAP offtake was 718 thousand tonnes, which also went up by 471.4 per cent overKharif 2008.
2. SUPPLY/DEMAND SITUATION DURING AUGUST, 2009
Total nutrient offtake during August, 2009 was about 449 thousand tonnes, which recorded anincrease of 86.5 per cent over August 2008. Nitrogen offtake increased by 54.4 per cent andphosphate by 406.6 per cent. Potash offtake decreased by 54.8 percent. Urea offtake duringAugust 2009 was 598 thousand tonnes, which went up by 42.2 per cent over August 2008. DAPofftake was about 205 thousand tonnes, as compared to 24 thousand tonnes of August 2008.
3. FERTILIZER PRODUCTION AND IMPORTED SUPPLIES
Imported supplies during August were 334 thousand tonnes comprising 180 thousand tonnes of urea, 153 thousand tonnes of DAP and 1 thousand tonne of TSP. Production of all fertilizerproducts during August was about 603 thousand tonnes: Urea 453 thousand tonnes, DAP 59thousand tonnes, CAN 36 thousand tonnes, NP 36 thousand tonnes and SSP 18 thousand tonnes.The production of NPK’s blends has been recorded only about one thousand tonnes.
4. PRICE TREND
Domestic: Average prices of nitrogenous fertilizers like urea, CAN and AS decreased whilethat of phosphatic products increased with the highest increase recorded in price of DAP by 5.2percent. Price of SOP also witnessed increase by 2 percent.
International: Urea prices firmed up and were quoted at US $ 235-265/t fob bulks Yuzhnyagainst 240-260/t of previous month. Arabian Gulf bagged urea reached a level of US$ 283-290/t. DAP prices during August were in the range of US $ 305-325/t fob bulk in US Gulf andUS $ 320-330/t fob in Jordan. MAP fob bulk prices were US $ 305-330/t, TSP US $ 230-235/tand SOP US$ 1130/t.
5. WEATHER SITUATION
During the month of August 2009 seasonal low rainfall remained well marked over Baluchistanand adjoining Sindh. Monsoon currents were not very active consequently below normalprecipitation reported in most parts of the country Under the influence of monsoon systems

8/8/2019 NFDC Fertilizer Aug 2009
http://slidepdf.com/reader/full/nfdc-fertilizer-aug-2009 2/23
6. SITUATION IN KHARIF 2009
The Kharif situation in respect of major fertilizer products Urea and DAP appears to besatisfactory right now. The left over of this season will be transferred to next season that will helpmeet the requirements of the coming Rabi 2009-10.
7. OUTLOOK FOR RABI 2009-10
Keeping in view the expected left over of Kharif 2009 and domestic production and importedsupplies, the urea availability will be around 2500 thousand tonnes against the demand of 3000thousand tonnes. Hence, timely import of about 600 thousand tonnes would be needed for Rabi
2009-10. As far as phosphatic fertilizers are concerned, the projected offtake of the DAP is 850thousand tonnes against the 962 thousand tonnes of availability (production and imports), thusthe situation appears to be satisfactory. Other phosphatic fertilizer products like MAP, TSP, NPand SSP will also be available to supplement the DAP availability.

8/8/2019 NFDC Fertilizer Aug 2009
http://slidepdf.com/reader/full/nfdc-fertilizer-aug-2009 3/23
MRR No.9/2009
KHARIF FERTILIZER SITUATION: MID SEPTEMBER 2009 AND
OUTLOOK FOR RABI 2009-10
1. INTRODUCTION
The fertilizer supply/demand situation during August 2009, along-with Kharif 2009 and Rabi
2009-10, have been analyzed. The report also contains domestic retail and international fertilizerprices of the major products; namely Urea, DAP, TSP, SOP and MAP. Brief on weather has alsobeen presented.
2. CUMULATIVE FERTILIZER OFFTAKE DURING KHARIF 2009
(APRIL-AUGUST)
The fertilizer use in Kharif is almost over. The provisional cumulative nutrient offtake during Kharif 2009(April-August) was about 1,843 thousand nutrient tonnes, which represented an increase of 52.1 per centover the same timeframe of the last year. Of this, nitrogen offtake was 1,434 thousand tonnes, phosphateabout 403 thousand tonnes and potash only 6.4 thousand tonnes (Table-1).
Consolidated data in Table 1 reveal that cumulative urea and DAP offtake during Kharif 2009 was 2,646thousand tonnes (20.3 per cent over Kharif 2008) and 718 thousand tonnes (471.4 per cent over Kharif 2008) respectively.
Table 1. Cumulative Fertilizer offtake during Kharif 2009 versus Kharif
2008(April-August)
('000 tonnes)
Season Nutrient Total Product
Nitrogen Phosphate Potash Nutrients Urea DAP
Kharif 2008 (April- August) 1,100 101.1 10.71 1,212 2,200 126
Kharif 2009 (April-August) 1,434 402.6 6.42 1,843 2,646 718
Percent change 30.3 298.3 -40.0 52.1 20.3 471.4
Details are presented in Annex 1 & 2.
3. FERTILIZER OFFTAKE DURING AUGUST, 2009

8/8/2019 NFDC Fertilizer Aug 2009
http://slidepdf.com/reader/full/nfdc-fertilizer-aug-2009 4/23
Table 2. Fertilizer offtake during August, 2009 compared with previous years
('000 tonnes)
Nutrient/ August August August August AugustPer cent
change in 2009Product 2005 2006 2007 2008 2009 Over 2008
Nitrogen 244 196 242 215 332 54.4
Phosphate 62 22 45 23 116 406.6
Potash 2 1 2 3 1 -54.8
Total 308 219 290 241 449 86.5
Urea 452 383 464 421 598 42.2
DAP 103 32 77 24 205 737.3Note:- Details are presented in Annex 1 and 2
4. FERTILIZER PRODUCTION AND IMPORTED SUPPLIES DURING
AUGUST 2009
Table 3 shows the production and imported supplies during the August 2009. Total production of all products were about 603 thousand tonnes comprising 453 thousand tonnes of Urea (75 % of the total production), 59 thousand tonnes of DAP, 36 thousand tonnes of NP, 36 thousand tonnesof CAN, 18 thousand tonnes of SSP and one thousand tonnes of blends of various grades of NPK.About 334 thousand tonnes of fertilizers were supplied in the market through import.
Table 3. Fertilizer production and imported supplies during August 2008
(‘000 tonnes)
Description Urea DAP NP CAN SSP NPKs SOP MOP MAP TSP Total
Production 453 59 36 36 18 1 - - - - 603
Percent share 75.0 9.8 6.0 6.0 2.9 0.1 - - - - 100
Import 180 153 - - - - - - - 1 334
Details are presented in Annex 6,10&11
5 PROVINCE WISE UREA AND DAP OFFTAKE DURING AUGUST 2009

8/8/2019 NFDC Fertilizer Aug 2009
http://slidepdf.com/reader/full/nfdc-fertilizer-aug-2009 5/23
Table 4. Province-wise urea and DAP offtake during August 2009 compared with previous years
(‘000 tonnes)Province August August August August August Per cent change
2005 2006 2007 2008 2009
in 2009 over2008
Urea
Punjab 272.7 263.4 278.1 265.6 418.3 57.5
Sindh 137.9 72.2 127.6 117.0 129.9 11.0
NWFP 23.9 31.7 31.4 24.3 33.3 37.0
Balochistan 17.9 16.1 27.4 13.6 16.7 22.7
Total 452.4 383.5 464.5 420.5 598.2 42.2
Per cent change -15.2 21.1 -9.5 42.2
over previous year
DAP
Punjab 77.9 18.1 45.0 17.5 114.4 552.2
Sindh 20.2 9.6 22.8 5.4 69.9 1194.9
NWFP 3.1 1.5 5.0 1.3 12.7 844.9
Balochistan 1.6 2.7 4.6 0.2 7.8 4390.2
Total 102.8 32.0 77.3 24.5 204.7 737.3
Per cent change -68.9 141.5 -68.4 737.3over previous year
Details are presented in Annex 7,8&9.
6. SUPPLY DEMAND SITUATION DURING AUGUST 2009
6.1. Urea
Total urea availability during August 2009 was about 741 thousand tonnes, which comprised 109thousand tonnes of previous month leftover, 453 thousand tonnes domestic production and 180 thousandtonnes imported supplies (Table 5). Urea offtake during August 2009 was 598 thousand tonnes withclosing balance of 143 thousand tonnes.
6.2. DAP

8/8/2019 NFDC Fertilizer Aug 2009
http://slidepdf.com/reader/full/nfdc-fertilizer-aug-2009 6/23
Table 5. Urea and DAP supply/demand situation during Kharif 2009
('000 tonnes)Description APR* MAY* JUN* JUL* AUG* SEP** TOTAL
UREA
Opening inventory 38 76 102 103 109 143 38
Imported supplies 66 52 116 183 180 108 705
Domestic production 397 441 430 442 453 430 2,592
Total availability 501 569 648 727 741 681 3,335
Offtake 422 466 543 618 598 550 3,197
Write off/on -2 -1 -2 -1- -
-7
Estimated inventory 76 102 103 109 143 131 131
DAP
Opening inventory 204 246 209 147 77 86 204
Imported supplies 41 1 27 109 153 171 502
Domestic production 51 56 53 47 59 55 322
Total availability 296 303 290 303 290 312 1,029
Offtake 49 95 143 226 205 100 818
Write off/on -1 1-
0- -
0
Estimated inventory 246 209 147 77 86 212 212
*Actual ** Estimated.
7. SITUATION IN KHARIF 2009
A picture of fertilizer situation during current Kharif season is presented in table 5, which isalmost to over. The data confirm 3,335 thousand tonnes urea availability comprising 705thousand tonnes of imported supplies and 2,592 thousand tonnes of domestic production against3,197 thousand tonnes demand. Similarly 1029 thousand tonnes DAP is available to meet thedemand of 818 thousand tonnes. Therefore the situation remains generally comfortable.
8. OUTLOOK FOR RABI 2009-10
Table 6 presents an outlook for Rabi 2009-10. The figures are based on estimates of domesticproduction, demand forecasts by NFDC and lined up imports reported internationally as well asdi d i th F tili R i C itt ti h ld A t 18 2009

8/8/2019 NFDC Fertilizer Aug 2009
http://slidepdf.com/reader/full/nfdc-fertilizer-aug-2009 7/23
DAP is needed to meet demand during Rabi. Other complimentary products such as MAP, SSP,NP and TSP would also be available in the market to meet the emerging demand.
Table 6. Urea and DAP supply/demand situation during Rabi 2009-10 (Estimated)
(000 tonnes)
Description OCT NOV DEC JAN FEB MAR TOTAL
UREA
Opening inventory 131 216 400 344 295 211 131
Imported Supplies 100 200 100 200 - - 600
Domestic production 385 434 444 350 403 434 2,450Total availability 616 850 944 894 698 645 3,181
Offtake 400 450 600 599 487 464 3,000
Adjustment (+/-) - - - - - - -
Estimated balance 216 400 344 295 211 181 181
DAP
Opening inventory 212 192 117 117 127 119 212
Imported Supplies 200 200 50 - - - 450
Domestic production 50 50 50 50 50 50 300
Total availability 462 442 217 167 177 169 962
Offtake 270 325 100 40 58 57 850
Adjustment (+/-) - - - - - - -
Estimated balance 192 117 117 127 119 112 112
9. FERTILIZER PRICES
9.1. Domestic fertilizer prices
Average fertilizer market prices in the country during July and August, 2009 are presented in Table 7.
Table 7. Average Fertilizer Retail Prices in August, 2009 compared with
July, 2009.
(Rs. Per 50 kg bag)
Product July August Percent
2009 2009 change
Urea Sona (FFC) 797 767 -3.7
Urea Kissan (NFC) 789 757 -4.1
DAP 1867 1963 5.2

8/8/2019 NFDC Fertilizer Aug 2009
http://slidepdf.com/reader/full/nfdc-fertilizer-aug-2009 8/23
Average prices of urea decreased in the range of 3.7 to 4.1 percent from Rs. 797 to 757 per 50 kgbag. Price of CAN and AS also decreased, however, prices of all the phosphatic and potash
products increased.
9.2. International prices
Fertilizer prices for urea, DAP, TSP, MAP and SOP in the international market during August2009 are presented in Table 8. Urea Fob bulk yuzhny price in international market fluctuatedbetween US $ 235-265/t (US $ 240-260/t last month). While in Arabian Gulf, it was US $ 283-290 Fob bagged.
DAP prices during the month were in the range of US $ 305-325/t fob US Gulf, (US $ 285-295/tin July, 2009) while Jordan prices were in the range of US $ 320-330/t fob bulk. MAP, TSP andSOP prices remained at US $ 305-330, 230-235/t and 1130/t respectively during August 2009.
Table 7. International prices during August, 2009
(US $ per MT)
Terms/Port 6-Aug 13-Aug 20-Aug 27-Aug
(FOB) (1st week) (2nd week) (3rd week) (4th week)
Urea
Yuzhny 260-265 248-255 240-245 235-238
(Prilled Bulk) (240-245) (242-250) (245-250) (250-260)
Arabian Gulf 270-273 270-273 270-277 270-277
(Prilled Bulk) (260-261) (260-261) (260-273) (270-273)
Arabian Gulf 283-285 283-285 283-290 283-290
(Prilled Bgd) (273-275) (273-275) (273-285) (283-285)
DAP
US Gulf 305-310 313-325 313-325 315-322
(Bulk) (285-290) (288-290) (290-295) (290-295)
Jordan 320-330 320-330 320-330 320-330
(Bulk) (310-320) (310-320) (320-330) (320-330)
China 340-345 340-345 340-345 340-345
(Bulk) (330-340) (330-340) (330-340) (330-340)
MAP
Baltic 320-330 305-325 305-325 315-325
(Bulk) (290-320) (305-320) (305-320) (310-320)
TSP

8/8/2019 NFDC Fertilizer Aug 2009
http://slidepdf.com/reader/full/nfdc-fertilizer-aug-2009 9/23
10. WEATHER SITUATION
During August 2009, monsoon remained less active over NWFP, Potohar plateau and northernareas. Under their influence moderate to isolated heavy rains/thunderstorms were reported fromthe areas. In NWFP and northern areas in one or two districts reported floods which caused lifeand property losses. In plains of Punjab rainfall remained below normal except Faisalabad whereit remained above normal. In Baluchistan and Sindh provinces except Khuzdar district, monsoonrainfall in this month was recorded below normal.
Table 8. Rainfall data during August 2009 compared with August 2008
Rainfall (mm)
Station August August Per cent
2008 2009 change
Peshawar 9.6 43.8 356.3
Kamra 199.0 169.0 -15.1
Rawalpindi 225.2 202.4 -10.1
Jhelum 184.8 164.3 -11.1
Sargodha 68.0 54.8 -19.4
Lahore 68.4 92.0 34.5
D.I. Khan 31.5 58.6 86.0
Faisalabad 118.2 137.4 16.2
Multan 1.7 6.0 252.9
Khanpur 27.0 1.2 -
Quetta 7.0 0.6 -91.4Rohri 9.0 - -
Hyderabad 1.0 72.0 7100.0Source: National Agromet Centre, Islamabad.
Dated: September 17, 2009
ANNEXES
1. Month-wise nutrient offtake during Kharif 2009 compared with previous seasons.2. Month-wise urea and DAP offtake during Kharif 2009 compared with previous seasons.3. Month-wise nutrient offtake during year 2009-10 compared with previous years4. Month-wise urea and DAP offtake during year 2009-10 compared with previous years5 Pl i d i l d k i i (A 2009)

8/8/2019 NFDC Fertilizer Aug 2009
http://slidepdf.com/reader/full/nfdc-fertilizer-aug-2009 10/23
ANNEX-1
MONTH-WISE NUTRIENT OFFTAKE DURING KHARIF 2009 COMPARED WITHPREVIOUS SEASONS
(Tonnes)
Month/ Kharif Kharif Kharif Kharif Kharif* Percent
Season 2005 2006 2007 2008 2009 Change
TOTAL NUTRIENTS (N+P2O5+K2O)
April 217,506 196,650 147,416 202,621 257,628 27.1
May 266,371 255,983 276,711 279,958 314,397 12.3
June 350,315 359,415 421,736 220,177 372,674 69.3July 369,808 301,395 429,638 268,343 449,182 67.4
August 307,748 219,355 289,604 240,822 449,057 86.5
Sub-Total 1,511,748 1,332,798 1,565,105 1,211,921 1,842,938 52.1
September 295,746 185,133 188,834 293,539 240,813 -18.0
Total Kharif 1,807,494 1,517,931 1,753,939 1,505,460 2,083,751 38.4
Percent change -16.0 15.5 -14.2 38.4
NITROGEN
April 176,471 153,101 108,887 191,764 220,182 14.8
May 214,722 208,626 215,480 242,733 252,578 4.1June 260,667 301,861 330,013 208,690 293,184 40.5
July 275,701 235,296 348,182 241,958 336,118 38.9
August 244,089 196,205 242,099 214,982 331,830 54.4
Sub-Total 1,171,650 1,095,089 1,244,661 1,100,127 1,433,892 30.3
September 213,394 162,981 139,454 232,371 187,050 -19.5
Total Kharif 1,385,044 1,258,070 1,384,115 1,332,498 1,620,942 21.6
Percent change -9.2 10.0 -3.7 21.6
PHOSPHATE
April 39,018 41,583 35,906 10,300 36,255 252.0May 48,459 45,113 60,241 35,143 60,186 71.3
June 83,194 56,280 88,466 9,737 78,341 704.6
July 90,845 65,168 78,623 23,027 111,956 386.2
August 61,747 22,030 45,247 22,880 115,888 406.5
Sub-Total 323,263 230,174 308,483 101,087 402,626 298.3
September 78,417 20,466 45,707 56,838 50,357 -11.4
Total Kharif 401,680 250,640 354,190 157,925 452,983 186.8
Percent change -37.6 41.3 -55.4 186.8
POTASH
April 2,017 1,966 2,623 557 1,191 113.8
May 3,190 2,244 990 2,082 1,633 -21.6
June 6,454 1,274 3,257 1,750 1,149 -34.3
July 3,262 931 2,833 3,358 1,108 -67.0
August 1,912 1,120 2,258 2,960 1,339 -54.8
S b T t l 16 835 7 535 11 961 10 707 6 420 40 0

8/8/2019 NFDC Fertilizer Aug 2009
http://slidepdf.com/reader/full/nfdc-fertilizer-aug-2009 11/23
ANNEX-2
MONTH-WISE COMPARATIVE UREA AND DAP OFTAKE DURING KHARIF, 2009COMPARED WITH PREVIOUS SEASONS
(Tonnes) Month/ Kharif Kharif Kharif Kharif Kharif Percent
Season 2005 2006 2007 2008 2009 Change
UREA
April 325,653 276,116 188,838 390,073 422,212 8.2
May 401,454 388,429 378,549 473,866 465,695 -1.7
June 475,597 585,040 599,128 426,652 542,777 27.2
July 509,150 432,610 667,584 489,079 617,572 26.3
August 452,414 383,452 464,458 420,547 598,182 42.2
Sub Total 2,164,268 2,065,647 2,298,557 2,200,217 2,646,438 20.3
September 375,973 325,480 239,091 419,580 340,031 -19.0
Total Kharif 2,540,241 2,391,127 2,537,648 2,619,797 2,986,469 14.0
Percent change -5.9 6.1 3.2 14.0
DAP
April 47,280 65,477 45,349 5,810 49,335 749.1
May 67,513 60,237 93,016 57,099 95,076 66.5
June 138,646 90,770 144,504 4,887 142,627 2818.5
July 165,609 106,711 150,504 33,368 225,929 577.1
August 102,827 32,024 77,344 24,453 204,747 737.3
Sub Total 521,875 355,219 510,717 125,617 717,714 471.4
September 128,716 34,443 74,289 72,406 77,464 7.0
Total Kharif 650,591 389,662 585,006 198,023 795,178 301.6
Percent change -40.1 50.1 -66.2 301.6
* September 2009 is average of previous years.

8/8/2019 NFDC Fertilizer Aug 2009
http://slidepdf.com/reader/full/nfdc-fertilizer-aug-2009 12/23
ANNEX-3
MONTH-WISE COMPARATIVE NUTRIENT OFFTAKE DURING YEAR 2009-10 COMPARED WITH
PREVIOUS YEARS(Tonnes)
YEAR 2005-06 2006-07 2007-08 2008-09 2009-10* Percent change
TOTAL NUTRIENTS (N+P2O5+K2O) July 369,808 301,395 429,638 268,343 449,184 67.4August 307,748 219,355 289,604 240,822 449,057 86.5September 295,746 185,133 188,834 293,539 240,813 -18.0October 383,774 390,771 261,234 390,351 356,533 -8.7November 417,509 582,497 534,841 336,822 467,917 38.9December 433,095 548,100 418,331 323,966 430,873 33.0January 302,554 225,213 311,830 325,430 291,257 -10.5February 234,637 193,766 214,079 294,839 234,330 -20.5
March 245,983 178,519 230,065 292,521 236,772 -19.1April 196,650 147,416 202,621 257,628 201,079 -21.9May 255,983 276,711 279,958 314,397 281,762 -10.4June 359,415 421,736 220,177 372,674 343,501 -7.8
Total 3,802,902 3,670,612 3,581,212 3,711,332 3,983,077 7.3
Percent change -3.5 -2.4 3.6 7.3
NITROGEN July 275,701 235,296 348,182 241,958 336,118 38.9August 244,089 196,205 242,099 214,982 331,830 54.4September 213,394 162,981 139,454 232,371 187,050 -19.5October 236,616 167,909 149,937 260,836 203,825 -21.9November 251,927 322,701 348,524 245,930 292,271 18.8December 354,851 438,342 360,049 287,147 360,097 25.4
January 281,079 190,170 284,294 294,092 262,409 -10.8February 209,535 154,153 196,775 248,101 202,141 -18.5March 195,475 126,601 212,113 243,546 194,434 -20.2April 153,101 108,887 191,764 220,182 168,484 -23.5May 208,626 215,480 242,733 252,578 229,854 -9.0June 301,861 330,013 208,690 293,184 283,437 -3.3
Total 2,926,255 2,648,738 2,924,614 3,034,907 3,051,949 0.6
Percent change -9.5 10.4 3.8 0.6
PHOSPHATE July 90,845 65,168 78,623 23,027 111,958 386.2August 61,747 22,030 45,247 22,880 115,888 406.5September 78,417 20,466 45,707 56,838 50,357 -11.4
October 144,860 214,446 105,470 126,536 147,828 16.8November 163,264 251,631 183,462 89,403 171,940 92.3December 76,351 107,260 57,701 36,532 69,461 90.1January 20,636 32,897 26,236 29,752 27,380 -8.0February 22,681 34,742 15,558 43,624 29,151 -33.2March 47,833 45,510 16,490 47,796 39,407 -17.6April 41,583 35,906 10,300 36,255 31,011 -14.5May 45,113 60,241 35,143 60,186 50,171 -16.6June 56,280 88,466 9,737 78,341 58,206 -25.7
Total 849,610 978,763 629,674.00 651,170 902,758 38.6
Percent change 15.2 -35.7 3.4 38.6
POTASH
July 3,262 931 2,833 3,358 1,108 -67.0August 1,912 1,120 2,258 2,960 1,339 -54.8September 3,935 1,686 3,673 4,330 3,406 -21.3October 2,298 8,416 5,827 2,979 4,880 63.8November 2,318 8,165 2,855 1,489 3,707 148.9December 1,893 2,498 581 288 1,315 357.3January 840 2,146 1,300 1,585 1,468 -7.4February 2,419 4,871 1,746 3,114 3,038 -2.5March 2,676 6,408 1,462 1,179 2,931 148.6

8/8/2019 NFDC Fertilizer Aug 2009
http://slidepdf.com/reader/full/nfdc-fertilizer-aug-2009 13/23
ANNEX-4
MONTH-WISE COMPARATIVE UREA AND DAP OFFTAKE DURING YEAR 2009-10
COMPARED WITH PREVIOUS YEARS
(Tonnes)
YEAR 2005-06 2006-07 2007-08 2008-09 2009-10 Percent change
UREA
July 509,150 432,610 667,584 489,079 617,572 26.3
August 452,414 383,452 464,458 420,547 598,182 42.2
September 375,973 325,480 239,091 419,580 340,031 -19.0
October 377,709 172,707 225,035 445,726 305,294 -31.5
November 403,606 493,037 574,280 441,730 478,163 8.2December 697,912 838,788 715,024 570,047 705,443 23.8
January 562,898 364,973 582,671 598,642 527,296 -11.9
February 411,643 283,214 391,431 477,338 390,907 -18.1
March 364,583 216,980 429,119 463,590 368,568 -20.5
April 276,116 188,838 390,073 422,212 319,310 -24.4
May 388,429 378,549 473,866 465,695 426,635 -8.4
June 585,040 599,128 426,652 542,777 538,399 -0.8
Total 5,405,473 4,677,756 5,579,284 5,756,963 5,615,800 -2.5
Percent change -13.5 19.3 3.2 -2.5
DAP
July 165,609 106,711 150,504 33,368 225,929 577.1
August 102,827 32,024 77,344 24,453 204,747 737.3
September 128,716 34,443 74,289 72,405 77,463 7.0
October 257,677 380,858 202,453 251,662 273,163 8.5
November 264,147 397,209 327,261 166,220 288,709 73.7
December 105,767 197,163 94,757 66,008 115,924 75.6
January 31,006 54,889 56,780 44,463 46,785 5.2
February 31,821 53,655 14,180 69,568 42,306 -39.2
March 78,709 72,199 21,817 75,062 61,947 -17.5
April 65,477 45,349 5,810 49,335 41,493 -15.9
May 60,237 93,016 57,099 95,076 76,357 -19.7
June 90,770 144,504 4,887 142,627 95,697 -32.9
Total 1,382,763 1,612,020 1,087,181 1,090,247 1,550,519 42.2
Percent change 16.6 -32.6 0.3 42.2
* September 2009 onward are average of previous years.

8/8/2019 NFDC Fertilizer Aug 2009
http://slidepdf.com/reader/full/nfdc-fertilizer-aug-2009 14/23

8/8/2019 NFDC Fertilizer Aug 2009
http://slidepdf.com/reader/full/nfdc-fertilizer-aug-2009 15/23
National Fertilizer Development Centre (NFDC)
Street No. 1, Sector H-8/1, Islamabad 15
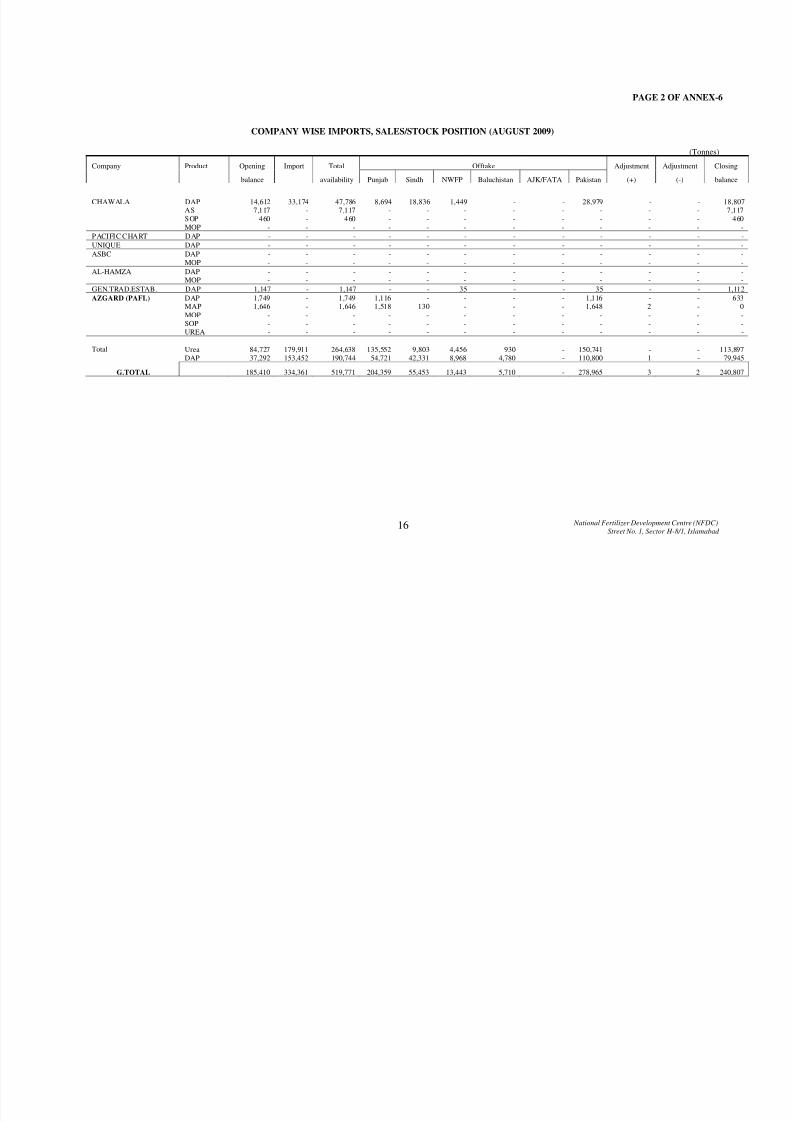
ANNEX-6
COMPANY WISE IMPORTS, SALES/STOCK POSITION (AUGUST 2009)
(Tonnes)
Company Product Opening Import Total Offtake Adjustment Adjustment Closing
balance availability Punjab Sindh NWFP Baluchistan AJK/FATA Pakistan (+) (-) BalanceFFC Urea - - - - - - - - - - - -
DAP - - - - - - - - - - - -TSP - - - - - - - - - - - -
SOP 61 - 61 - 61 - - - 61 - - -ECPL Urea - - - - - - - - - - - -
DAP 8,090 29,841 37,931 17,810 14,471 3,460 1,209 - 36,950 1 - 982MAP 9,821 - 9,821 3,571 1,787 9 - - 5,367 - 2 4,452TSP 3,063 998 4,061 3,996 63 - - - 4,059 - - 2
DCL Urea - - - - - - - - - - - -DAP - - - - - - - - - - - -
NFMLUrea 84,727 179,911 264,638 135,552 9,803 4,456 930 - 150,741 - - 113,897
DAP - - - - - - - - - - - -PAK ARAB Urea - - - - - - - - - - - -
DAP 1,747 11,432 13,179 551 748 - - - 1,299 - - 11,880
MAP 18,866 - 18,866 989 - - - - 989 - - 17,877JBL DAP 9,948 - 9,948 5124 1,134 453 - - 6,711 - - 3,237
TSP 19,124 - 19,124 2622 806 10 - - 3,438 - - 15,686MOP 65 - 65 - - - - - - - - 65MAP 1,401 - 1,401 761 180 - - - 941 - - 460
SOP 1,767 - 1,767 629 292 - - - 921 - - 846KJB DAP - - - - - - - - - - - -
NP - - - - - - - - - - - -TSP - - - - - - - - - - - -
MAP - - - - - - - - - - - -UNI. AGRO DAP 0 79,005 79,005 21,426 7,142 3,571 3,571 35,710 - - 43,295
TSP - - - - - - - - - - - -
SOP - - - - - - - - - - - -MOP 0 - 0 - - - - - - - - 0
8/8/2019 NFDC Fertilizer Aug 2009
http://slidepdf.com/reader/full/nfdc-fertilizer-aug-2009 16/23
National Fertilizer Development Centre (NFDC)
Street No. 1, Sector H-8/1, Islamabad 16
PAGE 2 OF ANNEX-6
COMPANY WISE IMPORTS, SALES/STOCK POSITION (AUGUST 2009)
(Tonnes)
Company Product Opening Import Total Offtake Adjustment Adjustment Closing
balance availability Punjab Sindh NWFP Baluchistan AJK/FATA Pakistan (+) (-) balance
CHAWALA DAP 14,612 33,174 47,786 8,694 18,836 1,449 - - 28,979 - - 18,807AS 7,117 - 7,117 - - - - - - - - 7,117SOP 460 - 460 - - - - - - - - 460MOP - - - - - - - - - - - -
PACIFIC CHART DAP - - - - - - - - - - - -
UNIQUE DAP - - - - - - - - - - - -
ASBC DAP - - - - - - - - - - - -MOP - - - - - - - - - - - -
AL-HAMZA DAP - - - - - - - - - - - -MOP - - - - - - - - - - - -
GEN.TRAD.ESTAB. DAP 1,147 - 1,147 - - 35 - - 35 - - 1,112
AZGARD (PAFL) DAP 1,749 - 1,749 1,116 - - - - 1,116 - - 633MAP 1,646 - 1,646 1,518 130 - - - 1,648 2 - 0MOP - - - - - - - - - - - -SOP - - - - - - - - - - - -UREA - - - - - - - - - - - -
Urea 84,727 179,911 264,638 135,552 9,803 4,456 930 - 150,741 - - 113,897TotalDAP 37,292 153,452 190,744 54,721 42,331 8,968 4,780 - 110,800 1 - 79,945
G.TOTAL 185,410 334,361 519,771 204,359 55,453 13,443 5,710 - 278,965 3 2 240,807

8/8/2019 NFDC Fertilizer Aug 2009
http://slidepdf.com/reader/full/nfdc-fertilizer-aug-2009 17/23
National Fertilizer Development Centre (NFDC)
Street No. 1, Sector H-8/1, Islamabad 17
ANNEX-7
TOTAL SALES AND STOCK POSITION (AUGUST 2009)
(Tonnes)
Product Opening Production Import Total Offtake Adjustment Adjustment Closing
Balance Availability Punjab Sindh NWFP Baluchistan AJK/FATA Pakistan (+) (-) BalanceUREA 109,214 452,681 179,911 741,806 418,282 129,921 33,304 16,675 - 598,182 - 395 143,229DAP 77,656 59,361 153,452 290,469 114,369 69,911 12,699 7,768 - 204,747 1 15 85,708NP 10,387 36,326 - 46,713 23,275 15,385 530 243 - 39,433 - - 7,280CAN 4,385 36,425 - 40,810 26,971 7,832 447 150 - 35,400 - - 5,410SSP 62,294 17,746 - 80,040 18,856 30 570 - - 19,456 - - 60,584TSP 19,124 - 998 20,122 6,618 869 10 - - 7,497 - - 12,625
SOP 2,288 - - 2,288 629 353 - - - 982 - - 1,306MAP 31,734 - - 31,734 6,839 2,097 9 - - 8,945 2 2 22,789MOP 65 - - 65 - - - - - - - - 65AS 7,117 - - 7,117 - - - - - - - - 7,117NPK 10,311 853 - 11,164 3,723 958 6 87 - 4,774 - 3 6,387
TOTAL 334,575 603,392 334,361 1,272,328 619,562 227,356 47,575 24,923 - 919,416 3 415 352,499
TOTAL NUTRIENT WISE SALES AND STOCK POSITION (AUGUST 2009)
(Tonnes)
Nutrient Opening Production Import Total Offtake Adjustment Adjustment Closing
Balance Availability Punjab Sindh NWFP Baluchistan Pakistan (+) (-) Balance
Nitroen 73,981 236,829 110,380 421,190 226,526 78,282 17,846 9,176 331,830 - 185 89,175
Phosphate 78,303 39,052 71,047 188,401 68,779 37,386 6,076 3,646 115,887 - 8 72,506
Potash 3,015 154 - 3,168 979 344 1 15 1,339 - - 1,829
Total 155,298 276,034 181,427 612,760 296,284 116,012 23,923 12,837 449,057 - 193 163,510

8/8/2019 NFDC Fertilizer Aug 2009
http://slidepdf.com/reader/full/nfdc-fertilizer-aug-2009 18/23
National Fertilizer Development Centre (NFDC)
Street No. 1, Sector H-8/1, Islamabad 18
ANNEX-8
PROVINCE-WISE AND PRODUCT-WISE OFFTAKE OF DOMESTICALLY PRODUCED FERTILIZERS (AUGUST 2009)
(Tonnes)
PROVINCES UREA CAN NP 22:20 SSP J SSP H DAP NPK NPK NPK NPK NPK NPK NPK TOTAL
18:09:18 17:17:17 10:23:10 10/08:23:18 12:15:20 8:18:15/20 10:28:10
Punjab 282,730 26,971 23,275 6,662 12,194 59,648 - 573 - 3,150 - - - 415,203
Sindh 120,118 7,832 15,385 30 - 27,580 - 464 - 494 - - - 171,903
NWFP 28,848 447 530 - 570 3,731 - 6 - - - - - 34,132
Balochistan 15,745 150 243 - - 2,988 - 54 - 33 - - - 19,213
AJK/FATA - - - - - - - - - - - - - -
-
Total Pakistan 447,441 35,400 39,433 6,692 12,764 93,947 - 1,097 - 3,677 - - - 640,451
FERTILIZER DOMESTIC NUTRIENT OFFTAKE (AUGUST 2009)
(Tonnes)
PROVINCES NITROGEN PHOSPHATE POTASH TOTAL
PUNJAB 153,571 37,007 664 191,242
SINDH 65,922 16,423 168 82,513
NWFP 14,181 1,942 1 16,124
BALOCHISTAN 7,888 1,447 15 9,350
AJK - - - -
TOTAL PAKISTAN 241,561 56,820 848 299,229

8/8/2019 NFDC Fertilizer Aug 2009
http://slidepdf.com/reader/full/nfdc-fertilizer-aug-2009 19/23
National Fertilizer Development Centre (NFDC)
Street No. 1, Sector H-8/1, Islamabad 19
ANNEX-9
PROVINCE-WISE AND PRODUCT-WISE OFFTAKE OF IMPORTED FERTILIZERS (AUGUST 2009)
(Tonnes)
PROVINCES UREA AS NP SSP DAP TSP SOP NPK MOP MAP TOTAL
10:15:20
Punjab 135,552 - - - 54,721 6,618 629 - - 6,839 204,359
Sindh 9,803 - - - 42,331 869 353 - - 2,097 55,453
NWFP 4,456 - - - 8,968 10 - - - 9 13,443
Balochistan 930 - - - 4,780 - - - - - 5,710
AJK/FATA - - - - - - - - - - -
Total Pakistan 150,741 - - - 110,800 7,497 982 - - 8,945 278,965
FERTILIZER IMPORTED NUTRIENT OFFTAKE (AUGUST 2009)
(Tonnes)
Provinces Nitrogen Phosphate Potash Total
Punjab 72,956 31,772 315 105,043
Sindh 12,360 20,963 177 33,499
NWFP 3,665 4,135 - 7,800
Balochistan 1,288 2,199 - 3,487AJK/FATA - - - -
Total Pakistan 90,269 59,068 491 149,828

8/8/2019 NFDC Fertilizer Aug 2009
http://slidepdf.com/reader/full/nfdc-fertilizer-aug-2009 20/23
National Fertilizer Development Centre (NFDC)
Street No. 1, Sector H-8/1, Islamabad
20
ANNEX-10
TOTAL FERTILIZER PROVINCE-WISE AND PRODUCT-WISE OFFTAKE (AUGUST 2009)
(Tonnes)
PROVINCES UREA CAN AS NP SSP DAP TSP SOP NPK's MOP MAP TOTAL
1+2 1+2 1+2 Total
Punjab 418,282 26,971 - 23,275 18,856 114,369 6,618 629 3,723 - 6,839 619,562
Sindh 129,921 7,832 - 15,385 30 69,911 869 353 958 - 2,097 227,356
NWFP 33,304 447 - 530 570 12,699 10 - 6 - 9 47,575
Balochistan 16,675 150 - 243 - 7,768 - - 87 - - 24,923
AJK/FATA - - - - - - - - - - - -
Total Pakistan 598,182 35,400 - 39,433 19,456 204,747 7,497 982 4,774 - 8,945 919,416
TOTAL FERTILIZER NUTRIENT OFFTAKE (AUGUST 2009)
(Tonnes)
Provinces Nitrogen Phosphate Potash Total
Punjab 226,526 68,779 979 296,285
Sindh 78,282 37,386 344 116,012
NWFP 17,846 6,076 1 23,923
Balochistan 9,176 3,646 15 12,837
AJK/FATA - - - -
Total Pakistan 331,830 115,888 1,339 449,057

8/8/2019 NFDC Fertilizer Aug 2009
http://slidepdf.com/reader/full/nfdc-fertilizer-aug-2009 21/23
National Fertilizer Development Centre (NFDC)
Street No. 1, Sector H-8/1, Islamabad
21
ANNEX-11
FERTILIZER PRODUCTION BY PRODUCT AND MANUFACTURER (2009-10)
(Tonnes)
PRODUCT MANUFAC. JULY AUG SEP OCT NOV DEC JAN FEB MAR APR MAY JUN TOTAL
UREA DHL 45,950 48,795 - - - - - - - - - - 94,745
UREA ECPL 87,941 88,006 - - - - - - - - - - 175,947
UREA (PAFL) AZGARD 34,263 35,047 - - - - - - - - - - 69,310
UREA (PAK-ARAB) FATIMA 5,770 10,557 - - - - - - - - - - 16,327
UREA (PAK-SAUDI)MM FFC 69,663 70,165 - - - - - - - - - - 139,828
UREA (P.) G. MACHI FFC 143,191 142,546 - - - - - - - - - - 285,737
UREA (G.) FFBL FFC 54,788 57,565 - - - - - - - - - - 112,353
TOTAL UREA 441,566 452,681 - - - - - - - - - - 894,247
CAN (PAK-ARAB) FATIMA 16,916 36,425 - - - - - - - - - - 53,341
NP (PAK-ARAB) FATIMA 13,464 29,847 - - - - - - - - - - 43,311
DAP (SONA) FFBL FFC 47,417 59,361 - - - - - - - - - - 106,778
SSP LCFL AL-HAMD 4,568 8,420 - - - - - - - - - - 12,988
SSP (HPFL) AZGARD 8,741 9,326 - - - - - - - - - - 18,067
NP ECPL 2,687 6,479 - - - - - - - - - - 9,166
NPKs ( Various grades ) ECPL 3,891 853 - - - - - - - - - - 4,744
G. TOTAL 539,250 603,392 - - - - - - - - - - 1,142,642

8/8/2019 NFDC Fertilizer Aug 2009
http://slidepdf.com/reader/full/nfdc-fertilizer-aug-2009 22/23
National Fertilizer Development Centre (NFDC)
Street No. 1, Sector H-8/1, Islamabad
22
ANNEX-12
RAINFALL (AUGUST 2009)
(MM)
STATION JUL AUG SEP OCT NOV DEC JAN FEB MAR APR MAY JUN TOTAL
Peshawar 22.5 43.8 - - - - - - - - - - 66.3
Kamra 89.0 169.0 - - - - - - - - - - 258.0
Rawalpindi 88.5 202.4 - - - - - - - - - - 290.9
Jhelum 130.0 164.3 - - - - - - - - - - 294.3
Sargodha 6.6 54.8 - - - - - - - - - - 61.4
Lahore 110.9 92.0 - - - - - - - - - - 202.9
D.I. Khan 70.7 58.6 - - - - - - - - - - 129.3
Faisalabad 52.5 137.4 - - - - - - - - - - 189.9
Multan 43.2 6.0 - - - - - - - - - - 49.2
Khanpur 49.4 1.2 - - - - - - - - - - 50.6
Quetta - 0.6 - - - - - - - - - - 0.6
Rohri 11.2 - - - - - - - - - - - 11.2
Hyderabad 88.5 72.0 - - - - - - - - - - 160.5
Source: National Agromet Centre, Islamabad.

8/8/2019 NFDC Fertilizer Aug 2009
http://slidepdf.com/reader/full/nfdc-fertilizer-aug-2009 23/23
National Fertilizer Development Centre (NFDC)
Street No. 1, Sector H-8/1, Islamabad
23
ANNEX-13
Despatches of Imported Fertilizer
Product Qty M/Tons Imported by Name of Ship Date of Berthing Remarks
UREA 32,210 TCP MV RADONEZH 31-5-09 COMPLETED
DAP 36,804 PVT SECTOR MV BARA 04-8-09 COMPLETED
UREA 32,700 TCP MV NIKOLAY 03-8-09 COMPLETED
UREA 26,324 TCP MV NAVISION TRADER 06-8-09 COMPLETED
UREA 26,767 TCP MV IBD SHIF BULKER 07-8-09 COMPLETED
UREA 28,673 TCP MV SHEN MING HONG-7 07-8-09 COMPLETED
DAP 41,990 PVT SECTOR MY STAR THETA 12-8-09 COMPLETED
UREA 27,673 TCP MV SUN RISE 15-8-09 COMPLETED
DAP 30,030 PVT SECTOR MV ALAM SLAMAT 19-8-09 COMPLETED
UREA 33,130 TCP MV ST MARK 18-8-09 COMPLETED
DAP 31,012 PVT SECTOR MV POS JADE 22-8-09 U/HANDLING
DAP 39,300 PVT SECTOR MV ID NORD 31-8-09 U/HANDLING
DAP 43,889 PVT SECTOR MV OCEAN ISLAND 31-8-09 U/HANDLING
Related Documents