G0MRF Pre-Amplifier NF + VNA measurements Measurement report Wouter Weggelaar PA3WEG Wouter Weggelaar PA3WEG FUNcube technical team 21 st of October 2011

Welcome message from author
This document is posted to help you gain knowledge. Please leave a comment to let me know what you think about it! Share it to your friends and learn new things together.
Transcript
G0MRF Pre-AmplifierNF + VNA measurements
Measurement reportWouter Weggelaar
PA3WEG
Wouter WeggelaarPA3WEGFUNcube technical team21st of October 2011
G0MRF Pre-Amplifier Measurements PA3WEG, FUNcube technical team
Table of ContentsNoise Figure and in-band gain ............................................................................................................3
Equipment used:..............................................................................................................................3Calibration.......................................................................................................................................3Setup................................................................................................................................................3Results..............................................................................................................................................4
VNA measurements..............................................................................................................................5Equipment used:..............................................................................................................................5Calibration.......................................................................................................................................5Setup................................................................................................................................................5Results..............................................................................................................................................5
G0MRF Pre-Amplifier Measurements PA3WEG, FUNcube technical team
Noise Figure and in-band gain The first measurement performed was the NF and in-band gain measurement. The results of the analyzer could not be saved to disk due to a disk drive failure.
Equipment used:• Agilent N8973A noise analyzer• Hewlett Packard 346A noise source• Bias tee• Delta elektronica power supply set to 5V
CalibrationMeasurements were done with the correct ENR table loaded into the analyzer, and by performing a calibration first with the bias-T in circuit. The reference plane is at the noise head N-female connector and at the Bias-T N-female connector.
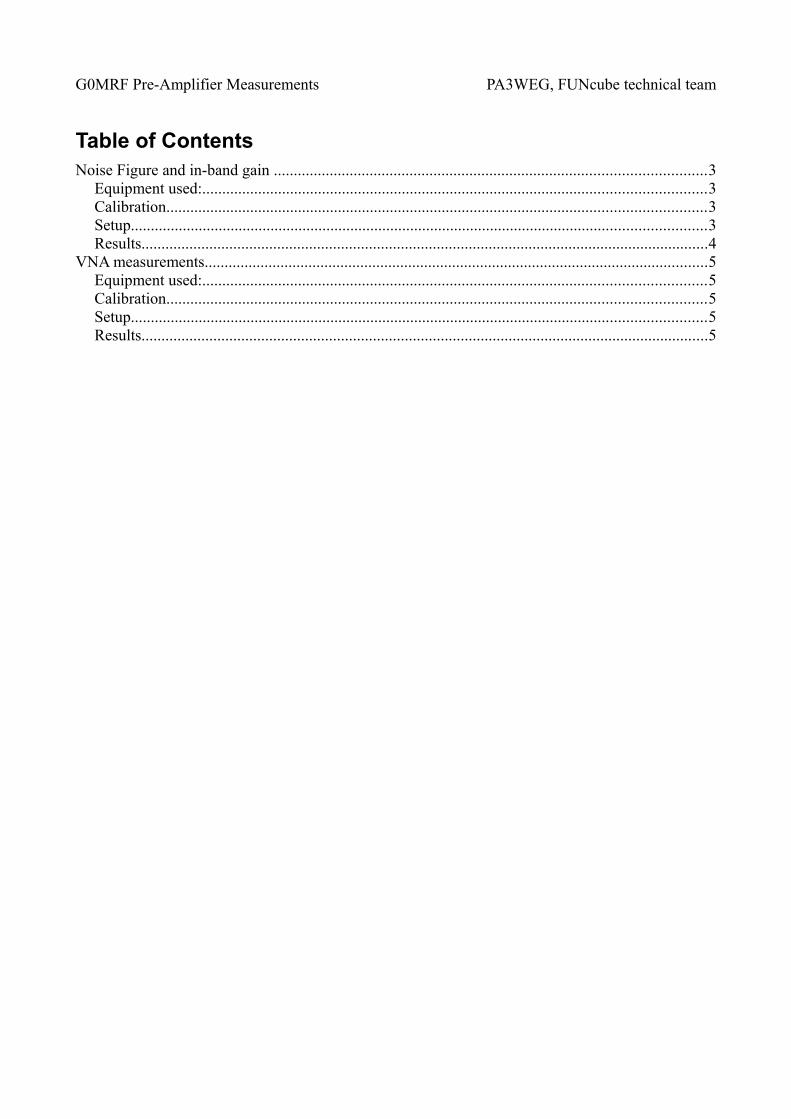
SetupThe setup consist of the noise analyzer, connected to the noise head by means of a BNC cable. The output of the noise head is connected to the Pre-Amp input by using an N-N male adaptor. The Pre-Amp has a BNC connection to the transceiver. This is connected to the bias-T by means of a BNC-BNC male coupler + BNC-female to N-male adaptor. The Bias-T is in turn connected to the analyzer with an N-male cable. The setup is shown in figure 1.
Figure 1: Measurement setup
G0MRF Pre-Amplifier Measurements PA3WEG, FUNcube technical team
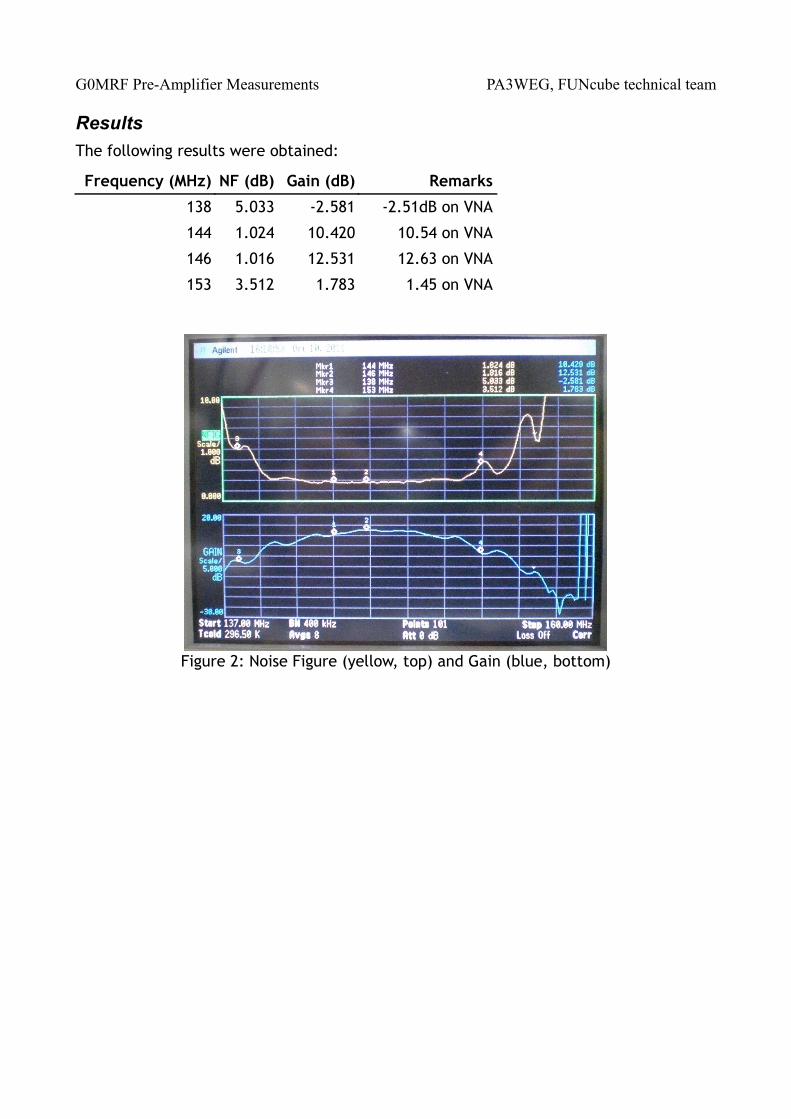
ResultsThe following results were obtained:
Frequency (MHz) NF (dB) Gain (dB) Remarks
138 5.033 -2.581 -2.51dB on VNA
144 1.024 10.420 10.54 on VNA
146 1.016 12.531 12.63 on VNA
153 3.512 1.783 1.45 on VNA
Figure 2: Noise Figure (yellow, top) and Gain (blue, bottom)
G0MRF Pre-Amplifier Measurements PA3WEG, FUNcube technical team
VNA measurementsThe VNA measurements were done after NF measurements. Two frequency ranges were swept.
Equipment used:• Anritsu MS2034A Vector Network Analyzer• Phase stable Anritsu measurement cable• Calibration kit Anritsu OSLN-50-1 S/N 0801062• Load: Anritsu SM / PL-1 sn 0748110• Through: Anritsu 34NN50A• Bias-T• Delta elektronica power supply set to 5V
CalibrationCalibration was performed with the bias-T in circuit. The reference plane is at the VNA measurement cable RF out N-female connector and at the Bias-T N-female connector.
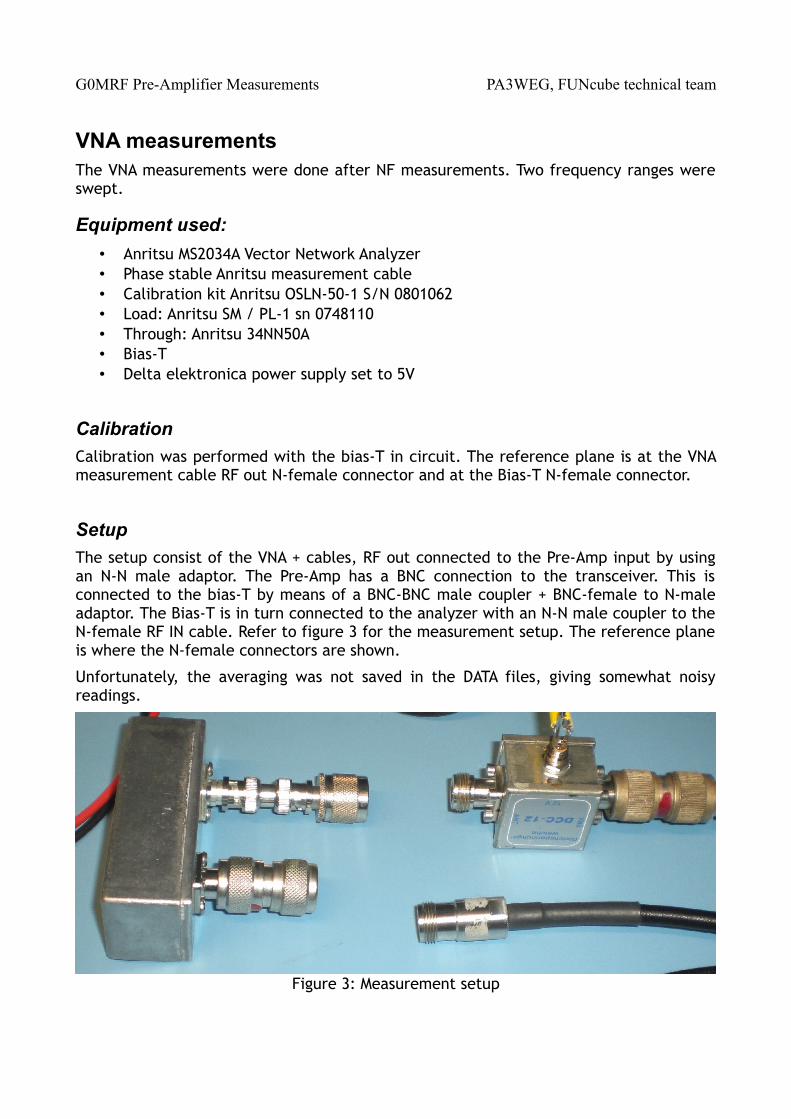
SetupThe setup consist of the VNA + cables, RF out connected to the Pre-Amp input by using an N-N male adaptor. The Pre-Amp has a BNC connection to the transceiver. This is connected to the bias-T by means of a BNC-BNC male coupler + BNC-female to N-male adaptor. The Bias-T is in turn connected to the analyzer with an N-N male coupler to the N-female RF IN cable. Refer to figure 3 for the measurement setup. The reference plane is where the N-female connectors are shown.
Unfortunately, the averaging was not saved in the DATA files, giving somewhat noisy readings.
Figure 3: Measurement setup
G0MRF Pre-Amplifier Measurements PA3WEG, FUNcube technical team
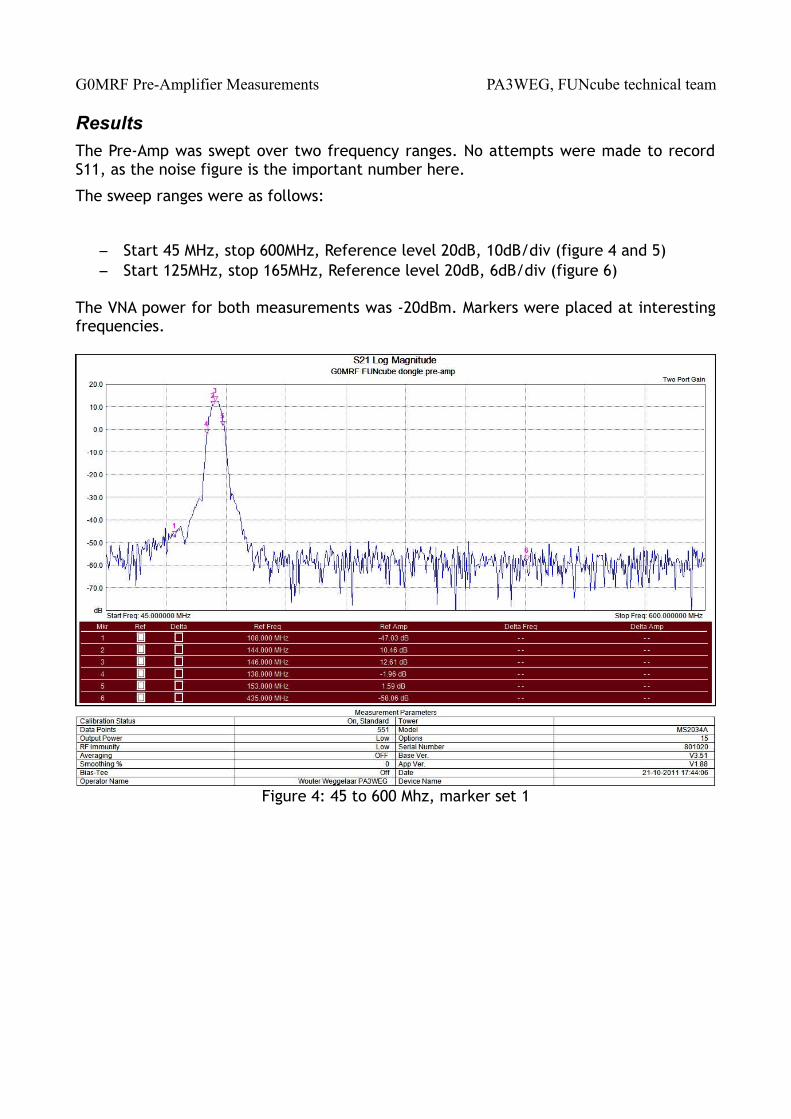
ResultsThe Pre-Amp was swept over two frequency ranges. No attempts were made to record S11, as the noise figure is the important number here.
The sweep ranges were as follows:
– Start 45 MHz, stop 600MHz, Reference level 20dB, 10dB/div (figure 4 and 5)– Start 125MHz, stop 165MHz, Reference level 20dB, 6dB/div (figure 6)
The VNA power for both measurements was -20dBm. Markers were placed at interesting frequencies.
Figure 4: 45 to 600 Mhz, marker set 1
G0MRF Pre-Amplifier Measurements PA3WEG, FUNcube technical team
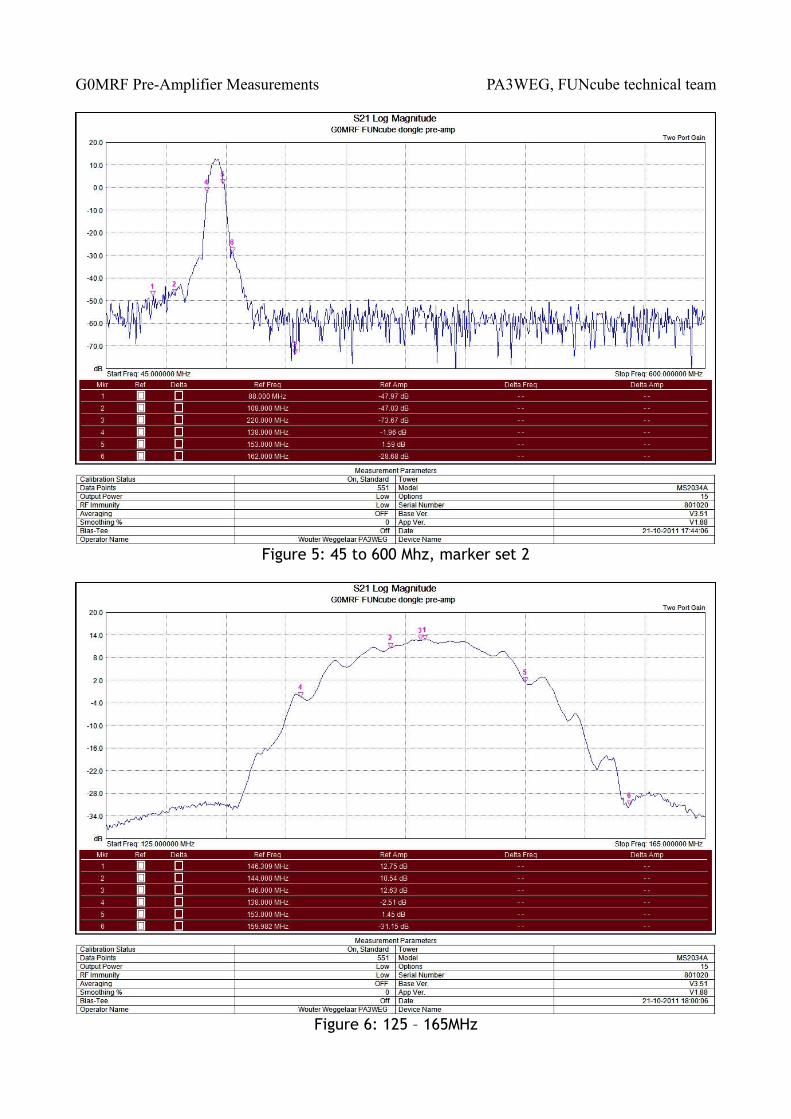
Figure 5: 45 to 600 Mhz, marker set 2
Figure 6: 125 – 165MHz
G0MRF Pre-Amplifier Measurements PA3WEG, FUNcube technical team
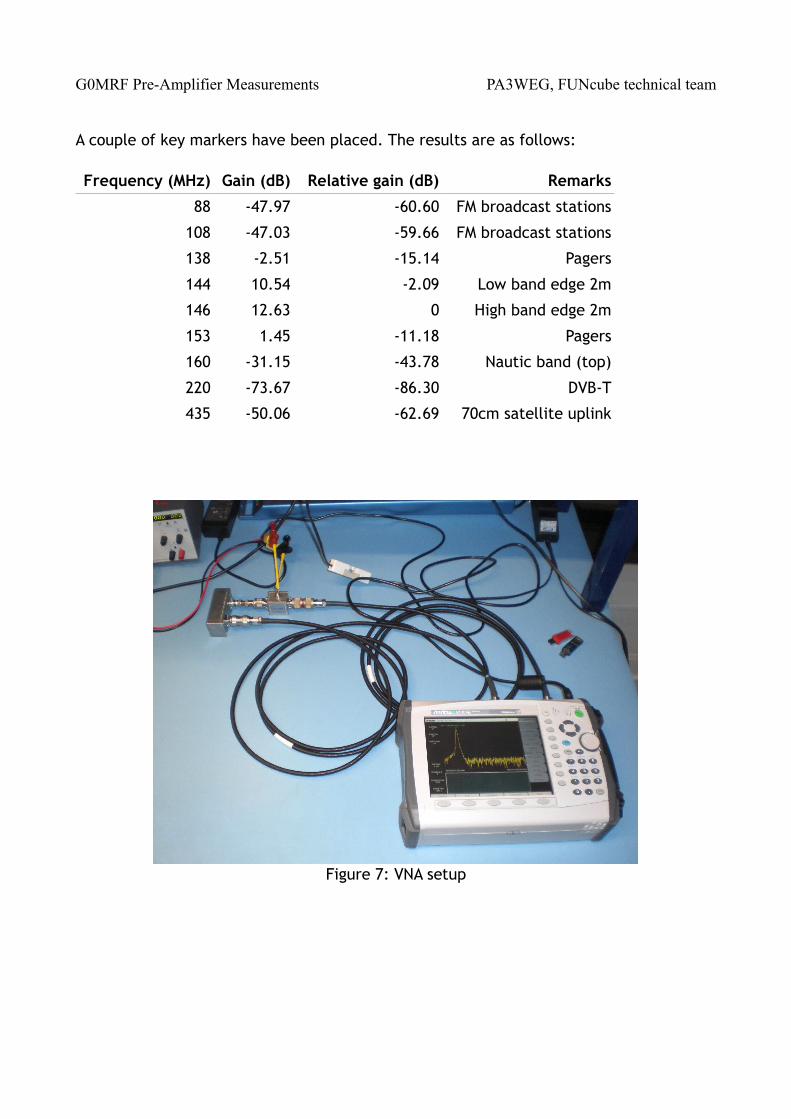
A couple of key markers have been placed. The results are as follows:
Frequency (MHz) Gain (dB) Relative gain (dB) Remarks
88 -47.97 -60.60 FM broadcast stations
108 -47.03 -59.66 FM broadcast stations
138 -2.51 -15.14 Pagers
144 10.54 -2.09 Low band edge 2m
146 12.63 0 High band edge 2m
153 1.45 -11.18 Pagers
160 -31.15 -43.78 Nautic band (top)
220 -73.67 -86.30 DVB-T
435 -50.06 -62.69 70cm satellite uplink
Figure 7: VNA setup
Related Documents