Journal of Electron Spectroscopy and Related Phenomena 100 (1999) 119–135 www.elsevier.nl / locate / elspec NEXAFS spectromicroscopy of polymers: overview and quantitative analysis of polyurethane polymers a b, a a * Stephen G. Urquhart , Adam P. Hitchcock , Archie P. Smith , Harald W. Ade , c c c Werner Lidy , Ed G. Rightor , Gary E. Mitchell a Department of Physics, North Carolina State University, Raleigh, NC 27695-8202, USA b Brockhouse Institute for Materials Research, McMaster University, Hamilton, ONT, Canada L8S 4M1 c Dow Chemical USA, Midland, MI 48667, USA Received 4 January 1999; accepted 19 April 1999 Abstract The successful application of X-ray spectromicroscopy to chemical analysis of polymers is reviewed and a detailed application to quantitative analysis of polyurethanes is presented. Near Edge X-ray Absorption Fine Structure (NEXAFS) spectroscopy is the basis of chemical sensitive X-ray imaging, as well as qualitative and quantitative micro-spectroscopy. These capabilities are demonstrated by a review of recent work, and by presentation of new results outlining a methodology for quantitative speciation of polyurethane polymers. C 1s inner-shell excitation spectra of a series of molecular and polymeric model compounds, recorded by gas phase inelastic electron scattering (ISEELS) and solid phase NEXAFS techniques, are used to understand the spectroscopic basis for chemical analysis of polyurethanes. These model species contain the aromatic urea, aromatic urethane (carbamate) and aliphatic ether functionalities that are the main constituents of polyurethane polymers. Ab initio calculations of several of the model molecular compounds are used to support spectral assignments and give insight into the origin and relative intensities of characteristic spectral features. The model polymer spectra provide reference standards for qualitative identification and quantitative analysis of polyurethane polymers. The chemical compositions of three polyurethane test polymers with systematic variation in urea / urethane content are measured using the spectra of model toluene diisocyanate (TDI) urea, TDI-carbamate, and poly(propylene oxide) polymers as reference standards. 1999 Elsevier Science B.V. All rights reserved. Keywords: NEXAFS microscopy; Polyurethanes; Molecular models; Polymer quantitative analysis 1. Introduction Structure (NEXAFS) [3]. Recently there has been considerable activity in developing inner-shell exci- Inner-shell excitation of molecules and solids can tation spectroscopy as a high spatial resolution be studied by either inelastic electron scattering analytical technique, as in NEXAFS X-ray micro- (Inner Shell Electron Energy Loss Spectroscopy, scopy [4–12] or Electron Energy Loss Spectroscopy ISEELS) [1,2] or Near Edge X-ray Absorption Fine (EELS) in a transmission electron microscope [13,14]. In this form, inner-shell excitation spec- troscopy provides a useful tool for the microanalysis *Corresponding author. E-mail address: [email protected] (A.P. Hitchcock) of many types of materials including polymers. 0368-2048 / 99 / $ – see front matter 1999 Elsevier Science B.V. All rights reserved. PII: S0368-2048(99)00043-2

Welcome message from author
This document is posted to help you gain knowledge. Please leave a comment to let me know what you think about it! Share it to your friends and learn new things together.
Transcript

Journal of Electron Spectroscopy and Related Phenomena 100 (1999) 119–135www.elsevier.nl / locate /elspec
NEXAFS spectromicroscopy of polymers: overview and quantitativeanalysis of polyurethane polymers
a b , a a*Stephen G. Urquhart , Adam P. Hitchcock , Archie P. Smith , Harald W. Ade ,c c cWerner Lidy , Ed G. Rightor , Gary E. Mitchell
aDepartment of Physics, North Carolina State University, Raleigh, NC 27695-8202, USAbBrockhouse Institute for Materials Research, McMaster University, Hamilton, ONT, Canada L8S 4M1
cDow Chemical USA, Midland, MI 48667, USA
Received 4 January 1999; accepted 19 April 1999
Abstract
The successful application of X-ray spectromicroscopy to chemical analysis of polymers is reviewed and a detailedapplication to quantitative analysis of polyurethanes is presented. Near Edge X-ray Absorption Fine Structure (NEXAFS)spectroscopy is the basis of chemical sensitive X-ray imaging, as well as qualitative and quantitative micro-spectroscopy.These capabilities are demonstrated by a review of recent work, and by presentation of new results outlining a methodologyfor quantitative speciation of polyurethane polymers. C 1s inner-shell excitation spectra of a series of molecular andpolymeric model compounds, recorded by gas phase inelastic electron scattering (ISEELS) and solid phase NEXAFStechniques, are used to understand the spectroscopic basis for chemical analysis of polyurethanes. These model speciescontain the aromatic urea, aromatic urethane (carbamate) and aliphatic ether functionalities that are the main constituents ofpolyurethane polymers. Ab initio calculations of several of the model molecular compounds are used to support spectralassignments and give insight into the origin and relative intensities of characteristic spectral features. The model polymerspectra provide reference standards for qualitative identification and quantitative analysis of polyurethane polymers. Thechemical compositions of three polyurethane test polymers with systematic variation in urea /urethane content are measuredusing the spectra of model toluene diisocyanate (TDI) urea, TDI-carbamate, and poly(propylene oxide) polymers asreference standards. 1999 Elsevier Science B.V. All rights reserved.
Keywords: NEXAFS microscopy; Polyurethanes; Molecular models; Polymer quantitative analysis
1. Introduction Structure (NEXAFS) [3]. Recently there has beenconsiderable activity in developing inner-shell exci-
Inner-shell excitation of molecules and solids can tation spectroscopy as a high spatial resolutionbe studied by either inelastic electron scattering analytical technique, as in NEXAFS X-ray micro-(Inner Shell Electron Energy Loss Spectroscopy, scopy [4–12] or Electron Energy Loss SpectroscopyISEELS) [1,2] or Near Edge X-ray Absorption Fine (EELS) in a transmission electron microscope
[13,14]. In this form, inner-shell excitation spec-troscopy provides a useful tool for the microanalysis*Corresponding author.
E-mail address: [email protected] (A.P. Hitchcock) of many types of materials including polymers.
0368-2048/99/$ – see front matter 1999 Elsevier Science B.V. All rights reserved.PI I : S0368-2048( 99 )00043-2

120 S.G. Urquhart et al. / Journal of Electron Spectroscopy and Related Phenomena 100 (1999) 119 –135
However, for maximum analytical utility it is im- of aromatic and aliphatic components of poly-portant to have spectra of compounds of known urethanes. Here we explore how the spectra of modelstructure for fingerprint purposes. In most cases, it is polymers can be used as standards for quantitation ofalso very helpful to have detailed spectroscopic the three principle components of a complex poly-assignments based on comparisons of series of urethane (ether, urea, and urethane). Quantitative,closely related chemical species, aided by the results spatially resolved analysis of functional group com-of high-quality quantum chemical calculations [15– position (particularly the urea and urethane content)18]. This article briefly reviews X-ray spectromicros- is needed to help understand the chemical basis forcopy and its applications to polymer microanalysis. the microstructure of polyurethane polymersWe subsequently document the power of NEXAFS [21,25,26]. Such information can be correlated withspectroscopy by demonstrating quantitative specia- physical and mechanical properties and then be usedtion of polyurethane polymers. We emphasize the use to optimize formulation chemistry [21].of co-ordinated, complementary ISEELS and NEX- This paper is organized as follows. Section 2AFS studies of model compounds to assist the provides a brief description of the current status ofanalysis of the spectra of these complex polymers. soft X-ray spectromicroscopy, as it applies to poly-The chemical analysis capability is exemplified by mers. An example of its application to poly(ethylenethe use of NEXAFS spectroscopy for the quantitative terephthalate) /VectraE blends [27] is given in somecompositional analysis of urea and urethane linkages detail. Section 3 uses a sample STXM micrograph toin polyurethane polymers. In this work, we deal motivate the work on quantitative compositionalexclusively with the spectroscopic basis for the analysis of polyurethane polymers. It then presentsspeciation and its application to homogeneous model the spectroscopic basis for speciation of the principlepolymers; demonstration of speciation on a sub- components of polyurethanes, based on experimentalmicron spatial scale by NEXAFS spectromicroscopy studies (Section 3.1) and ab initio calculationsis presented elsewhere [19,20]. (Section 3.2) of model molecules, and STXM studies
Polyurethanes are complex materials that may of single component polymer model compoundsconsist of a variety of component species, depending (Section 3.3). Section 4 then applies this knowledgeon both the reagents and conditions of polymeri- to quantitative speciation of three model poly-zation [21]. Polyurethanes are formed from three urethanes, custom synthesized to test the quantitationprimary components: diisocyanate monomer, multi- capabilities of NEXAFS spectroscopy. All spectra offunctional polyether-polyols, and water. For many model single and multiple component polymers wereapplications the diisocyanate is an aromatic com- obtained using either the NSLS or ALS scanningpound – typically either toluene diisocyanate (mixed transmission X-ray microscopes (STXM) in order to2,4 and 2,6 isomers) (TDI) or 4,49 methylene have a proper evaluation of these NEXAFS micro-bis(phenyl isocyanate) (MDI). Two linkages are the scopes for the desired quantitation, under conditionsprimary building blocks of the polyurethane back- identical to that used to study heterogeneous polymerbone: urethane (carbamate) and urea. Urethane link- samples [19,20].ages are formed by the one step reaction of anisocyanate group with the OH group of a polyether-polyol. Urea linkages are the outcome of a two step 2. Current status of X-ray spectromicroscopy ofreaction of two isocyanate groups and water, where polymersCO gas is evolved.2
The spectra of model polymers are used to provide Spectromicroscopy refers to the combined use ofreference standards for the quantitative analysis selective energy imaging and spectroscopy at high(‘speciation’) of polyurethane polymers. We began spatial resolution. It is an integration of the spectro-the exploration of the use of core excitation for scopic and imaging aspects of analytical microscopy.quantitative analysis a number of years ago by Synchrotron-based X-ray microscopy in various im-demonstrating that both EELS [22,23] and NEXAFS plementations is an excellent example of spectromic-[24] are able to distinguish and quantify the amounts roscopy. There are X-ray microscopes in both the

S.G. Urquhart et al. / Journal of Electron Spectroscopy and Related Phenomena 100 (1999) 119 –135 121
soft X-ray (,1500 eV) and hard X-ray regimes energy resolution than presently existing full-field(.1500 eV) at many of the world’s synchrotrons. imaging soft X-ray microscopes (TXM).Initial developments in zone plate based X-ray A schematic of a STXM beamline is presented inmicroscopy focused on biological applications [5]. Fig. 1. The Stony Brook STXM at the NationalMore recently, the potential for powerful and often Synchrotron Light Source (NSLS) [10] and theunique applications in material science and molecu- BL7.0.1 STXM at the ALS [11,12] use undulators aslar environmental science has become appreciated. the X-ray source. Undulators are several orders ofThe lower radiation damage [28], excellent chemical magnitude brighter than bending magnet sources andsensitivity [4,10], and ability to examine solvated about eight to ten orders of magnitude brighter thanmaterials [29–31] are some of the strengths relative non-tunable laboratory X-ray tubes. In a STXM,to electron microscopy techniques. At present, the monochromated X-rays are focussed by a Fresnelprospects for significant contributions by X-ray zone plate, which is a circular, variable line density,microscopy to polymer science and technology are transmission diffraction grating. A central stop in theexcellent. The number of X-ray microscopes has zone plate, in conjunction with a slightly smallerbeen growing rapidly in the last few years, with new order sorting aperture (OSA), is used to isolate themicroscopes coming on-line at the Advanced Light positive first order diffraction and to suppress un-Source (ALS) in Berkeley [11,12] and other third wanted diffraction orders. In most instruments thegeneration synchrotron radiation facilities world- sample is mechanically raster scanned in the focalwide. plane of the spot, although one zone plate based
Volume 84 of this journal was a special issue that X-ray microscope has recently been implemented ingave a comprehensive overview of all types of soft which an over-filled zone plate rather than theX-ray spectromicroscopy. Here we focus our discus- sample is raster scanned [12]. The spot size achievedsion on scanning transmission X-ray microscopy with the zone plate determines the spatial resolution(STXM), as it is this type of instrument that has been of the microscope, which is about 40 nm with theused most extensively for polymer research. STXM best quality zone plates currently available. Theis preferred for high energy resolution NEXAFS sample is located in an air or He atmosphere and ismicroscopy of polymers because radiation damage investigated at room temperature.rates are reduced relative to Transmission X-ray In addition to imaging, the focused beam can beMicroscopy (TXM) (no low efficiency optical ele- left on the same spot while the photon energy isments after the sample), and because current genera- scanned. Absorption spectra (optical density, OD)tion STXM microscopes can perform both micro- are then derived from the transmitted X-ray intensityspectroscopy and energy selective imaging at higher as (2ln(I /I )), where an energy scan from the sample0
Fig. 1. Schematic of a scanning transmission X-ray microscope.

122 S.G. Urquhart et al. / Journal of Electron Spectroscopy and Related Phenomena 100 (1999) 119 –135
(I) is normalized to another energy scan recorded siderably lower in soft X-ray spectroscopy than inwithout a sample (I ). Quantitative analysis is pro- TEM–EELS [28], radiation damage is still of some0
vided by the Beer’s law dependence of the ab- concern, particularly when high quality spectra aresorbance: acquired from small sample areas or the sample is
particularly radiation sensitive. Acquiring spectraA 5 OD 5 mrt 5 2 ln(I /I )0 indirectly through a sequence of images (‘stacks’where m is the energy dependent mass absorption [32]) or linescans, can offer considerable advantagescoefficient, r is the density, and t is the sample in such cases, since image acquisition generallythickness. Spectra are acquired with resolving pow- requires lower dose per pixel than point spectra. Aers of 2000–9000, corresponding to an energy STXM capable of examining samples at cryogenicresolution in the C 1s region of about 0.2 eV at NSLS temperatures has recently been implemented atand better than 0.1 eV at the ALS. In principle, all NSLS [33]. Cooling the sample is known to reduceelements with inner shell thresholds in the 150–1200 the rate of radiation damage in TEM of polymers. AeV energy range can be accessed with NEXAFS similar beneficial effect is expected when cryo-microscopy, although most work to date has used the STXM techniques are applied to polymers.carbon 1s edge. At this core edge, energy calibration Many polymer systems and problems have alreadyis provided in situ by leaking CO into the micro- been investigated with NEXAFS microscopy. These2
scope atmosphere while the sample is in place [10]. include studies of: morphology of poly(ethyleneTypically, polymer sections |100 nm in thickness terphthalate)–polycarbonate (PET/PC) blends with-
are optimum for carbon K-edge NEXAFS. Samples out staining [8]; morphology and composition ofmuch thinner than 80 nm often suffer rapid beam PET–oxybenzoate /oxynapthoate (VectraE) blendsdamage and their spectra have a poor signal to noise [27], rubber toughened poly(methyl methacrylate)ratio whereas the spectra of samples much thicker (PMMA) [34,35], and macrophase-separated randomthan 200 nm can be distorted by absorption satura- block copolymer /homopolymer blends [36]; orienta-tion. Spectroscopy of thicker samples is a particular tion of molecular chains in Kevlar [7,9] and onproblem when the beam is contaminated by higher rubbed polyimide surfaces [37]; chemical changesorder photons or if the X-ray detector has appreci- inside wear tracks in lubrication layers on hard disksable dark noise. This effect causes an attenuation of [38,39]; dewetting and phase separation kinetics instrongly absorbing features. If required, spectra can polymer thin films [40–42]; characterization of phasebe normalized for thickness and density variations separation during processing, such as precipitates inbetween different sample locations by utilizing the polyurethanes [4,43] and multi-phase liquid crys-high energy continuum cross-section (.320 eV for talline polyesters [44]; chemical mechanism of fire-C 1s NEXAFS) where the signal is only sensitive to resistance imparted to heat treated polyacrylonitrileelemental composition. Similarly, density and thick- fibers [45]; development of exposure strategies forness variations in images can be detected and poly(methyl methacrylate) resists [46]; variation ofcorrected for by acquiring an image above 320 eV, or cross-linking in non-uniformly cross-linked hydratedby isolating the chemical composition information polymers [29,30]; micro-emulsions in thin polymervia ratios of images. films [31]; as well as studies of biological [5,47] and
In principle, the spatial resolution of NEXAFS organic geochemical [48–51] samples. Several re-microscopy is much lower than that obtained with views, which describe details and provide imagestransmission electron microscopy (TEM). However, and spectra from most of these applications, havein practice, the need for a high dose to acquire useful been published relatively recently [4,52].core excitation spectra by electron energy lossspectroscopy (EELS), combined with the low critical 2.1. NEXAFS microscopy of poly(ethylenedose for radiation damage of most polymers, means terephthalate) /VectraE blendsthat the effective spatial resolution that can beachieved for analytical measurements is often com- Here, we exemplify the power of NEXAFS micro-parable [28]. While radiation damage rates are con- scopy with a recent application that allowed us to
S.G. Urquhart et al. / Journal of Electron Spectroscopy and Related Phenomena 100 (1999) 119 –135 123
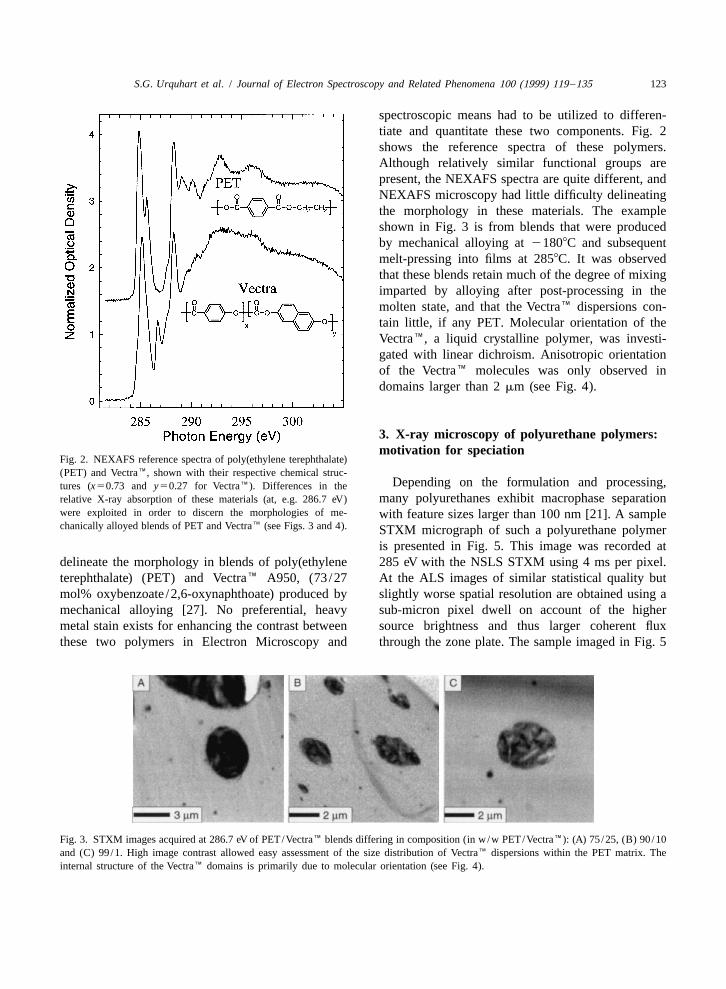
spectroscopic means had to be utilized to differen-tiate and quantitate these two components. Fig. 2shows the reference spectra of these polymers.Although relatively similar functional groups arepresent, the NEXAFS spectra are quite different, andNEXAFS microscopy had little difficulty delineatingthe morphology in these materials. The exampleshown in Fig. 3 is from blends that were producedby mechanical alloying at 21808C and subsequentmelt-pressing into films at 2858C. It was observedthat these blends retain much of the degree of mixingimparted by alloying after post-processing in themolten state, and that the VectraE dispersions con-tain little, if any PET. Molecular orientation of theVectraE, a liquid crystalline polymer, was investi-gated with linear dichroism. Anisotropic orientationof the VectraE molecules was only observed indomains larger than 2 mm (see Fig. 4).
3. X-ray microscopy of polyurethane polymers:motivation for speciation
Fig. 2. NEXAFS reference spectra of poly(ethylene terephthalate)(PET) and VectraE, shown with their respective chemical struc-
Depending on the formulation and processing,tures (x50.73 and y50.27 for VectraE). Differences in themany polyurethanes exhibit macrophase separationrelative X-ray absorption of these materials (at, e.g. 286.7 eV)
were exploited in order to discern the morphologies of me- with feature sizes larger than 100 nm [21]. A samplechanically alloyed blends of PET and VectraE (see Figs. 3 and 4). STXM micrograph of such a polyurethane polymer
is presented in Fig. 5. This image was recorded atdelineate the morphology in blends of poly(ethylene 285 eV with the NSLS STXM using 4 ms per pixel.terephthalate) (PET) and VectraE A950, (73/27 At the ALS images of similar statistical quality butmol% oxybenzoate /2,6-oxynaphthoate) produced by slightly worse spatial resolution are obtained using amechanical alloying [27]. No preferential, heavy sub-micron pixel dwell on account of the highermetal stain exists for enhancing the contrast between source brightness and thus larger coherent fluxthese two polymers in Electron Microscopy and through the zone plate. The sample imaged in Fig. 5
Fig. 3. STXM images acquired at 286.7 eV of PET/VectraE blends differing in composition (in w/w PET/VectraE): (A) 75/25, (B) 90/10and (C) 99/1. High image contrast allowed easy assessment of the size distribution of VectraE dispersions within the PET matrix. Theinternal structure of the VectraE domains is primarily due to molecular orientation (see Fig. 4).

124 S.G. Urquhart et al. / Journal of Electron Spectroscopy and Related Phenomena 100 (1999) 119 –135
Fig. 4. STXM images acquired at 286.7 eV of a 99/1 w/w PET/VectraEM blend subjected to post-milling melt pressing. Images (A) and(B) have been converted to optical density which is why the contrast appears reversed to the images in Fig. 3. In images (A) and (B), the
¢electric polarization vector (E) is rotated by 908 with respect to each other, as indicated. Differences in intensity in these images areprimarily due to anisotropic molecular orientation. The ratio of these images (C) reveals the linear dichroism of the specimen. SmallVectraE domains appear gray and possess no discernible orientation, whereas the large dispersion exhibits a measurable degree of molecularorientation (black and white areas) due to the nematic nature of this liquid crystalline polymer.
is a thin section of a high water, TDI-based poly- objective in studying these polyurethane polymers isurethane plaque. TEM micrographs of high water to quantify and map the composition, in particularpolyurethanes exhibit a similar appearance. TEM the urea and urethane content, and possibly that ofresults, along with analytical results from other minority species, in a variety of formulations andsample characterization techniques, have been pre- thereby determine relationships between chemicalsented elsewhere [25,26]. The strong contrast at 285 composition, processing, and properties of the finaleV is reflective of the high aromatic content of the polymer product. The ultimate goal of the quantita-precipitates in this high water polyurethane. Our tive analysis methodology is to be able to determine
the functional group composition at the instrumentalresolution in an image like that in Fig. 5.
3.1. Molecular model studies by ISEELSspectroscopy
While there is considerable literature of coreexcitation spectroscopic studies of small and mediumsize molecules in the gas phase [2], there have beenrelatively few studies directly targeted at using gasphase species to model polymer components. Amongthese are papers dealing with Inner Shell ElectronEnergy Loss Spectroscopy (ISEELS) studies ofsmall molecule modeling of poly(ethylene tere-phthalate) and its isomers [28,53,54], polyurethanes[22,23], conducting polymers [55,56], and Lang-muir–Blodgett chains on surfaces [57–59]. In sever-
Fig. 5. STXM image of a high-water, TDI-based polyurethane al of these cases the gas phase spectra were helpfulrecorded at 285 eV with the NSLS STXM using 4 ms per pixel. in interpreting aspects of the polymer spectraThe dark areas are aromatic-rich hard segments, while the uniform [22,23,56], and led to useful insights as to how tomatrix is enriched in the aliphatic polyether component. The
use the NEXAFS spectra for analytical purposesultimate goal of the quantitative analysis methodology is to[54].determine the functional group composition at each pixel in this
type of image. As microanalytical tools based on inner shell

S.G. Urquhart et al. / Journal of Electron Spectroscopy and Related Phenomena 100 (1999) 119 –135 125
excitation continue to improve and the problems that the spectra are dominated by electric dipoleaddressed become more complex, it becomes in- transitions and thus are very close to the corre-creasingly important to develop better qualitative and sponding NEXAFS spectra. The energy resolutionquantitative analysis procedures based on compari- was typically 0.7 eV fwhm, with the sharp near edgesons to spectra of compounds with known structures. region recorded with |0.55 eV fwhm resolution. TheIf the spectra of these models contain the same compounds were obtained commercially (ethyl N-spectral features at similar energy resolution to those phenyl urethane (2) – Eastern Chemical; N,N9-contributing to the spectra of polymers of unknown diphenyl urea (1) – Aldrich) or synthesized (2,4-composition, then it should be possible to develop toluene di(methyl carbamate) (3), and 4,49 methyleneaccurate quantitative speciation procedures. Here, we bis(ethyl N-phenyl carbamate) (4)). The spectra ofillustrate the modeling aspects of our polymer micro- most materials were obtained by placing |0.1 g in aanalysis program with a selection of C 1s spectra of metal tube directly attached to the collision cell. Inmolecular compounds and model polymers related to some cases heating was required to achieve anthe principle components of polyurethanes. Scheme adequate vapor density. The energy scale was cali-1 summarizes the structures of the molecules and brated by recording simultaneously the spectrum ofpolymers investigated in this work. the unknown and that of a suitable reference com-
The apparatus and experimental procedures used pound, typically CO, or CO for C 1s studies [61].2
for ISEELS have been described in detail elsewhere Fig. 6 presents the C 1s spectra of gaseous N,N9-[1,60]. A final electron energy of 2.5 keV ensures diphenyl urea (1), ethyl N-phenyl carbamate (2),
Scheme 1. Structures of molecules and model polymers related to polyurethane components that were studied in this work. The numbers areused to identify these species in the text and figures.

126 S.G. Urquhart et al. / Journal of Electron Spectroscopy and Related Phenomena 100 (1999) 119 –135
Energies and proposed assignments of the spectralfeatures are listed in Table 1. The sharp features inthese spectra are associated with transitions from theground state to an excited state in which an electronhas been promoted from a C 1s core orbital to anenergy level that is unoccupied in the ground state.Although all such states rapidly decay to valenceionized states, it is meaningful to consider thosefeatures below the C 1s ionization threshold (|290eV in the free molecules) as quasi-discrete states andthose at higher energies, as short lived resonances inthe C 1s ionization continuum.
While the spectra of all four species (1–4) aredominated by the strong C 1s→p* and CC=C
1s→p* features around 285 and 290 eV, there areC=O
significant differences in detail which allows cleardistinction of the urea and urethane functionalgroups, as well as between the TDI- and MDI-basedmaterials [60]. In particular, relative to the MDIspecies, the TDI species has relatively weaker p*C=C
signals at 285 and 287 eV, since it has only onephenyl ring per two C=O groups, in contrast to MDI,which has one phenyl ring per C=O group. Thus the
Fig. 6. Inner shell electron energy loss (ISEELS) C 1s spectra ofMDI-urethane (4) has a p* /p* intensity ratioC=C C=ON,N9-diphenyl urea (1), ethyl N-phenyl carbamate (2), 2,4-toluenesimilar to that in (2). Perhaps the most significantdi(methyl carbamate) (3) and 4,49 methylene bis(ethyl N-phenyl
carbamate) (4). In each case the as-recorded signal has been difference is that the p* peak in urea is 0.5 eVC=Obackground subtracted and converted to oscillator strength per lower in energy than the p* peak in urethanesC=Ocarbon atom scale. A kinematic correction has been applied to the [24]. In Fig. 6 it appears that the p* feature ofC=OISEELS data to convert dipole regime electron scattering to
urea is weaker than that in the urethane species. Theoscillator strengths. Vertical offsets are used for clarity.urea p* peak is slightly broader, and its intensityC=O
2,4-dimethylcarbamate toluene (called TDI-urethane is reduced, although not as much as suggested by thefor convenience) (3), and 4,49 methylene bis(ethyl peak intensity since the urethane p* peak isC=O
N-phenyl carbamate) (called MDI-urethane) (4). ‘artificially enhanced’ because it sits on a back-
Table 1Energies (60.1 eV) and proposed assignment of features in the C 1s spectra of molecular models for MDI- and TDI-urea and urethanes
Energy (eV) Assignment (final orbital)
[ 1 2 3 4 C–H C–R aliph C=Oa a a a1 285.14 285.29 285.3 285.22 1p*
2 286.4 286.8 286.7 286.6 1p*3 – 288.1 288.1 288.2 2p* s*C–H
4 – 288.9 – 288.8 s*C–H
5 289.45 290.0 289.9 289.9 p*C=O
6 295 294 294 294 s* s*C–C C–C
7 – 298 297 – s*C–C
8 303 304 304 303 s* s* s*C–C C–C C=O
a Calibration: gas: (1) 22.26(8) eV; (2) 22.11(7) eV; (3) 22.1(1) eV; (4) 22.18(6) eV relative to p* transition in CO (287.40) [61].

S.G. Urquhart et al. / Journal of Electron Spectroscopy and Related Phenomena 100 (1999) 119 –135 127
ground from the s* feature of the aliphatic ethyl shape for each calculated excitation. The width ofC–C
group contained in (2) but not in (1). these Gaussians is 0.3 eV for orbitals of eigenvalue(e) 215,e ,0; 1.2 eV for 0,e ,4; and 4.0 for
3.2. Ab initio calculations of polymer model e .4.0 eV. These values correspond to the ex-spectra perimental resolution for discrete transitions, and an
attempt to track the approximate width of theTo aid the spectral assignments ab initio calcula- continuum resonances which are lifetime broadened
tions have been performed on the C 1s excitation due to their rapid decay into the direct C 1sspectra of N,N9-diphenyl urea (1) and ethyl N-phenyl ionisation continuum. The simulated spectra are setcarbamate (2). These molecular species represent the to an approximate experimental scale by setting thelocal atomic and the delocalized electronic environ- zero of the calculated term value scale (e 50) to thement of the urea and carbamate groups in poly- calculated (DSCF) ionisation potential. Comparisonurethanes. Lower quality semi-empirical extended to the experimental spectra indicate the absolute
¨Huckel calculations of similar species have been error is |2.1 eV for each species.reported previously [22]. Although qualitatively The results of the ab initio calculations of (1) andsimilar results are obtained, the higher accuracy of (2) are presented as simulated spectra in Fig. 7. Thethe ab initio methodology gives greater confidence in calculations nicely reproduce the dominant spectralour spectral interpretation and better illustrates our features, in particular the C 1s(C–H)→1p* , CC=C
current approach to the use of quantum chemical 1s(C–R)→1p* , and C 1s(C=O)→p* transi-C=C C=O
calculations to assist X-ray spectromicroscopy of tions. They also reproduce the large, characteristicpolymers. change in the relative intensity of the 1p* andC=C
Calculations of the core excitation transitions were p* transitions between ureas and carbamates. InC=O
carried out using Kosugi’s GSCF3 package [16,17]. addition to giving detailed insight into the origin ofSince the electronic relaxation of the core excited all the low-lying spectral features, comparison of thestates induces significant alterations in the electronic results for (1) and (2) indicates that the p* peakC=O
structure, high level calculations are necessary in of the urea occurs |0.4 eV below the p* peak ofC=O
order to reliably assign inner shell spectra [62,63]. the urethane species, consistent with the experimen-These calculations are based on the Improved Virtual tal observation. The shift in the p* peak betweenC=O
Orbital approximation (IVO) which explicitly takes urea and urethane is the basis for the quantitativeinto account the core hole in the Hartree–Fock analysis of these functional moieties, described inapproximation and are highly optimized for calcula- Section 4.tion of core excited states [64]. The difference in thetotal energy between the core ionized and ground 3.3. Polymer model studies by NEXAFSstates energies gives the core ionization potential spectroscopy(IP) with a typical accuracy of ¯1 eV.
Optimized (minimum total energy) molecular Polymer models for important functional groups ofgeometries for ethyl N-phenyl carbamate (2) and polyurethanes (MDI-polyurea (6), TDI-polyurea (7),N,N9-diphenyl urea (1) were determined using the MDI-polyurethane (5), TDI-polyurethane (8) andprogram GAMESS [65] with a 4–21 G level basis. polyether) were custom synthesized or were obtainedFor the GSCF3 calculations, a Huzinaga [66] basis from previous studies [24,67]. The polyurethaneset is employed: (621/41) contracted Gaussian type polymers used as the test targets for quantitativefunctions were used on the heavy atoms (C, N and analysis were prepared using conventional method-O); (41) on H; and a higher quality basis set ologies [21] from mixtures of a poly(propylene(411121/3111/*) on the heavy atom onto which the oxide) rich polyether-polyol, toluene diisocyanatecore hole is placed. A separate calculation is per- (TDI) (80% 2,4 TDI, 20% 2,6 TDI isomers), mono-formed for each symmetry inequivalent core excited ethylene glycol (MEG) and water according toatom of interest. Simulated spectra are generated formulations documented as a footnote to Table 2.from the calculational results using a Gaussian line Varying amounts of water, polyol and MEG were

128 S.G. Urquhart et al. / Journal of Electron Spectroscopy and Related Phenomena 100 (1999) 119 –135
Fig. 7. Simulated C 1s spectra of N,N9-diphenyl urea (1) and ethyl N-phenyl carbamate (2) based on the results of GSCF3 calculations. Theintensity of each unique carbon site is indicated, along with the appropriately weighted sum. The details of the calculations and theconstruction of the simulated spectra are presented in the text.
used to give a systematic change in relative amounts beam was used to average over that morphology.of urea and urethane. The synthesis was carried out Energy scales were calibrated by adding CO gas to2
without silicone surfactant in a compression mold to the He purge in the microscope and recording theform a solid plaque. transmission spectrum of the mixture of the polymer
C 1s NEXAFS spectra of model and test polymers and CO gas [10]. The energies of the2
were recorded with the Stony Brook STXM at CO →Rydberg transitions from the high-resolution2
beamline X1A at the NSLS [10] or the BL7.0.1 NEXAFS spectra of Ma et al. [68] were used toSTXM at the Advanced Light Source (ALS) [11,12]. calibrate these spectra.The energy resolution was typically 0.2 eV fwhm Fig. 8 presents the C 1s spectra of the MDI-(NSLS) or 0.1 eV fwhm (ALS). Thin sections of polyurea (6), MDI-polyurethane (5), TDI-polyureamodel polymers and the polymer plaques used for (7) and TDI-polyurethane (8) based model polymers.analytical testing (codes: 258, 259, 260) were pre- The energies and detailed spectral assignments havepared using a Reichert–Jung (now Leica) microtome been presented and discussed elsewhere [24]. Whilewith cryo-attachment at 21208C. Samples were many of the spectral features are the same as those intransferred dry to unsupported copper grids with an the molecular compounds (Fig. 6), there are alsoeyelash. For homogeneous polymer samples, the X- additional contributions from the polyether linkagesray beam was defocused to a 5–15 mm diameter used to make the polymer from the isocyanate‘donut’ (the shape of a defocused zone plate beam) monomer. In addition, all spectral features are muchin order to reduce the rate of beam damage by better resolved on account of the better spectraldistributing the X-ray dose over a suitably large resolution of the NEXAFS spectrometer (,0.2 eV)volume of sample [28]. The analytical test samples relative to that of ISEELS (|0.6 eV). Aside fromshowed some phase segregation at the submicron this, there is good agreement between the polymerscale, but a sufficiently large defocus of the X-ray spectra and the spectra of the molecular models

S.G. Urquhart et al. / Journal of Electron Spectroscopy and Related Phenomena 100 (1999) 119 –135 129
Table 2aQuantitative analysis of model TDI-based polyurethane polymers
2Species Polyether Urea Carbamate Quality of fit (r ) Standard errorb b bPred. ALS NSLS Pred. ALS NSLS Pred. ALS NSLS ALS NSLS ALS NSLS
a(a) % of Carbon-atoms of indicated component258 70.6 66 70 25.5 28 26 3.9 6 4 0.9996 0.9996 0.0084 0.0067259 78.2 72 75 14.5 18 17 8.0 10 8 0.9995 0.9995 0.0091 0.0078260 77.3 70 75 8.3 13 13 16.7 17 11 0.9994 0.9997 0.0097 0.0065
Species Polyether Urea Carbamateb b bPred. ALS NSLS Pred. ALS NSLS Pred. ALS NSLS
c(b) mol% of formula units of indicated component258 86.7 84 86 11.8 12 12 1.6 3 2259 90.6 88 89 6.3 8 8 3.1 4 3260 89.9 87 90 3.6 6 4 6.5 7 6
a Derived by a least-squares fit of the C 1s NEXAFS of the polymer to weighted sums of three model spectra. The reference signals usedare the orthogonal chemical component from polyether (E), TDI-urea (U) and TDI-urethane (C), each on a per-carbon atom oscillatorstrength intensity scale – see Fig. 9. The least squares fit was performed over the energy ranges of 282–286 and 289–291 eV. These regionswere selected to give maximum sensitivity to the chemical differentiation of the three components while at the same time making theprocedure less sensitive to systematic errors (model generation, background subtraction and continuum normalization procedures).Concentrations have been rounded and may not add to 100.
b The predictions are based on the polymer formulations, expressed in mass of each reagent (arbitrary mass units). A constant amount ofthe catalyst DABCO 33-LV (0.6 parts) was used. The polyol is 5000 MW, trifunctional and predominantly composed of poly(propyleneoxide). MEG (ethylene glycol) is a chain extender used to control the carbamate concentration.
Polyol TDI Water MEG (arbitary mass units)
258 100 45.45 4 0259 100 29.86 2 1.51260 100 31 1.12 4.96
The carbon atom percentages (% urea, % carbamate, % polyol) are derived from these formulations, given the molecular weight andfunctionality of each component and their reaction chemistry. These calculations are based on the standard polyurethane calculations ofHerrington [21] except they have been extended here to the ‘carbon atom concentration’ which are the natural unit for NEXAFS analysis.The urea concentration is driven by the presence of water, while the carbamate concentration is driven by the presence of –OH groups inpolyol and MEG.
c The carbon-atom-% numbers were converted to relative amounts of the repeat units (mol%) by mol%(i)5100*hC-atom%(i)) /n(i)j / hS i
C-atom%(i)) /n(i)) where n(i) is the number of carbon atoms per repeat unit: i.e. 3, 8 and 9 for ether, urea and urethane based on thestructures given in Scheme 1.
shown in Fig. 6. In particular the urea p* previous section provides the basis for quantitativeC=O
transitions are systematically broader, and weaker speciation of the principle components of complexthan the urethane p* transitions. polyurethane materials (urea and urethane (carba-C=O
mate) linkages and the polyether copolymer). Thequantitation procedure outlined in this section is
4. Quantitative chemical analysis of based on a least squares optimization of the analytepolyurethane polymers polymer spectra to weighted sums of component
spectra. This approach complements analytical meth-The experimental and computational studies of ods based on singular value decomposition tech-
small molecule and polymer models outlined in the niques [47]. In order to explore the quantitative

130 S.G. Urquhart et al. / Journal of Electron Spectroscopy and Related Phenomena 100 (1999) 119 –135
components in a random block copolymer (i.e.styrene acrylonitrile), the spectra of the homopoly-mers (polystyrene and polyacrylonitrile) can be usedas component models if the polymer and monomerspectra are additive. Polyurethane polymers arecomplex and care must be taken in the choice ofanalytical models. Polyurethane polymers consist ofthree primary components: urea linkages (U),urethane or carbamate linkages (C) and ether link-ages (E). Scheme 2 presents representative poly-urethane structures with these units (U, C, E)indicated in bold. For quantitative analysis, we haveproduced polymer spectral standards to model thesecomponents. It is important to identify such com-ponent structures in such a way that they areorthogonal and they have a clearly defined stoi-chiometry. NEXAFS spectroscopy is sensitive to therelative carbon atom concentration for the differentcomponents, so the stoichiometry is needed to con-vert the results from the spectroscopic analysis(which we express in terms of ‘% of C atoms in agiven unit’) into more conventional wt.% or func-tional group concentrations.
We have adapted the C 1s spectra of TDI-polyureaFig. 8. NEXAFS C 1s spectra of MDI-polyurea (6), MDI-poly-(7), TDI-polyurethane (8), and poly(propyleneurethane (5), TDI-polyurea (7) and TDI-polyurethane (8). The
TDI monomer used was an 80% 2,4 and 20% 2,6 isomeric oxide) (9) model polymers (presented and discussedmixture. In each case the as-recorded signal has been background in greater detail elsewhere [24]) to prepare standardsubtracted and converted to oscillator strength per carbon atom spectra for quantitative analysis. Fig. 9 presents thescale (vertical offsets are used for clarity).
analysis capabilities of NEXAFS spectroscopy (andultimately spectromicroscopy), we have performedquantitative analysis of three test polyurethane poly-mers (258, 259, 260) in which a controlled variationof the urea and urethane content was achieved bycareful adjustment of the water content in theformulation (see Table 2). These test polymers arewell suited to verify the quantitation capability ofNEXAFS since a reliable estimate of ether, urea andurethane content could be made a priori from theformulation (see footnote b of Table 2 for thedetails).
For accurate quantitation, well-characterizedNEXAFS spectra of carefully chosen models of thepolymer components is required. For a blend of two
Scheme 2. Representative structures of the urea (U), carbamateor more homopolymers (i.e. polystyrene /poly(methyl (urethane) (C) and poly(propylene oxide) polyether (E) units uponmethacrylate)), the analytical models can simply be which quantitation is based for the test polyurethanes 258, 259 andthe individual homopolymers. For quantitation of 260.

S.G. Urquhart et al. / Journal of Electron Spectroscopy and Related Phenomena 100 (1999) 119 –135 131
urethane model (8) differs slightly from the carba-mate model structure (C) due to the presence of abutane chain (from the reaction of TDI with butanediol). In order to prepare the carbamate analyticalmodel spectrum (C), we approximately removed thiscomponent by subtracting a stoichimetrically weight-ed spectrum of poly(propylene oxide) (9). Thespectroscopic signature of poly(propylene oxide) isexpected to be close to the butane fragment presentin (8). The original TDI-urethane spectrum (8) andthe resulting carbamate analytical model spectrum(C) are presented in Fig. 9.
Fig. 10 plots the C 1s spectra of the three testpolymers (codes 258, 259, 260), along with the bestquality fits to data recorded at the ALS BL 7.0STXM (left panel) and at the X1A STXM at NSLS(right panel). An earlier analysis of NSLS spectra ofsimilar statistical quality but slightly lower energyresolution has been presented elsewhere [69]. Themodel reference spectra (C, U and E) used in eachanalysis were those recorded with the same instru-ment in order to avoid artifacts associated withdifferences in the energy resolution.
As with all data presented in this work, the spectraFig. 9. Plot of the C 1s NEXAFS spectra of TDI-polyurethane of the test polymers (258, 259, 260) and the stripped(8), TDI-polyurea (7) and T3000, a polyether rich polyurethane,
spectra of the individual analytical components (C,(9) which are used to derive the analytical reference standards forU, E) were background subtracted and normalized inquantitative analysis. These spectra are presented on oscillator
strength per repeat unit normalization scale. The curves labeled the far continuum on an oscillator strength per atomNSLS were recorded with the Stony Brook STXM at X-1A, all basis. The C, U and E composition of 258, 259 andother spectra were recorded with the ALS BL 7.0 STXM. From 260 was determined by a linear least squares fit overthese experimental spectra, analytical reference standards for ether
the energy range 282–286 and 289–291 eV. This(E), carbamate (C) and urea (U) have been derived by thechoice of energy range restricts the least-squares fitsubtraction of a small component of aromatic signal (as explicitly
indicated for the ether signal) or aliphatic signal (in the case of to the energy region that is most sensitive to thecarbamate) in order to isolate the pure spectral signature of the chemical differences and where our models are mostaromatic urea, aromatic urethane, and the saturated polyether. representative of the polymer chemistry. The relative
aromatic fraction is determined through the C 1s(C–C 1s spectra of the TDI-polyurethane (8), TDI- H)→p* transitions of the phenyl ring in theC=C
polyurea (7) and the poly(propylene oxide) poly- 284–286 eV range. Simultaneously, the urea, carba-ether-polyol (9) models. The as-recorded spectra mate and ether composition is determined by fittingfrom ALS (and NSLS, for the urea and urethane the the 289–291 eV energy range where the adjacentspecies) are indicated. The repeat unit structure of urea and carbamate C 1s(C=O)→p* transitionsC=O
the TDI-polyurea (7) is identical to the urea model are superimposed on the broad ether C 1s→s*C–O
structure (U) so its spectrum can be used directly as transitions. In the ALS data, differences between thethe analytical model. The polyol model (9) contained 258, 259 and 260 data (points) and the fits (solida small fraction of an aromatic polyurethane signal. lines) are most evident in the 286–289 eV regionThe spectrum of the polyol analytical model (E) was which was excluded from the least squares fit. Weisolated by subtracting a small urethane signal as believe that shortcomings in the model spectra areindicated in Fig. 9. The structure of the TDI-poly- responsible for these differences. For example use of

132 S.G. Urquhart et al. / Journal of Electron Spectroscopy and Related Phenomena 100 (1999) 119 –135
Fig. 10. Quantitative analysis of C 1s NEXAFS spectra of three different model polyurethane polymers of varying urea and urethanecontent. The polyurethane data is indicated by filled circle symbols, the best fit by the thicker solid line, and the amounts of the individualpolyether (E5ether), TDI-polyurea (U5urea), and TDI-polyurethane (C5carbamate) component spectra required to construct that best fitare indicated by the thin solid lines. Vertical offsets are used for clarity.
the polyether signal to correct for the butane com- composition and that predicted from the formulationponent of the TDI-polyurethane model (8) will agree within 20%. The quality of the match betweenmisrepresent the urethane signal in the 286–289 eV data and optimized model (Fig. 10) demonstratesregion. that C 1s NEXAFS spectra, when analyzed using
The results of the NEXAFS analysis from both spectra of appropriate models recorded with the sameALS and NSLS data sets are compared to the experimental conditions, can determine chemicalcomposition predicted from the formulation chemis- composition at the |10 mol% level, with 10–20%try in Table 2. The compositions are expressed in accuracy. This is a remarkably good level of quanti-percent atom-type (the natural unit for the NEXAFS tation given the relatively small spectral differencesanalysis, given the use of per-atom continuum nor- which are the basis for this quantitative chemicalmalization) and in more conventional formula unit analysis (mainly the shift of |0.5 eV between thepercentages. Except for a few values for the urea and urea and urethane p* signals around 290 eV), andC=O
urethane composition of the test polymers with high the extensive overlap of these key features with theurethane content (260), the NEXAFS determined broad underlying s* resonances. Good energy res-

S.G. Urquhart et al. / Journal of Electron Spectroscopy and Related Phenomena 100 (1999) 119 –135 133
olution (,0.2 eV, preferably ,0.1 eV) is a critical of the relative amounts of urea and urethane structur-factor in being able to track the subtle changes in the al elements. The use of model polymer spectra forline shapes in the 289–291 eV range which provide polymer compositional quantitation was demonstra-the sensitivity to quantitative composition. Energy ted. The present results indicate that C 1s NEXAFSscale stability is also important, as model and analyte spectromicroscopy can determine the chemical com-spectra recorded at different times must be placed position of even complex polymers such as poly-onto a common energy scale for this analysis. urethanes at the |10 mol% level, with 10–20%Another important factor is confidence in the abso- accuracy, when analyzed using spectra of appropriatelute spectral shape for both the models and the models recorded with the same experimental con-analyte materials. The relative intensity of spectro- ditions.scopic features can be affected by changes in energyresolution, linear dichroism in oriented samples,higher-order X-ray photons and detector dark noise. Acknowledgements
While the spectra of these test polyurethanes (258,259, 260) were acquired from relatively large areas We thank M. Adams and D. Gier (Dow Chemical)2(a few mm , using a defocused probe to avoid beam for synthesis of molecular and polymer model com-damage), the ultimate goal of this quantitation meth- pounds, and G. Young (Dow Chemical) for expertodology is functional group analysis of polymers at preparation of the polymer thin sections. Data wasthe state-of-the-art spatial resolution of STXM (50 recorded using the Stony Brook STXM at NSLSnm). Examples of this type of quantitative com- X-1A, the BL7.0 STXM at ALS, and the ISEELSpositional analysis, carried out on spectra recorded in spectrometer at McMaster. Financial support haspoint mode using a fully focussed 50 nm probe, or been provided by research and partnership grantsextracted from image stack sequences [32], are being from NSERC (Canada). The Stony Brook STXMpresented elsewhere, for both the polyurethane sam- was developed by the groups of J. Kirz and C.ple whose image is presented in Fig. 2 [19], and for Jacobsen, with support from the Office of Biologicalpolyurethanes with various copolymer polyol com- and Environmental Research, U.S. DOE under con-ponents. [20] tract DE-FG02-89ER60858, and the NSF under grant
DBI-9605045. The zone plates were developed by S.Spector and C. Jacobsen of Stony Brook and Don
5. Summary Tennant of Lucent Technologies Bell Labs, withsupport from the NSF under grant ECS-9510499.
We have presented a brief overview of NEXAFS The ALS STXM was developed by T. Warwickmicroscopy applications in polymer science and (ALS), B. Tonner (UWM) and collaborators, withexemplified the power of NEXAFS microscopy by support from the U.S. DOE (contract DE-AC03-describing the characterization of PET/VectraE 76SF00098). Zone plates at ALS were provided byblends. In addition, we provided a detailed descrip- Eric Anderson of CXRO, LBNL. H. Ade and A.P.tion of how NEXAFS microscopy can be used to Smith are supported by NSF Young Investigatoridentify polyurethane polymer components and make Award (DMR-9458060).a quantitative analysis of these chemical compo-nents. In particular, the spectra of a number of gasand solid molecular models for the principle func-
Referencestional group components of polyurethane polymershave been presented and analyzed. These spectra
[1] A.P. Hitchcock, Phys. Scr. T31 (1990) 159.were found to be in good agreement with the spectral[2] A.P. Hitchcock, D.C. Mancini, J. Electr. Spectros. Relat.features associated with the non-polyether parts of
Phenom. 67 (1994) 1.model polyurethane polymers containing the same ¨[3] J. Stohr, NEXAFS Spectroscopy, Springer-Verlag, Berlin,functional groups. The spectral shape in the C 1992.1s→p* region was shown to be a sensitive probe [4] H. Ade, Trends Polym. Sci. 5 (1997) 58.C=O
134 S.G. Urquhart et al. / Journal of Electron Spectroscopy and Related Phenomena 100 (1999) 119 –135
[5] J. Kirz, C. Jacobsen, M. Howells, Q. Rev. Biophys. 28 Ade, A.P. Hitchcock, W. Meyer-Ilse, L. Wilson, in prepara-(1995) 33. tion.
[6] H. Ade, X. Zhang, S. Cameron, C. Costello, J. Kirz, S. [31] S. Zhu, Y. Liu, M.H. Rafailovich, J. Sokoloc, D. Gersappe,Williams, Science 258 (1992) 972. A. Winesett, H. Ade, Nature (1999) in press
[7] H. Ade, B. Hsiao, Science 262 (1993) 1427. [32] C. Jacobsen, S. Wirick, G. Flynn, C. Zimba, J. Microscopy,in press.[8] H. Ade, A. Smith, S. Cameron, R. Cieslinski, C. Costello, B.
Hsiao, G. Mitchell, E. Rightor, Polymer 36 (1995) 1843. [33] J. Maser, A. Osanna, Y. Wang, R. Fliller, C. Jacobsen, J.Kirz, S. Spector, M. Weigel, B. Winn, D. Tennant, J.[9] A.P. Smith, H. Ade, Appl. Phys. Lett. 69 (1996) 3833.Microsc., (1999) in preparation.[10] H. Ade, A.P. Smith, H. Zhang, G.R. Zhuang, J. Kirz, E.
[34] A.P. Smith, H. Ade, R.J. Sponta, C.C. Koch, Microsc.Rightor, A.P. Hitchcock, J. Electron Spectrosc. Relat.Microanal. 4 (S-2) (1998) 142.Phenom. 84 (1997) 53.
[35] A.P. Smith, H. Ade, R.J. Spontak, C.C. Koch, S.D. Smith,[11] T. Warwick, H. Ade, S. Cerasari, J. Denlinger, K. Franck, A.Adv. Mater., in preparation.Garcia, S. Hayakawa, A. Hitchcock, J. Kikuma, J. Kortright,
G. Maigs, M. Moronne, S. Myneni, E. Rightor, E. Roten- [36] A.P. Smith, J.H. Laurer, H.W. Ade, S.D. Smith, A. Ashraf, R.berg, S. Seal, H.-J. Shin, R. Steele, T. Tyliszczak, B. Tonner, Spontak, Macromolecules 30 (1996) 663.Rev. Sci. Instrum. 69 (1998) 2964. [37] A. Cossy-Favre, J. Diaz, Y. Liu, H. Brown, M.G. Samant, J.
¨[12] T. Warwick, H. Ade, A.P. Hitchcock, H. Padmore, E.G. Stohr, A.J. Hanna, S. Anders, T.P. Russell, MacromoleculesRightor, B.P. Tonner, J. Electron Spectrosc. Relat. Phenom. 31 (1998) 4957.84 (1997) 85. [38] S. Anders, T. Stammler, C. Singh Bhatia, J. Stohr, W. Fong,
[13] R.F. Egerton, Electron Energy Loss Spectroscopy in the C.-Y. Chen, D.B. Bogy, Mater. Res. Soc. Proc. 517 (1998)Electron Microscope, Plenum Press, New York, 1986. 415.
[14] M.M. Disco, in: M.M. Disko, C.C. Ahn, B. Fultz (Eds.), [39] S. Anders, T. Stammler, W. Fong, D.B. Bogy, C. Singh¨Transmission Electron Energy-Loss Spectrometry in Materi- Bhatia, J. Stohr, J. Vac. Sci. Technol. A, in press.
als Science, TMS, 1992. [40] A. Cossy-Favre, J. Diaz, S. Anders, H. Padmore, Y. Liu, M.[15] H. Agren, V. Carravetta, O. Vahtras, L.G.M. Pettersson, Samant, J. Stohr, H. Brown, T.P. Russell, Acta Phys.
Chem. Phys. Lett. 222 (1994) 75. Polonica A 91 (1997) 923.[16] N. Kosugi, K.H. Kuroda, Chem. Phys. Lett. 74 (1980) 490. [41] H. Ade, D.A. Winesett, A.P. Smith, S. Anders, T. Stammler,
¨C. Heske, D. Slep, M.H. Rafailovich, J. Sokolov, J. Stohr,[17] N. Kosugi, Theor. Chim. Acta 72 (1987) 149.Appl. Phys. Lett. 73 (1998) 3773.[18] L. Triguero, L.G.M. Pettersson, H. Agren, Phys. Rev. B 58
[42] H. Ade, D.A. Winesett, A.P. Smith, S. Qu, S. Ge, S.(1998) 8097.Rafailovich, J. Sokolov, Europhs. Lett. 45 (1999) 526.[19] E.G. Rightor, G.E. Mitchell, S.G. Urquhart, A.P. Smith, H.
[43] A.P. Hitchcock, S.G. Urquhart, H. Ade, E.G. Rightor, W.Ade, A.P. Hitchcock, in preparation.Lidy, Microsc. Microanal. 5 (S-2) (1998) 808.[20] A.P. Hitchcock, T. Tyliszczak, E.G. Rightor, G.E. Mitchell,
[44] H. Ade, A.P. Smith, G.R. Zhuang, B. Wood, I. Plotzker, E.G.M.T. Dineen, W. Lidy, R.D. Priester, S.G. Urquhart, A.P.Rightor, D.-J. Liu, S.-C. Lui, C. Sloop, Mater. Res. Soc.Smith, H. Ade, in preparation.Symp. Proc. 437 (1996) 99.[21] R. Herrington, Flexible Polyurethane Foams, 2nd ed, The
[45] J. Kikuma, T. Warwick, H.J. Shin, J. Zhang, B.P. Tonner, J.DOW Chemical Company, 1997.Electron Spectrosc. Relat. Phenom. 94 (1998) 271.[22] S.G. Urquhart, A.P. Hitchcock, R.D. Priester, E.G. Rightor, J.
[46] X. Zhang, C. Jacobsen, S. Lindaas, S. Williams, J. Vac. Sci.Polym. Sci. B, Polym. Phys. 33 (1995) 1603.Technol., B 13 (1995) 1477.[23] S.G. Urquhart, A.P. Hitchcock, R.D. Leapman, R.D. Priester,
[47] X. Zhang, R. Balhorn, J. Mazrimas, J. Kirz, J. Struc. Biol.E.G. Rightor, J. Polym. Sci. B, Polym. Phys 33 (1995) 1593.116 (1996) 335.[24] S.G. Urquhart, H.W. Ade, A.P. Smith, A.P. Hitchcock, E.G.
[48] G.D. Cody, R.E. Botto, H. Ade, S. Behal, M. Disko, S.Rightor, W. Lidy, J. Phys. Chem. B 103 (1999) 4603.Wirick, Energy & Fuels 9 (1995) 153.[25] J.C. Moreland, G.L. Wilkes, R.B. Turner, E.G. Rightor, J.
[49] G.D. Cody, R.E. Botto, H. Ade, S. Behal, M. Disko, S.Appl. Polym. Sci. 52 (1994) 1459.Wirick, Energy & Fuels 9 (1995) 525.[26] J.P. Armistead, G.L. Wilkes, J. Appl. Polym. Sci. 35 (1988)
[50] G.D. Cody, H. Ade, S. Wirick, G.D. Mitchell, A. Davis, Org.601.Geochem. 28 (1998) 441.[27] A.P. Smith, C. Bai, H. Ade, R.J. Spontak, C.M. Balik, C.C.
[51] R.E. Botto, G.D. Cody, J. Kirz, H. Ade, S. Behal, M. Disko,Koch, Macromol. Rapid Commun. 19 (1998) 557.Energy & Fuels 8 (1994) 151.[28] E.G. Rightor, A.P. Hitchcock, H. Ade, R.D. Leapman, S.G.
[52] H. Ade, in: J.A.R. Samson, D.L. Ederer (Eds.), ExperimentalUrquhart, A.P. Smith, G.E. Mitchell, D. Fisher, H.J. Shin, T.Methods in the Physical Science, Academic Press, 1998.Warwick, J. Phys. Chem. B 101 (1997) 1950.
[53] A.P. Hitchcock, S.G. Urquhart, E.G. Rightor, J. Phys. Chem.[29] G.E. Mitchell, S.G. Urquhart, L. Wilson, M. Dineen, E.G.96 (1992) 8736.Rightor, A.P. Hitchcock, U. Neuhaeusler, H.W. Ade, W.
Meyer-Ilse, J.T. Brown, T. Warwick, Advanced Light Source [54] S.G. Urquhart, A.P. Hitchcock, A.P. Smith, H. Ade, E.G.Compendium 1997, LBNL Report 41658 (1998). Rightor, J. Phys. Chem. B 101 (1997) 2267.
[30] G.E. Mitchell, S.G. Urquhart, M. Dineen, E.G. Rightor, H. [55] J.T. Francis, A.P. Hitchcock, J. Phys. Chem. 96 (1992) 6598.

S.G. Urquhart et al. / Journal of Electron Spectroscopy and Related Phenomena 100 (1999) 119 –135 135
[56] A.P. Hitchcock, G. Tourillon, R. Garrett, G.P. Williams, C. [64] W.J. Hunt, W.A.I. Goddard, Chem. Phys. Lett. 3 (1969) 414.Mahatsekake, C. Andrieu, J. Phys. Chem. 94 (1990) 2327. [65] M.W. Schmidt, K.K. Baldridge, J.A. Boatz, S.T. Elbert, M.S.
[57] D.A. Outka, J. Stohr, J.P. Rabe, J.D. Swalen, J. Chem. Phys. Gordon, J.J. Jensen, S. Koseki, N. Matsunaga, K.A. Nguyen,88 (1988) 4076. S. Su, T.L. Windus, M. Dupuis, J.A. Montgomery, J.
¨[58] J. Stohr, D.A. Outka, K. Baberscke, D. Arvanitis, J.A. Computational Chem. 14 (1993) 1347.Horsley, Phys. Rev. B 36 (1987) 2976. [66] S. Huzinaga, J. Andzelm, M. Klobukowski, E. Radzio-
¨[59] D.A. Outka, J. Stohr, J. Chem. Phys. 88 (1988) 3539. Andzelm, Y. Sasaki, H. Tatewaki, Gaussian Basis Sets for[60] S.G. Urquhart, Core Excitation Spectroscopy of Molecules Molecular Orbital Calculations, Elsevier, Amsterdam, 1984.
and Polymers, Ph.D. Thesis, McMaster University, Hamilton, [67] C.P. Christenson, M.A. Hartcock, M.D. Meadows, H.L.ON, Canada, 1997. Spell, W.L. Howard, M.W. Creswick, R.E. Guerra, R.B.
[61] R.N.S. Sodhi, C.E. Brion, J. Electron Spectrosc. 34 (1984) Turner, J. Polym. Sci.: Part B: Polym. Phys. 24 (1986) 1401.363. [68] Y. Ma, C.T. Chen, G. Meigs, K. Randall, F. Sette, Phys. Rev.
[62] N. Kosugi, J. Adachi, E. Shigemasa, A. Yagishita, J. Chem. A 44 (1991) 1848.Phys. 97 (1992) 8842. [69] A.P. Hitchcock, S.G. Urquhart, E.G. Rightor, W. Lidy, H.
[63] N. Kosugi, E. Shigemasa, A. Yagishita, Chem. Phys. Lett. Ade, A.P. Smith, T. Warwick, Microsc. Microanal. 3 (S-2)190 (1992) 481. (1997) 909.
Related Documents